Embed Size (px)
Citation preview
ABSTRACT. This paper presents the re-sults of a research program conducted todesign the all-weld metal deposited withAWS A5.5-811 E10018M2, E11018M2
and E12018M2 SMAW-type electrodes.The role that different alloying elementssuch as manganese, carbon andchromium play on the tensile properties,hardness and toughness as well as on themicrostructure was studied. Criteria forselecting the weld metal compositionleading to optimum combination of ten-sile strength and toughness are sug-gested. The effect of the variation of heatinput, within the requirements of theAWS standard, on the mentioned prop-erties was also analyzed. It was foundthat the E11018M and E12018M all-weld-metal tensile properties are verysensitive to variations in heat input. Forcertain values of chemical composition,welding parameter ranges suitable toguarantee the fulfillment of AWS re-quirements were determined.
Introduction
In recent years there has been an in-creased use of medium- and high-strength structural steels, posing a needfor adequate welding consumables forsuch materials. This led to a significantadvance in electrode formulation to ob-tain weld deposits with high values forstrength and good toughness (Ref. 3).Structural safety and a tolerance for dis-continuities in welded joints are ob-
tained by imposing requirements ontoughness by setting minimum Charpy V-notch levels at an arbitrary temperature,and minimum CTOD values at the low-est design temperature (Ref. 4). Theachievement of adequate CTOD valuesbecomes increasingly difficult as theweld metal tensile strength increases.One way to obtain improved weld metaltoughness is through microstructuralcontrol, which requires taking into ac-count the weld metal chemistry. It is gen-erally accepted that acicular ferrite is theoptimum microstructure for the as-welded C-Mn weld metal, leading to anadequate combination of strength andfracture toughness at low temperature(Refs. 5,6). Acicular ferrite has a very finegrain size and a high concentration ofdislocations that are responsible for itstoughness and ductility (Ref. 7). Severalworkers have reported that a low transi-tion temperature can be obtained in a C-Mn weld deposit provided the proportionof acicular ferrite is maintained at a highlevel, and if the amount of grain bound-ary ferrite with aligned M-A-C is suffi-ciently low (Refs. 3, 4, 7, 8).
Although the influence of Mn on me-chanical properties and microstructureof C-Mn weld metal is fairly well under-stood (Refs. 9,10), knowledge on the ef-fects of variations in the Mn level of al-loyed weld deposits is not adequate. Inrelation to this, the role played by differ-ent alloying elements is fairly complex.For instance, carbon behaves differentlyif acting alone or in the presence of otherelements such as manganese, silicon oroxygen (Ref. 11). From the point of viewof the influence on the microstructure ofdeposited weld metal (Ref. 12), an in-crease in the carbon content of C-Mnweld metal produces an increase in theamount of acicular ferrite at the expenseof grain boundary ferrite. With referenceto notch toughness, increasing the car-bon of weld deposits results in a changein shape of the transition Charpy-Vcurves, reducing the energy level of theupper shelf and extending the transitiontemperature range between brittle andductile fracture modes.
WELDING RESEARCH SUPPLEMENT | 217-s
RE
SE
AR
CH
/DE
VE
LO
PM
EN
T/R
ES
EA
RC
H/D
EV
EL
OP
ME
NT
/RE
SE
AR
CH
/DE
VE
LO
PM
EN
T/R
ES
EA
RC
H/D
EV
EL
OP
ME
NT
All-Weld-Metal Design for AWS E10018M,E11018M and E12018M Type Electrodes
BY E. S. SURIAN AND L. A. de VEDIA
The best combination of alloying elements to provide optimum toughness and strength is investigated
KEY WORDS
Charpy V-NotchToughnessHigh-Strength ElectrodeCovered ElectrodesCTODAcicular FerriteMicrostructure
E. S. SURIAN is with Universidad TecnológicaNacional, Facultad Regional San Nicolás,DEYTEMA, Buenos Aires, Argentina. L. A. deVEDIA is with Instituto de Tecnología Prof.Jorge A. Sábato (Universidad Nacional de SanMartín-CNEA), Buenos Aires, Argentina.
1. It must be noted that this paper reviews ex-perimental work performed between 1987and 1996, according to AWS A5.5-81 (Ref. 1),which was later revised as A5.5-96 (Ref. 2).This is a relevant point since in the 1996 ver-sion the joint preparation was changed fromthe 1981 design (45-deg included angle and1⁄2-in. [12.7-mm] root opening) to a 20-deg in-cluded angle and 5⁄8-in. (16-mm) root opening.As this is an important modification related tothe study of the influence of variation in heatinput, it would not be correct to state that theresults can be extrapolated to the new testspecimen design. See Conclusions.2. Previously designated by AWS A5.1-81 asE10018-M, E11018-M and E12018-M.
The purpose of this work is to sum-marize the results of a research projectconducted to develop AWS E10018M,E11018M and E12018M type electrodessuitable to deposit weld metal with opti-mum mechanical properties. This studyconsisted of an analysis of the effects ofvariations in the level of all-weld-metalMn (Ref. 13), C (Ref. 14) and Cr (Refs. 15and 16) contents on the mechanicalproperties and microstructure of the weldmetal. Finally, using the optimum chem-ical composition obtained for each elec-trode, a study was conducted on the in-fluence of variations of heat input (Refs.17,18) within the range allowed by theAWS standard (Ref. 1) on the microstruc-ture and mechanical properties of theweld metal.
Experimental Procedure
Variation of Chemical Composition of WeldMetal at Constant Heat Input
Electrodes
Six experimental iron powder basiccovered electrodes that provided Mn lev-els in the weld metal ranging from 0.6%to 2.0% (chemical compositions are ex-
218-s | JUNE 1999
RE
SE
AR
CH
/DE
VE
LO
PM
EN
T/R
ES
EA
RC
H/D
EV
EL
OP
ME
NT
/RE
SE
AR
CH
/DE
VE
LO
PM
EN
T/R
ES
EA
RC
H/D
EV
EL
OP
ME
NT
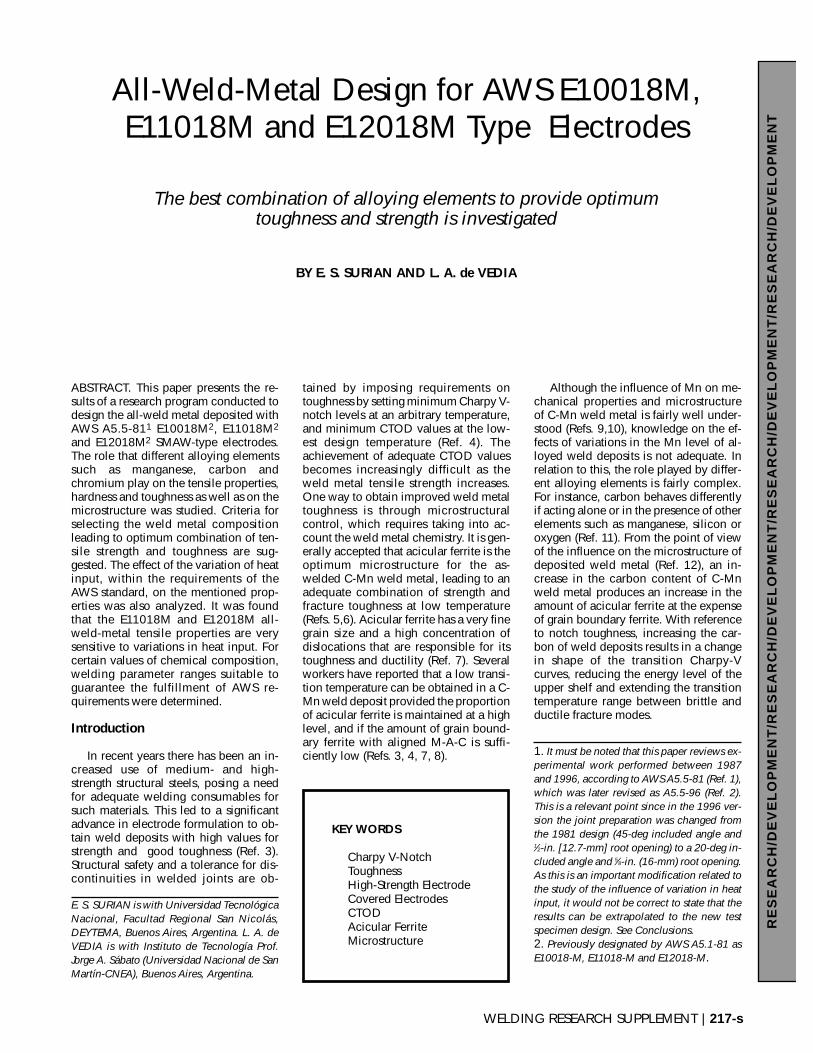
Fig. 1 — Tensile properties vs. all-weld-metal Mn content, ISO test spec-imens (AW, as-welded; SR, stress relieved).
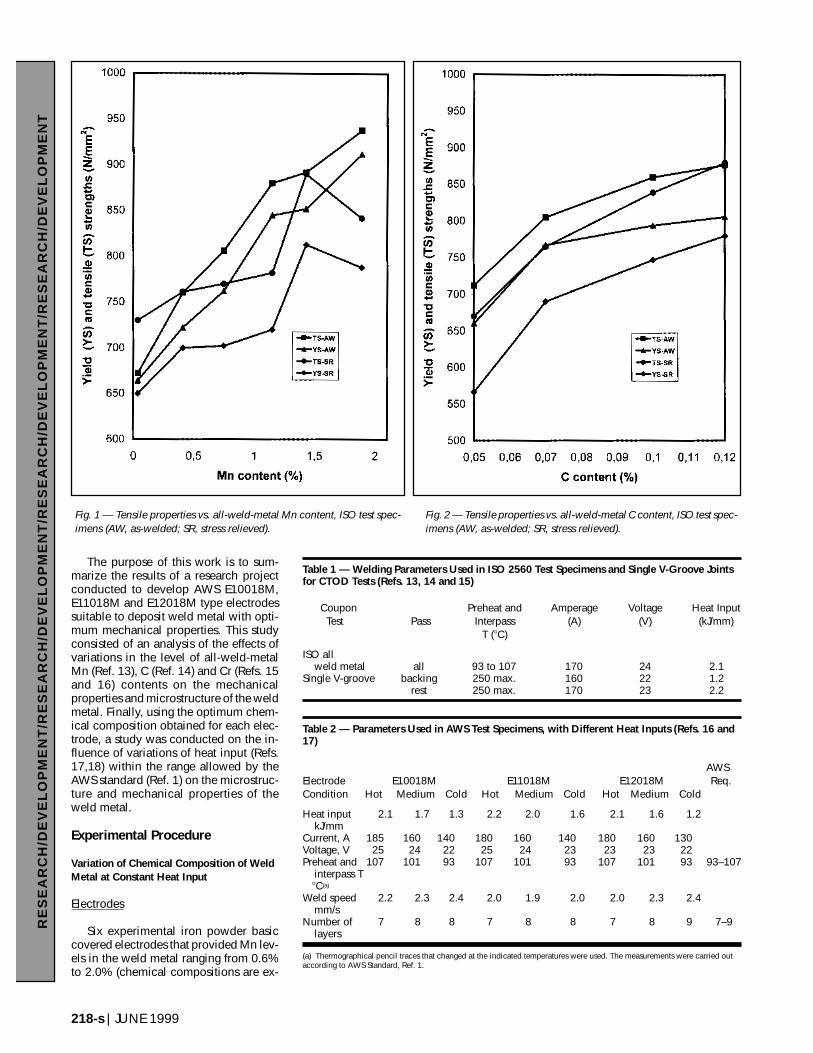
Fig. 2 — Tensile properties vs. all-weld-metal C content, ISO test spec-imens (AW, as-welded; SR, stress relieved).
Table 1 — Welding Parameters Used in ISO 2560 Test Specimens and Single V-Groove Jointsfor CTOD Tests (Refs. 13, 14 and 15)
Coupon Preheat and Amperage Voltage Heat InputTest Pass Interpass (A) (V) (kJ/mm)
T (�C)
ISO allweld metal all 93 to 107 170 24 2.1
Single V-groove backing 250 max. 160 22 1.2rest 250 max. 170 23 2.2
Table 2 — Parameters Used in AWS Test Specimens, with Different Heat Inputs (Refs. 16 and17)
AWSElectrode E10018M E11018M E12018M Req.Condition Hot Medium Cold Hot Medium Cold Hot Medium Cold
Heat input 2.1 1.7 1.3 2.2 2.0 1.6 2.1 1.6 1.2kJ/mm
Current, A 185 160 140 180 160 140 180 160 130Voltage, V 25 24 22 25 24 23 23 23 22Preheat and 107 101 93 107 101 93 107 101 93 93–107
interpass T �C(a)
Weld speed 2.2 2.3 2.4 2.0 1.9 2.0 2.0 2.3 2.4mm/s
Number of 7 8 8 7 8 8 7 8 9 7–9layers
(a) Thermographical pencil traces that changed at the indicated temperatures were used. The measurements were carried outaccording to AWS Standard, Ref. 1.
pressed in wt-%) and maintained the re-maining chemical elements constant,were initially developed. Building on theresults of this work, four experimentalelectrodes were designed and producedusing the previously found optimum Mnlevel to produce weld deposits with car-bon content of 0.05, 0.07, 0.10 and0.12% respectively. The influence of Crwas investigated by means of 12 experi-mental electrodes designed to produceweld deposits with nominal Cr levels of0, 0.4, 0.8, 1.2, 1.5 and 1.8% for Mn lev-els of 1% and 1.4% for each Cr content.Electrode diameter was 4 mm in all casesand the coating factor (diameter of thecoating/diameter of the wire) was main-tained at 1.65.
All-Weld-Metal Test Coupons
Two all-weld-metal samples weremade with each electrode in the flat po-sition according to ISO 2560-73. Al-though the objective was to developAWS E100/110/12018M-type electrodes,ISO-type all-weld-metal samples withthree passes per layer were preferred inorder to obtain the highest possiblecolumnar zone percentage in the CharpyV-notch location (Ref. 19). The weldingparameters employed are shown in Table1. One sample from each electrode waskept in the as-welded condition while the
other was subjected to a stress relievingheat treatment for 1 h at 620°C (1150°F).
Mechanical Properties and Metallographic Studies
Two sub-size Minitrac (Ref. 20) tensilespecimens (total length = 55 mm, gaugelength = 25 mm, reduced section diame-ter = 5 mm, ratio of gauge length to di-ameter = 5:1) tested at room temperature,and enough Charpy V-notch specimensto build the Absorbed Energy vs. TestTemperature curve between –90°C(–130°F) and 20°C (68°F) were machinedout of the ISO all-weld-metal samples. Across section was also obtained fromeach specimen to conduct a hardnesssurvey and the metallographic analysis.This was performed using light mi-croscopy on the top bead, the grain-coarsened and grain-refined regions ofthe weld metal, and along a line coinci-dent with the location of the notch of theCharpy samples (Ref. 21). In case of Crvariation, a study using the scanningelectron microscope was also carried outat 1000 and 5000X.
To take into account any possible ef-fect of dilution and/or dynamic strainaging at the root region on fracturetoughness of the weld deposits (Ref. 22),production-type, single V-groove, multi-pass welds were made with each elec-
trode on 19-mm-thick plate (typicalchemical composition: C 0.1%; Mn0.5%; Si 0.1%; P 0.01% and S 0.02%).Welding parameters used in this case areshown in Table 1. Welding was done inthe flat position and the sequence wassuch that a backing run was depositedfirst and, after grinding to sound weldmetal from the other side, the weld wascompleted. The test panels were pre-vented from moving during welding.Fracture toughness of the as-welded pro-duction-type, single V-groove joints wasassessed by means of CTOD testing. Forthis purpose, full thickness, single-edge-notched, three-point-bend specimenswere extracted from each weld, with thenotch in the through-thickness direction.An initiating fatigue precrack, with initialcrack depth to width ratio a/W = 0.5, wasused in all cases. To promote plain strainconditions at the crack tip, 25% sidegrooving of the specimens was adopted.Testing was conducted at –10°C (14°F)according to BS 5762:79 (Ref. 23).
Variation of Heat Input
To study the influence of changes inheat input, all-weld-metal test couponsaccording to AWS A5.5-81 were pre-pared with E10018M, E11018M andE12018M commercial-type electrodes,designed according to the results ob-
WELDING RESEARCH SUPPLEMENT | 219-s
RE
SE
AR
CH
/DE
VE
LO
PM
EN
T/R
ES
EA
RC
H/D
EV
EL
OP
ME
NT
/RE
SE
AR
CH
/DE
VE
LO
PM
EN
T/R
ES
EA
RC
H/D
EV
EL
OP
ME
NT
Table 3 — All-Weld-Metal Chemical Composition from Electrodes Used for A, B and C
A — Variation of Mn (Ref. 13)Electrode All Elements Expressed in wt-% Except N and O, which Are in ppmNominalMn P S C Si Cu Ni Cr Mo Mn N O
Mn 0.6 0.016 0.016 0.042 0.36 0.10 1.87 0.03 0.32 0.62 108 539Mn 1.0 0.018 0.014 0.032 0.26 0.11 1.97 0.03 0.36 1.04 101 429Mn 1.25 0.017 0.011 0.036 0.26 0.10 1.95 0.03 0.32 1.26 128 448Mn 1.5 0.015 0.014 0.036 0.29 0.10 1.86 0.03 0.33 1.45 122 460Mn 1.8 0.017 0.013 0.038 0.30 0.11 2.07 0.03 0.37 1.82 122 400Mn 2.0 0.018 0.013 0.043 0.29 0.11 2.08 0.04 0.37 2.10 123 410B — Variation of C (Ref. 14)Nominal C P S C Si Cu Ni Cr Mo Mn V N O
0.05 0.024 0.013 0.95 0.25 0.06 1.84 0.05 0.34 1.21 0.01 143 4440.07 0.025 0.013 0.07 0.26 0.06 1.90 0.05 0.34 1.24 0.01 119 365 0.10 0.023 0.009 0.10 0.34 0.05 1.92 0.05 0.35 1.42 0.01 87 3450.12 0.031 0.011 0.12 0.33 0.05 1.88 0.05 0.34 1.41 0.01 99 329
C — Variation of Cr (Ref. 15)Nominal Cr P S C Si Cu Ni Cr Mo Mn V N O
0 0.014 0.010 0.038 0.36 0.070 2.00 0.04 0.37 1.03 0.01 98 4760.4 0.014 0.011 0.040 0.35 0.070 1.96 0.38 0.35 1.00 0.01 79 4740.8 0.014 0.010 0.041 0.35 0.072 1.96 0.78 0.37 1.03 0.01 84 4871.2 0.015 0.011 0.042 0.38 0.073 1.95 1.15 0.37 1.06 0.01 90 4891.5 0.014 0.011 0.042 0.40 0.071 1.98 1.50 0.35 1.07 0.01 105 5251.8 0.014 0.011 0.042 0.38 0.070 1.92 1.82 0.34 1.06 0.01 101 5170 0.013 0.010 0.042 0.33 0.065 1.98 0.04 0.37 1.46 0.01 94 4720.4 0.013 0.010 0.040 0.35 0.065 1.94 0.41 0.36 1.43 0.01 104 4590.8 0.013 0.010 0.048 0.34 0.065 1.86 0.75 0.34 1.45 0.01 103 4701.2 0.013 0.010 0.043 0.34 0.065 1.98 1.15 0.38 1.37 0.01 120 4621.5 0.014 0.011 0.044 0.33 0.065 1.88 1.43 0.36 1.39 0.01 92 4861.8 0.014 0.011 0.04 0.36 0.065 1.99 1.89 0.38 1.49 0.01 103 472

220-s | JUNE 1999
RE
SE
AR
CH
/DE
VE
LO
PM
EN
T/R
ES
EA
RC
H/D
EV
EL
OP
ME
NT
/RE
SE
AR
CH
/DE
VE
LO
PM
EN
T/R
ES
EA
RC
H/D
EV
EL
OP
ME
NT
Fig. 3 — Tensile properties vs. all-weld-metal Cr content for 1% Mn, ISOtest specimens (AW, as-welded; SR, stress relieved).
Fig. 4 — Tensile properties vs. all-weld-metal Cr content for 1.4% Mn,ISO test specimens (AW, as-welded; SR, stress relieved).
Fig. 5 — All-weld-metal Charpy V-notch impact test results for Mn vari-ation (Ref. 13).
Fig. 6 — All-weld-metal Charpy V-notch impact test results for C vari-ation (Ref. 14).
tained as stated previously. The currentrange was selected to obtain good oper-ative behavior in all cases, and the inter-pass temperature (maintained within therange allowed by the AWS standard, Ref.1) (Table 2) and welding speed were var-ied in such a way as to obtain with eachelectrode three sets of samples: a “hot”weld (high heat input and interpass tem-perature), a “medium” weld (mediumheat input and interpass temperature)and a “cold” weld (low heat input and in-terpass temperature). The welding para-meters employed are shown in Table 2.
From each all-weld-metal test speci-men, tensile specimens (with a 4:1 gaugelength to diameter ratio and located as re-quired by AWS A5.5-81), one section forboth metallographic studies and a hard-ness survey, and five Charpy V-notchspecimens were obtained. Tensile prop-erties were measured at room tempera-ture and Charpy V-notch tests were con-ducted at –51°C (–60°F).
Results and Discussion
Variation of Chemical Composition of WeldMetal at Constant Heat Input
Table 3 shows the all-weld-metalchemical composition for all the elec-trodes. Each one of the three groups ofelectrodes presents the variations in theelements previously mentioned while
the other elements re-mained essentiallyconstant. Minor in-evitable variations incarbon and nickel forthe Mn series werefound to be within themeasurement methoderror. Manganesevariations in the C se-ries, although higher,corresponded to therange in which notoughness differenceswere found in the Mnseries (Ref. 13). It wasobserved that, as ex-pected, increasingcarbon and man-ganese led to a reduc-tion in weld metaloxygen due to thedouble role played bythese elements as deoxidants and alloy-ing elements.
Figures 1–4 show the effects of man-ganese, carbon and chromium (for 1 and1.4% Mn) on the all-weld-metal tensiletest results in the as-welded and stress re-lieved conditions, respectively. It can beseen that an increase in the content ofany of the elements considered led to ahigher weld metal yield point and tensilestrength. Stress relieving resulted in somereduction in the tensile properties. It
would be thus rather easy to select the al-loying values suitable to satisfy the mini-mum requirements for weld metal tensilestrength and to locate the yield pointwithin the range established by the AWSstandard for the E10018M, E11018M andE12018M type electrodes. Charpy V-notch curves corresponding to the all-weld-metal ISO specimens in the as-welded condition are shown in Figs. 5–8for each group of electrodes. It was ob-served that Mn in the range of 1 to 1.4%
WELDING RESEARCH SUPPLEMENT | 221-s
RE
SE
AR
CH
/DE
VE
LO
PM
EN
T/R
ES
EA
RC
H/D
EV
EL
OP
ME
NT
/RE
SE
AR
CH
/DE
VE
LO
PM
EN
T/R
ES
EA
RC
H/D
EV
EL
OP
ME
NT
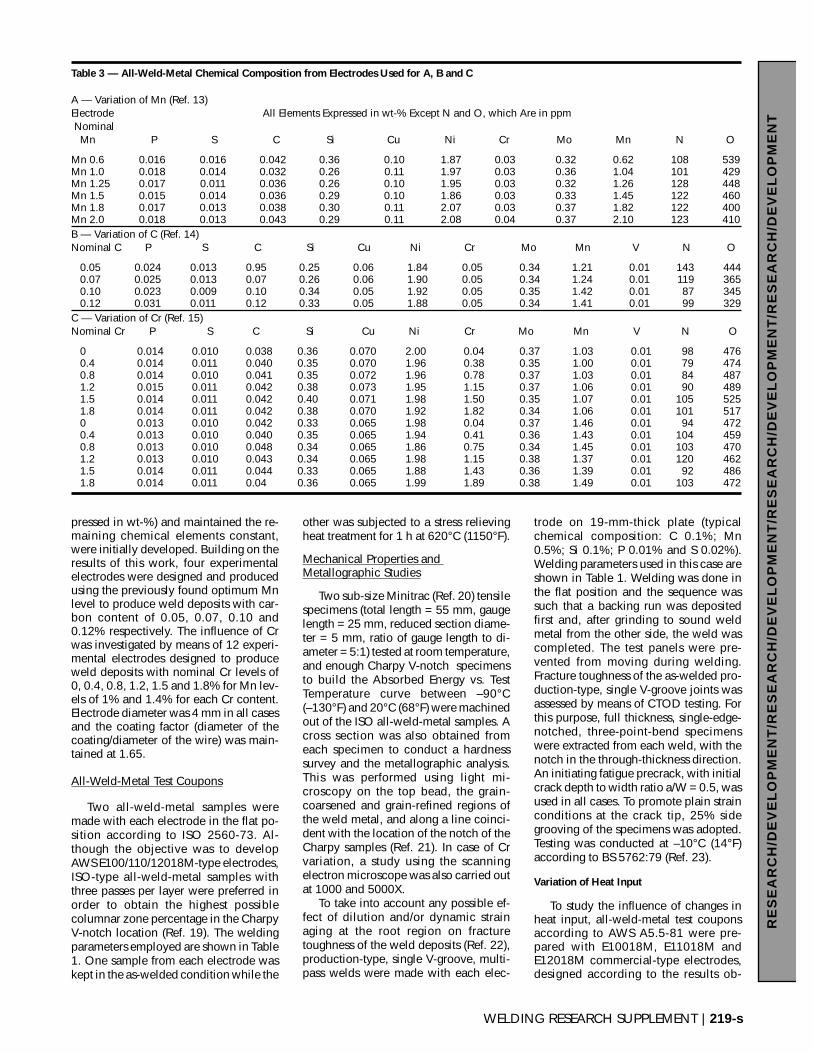
Fig. 7 — All-weld-metal Charpy V-notch impact test results for Cr variation,1% Mn (Ref. 15).
Fig. 8 — All-weld-metal Charpy V-notch impact test results for Crvariation, 1.4% Mn (Ref. 15).
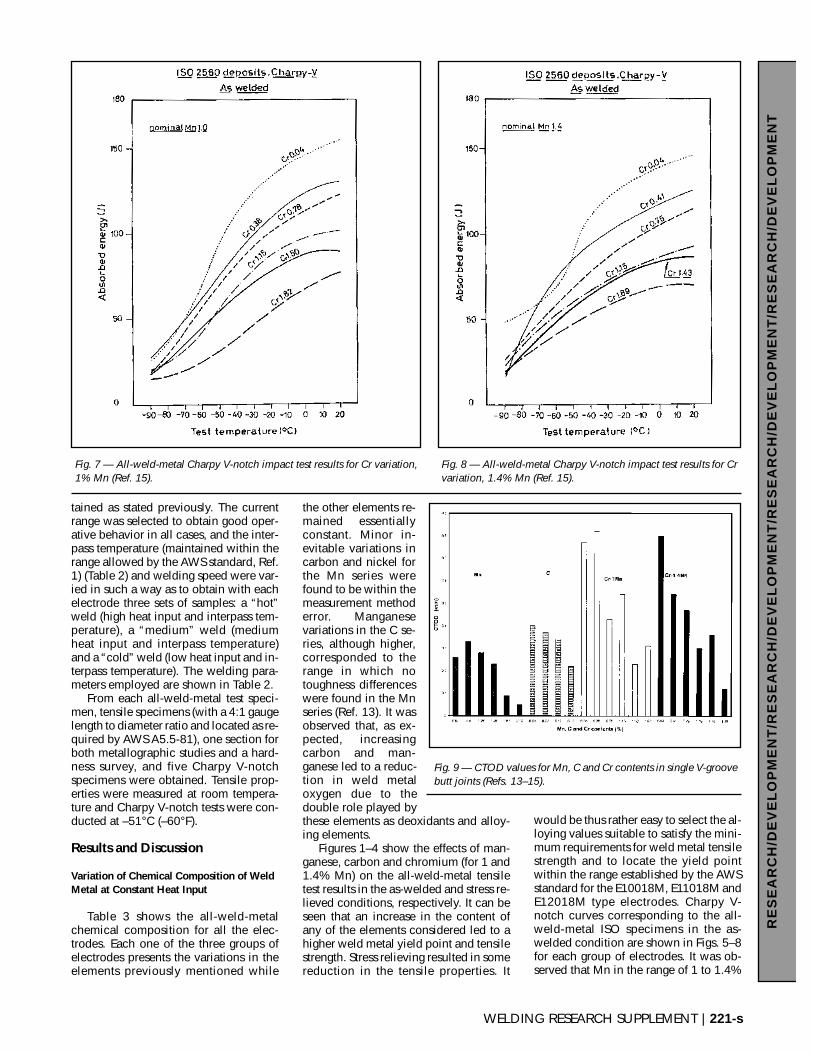
Fig. 9 — CTOD values for Mn, C and Cr contents in single V-groovebutt joints (Refs. 13–15).
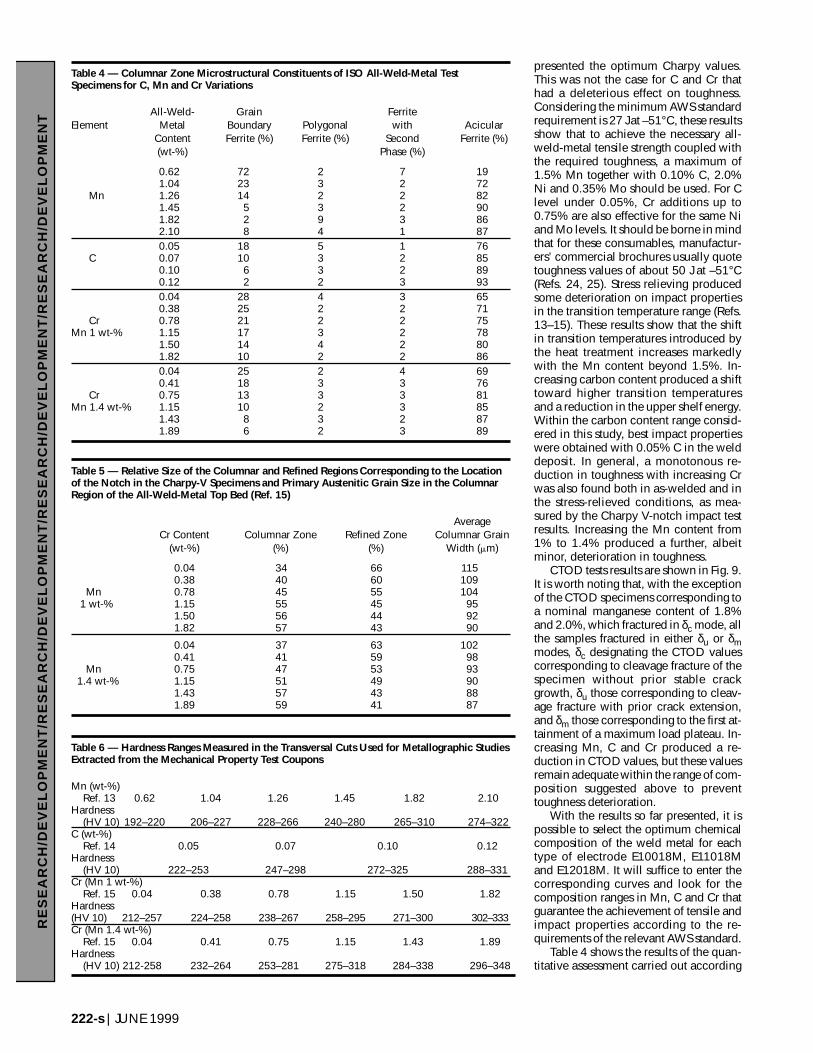
presented the optimum Charpy values.This was not the case for C and Cr thathad a deleterious effect on toughness.Considering the minimum AWS standardrequirement is 27 J at –51°C, these resultsshow that to achieve the necessary all-weld-metal tensile strength coupled withthe required toughness, a maximum of1.5% Mn together with 0.10% C, 2.0%Ni and 0.35% Mo should be used. For Clevel under 0.05%, Cr additions up to0.75% are also effective for the same Niand Mo levels. It should be borne in mindthat for these consumables, manufactur-ers’ commercial brochures usually quotetoughness values of about 50 J at –51°C(Refs. 24, 25). Stress relieving producedsome deterioration on impact propertiesin the transition temperature range (Refs.13–15). These results show that the shiftin transition temperatures introduced bythe heat treatment increases markedlywith the Mn content beyond 1.5%. In-creasing carbon content produced a shifttoward higher transition temperaturesand a reduction in the upper shelf energy.Within the carbon content range consid-ered in this study, best impact propertieswere obtained with 0.05% C in the welddeposit. In general, a monotonous re-duction in toughness with increasing Crwas also found both in as-welded and inthe stress-relieved conditions, as mea-sured by the Charpy V-notch impact testresults. Increasing the Mn content from1% to 1.4% produced a further, albeitminor, deterioration in toughness.
CTOD tests results are shown in Fig. 9.It is worth noting that, with the exceptionof the CTOD specimens corresponding toa nominal manganese content of 1.8%and 2.0%, which fractured in δc mode, allthe samples fractured in either δu or δmmodes, δc designating the CTOD valuescorresponding to cleavage fracture of thespecimen without prior stable crackgrowth, δu those corresponding to cleav-age fracture with prior crack extension,and δm those corresponding to the first at-tainment of a maximum load plateau. In-creasing Mn, C and Cr produced a re-duction in CTOD values, but these valuesremain adequate within the range of com-position suggested above to preventtoughness deterioration.
With the results so far presented, it ispossible to select the optimum chemicalcomposition of the weld metal for eachtype of electrode E10018M, E11018Mand E12018M. It will suffice to enter thecorresponding curves and look for thecomposition ranges in Mn, C and Cr thatguarantee the achievement of tensile andimpact properties according to the re-quirements of the relevant AWS standard.
Table 4 shows the results of the quan-titative assessment carried out according
222-s | JUNE 1999
RE
SE
AR
CH
/DE
VE
LO
PM
EN
T/R
ES
EA
RC
H/D
EV
EL
OP
ME
NT
/RE
SE
AR
CH
/DE
VE
LO
PM
EN
T/R
ES
EA
RC
H/D
EV
EL
OP
ME
NT
Table 4 — Columnar Zone Microstructural Constituents of ISO All-Weld-Metal TestSpecimens for C, Mn and Cr Variations
All-Weld- Grain FerriteElement Metal Boundary Polygonal with Acicular
Content Ferrite (%) Ferrite (%) Second Ferrite (%)(wt-%) Phase (%)
0.62 72 2 7 191.04 23 3 2 72
Mn 1.26 14 2 2 821.45 5 3 2 901.82 2 9 3 862.10 8 4 1 870.05 18 5 1 76
C 0.07 10 3 2 850.10 6 3 2 890.12 2 2 3 930.04 28 4 3 650.38 25 2 2 71
Cr 0.78 21 2 2 75Mn 1 wt-% 1.15 17 3 2 78
1.50 14 4 2 801.82 10 2 2 860.04 25 2 4 690.41 18 3 3 76
Cr 0.75 13 3 3 81Mn 1.4 wt-% 1.15 10 2 3 85
1.43 8 3 2 871.89 6 2 3 89
Table 5 — Relative Size of the Columnar and Refined Regions Corresponding to the Locationof the Notch in the Charpy-V Specimens and Primary Austenitic Grain Size in the ColumnarRegion of the All-Weld-Metal Top Bed (Ref. 15)
AverageCr Content Columnar Zone Refined Zone Columnar Grain
(wt-%) (%) (%) Width (�m)
0.04 34 66 1150.38 40 60 109
Mn 0.78 45 55 1041 wt-% 1.15 55 45 95
1.50 56 44 921.82 57 43 90
0.04 37 63 1020.41 41 59 98
Mn 0.75 47 53 931.4 wt-% 1.15 51 49 90
1.43 57 43 881.89 59 41 87
Table 6 — Hardness Ranges Measured in the Transversal Cuts Used for Metallographic StudiesExtracted from the Mechanical Property Test Coupons
Mn (wt-%)Ref. 13 0.62 1.04 1.26 1.45 1.82 2.10
Hardness(HV 10) 192–220 206–227 228–266 240–280 265–310 274–322
C (wt-%)Ref. 14 0.05 0.07 0.10 0.12
Hardness(HV 10) 222–253 247–298 272–325 288–331
Cr (Mn 1 wt-%)Ref. 15 0.04 0.38 0.78 1.15 1.50 1.82
Hardness(HV 10) 212–257 224–258 238–267 258–295 271–300 302–333Cr (Mn 1.4 wt-%)
Ref. 15 0.04 0.41 0.75 1.15 1.43 1.89Hardness
(HV 10) 212-258 232–264 253–281 275–318 284–338 296–348

to the recommendations of IIW Doc. IX-1533-88 (Ref. 21), on the top bead of theISO specimens in the as-welded condi-tion at magnifications of 400 and 500Xfor each one of the tested samples.
Manganese additions up to about1.5% promoted the formation of acicularferrite and reduced the amount of grainboundary ferrite as previously found (Ref.9). Beyond this level, there seemed to besome further reduction in the relativeamount of grain boundary ferrite but alsoan increase in polygonal ferrite and fer-rite with aligned M-A-C. This is in agree-ment with the notch toughness test re-sults that showed impact propertiesdeteriorated when the Mn level increasesbeyond 1.5%. Manganese also produceda generalized grain size decrease as canbe seen in Fig. 10.
Increasing carbon led to a higher pro-portion of acicular ferrite and to a reduc-tion in grain boundary ferrite. For a car-bon content of about 0.12%, amicrostructure consisting of practically100% acicular ferrite was obtained.Some small proportion of polygonal fer-rite and ferrite with aligned M-A-C wasalso present, but the amount of theseconstituents did not seem to be signifi-cantly affected by variations in the car-bon level. These results are in agreementwith previous findings by Evans (Ref. 12)in C-Mn weld metal. In the weld metalanalyzed in this work, the presence of Niand Mo contributed further to the reduc-tion in the proportion of grain boundaryferrite with a corresponding increase inacicular ferrite, according to what wasshown by other authors (Refs. 26–28). Al-though increasing C levels effectivelypromoted acicular ferrite formation, it
WELDING RESEARCH SUPPLEMENT | 223-s
RE
SE
AR
CH
/DE
VE
LO
PM
EN
T/R
ES
EA
RC
H/D
EV
EL
OP
ME
NT
/RE
SE
AR
CH
/DE
VE
LO
PM
EN
T/R
ES
EA
RC
H/D
EV
EL
OP
ME
NT
Fig. 10 — All-weld-metal typical microstructures for Mn variation series, as welded, 500X (Ref.13). A — Columnar zone, 0.62% Mn; B — columnar zone, 1.82% Mn; C — reheated zone,0.62% Mn; D — reheated zone, 1.82% Mn.
A B
C D
Table 7 — All-Weld-Metal Chemical Composition from Commercial Electrodes Used in AWS Test Specimens with Different Heat Inputs (Refs.16 and 17)
All Elements Expressed in wt-% Except N and O in ppmElectrode C Mn P S Si Ni Cr Mo O N
E10018Mhot 0.042 1.34 0.025 0.013 0.34 1.90 0.08 0.38 552 129
E10018Mmedium 0.041 1.45 0.028 0.013 0.40 1.97 0.08 0.40 538 120
E10018Mcold 0.056 1.49 0.029 0.013 0.40 1.97 0.09 0.40 511 87
E11018Mhot 0.040 1.58 0.015 0.007 0.44 1.94 0.30 0.33 360 86
E11018Mmedium 0.042 1.63 0.016 0.007 0.48 1.97 0.31 0.35 321 84
E11018Mcold 0.045 1.68 0.016 0.008 0.54 1.98 0.31 0.34 315 71
E12018Mhot 0.043 1.56 0.022 0.016 0.43 2.25 0.45 0.43 377 98
E12018Mmedium 0.048 1.62 0.018 0.013 0.45 2.20 0.43 0.42 349 95
E12018Mcold 0.051 1.68 0.020 0.012 0.46 2.13 0.46 0.40 314 87
Note: In all cases, Sn As, Sb, Co, Nb, Ti and Al were lower than 0.01 wt-%.
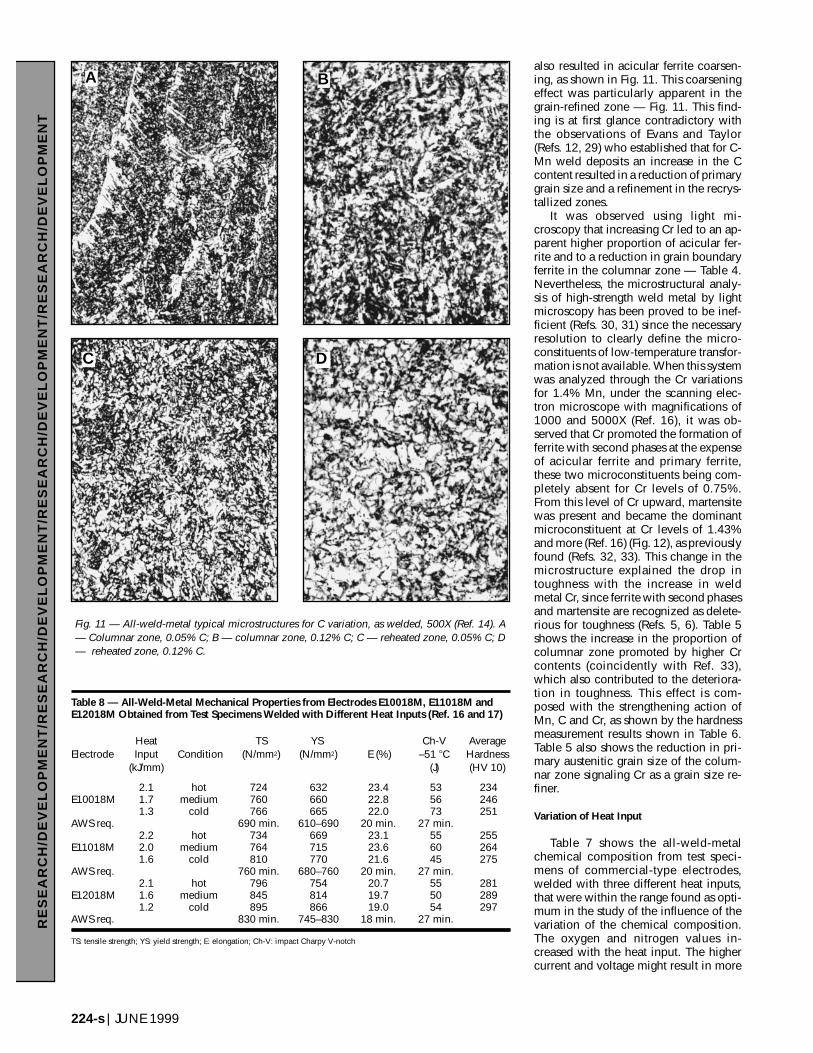
also resulted in acicular ferrite coarsen-ing, as shown in Fig. 11. This coarseningeffect was particularly apparent in thegrain-refined zone — Fig. 11. This find-ing is at first glance contradictory withthe observations of Evans and Taylor(Refs. 12, 29) who established that for C-Mn weld deposits an increase in the Ccontent resulted in a reduction of primarygrain size and a refinement in the recrys-tallized zones.
It was observed using light mi-croscopy that increasing Cr led to an ap-parent higher proportion of acicular fer-rite and to a reduction in grain boundaryferrite in the columnar zone — Table 4.Nevertheless, the microstructural analy-sis of high-strength weld metal by lightmicroscopy has been proved to be inef-ficient (Refs. 30, 31) since the necessaryresolution to clearly define the micro-constituents of low-temperature transfor-mation is not available. When this systemwas analyzed through the Cr variationsfor 1.4% Mn, under the scanning elec-tron microscope with magnifications of1000 and 5000X (Ref. 16), it was ob-served that Cr promoted the formation offerrite with second phases at the expenseof acicular ferrite and primary ferrite,these two microconstituents being com-pletely absent for Cr levels of 0.75%.From this level of Cr upward, martensitewas present and became the dominantmicroconstituent at Cr levels of 1.43%and more (Ref. 16) (Fig. 12), as previouslyfound (Refs. 32, 33). This change in themicrostructure explained the drop intoughness with the increase in weldmetal Cr, since ferrite with second phasesand martensite are recognized as delete-rious for toughness (Refs. 5, 6). Table 5shows the increase in the proportion ofcolumnar zone promoted by higher Crcontents (coincidently with Ref. 33),which also contributed to the deteriora-tion in toughness. This effect is com-posed with the strengthening action ofMn, C and Cr, as shown by the hardnessmeasurement results shown in Table 6.Table 5 also shows the reduction in pri-mary austenitic grain size of the colum-nar zone signaling Cr as a grain size re-finer.
Variation of Heat Input
Table 7 shows the all-weld-metalchemical composition from test speci-mens of commercial-type electrodes,welded with three different heat inputs,that were within the range found as opti-mum in the study of the influence of thevariation of the chemical composition.The oxygen and nitrogen values in-creased with the heat input. The highercurrent and voltage might result in more
224-s | JUNE 1999
RE
SE
AR
CH
/DE
VE
LO
PM
EN
T/R
ES
EA
RC
H/D
EV
EL
OP
ME
NT
/RE
SE
AR
CH
/DE
VE
LO
PM
EN
T/R
ES
EA
RC
H/D
EV
EL
OP
ME
NT
Fig. 11 — All-weld-metal typical microstructures for C variation, as welded, 500X (Ref. 14). A— Columnar zone, 0.05% C; B — columnar zone, 0.12% C; C — reheated zone, 0.05% C; D— reheated zone, 0.12% C.
A B
C D
Table 8 — All-Weld-Metal Mechanical Properties from Electrodes E10018M, E11018M andE12018M Obtained from Test Specimens Welded with Different Heat Inputs (Ref. 16 and 17)
Heat TS YS Ch-V AverageElectrode Input Condition (N/mm2) (N/mm2) E (%) –51 �C Hardness
(kJ/mm) (J) (HV 10)
2.1 hot 724 632 23.4 53 234E10018M 1.7 medium 760 660 22.8 56 246
1.3 cold 766 665 22.0 73 251AWS req. 690 min. 610–690 20 min. 27 min.
2.2 hot 734 669 23.1 55 255E11018M 2.0 medium 764 715 23.6 60 264
1.6 cold 810 770 21.6 45 275AWS req. 760 min. 680–760 20 min. 27 min.
2.1 hot 796 754 20.7 55 281E12018M 1.6 medium 845 814 19.7 50 289
1.2 cold 895 866 19.0 54 297AWS req. 830 min. 745–830 18 min. 27 min.
TS: tensile strength; YS: yield strength; E: elongation; Ch-V: impact Charpy V-notch

O and N in the arc environment (Refs. 34,35) as more time was available for theweld pool to absorb them from the envi-ronment (Ref. 35). It is interesting to notethat due to a different coating factor, min-eral base and Mn content of the coatingof the E10018M, E11018M andE12018M commercial electrodes used,two different levels of oxygen wereachieved (511–552 ppm and 314–377ppm). Nevertheless, the three electrodeswere iron powder basic coating elec-trodes according to EXXX18-X classifica-tion (Ref. 1 and/or 2). It was possible toobserve in the three cases that as the heatinput increased and consequently thepool oxygen content rose, the values ofC, Mn and Si decreased, due to the in-creased oxidation of these three ele-ments. This effect was previously foundby Evans (Refs. 36, 37). The “medium”test specimens presented intermediateMn and Si levels.
Table 8 presents the mechanical prop-erties obtained with the three AWS testcoupons prepared with different heat in-puts. It can be seen that the variation ofheat input produced changes in the all-weld-metal mechanical properties as ex-pected, due to the fact that they are de-pendent on the chemical compositionand microstructure. Therefore, the rate atwhich welds cool and transform fromaustenite following solidification exerts astrong influence on their properties. Inturn, cooling rate is dependent upon theconditions of welding (Refs. 38–45).
In agreement with what was found inhigh-strength steel weld metal obtainedwith the GMA (Refs. 38, 39) and SAWprocesses (Refs. 40, 42), yield and tensilestrengths decreased, as well as averagehardness values as measured along thecross section centerline, when heat inputincreased (Table 8). As expected, averagehardness values rose from E10018M toE11018M to E12018M all-weld-metalelectrodes, due to alloy content increase.
All the test samples produced with theE10018M electrode satisfied the yieldand tensile strength requirements of thestandard, while those samples producedwith E11018M and E12018M electrodesexhibited a different behavior: Only the“medium” sample satisfied the require-ments of the relevant AWS standard forthese electrodes. With the E11018M andE12018M “cold” samples, the maximumyield point limits were exceeded. Withthe “hot” samples, the required mini-mum tensile strengths were notachieved, and with the E11018M “hot”sample, the minimum required yieldstrength value was not reached. Elonga-tion and toughness requirements wereeasily satisfied with all the electrodes andall the heat inputs (Table 8).
WELDING RESEARCH SUPPLEMENT | 225-s
RE
SE
AR
CH
/DE
VE
LO
PM
EN
T/R
ES
EA
RC
H/D
EV
EL
OP
ME
NT
/RE
SE
AR
CH
/DE
VE
LO
PM
EN
T/R
ES
EA
RC
H/D
EV
EL
OP
ME
NT
Fig. 12 — All-weld-metal typical microstructures for 0.75%, Cr 1.4% Mn, as welded (Refs. 15,16). A — Columnar zone, 500X; B — columnar zone 1000X; C — columnar zone 5000X; D —reheated zone, 500X; E — reheated zone, 1000X; F — reheated zone, 5000X.
A B
C
D
E F
Table 9 — Percentages of Variations of Yield Strength (YS) with Respect to the Medium Valueof the YS Range Required by AWS Standard for the Three Electrodes (Ref. 16)
AWS YS YS RequiredElectrode Required Range Range Medium YS Range % YS (from
(N/mm2) Value (N/mm2) (N/mm2) Medium Value)
E10018M 610–690 650 80 ±� 6.2E11018M 680–760 720 80 ±� 5.6E12018M 745–830 787.5 85 ±� 5.4

It follows that with the electrodeE10018M, the full range of heat inputsused in this work may be employed with-out risk of impairing the properties of theweld metal beyond the allowable limits.On the other hand, with electrodesE11018M and E12018M, care must beexerted to control the cooling rate during
welding, and pre-cise instructionsshould be issued toestablish suitablewelding parame-ters within a nar-rower range thanthat used in thiswork to guaranteemeeting the re-quirements. Ac-cording to Table 8,when going fromelectrodeE10018M to theE12018M, that iswith increasingalloy content, all-weld-metal tensileproperties becamemore sensitive tovariations in heat
input with a reduction in the heat inputusable range, as shown in Figs. 13–15.Actually, to satisfy the AWS tensile prop-erty requirements becomes more difficultas weld alloy content increases, due totwo facts: the already referred increasedweld metal sensitivity and the increasingAWS tensile requirements. Table 9 shows
the relative variation of yield strengthwith respect to the mean value of theyield strength range required by AWSstandard for the three electrodes. It canbe observed that as the yield strength in-creases the percentage variation de-creases, thus rendering the standardmore demanding. (It should be stressedthat the previous considerations apply tothe specific test conditions under whichthe samples were produced ([20-mm-thick plate and 93° to 107°C preheat andinterpass temperature]).
The metallographic study (Table 10)showed a decrease in the proportion ofthe columnar zones (and consequentlyan increase of the reheated ones) and anincrease in the ferrite grain size as theheat input increased, as previouslyfound (Refs. 36, 37, 40, 42). It was notpossible to carry out this last measure-ment for E12018M all-weld-metal be-cause the veins of grain boundary ferritedisappeared as the degree of alloy in-creased (Refs. 27, 32, 33, 46). A small in-crease in both acicular ferrite and ferritewith second phase, at the expense of theprimary ferrite in the columnar zone,was also observed with the light micro-scope at 400X. With higher magnifica-tions, other constituents could be identi-fied and quantified (Refs. 16, 27, 33).
Conclusions
The influences of chemical composi-tion at constant heat input were as fol-lows:
• An increase in Mn, C or Cr individ-ually produced an increase of tensile andyield strengths and hardness.
• In the absence of Cr and at the low-est value of C, maximum toughness wasobtained for Mn contents between 1.0and 1.5%. Toughness fell as C increased.Up to 0.10% C the obtained values sat-isfied the AWS requirements, when Mn
226-s | JUNE 1999
RE
SE
AR
CH
/DE
VE
LO
PM
EN
T/R
ES
EA
RC
H/D
EV
EL
OP
ME
NT
/RE
SE
AR
CH
/DE
VE
LO
PM
EN
T/R
ES
EA
RC
H/D
EV
EL
OP
ME
NT
Table 10 — Results of Metallographic Studies (Refs. 16 and 17)
Heat Prior Ferrite withElectrode Input Columnar Refined Austenite Acicular Second Primary
(kJ/mm) Zone (%) Zone (%) Grain Width Ferrite Phase Ferrite (�)(a) (%)(b) (%)(b) (%)(b)
2.1 hot 25 75 140 62 20 18E10018M 1.7 medium 42 58 125 58 16 26
1.3 cold 55 45 110 56 14 302.2 hot 18 82 216 74 20 6
E11018M 2.0 medium 25 75 189 72 19 91.6 cold 42 58 159 66 17 172.1 hot 36 64 64 26 10
E12018M 1.6 medium 45 55 (c) 62 25 131.2 cold 50 50 59 22 19
(a) Measured in the columnar zone. (b) Microconstituents in columnar zone. (c) For E12018M electrode, it was not possible toperform this measurement due to the loss of the grain boundary ferrite veins.
Fig. 14 — Tensile properties vs. heat input E11018M (YS, yieldstrength; TS, tensile strength).
Fig. 15 — Tensile properties vs. heat input E12018M (YS, yield strength;TS, tensile strength).
Fig. 13 — Tensile properties vs. heat input E10018M (YS, yield strength;TS, tensile strength).
was in the optimum range and withoutaddition of Cr. In general, Cr was detri-mental to toughness in this system, butgood impact properties were obtainedwith Cr up to 1.0% for both Mn contentsstudied. In all cases stress relief treat-ment produced a decrease in tensileproperties and Charpy V-notch tough-ness results. While an increase in thesethree elements produced a drop inCTOD results, it was possible to main-tain satisfactory values for all C levels,and up to about 1.4% Mn and Cr, re-spectively.
• Manganese and carbon promotedthe formation of acicular ferrite, asshown by examination at low magnifica-tion with the light microscope. It was ob-served that increasing Cr led to an ap-parent higher proportion of acicularferrite and to a reduction in grain bound-ary ferrite in the columnar zone. At highenough resolution it was detected that Crpromoted the formation of ferrite withsecond phases at the expense of acicularferrite and primary ferrite, these two mi-croconstituents being completely absentfor Cr levels of 0.75%. From this level ofCr upward, martensite was present .
• Manganese and chromium acted asgrain refiners. The addition of C pro-duced a general grain size coarsening.
The influences of varying heat inputwere as follows:
•AWS E10018M-type electrodeswere found suitable to produce all-weld-metal test coupons over a wide range ofwelding parameters while still meetingthe AWS mechanical property require-ments. However, welding parameters forAWS E11018M and E12018M electrodeshad to be precisely specified and closelycontrolled if all-weld-metal test couponswere to reproducibly satisfy AWS re-quirements.
These results involve a rationalmethodology for welding consumable de-velopment that is based on the influencethat controlled changes in chemical com-position and heat input have on weldmetal mechanical properties and mi-crostructure of E10018/11018/12018Mdeposits.
The study on the influence of heatinput variation was performed accordingto AWS A5.5-81 requirements. Chemicalcomposition and mechanical propertyrequirements of the two versions of A5.5standard are the same, but the design ofthe Groove Weld Test Assembly for Me-chanical Properties and Soundness ofWeld Metal is slightly different. This dif-ference may account for differences intensile property results. It is the opinionof the authors of this paper that the all-weld-metal behavior general tendencywill be the same if the new design is used
to evaluate the variation of tensile prop-erties with heat input, but this cannot beassured without the performance of ade-quate tests.
Acknowledgments
The authors want to give properrecognition to the Fundación Lati-noamericana de Soldadura, the INTEMAof Facultad de Ingeniería de la Universi-dad Nacional de Mar del Plata, andConarco Alambres y Soldaduras S.A.from Argentina and to the Pontifícia Uni-versidade Católica do Rio and CentroFederal de Educação Tecnológica fromBrazil. All are organizations that havesupported the different stages of thisworking program, from 1987 to 1996.
References
1. AWS A5.5-81, Specification for LowAlloy Steel Covered Arc Welding Electrodes.American Welding Society, Miami, Fla.
2. ANSI/AWS A5.5-96, Specification forLow-Alloy Steel Electrodes for Shielded MetalArc Welding. American Welding Society,Miami, Fla.
3. George, M., Still, J., and Terry, P. 1981.Gas metal arc welds for high toughness appli-cations — microstructure and other factors.Metal Construction 13(12): 730–737.
4. Keeler, T. 1981. Innershield welding.Part 1 — development and applications.1981. Metal Construction 13(11): 667–673.
5. Garland, J. C., and Kirkwood, P. R. 1975.Towards improved submerged arc weld metal— part 1. Metal Construction 7(5): 275–283.
6. Garland, J. C., and Kirkwood, P. R. 1975.Towards improved submerged arc weld metal— part 2. Metal Construction 7(5): 320–330.
7. Pickering, F. B. 1978. Physical Metal-lurgy and the Design of Steels. Materials Sci-ence Series, Applied Science Publishers, Lon-don, U.K.
8. Abe, N., Kitada, T., and Miyata, S. 1980.Effects of alloying elements on the toughnessand microstructure of high current density gasshielded arc process weld metals. Transact. ofthe JWS 11(4): 29–34.
9. Evans, G. 1980. Effect of manganese onthe microstructure and properties of all-weld-metal deposits. Welding Journal 59(3): 67-s to75-s.
10. Surian, E., and Boniszweski, T. 1992.Effect of manganese and type of current on theproperties and microstructure of all-weld-metal deposited with E7016-1 electrodes.Welding Journal 71(9): 348-s.
11. Den Ouden, G., Verhagen, J. G., andTichelgar, G. W. 1975. Influence of chemicalcomposition on mild steel weld metal notchtoughness.Welding Journal 54 (3):87-s to 94-s.
12. Evans, G. 1981. The effect of carbon onthe microstructure and properties of C-Mn all-weld-metal deposits. IIW-IIS Doc. II-A-546-81.
13. Surian, E., Trotti, J., Cassanelli, A. Ni,and de Vedia, L. 1987. Influence of Mn con-tent on mechanical properties and mi-crostructure of a high strength SMA electrodeweld metal. IIW-IIS Doc. II-A-724-87.
14. Surian, E., Trotti, J., Herrera, R. y de,
Vedia, L. A. 1991. Influence of C on mechan-ical properties and microstructure of weldmetal from a high-strength SMA electrode.Welding Journal 70(6): 133-s to 140-s.
15. Surian, E., Trotti, J., Cassanelli, L. A., andde Vedia, L. A. 1994. Influence of chromium onmechanical properties and microstructure ofweld metal from a high strength SMA electrode.Welding Journal 73(3): 45-s to 53-s.
16. Bott, I. de S., Souza, L., Jorge, J., andSurian, E. Microstructural evaluation of a highstrength weld metal with varying Cr content bymeans of scanning electron microscopy. IIW-IIS Doc. II-A-936–94.
17. Vercesi, J., and Surian, E. 1996. The ef-fect of welding parameters on high-strengthSMAW all-weld-metal — part 1: AWS E11018M.Welding Journal 75 (6): 191-s to 196-s.
18. Vercesi, J., and Surian, E. 1997. The ef-fect of welding parameters on high-strengthSMAW all-weld-metal — part 2: AWSE10018M and E12018M. Welding Journal77(4): 164-s to 171-s.
19. Evans, G. M. 1978. Comparison of ISO2560 and AWS A5.1-69. Oerlikon-Schweiss-mitt 3(85): 4–10.
20. Schnadt, H. M., and Leinhard, E.W.1963. Experimental investigation of the sharp-notch behavior of 60 steels at different tem-perature and strain rates. IIW-IIS Doc. 196-343-63.
21. Abson, D. J. Guide to the light micro-scope examination of ferrite steel weld metals.IIW Doc. IX-1533-88.
22. Vega, R. A., Otegui, J. L., and de Vedia,L. A. Influence of dynamic strain ageing onnotch toughness of weld deposits. Latinamer-ican J. of Metallurgy and Materials 1(3):42–47.
23. British Standard Institution. Methodsfor Crack Tip Opening Displacement (COD)Testing, BS 5762:79, London, England.
24. Welding Electrodes. Catalog of PhilipsLastechniek B. V. Holland.
25. Welding Consumables. Catalog ofKobe Steel. Kobelco. Japan.
26. Evans, G. M. 1990. The effect of nickelon the microstructure and properties of C-Mnall-weld metal deposits. Oerlikon-Schweißmitteilungen 45(115) 18–35.
27. Evans, G. M. 1988. The influence ofmolybdenum on the microstructure and prop-erties of C-Mn all-weld-metal deposits. Join.Mat. 1(5): 239-s to 246-s.
28. Judson, P., and McKoewn, D. 1982.Advances in the control of weld metal tough-ness. Second International Conference on Off-shore Welded Structures. The Welding Insti-tute, London, England.
29. Taylor, D. S., and Evans, G. M. 1982.The systematic development of a new range ofMMA electrodes for critical areas for offshorefabrication. Second International Conferenceon Offshore Welded Structures. The WeldingInstitute, London, England.
30. Jorge, J. C. F., and Rebello, J. M. A.1989. Microscopia eletrônica de varredura decordões de solda de alta resistência. Soldageme Materiais 1(3): 44–49.
31. Jorge, J. C. F. 1993. Relacão tenaci-dade/microstrutura de metal de solda de açoC-Mn-Cr obtidos de solda passe único peloproceso arco submerso. Tese D. Sc.COPPE/UFRJ. Brazil.
32. Jorge, J. C. J., Rebello, J. M. A., andEvans, G. M. 1993. Microstructure and tough-
WELDING RESEARCH SUPPLEMENT | 227-s
RE
SE
AR
CH
/DE
VE
LO
PM
EN
T/R
ES
EA
RC
H/D
EV
EL
OP
ME
NT
/RE
SE
AR
CH
/DE
VE
LO
PM
EN
T/R
ES
EA
RC
H/D
EV
EL
OP
ME
NT

ness relationship in C-Mn-Cr all-weld metaldeposits. IIW / IIS Doc. II-A-880-93.
33. Jorge, J. C. J., Souza, L. F. G., Rebello, J.M. A., and Evans, G. M. 1994. Effect ofChromium on the Microstructure/ ToughnessRelationship in C-Mn-Mo Weld Deposits. IIW /IIS Doc. II-A-930-94.
34. van Nassau, L., and van der Mee, V.1991/1992. Nitrogen in manual metal arcwelding. WRC Bulletin, N 369.
35. Boniszewski, T. Self-Shielded ArcWelding. p. 31, Abington Publishing, Cam-bridge, England.
36. Evans, G. M. 1982. The effect of heatinput on the microstructure and properties ofC-Mn all-weld-metal deposits. Welding Jour-nal 61(4): 125-s to 132-s.
37. Evans, G. M. 1982. Effect of electrodediameter on the microstructure and propertiesof C-Mn all-weld-metal deposits. Welding Re-view 1(2): 4–8.
38. Stout, R. D., McLaughlin, P. F., andStrunck, S. S. 1969. Heat treatment effects onmultipass welds. Welding Journal 48(4): 155-s to 160-s.
39. Lyttle, J. E., Dorschu, K. E., andFragetta, W. A. 1969. Some metallurgicalcharacteristics of tough, high-strength welds.Welding Journal 48 (11): 493-s to 498-s.
40. Smith, N. J., McGrath, J. T., Gianetto,J. A., and Orr, R. F. 1989. Microstructure/me-chanical property relationships of submergedarc welds in HSLA 80 steel. Welding Journal68(3): 112-s to 120-s.
41. Oldland, P. T., Ramsay, C. W., Matlock, D. K., and Olson, D. L. 1989. Significant fea-tures of high-strength steel weld metal mi-crostructures. Welding Journal 68(4): 158-s to168-s.
42. Gianetto, J. A., Smith, N. J., McGrath,J. T., and Bowker, J. T. 1992. Effect of compo-sition and energy input on structure and prop-
erties of high-strength weld metals. WeldingJournal 71(11): 407-s to 419-s.
43. Strunck, S. S., and Stout, R. D. 1972.Heat treatment effects in multipass weldmentsof a high-strength steel. Welding Journal 51(10): 508-s to 520-s.
44. Glover, A. G., McGrath, J. T., Tinkler,M. J., and Weatherly, G. C. 1977. The influ-ence of cooling rate and composition on weldmetal microstructures in a C/Mn and a HSLAsteel. Welding Journal 56(9): 267-s to 273-s.
45. Dorschu, K. E. 1968. Control of cool-ing rates in steel weld metal. Welding Journal47(2): 49-s to 62-s.
46. Evans, G. M. 1989. The effect ofchromium on the microstructure and proper-ties of C-Mn all-weld-metal deposits. Weld.Met. Fab. 57(7): 346–358.
228-s | JUNE 1999
RE
SE
AR
CH
/DE
VE
LO
PM
EN
T/R
ES
EA
RC
H/D
EV
EL
OP
ME
NT
/RE
SE
AR
CH
/DE
VE
LO
PM
EN
T/R
ES
EA
RC
H/D
EV
EL
OP
ME
NT
All authors should address themselves to thefollowing questions when writing papers for submissionto the Welding Research Supplement:
◆ Why was the work done?◆ What was done?◆ What was found?◆ What is the significance of your results?◆ What are your most important conclusions?With those questions in mind, most authors can
logically organize their material along the followinglines, using suitable headings and subheadings todivide the paper.
1) Abstract. A concise summary of the majorelements of the presentation, not exceeding 200 words,to help the reader decide if the information is for him orher.
2) Introduction. A short statement giving relevantbackground, purpose and scope to help orient thereader. Do not duplicate the abstract.
3) Experimental Procedure, Materials,Equipment.
4) Results, Discussion. The facts or data obtainedand their evaluation.
5) Conclusion. An evaluation and interpretation ofyour results. Most often, this is what the readersremember.
6) Acknowledgment, References and Appendix.Keep in mind that proper use of terms,
abbreviations and symbols are importantconsiderations in processing a manuscript forpublication. For welding terminology, the WeldingJournal adheres to ANSI/AWS A3.0-94, StandardWelding Terms and Definitions.
Papers submitted for consideration in the WeldingResearch Supplement are required to undergo PeerReview before acceptance for publication. Submit anoriginal and one copy (double-spaced, with 1-in.margins on 8 1⁄2 x 11-in. or A4 paper) of the manuscript.Submit the abstract only on a computer disk. Thepreferred format is from any Macintosh® wordprocessor on a 3.5-in. double- or high-density disk.Other acceptable formats include ASCII text,Windows™ or DOS. A manuscript submission formshould accompany the manuscript.
Tables and figures should be separate from themanuscript copy and only high-quality figures will bepublished. Figures should be original line art or glossyphotos. Special instructions are required if figures aresubmitted by electronic means. To receive completeinstructions and the manuscript submission form,please contact the Peer Review Coordinator, DoreenKubish, at (305) 443-9353, ext. 275; FAX 305-443-7404; or write to the American Welding Society, 550 NWLeJeune Rd., Miami, FL 33126.
Preparation of Manuscripts for Submissionto the Welding Journal Research Supplement