Embed Size (px)
Citation preview

Private versus Public Corporate Ownership: Implications for Future Profitability
Kristian D. Allee Michigan State University
Brad A. Badertscher
University of Notre Dame
and
Teri Lombardi Yohn Indiana University
Draft: September 2011 Preliminary and Incomplete – Do not cite without permission.
Abstract: There is a long history of academic research that attempts to provide insight into the effect of public ownership on firm performance. We extend this line of research by evaluating the differences in future profitability between publicly traded and privately held firms. We posit that private firms are more profitable than public firms and this is mainly driven by differences in the profit margin of the firms. We empirically test these predictions using a matched sample of private and public firms. Our results indicate that private firms have greater future profitability than public firms. We also find differences in the future profit margin but not future asset turnover of the private firms relative to the public firms. These results provide useful evidence in understanding the overall effect that public and private ownership has on the future profitability. _____________________________________________________________________________________
JEL classification: Keywords: private companies, profitability, future performance, and ownership structure
All errors are our own.

1
I. INTRODUCTION
The advantages and disadvantages of public corporate ownership have been debated for
years (Berle and Means 1932). Public ownership allows for greater access to credit, enhanced
stock-based management compensation packages, external monitoring of the business, and to
greater publicity for the company. These advantages of public ownership have the potential to
increase investment opportunities, attract the best employee talent, and lead to an enhanced
reputation relative to what would be possible if the company were private.
On the other hand, there are potential disadvantages of public ownership. The diffuse
ownership and separation of ownership from control could potentially create agency problems
such that managers do not make decisions that are in the best interest of shareholders. The cost of
regulation, especially since the implementation of the Sarbanes-Oxley Act (SOX), can be daunting,
and the disclosure requirements can diminish the competitiveness of the business. In addition,
public monitoring can lead managers of public companies to focus on short-term metrics instead of
long-run future profitability.
In general, there are fundamental differences between private and public ownership that
could potentially affect corporate growth and profitability. Public ownership could aid companies
in generating higher future profitability or it could inhibit companies from meeting their potential
relative to private ownership. Warren Buffett has noted the potential concerns with publicly traded
companies and has recently demonstrated a preference for investments in private companies.
Hough (2011), in a discussion of Warren Buffett’s letter to Berkshire Hathaway shareholders,
states that “Wall Street’s short-sighted focus on stock earnings hinders company performance,
whereas private companies are free to prosper.” Google (2004), prior to its initial public offering,
noted that “outside pressures too often tempt [public] companies to sacrifice long term
opportunities to meet quarterly market expectations." Furthermore, Berman (2011) notes that a

2
benefit of private investment into Automated Data Systems is that “all the margin information, so
useful to competitors, stays hidden from public view.”
These arguments suggest that there are tradeoffs associated with being publicly owned that
could hinder future profitability. Therefore, the benefits of public ownership associated with
greater access to credit, publicity, and management talent could be completely offset by agency
issues, a short-term focus from market pressures, and regulatory and disclosure requirements
associated with public ownership. This could lead public companies to experience lower future
profitability relative to their private counterparts. Despite the interest in both practice and
academics on the effect of private versus public ownership structure on firm performance, little
research has examined this issue. The lack of empirical evidence is primarily due to the lack of
data on private companies.
In this study, we are able to provide empirical evidence on the relative future profitability
of private and public companies by using data from Sageworks Inc., which has recently made
private firm data more available to academic researchers. The Sageworks database contains
balance sheet and income statement data for more than 100,000 unique private firms over the
period 2001 to 2010 and was designed to assist accounting firms and banks in performing
analytical procedures and ratio analyses on private clients. These data allow our study to take a
first step toward examining the relative differences in future profitability between public and
private companies from a broad set of industries using actual financial statement data.
We hypothesize, after matching on year, industry, size, and current profitability, that
private companies experience higher future operating profitability than public companies. We also
hypothesize that the greater profitability for private companies is driven by higher future profit
margins rather than higher future asset turnovers. Finally, we recognize that public companies will

3
likely experience lower costs of debt due to the disclosure requirements of a public company, but
also suggest that this will not offset the hypothesized lower operating profitability resulting from
diminished profit margins. Therefore, we predict that private companies will have higher future
return on equity.
To test these hypotheses, we first match public and private companies based on year,
industry, firm size (net operating assets), and current profitability (return on net operating assets,
profit and loss firms). We then examine whether firm profitability, defined as return on net
operating assets, one, three, and five years ahead, differs between public and private firms, holding
constant the matched variables in univariate results. In multivariate tests, we control for current
growth and profitability as well as the components of profitability. We also test for differences
between private and public companies with respect to the components of return on net operating
assets, asset turnover and profit margin, to improve our understanding of the differences in
profitability between public and private firm ownership. Finally, we investigate differences in the
cost of debt for public and private companies, and test for differences in future return on equity
between public and private firm ownership to assess whether financing costs affect future
profitability differentially.
We find evidence consistent with our predictions. Specifically, we find that private
companies have significantly higher return on net operating assets one, three, and five years ahead.
We find that the relatively higher profitability for private versus public companies is driven by
higher profit margins. We find no significant difference in future asset turnover between public
and private companies. We also find that while private companies experience a significantly
higher cost of debt, private companies also experience a higher return on equity after controlling
for the relative disadvantage of debt in their capital structure.

4
These results suggest that, for private and public companies in the same industry, of similar
size, and similar current profitability, private companies experience higher future profitability in
the form of return on net operating assets, profit margins, and return on equity. These results
provide evidence on the overall effect of public versus private ownership on corporate future
profitability. These results provide empirical evidence helpful to managers, lenders, and equity
fund managers, both public and private, in terms of the future costs and benefits associated with
ownership differences. Our results are also consistent with differences in future profitability
deriving from the costs associated with being a public firm and not necessarily from the financial
reporting pressures of reporting consistent and increasing earnings as many researchers and
practitioners have suggested.
This study contributes to the literature on the effect of ownership structure on firm
performance. Prior work provides evidence on the effect of specific corporate ownership
characteristics on current profitability (Demsetz and Lehn 1985; Demsetz and Villalonga 2001).
While these studies examine the relation between current profitability and specific ownership
structures within public companies, they do not provide evidence regarding the overall effect of
public versus private ownership on current or future profitability.
This study also contributes to the literature that examines firm performance before and after
an initial public offering (Pagano, et al. 1998; Jain and Kini 1994; Mikkelson, et al 1997) or a
public offering via a reverse leveraged buyout (DeGeoge and Zeckhauser 1993). Our study
contributes to this literature by examining a sample of private firms compared to a matched sample
of public firms. By examining the future profitability of these two samples, as opposed to
examining companies around public offerings, the observed future performance is not influenced
by the effects of the public offering itself. Our sample of firms are, therefore, likely to be more

5
stable, which allows for a more complete analysis of the impact of private versus public ownership
on firm performance and is able to provide additional insight into the association between private
versus public ownership and long-run performance.
The remainder of the paper is organized as follows. Section II provides some background
and develops the hypotheses. Section III describes sample selection and matching procedures, and
provides descriptive statistics. Section IV presents the results of the empirical analyses, and
Section V offers concluding remarks.
II. BACKGROUND, HYPOTHESES DEVELOPMENT, AND RESEARCH DESIGN
Prior Literature
There is a long history of academic research that attempts to provide insight into the effect
of public ownership on firm performance. Much of the research has examined the association
between specific ownership characteristics and firm performance. For example, Himmelberg et al.
(1999) and Demsetz and Lehn (1985) find no relation between return on assets and managerial
ownership. Demsetz and Villalong (2001) find no relation between various ownership structure
characteristics and firm performance. Holderness and Sheehan (1988) and Denis and Denis (1994)
find no association between firm performance and the diffusion of ownership. Other research has
examined specific costs associated with ownership structure. For example, Ang et al. (2000) find
that agency costs increase with non-managerial ownership.
Research has also examined the performance of companies after initial public offerings to
assess the association between public ownership and firm performance. For example, Pagano et al.
(1998) find a reduction in the profitability of companies after an initial public offering for a sample
of Italian companies. Jain and Kini (1994) find a reduction in operating profitability after an initial

6
public offering for a sample of U.S. firms. Mikkelson et al. (1997) find reduced profitability from
prior to the initial public offering to the end of the first year after public offering for a sample of
U.S. firms, but find no further decline in profitability for the ten years after the public offering.
DeGeorge and Zeckhauser (1993) find a reduction in firm performance after companies go public
through a reverse leveraged buyout.
While these studies provide insight into whether specific ownership characteristics are
associated with firm performance or whether having an initial public offering is associated with a
change in profitability, it is difficult to assess whether public companies are associated with
differential future profitability relative to private companies. Research on specific ownership
characteristics and company performance cannot provide insight into the overall effect of public
versus private ownership on firm performance. In addition, research on changes in company
performance around public offerings is unable to provide insight into whether there are differences
in firm performance between public and private companies in a stable environment when there is
not a significant inflow of capital. A direct empirical comparison of future profitability between
private versus public firms would provide insight into this issue. However, the difficulty in
obtaining data on private firms has led to a lack of research in this area.
Some studies have overcome the data problem by focusing on regulated industries, such as
banking and insurance companies, or using data collected from surveys of private companies. For
example, Ke et al. (1999) perform a univariate comparison of a sample of 45 privately-held
property-liability insurers and 18 publicly-held property-liability insurers, and detect no significant
difference in profitability between public and private firms. However, this analysis examines a
small sample of firms within one industry. Using the Forbes survey of the 500 biggest private
companies in the United States, Coles et al. (2003) find that private firms are less profitable than

7
similar public firms, when profitability is measured as operating margin and profit margin.
However, Coles, et al (2003) uses estimated data and does not employ a matched pair research
design. We contribute to this stream of literature by presenting empirical evidence on differences
in future profitability between a matched sample of private and public companies.
Hypotheses Development
The public corporation is believed to have numerous advantages over its private
counterpart (Renneboog et al. 2007). For example, public firms are likely to be able to invest in
more profitable projects to due greater access to capital. Additionally, public firms have access to
more media exposure, greater publicity and an increased reputation. Public firms have greater use
of stock price-based compensation packages that can attract the best employee and management
talent. All of these factors could result in public companies outperforming private companies in
terms of long-run future profitability.
On the other hand, recently there have been arguments that public companies may be less
profitable in the long-run than private companies. The agency conflict in which managers may not
act in the best interest of shareholders is the most debated potential disadvantage of public
ownership (Berle and Means 1932). Detailed disclosure requirements for public companies may
also hinder profitability (Pagano and Roell 1998). In fact, Brau and Fawcett (2006) find, in a
survey of CFOs, that “disclosing information to competitors” and “SEC reporting requirements”
are among the five most important reasons why private firms remain private in the U.S. Therefore,
firms organized as private companies have distinctive long-run advantages over public companies
due to increased exposure of public firm corporate strategies and trade secrets. In addition, the
cost of regulation, especially since the implementation of SOX, can hinder profitability. CFOs
surveyed by Brau and Fawcett (2006) suggest that expenses associated with listing requirements

8
imposed by securities exchanges, SEC rules and regulations, and accounting requirements for
public companies, estimated at over a million dollars annually, can affect long-run profitability
(Hartman 2006).
Moreover, organizing as a private firm avoids some of the pressures of myopic investment
decisions due to demands from short-term oriented investors (Stein 1988; 1989).1 For example,
Beatty et al. (2002) compare samples of publicly and privately held bank holding companies
because they expect public banks’ diffuse shareholders to be more likely than private banks’ more
concentrated shareholders to rely on simple earnings-based heuristics in evaluating firm
performance. Beatty et al. (2002) expect public banks managers to face more pressure than private
bank managers to report earnings in line with expectations and find evidence consistent with their
expectations.
In summary, while we recognize there are valid reasons to expect public ownership to
enhance a firm’s performance, we hypothesize that these will be overpowered by the costs
associated with public ownership. Specifically, public ownership accentuates agency conflicts,
requires disclosure of detailed information to competitors, is relatively more costly due to listing
requirements imposed by securities exchanges and the SEC, and can lead managers of public
companies to focus on short-term metrics instead of long-run future profitability in order to report
earnings in line with expectations. This leads to our first hypothesis:
H1: The future operating profitability is higher for private companies relative to the public companies.
Operating profitability, defined as return on net operating assets, is a multiplicative
function of the company’s asset turnover and profit margin (Fairfield and Yohn 2001). Public
1 Charles Koch, chief executive of Koch Industries Inc., the United States’ second-largest private company, claims chief executives that obsess about delivering those “ever-increasing and predictable quarterly earnings” are “going to sacrifice long-term value” in the end (Shlaes 2007).
9
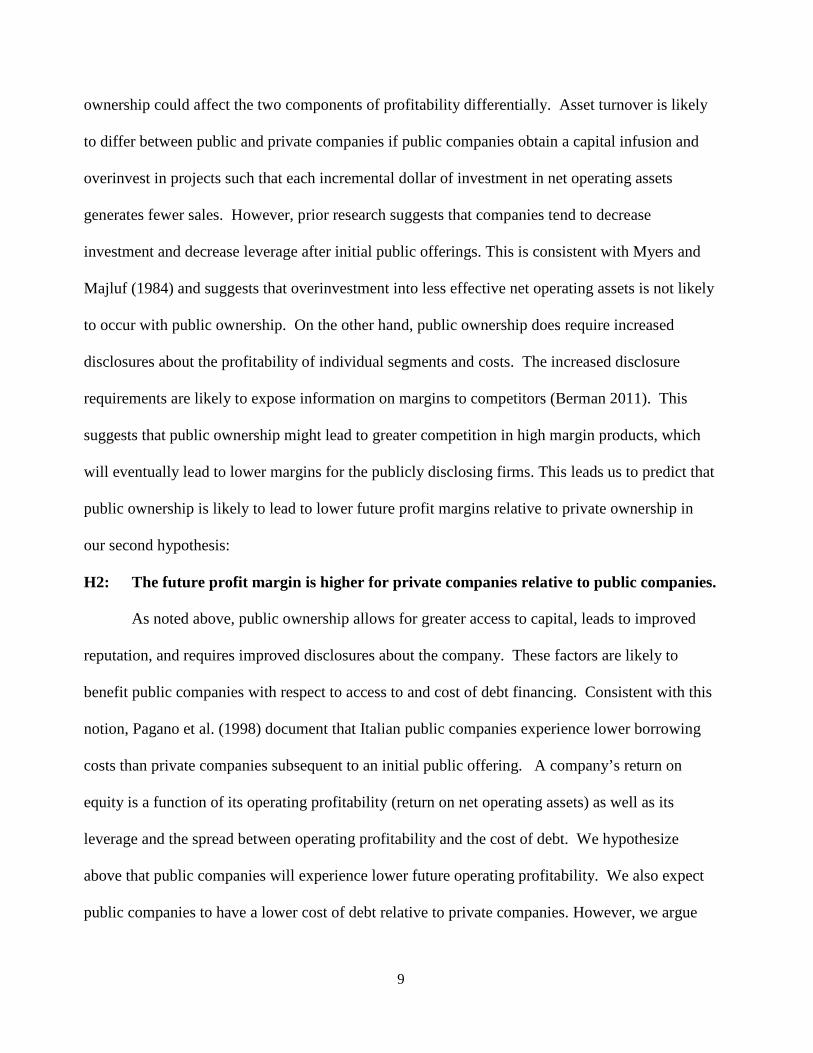
ownership could affect the two components of profitability differentially. Asset turnover is likely
to differ between public and private companies if public companies obtain a capital infusion and
overinvest in projects such that each incremental dollar of investment in net operating assets
generates fewer sales. However, prior research suggests that companies tend to decrease
investment and decrease leverage after initial public offerings. This is consistent with Myers and
Majluf (1984) and suggests that overinvestment into less effective net operating assets is not likely
to occur with public ownership. On the other hand, public ownership does require increased
disclosures about the profitability of individual segments and costs. The increased disclosure
requirements are likely to expose information on margins to competitors (Berman 2011). This
suggests that public ownership might lead to greater competition in high margin products, which
will eventually lead to lower margins for the publicly disclosing firms. This leads us to predict that
public ownership is likely to lead to lower future profit margins relative to private ownership in
our second hypothesis:
H2: The future profit margin is higher for private companies relative to public companies. As noted above, public ownership allows for greater access to capital, leads to improved
reputation, and requires improved disclosures about the company. These factors are likely to
benefit public companies with respect to access to and cost of debt financing. Consistent with this
notion, Pagano et al. (1998) document that Italian public companies experience lower borrowing
costs than private companies subsequent to an initial public offering. A company’s return on
equity is a function of its operating profitability (return on net operating assets) as well as its
leverage and the spread between operating profitability and the cost of debt. We hypothesize
above that public companies will experience lower future operating profitability. We also expect
public companies to have a lower cost of debt relative to private companies. However, we argue

10
that the effect of public ownership on return on net operating assets is likely to outweigh the effect
of public ownership on the cost of debt with respect to the company’s return on equity. We make
this assertion based on the notion that public companies are likely to rely less on debt after an
equity offering (Pagano et al. 1998). Therefore, the benefit of the lower cost of debt is likely to
have a small effect on return on equity. This leads to our third hypothesis:
H3: The future return on equity is higher for private companies relative to public companies.
Research Design
To test our hypotheses that private companies are likely to experience greater future
profitability than public companies, primarily due to differences in profit margins, we estimate the
regression model shown in equation (1).2
(1)
The left-hand side variable is a future profitability metric of interest. We evaluate the
following future profitability metrics: (1) future return on net operating assets, measured as
RNOAt+1, RNOAt+3, and RNOAt+5; (2) future profit margin, measured as PMt+1, PMt+3, and PMt+5;
and (3) future asset turnover, measured as ATOt+1, ATOt+3, and ATOt+5. RNOA is calculated as
net operating income (before any financing costs or investment income) in the numerator, and
average net operating assets (operating assets net of operating liabilities) in the denominator
2 We examine all of our hypotheses using a matched-pair design which is described later in this section.
����������� � �������� �� � ��������� � ������� � ��∆����� � ��∆����
� ����� � �∆���� � ����� � ��∆��� � � �������
� ����� � ���������� � ∆����� � ���������� � ∆����
� ���������� � ���� � ���������� � ∆����
� ���������� � ��� � ��������� � ∆��� � ��

11
(Fairfield et al. 2009).3 PM is the firm profit margin and equals operating income divided by sales
and ATO is asset turnover defined as sales divided by net operating assets. ∆RNOA is the change
in RNOA as described above from t-1 to t. ∆NOA is the change in average net operating assets
from t-1 to t. ∆ATO and ∆PM are the changes in ATO and profit margin from t-1 to t,
respectively. The indicator variable PRIVATE is coded one when the firm is a private firm and
zero otherwise. The coefficient of interest for our first and second hypothesis is b1 for which we
expect a positive and statistically significant sign on the coefficient.
We also run equation (1) using future RNOA as the dependent variable for private firms
with audited financial statements, and their matched public firms to examine the future
profitability differences between public and private firms holding constant the presence of audited
financial statements.4 Although this specification reduces our sample size, we want to be sure that
our results are not driven by non-audited private firms.
To test our last hypothesis, H3, we analyze the future profitability of public and private
firms after including financing costs by examining future ROE, defined as net income divided by
stockholders’ equity. The difference between RNOA and ROE is generally related to the capital
structure of the company. All else equal, a more levered firm will have a higher ROE than a less
levered firm and that will result in a larger gap between RNOA and ROE, but that difference also
depends on the ability of the firm to earn a return on net operating assets greater than the cost of
the debt incurred. Public firms likely have greater access to and lower costs of debt due to the
disclosure, audit, and regulatory requirements of the SEC. Our univariate results confirm that
3 Operating income equals sales minus costs of goods sold, overhead costs, and depreciation and amortization. Net operating assets equals stockholders’ equity minus cash and short term investments plus interest plus debt in current liabilities plus long-term debt. 4 Note here that we recognize that we cannot hold constant the cost of the audited financial statements and that the cost of the audit for a public firm is likely higher than the cost of the audit for a private firm due to the increasing costs of litigation for the auditor (Badertscher et al. 2011).

12
public firms indeed have lower cost of debt relative to private firms. However, since public firms
have access to public equity, they are unlikely to finance their operations through significant
increases in debt. Thus, while there is a benefit associated with being public, on the margin, we
hypothesize that it is not likely to reverse the effects we hypothesize for RNOA after incorporating
the effects of debt. Therefore, ROEt+1, ROEt+3, and ROEt+5 are the dependent variables in equation
(2) and H3 predicts a positive and statistically significant coefficient on c1 below.
(2)
New variables in equation (2) are defined as follows: ∆BVE is the change in book value of
equity from t-1 to t; LEV is long-term debt divided by the book value of equity; and ∆LEV is the
change in that variable from t-1 to t. As stated earlier, leverage will only be a benefit to current
and future ROE when the firm earns a return on net operating assets greater than the cost of the
debt incurred from the liability. This difference is often referred to as the spread. The importance
of spread for increasing ROE can be established by disaggregating ROE as follows:
(3)
According to equation (3), return on equity can be increased by i) increases in the rate of return on
the firm’s net operating assets, ii) increases in leverage, and iii) decreases in the cost of debt
relative to the return on net operating assets (Wahlen et al. 2011). Thus, we also examine ROEt+1,
ROEt+3, and ROEt+5 by breaking current ROE into its three components (i.e., RNOA, Leverage,
and Spread). Specifically, we examine the d1 coefficient in equation (4) to further test H3.
������ � �� � ��������� � ������ � ��∆���� � ������ � �∆����
� ���� � ��∆��� � ������ � � ∆���� � ����������
� ��� � ���������� � ∆���� � ���������� � ����
� ���������� � ∆���� � ���������� � ��� � ���������
� ∆��� � ��������� � ���� � ���������� � ∆���� � ��
��� � � � ����� ���!"�# �$ ′�%&��⁄
� ���� � ( � ) ��* + ,���� – .�$� �� / ��01
� ���� � � ) ��* + 2� �#

13
(4)
Because of sample limitations we define SPREAD_POS (SPREAD_NEG) equal to one if
RNOA is greater (less) than the cost of debt and zero if the cost of debt is missing because the firm
has no debt and/or interest expense. All other variables are previously defined.
Matching Procedure
Our research question involves examining the performance of public and private firms
relative to one another. As documented by prior research, public companies are substantially
larger than private companies. Using a sample of private and public firms, Asker et al. (2010)
provide evidence that the median public firm has total assets of $246.2 million, compared to $1.3
million for private firms. To ensure that our results are not driven by size we use a matched dataset
designed to identify large private companies and small public companies. Specifically, we match
public and private firm-years based on fiscal year, firm industry, net operating assets, return on net
operating assets, and whether the firm reported a loss. Consistent with Asker et al. (2010), our
matching procedure is a variant of nearest-neighbor matching used in the program evaluation
literature (Imbens and Wooldridge 2009).
Starting in 2001, for each private firm, we identify a public firm in the same four-digit
NAICS industry (equivalent to three-digit SIC), same fiscal year, closest in terms of net operating
assets (NOA), such that max(NOApublic, NOAprivate) / min(NOApublic, NOAprivate) < 2,
closest in terms of return on net operating assets (RNOA), such that max(RNOApublic,
RNOAprivate) / min(RNOApublic, RNOAprivate) < 2, and whether the private and public firms
������ � #� � #�������� � #������ � #����� � #� ����/_�� �� # ����/_��4� � #���� � ����/_�� � � #�����
� ����/_��4� � #�������� � ����� � # ������� � ����
� #��������� � ����/_�� � � #���������
� ����/_��4� � #��������� � ���� � ����/_�� �� #��������� � ���� � ����/_��4� � ��

14
are loss firms (pre-tax net income <0). If no match can be found in a given fiscal year, the private
observation is discarded and a new match is attempted for that firm in the following year. Once a
match is formed, it is kept intact for as long as both the public and private firms remain in our
sample. For new firms added after 2001 we follow the same approach in each year they have data.
III. DATA SOURCES, SAMPLE SELECTION, AND DESCRIPTIVE STATISTICS
Data Sources and Sample Selection
Our database combines data on private companies obtained from Sageworks Inc., a firm
that collects private firm data and develops financial analysis tools, with public companies
obtained from Compustat. The Sageworks database was designed to assist accounting firms and
banks performing analytical procedures and ratio analyses on private clients for benchmarking
purposes. In order to conduct such analyses, Sageworks’ users input their clients’ financial
statement information into the Sageworks’ system which then becomes part of the collective
database used in our study. As a result, Sageworks obtains financial statement information directly
from the private companies’ auditors or banks and not from the private firms themselves.
Sageworks is similar to Compustat in that it contains accounting data from the income statement
and balance sheet. In addition to financial information, the private firm’s four digit NAICS
industry code, legal form (S-Corp, C-Corp, partnership, limited liability), fiscal year end, state, and
type of audit report (e.g., compilation, review, tax return, or audit) are also available. The auditors
that utilize Sageworks’ software include most national mid-market accounting firms as well as
hundreds of regional audit firms. Unlike Compustat, Sageworks exclusively covers private firms
and all data are held anonymously so that no individual firm can be identified. Firms leave the
Sageworks database due to mortality or switching to an auditing firm that does not utilize the

15
Sageworks software. Sageworks has a dedicated staff of accounting and programming specialists
who review, examine, and monitor the data on a continuous basis.
To construct our sample of private companies, we follow a similar process as Minnis
(2011) and exclude from the Sageworks database all non-U.S. based companies as well as
observations with data quality issues. Specifically, we delete all firm-years that fail to satisfy basic
accounting identities as well as when net income (NI), cash flow from operations (CFO), accruals
(ACC), or property, plant and equipment (PPE) are greater than total assets at year-end. We also
require firms have assets and sales greater than $100,000 and must be of legal form C-Corp to
ensure comparability to public firms. To be part of the sample of public firms, a firm must have
non-missing amounts of assets, sales, and net income from Compustat during our sample period,
be incorporated in the U.S. and have equity that is publicly traded.
Consistent with prior literature, we exclude from both the public and private samples
financial firms (NAICS 52) and regulated utilities (NAICS 22). Both the public-firm and private-
firm samples cover the period from 2001 (the beginning of the Sageworks database) through 2010,
giving us a ten-year panel of data. After requiring lagged data to calculate changes, current data
for examination, future data of at least one year, and requiring a public match as described above
we are left with 642 unique private firms in the sample. We match these private firms with their
nearest neighbor public firm allowing public firms to serve as a neighbor for more than one private
firm if necessary. The final sample contains 1,196 private firm-years and an equal number of
public firm-years.
Descriptive Statistics
The descriptive statistics in Table 1 are reported so as to ensure that our matching
procedure worked as planned. Our matching procedure appears to have effectively held constant

16
firms’ current profitability and size between public and private firms within the same industry, in
the same year, and either reporting profit or loss in the matching year. Specifically, we observe no
statistical differences in the mean or median RNOA, ASSETS, NOA, or LOSS variables between
public and private firms for our sample. However, we do observe that these firms are different in
other aspects of financial performance and financial structure in the matching year. Public firm
mean profitability measured in terms of total assets (ROA) is lower than private firm profitability
on total assets, but that difference is not significant in terms of the median ROA. Furthermore, we
observe in Table 1 that the mean levels of PM and ROE (ATO) are statistically significantly higher
(lower) for private companies in the year of the match.
[Insert Table 1 Here]
Also in Table 1 we observe that private companies have more sales and have less debt than
public companies. Consistent with our expectations as well as the prior literature (e.g., Pagano et
al. 1998), we also find an economically and statistically significant difference in the cost of debt
(COD) between public and private firms. Specifically, we find that on average publicly traded
firms are charged approximately 400 basis points less than private firms for their debt and appear
to benefit from the greater access to capital, improved reputation, and required disclosures about
the company as expected. However, as noted in our hypothesis development, Table 1 reports that
the proportion of debt used in the capital structure of these public companies is relatively small
with the mean (median) long-term debt to average total assets of 7.7 (0.3) percent.
Panel A of Table 2 reports descriptive statistics for all firm years of our sample, as opposed
to only the descriptive statistics of the initial matching sample year (Table 1). Specifically, Table
2 Panel A reports the descriptive statistics for the sample of private and public firms for all years
they are in the sample. From Panel A of Table 2 we observe that private firms are more profitable

17
than public firms on average, but this does not address potential future profitability differences in
the firms. This result is similar to Asker et al (2010) who report a statistically significant
difference in ROA between their sample of private firms and matched public firms also using the
Sageworks database. However, Asker et al. (2010) do not look at future profitability of these firms
or match on profitability characteristics. Rather, for their tests involving investment behavior of
public and private firms, they attempt to control for these profitability differences. Our research
question addresses whether the differences between public and private firms observed in Panel A
of Table 2 and Table 1 of Asker et al (2010) are persistent over time.
In Table 2, Panel A we observe that future profitability, measured as RNOAt+1, RNOAt+3,
and RNOAt+5 are all significantly greater for private firms than for the matched public firms in our
sample. This leads to preliminary univariate support for our first hypothesis. Additionally, it
appears that the magnitude of the difference between samples is monotonically increasing in both
means and medians as time passes from the current year to five years out.
[Insert Table 2 Here]
Figure 1 plots the median levels of RNOA over time for our matched firms. It shows that
the monotonic increases observed in the difference between public and private firms from Panel A
of Table 2 are a function of increasing profitability for the private firms and/or decreasing
profitability for the matched public firms in our sample. We observe the same pattern if we plot
mean levels of RNOA over time for our matched firms.
[Insert Figure 1 Here]
Panel A of Table 2 also provides further evidence for the expected difference in cost of
debt between public and private firms. We find that there are significant differences in the cost of
debt between our matched sample of public and private firms, not just in the matching year. Public

18
firms have significantly lower cost of debt and it appears that private firms pay a 65 (91) percent
higher mean (median) premium than that of public firms for the debt in their capital structure.
Examining the descriptive statistics on net income (NI) reported in Panel A of Table 2 we
note that for our sample of matched firms there is no statistically significant difference in reported
net income or the standard deviation of net income between public and private firms.
There is an increasingly large literature discussing the pressures of managers of public
corporations to report smooth and predictable earnings (Bartov 1993; DeAngelo et al. 1996; Barth
et al. 1999; Beatty et al. 2002; Graham et al. 2005; Petrovits 2006; Allee et al. 2011). In a survey
of more than 400 executives, Graham et al. (2005) report, “[p]redictability of earnings is an over-
arching concern among CFOs” and the “executives believe that less predictable
earnings…command a risk premium in the market.” We cannot generalize beyond our sample, but
it appears that any profitability differences we observe in this paper are not likely due to
differential pressure for predictably increasing earnings between public and private firms.
Panels B and C of Table 2 report the Pearson correlations (above the diagonal) and
Spearman correlations (below the diagonal) for the private and public firms in our sample,
respectively. We see strong correlations between RNOA and its components ATO and PM, as
well as RNOA and other profitability metrics such as ROA and ROE. We also observe strong
correlations in the changes of RNOA and the changes in its components. There are few
differences in the correlations of the variables between public and private firms (i.e., comparisons
of the magnitudes and directions of the correlations between panels B and C of Table 2), except for
the relation between current RNOA and future RNOA and the change in NOA (∆NOA) and
RNOAt+3 and RNOAt+5. It is apparent that current RNOA is much more highly correlated with
future RNOA for private firms than public firms, consistent with our first hypothesis. Also, it

19
appears that ∆NOA has differential effects on future profitability for public and private firms,
consistent with profitability differences between the types of firms deriving from operating assets.
IV. EMPIRICAL RESULTS
Tables 3, 4, and 5 report the main results in this study regarding the differences in future
profitability between our two samples. Panel A of Table 3 reports the results of equation (1) to test
our first hypothesis on a multivariate basis. The results are consistent with our first hypothesis,
both in the full regression and in the simplified regression (including only our PRIVATE firm
variable, current RNOA, and the interaction term between the two variables). In both cases
PRIVATE is positive and statistically significant for RNOAt+1, RNOAt+3, and RNOAt+5.5 The
statistical significance decreases as we get further into the future, going from a one sided p-value
of less than 0.025 for PRIVATE on RNOAt+1 to 0.04 for PRIVATE on RNOAt+5. However, we
note that the sample size decreases across the horizons from 2,392 firm years for RNOAt+1, to only
202 firm years for RNOAt+5. The decreased statistical power is likely the cause of the lower
significance. Not surprisingly, current RNOA is an important predictor of future RNOA for all
future years examined suggesting persistence in RNOA for both public and private firms.
However, we do not find differential persistence of RNOA between the two types of firms as the
coefficient on PRIVATE*RNOA is not significant in most specifications. Interestingly, no other
variable in our model is consistent in predicting future profitability of public or private firms. This
suggests that, for our sample of firms, using the components of RNOA or their changes appears to
be uninformative in the prediction of future firm RNOA, dissimilar to the literature on predicting
public firm profitability (Fairfield and Yohn 2001). However, given that the prior results were
5 We test for statistical significance of the parameter estimates by using heteroskedasticity robust standard errors, in regressions with errors clustered by private firm and year. As the public firms in our sample can be used multiple times in the analysis, we also ran the regressions clustering by public firm and year and observe statistically similar results.

20
observed on larger public companies with more established production practices, this result is not
necessarily inconsistent with those results.
[Insert Table 3 Here]
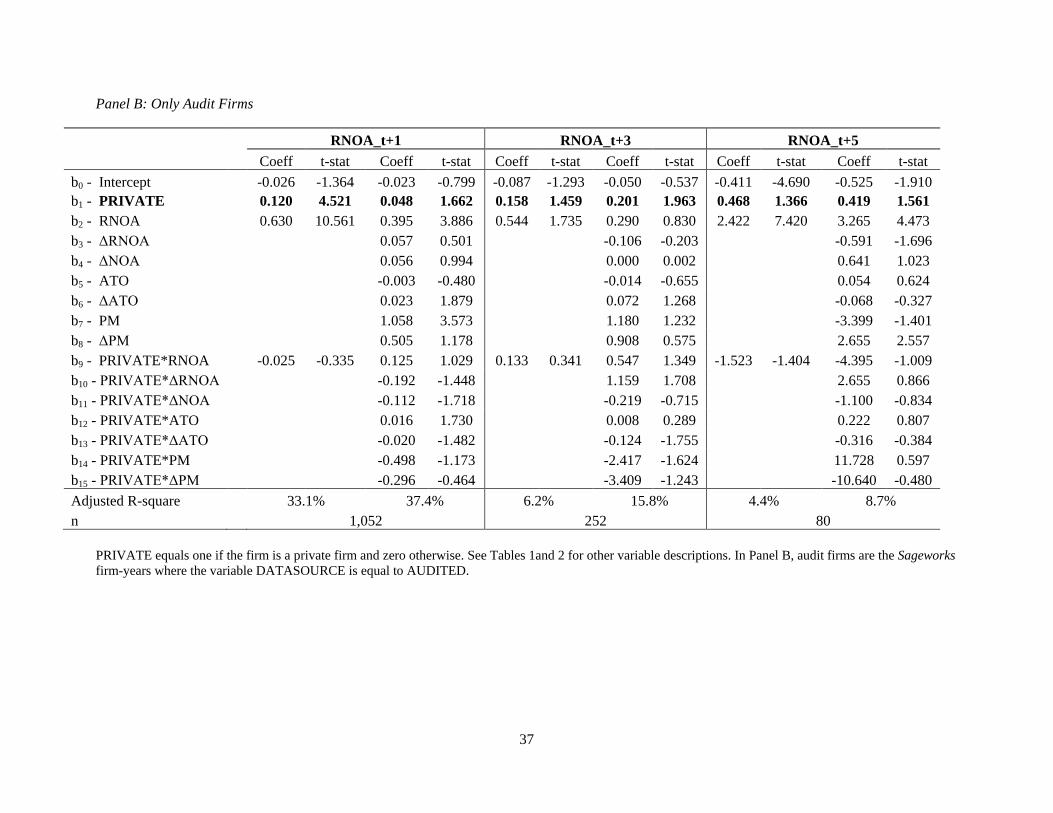
In Panel B of Table 3 we run equation (1) on our sample of firms, but we limit the analysis
to only private firms with audited financial statements and their matched public firms who
naturally have audited financial statements due to regulatory requirements. In Panel B of Table 3
we find similar results to Panel A of Table 3, but it appears that the requirement to have audited
financial statements does attenuate the statistical significance of the future profitability differences
between public and private firms, though the coefficients remain similar in size or are somewhat
larger. We find a one sided p-value of 0.053 for PRIVATE on RNOAt+1 and 0.06 for PRIVATE
on RNOAt+5 when the sample is limited to firms with audited financial statements.
It is difficult to determine whether this attenuation in the statistical significance of our
results is due to the decrease in sample size or to a decrease in the future profitability effect
observed in Panel A of Table 3. A decrease in the future profitability effect is consistent with the
observation by CFOs surveyed in Brau and Fawcett (2006) that expenses associated with securities
exchange listing requirements, SEC rules and regulations, and accounting requirements, estimated
at over a million dollars annually, can severely hinder future profitability of public companies
(Hartman 2006). It is also consistent with the literature on firms “going private.” Specifically,
Block (2004) surveys 110 managers from a sample of 236 firms that went private between 2001
and 2003 and finds that the cost of being public is the number one reason for going private by
smaller firms. This relates directly to the passage of the Sarbanes-Oxley Act in 2002. Therefore,
requiring the private firms to have an audit appears to “level the playing field” a bit, but there are
still future profitability differences between public and private firms in our sample.

21
Examining Table 2 we can see mean differences in the profit margin and asset turnover
components of RNOA for public and private firms. In H2 we argue that public ownership leads to
greater competition in high margin products through increased exposure via public disclosure
requirements, which will eventually lead to lower corporate margins for public companies.
Although it is plausible that asset turnover could differ between public and private companies, we
do not think that this is likely. Therefore, we do not hypothesize differences in asset turnover
between public and private firms but do expect a difference in profit margin between our sample
firms. Figure 2 plots the median levels of PM and ATO over time for our matched public and
private firms. We can see from these graphs that there appears to be a difference in PM for private
firms relative to public firms, but that there does not appear to be consistent differences in ATO
between the two samples.
[Insert Figure 2 Here]
Panels A and B in Table 4 examine profit margin (PM) and asset turnover (ATO),
respectively. The results from the simple model and full model correspond with our hypothesis
that public firms have lower profit margins in the future relative to private firms. We observe
that, much like future RNOA results, future profit margins are difficult to predict and only current
profit margin and RNOA are helpful in consistently predicting future PM. Panel B reports the
results of the regression on equation (1) with future asset turnover, ATOt+1, ATOt+3, and ATOt+5,
as the profitability metric of interest. Consistent with our discussion, we find that private firms do
not differ consistently relative to public firms in terms of future asset turnover. Current ATO
appears to be the only variable that is consistently predictive of future ATO, suggesting the relative
importance of persistence in operating efficiencies.
[Insert Table 4 Here]

22
To more fully examine the relative future costs and benefits associated with organizational
form we also look at future profitability for public and private firms in our sample in terms of
ROEt+1, ROEt+3, and ROEt+5. This allows for a test of our last hypothesis on the differential future
profitability of public and private firms including financing costs. Figure 3 plots the median levels
of ROE over time for our matched public and private firms. The plots reveal that while both firms
seem to be exhibiting decreasing returns to equity over time, the public sample is decreasing at a
greater rate than the private firms in our sample. This suggests that private firms may be more
profitable than public firms even after factoring the beneficial costs of financing for public firms
relative to private firms.
[Insert Figure 3 Here]
We test H3 by estimating equations (2) and (4) on our sample of matched firms in Table 5.
Table 5, Panel A reports the results from the regression on future ROE specified in equation (2).
We observe that private firms appear to still have higher future profitability, when future
profitability is measured as ROEt+1, ROEt+3, and ROEt+5, even after controlling for the effects of
leverage on the firms. The result in the fifth year out is somewhat attenuated relative to the results
on RNOA reported in Table 3; however, it is still significant with a one-sided p-value of 0.076 on
only 202 observations. This is relatively persuasive support for our third hypothesis that, for
private and public companies matched yearly on industry, size and current profitability, the future
return on equity is higher for private companies relative to public companies. As in prior
regressions, predicting future ROE using current profitability and its components is difficult. None
of the other variables in the regression appear to consistently aid in prediction, including current
ROE.
[Insert Table 5 Here]

23
Panel B of Table 5 reports results consistent with and somewhat stronger than the results
observed in Panel A of Table 5. After decomposing ROE into its RNOA, LEV, and SPREAD
components, we find that private firm future profitability is greater than public firm future
profitability and for ROEt+5 this result is significant at a one sided p-value of 0.061. We also find
that positive spread is a significant predictor of future profitability and that this effect is even
somewhat greater for private firms than for public firms. We know of no theory that would
suggest that a positive spread is more beneficial to the future profitability of a private firm than a
public firm, but find it motivating that a careful decomposition of ROE into its components
consistent with theory can aid in this type of analysis. Note that for ROEt+5 the decreasing sample
size left us with a sample of firms reporting no negative spreads and no private firms with positive
spreads and leverage; hence, we cannot estimate all variables and their interactions in model (5)
for ROEt+5.
V. CONCLUSION
In this paper we examine the relative future performance of a sample of private and public
companies matched each year on industry, size and current profitability. We hypothesize and find
that private firms are more profitable in the future than public firms. We also hypothesize that this
difference is likely due to differences in the profit margin of the firms and not the asset turnover
component of their return on net operating assets. We acknowledge that there are financing
benefits for being a public company. We find that there is a significant difference in the cost of
debt between public and private companies likely due to the disclosure, audit, and regulatory
requirements of the SEC. However, since public firms have access to public equity, they are less
likely to finance their operations through debt. Thus, while there is a benefit associated with being

24
public, on the margin, we hypothesize and find that it only slightly attenuates the effects we
observed in examining return on net operating assets.
There are several limitations to our study that we acknowledge. First, due to sample size
and time-series data limitations our ability to test future profitability is potentially limited.
However, existing studies (e.g., Sloan 1996; Fairfield et al. 2003) use windows as short as one year
ahead when examining future profitability and therefore our horizon is not inconsistent with, and
some cases longer than, that used in prior research. Additionally, our results are generalizable only
to the extent that the private firms in our sample and their corresponding public matches are
representative of private and public companies in general. The Sageworks database is populated
by firms that come in contact with auditors and bankers that take the extra time to benchmark their
clients’ ratios and financial data against what they must believe to be a useful and archetypical
sample of firms. However, this process potentially leads to particular types of firms being
included in the Sageworks sample. However, this concern should be alleviated due to our
matching on the same industry. Finally, the variables available to us to examine ownership
structure, instead of public versus private ownership in general, are restricted and limit our ability
to identify the specific mechanisms resulting in the observed differences.
Our results provide evidence on the overall effect of public versus private ownership on
corporate future profitability and provide empirical evidence helpful to managers, lenders, and
equity fund managers, both public and private, in terms of the future costs and benefits associated
with ownership differences. Our results are also indicative of differences in future profitability
between private and public firms deriving from the costs associated with being a public firm and
not necessarily from the financial reporting pressures of reporting consistently increasing earnings
as many researchers and practitioners have suggested. Future research may wish to examine a

25
specific sample of public firms with these incentives and try to match on private firms to observe
differences in financial reporting behavior and future profitability.

26
References
Allee, K.D., S.J.W. Hamm, and D.D. Wangerin. 2011. Have Accounting Standards Affected M&A Deal Structure? Evidence from Earnouts Working paper – Michigan State and Ohio State Universities.
Ang, J., R. Cole and J. Lin. 2000. Agency Costs and Ownership Structure. The Journal of Finance 55: 81-106.
Asker, J., J. Farre-Mensa and A. Ljungqvist. 2010. Does the Stock Market Harm Investment Incentives? Working paper – New York University.
Badertscher, B., B. Jorgensen, S. Katz, and W. Kinney. 2011. Litigation Risk and Audit Fees: The Role of Public Equity. Working paper.
Barth, M. E., J. A. Elliott, and M. W. Finn. 1999. Market rewards associated with patterns of increasing earnings. Journal of Accounting Research 37 (2):387-413.
Bartov, E. 1993. The Timing of Asset Sales and Earnings Manipulation. Accounting Review 68 (4):840-855.
Beatty, A. L., B. Ke, and K. R. Petroni. 2002. Earnings management to avoid earnings declines across publicly and privately held banks. The Accounting Review 77 (3):547-570.
Berle, A. and G. Means. 1932. The Modern Corporation and Private Property. Chicago: Commerce Clearing House.
Berman, D. 2011. Going on Safari with Warren Buffett. The Wall Street Journal. March 1, 2011.
Block, S.B. 2004. The Latest Movement to Going Private: An Empirical Study. Journal of Applied Finance Vol. 14, No. 1
Brau, J. C., and S. E. Fawcett. 2006. Initial public offerings: An analysis of theory and practice. Journal of Finance 61 (1):399-436.
Coles, J. L., M. Lemmon, and L. Naveen. 2003. A Comparison of Profitability and CEO Turnover Sensitivity In Large Private and Public Firms. Working Paper - Arizona State University.
DeAngelo, H., L. DeAngelo, and D. J. Skinner. 1996. Reversal of fortune - Dividend signaling and the disappearance of sustained earnings growth. Journal of Financial Economics 40 (3):341-371.
DeGeorge, F. and R. Zeckhauser. 1993. The Reverse LBO Decision and Firm Performance: Theory and Evidence. The Journal of Finance 48: 1323-1348.
Demsetz, H. and K. Lehn. 1985. The Structure of Corporate Ownership: Causes and Consequences. Journal of Political Economy 93: 1155-1177.

27
Demsetz, H. and B. Villalonga. 2001. Ownership Structure and Corporate Performance. Journal of Corporate Finance 7: 209-233.
Denis, D. and Denis, D. 1994. Majority Owner-managers and Organizational Efficiency. Journal of Corporate Finance 1: 91-118.
Fairfield, P.M., T.L. Yohn. 2001. Using Asset Turnover and Profit Margin to Forecast Changes in Profitability. Review of Accounting Studies 6:371-385
Fairfield, P. M., S. Ramnath, and T. L. Yohn. 2009. Do Industry-Level Analyses Improve Forecasts of Financial Performance? Journal of Accounting Research 47 (1):147-178.
Fairfield, P. M., R. J. Sweeney, and T. L. Yohn. 1996. Accounting classification and the predictive content of earnings. Accounting Review 71 (3):337-355.
Fairfield, P. M., J.S. Whisenant, and T. L. Yohn. 2003. Accrued Earnings and Growth: Implications for Future Profitability and Market Mispricing. The Accounting Review 78 (1):353-371.
Fama, E. F., and K. R. French. 2000. Forecasting profitability and earnings. Journal of Business 73 (2):161-175.
Freeman, R. N., J. A. Ohlson, and S. H. Penman. 1982. Book Rate-of-Return and Prediction of Earnings Changes - an Empirical-Investigation. Journal of Accounting Research 20 (2):639-653.
Google. 2004. S-1 Registration Statement. Mountain View, CA: Google 2004.
Graham, J. R., C. R. Harvey, and S. Rajgopal. 2005. The economic implications of corporate financial reporting. Journal of Accounting & Economics 40 (1-3):3-73.
Hartman, T. E. 2006. The Cost of Being Public in the Era of Sarbanes-Oxley: Foley & Lardner LLP.
Holderness, C. and D. Sheehan. 1988. The Role of Majority Shareholders in Publicly Held Corporations. Journal of Financial Economics 20: 317-346.
Himmelberg, C., G. Hubbard, and D. Palia. 1999. Understanding the Determinants of Managerial Ownership and the Link between Ownership and Performance. Journal of Financial Economics 53: 353-384.
Hough, J. 2011. What Buffett's Letter Didn't Say. www.smartmoney.com. March 1, 2011.
Imbens, G. and J. Wooldridge. 2009. Recent developments in the econometrics of program evaluation, Journal of Economic Literature 47, 5-86.
Jain, B. and O. Kini. 1994. The Post-Issue Operating Performance of IPO Firms. The Journal of
Finance 49: 1699-1726.

28
Ke, B., K. Petroni, and A. Safieddine. 1999. Ownership concentration and sensitivity of executive pay to accounting performance measures: Evidence from publicly and privately-held insurance companies. Journal of Accounting & Economics 28 (2):185-209.
Minnis, M. 2011. The Value of Financial Statement Verification in Debt Financing: Evidence from Private U.S. Firms. Journal of Accounting Research 49 (2): 457-506.
Mikkelson, W., M. Partch and K. Shah. 1997. Ownership and Operating Performance of Companies that Go Public. The Journal of Financial Economics 44: 281-307.
Myers, S. and N. Majluf. 1984. Corporate Financing and Investment Decisions when Firms have Information that Investors Do Not Have. Journal of Financial Economics 13: 187-221.
Nissim, D., and S. H. Penman. 2001. Ratio Analysis and Equity Valuation: From Research to Practice. Review of Accounting Studies 6 (1):109-154.
Pagano, M., F. Panetta, and L. Zingales. 1998. Why do companies go public? An empirical analysis. Journal of Finance 53 (1):27-64.
Pagano, M. and A. Roell. 1998. The Choice of Stock Ownership Structure: Agency Costs, Monitoring and the Decision to Go Public. The Quarterly Journal of Economics 187-225.
Petrovits, C. M. 2006. Corporate-sponsored foundations and earnings management. Journal of Accounting & Economics 41 (3):335-362.
Renneboog, L., T. Simons, and M. Wright. 2007. Why do public firms go private in the UK? The impact of private equity investors, incentive realignment and undervaluation. Journal of Corporate Finance 13 (4):591-628.
Shlaes, A. 2007. Blackstone Prepares IPO As Koch Backs Other Model. In Op-Ed - Council on Foreign Relations: CFR.org.
Sloan, R.G. 1996. Do Stock Prices Fully Reflect Information in Accruals and Cash Flows about Future Earnings? The Accounting Review Vol. 71 (3):289-315.
Stein, J. C. 1988. Takeover Threats and Managerial Myopia. The Journal of Political Economy 96 (1):61-80.
———. 1989. Efficient Capital Markets, Inefficient Firms: A Model of Myopic Corporate Behavior. The Quarterly Journal of Economics 104 (4):655-669.
Wahlen, J.M., S.P. Baginski, and M.T. Bradshaw. 2011. Financial Reporting, Financial Statement Analysis, and Valuation: A Strategic Perspective: South-Western Cengage Learning.

29
FIGURE 1 Median Return on Net Operating Assets for Public and Private Firms
Return on Net Operating Assets (RNOA) equals operating income divided by average net operating assets. Operating income equals sales (Compustat SALE, Sageworks SALES) minus cost of goods sold (COGS plus XSGA, COSTOFSALES plus OVERHEAD) minus depreciation and amortization (DP, DEPRECIATION plus AMORTIZATION). Net operating assets equals stockholders’ equity (SEQ, TOTALEQUITY) minus cash and short term investments (CHE, CASH) plus interest (XINT, INTEREST) plus debt in current liabilities (DLC, SHORTTERMDEBT plus CURRENTLONGTERMDEBT) plus long-term debt (DLTT, SENIORDEBT plus SUBORDINATEDDEBT).
0.00
0.10
0.20
0.30
0.40
0.50
t t+1 t+2 t+3 t+4 t+5
PUBLIC PRIVATE

30
FIGURE 2 Profit Margin and Asset Turnover for Public and Private Firms
Panel A: Profit Margin
Panel B: Asset Turnover
Profit Margin (PM) equals operating income divided by sales. Asset Turnover (ATO) equals sales divided by net operating assets.
0.00
0.02
0.04
0.06
0.08
0.10
0.12
t t+1 t+2 t+3 t+4 t+5
PUBLIC PRIVATE
0.00
1.00
2.00
3.00
4.00
5.00
6.00
7.00
t t+1 t+2 t+3 t+4 t+5
PUBLIC PRIVATE

31
FIGURE 3 Return on Equity for Public and Private Firms
Return on Equity (ROE) equals net income (NI, NETINCOME) divided by stockholders’ equity.
-0.10
-0.05
0.00
0.05
0.10
0.15
0.20
t t+1 t+2 t+3 t+4 t+5
PUBLIC PRIVATE

32
TABLE 1
Descriptive Statistics for Public and Private Firms based on the First Matched Year
Private Public Difference
Variable mean std q1 med q3 n
mean std q1 med q3 n
Mean Median
RNOA 0.326 0.368 0.136 0.257 0.475 642
0.311 0.356 0.142 0.255 0.433 642
0.015 0.002
ROA 0.129 0.126 0.058 0.105 0.192 642
0.100 0.109 0.048 0.101 0.156 642
0.029 *** 0.004
ATO 5.466 4.005 2.611 4.234 7.034 642
6.065 5.634 2.322 4.075 7.171 642
-0.599 ** 0.159
PM 0.069 0.074 0.028 0.054 0.098 642 0.059 0.083 0.029 0.056 0.093 642 0.010 ** -0.003
ROE 0.133 0.163 0.056 0.129 0.224 642
0.124 0.204 0.064 0.127 0.209 602
0.009 ** 0.002
SALES 2.255 1.076 1.462 2.081 2.888 642
1.966 0.926 1.219 1.935 2.587 642
0.289 *** 0.145 **
ASSETS 175.37 1809.00 4.12 9.07 20.68 642
131.05 1232.76 6.48 12.69 34.71 642
44.32 -3.62
NOA 8.434 11.500 1.545 3.547 8.775 642
11.955 18.773 2.150 4.521 11.799 642
-3.52 -0.97
NI 0.082 0.093 0.027 0.072 0.135 642
0.081 0.125 0.034 0.077 0.133 642
0.002 -0.005
LEV 0.018 0.044 0.000 0.000 0.000 642
0.077 0.126 0.000 0.003 0.106 642
-0.058 *** -0.003
COD 0.110 0.065 0.050 0.097 0.180 227
0.068 0.046 0.039 0.052 0.080 436
0.042 *** 0.045 ***
LOSS 0.131 0.337 0.000 0.000 0.000 642 0.131 0.337 0.000 0.000 0.000 642 0.000 0.000
RNOA equals operating income divided by average net operating assets. Operating income equals sales (Compustat SALE, Sageworks SALES) minus cost of goods sold (COGS
plus XSGA, COSTOFSALES plus OVERHEAD) minus depreciation and amortization (DP, DEPRECIATION plus AMORTIZATION). Net operating assets equals stockholders’
equity (SEQ, TOTALEQUITY) minus cash and short term investments (CHE, CASH) plus interest (XINT, INTEREST) plus debt in current liabilities (DLC, SHORTTERMDEBT
plus CURRENTLONGTERMDEBT) plus long-term debt (DLTT, SENIORDEBT plus SUBORDINATEDDEBT). ROA equals operating income divided by average total assets
(AT, TOTALASSETS). ATO equals sales divided by net operating assets. PM equals operating income divided by sales. ROE equals net income (NI, NETINCOME) divided by
stockholders’ equity. SALES equals total sales (SALE, SALES) divided by average total assets. ASSETS equals total assets (AT, TOTALASSETS). NOA equals stockholders’
equity (SEQ, TOTALEQUITY) minus cash and short term investments (CHE, CASH) minus interest (XINT, INTEREST) minus debt in current liabilities (DLC,
SHORTTERMDEBT plus CURRENTLONGTERMDEBT) minus long-term debt (DLTT, SENIORDEBT plus SUBORDINATEDDEBT). NI equals net income (NI,
NETINCOME) divided by average total assets. CFO equals cash flow from operations (OANCF, NETINCOME minus ACC) divided by average total assets. ACC is net income
(NI, NETINCOME) minus cash flow from operations (OANCF) divided by average total assets. For the Sageworks data we used the change in the balance sheet to calculate
accruals. Specifically, accruals equals the change in current assets (TOTALCURRENTASSETS) minus change in current liabilities (TOTALCURRENTLIABILITIES) minus
change in cash (CASH) plus change in short-term debt (SHORTTERMDEBT) plus change in long-term debt (LONGTERMDEBT) minus depreciation (DEPRECIATION) and
amortization (AMORTIZATION)). LEV is total long-term debt (DLTT, SENIORDEBT plus SUBORDINATEDDEBT) divided by average total assets. COD is the after-tax cost of
debt calculated as interest expense (XINT, INTEREST) times 0.65 divided by long-term debt. LOSS is equal to one if net income is less than zero and zero otherwise. All
continuous variables are winsorized at 1st and 99th percentile.

33
TABLE 2
Descriptive Statistics and Correlations for Public and Private Firms Panel A: Descriptive Statistics for Public and Private Firms for All Firm-Years
Private Public Difference
Variable mean std q1 med q3 n
mean std q1 med q3 n
Mean Median
RNOA 0.322 0.367 0.115 0.244 0.455 1,196
0.264 0.347 0.102 0.226 0.365 1,196
0.058 *** 0.018 *
RNOA_t+1 0.287 0.397 0.063 0.205 0.428 1,196
0.170 0.384 -0.022 0.171 0.356 1,196
0.118 *** 0.034 *
RNOA_t+3 0.292 0.543 0.073 0.229 0.411 260
0.121 0.457 -0.029 0.140 0.339 260
0.171 *** 0.090 **
RNOA_t+5 0.386 0.562 0.067 0.221 0.480 101
0.131 0.355 -0.016 0.087 0.357 101
0.255 ** 0.133 *
ΔRNOA -0.041 0.331 -0.164 -0.023 0.093 1,196
0.029 0.354 -0.139 0.019 0.161 1,196
-0.071 *** -0.042 ***
ROA 0.124 0.126 0.052 0.100 0.189 1,196
0.090 0.111 0.036 0.093 0.149 1,196
0.034 *** 0.007
ΔROA -0.008 0.094 -0.056 -0.007 0.037 1,196
0.007 0.112 -0.056 -0.002 0.051 1,196
-0.015 *** -0.005 *
ΔNOA 0.146 0.407 -0.080 0.074 0.255 1,196
0.201 0.576 -0.130 0.055 0.367 1,196
-0.055 *** 0.019
ATO 5.341 4.013 2.422 4.070 6.913 1,196
5.426 5.183 2.071 3.548 6.398 1,196
-0.085 0.522
ΔATO -0.380 2.770 -0.946 -0.125 0.497 1,196
-0.142 3.539 -0.679 0.000 0.721 1,196
-0.238 * -0.126 *
PM 0.069 0.076 0.025 0.053 0.102 1,196
0.051 0.083 0.022 0.055 0.088 1,196
0.018 *** -0.002
ΔPM -0.003 0.047 -0.025 -0.001 0.020 1,196
0.006 0.065 -0.020 0.002 0.036 1,196
-0.009 *** -0.003
ROE 0.118 0.157 0.041 0.112 0.201 1,196 0.096 0.217 0.050 0.113 0.192 1,196 0.021 *** -0.001
SALES 2.194 1.064 1.377 2.012 2.760 1,196
1.929 0.905 1.202 1.890 2.520 1,196
0.265 *** 0.122 *
ASSETS 120.9 1385.9 4.5 9.4 20.4 1,196
105.6 974.1 7.3 13.4 33.8 1,196
15.35 -3.99
NOA 8.2 10.9 1.8 3.7 9.1 1,196
13.1 19.3 2.4 5.2 13.9 1,196
-4.89 *** -1.51 *
NI 0.075 0.092 0.022 0.064 0.126 1,196
0.069 0.129 0.021 0.069 0.123 1,196
0.006 -0.005
EPS
0.233 0.425 0.010 0.100 0.350 1,196
NA NA
LEV 0.018 0.044 0.000 0.000 0.000 1,196
0.079 0.127 0.000 0.003 0.115 1,196
-0.061 *** -0.003
COD 0.106 0.065 0.046 0.094 0.180 432
0.064 0.042 0.039 0.049 0.074 801
0.042 *** 0.044 ***
LOSS 0.147 0.354 0.000 0.000 0.000 1,196 0.182 0.386 0.000 0.000 0.000 1,196 -0.035 ** 0.000

34
Panel B: Pearson (above the diagonal) and Spearman (below the diagonal) Correlations for Public Firms
1 2 3 4 5 6 7 8 9 10 11 12 13
RNOA (1) 0.539 0.307 0.484 0.486 0.700 0.314 0.132 0.333 -0.027 0.656 0.352 0.618
RNOA_t+1 (2) 0.548 0.209 0.577 0.347 0.488 0.245 0.005 0.230 0.079 0.444 0.257 0.367
RNOA_t+3 (3) 0.462 0.530 0.325 0.028 0.278 0.065 -0.141 0.030 0.113 0.246 0.078 0.306
RNOA_t+5 (4) 0.646 0.635 0.478 0.024 0.374 0.132 0.514 -0.046 -0.523 0.156 0.105 0.148
ΔRNOA (5) 0.426 0.287 0.210 0.106 0.327 0.690 -0.070 0.215 0.205 0.297 0.642 0.345
ROA (6) 0.703 0.455 0.374 0.420 0.351 0.415 0.090 -0.033 -0.005 0.879 0.411 0.754
ΔROA (7) 0.320 0.206 0.133 0.127 0.787 0.386 0.022 0.096 0.109 0.321 0.905 0.425
ΔNOA (8) 0.087 -0.055 -0.239 0.228 -0.117 0.166 0.021 -0.119 -0.683 0.092 0.047 0.257
ATO (9) 0.416 0.301 0.237 0.262 0.193 0.041 0.131 -0.228 0.211 -0.104 0.095 0.028
ΔATO (10) 0.069 0.141 0.248 -0.215 0.359 0.054 0.222 -0.711 0.227 -0.008 0.084 -0.116
PM (11) 0.636 0.385 0.237 0.037 0.320 0.856 0.326 0.163 -0.176 0.051 0.370 0.662
ΔPM (12) 0.353 0.217 0.095 0.066 0.754 0.384 0.934 0.027 0.120 0.208 0.350 0.423
ROE (13) 0.654 0.337 0.270 -0.043 0.391 0.775 0.433 0.271 0.115 -0.066 0.626 0.441

35
Panel C: Pearson (above the diagonal) and Spearman (below the diagonal) Correlations for Private Firms
1 2 3 4 5 6 7 8 9 10 11 12 13
RNOA (1) 0.575 0.296 0.010 0.212 0.812 0.297 0.217 0.314 -0.077 0.647 0.329 0.572
RNOA_t+1 (2) 0.590 0.225 0.065 0.063 0.508 0.146 0.041 0.238 0.036 0.419 0.172 0.323
RNOA_t+3 (3) 0.342 0.386 0.553 0.222 0.141 0.132 0.141 0.034 -0.277 0.058 0.121 -0.009
RNOA_t+5 (4) -0.080 0.300 0.488 0.059 -0.069 0.064 -0.011 0.156 0.013 -0.091 0.063 0.130
ΔRNOA (5) 0.222 0.084 0.139 0.150 0.169 0.731 -0.039 0.006 0.193 0.154 0.653 0.144
ROA (6) 0.830 0.523 0.158 -0.136 0.186 0.326 0.178 0.073 -0.039 0.816 0.377 0.638
ΔROA (7) 0.288 0.155 0.093 0.210 0.815 0.298 0.115 0.058 0.046 0.262 0.886 0.325
ΔNOA (8) 0.242 0.086 0.117 -0.057 -0.016 0.229 0.113 -0.126 -0.617 0.159 0.133 0.223
ATO (9) 0.319 0.244 0.198 0.236 0.030 0.087 0.086 -0.102 0.230 -0.184 0.066 0.199
ΔATO (10) -0.076 0.035 -0.140 -0.020 0.240 -0.058 0.117 -0.642 0.190 -0.029 -0.011 -0.052
PM (11) 0.714 0.462 0.052 -0.107 0.166 0.863 0.249 0.221 -0.209 -0.070 0.341 0.495
ΔPM (12) 0.336 0.189 0.076 0.282 0.748 0.359 0.904 0.135 0.081 0.037 0.328 0.347
ROE (13) 0.645 0.385 0.114 0.051 0.194 0.684 0.327 0.282 0.215 -0.057 0.541 0.342
In Panel A, ***, **,* denote that the value in the private partition significantly differs from the corresponding value in the public partition at the 1, 5, and 10
percent levels, respectively (two-tailed). In Panels B and C, BOLD denote significantly different from zero at the 5 percent level or better (two-tailed).
RNOA_t+x equals return on net operating assets for year t+x where x is 1, 3 or 5. ΔRNOA is the change in return on net operating assets from year t-1 to t.
ΔNOA equals the change in net operating assets from year t-1 to t. ΔATO is the change in asset turnover from year t-1 to t. ΔPM is the change in profit margin
from year t-1 to year t. All continuous variables are winsorized at 1 and 99. See Table 1 for other variable descriptions.

36
TABLE 3
Regressions of Future Return on Net Operating Assets on an Indicator Variable for Private Firms and Financial Performance
Variables
Panel A: All Firms
RNOA_t+1 RNOA_t+3 RNOA_t+5
Coeff t-stat Coeff t-stat Coeff t-stat Coeff t-stat Coeff t-stat Coeff t-stat
b0 - Intercept
0.012 0.916 -0.025 -1.432 -0.017 -0.309 0.031 0.430 -0.057 -0.621 0.096 0.602
b1 - PRIVATE
0.075 4.026 0.049 2.024 0.136 1.735 0.206 2.024 0.438 2.637 0.240 1.759
b2 - RNOA
0.597 16.580 0.327 4.610 0.533 2.872 0.665 2.518 0.915 2.006 1.242 2.073
b3 - ΔRNOA
0.122 1.866 -0.286 -1.426 0.397 0.879
b4 - ΔNOA
-0.005 -0.169 -0.215 -2.429 0.325 0.762
b5 - ATO
0.009 2.629 -0.008 -0.714 -0.005 -0.180
b6 - ΔATO
0.004 0.644 -0.011 -0.533 -0.013 -0.192
b7 - PM
1.099 4.946 0.181 0.256 -3.395 -1.657
b8 - ΔPM
-0.132 -0.456 0.635 0.820 -0.854 -0.574
b9 - PRIVATE*RNOA
0.025 0.502 0.189 1.949 0.038 0.148 -0.057 -0.172 -0.892 -1.698 -0.956 -0.897
b10 - PRIVATE*ΔRNOA
-0.222 -2.452 0.723 2.329 -0.944 -1.063
b11 - PRIVATE*ΔNOA
-0.052 -0.968 0.105 0.410 -0.198 -0.309
b12 - PRIVATE*ATO
0.000 0.072 -0.004 -0.202 0.030 0.324
b13 - PRIVATE*ΔATO
0.001 0.100 -0.053 -1.203 0.079 0.687
b14 - PRIVATE*PM
-0.350 -1.019 -1.154 -1.147 0.894 0.220
b15 - PRIVATE*ΔPM 0.316 0.682 -1.741 -1.209 5.167 1.240
Adjusted R-square
31.9% 35.4% 6.1% 15.8% 8.0% 11.3%
n 2,392 520 202
37
Panel B: Only Audit Firms
RNOA_t+1 RNOA_t+3 RNOA_t+5
Coeff t-stat Coeff t-stat Coeff t-stat Coeff t-stat Coeff t-stat Coeff t-stat
b0 - Intercept
-0.026 -1.364 -0.023 -0.799 -0.087 -1.293 -0.050 -0.537 -0.411 -4.690 -0.525 -1.910
b1 - PRIVATE
0.120 4.521 0.048 1.662 0.158 1.459 0.201 1.963 0.468 1.366 0.419 1.561
b2 - RNOA
0.630 10.561 0.395 3.886 0.544 1.735 0.290 0.830 2.422 7.420 3.265 4.473
b3 - ΔRNOA
0.057 0.501 -0.106 -0.203 -0.591 -1.696
b4 - ΔNOA
0.056 0.994 0.000 0.002 0.641 1.023
b5 - ATO
-0.003 -0.480 -0.014 -0.655 0.054 0.624
b6 - ΔATO
0.023 1.879 0.072 1.268 -0.068 -0.327
b7 - PM
1.058 3.573 1.180 1.232 -3.399 -1.401
b8 - ΔPM
0.505 1.178 0.908 0.575 2.655 2.557
b9 - PRIVATE*RNOA
-0.025 -0.335 0.125 1.029 0.133 0.341 0.547 1.349 -1.523 -1.404 -4.395 -1.009
b10 - PRIVATE*ΔRNOA
-0.192 -1.448 1.159 1.708 2.655 0.866
b11 - PRIVATE*ΔNOA
-0.112 -1.718 -0.219 -0.715 -1.100 -0.834
b12 - PRIVATE*ATO
0.016 1.730 0.008 0.289 0.222 0.807
b13 - PRIVATE*ΔATO
-0.020 -1.482 -0.124 -1.755 -0.316 -0.384
b14 - PRIVATE*PM
-0.498 -1.173 -2.417 -1.624 11.728 0.597
b15 - PRIVATE*ΔPM -0.296 -0.464 -3.409 -1.243 -10.640 -0.480
Adjusted R-square
33.1% 37.4% 6.2% 15.8% 4.4% 8.7%
n 1,052 252 80
PRIVATE equals one if the firm is a private firm and zero otherwise. See Tables 1and 2 for other variable descriptions. In Panel B, audit firms are the Sageworks
firm-years where the variable DATASOURCE is equal to AUDITED.

38
TABLE 4
Regressions of Future Profit Margin and Asset Turnover on an Indicator Variable for Private Firms and Financial
Performance Variables
Panel A: Profit Margin Analysis
PM_t+1 PM_t+3 PM_t+5
Coeff t-stat Coeff t-stat Coeff t-stat Coeff t-stat Coeff t-stat Coeff t-stat
b0 - Intercept -0.043 -6.581 -0.062 -6.104 -0.055 -3.559 -0.059 -3.010 -0.030 -1.379 -0.058 -1.022
b1 - PRIVATE 0.039 5.232 0.057 4.692 0.082 3.427 0.100 3.436 0.101 1.797 0.124 1.589
b2 - RNOA -0.086 -2.696 -0.125 -1.157 0.074 0.515
b3 - ΔRNOA 0.064 2.402 0.033 0.465 0.079 0.946
b4 - ΔNOA -0.024 -1.885 -0.048 -1.504 0.107 0.899
b5 - ATO 0.005 4.414 0.005 1.633 0.001 0.131
b6 - ΔATO -0.004 -2.545 -0.007 -0.913 0.012 0.613
b7 - PM 1.261 14.899 1.595 10.865 1.066 5.258 1.461 4.032 0.490 2.114 0.367 0.589
b8 - ΔPM -0.451 -2.981 -0.188 -0.587 -0.068 -0.126
b9 - PRIVATE*RNOA 0.086 2.493 0.092 0.799 -0.218 -0.802
b10 - PRIVATE*ΔRNOA -0.069 -2.418 0.021 0.257 0.007 0.034
b11 - PRIVATE*ΔNOA 0.032 1.856 0.108 2.745 -0.160 -0.902
b12 - PRIVATE*ATO -0.006 -3.715 -0.008 -1.982 0.004 0.128
b13 - PRIVATE*ΔATO 0.005 2.429 0.008 0.999 -0.024 -0.784
b14 - PRIVATE*PM -0.268 -2.904 -0.595 -3.782 -0.389 -1.384 -0.695 -1.616 0.008 0.017 0.568 0.502
b15 - PRIVATE*ΔPM 0.406 2.278 -0.280 -0.646 -0.136 -0.118
Adjusted R-square 43.2% 45.9% 23.0% 28.0% 17.3% 20.1%
n 2,392 520 202

39
Panel B: Asset Turnover Analysis
ATO_t+1 ATO_t+3 ATO_t+5
Coeff t-stat Coeff t-stat Coeff t-stat Coeff t-stat Coeff t-stat Coeff t-stat
b0 - Intercept 1.468 5.586 1.670 5.552 2.311 4.620 2.655 3.382 2.797 1.872 6.116 2.363
b1 - PRIVATE -1.152 -2.863 -1.512 -2.838 1.067 1.149 2.224 1.605 0.074 0.030 3.007 0.820
b2 - RNOA -2.148 -1.918 3.982 1.539 11.568 1.459
b3 - ΔRNOA -3.022 -3.046 3.165 0.915 -1.367 -0.215
b4 - ΔNOA -0.793 -1.467 -0.628 -0.758 -7.338 -1.995
b5 - ATO 0.580 9.107 0.653 9.661 0.374 2.579 0.220 1.148 0.687 1.816 0.753 2.426
b6 - ΔATO 0.057 0.496 0.046 0.185 -2.134 -2.939
b7 - PM 3.767 1.112 -9.598 -0.940 -63.806 -2.046
b8 - ΔPM 5.542 1.359 -15.670 -1.381 -4.842 -0.227
b9 - PRIVATE*RNOA 0.959 0.509 -12.870 -2.752 -18.641 -1.793
b10 - PRIVATE*ΔRNOA 2.552 1.678 -4.006 -0.662 -0.385 -0.034
b11 - PRIVATE*ΔNOA -0.425 -0.380 5.737 1.578 10.905 2.293
b12 - PRIVATE*ATO 0.421 4.567 0.434 3.639 0.452 2.163 0.959 3.375 -0.058 -0.086 0.124 0.249
b13 - PRIVATE*ΔATO -0.477 -2.336 -0.648 -0.771 1.460 1.245
b14 - PRIVATE*PM -2.407 -0.410 20.546 1.343 61.806 1.358
b15 - PRIVATE*ΔPM -0.277 -0.041 28.622 1.141 11.827 0.228
Adjusted R-square 30.2% 53.5% 12.4% 33.4% 17.2% 20.5%
n 2,392 520 202
See Tables 1and 2 for other variable descriptions.

40
TABLE 5
Regressions of Future Return on Equity on Financial Performance Variables
Panel A: Future Return on Equity on an Indicator Variable for Private Firms and Financial Performance Variables
ROE_t+1 ROE_t+3 ROE_t+5
Coeff t-stat Coeff t-stat Coeff t-stat Coeff t-stat Coeff t-stat Coeff t-stat
c0 - Intercept -0.057 -5.033 -0.130 -6.564 -0.102 -3.282 -0.127 -2.557 0.011 0.140 0.149 0.912
c1 - PRIVATE 0.041 2.712 0.099 4.079 0.102 2.332 0.114 1.876 0.129 1.542 0.198 1.429
c2 - ROE 0.672 9.476 0.410 4.809 0.537 3.045 0.292 1.353 -0.220 -0.329 -0.892 -1.060
c3 - ΔBVE
0.000 0.890
-0.002 -1.202
0.000 0.101
c4 - ATO
0.007 4.085
-0.003 -0.551
-0.017 -1.197
c5 - ΔATO
-0.005 -1.514
0.009 0.985
-0.027 -1.718
c6 - PM
1.299 7.285
1.330 2.843
0.273 0.216
c7 - ΔPM
-0.671 -3.375
-0.353 -0.812
0.518 0.461
c8 - LEV
-0.029 -0.531
-0.030 -0.344
0.173 0.575
c9 - ΔLEV
-0.003 -0.441
0.009 1.713
-0.159 -0.691
c10 - PRIVATE*ROE 0.196 2.100 0.431 3.884 -0.094 -0.372 0.171 0.619 0.811 1.237 1.726 1.762
c11 - PRIVATE*ΔBVE
0.000 0.095
0.002 1.007
-0.001 -0.275
c12 - PRIVATE*ATO
-0.007 -2.316
0.005 0.815
0.015 0.776
c13 - PRIVATE*ΔATO
0.002 0.563
-0.010 -0.768
0.032 1.144
c14 - PRIVATE*PM
-1.125 -5.573
-1.312 -2.431
-0.939 -0.617
c15 - PRIVATE*ΔPM
0.468 1.847
-0.034 -0.071
-0.242 -0.178
c16 - PRIVATE*LEV
0.033 0.485
-0.015 -0.068
0.592 0.842
c17 - PRIVATE*ΔLEV -0.002 -0.041 -0.169 -0.825 -2.728 -1.202
Adjusted R-square 24.2% 26.5% 9.4% 12.9% 12.5% 18.2%
n 2,392 520 202
LEV is long-term debt (DLTT, LONGTERMDEBT) divided by stockholders’ equity. BVE equal book value of equity (SEQ, TOTALEQUITY). See
Tables 1and 2 for other variable descriptions.
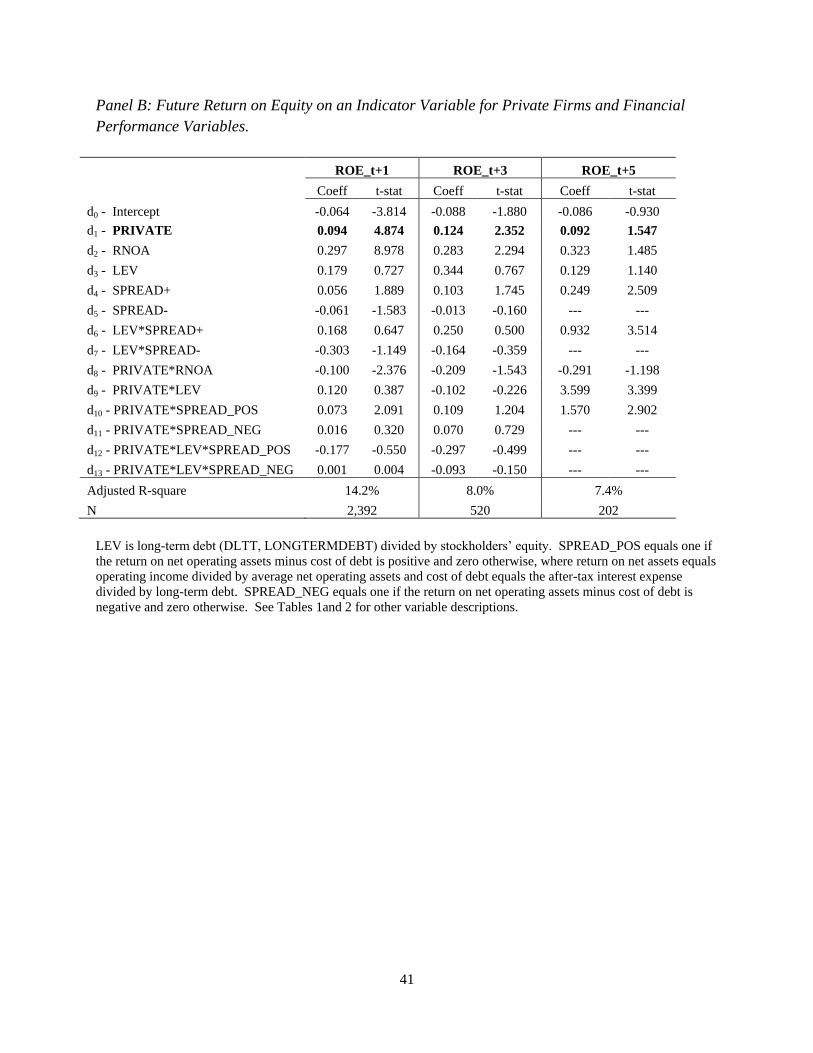
41
Panel B: Future Return on Equity on an Indicator Variable for Private Firms and Financial
Performance Variables.
ROE_t+1 ROE_t+3 ROE_t+5
Coeff t-stat Coeff t-stat Coeff t-stat
d0 - Intercept -0.064 -3.814 -0.088 -1.880 -0.086 -0.930
d1 - PRIVATE 0.094 4.874 0.124 2.352 0.092 1.547
d2 - RNOA 0.297 8.978 0.283 2.294 0.323 1.485
d3 - LEV 0.179 0.727 0.344 0.767 0.129 1.140
d4 - SPREAD+ 0.056 1.889 0.103 1.745 0.249 2.509
d5 - SPREAD- -0.061 -1.583 -0.013 -0.160 --- ---
d6 - LEV*SPREAD+ 0.168 0.647 0.250 0.500 0.932 3.514
d7 - LEV*SPREAD- -0.303 -1.149 -0.164 -0.359 --- ---
d8 - PRIVATE*RNOA -0.100 -2.376 -0.209 -1.543 -0.291 -1.198
d9 - PRIVATE*LEV 0.120 0.387 -0.102 -0.226 3.599 3.399
d10 - PRIVATE*SPREAD_POS 0.073 2.091 0.109 1.204 1.570 2.902
d11 - PRIVATE*SPREAD_NEG 0.016 0.320 0.070 0.729 --- ---
d12 - PRIVATE*LEV*SPREAD_POS -0.177 -0.550 -0.297 -0.499 --- ---
d13 - PRIVATE*LEV*SPREAD_NEG 0.001 0.004 -0.093 -0.150 --- ---
Adjusted R-square 14.2% 8.0% 7.4%
N 2,392 520 202
LEV is long-term debt (DLTT, LONGTERMDEBT) divided by stockholders’ equity. SPREAD_POS equals one if
the return on net operating assets minus cost of debt is positive and zero otherwise, where return on net assets equals
operating income divided by average net operating assets and cost of debt equals the after-tax interest expense
divided by long-term debt. SPREAD_NEG equals one if the return on net operating assets minus cost of debt is
negative and zero otherwise. See Tables 1and 2 for other variable descriptions.


![Alchian and Demsetz 1972 Production Information Costs and Economic Organization[1]](https://img.pdfslide.net/doc/110x75/547ac60ab4af9fda158b4c61/alchian-and-demsetz-1972-production-information-costs-and-economic-organization1.jpg)