Embed Size (px)
DESCRIPTION
USACE Asset Management Risk and Reliability Workshop Using CI Ratings as an Estimate of Failure Probability. Allen C. Estes United States Military Academy. Agenda. Strength-based reliability Miter gate example Serviceability-based reliability Spillway gate system example - PowerPoint PPT Presentation
Citation preview

USACE Asset Management Risk and Reliability Workshop
Using CI Ratings as an Estimate of Failure
Probability
Allen C. EstesUnited States Military Academy
• Strength-based reliability–Miter gate example
• Serviceability-based reliability–Spillway gate system example
• Strengths and limitations
AgendaAgenda

• Probabilistic Approach to Design and Analysis
• Corps of Engineers requires for major rehabilitation projects
• Used for life-cycle analysis– Probability of failure– Deterioration model– Hazard functions
• Reliability requires lots of data
Reliability MethodsReliability Methods

Strength-Based ReliabilityStrength-Based ReliabilityMiter Gate: Lock and Dam #12Miter Gate: Lock and Dam #12

MomentDiagram
Upper PoolElevation
Low er PoolElevation
VerticalGirder
M m ax
Hydrostatic Forces on Vertical GirderHydrostatic Forces on Vertical Girder
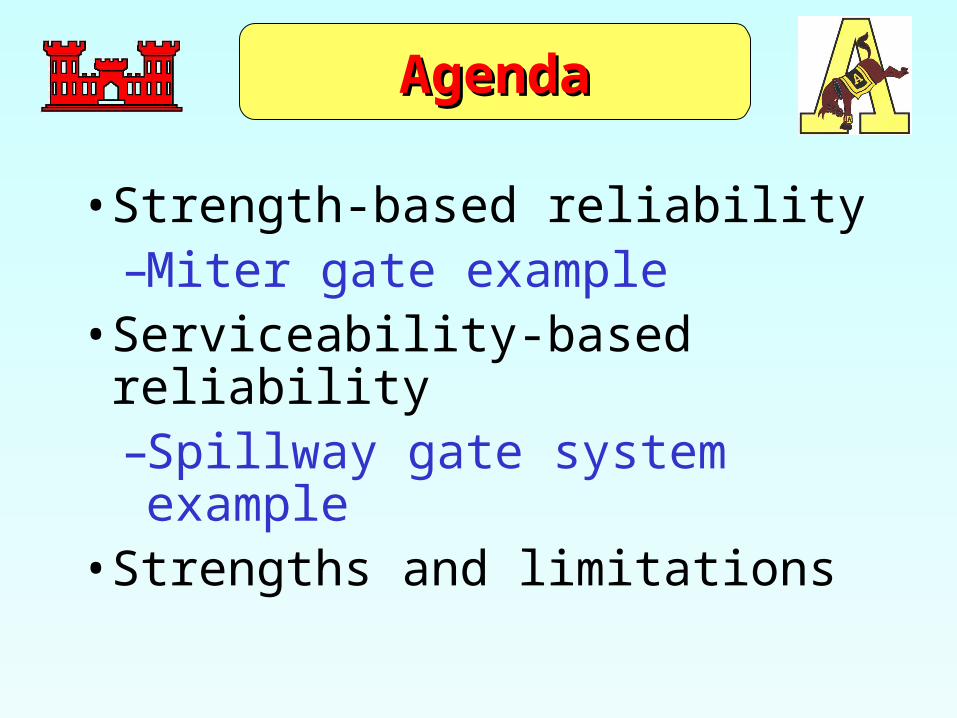
Reliability of Miter Gate on Lock 12Reliability of Miter Gate on Lock 12
Actual Stress
)( 2
max
dAII
A
Ayy
IkyM
NANA
NA
NAsNAactual
Yield Stress]48.3,8.34[Ny
Reliability yactual Pr
As time passes and corrosion ensues
0
0.01
0.02
0.03
0.04
0.05
0.06
140 160 180 200 220 240 260
Pro
bab
ility
Den
sity
Dis
trib
uti
on
S tress (MPa)
Yield StressActual Stress
Year 0
Actual StressYear 20
Actual StressYear 40

Deterioration Model
Atmospheric Zone
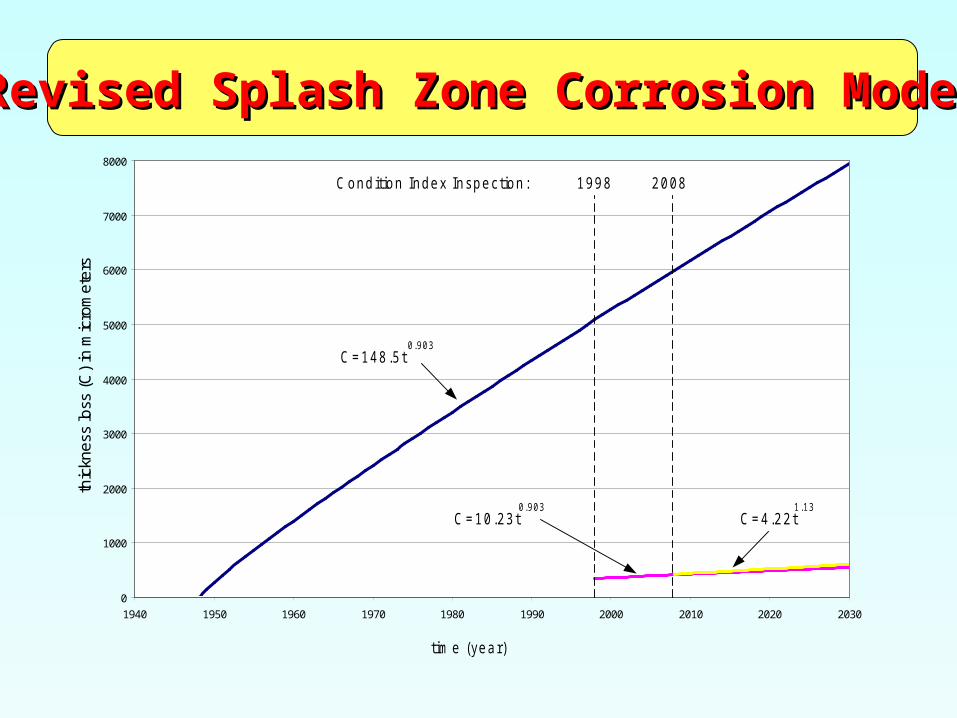
ctC log65.04.23loglog
ctC log903.05.148loglog
Splash Zone
C = Thickness loss due to corrosion (micrometers)
t = time (years)
c = uncertainty factor ( mean = 0; Std. Deviation 0.099/0.219)

Level Description
0 New
1 Minor surface scale
2 Moderate pitting
3 Severe pitting
4 Obvious thickness reduction
5 Holes due to thickness reduction 5
Condition Index Description: CorrosionCondition Index Description: Corrosion

Condition State GuidesCondition State Guides
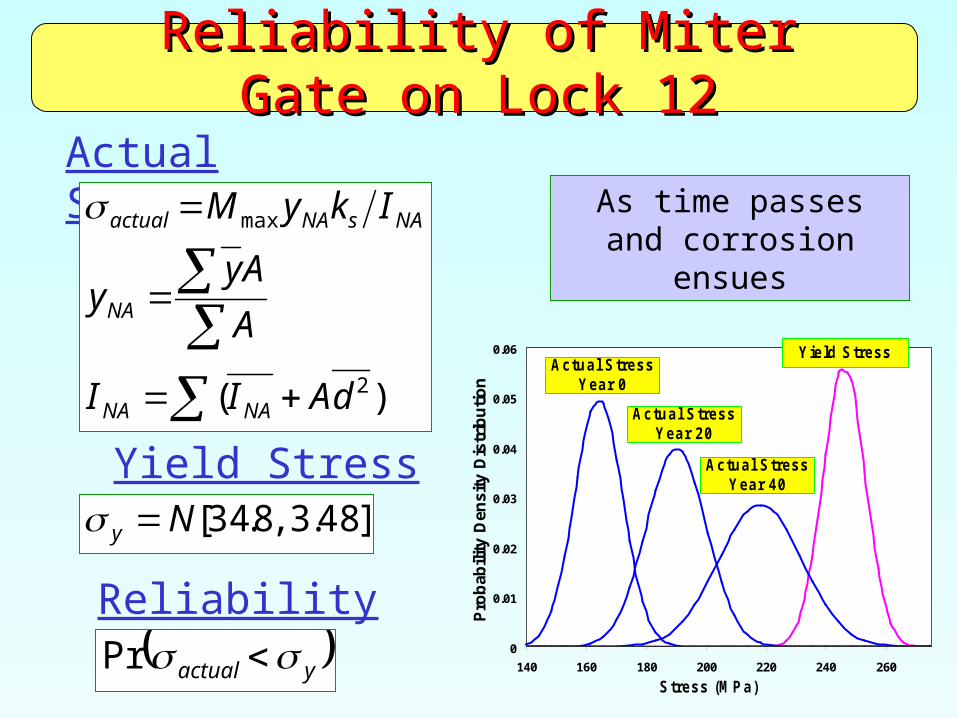
Can I use this to update reliability?
NO
Well, what would it take?
•Quantify the condition levels
•Segment-based inspection

Corrosion Levels Quantified
Level Description Thickness Loss (m)
0 New 0
1 Minor surface scale 0-200
2 Moderate pitting 0-500
3 Severe pitting 0-1000
4 Obvious thickness reduction 1000-3000
5 Holes due to thickness reduction >3000 5
Corrosion Levels QuantifiedCorrosion Levels Quantified
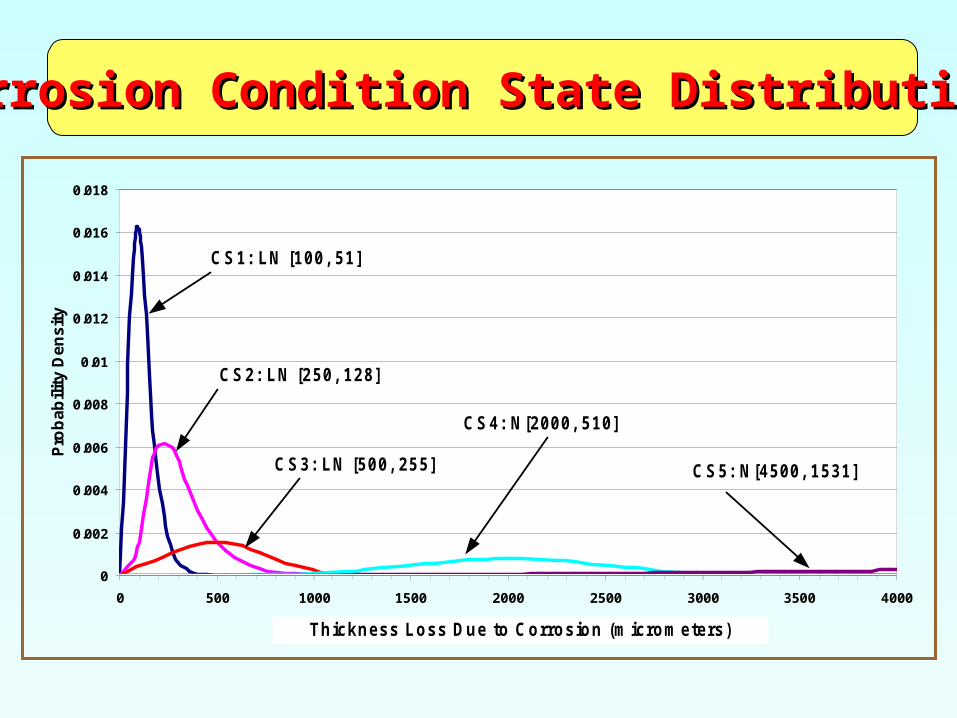
Corrosion Condition State DistributionsCorrosion Condition State Distributions
0
0.002
0.004
0.006
0.008
0.01
0.012
0.014
0.016
0.018
0 500 1000 1500 2000 2500 3000 3500 4000
Change in Bar Diameter (micrometers)
Pro
ba
bil
ity
De
ns
ity
CS1: LN [100, 51]
CS2: LN [250, 128]
CS3: LN [500, 255]
CS4: N[2000, 510]
CS5: N[4500, 1531]
Thickness Loss Due to Corrosion (micrometers)

0
1000
2000
3000
4000
5000
6000
7000
8000
9000
1930 1950 1970 1990 2010 2030
Th
ickn
ess
Lo
ss (
mic
rom
eter
s)
Year
Level 5Level 0 Level 4
Level 2Level 1
Level 1 Level 2 Level 3
AtmosphericCorrosion
Splash ZoneCorrosion
Projected Condition State Deterioration
0
1000
2000
3000
4000
5000
6000
7000
8000
1940 1950 1960 1970 1980 1990 2000 2010 2020 2030
tim e (year)
thic
kne
ss lo
ss (
C)
in m
icro
me
ters
C =148.5 t0.903
C =10.23t0.903
C =4.22t1.13
1998 2008C ond ition Index Inspection :
Revised Splash Zone Corrosion ModelRevised Splash Zone Corrosion Model

CI Limitations
• Not designed to accommodate reliability• Based on subjective judgment of inspector• Not enough information to quantify in
probabilistic terms• CI rating based on condition of the worst
element• Not conducted regularly -- no knowledge of
condition state transition

Strength-BasedConclusions
• Visual inspection information can be used to update reliability analyses– in some cases– with some modification
• Case studies show– Works well for external corrosion– Moderately well for internal corrosion– Poorly for fatigue
• Potential exists to use visual inspection data to update deterioration on many structures
• People who design visual inspections and the people who use the data need to talk
• The information is already there – we should use it

• Serviceability issues typically drive repair and rehabilitation decisions
• Periodic inspection results are best measure of overall structural condition– The Corps has developed condition index rating systems
for many structures– Condition index ratings are deterministic, have lots of
variables, and are tough to quantify– AND, they currently have no data
• Can we use the condition index ratings to quantify the risk to a structure for purposes of repair and replacement?
Serviceability-BasedServiceability-BasedReliabilityReliability

Spillway Gates on DamsSpillway Gates on Dams
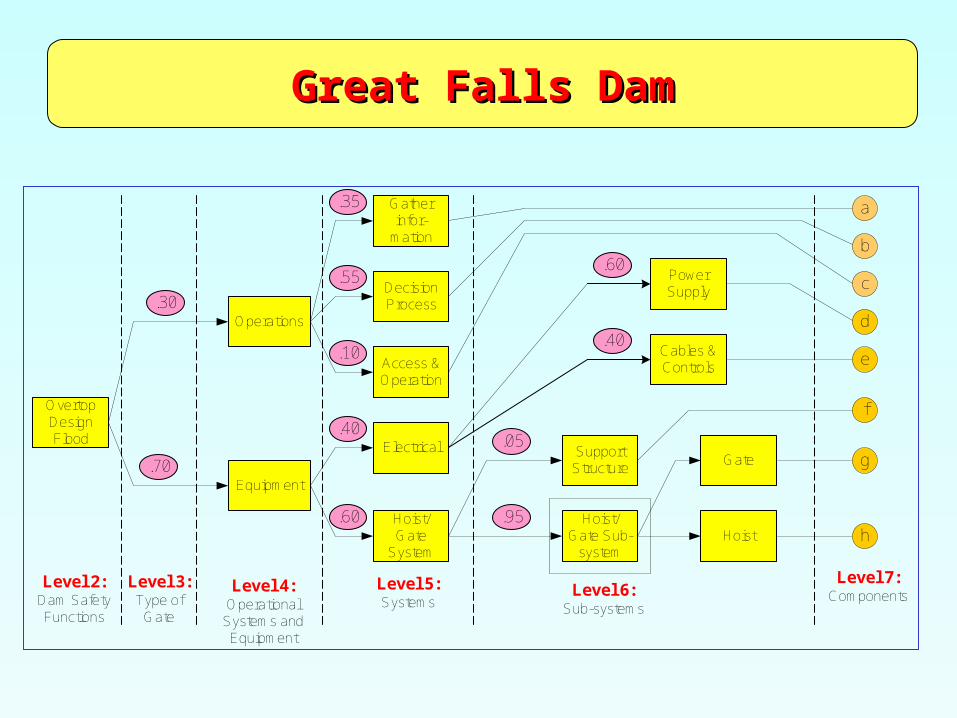
Level 2:Dam SafetyFunctions
Level 3:Type of
Gate
Level 4:Operational
Systems andEquipment
Level 5:Systems
Level 6:Sub-systems
Level 7:Components
Operations
Equipment
Gatherinfor-
mation
DecisionProcess
Access &Operation
Electrical
Hoist/Gate
System
PowerSupply
Cables &Controls
OvertopDesignFlood
SupportStructure
.30
.70
.40
.60
.35
.55
.10
.60
.40
Hoist/Gate Sub-
systemHoist
Gate
.95
.05
a
b
c
d
e
g
h
f
Great Falls DamGreat Falls Dam

Level 6:Sub-systems
Level 7:Components
Cables &Controlse
Support.Structuref
PowerSupplyd
Freq. &Voltage
EngineTemp/OilPressure
StartingSequence
Insulation
C.25
C.24
Noise &Vibration
Funct.Test
Fuel
Termin-ations
Batteries
BatteryCharger
Alternator
LocalEmergen.Generator
Dielectric
Insulation Tank
Windings
Lubri-cation
CoolingSystem
Intake &ExhaustSystem
Insulation
Termin-ations
Test(TransferSwitch)
Test(ManualSwitch)
Under-groundCables
PowerFeederCables
Trans-former
PowerTransferSystem
LiftingDevice(Steel)
LiftingDevice(Conc.)
Cracks
Distortion
Disp./Deter-ioration
AnchorBolts
Corrosion
Missing/LooseParts
C.61
C.64
C.27
C.26
C.25
.08
.08
.08
.08
.08
.08
.08.08
.08
.08.08
.08
1.0
.25 .25
.25.25
.25
.25
.25
.25
.50
.50
.50
.50
.50
.50
.50
.50
.17.17.17
.17.17.17
Great Falls DamGreat Falls Dam

Hoist Brake Function To arrest motion of gate and hold gate in any position Excellent Can arrest motion at any position, not seized Failed Cannot arrest motion at any position, seizing of brake Indicator 0-9 10-24 25-39 40-54 55-69 70-84 85-100 Score Comments Can arrest motion at any position, not seized
x
Limited slippage without impacting operation; no slip but vibration
x x x
Limited slippage that impacts operation
x x
Continuous slippage, seizing of brake
x
Typical Component Condition TableTypical Component Condition Table
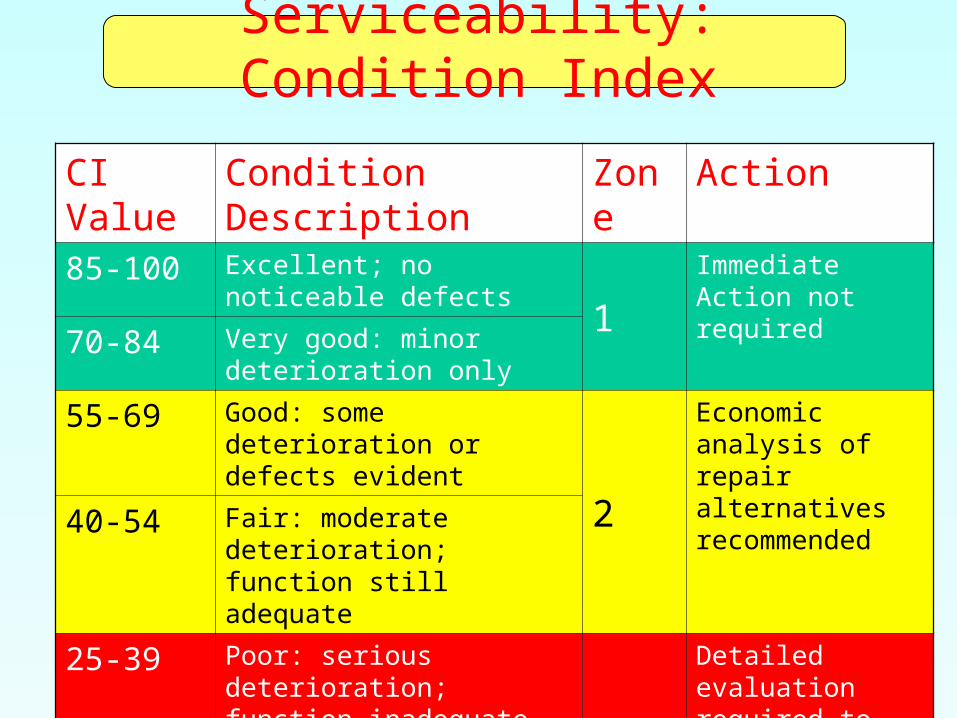
Serviceability: Condition Index
CI Value Condition Description Zone Action85-100 Excellent; no noticeable defects
1Immediate Action not required
70-84 Very good: minor deterioration only
55-69 Good: some deterioration or defects evident
2
Economic analysis of repair alternatives recommended40-54 Fair: moderate deterioration;
function still adequate
25-39 Poor: serious deterioration; function inadequate
3
Detailed evaluation required to determine need for repair, rehabilitation or reconstruction
10-24 Very Poor: extensive deterioration, barely functional
0-10 Failed: no longer functional

• Risk is product of Probability of Failure and Consequences
• Condition Index is the random variable• Random variable assumptions
– Normally distributed– Independent
• Probability of failure (repair/replacement action)
• Structural systems are a function of– Component condition– Component importance
General ApproachGeneral Approach
)( failureactualf CICIPP
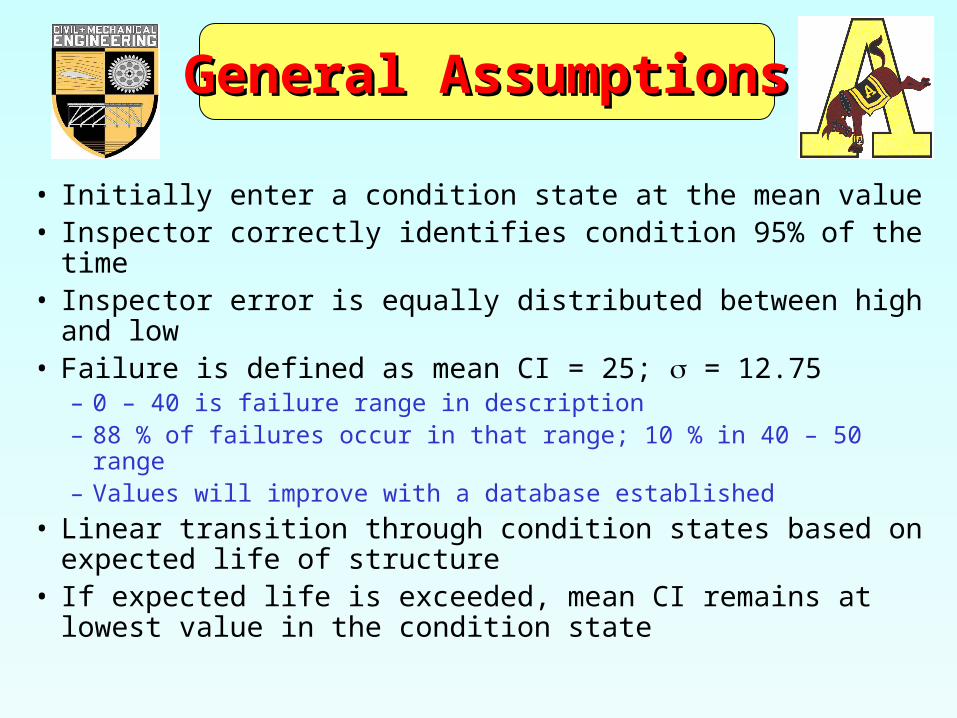
• Initially enter a condition state at the mean value• Inspector correctly identifies condition 95% of the time• Inspector error is equally distributed between high and low• Failure is defined as mean CI = 25; = 12.75
– 0 – 40 is failure range in description– 88 % of failures occur in that range; 10 % in 40 – 50 range– Values will improve with a database established
• Linear transition through condition states based on expected life of structure
• If expected life is exceeded, mean CI remains at lowest value in the condition state
General AssumptionsGeneral Assumptions
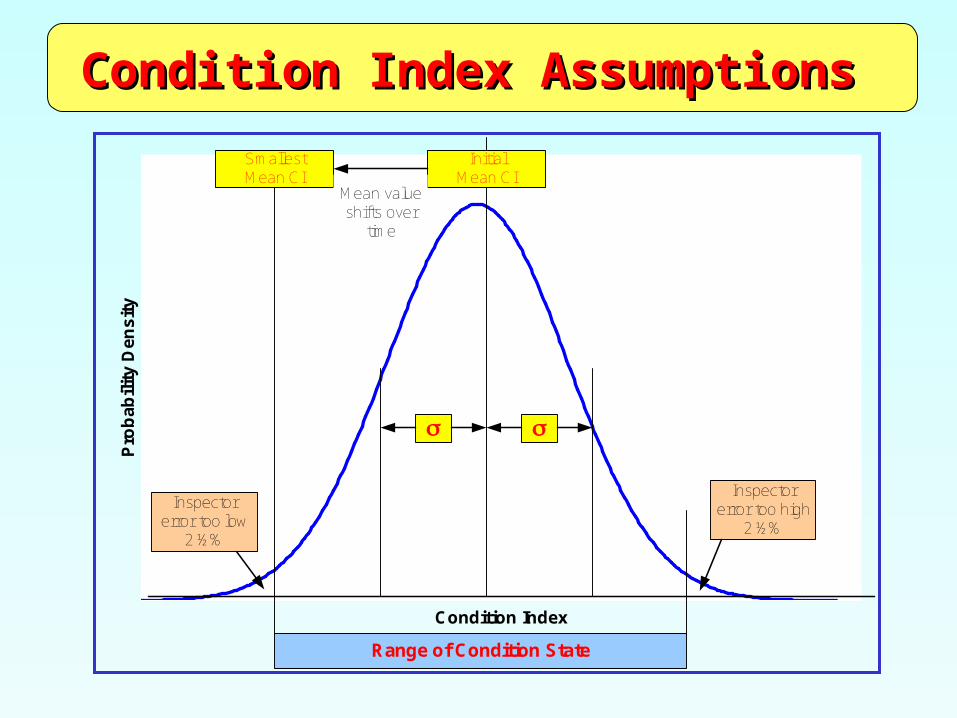
Condition Index Assumptions Condition Index Assumptions
Condition Index
Pro
ba
bil
ity
De
ns
ity
InitialMean CI
SmallestMean CI
Range of Condition State
Mean valueshifts over
time
Inspectorerror too high
2 ½%
Inspectorerror too low
2 ½%

Serviceability: Condition Index
CI Value Condition Description Zone Action85-100 Excellent; no noticeable defects
1Immediate Action not required
70-84 Very good: minor deterioration only
55-69 Good: some deterioration or defects evident
2
Economic analysis of repair alternatives recommended40-54 Fair: moderate deterioration;
function still adequate
25-39 Poor: serious deterioration; function inadequate
3
Detailed evaluation required to determine need for repair, rehabilitation or reconstruction
10-24 Very Poor: extensive deterioration, barely functional
0-10 Failed: no longer functional

0
0.005
0.01
0.015
0.02
0.025
0.03
0.035
0.04
0 5 10 15 20 25 30 35 40 45 50 55 60 65 70
Condition Index
Pro
ba
bil
ity
De
ns
ity
CI =0 to 9
CI =25 to 39
CI =10 to 24
CI >55
CI =40 to 54
11.5%0.8%
10.7%
38.5%38.5%
Quantification of FailureQuantification of Failure
= 25
= 12.75

4.5174785
MeanValue
2.293.57
11.227.65
StandardDeviation
x4x3
xxx2xx1
85 - 10070-8455-6940-5425-3910-240-9
Condition Index ScoreCondition
State
Medium Voltage Overhead Wires
4.5174785
MeanValue
2.293.57
11.227.65
StandardDeviation
x4x3
xxx2xx1
85 - 10070-8455-6940-5425-3910-240-9
Condition Index ScoreCondition
State
Medium Voltage Overhead Wires
0
0.02
0.04
0.06
0.08
0.1
0.12
0.14
0.16
0.18
0 10 20 30 40 50 60 70 80 90 100
Condition Index
Pro
ba
bil
ity
De
ns
ity
CS 1Mean = 85 = 7.65
CS 2Mean = 47 = 11.22
CS 3Mean = 17 = 3.57
CS4Mean = 4.5 = 2.29
FailureMean = 25 = 12.5
Medium VoltageOverhead Lines

Ideal ComponentIdeal Component
Ideal Component
ConditionState
Condition Index Score MeanValue
StandardDeviation0-9 10-24 25-39 40-54 55-69 70-84 85 - 100
1 x 92.5 3.82
2 x 77 3.57
3 x 62 3.57
4 x 47 3.57
5 x 32 3.57
6 x 17 3.57
7 x 4.5 2.29

Ideal ComponentIdeal Component
0
0.02
0.04
0.06
0.08
0.1
0.12
0.14
0.16
0.18
0 10 20 30 40 50 60 70 80 90 100
Condition Index
Pro
ba
bil
ity
De
ns
ity
Component B
FailureMean = 25 = 12.75
CS 1Mean = 92.5
= 3.82
CS 2Mean = 77 = 3.57
CS 3Mean = 62 = 3.57
CS 4Mean = 47 = 3.57
CS 5Mean =32 = 3.57
CS 6Mean = 17 = 3.57
CS 7Mean = 47 = 2.29
Ideal Component

System Condition Index System Condition Index
BBAAj
n
jjStructure CIICIICIICI
1
Mean Value (Chouinard et.al. 2003) Eqn [4.5]
Standard Deviation
2222
1
22BBAA
n
jjjCI III
Structure

Standard Reliability ReferenceItem Number Importance Mean CI Deviation Index TableLevel 7: ComponentsPower Supply 86.25 2.07 4.74 Local or Emergency Generators 7d 1.00 86.25 2.07 4.74 C.25 Frequency and Voltage 7d.1 0.08 85.00 7.65 4.03 Engine Temperature / Oil Pressure7d.2 0.08 85.00 7.65 4.03 Starting Sequence 7d.3 0.08 85.00 7.65 4.03 Noise and Vibratiion 7d.4 0.08 85.00 7.65 4.03 Functional Test 7d.5 0.08 92.50 3.83 5.07 Fuel 7d.6 0.08 92.50 3.83 5.07 Batteries 7d.7 0.08 85.00 7.65 4.03 Battery Charger 7d.8 0.08 85.00 7.65 4.03 Alternator 7d.9 0.08 85.00 7.65 4.03 Lubrication 7d.10 0.08 85.00 7.65 4.03 Cooling System 7d.11 0.08 85.00 7.65 4.03 Intake and Exhaust System 7d.12 0.08 85.00 7.65 4.03
Cables and Controls 7e 87.94 2.57 4.84 Underground and Encased Cables 7e.1 0.25 85.00 5.41 4.33 C.24 Insulation 7e.1.1 0.50 85.00 7.65 4.03 Terminators 7e.1.2 0.50 85.00 7.65 4.03 Power Feeder Cables 7e.2 0.25 85.00 5.41 4.33 C.25 Insulation 7e.2.1 0.50 85.00 7.65 4.03 Terminators 7e.2.2 0.50 85.00 7.65 4.03 Transformer 7e.3 0.25 89.25 5.69 4.60 C.26 Dielectric 7e.3.1 0.00 N/A N/A N/A Insulation 7e.3.2 0.50 85.00 7.65 4.03 Windings 7e.3.3 0.55 85.00 7.65 4.03 Tank 7e.3.4 0.00 N/A N/A N/A Power Source Transfer System 7e.4 0.25 92.50 3.83 5.07 C.27 Test (Transfer Switch) 7e.4.1 0.00 N/A N/A N/A Test (Manual Transfer Device) 7e.4.2 1.00 92.50 3.83 5.07
Supporting Structure 6e 92.50 2.07 5.22 Lifting Device Structure (Steel) 7f.1 0.50 92.50 1.56 5.25 C.64 Displacement / Deterioration 7f.1.1 0.17 92.50 3.83 5.07 Anchor Bolts 7f.1.2 0.17 92.50 3.83 5.07 Cracks 7f.1.3 0.17 92.50 3.83 5.07 Distortion 7f.1.4 0.17 92.50 3.83 5.07 Corrosion 7f.1.5 0.17 92.50 3.83 5.07 Missing or Loose Parts 7f.1.6 0.17 92.50 3.83 5.07 Lifting Device Structure (Concrete) 7f.2 0.50 92.50 3.83 5.07 C.61
Derived from a Combination of Inspected Items
Directly Measured by Inspection

• Based on the assumptions, a risk-based approach is possible• Structure is described in visible hierarchical format; easy to
include/exclude variables• Inspector is only required to choose the condition state• Range and inspector uncertainty is quantified• Linear transition accounts for effects of aging• Normal, independent assumptions make computations easy• Methodology can be applied to any structure• Any relevant variable can be included• Wrong assumptions are corrected as data becomes available• System CIs provide effective means of comparison between
entire structures
Conclusions: StrengthsConclusions: Strengths

• Not based on any real data; assumptions have not been verified
• System CI proposal is controversial; violates rules of traditional reliability
• Linear transition across condition states needs further analysis
• Not a replacement for a traditional reliability analysis
• Need a red flag provision for component CI scores lower than CI = 40
Conclusions: LimitationsConclusions: Limitations

• Apply methodology to a single class of structures to– develop procedural modifications – verify assumptions – time dependence on real structure – compare with cost-benefit from traditional reliability
• Investigate for other types of structures (i.e., bridges, buildings)
• Corps of Engineers needs to commit to CI inspections– Mandatory for all USACE districts– Centralized consolidation of data– Publish deterioration rates
RecommendationsRecommendations
USACE Asset Management Risk and Reliability Workshop
Using CI Ratings as an Estimate of Failure
Probability
Allen C. EstesUnited States Military Academy
Questions?