Embed Size (px)
Citation preview
© 2021 ADS Alliance Data Systems, Inc.
Alliance DataSecond Quarter 2021 Results
Perry BebermanEVP & CFO
© 2021 ADS Alliance Data Systems, Inc.
July 29, 2021
Ralph AndrettaPresident & CEO
© 2021 ADS Alliance Data Systems, Inc.
This release contains forward-looking statements within the meaning of Section 27A of the Securities Act of 1933 and Section 21E of the Securities
Exchange Act of 1934. Forward-looking statements give our expectations or forecasts of future events and can generally be identified by the use of
words such as "believe," "expect," "anticipate," "estimate," "intend," "project," "plan," "likely," "may," "should" or other words or phrases of similar
import. Similarly, statements that describe our business strategy, outlook, objectives, plans, intentions or goals also are forward-looking statements.
Examples of forward-looking statements include, but are not limited to, statements we make regarding, and the guidance we give with respect to,
our anticipated operating or financial results, initiation or completion of strategic initiatives including the proposed spinoff of our LoyaltyOne
segment, future dividend declarations, and future economic conditions, including, but not limited to, fluctuation in currency exchange rates, market
conditions and COVID-19 impacts related to relief measures for impacted borrowers and depositors, labor shortages due to quarantine, reduction in
demand from clients, supply chain disruption for our reward suppliers and disruptions in the airline or travel industries.
We believe that our expectations are based on reasonable assumptions. Forward-looking statements, however, are subject to a number of risks and
uncertainties that could cause actual results to differ materially from the projections, anticipated results or other expectations expressed in this
release, and no assurances can be given that our expectations will prove to have been correct. These risks and uncertainties include, but are not
limited to, factors set forth in the Risk Factors section in our Annual Report on Form 10-K for the most recently ended fiscal year, which may be
updated in Item 1A of, or elsewhere in, our Quarterly Reports on Form 10-Q filed for periods subsequent to such Form 10-K. Our forward-looking
statements speak only as of the date made, and we undertake no obligation, other than as required by applicable law, to update or revise any
forward-looking statements, whether as a result of new information, subsequent events, anticipated or unanticipated circumstances or otherwise.
2
Forward-Looking Statements
© 2021 ADS Alliance Data Systems, Inc.
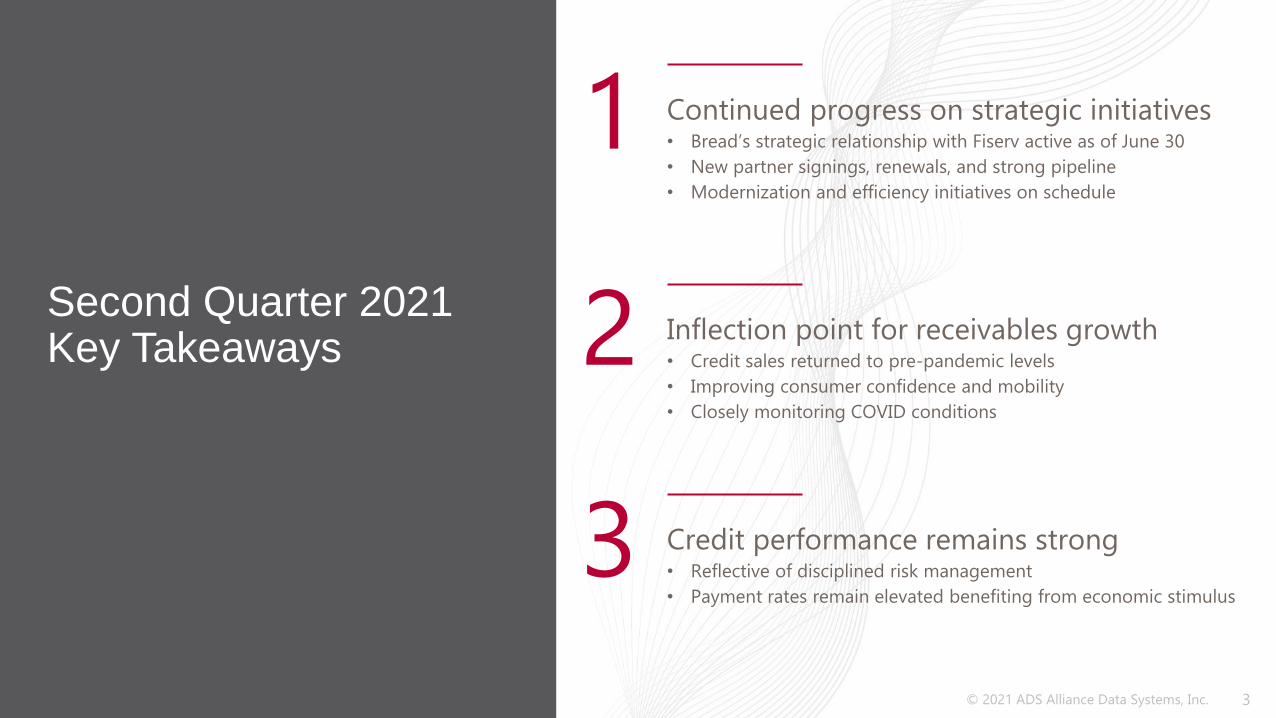
Continued progress on strategic initiatives• Bread’s strategic relationship with Fiserv active as of June 30
• New partner signings, renewals, and strong pipeline
• Modernization and efficiency initiatives on schedule
1
Inflection point for receivables growth• Credit sales returned to pre-pandemic levels
• Improving consumer confidence and mobility
• Closely monitoring COVID conditions
2
Credit performance remains strong• Reflective of disciplined risk management
• Payment rates remain elevated benefiting from economic stimulus
3
Second Quarter 2021 Key Takeaways
3
© 2021 ADS Alliance Data Systems, Inc.
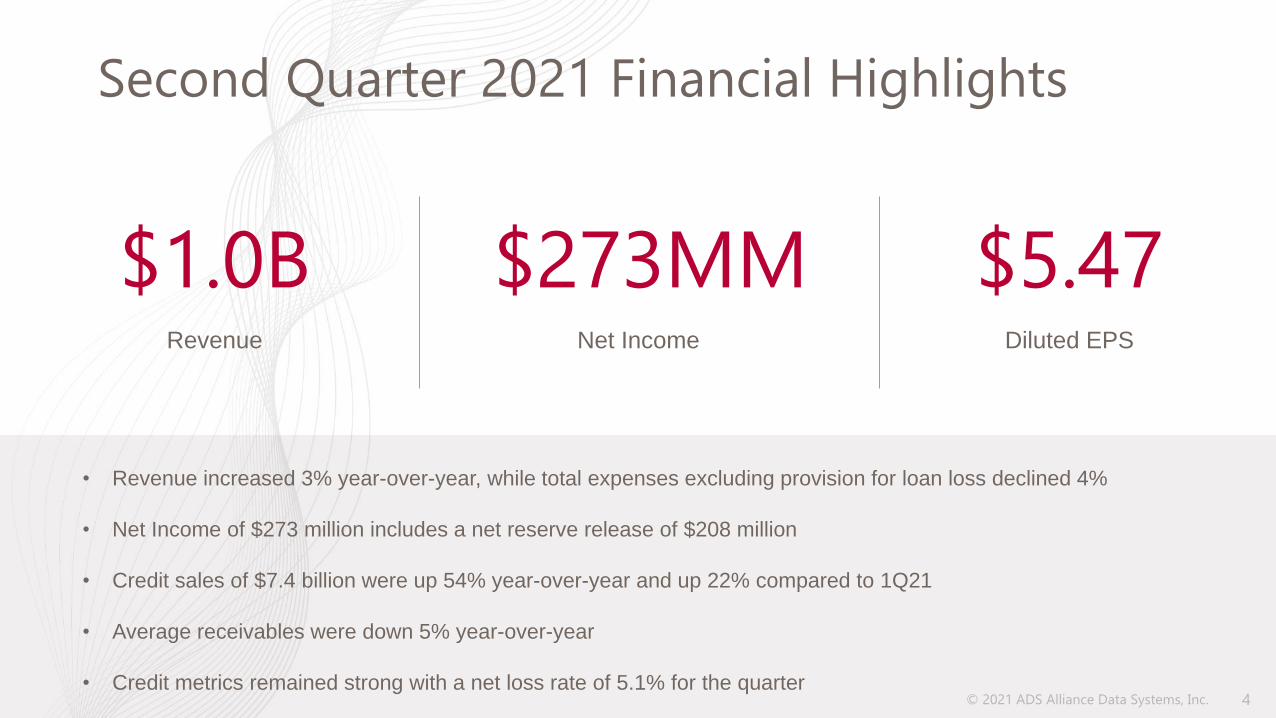
Second Quarter 2021 Financial Highlights
4
• Revenue increased 3% year-over-year, while total expenses excluding provision for loan loss declined 4%
• Net Income of $273 million includes a net reserve release of $208 million
• Credit sales of $7.4 billion were up 54% year-over-year and up 22% compared to 1Q21
• Average receivables were down 5% year-over-year
• Credit metrics remained strong with a net loss rate of 5.1% for the quarter
$1.0BRevenue
$273MMNet Income
$5.47Diluted EPS
© 2021 ADS Alliance Data Systems, Inc.
Strategic Initiatives Update
5
• Launch of Bread / Fiserv strategic relationship
Bread Distribution Relationship with Fiserv
• Accelerating integration with brand partners
Enhanced Digital Suite (EDS) & Unified Software Development Kit (SDK)
• Successfully transitioned statement processing in 2Q21
• Expected completion of core processing conversion to Fiserv in 2022
Core Processing & Statement Processing Conversions
• Exceeded 1 million cardholder activations
• Opportunity to increase cardholder acquisition in 2022
Proprietary Brand Card
• Completed ADS debt refinancing / extension
• Spin expected to be completed in 4Q21
Balance Sheet Management

© 2021 ADS Alliance Data Systems, Inc.
Card Services Brand Partner Highlights
6
Select New Bread Direct Acquisition PartnersSelect New Brand Partners
Brand Partner Renewals
© 2021 ADS Alliance Data Systems, Inc.
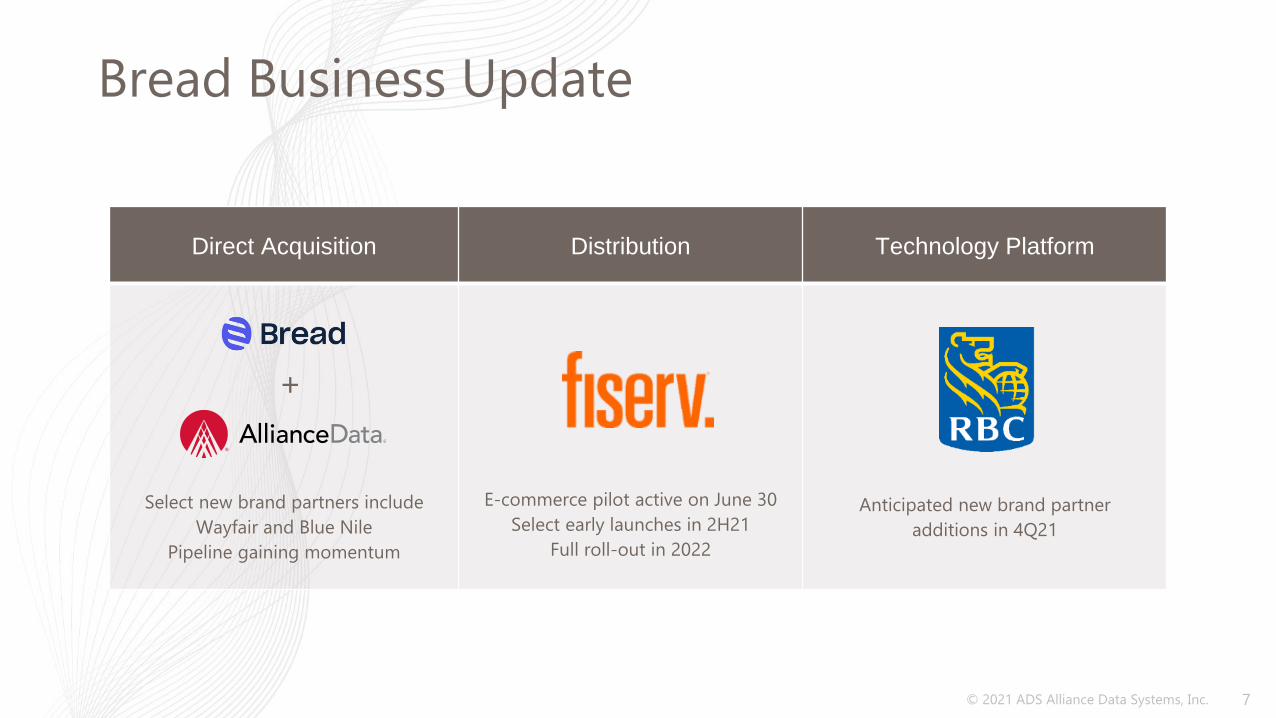
Direct Acquisition Distribution Technology Platform
Select new brand partners include
Wayfair and Blue Nile
Pipeline gaining momentum
E-commerce pilot active on June 30
Select early launches in 2H21
Full roll-out in 2022
Anticipated new brand partner
additions in 4Q21
Bread Business Update
7
+
© 2021 ADS Alliance Data Systems, Inc.© 2021 ADS Alliance Data Systems, Inc.
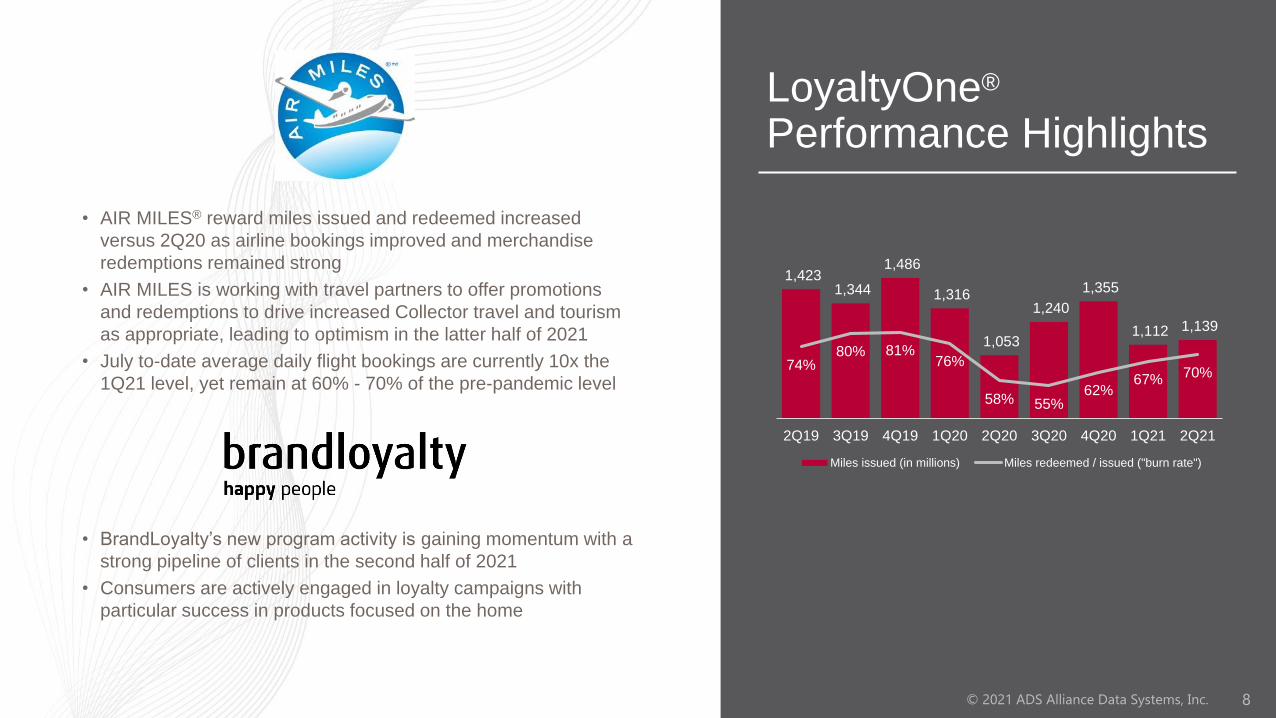
LoyaltyOne®
Performance Highlights
8
1,423 1,344
1,486
1,316
1,053
1,240
1,355
1,112 1,139
74%80% 81%
76%
58% 55%62%
67% 70%
2Q19 3Q19 4Q19 1Q20 2Q20 3Q20 4Q20 1Q21 2Q21
Miles issued (in millions) Miles redeemed / issued ("burn rate")
• AIR MILES® reward miles issued and redeemed increased
versus 2Q20 as airline bookings improved and merchandise
redemptions remained strong
• AIR MILES is working with travel partners to offer promotions
and redemptions to drive increased Collector travel and tourism
as appropriate, leading to optimism in the latter half of 2021
• July to-date average daily flight bookings are currently 10x the
1Q21 level, yet remain at 60% - 70% of the pre-pandemic level
• BrandLoyalty’s new program activity is gaining momentum with a
strong pipeline of clients in the second half of 2021
• Consumers are actively engaged in loyalty campaigns with
particular success in products focused on the home
© 2021 ADS Alliance Data Systems, Inc.
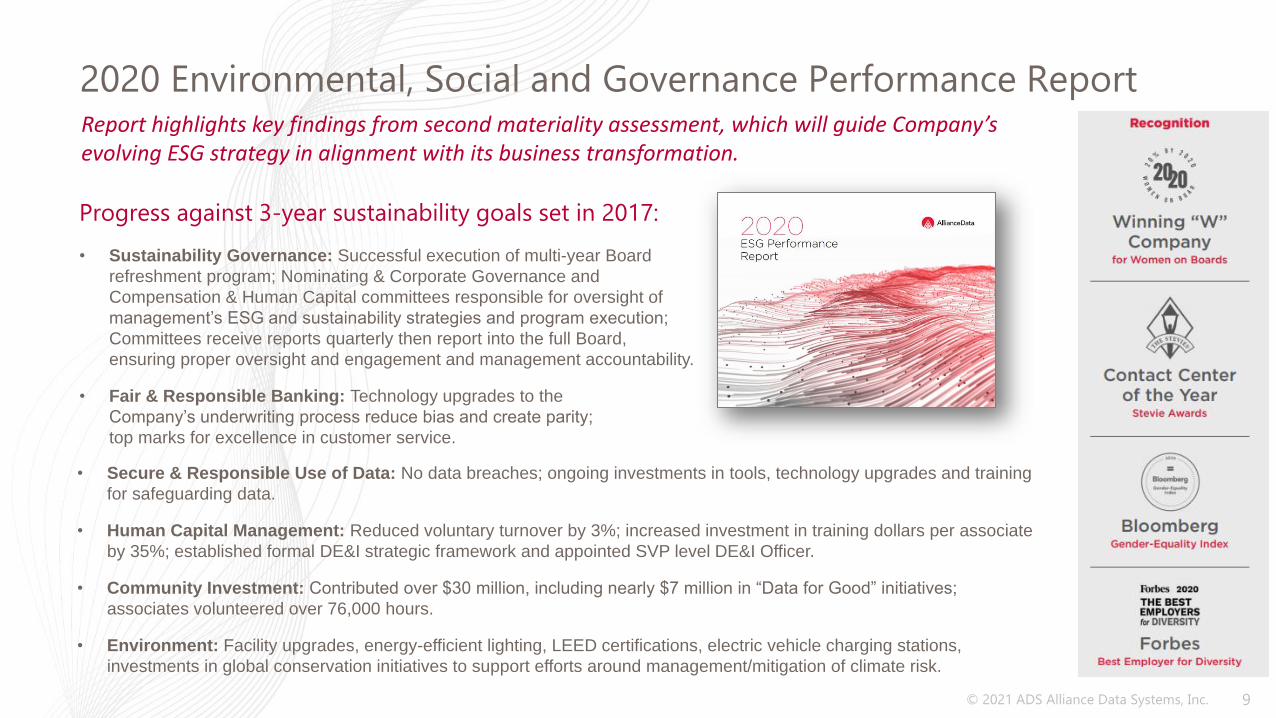
2020 Environmental, Social and Governance Performance Report
9
Report highlights key findings from second materiality assessment, which will guide Company’s evolving ESG strategy in alignment with its business transformation.
• Secure & Responsible Use of Data: No data breaches; ongoing investments in tools, technology upgrades and training
for safeguarding data.
• Human Capital Management: Reduced voluntary turnover by 3%; increased investment in training dollars per associate
by 35%; established formal DE&I strategic framework and appointed SVP level DE&I Officer.
• Community Investment: Contributed over $30 million, including nearly $7 million in “Data for Good” initiatives;
associates volunteered over 76,000 hours.
• Environment: Facility upgrades, energy-efficient lighting, LEED certifications, electric vehicle charging stations,
investments in global conservation initiatives to support efforts around management/mitigation of climate risk.
• Sustainability Governance: Successful execution of multi-year Board
refreshment program; Nominating & Corporate Governance and
Compensation & Human Capital committees responsible for oversight of
management’s ESG and sustainability strategies and program execution;
Committees receive reports quarterly then report into the full Board,
ensuring proper oversight and engagement and management accountability.
• Fair & Responsible Banking: Technology upgrades to the
Company’s underwriting process reduce bias and create parity;
top marks for excellence in customer service.
Progress against 3-year sustainability goals set in 2017:
© 2021 ADS Alliance Data Systems, Inc.
Financial Results – Consolidated
10
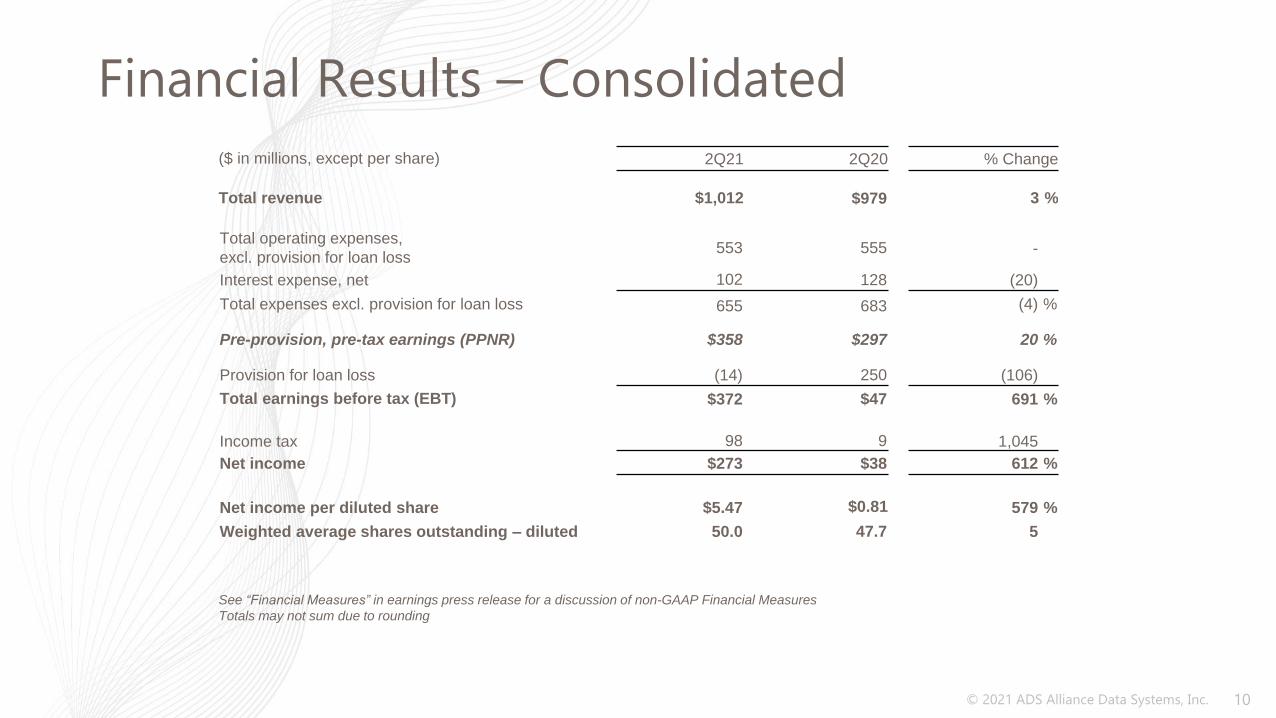
($ in millions, except per share) 2Q21 2Q20 % Change
Total revenue $1,012 $979 3 %
Total operating expenses,
excl. provision for loan loss553 555 -
Interest expense, net 102 128 (20)
Total expenses excl. provision for loan loss 655 683 (4) %
Pre-provision, pre-tax earnings (PPNR) $358 $297 20 %
Provision for loan loss (14) 250 (106)
Total earnings before tax (EBT) $372 $47 691 %
Income tax 98 9 1,045
Net income $273 $38 612 %
Net income per diluted share $5.47 $0.81 579 %
Weighted average shares outstanding – diluted 50.0 47.7 5
See “Financial Measures” in earnings press release for a discussion of non-GAAP Financial Measures
Totals may not sum due to rounding
© 2021 ADS Alliance Data Systems, Inc.
Financial Results – Segments
11
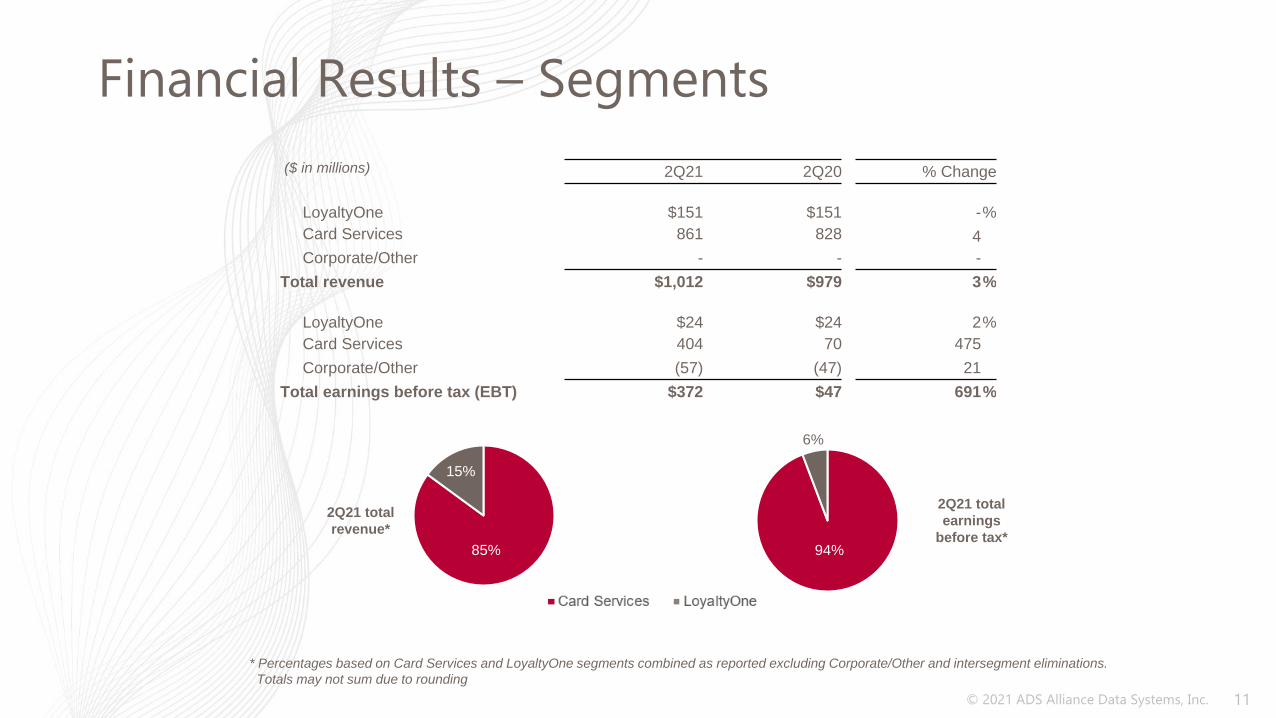
94%
6%
85%
15%
2Q21 total
revenue*
2Q21 total
earnings
before tax*
* Percentages based on Card Services and LoyaltyOne segments combined as reported excluding Corporate/Other and intersegment eliminations.
Totals may not sum due to rounding
($ in millions) 2Q21 2Q20 % Change
LoyaltyOne $151 $151 -%
Card Services 861 828 4
Corporate/Other - - -
Total revenue $1,012 $979 3%
LoyaltyOne $24 $24 2%
Card Services 404 70 475
Corporate/Other (57) (47) 21
Total earnings before tax (EBT) $372 $47 691%
© 2021 ADS Alliance Data Systems, Inc.
Key Business Metrics
12
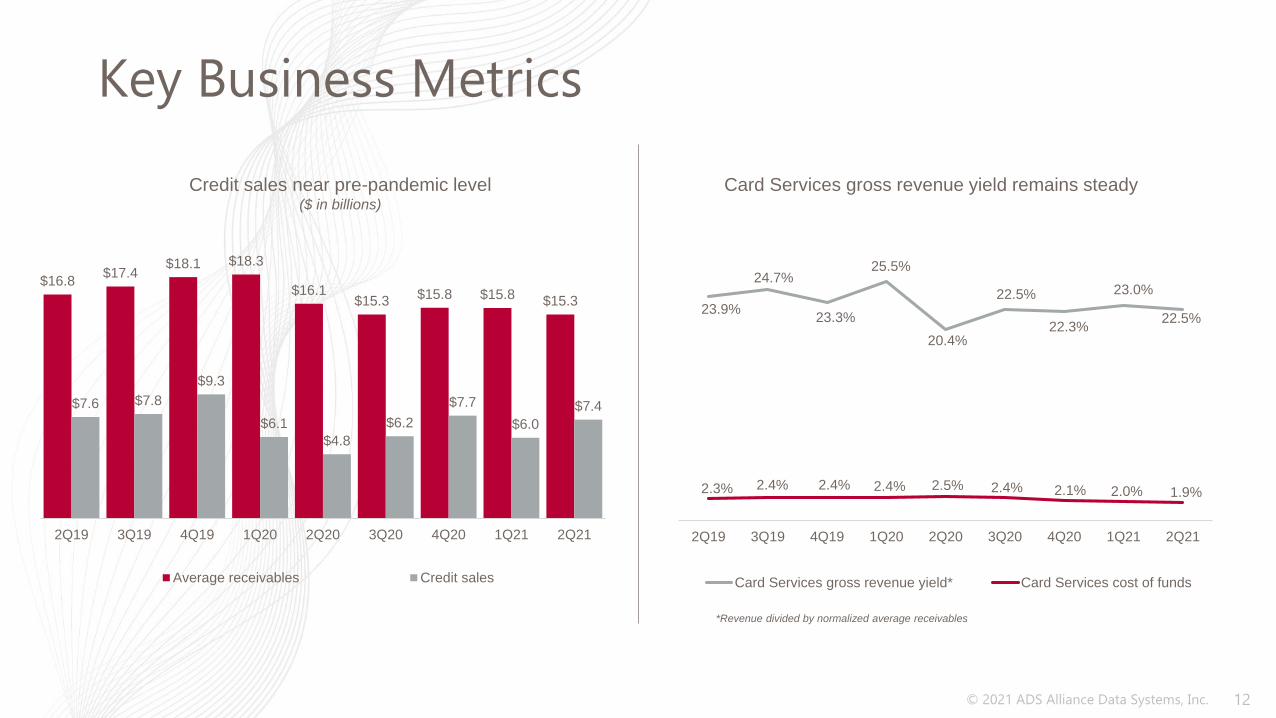
$16.8 $17.4
$18.1 $18.3
$16.1 $15.3
$15.8 $15.8 $15.3
$7.6 $7.8
$9.3
$6.1
$4.8
$6.2
$7.7
$6.0
$7.4
2Q19 3Q19 4Q19 1Q20 2Q20 3Q20 4Q20 1Q21 2Q21
Average receivables Credit sales
23.9%
24.7%
23.3%
25.5%
20.4%
22.5%
22.3%
23.0%
22.5%
2.3% 2.4% 2.4% 2.4% 2.5% 2.4% 2.1% 2.0% 1.9%
2Q19 3Q19 4Q19 1Q20 2Q20 3Q20 4Q20 1Q21 2Q21
Card Services gross revenue yield* Card Services cost of funds
Card Services gross revenue yield remains steadyCredit sales near pre-pandemic level($ in billions)
*Revenue divided by normalized average receivables
© 2021 ADS Alliance Data Systems, Inc.
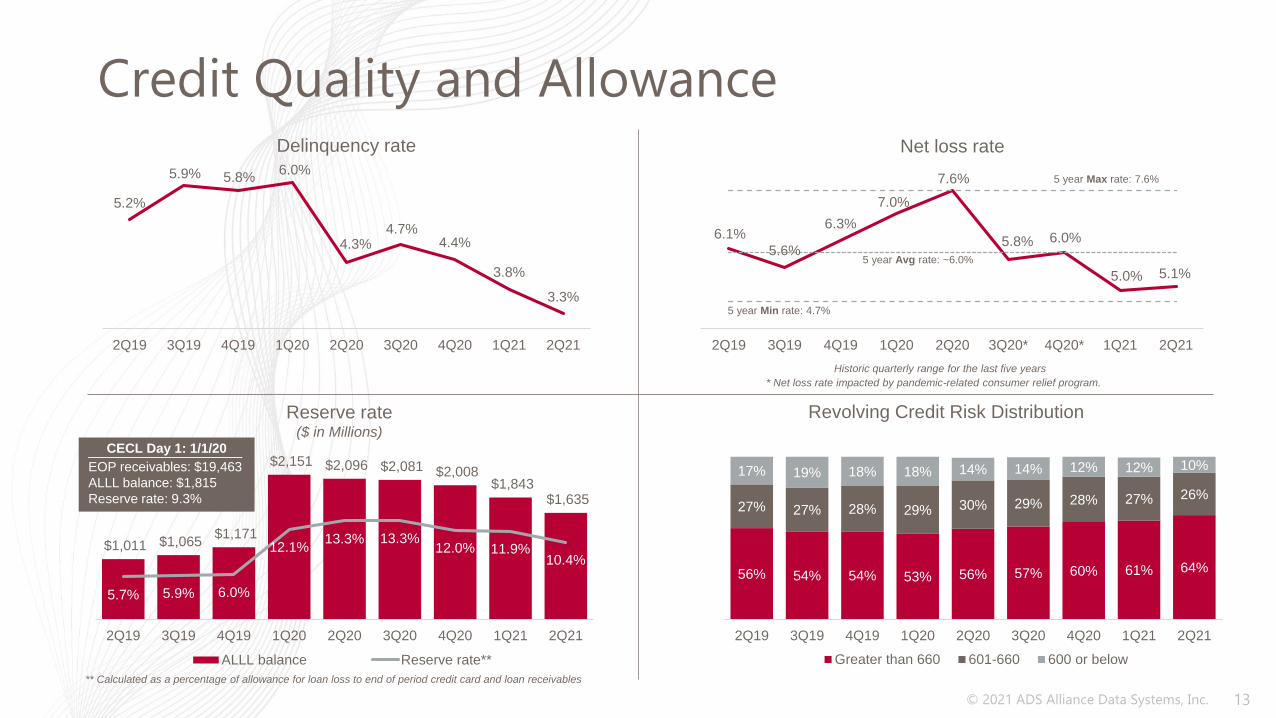
6.1%
5.6%
6.3%
7.0%
7.6%
5.8% 6.0%
5.0% 5.1%
2Q19 3Q19 4Q19 1Q20 2Q20 3Q20* 4Q20* 1Q21 2Q21
$1,011 $1,065 $1,171
$2,151 $2,096 $2,081 $2,008 $1,843
$1,635
5.7% 5.9% 6.0%
12.1%13.3% 13.3%
12.0% 11.9%10.4%
2Q19 3Q19 4Q19 1Q20 2Q20 3Q20 4Q20 1Q21 2Q21
ALLL balance Reserve rate**
Credit Quality and Allowance
13
5.2%
5.9% 5.8%6.0%
4.3%4.7%
4.4%
3.8%
3.3%
2Q19 3Q19 4Q19 1Q20 2Q20 3Q20 4Q20 1Q21 2Q21
Reserve rate ($ in Millions)
Net loss rateDelinquency rate
5 year Max rate: 7.6%
5 year Min rate: 4.7%
5 year Avg rate: ~6.0%
Historic quarterly range for the last five years
* Net loss rate impacted by pandemic-related consumer relief program.
** Calculated as a percentage of allowance for loan loss to end of period credit card and loan receivables
Revolving Credit Risk Distribution
56% 54% 54% 53% 56% 57% 60% 61% 64%
27% 27% 28% 29% 30% 29% 28% 27% 26%
17% 19% 18% 18% 14% 14% 12% 12% 10%
2Q19 3Q19 4Q19 1Q20 2Q20 3Q20 4Q20 1Q21 2Q21
Greater than 660 601-660 600 or below
_____________________
EOP receivables: $19,463
ALLL balance: $1,815
Reserve rate: 9.3%
CECL Day 1: 1/1/20
© 2021 ADS Alliance Data Systems, Inc.
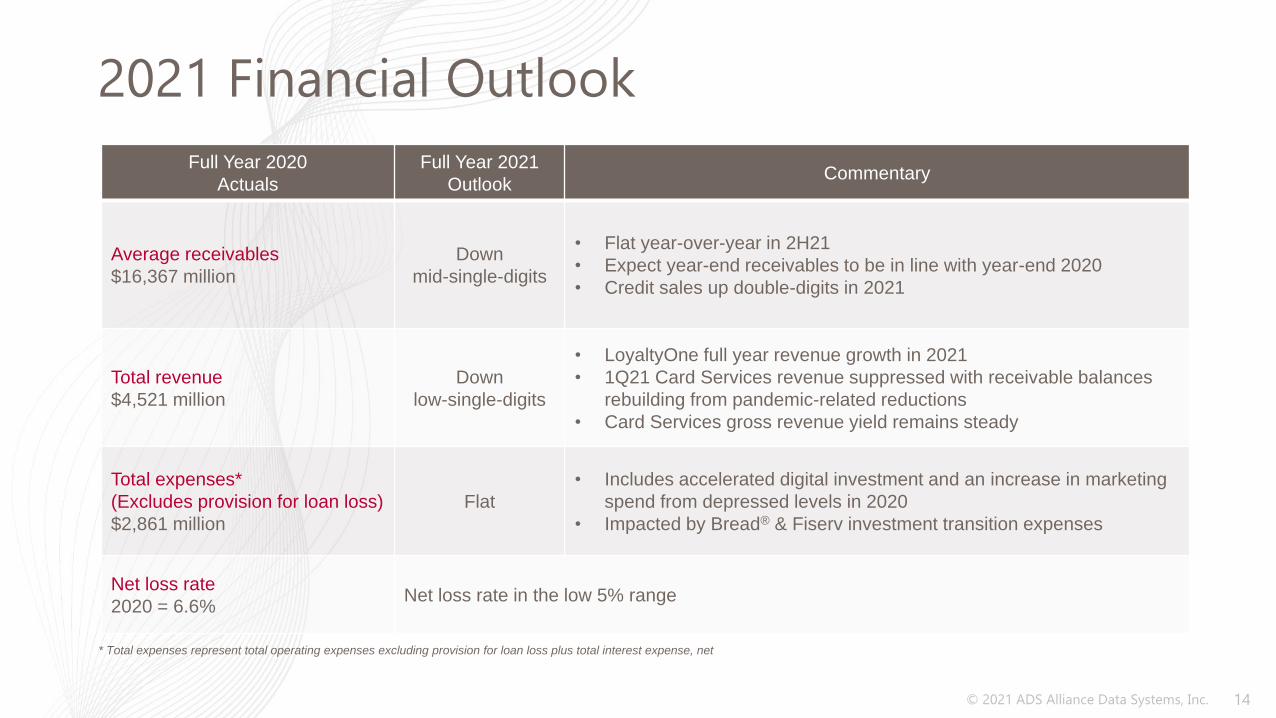
Full Year 2020
Actuals
Full Year 2021
OutlookCommentary
Average receivables
$16,367 million
Down
mid-single-digits
• Flat year-over-year in 2H21
• Expect year-end receivables to be in line with year-end 2020
• Credit sales up double-digits in 2021
Total revenue
$4,521 million
Down
low-single-digits
• LoyaltyOne full year revenue growth in 2021
• 1Q21 Card Services revenue suppressed with receivable balances
rebuilding from pandemic-related reductions
• Card Services gross revenue yield remains steady
Total expenses*
(Excludes provision for loan loss)
$2,861 million
Flat
• Includes accelerated digital investment and an increase in marketing
spend from depressed levels in 2020
• Impacted by Bread® & Fiserv investment transition expenses
Net loss rate
2020 = 6.6%Net loss rate in the low 5% range
2021 Financial Outlook
14
* Total expenses represent total operating expenses excluding provision for loan loss plus total interest expense, net
© 2021 ADS Alliance Data Systems, Inc.
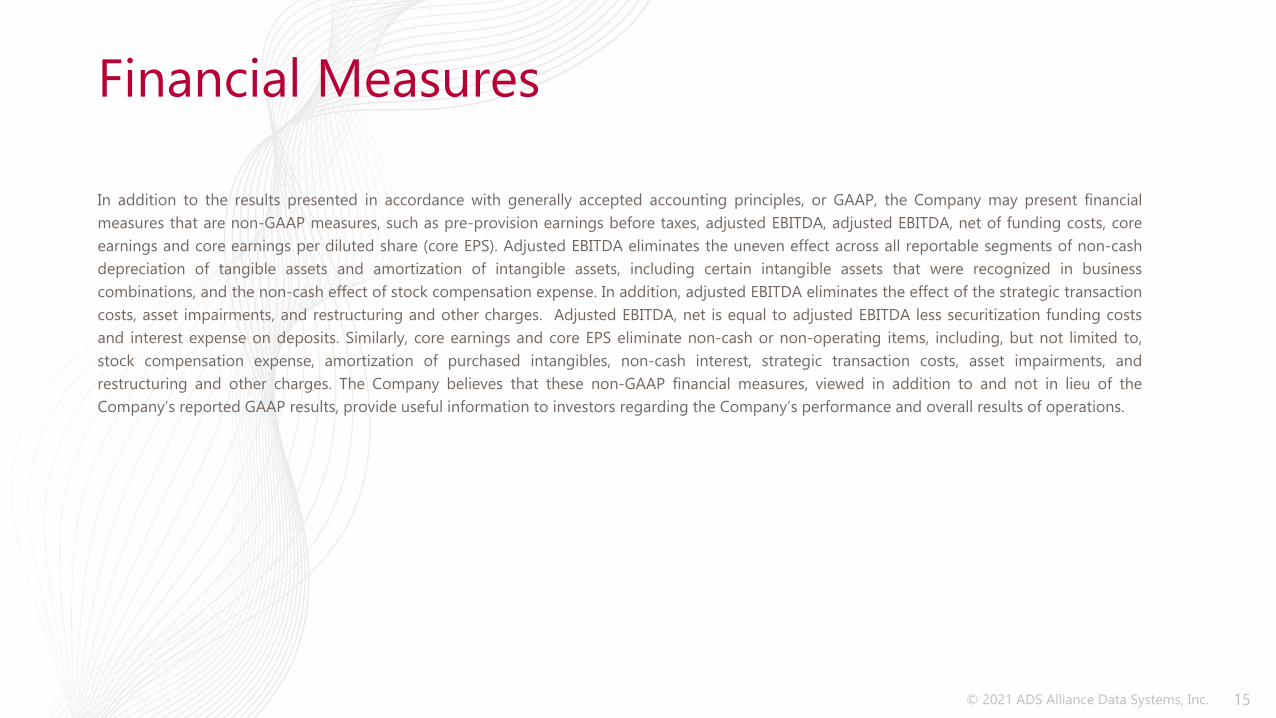
In addition to the results presented in accordance with generally accepted accounting principles, or GAAP, the Company may present financial
measures that are non-GAAP measures, such as pre-provision earnings before taxes, adjusted EBITDA, adjusted EBITDA, net of funding costs, core
earnings and core earnings per diluted share (core EPS). Adjusted EBITDA eliminates the uneven effect across all reportable segments of non-cash
depreciation of tangible assets and amortization of intangible assets, including certain intangible assets that were recognized in business
combinations, and the non-cash effect of stock compensation expense. In addition, adjusted EBITDA eliminates the effect of the strategic transaction
costs, asset impairments, and restructuring and other charges. Adjusted EBITDA, net is equal to adjusted EBITDA less securitization funding costs
and interest expense on deposits. Similarly, core earnings and core EPS eliminate non-cash or non-operating items, including, but not limited to,
stock compensation expense, amortization of purchased intangibles, non-cash interest, strategic transaction costs, asset impairments, and
restructuring and other charges. The Company believes that these non-GAAP financial measures, viewed in addition to and not in lieu of the
Company’s reported GAAP results, provide useful information to investors regarding the Company’s performance and overall results of operations.
15
Financial Measures

Appendix
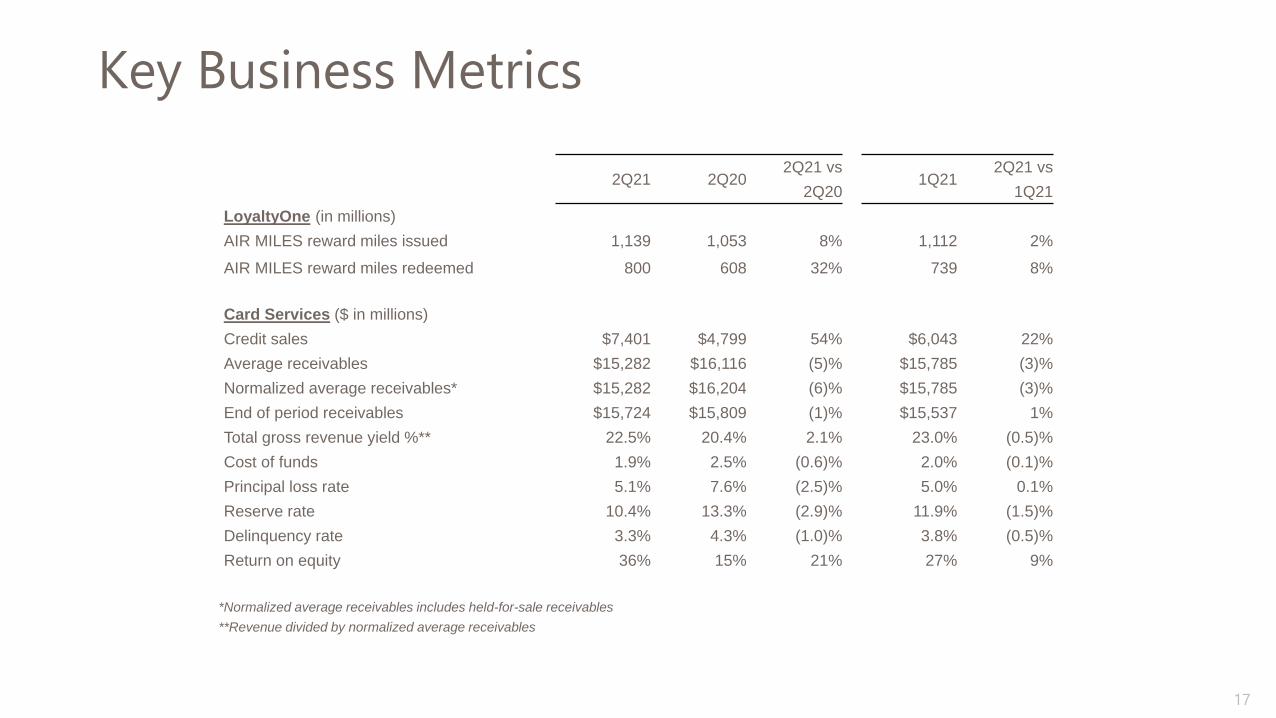
Key Business Metrics
17
2Q21 2Q202Q21 vs
1Q212Q21 vs
2Q20 1Q21
LoyaltyOne (in millions)
AIR MILES reward miles issued 1,139 1,053 8% 1,112 2%
AIR MILES reward miles redeemed 800 608 32% 739 8%
Card Services ($ in millions)
Credit sales $7,401 $4,799 54% $6,043 22%
Average receivables $15,282 $16,116 (5)% $15,785 (3)%
Normalized average receivables* $15,282 $16,204 (6)% $15,785 (3)%
End of period receivables $15,724 $15,809 (1)% $15,537 1%
Total gross revenue yield %** 22.5% 20.4% 2.1% 23.0% (0.5)%
Cost of funds 1.9% 2.5% (0.6)% 2.0% (0.1)%
Principal loss rate 5.1% 7.6% (2.5)% 5.0% 0.1%
Reserve rate 10.4% 13.3% (2.9)% 11.9% (1.5)%
Delinquency rate 3.3% 4.3% (1.0)% 3.8% (0.5)%
Return on equity 36% 15% 21% 27% 9%
*Normalized average receivables includes held-for-sale receivables
**Revenue divided by normalized average receivables
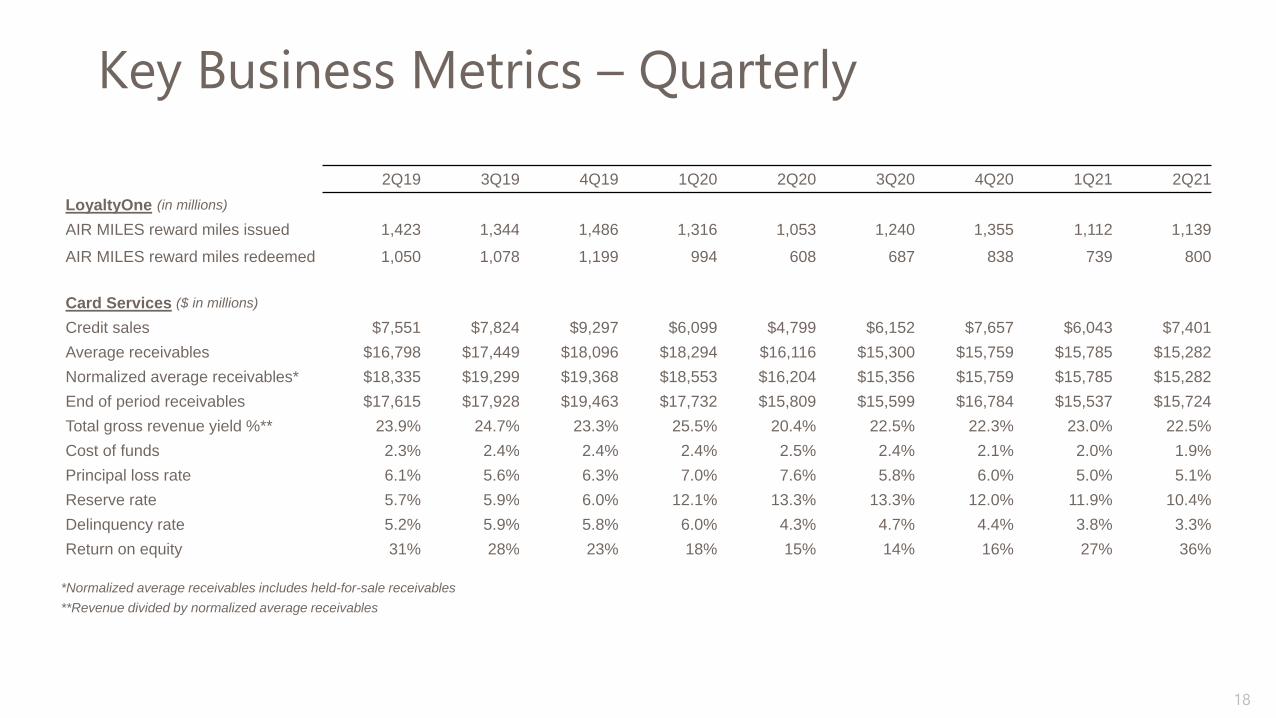
Key Business Metrics – Quarterly
18
2Q19 3Q19 4Q19 1Q20 2Q20 3Q20 4Q20 1Q21 2Q21
LoyaltyOne (in millions)
AIR MILES reward miles issued 1,423 1,344 1,486 1,316 1,053 1,240 1,355 1,112 1,139
AIR MILES reward miles redeemed 1,050 1,078 1,199 994 608 687 838 739 800
Card Services ($ in millions)
Credit sales $7,551 $7,824 $9,297 $6,099 $4,799 $6,152 $7,657 $6,043 $7,401
Average receivables $16,798 $17,449 $18,096 $18,294 $16,116 $15,300 $15,759 $15,785 $15,282
Normalized average receivables* $18,335 $19,299 $19,368 $18,553 $16,204 $15,356 $15,759 $15,785 $15,282
End of period receivables $17,615 $17,928 $19,463 $17,732 $15,809 $15,599 $16,784 $15,537 $15,724
Total gross revenue yield %** 23.9% 24.7% 23.3% 25.5% 20.4% 22.5% 22.3% 23.0% 22.5%
Cost of funds 2.3% 2.4% 2.4% 2.4% 2.5% 2.4% 2.1% 2.0% 1.9%
Principal loss rate 6.1% 5.6% 6.3% 7.0% 7.6% 5.8% 6.0% 5.0% 5.1%
Reserve rate 5.7% 5.9% 6.0% 12.1% 13.3% 13.3% 12.0% 11.9% 10.4%
Delinquency rate 5.2% 5.9% 5.8% 6.0% 4.3% 4.7% 4.4% 3.8% 3.3%
Return on equity 31% 28% 23% 18% 15% 14% 16% 27% 36%
*Normalized average receivables includes held-for-sale receivables
**Revenue divided by normalized average receivables
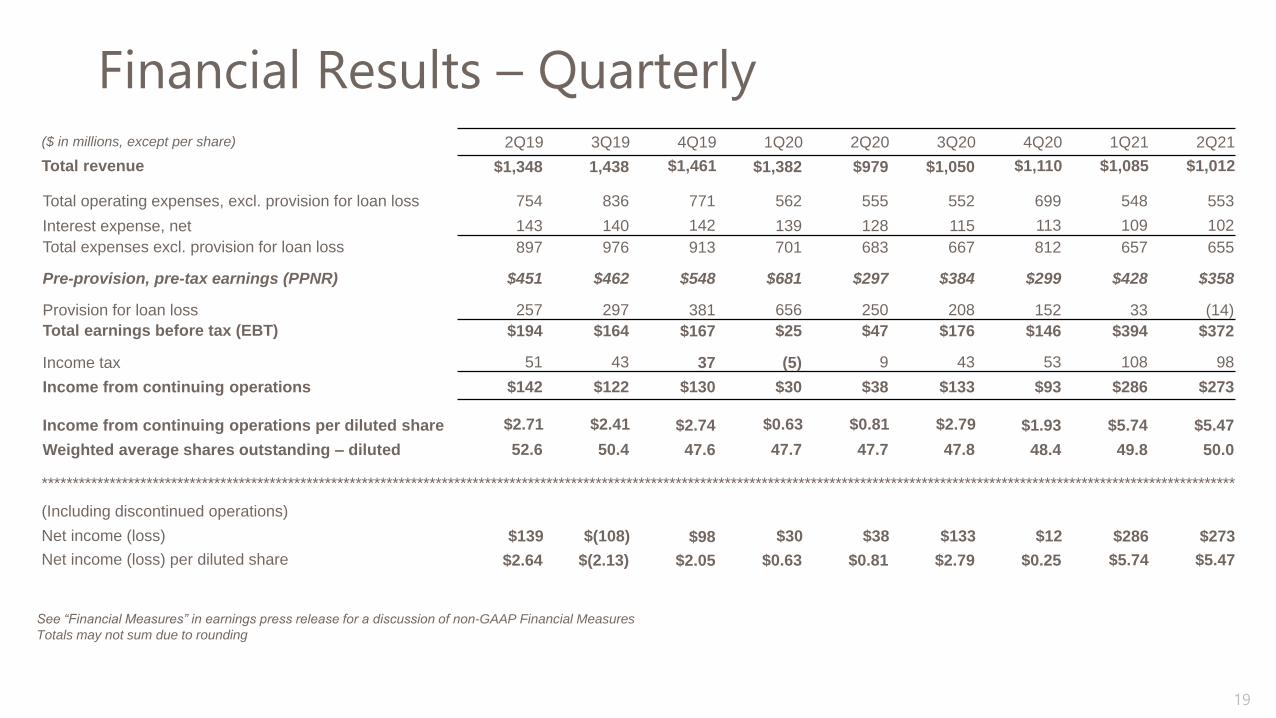
Financial Results – Quarterly
19
($ in millions, except per share) 2Q19 3Q19 4Q19 1Q20 2Q20 3Q20 4Q20 1Q21 2Q21
Total revenue $1,348 1,438 $1,461 $1,382 $979 $1,050 $1,110 $1,085 $1,012
Total operating expenses, excl. provision for loan loss 754 836 771 562 555 552 699 548 553
Interest expense, net 143 140 142 139 128 115 113 109 102
Total expenses excl. provision for loan loss 897 976 913 701 683 667 812 657 655
Pre-provision, pre-tax earnings (PPNR) $451 $462 $548 $681 $297 $384 $299 $428 $358
Provision for loan loss 257 297 381 656 250 208 152 33 (14)
Total earnings before tax (EBT) $194 $164 $167 $25 $47 $176 $146 $394 $372
Income tax 51 43 37 (5) 9 43 53 108 98
Income from continuing operations $142 $122 $130 $30 $38 $133 $93 $286 $273
Income from continuing operations per diluted share $2.71 $2.41 $2.74 $0.63 $0.81 $2.79 $1.93 $5.74 $5.47
Weighted average shares outstanding – diluted 52.6 50.4 47.6 47.7 47.7 47.8 48.4 49.8 50.0
**************************************************************************************************************************************************************************************************
(Including discontinued operations)
Net income (loss) $139 $(108) $98 $30 $38 $133 $12 $286 $273
Net income (loss) per diluted share $2.64 $(2.13) $2.05 $0.63 $0.81 $2.79 $0.25 $5.74 $5.47
See “Financial Measures” in earnings press release for a discussion of non-GAAP Financial Measures
Totals may not sum due to rounding
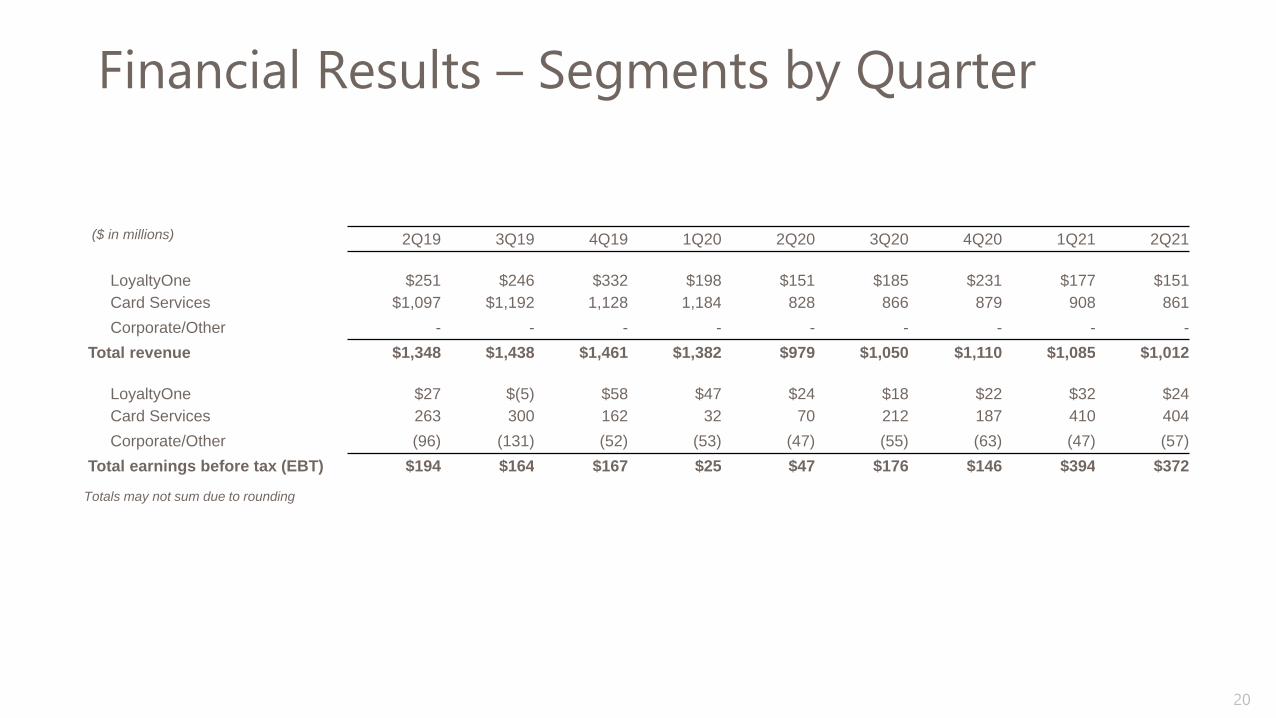
Financial Results – Segments by Quarter
20
($ in millions) 2Q19 3Q19 4Q19 1Q20 2Q20 3Q20 4Q20 1Q21 2Q21
LoyaltyOne $251 $246 $332 $198 $151 $185 $231 $177 $151
Card Services $1,097 $1,192 1,128 1,184 828 866 879 908 861
Corporate/Other - - - - - - - - -
Total revenue $1,348 $1,438 $1,461 $1,382 $979 $1,050 $1,110 $1,085 $1,012
LoyaltyOne $27 $(5) $58 $47 $24 $18 $22 $32 $24
Card Services 263 300 162 32 70 212 187 410 404
Corporate/Other (96) (131) (52) (53) (47) (55) (63) (47) (57)
Total earnings before tax (EBT) $194 $164 $167 $25 $47 $176 $146 $394 $372
Totals may not sum due to rounding
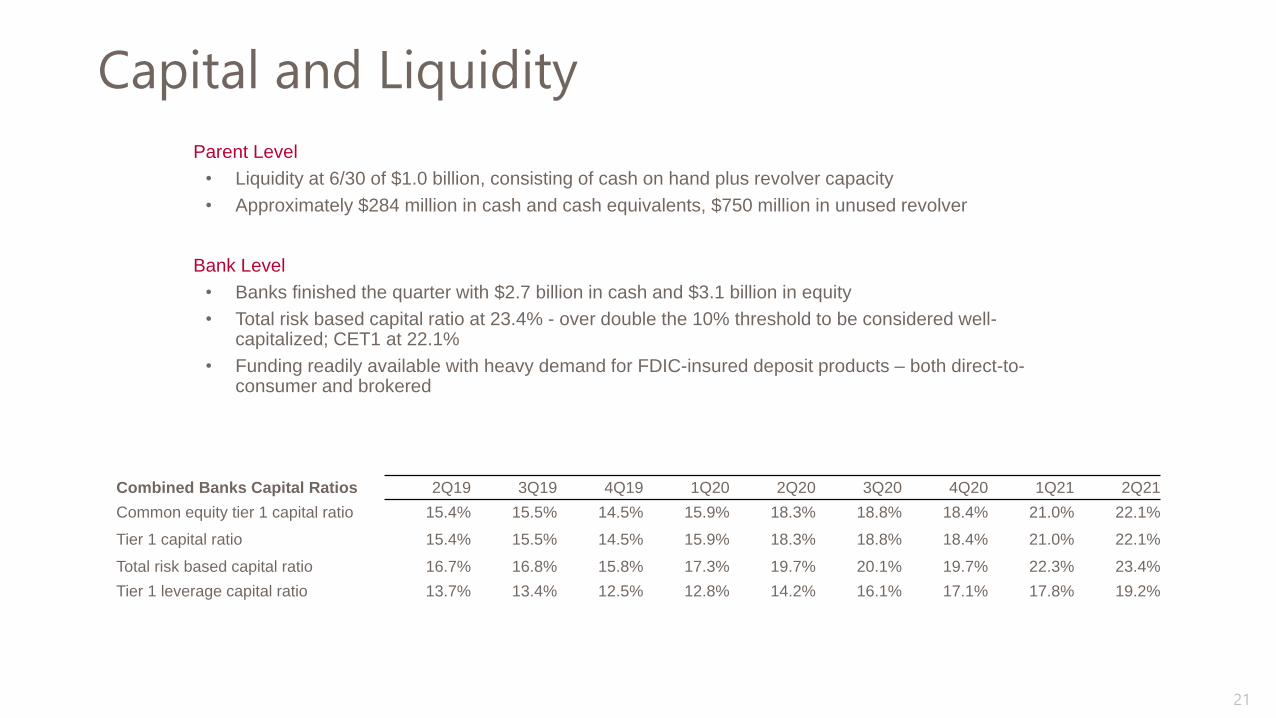
Capital and Liquidity
21
Combined Banks Capital Ratios 2Q19 3Q19 4Q19 1Q20 2Q20 3Q20 4Q20 1Q21 2Q21
Common equity tier 1 capital ratio 15.4% 15.5% 14.5% 15.9% 18.3% 18.8% 18.4% 21.0% 22.1%
Tier 1 capital ratio 15.4% 15.5% 14.5% 15.9% 18.3% 18.8% 18.4% 21.0% 22.1%
Total risk based capital ratio 16.7% 16.8% 15.8% 17.3% 19.7% 20.1% 19.7% 22.3% 23.4%
Tier 1 leverage capital ratio 13.7% 13.4% 12.5% 12.8% 14.2% 16.1% 17.1% 17.8% 19.2%
Parent Level
• Liquidity at 6/30 of $1.0 billion, consisting of cash on hand plus revolver capacity
• Approximately $284 million in cash and cash equivalents, $750 million in unused revolver
Bank Level
• Banks finished the quarter with $2.7 billion in cash and $3.1 billion in equity
• Total risk based capital ratio at 23.4% - over double the 10% threshold to be considered well-capitalized; CET1 at 22.1%
• Funding readily available with heavy demand for FDIC-insured deposit products – both direct-to-consumer and brokered
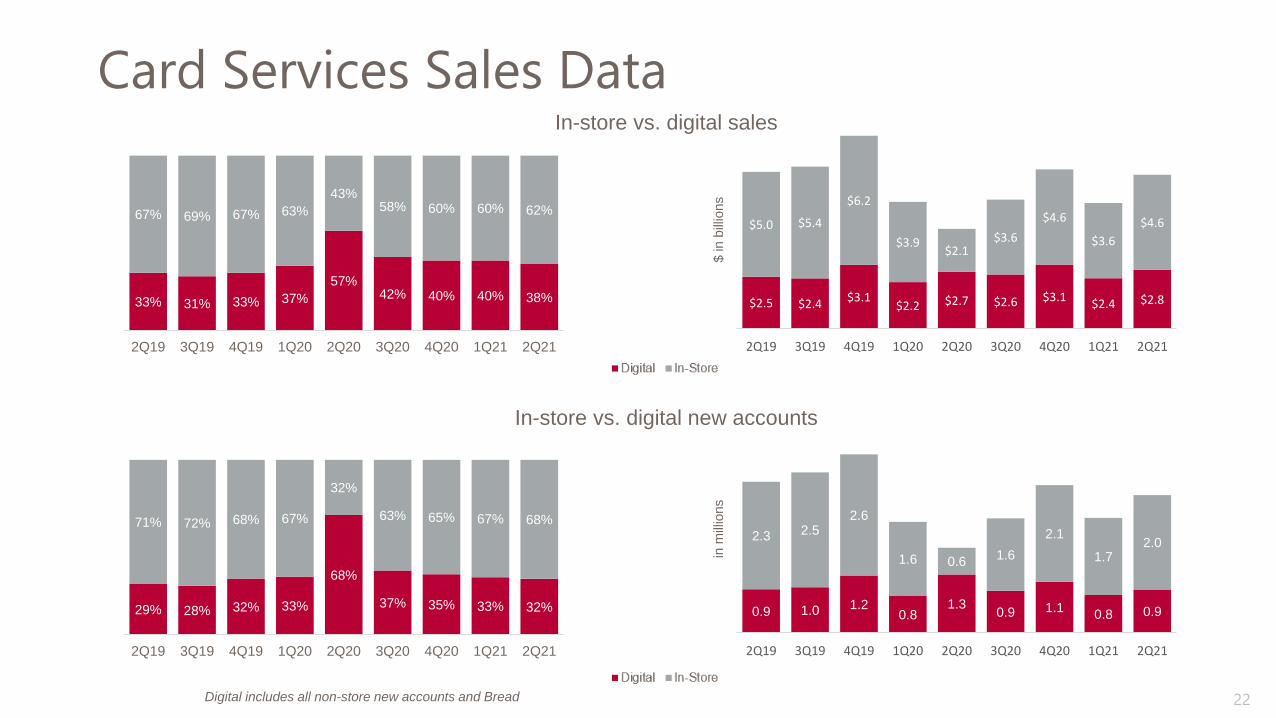
Card Services Sales Data
22
In-store vs. digital sales
33% 31% 33% 37%
57%42% 40% 40% 38%
67% 69% 67% 63%
43%58% 60% 60% 62%
2Q19 3Q19 4Q19 1Q20 2Q20 3Q20 4Q20 1Q21 2Q21
$2.5 $2.4$3.1
$2.2 $2.7 $2.6 $3.1$2.4 $2.8
$5.0 $5.4
$6.2
$3.9$2.1
$3.6
$4.6
$3.6
$4.6
2Q19 3Q19 4Q19 1Q20 2Q20 3Q20 4Q20 1Q21 2Q21
Digital includes all non-store new accounts and Bread
$ in
bill
ion
s
29% 28% 32% 33%
68%
37% 35% 33% 32%
71% 72% 68% 67%
32%
63% 65% 67% 68%
2Q19 3Q19 4Q19 1Q20 2Q20 3Q20 4Q20 1Q21 2Q21
In-store vs. digital new accounts
0.9 1.0 1.20.8
1.30.9 1.1
0.8 0.9
2.3 2.52.6
1.6 0.61.6
2.1
1.72.0
2Q19 3Q19 4Q19 1Q20 2Q20 3Q20 4Q20 1Q21 2Q21
in m
illio
ns
Reconciliation of Non-GAAP Information
23
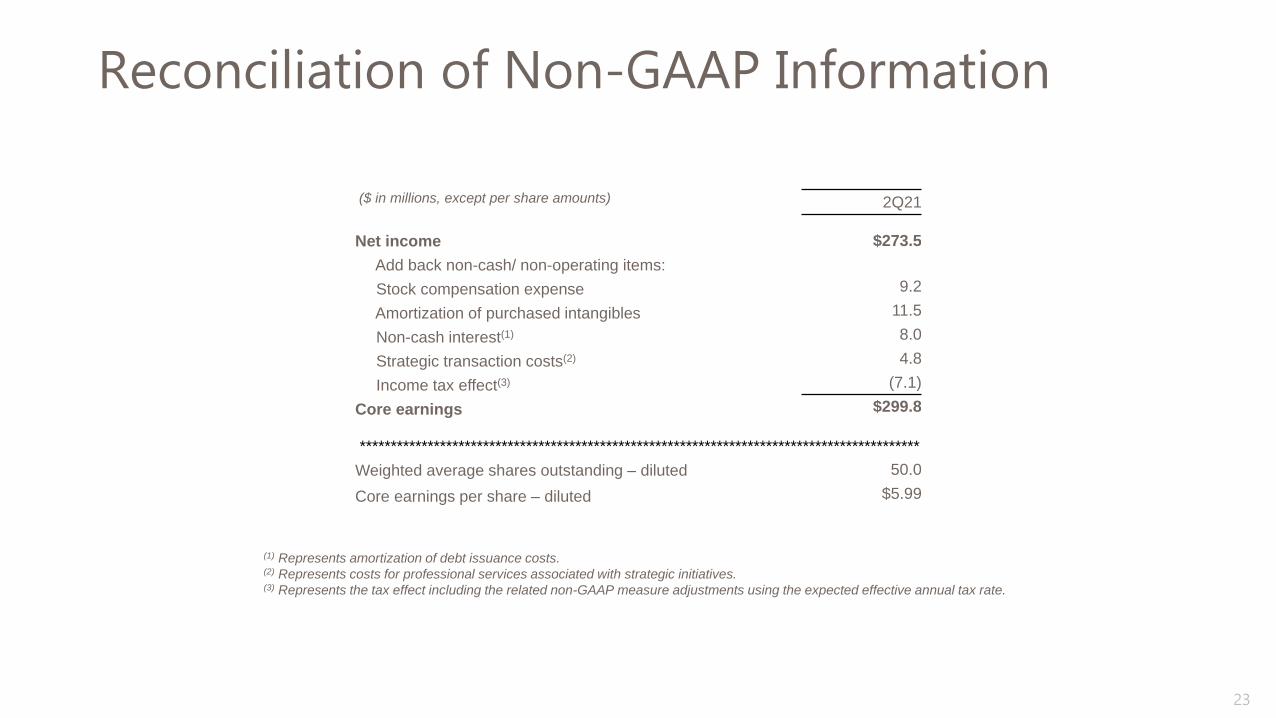
(1) Represents amortization of debt issuance costs.(2) Represents costs for professional services associated with strategic initiatives.(3) Represents the tax effect including the related non-GAAP measure adjustments using the expected effective annual tax rate.
($ in millions, except per share amounts) 2Q21
Net income $273.5
Add back non-cash/ non-operating items:
Stock compensation expense 9.2
Amortization of purchased intangibles 11.5
Non-cash interest(1) 8.0
Strategic transaction costs(2) 4.8
Income tax effect(3) (7.1)
Core earnings $299.8
*******************************************************************************************
Weighted average shares outstanding – diluted 50.0
Core earnings per share – diluted $5.99
Reconciliation of Non-GAAP Information
24
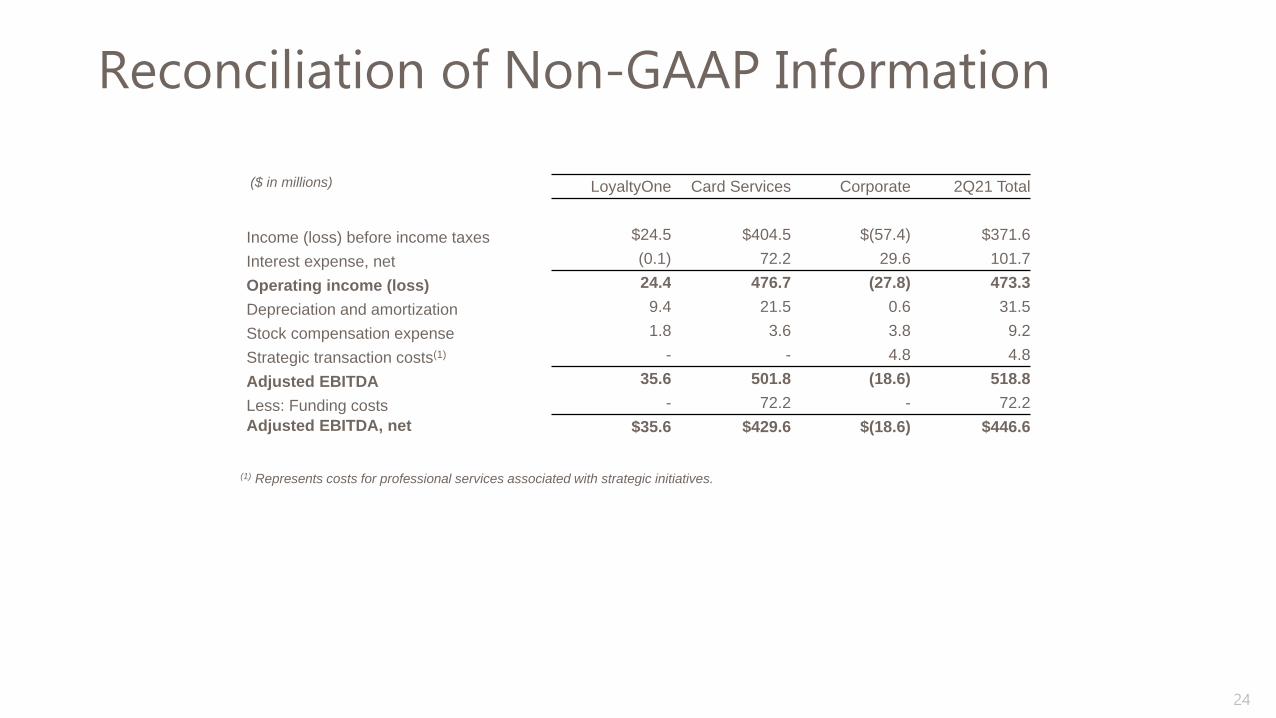
(1) Represents costs for professional services associated with strategic initiatives.
($ in millions) LoyaltyOne Card Services Corporate 2Q21 Total
Income (loss) before income taxes $24.5 $404.5 $(57.4) $371.6
Interest expense, net (0.1) 72.2 29.6 101.7
Operating income (loss) 24.4 476.7 (27.8) 473.3
Depreciation and amortization 9.4 21.5 0.6 31.5
Stock compensation expense 1.8 3.6 3.8 9.2
Strategic transaction costs(1) - - 4.8 4.8
Adjusted EBITDA 35.6 501.8 (18.6) 518.8
Less: Funding costs - 72.2 - 72.2
Adjusted EBITDA, net $35.6 $429.6 $(18.6) $446.6
25
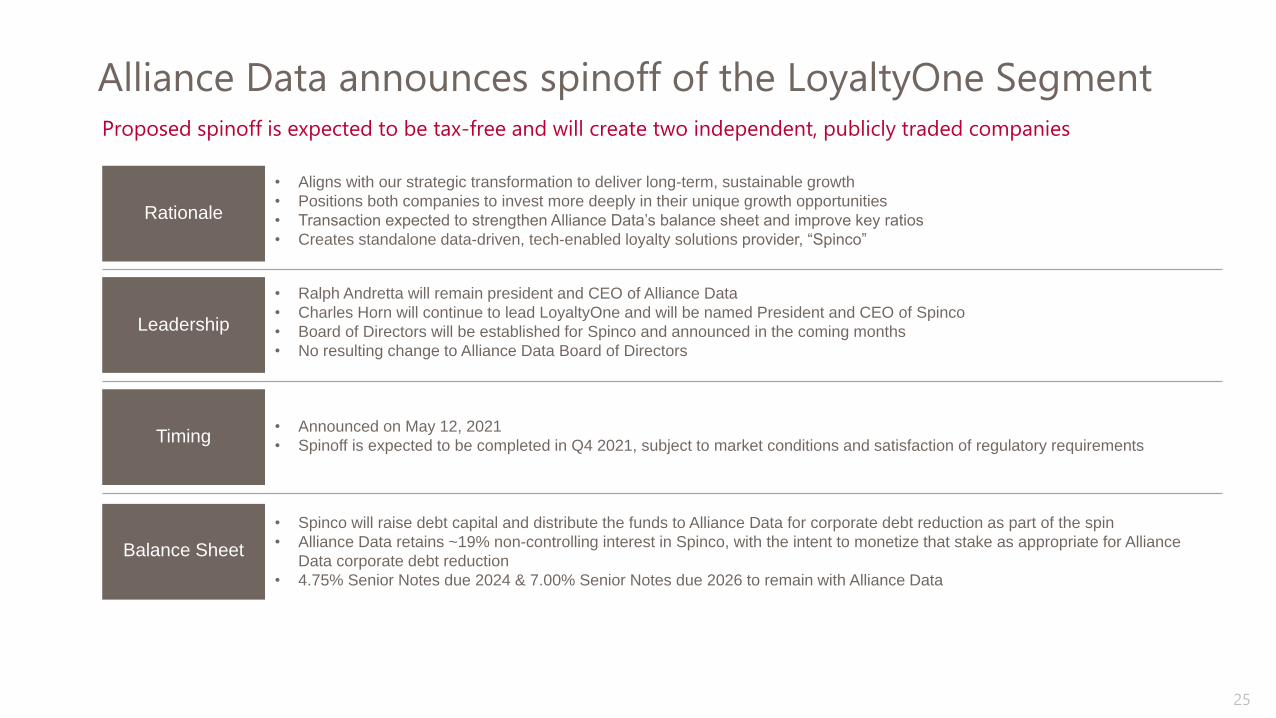
Alliance Data announces spinoff of the LoyaltyOne SegmentProposed spinoff is expected to be tax-free and will create two independent, publicly traded companies
Rationale
Leadership
Timing
• Aligns with our strategic transformation to deliver long-term, sustainable growth
• Positions both companies to invest more deeply in their unique growth opportunities
• Transaction expected to strengthen Alliance Data’s balance sheet and improve key ratios
• Creates standalone data-driven, tech-enabled loyalty solutions provider, “Spinco”
• Ralph Andretta will remain president and CEO of Alliance Data
• Charles Horn will continue to lead LoyaltyOne and will be named President and CEO of Spinco
• Board of Directors will be established for Spinco and announced in the coming months
• No resulting change to Alliance Data Board of Directors
• Announced on May 12, 2021
• Spinoff is expected to be completed in Q4 2021, subject to market conditions and satisfaction of regulatory requirements
• Spinco will raise debt capital and distribute the funds to Alliance Data for corporate debt reduction as part of the spin
• Alliance Data retains ~19% non-controlling interest in Spinco, with the intent to monetize that stake as appropriate for Alliance
Data corporate debt reduction
• 4.75% Senior Notes due 2024 & 7.00% Senior Notes due 2026 to remain with Alliance Data
Balance Sheet