Embed Size (px)
Citation preview
Allocation of CO2 Emission Allowances in RGGI
Dallas Burtraw, Karen Palmer, Danny KahnResources for the Future
Presentation to RGGI Stakeholder MeetingApril 6, 2005
Thanks to: The Energy Foundation, The Packard Foundation and New York Community Trust
Project Goals
1) Measure cost of various approaches to initial distribution of allowances. We do not consider costs outside the electricity sector.
2) Describe distributional consequences between consumers and producers, and among producers.
3) Identify ancillary effects and other considerations.
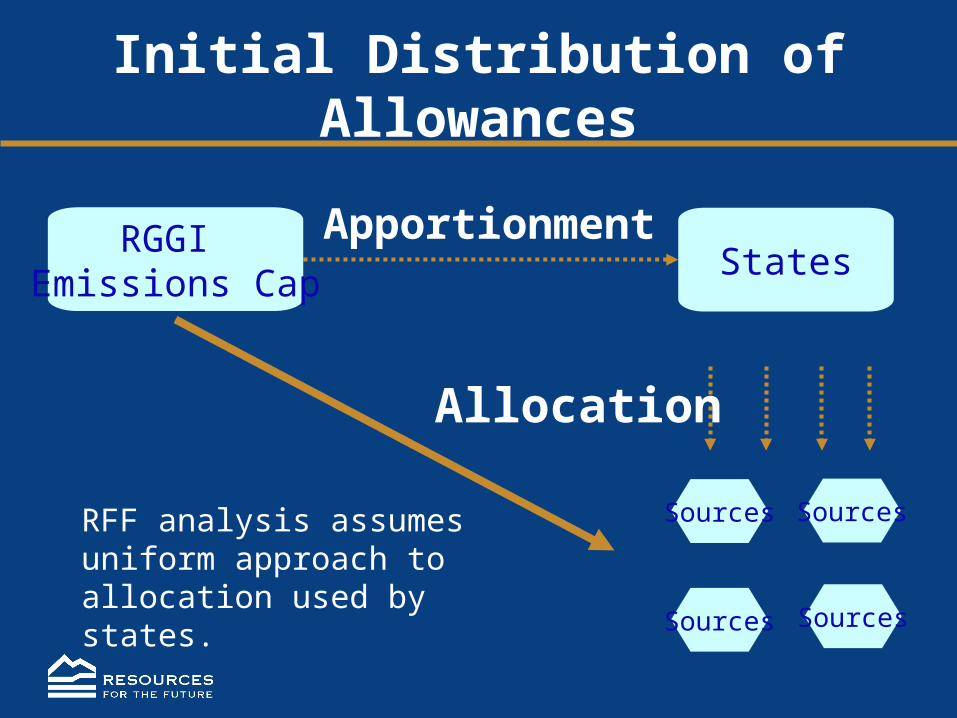
Initial Distribution of Allowances
Sources
Sources
Sources
Sources
RGGI Emissions Cap
StatesApportionment
Allocation
RFF analysis assumes uniform approach to allocation used by states.
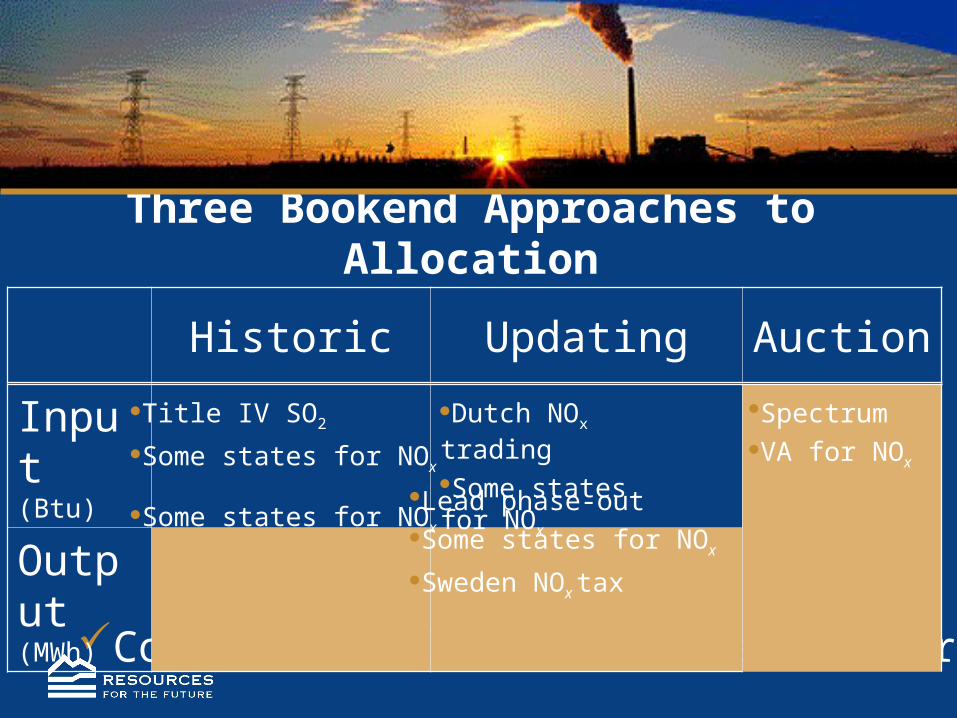
Three Bookend Approaches to Allocation
Historic Updating Auction
Common formula across fuels, sources?
Input(Btu)
Output(MWh)
Title IV SO2
Some states for NOx
Some states for NOx
Dutch NOx trading
Some states for NOx
Lead phase-outSome states for NOx
Sweden NOx tax
Spectrum VA for NOx
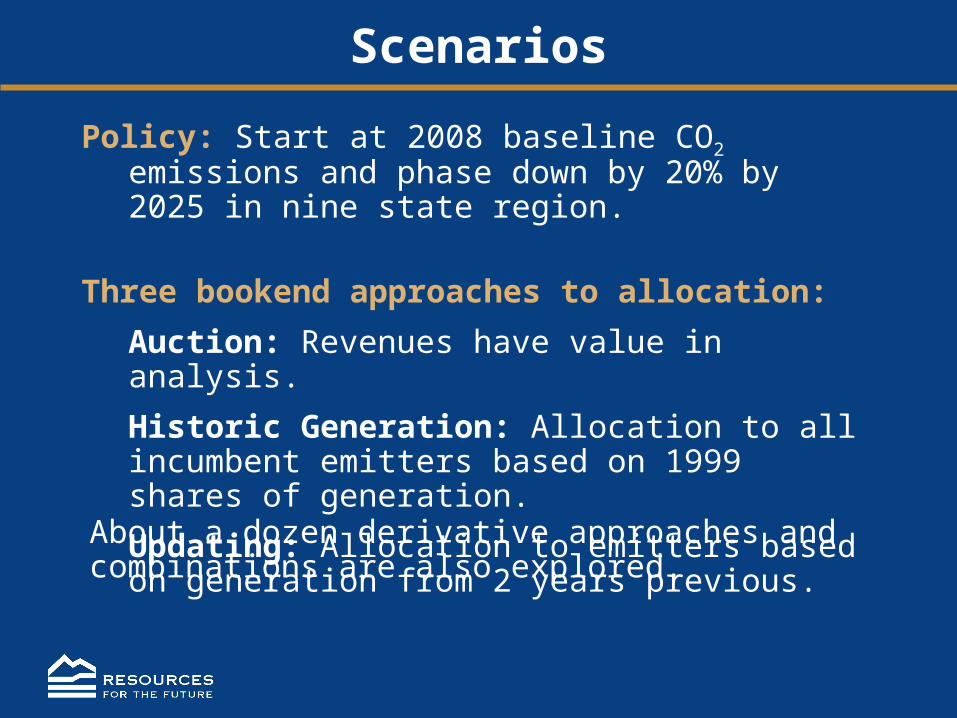
Scenarios
Policy: Start at 2008 baseline CO2 emissions and phase down by 20% by 2025 in nine state region.
Three bookend approaches to allocation:
Auction: Revenues have value in analysis.
Historic Generation: Allocation to all incumbent emitters based on 1999 shares of generation.
Updating: Allocation to emitters based on generation from 2 years previous.
About a dozen derivative approaches and combinations are also explored.
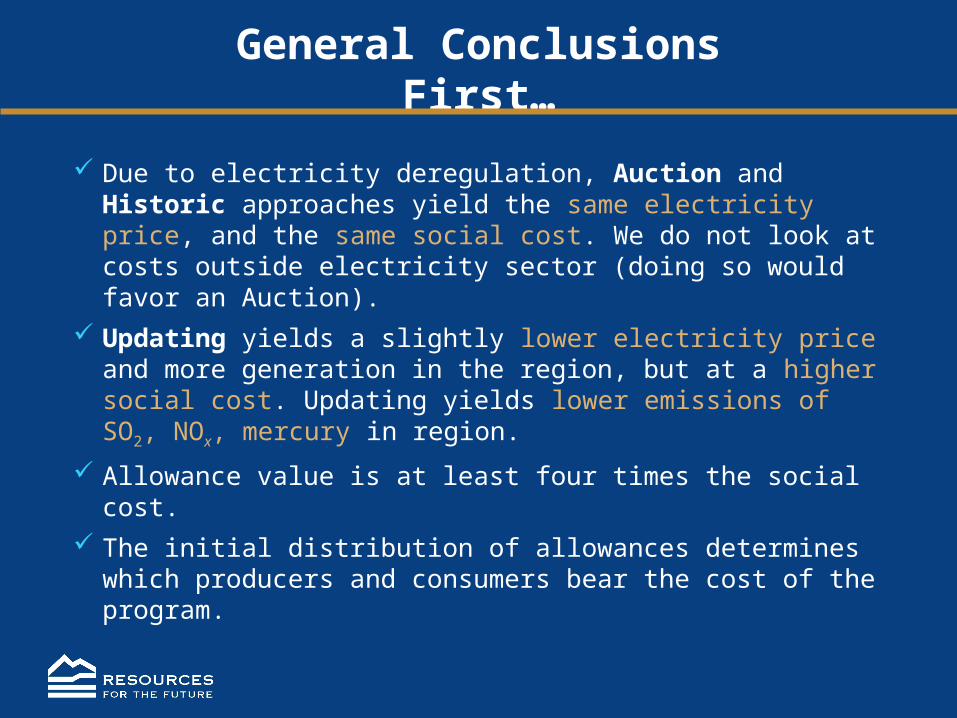
General Conclusions First…
Due to electricity deregulation, Auction and Historic approaches yield the same electricity price, and the same social cost. We do not look at costs outside electricity sector (doing so would favor an Auction).
Updating yields a slightly lower electricity price and more generation in the region, but at a higher social cost. Updating yields lower emissions of SO2, NOx, mercury in region.
Allowance value is at least four times the social cost.
The initial distribution of allowances determines which producers and consumers bear the cost of the program.
1) Economic Efficiency
Generally, the Auction and Historic approaches are similar because of competitive pricing in northeast electricity markets.
The Auction and Historic approaches are more efficient than the Updating approach.
Substantial variety exists among Updating approaches, with some approaches also relatively efficient.
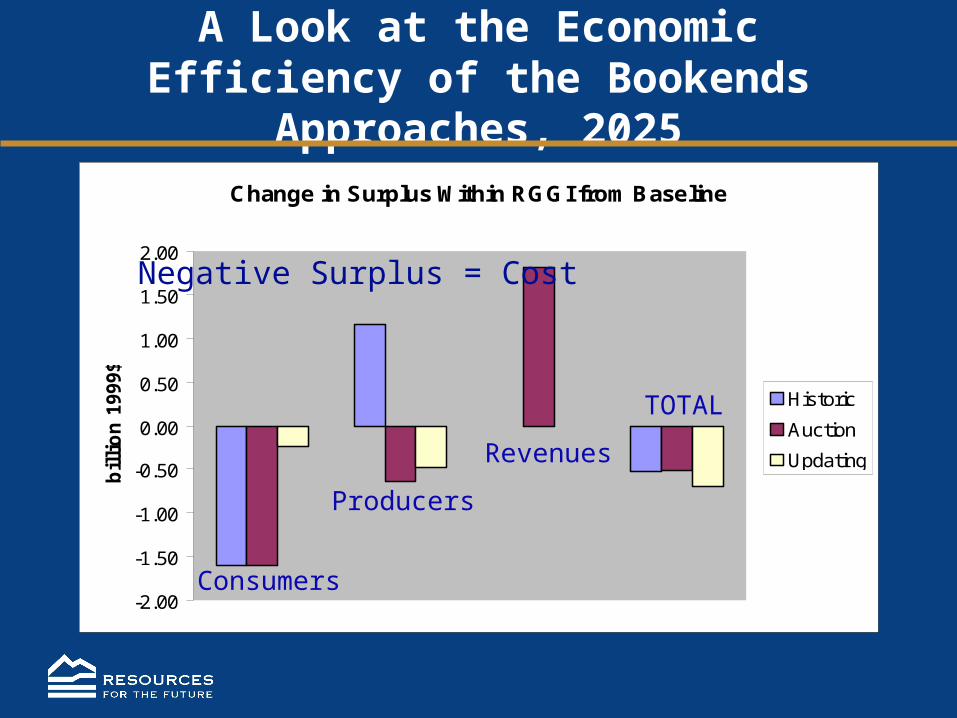
A Look at the Economic Efficiency of the Bookends Approaches, 2025
Change in Surplus Within RGGI from Baseline
-2.00
-1.50
-1.00
-0.50
0.00
0.50
1.00
1.50
2.00
bil
lio
n 1
999$
Historic
Auction
Updating
Consumers
TOTAL
Revenues
Producers
Negative Surplus = Cost
Additional Cases
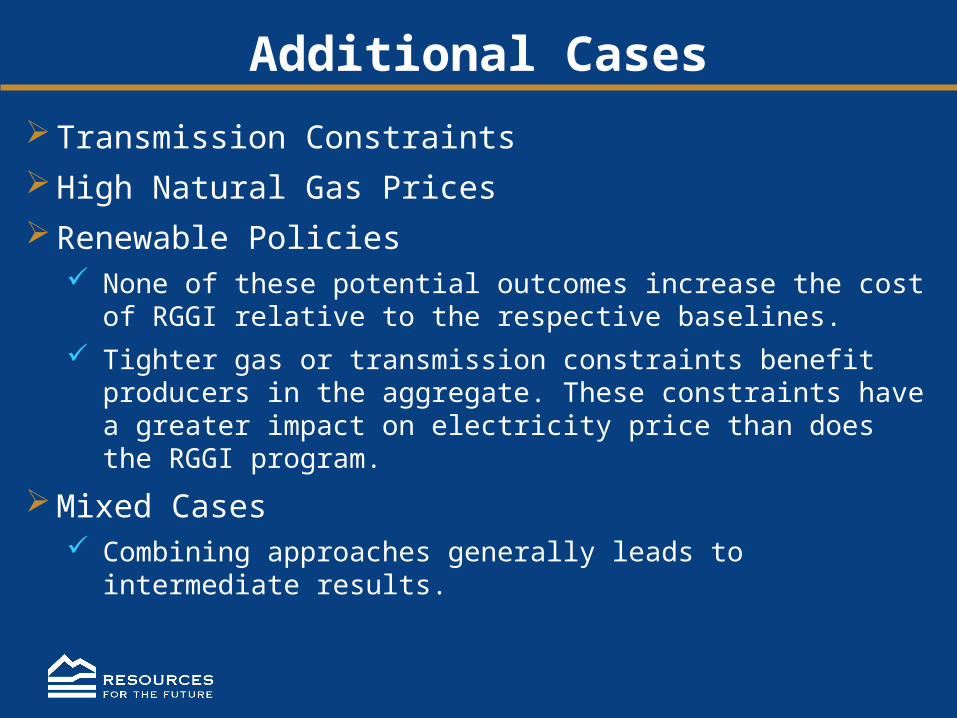
Transmission Constraints
High Natural Gas Prices
Renewable Policies None of these potential outcomes increase the cost of RGGI
relative to the respective baselines.
Tighter gas or transmission constraints benefit producers in the aggregate. These constraints have a greater impact on electricity price than does the RGGI program.
Mixed Cases Combining approaches generally leads to intermediate results.
2) Allowances as Compensation
Compensation is justification for free distribution. How much compensation is sufficient?
Firms charge consumers for using emission allowances, whether the allowances were received for free or at a cost.
Fixed price contracts mitigate the ability to pass through costs in the short run.
Are other segments of the economy/society also candidates for compensation?
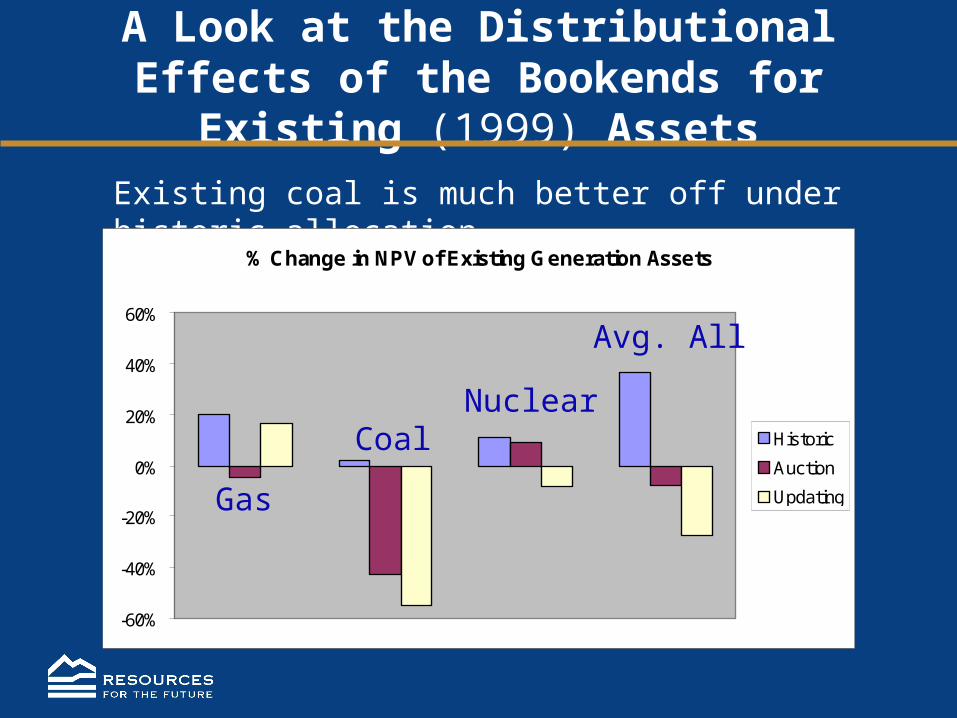
A Look at the Distributional Effects of the Bookends for Existing (1999) Assets
Existing coal is much better off under historic allocation
% Change in NPV of Existing Generation Assets
-60%
-40%
-20%
0%
20%
40%
60%
Historic
Auction
UpdatingGas
Avg. All
NuclearCoal
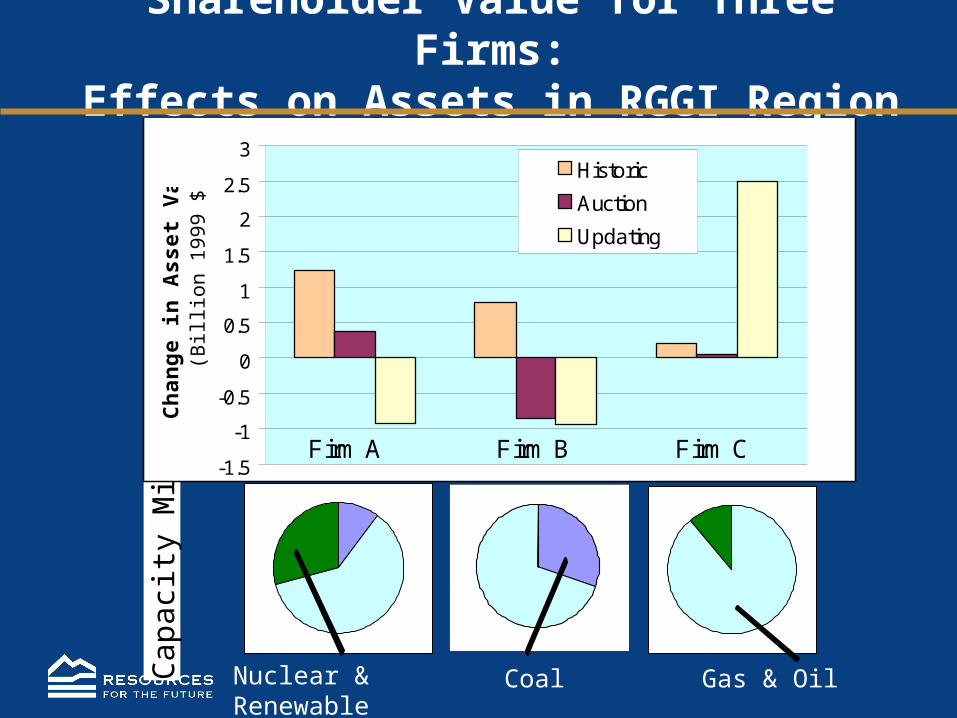
Shareholder Value for Three Firms:Effects on Assets in RGGI Region
Nuclear & Renewable Gas & Oil
Cap
acit
y M
ix
Coal
-1.5
-1
-0.5
0
0.5
1
1.5
2
2.5
3C
ha
ng
e in
As
se
t V
alu
e(B
illio
n 19
99 $
)Historic
Auction
Updating
Firm A Firm CFirm B
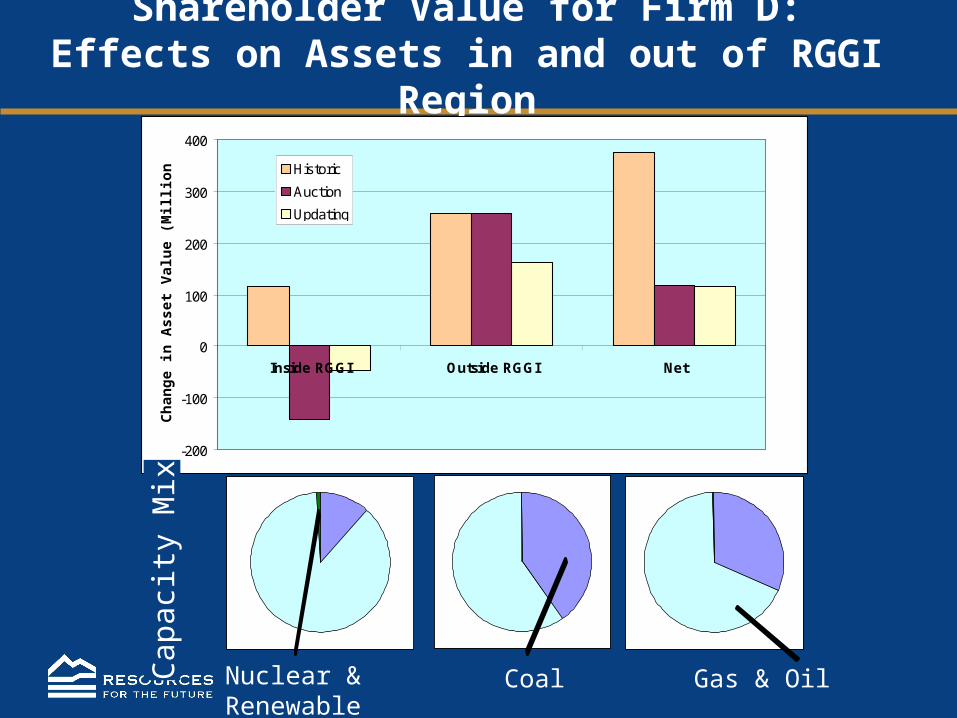
Shareholder Value for Firm D:Effects on Assets in and out of RGGI Region
-200
-100
0
100
200
300
400
Inside RGGI Outside RGGI Net
Ch
ang
e in
Ass
et V
alu
e (M
illi
on
199
9 $) Historic
Auction
Updating
Nuclear & Renewable Gas & Oil
Cap
acit
y M
ix
Coal
Expected emission reductions in the region are accelerated under RGGI policy. In the region emissions fall by roughly 40-45% under Auction and Historic approaches, and by 65-81% under Updating.
Capping CO2 emissions has the effect of lowering compliance cost for conventional pollutants (NOx, SO2, Hg) within RGGI.
Nearly $200 million in savings under Auction and Historic by 2025.
Over $400 million in savings for Updating by 2025.
3) Other considerations… Conventional Pollutants
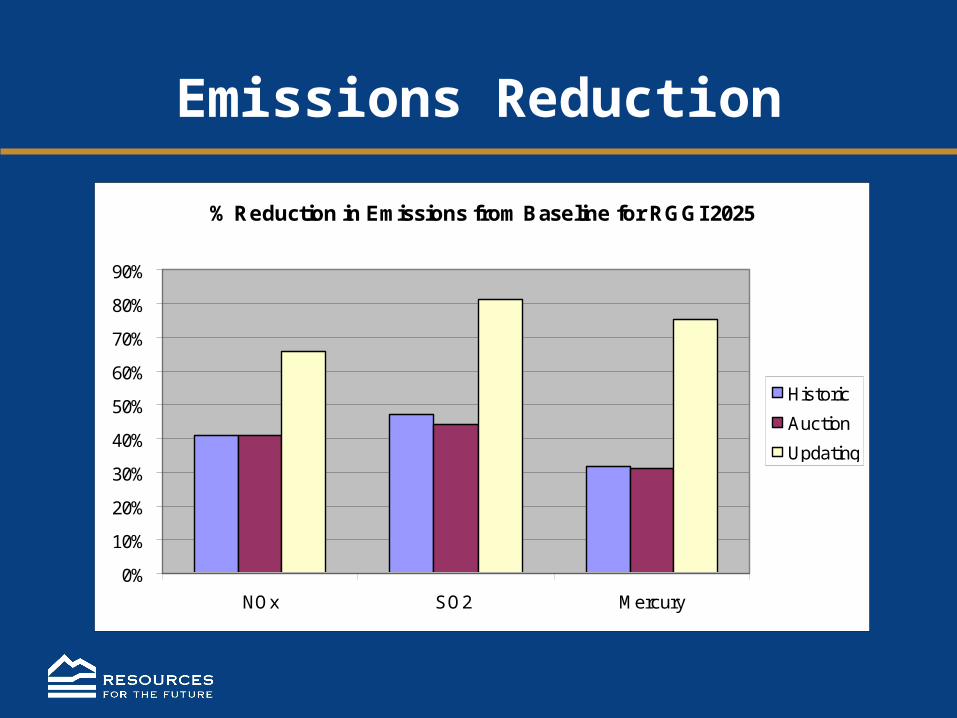
Emissions Reduction
% Reduction in Emissions from Baseline for RGGI 2025
0%
10%
20%
30%
40%
50%
60%
70%
80%
90%
NOx SO2 Mercury
Historic
Auction
Updating
Closing Observations
Auction, Historic are most efficient but Updating leads to lower electricity prices.
Change in shareholder value depends on the portfolio of assets. A firm may have facilities that lose and that gain value, inside and outside of the region.
Cost of the RGGI policy is not sensitive to natural gas or transmission constraints. Tighter constraints benefit producers in the aggregate in the baseline. These constraints have a greater impact on electricity price than does the RGGI program.
Combining approaches generally leads to intermediate results. We suggest the emphasis given to compensation versus
efficiency can differ between the short run and long run for RGGI planners.

For More Information
www.rff.org/multipollutant
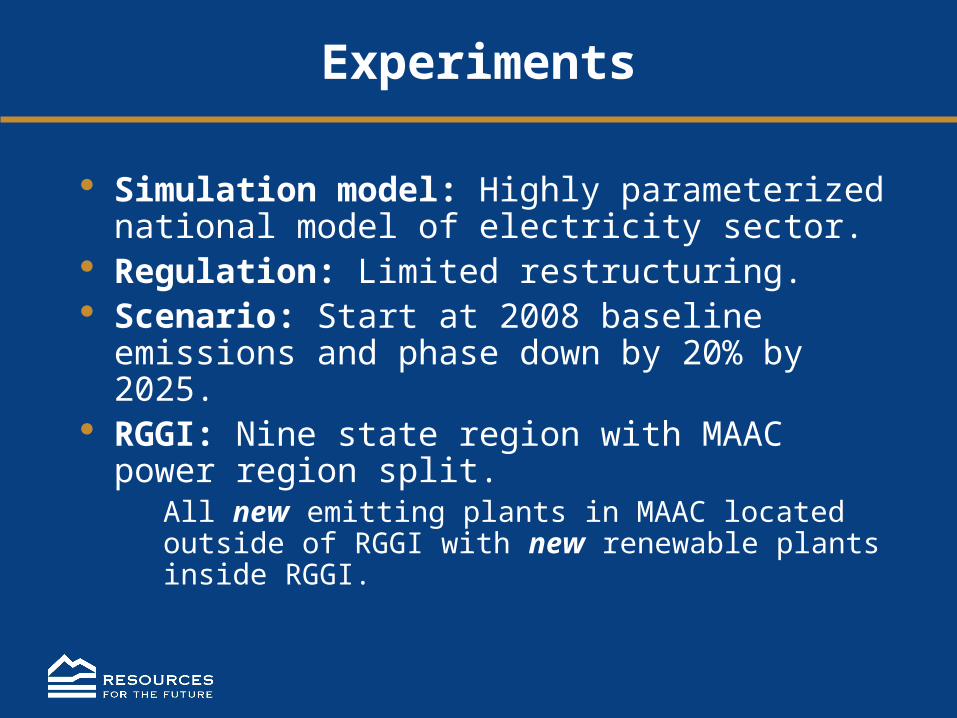
Experiments
Simulation model: Highly parameterized national model of electricity sector.
Regulation: Limited restructuring. Scenario: Start at 2008 baseline emissions and
phase down by 20% by 2025. RGGI: Nine state region with MAAC power region
split. All new emitting plants in MAAC located outside of RGGI with new renewable plants inside RGGI.
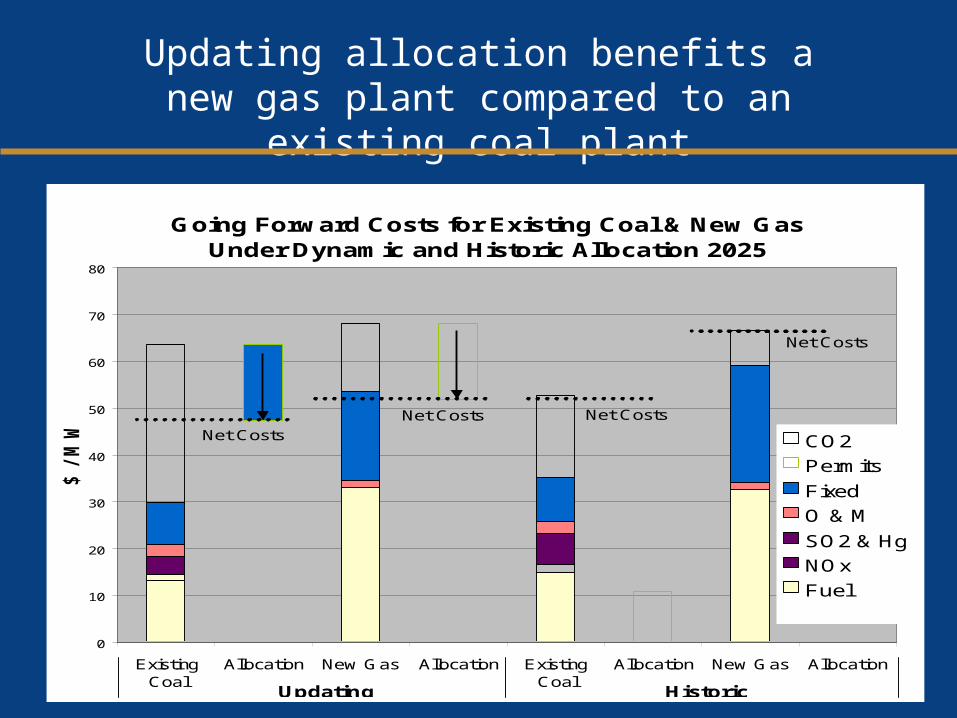
Going Forward Costs for Existing Coal & New Gas Under Dynamic and Historic Allocation 2025
0
10
20
30
40
50
60
70
80
ExistingCoal
Allocation New Gas Allocation ExistingCoal
Allocation New Gas Allocation
$ / M
WH
CO2
Permits
Fixed
O & M
SO2 & Hg
NOx
Fuel
Updating Historic
Net Costs
Net Costs
Net Costs
Net Costs
Updating allocation benefits a new gas plant compared to an existing coal plant
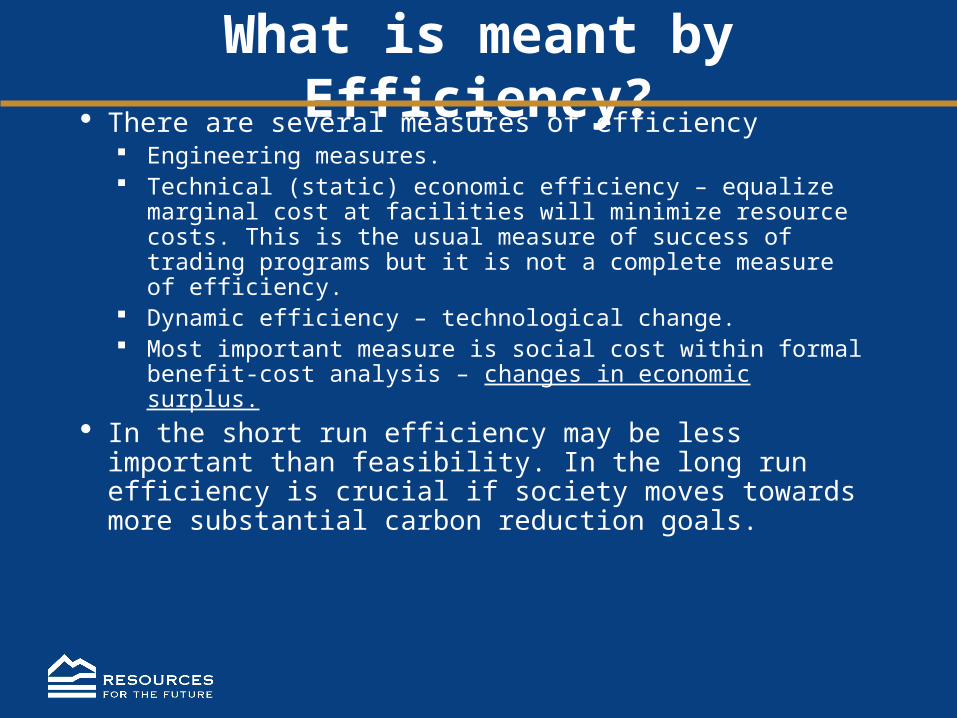
What is meant by Efficiency? There are several measures of efficiency
Engineering measures. Technical (static) economic efficiency – equalize marginal
cost at facilities will minimize resource costs. This is the usual measure of success of trading programs but it is not a complete measure of efficiency.
Dynamic efficiency – technological change. Most important measure is social cost within formal benefit-
cost analysis – changes in economic surplus. In the short run efficiency may be less important than
feasibility. In the long run efficiency is crucial if society moves towards more substantial carbon reduction goals.
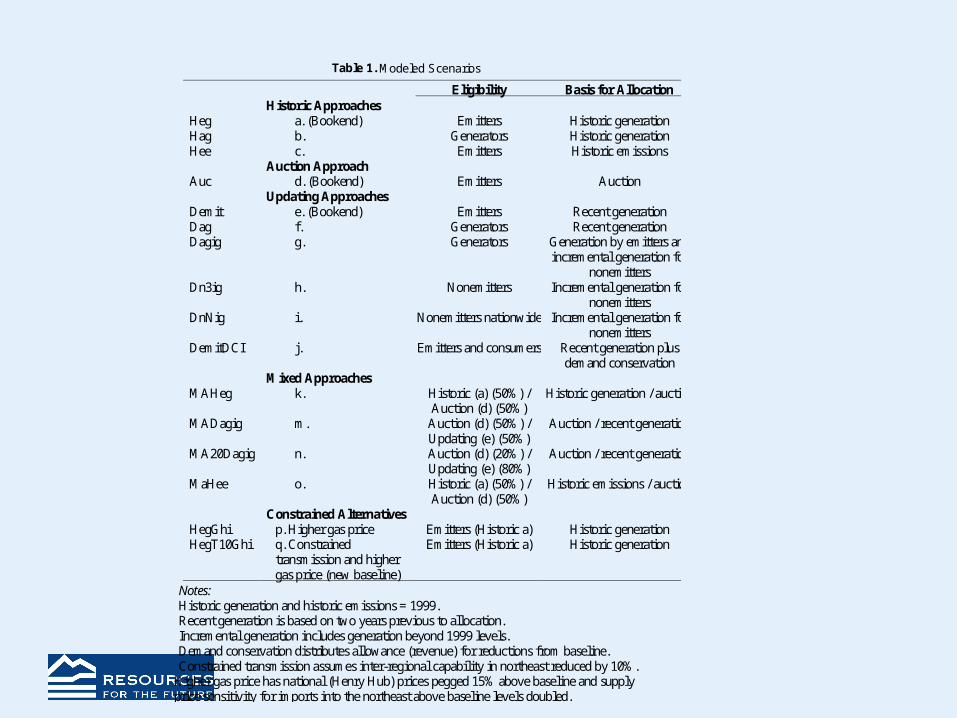
Table 1. Modeled Scenarios
Eligibility Basis for Allocation Historic Approaches Heg a. (Bookend) Emitters Historic generation Hag b. Generators Historic generation Hee c. Emitters Historic emissions Auction Approach Auc d. (Bookend) Emitters Auction Updating Approaches Demit e. (Bookend) Emitters Recent generation Dag f. Generators Recent generation Dagig g. Generators Generation by emitters and
incremental generation for nonemitters
Dn3ig h. Nonemitters Incremental generation for nonemitters
DnNig i. Nonemitters nationwide Incremental generation for nonemitters
DemitDCI j. Emitters and consumers Recent generation plus demand conservation
Mixed Approaches MAHeg k. Historic (a) (50%) /
Auction (d) (50%) Historic generation / auction
MADagig m. Auction (d) (50%) / Updating (e) (50%)
Auction / recent generation
MA20Dagig n. Auction (d) (20%) / Updating (e) (80%)
Auction / recent generation
MaHee o. Historic (a) (50%) / Auction (d) (50%)
Historic emissions / auction
Constrained Alternatives HegGhi p. Higher gas price Emitters (Historic a) Historic generation HegT10Ghi q. Constrained
transmission and higher gas price (new baseline)
Emitters (Historic a) Historic generation
Notes: Historic generation and historic emissions = 1999. Recent generation is based on two years previous to allocation. Incremental generation includes generation beyond 1999 levels. Demand conservation distributes allowance (revenue) for reductions from baseline. Constrained transmission assumes inter-regional capability in northeast reduced by 10%.
Higher gas price has national (Henry Hub) prices pegged 15% above baseline and supply price sensitivity for imports into the northeast above baseline levels doubled.
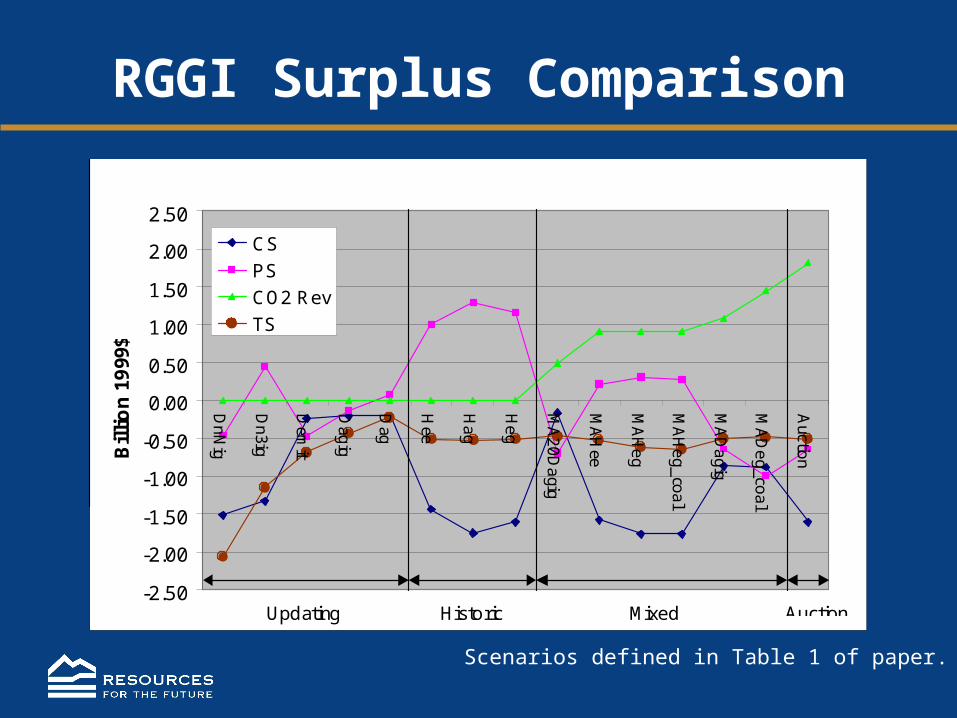
RGGI Surplus Comparison
-2.50
-2.00
-1.50
-1.00
-0.50
0.00
0.50
1.00
1.50
2.00
2.50
Dn
Nig
Dn
3ig
Dem
it
Dag
ig
Dag
Hee
Ha
g
He
g
MA
20
Da
gig
MA
Hee
MA
He
g
MA
He
g_
coa
l
MA
Da
gig
MA
De
g_co
al
Auctio
nBil
lio
n 1
999
$
CS
PS
CO2 Rev
TS
Updating Historic Mixed Auction
Scenarios defined in Table 1 of paper.
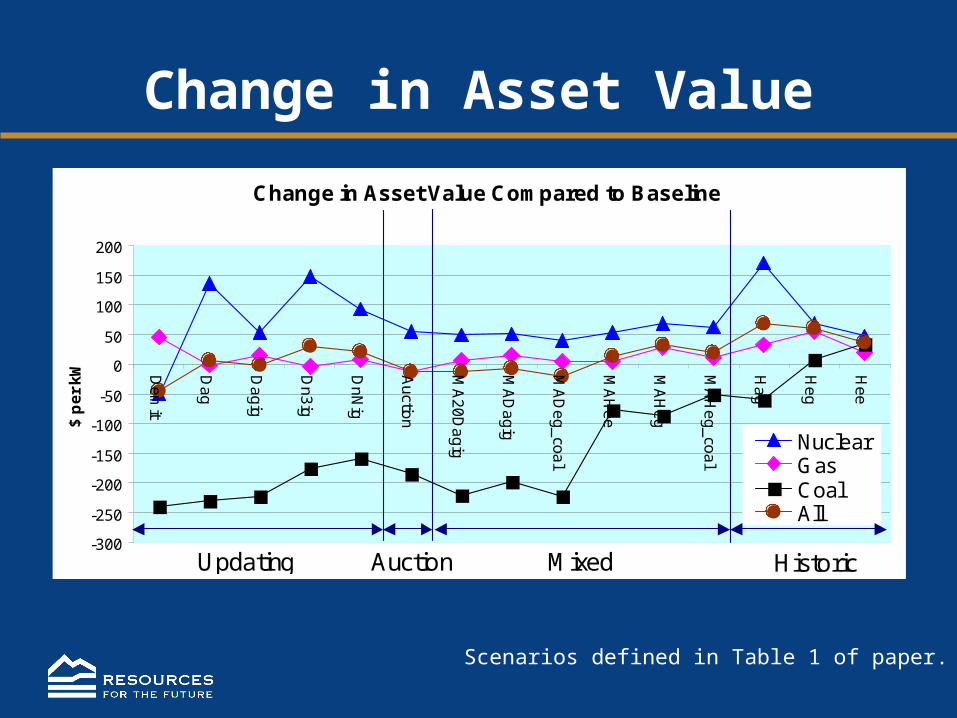
Change in Asset Value
Scenarios defined in Table 1 of paper.
Change in Asset Value Compared to Baseline
-300
-250
-200
-150
-100
-50
0
50
100
150
200
De
mit
Da
g
Da
gig
Dn
3ig
Dn
Nig
Au
ction
MA
20
Da
gig
MA
Da
gig
MA
De
g_
coa
l
MA
He
e
MA
He
g
MA
He
g_
coa
l
Ha
g
He
g
He
e$
pe
r k
W
NuclearGasCoalAll
Updating HistoricMixed Auction
Limitations in Bookend Analysis
Electricity imports from Canada do not change. Out-of-merit-order dispatch due to long-term fuel
contracts is captured only approximately. We do not capture long-term contracts for nuclear.
Intra-regional transmission constraints are captured only partly.
We examine higher natural gas prices, renewable policies, imports from Canada and transmission constraints in sensitivity analysis.