Embed Size (px)
Citation preview

AllocationMaster Report
Prepared for:
American Research Institute in Turkey(50/50 Allocation- 4% Spend)
March 04, 2011
Prepared by:
Stephen Larkin
1735 MARKET STPhiladelphia, PA 19103-7589
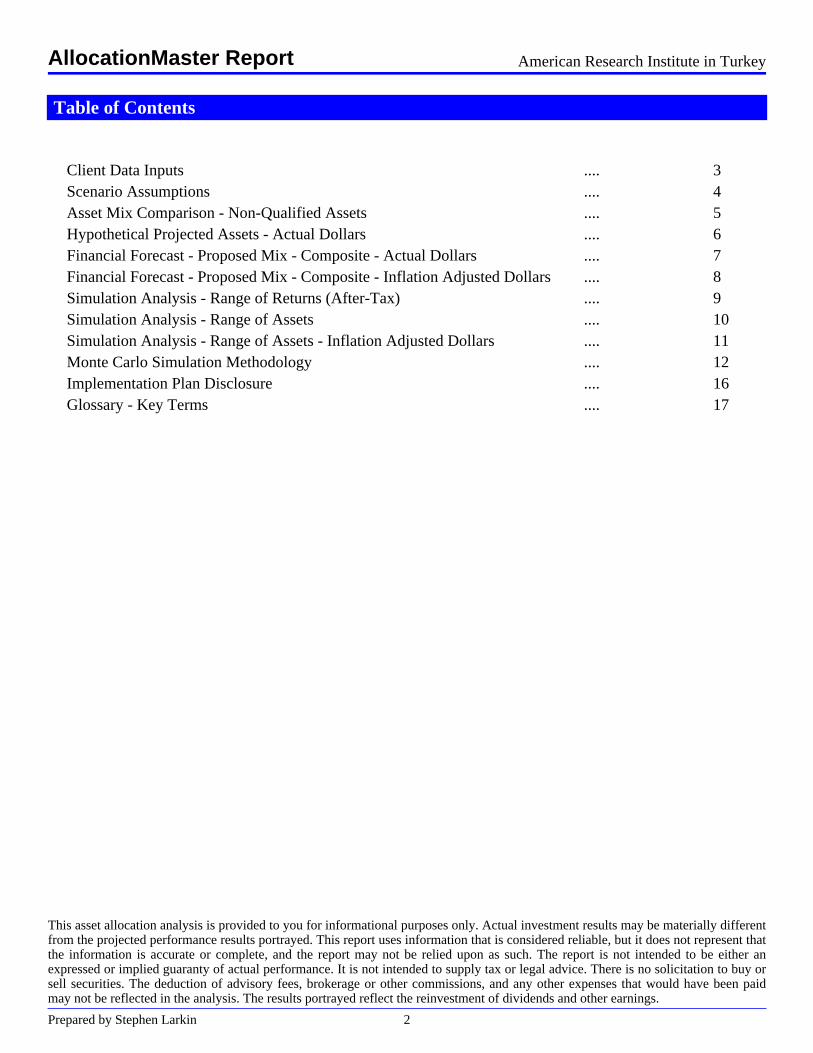
Table of Contents
Client Data Inputs .... 3Scenario Assumptions .... 4Asset Mix Comparison - Non-Qualified Assets .... 5Hypothetical Projected Assets - Actual Dollars .... 6Financial Forecast - Proposed Mix - Composite - Actual Dollars .... 7Financial Forecast - Proposed Mix - Composite - Inflation Adjusted Dollars .... 8Simulation Analysis - Range of Returns (After-Tax) .... 9Simulation Analysis - Range of Assets .... 10Simulation Analysis - Range of Assets - Inflation Adjusted Dollars .... 11Monte Carlo Simulation Methodology .... 12Implementation Plan Disclosure .... 16Glossary - Key Terms .... 17
This asset allocation analysis is provided to you for informational purposes only. Actual investment results may be materially differentfrom the projected performance results portrayed. This report uses information that is considered reliable, but it does not represent thatthe information is accurate or complete, and the report may not be relied upon as such. The report is not intended to be either anexpressed or implied guaranty of actual performance. It is not intended to supply tax or legal advice. There is no solicitation to buy orsell securities. The deduction of advisory fees, brokerage or other commissions, and any other expenses that would have been paidmay not be reflected in the analysis. The results portrayed reflect the reinvestment of dividends and other earnings.
AllocationMaster Report American Research Institute in Turkey
Prepared by Stephen Larkin 2

Client Data Inputs
Federal Income Tax Rate:State Income Tax Rate:Federal Capital Gains Tax Rate:State Capital Gains Tax Rate:
0.00%0.00%0.00%0.00%
Non-Qualified Fee:Qualified Fee:Non-Qual Tax-Deferred Fee:
1.25%1.25%1.25%
Future Federal Income Tax Rate:Future State Income Tax Rate:Future Federal Capital Gains Tax Rate:Future State Capital Gains Tax Rate:
Starting Year:
0.00%0.00%0.00%0.00%
2011
Non-Qualified Assets
Market % of Cost # ofAsset Class Product Name Value Total Basis Shares Hold Symbol
Cash Equivalents $1,525,833 100% $1,525,833 0.0 No
Total* $1,525,833
Qualified Assets
Market % of Cost # ofAsset Class Product Name Value Total Basis Shares Hold Symbol
Total* $0
Other Spending Goals
Spend 4.00% of Non-Qual Market Value
*The amount shown includes only those assets that have been assigned to an asset class.
AllocationMaster Report American Research Institute in Turkey
Prepared by Stephen Larkin 3

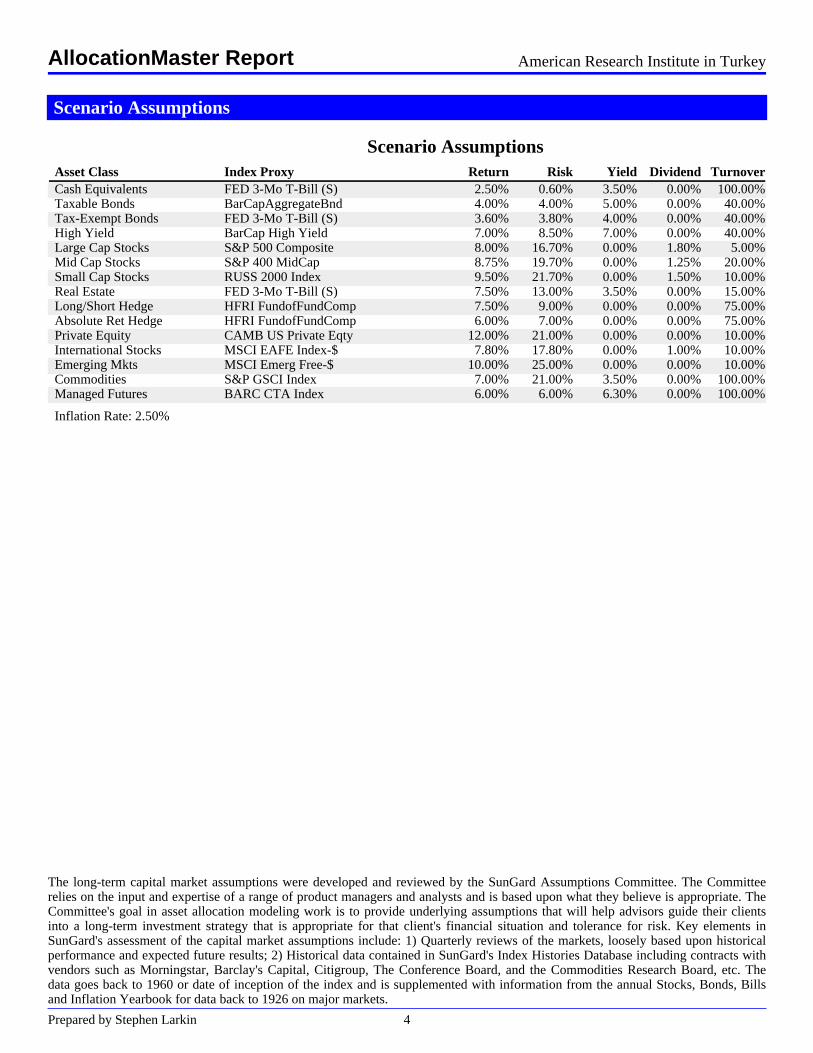
Scenario Assumptions
Scenario AssumptionsAsset Class Index Proxy Return Risk Yield Dividend TurnoverCash Equivalents FED 3-Mo T-Bill (S) 2.50% 0.60% 3.50% 0.00% 100.00%Taxable Bonds BarCapAggregateBnd 4.00% 4.00% 5.00% 0.00% 40.00%Tax-Exempt Bonds FED 3-Mo T-Bill (S) 3.60% 3.80% 4.00% 0.00% 40.00%High Yield BarCap High Yield 7.00% 8.50% 7.00% 0.00% 40.00%Large Cap Stocks S&P 500 Composite 8.00% 16.70% 0.00% 1.80% 5.00%Mid Cap Stocks S&P 400 MidCap 8.75% 19.70% 0.00% 1.25% 20.00%Small Cap Stocks RUSS 2000 Index 9.50% 21.70% 0.00% 1.50% 10.00%Real Estate FED 3-Mo T-Bill (S) 7.50% 13.00% 3.50% 0.00% 15.00%Long/Short Hedge HFRI FundofFundComp 7.50% 9.00% 0.00% 0.00% 75.00%Absolute Ret Hedge HFRI FundofFundComp 6.00% 7.00% 0.00% 0.00% 75.00%Private Equity CAMB US Private Eqty 12.00% 21.00% 0.00% 0.00% 10.00%International Stocks MSCI EAFE Index-$ 7.80% 17.80% 0.00% 1.00% 10.00%Emerging Mkts MSCI Emerg Free-$ 10.00% 25.00% 0.00% 0.00% 10.00%Commodities S&P GSCI Index 7.00% 21.00% 3.50% 0.00% 100.00%Managed Futures BARC CTA Index 6.00% 6.00% 6.30% 0.00% 100.00%
Inflation Rate: 2.50%
The long-term capital market assumptions were developed and reviewed by the SunGard Assumptions Committee. The Committeerelies on the input and expertise of a range of product managers and analysts and is based upon what they believe is appropriate. TheCommittee's goal in asset allocation modeling work is to provide underlying assumptions that will help advisors guide their clientsinto a long-term investment strategy that is appropriate for that client's financial situation and tolerance for risk. Key elements inSunGard's assessment of the capital market assumptions include: 1) Quarterly reviews of the markets, loosely based upon historicalperformance and expected future results; 2) Historical data contained in SunGard's Index Histories Database including contracts withvendors such as Morningstar, Barclay's Capital, Citigroup, The Conference Board, and the Commodities Research Board, etc. Thedata goes back to 1960 or date of inception of the index and is supplemented with information from the annual Stocks, Bonds, Billsand Inflation Yearbook for data back to 1926 on major markets.
AllocationMaster Report American Research Institute in Turkey
Prepared by Stephen Larkin 4

Asset Mix Comparison - Non-Qualified AssetsPresent Asset Mix Proposed Asset Mix
Present Asset Mix Proposed Asset Mix AdjustmentCash Equivalents $1,525,833 100.00% $0 0.00% ($1,525,833)Tax-Exempt Bonds $0 0.00% $717,142 47.00% $717,142Large Cap Stocks $0 0.00% $442,492 29.00% $442,492Mid Cap Stocks $0 0.00% $68,662 4.50% $68,662Small Cap Stocks $0 0.00% $30,517 2.00% $30,517International Stocks $0 0.00% $106,808 7.00% $106,808Emerging Mkts $0 0.00% $99,179 6.50% $99,179Commodities $0 0.00% $15,258 1.00% $15,258Managed Futures $0 0.00% $45,775 3.00% $45,775
Total $1,525,833 100.00% $1,525,833 100.00%
Before-Tax Gross Return 2.50% 6.04%Before-Tax Net Return 1.25% 4.79%After-Tax Net Return 1.25% 4.79%Standard Deviation (Risk) 0.60% 8.04%Sharpe Ratio -3.75 0.16After-Tax Yield 2.25% 1.63%
This is for illustrative purposes only. Past performance is not an indication of future returns.
AllocationMaster Report American Research Institute in Turkey
Prepared by Stephen Larkin 5

Hypothetical Projected Assets - Actual Dollars
Present Asset MixProposed Asset Mix
The Projected Assets as shown above represent the projected Asset Value for the Present Asset Mix and the Proposed Asset Mix overthe projection period, using broad sector return assumption in line with historic returns. Implicit in these assumptions is that theinvestment returns would theoretically match the historic returns and based on this assumption, the graph indicates whether you wouldbe expected to have sufficient assets to meet your financial goals. The Asset Value shown is the beginning of year after-tax marketvalue for your combined Non-Qualified and Qualified assets. As individual investment returns may vary substantially, there can be noguarantee or promise of achieving the goals as stated above. These assumptions are also true of the Financial Forecast tables thatfollow.
AllocationMaster Report American Research Institute in Turkey
Prepared by Stephen Larkin 6
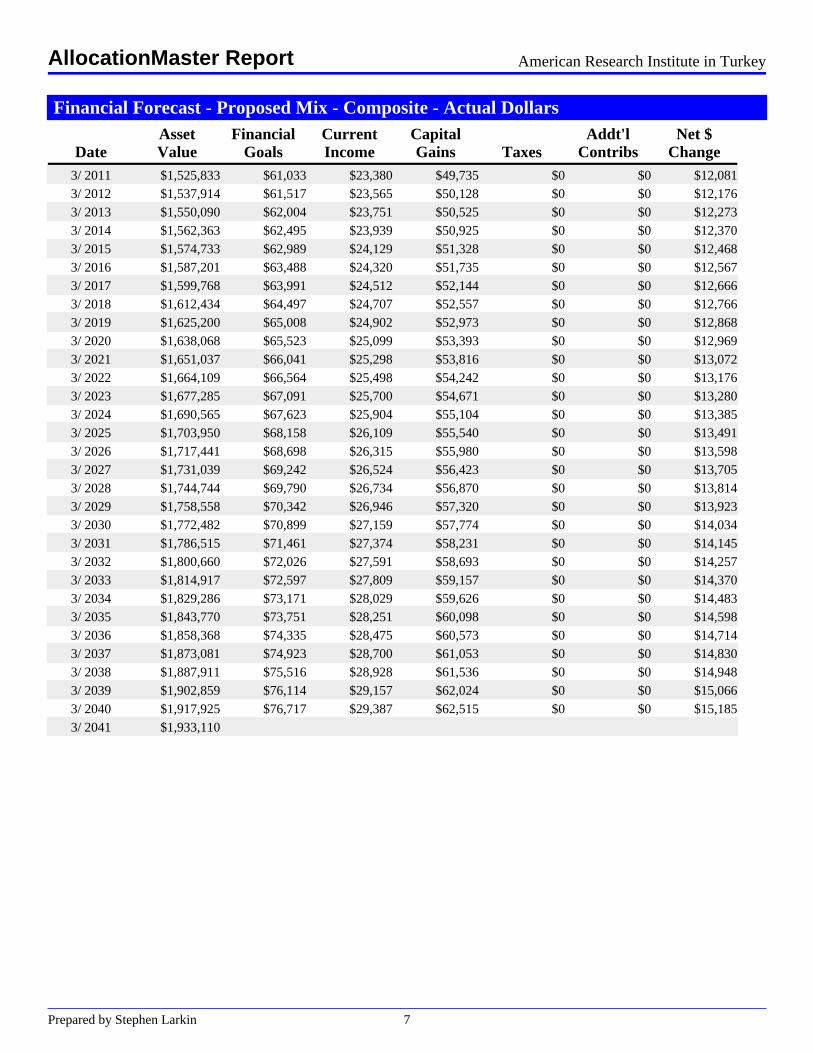
Financial Forecast - Proposed Mix - Composite - Actual DollarsAsset Financial Current Capital Addt'l Net $
Date Value Goals Income Gains Taxes Contribs Change3/ 2011 $1,525,833 $61,033 $23,380 $49,735 $0 $0 $12,0813/ 2012 $1,537,914 $61,517 $23,565 $50,128 $0 $0 $12,1763/ 2013 $1,550,090 $62,004 $23,751 $50,525 $0 $0 $12,2733/ 2014 $1,562,363 $62,495 $23,939 $50,925 $0 $0 $12,3703/ 2015 $1,574,733 $62,989 $24,129 $51,328 $0 $0 $12,4683/ 2016 $1,587,201 $63,488 $24,320 $51,735 $0 $0 $12,5673/ 2017 $1,599,768 $63,991 $24,512 $52,144 $0 $0 $12,6663/ 2018 $1,612,434 $64,497 $24,707 $52,557 $0 $0 $12,7663/ 2019 $1,625,200 $65,008 $24,902 $52,973 $0 $0 $12,8683/ 2020 $1,638,068 $65,523 $25,099 $53,393 $0 $0 $12,9693/ 2021 $1,651,037 $66,041 $25,298 $53,816 $0 $0 $13,0723/ 2022 $1,664,109 $66,564 $25,498 $54,242 $0 $0 $13,1763/ 2023 $1,677,285 $67,091 $25,700 $54,671 $0 $0 $13,2803/ 2024 $1,690,565 $67,623 $25,904 $55,104 $0 $0 $13,3853/ 2025 $1,703,950 $68,158 $26,109 $55,540 $0 $0 $13,4913/ 2026 $1,717,441 $68,698 $26,315 $55,980 $0 $0 $13,5983/ 2027 $1,731,039 $69,242 $26,524 $56,423 $0 $0 $13,7053/ 2028 $1,744,744 $69,790 $26,734 $56,870 $0 $0 $13,8143/ 2029 $1,758,558 $70,342 $26,946 $57,320 $0 $0 $13,9233/ 2030 $1,772,482 $70,899 $27,159 $57,774 $0 $0 $14,0343/ 2031 $1,786,515 $71,461 $27,374 $58,231 $0 $0 $14,1453/ 2032 $1,800,660 $72,026 $27,591 $58,693 $0 $0 $14,2573/ 2033 $1,814,917 $72,597 $27,809 $59,157 $0 $0 $14,3703/ 2034 $1,829,286 $73,171 $28,029 $59,626 $0 $0 $14,4833/ 2035 $1,843,770 $73,751 $28,251 $60,098 $0 $0 $14,5983/ 2036 $1,858,368 $74,335 $28,475 $60,573 $0 $0 $14,7143/ 2037 $1,873,081 $74,923 $28,700 $61,053 $0 $0 $14,8303/ 2038 $1,887,911 $75,516 $28,928 $61,536 $0 $0 $14,9483/ 2039 $1,902,859 $76,114 $29,157 $62,024 $0 $0 $15,0663/ 2040 $1,917,925 $76,717 $29,387 $62,515 $0 $0 $15,1853/ 2041 $1,933,110
AllocationMaster Report American Research Institute in Turkey
Prepared by Stephen Larkin 7

Financial Forecast - Proposed Mix - Composite - Inflation Adjusted DollarsAsset Financial Current Capital Addt'l Net $
Date Value Goals Income Gains Taxes Contribs Change3/ 2011 $1,525,833 $61,033 $23,380 $12,224 $0 $0 ($25,429)3/ 2012 $1,500,404 $60,016 $22,990 $12,021 $0 $0 ($25,006)3/ 2013 $1,475,398 $59,016 $22,607 $11,820 $0 $0 ($24,589)3/ 2014 $1,450,809 $58,032 $22,230 $11,623 $0 $0 ($24,179)3/ 2015 $1,426,630 $57,065 $21,860 $11,430 $0 $0 ($23,776)3/ 2016 $1,402,854 $56,114 $21,495 $11,239 $0 $0 ($23,380)3/ 2017 $1,379,475 $55,179 $21,137 $11,052 $0 $0 ($22,990)3/ 2018 $1,356,485 $54,259 $20,785 $10,868 $0 $0 ($22,607)3/ 2019 $1,333,878 $53,355 $20,438 $10,687 $0 $0 ($22,230)3/ 2020 $1,311,647 $52,466 $20,098 $10,508 $0 $0 ($21,860)3/ 2021 $1,289,788 $51,592 $19,763 $10,333 $0 $0 ($21,495)3/ 2022 $1,268,292 $50,732 $19,433 $10,161 $0 $0 ($21,137)3/ 2023 $1,247,155 $49,886 $19,110 $9,992 $0 $0 ($20,785)3/ 2024 $1,226,370 $49,055 $18,791 $9,825 $0 $0 ($20,439)3/ 2025 $1,205,932 $48,237 $18,478 $9,661 $0 $0 ($20,098)3/ 2026 $1,185,834 $47,433 $18,170 $9,500 $0 $0 ($19,763)3/ 2027 $1,166,071 $46,643 $17,867 $9,342 $0 $0 ($19,434)3/ 2028 $1,146,637 $45,865 $17,569 $9,186 $0 $0 ($19,110)3/ 2029 $1,127,528 $45,101 $17,277 $9,033 $0 $0 ($18,791)3/ 2030 $1,108,736 $44,349 $16,989 $8,883 $0 $0 ($18,478)3/ 2031 $1,090,258 $43,610 $16,705 $8,735 $0 $0 ($18,170)3/ 2032 $1,072,088 $42,884 $16,427 $8,589 $0 $0 ($17,867)3/ 2033 $1,054,221 $42,169 $16,153 $8,446 $0 $0 ($17,569)3/ 2034 $1,036,651 $41,466 $15,884 $8,305 $0 $0 ($17,277)3/ 2035 $1,019,375 $40,775 $15,619 $8,167 $0 $0 ($16,989)3/ 2036 $1,002,386 $40,095 $15,359 $8,031 $0 $0 ($16,706)3/ 2037 $985,680 $39,427 $15,103 $7,897 $0 $0 ($16,427)3/ 2038 $969,253 $38,770 $14,851 $7,765 $0 $0 ($16,153)3/ 2039 $953,100 $38,124 $14,604 $7,636 $0 $0 ($15,884)3/ 2040 $937,216 $37,489 $14,360 $7,509 $0 $0 ($15,619)3/ 2041 $921,596
AllocationMaster Report American Research Institute in Turkey
Prepared by Stephen Larkin 8

Simulation Analysis - Range of Returns (After-Tax)
Present Asset MixProposed Asset Mix
Probability of Exceeding Return* 1 Year 5 Years 10 Years 20 Years 30 Years
Present2% 2.7% 1.8% 1.6% 1.5% 1.5%16% 1.9% 1.5% 1.4% 1.4% 1.3%50% 1.2% 1.2% 1.2% 1.3% 1.3%84% 0.6% 1.0% 1.1% 1.1% 1.1%98% -0.0% 0.7% 0.8% 1.0% 1.0%
Proposed2% 22.7% 10.9% 9.2% 7.9% 7.4%16% 11.5% 7.8% 6.9% 6.2% 5.8%50% 3.9% 4.7% 4.5% 4.5% 4.4%84% -2.3% 1.0% 2.2% 2.8% 3.1%98% -10.6% -2.5% -0.2% 1.1% 1.5%
* The Probability of Exceeding Return column shows the likelihood of exceeding the after-tax compound returns shown in theTime Horizons. For example, in the Proposed Portfolio, there is a 2% likelihood of exceeding 22.7% and a 98% likelihood ofexceeding -10.6% when all simulated returns are considered at 1 Year.
The simulated range of annualized compound returns for the Present and Proposed Composite Asset Mixes are shown over theprojection period. The expected ranges of returns are represented by the bars. There is a 98% chance of realizing a return that isgreater than the simulated worst case return. And, there is a 2% chance of exceeding the simulated best case return. The expectedrange of returns narrows over longer time periods and for more conservative portfolios. PLEASE REFER TO THE MONTE CARLOSIMULATION METHODOLOGY PRINTED REPORT PAGE FOR MORE INFORMATION REGARDING THEMETHODOLOGY, LIMITATIONS AND KEY ASSUMPTIONS OF MONTE CARLO SIMULATION.
AllocationMaster Report American Research Institute in Turkey
Prepared by Stephen Larkin 9

Simulation Analysis - Range of Assets
Present Asset MixProposed Asset Mix
1 Year 5 Years 10 Years 20 Years 30 Years
PresentBest Case $1,502,189 $1,363,084 $1,204,078 $928,391 $708,026Expected Case $1,484,313 $1,326,257 $1,153,569 $874,391 $659,554Worst Case $1,464,874 $1,288,551 $1,105,089 $818,136 $609,142
ProposedBest Case $1,818,953 $2,241,329 $2,837,138 $3,473,400 $4,183,587Expected Case $1,532,271 $1,561,201 $1,585,952 $1,681,412 $1,767,681Worst Case $1,300,339 $1,070,191 $971,549 $782,839 $691,062
The simulated range of projected asset values for the Present and Proposed Composite Asset Mixes are shown over the projectionperiod. The entire range of asset values covering the best case to worst case outcomes are represented by the bars. There is a 98%chance of realizing an asset value that is greater than the simulated worst-case. And, there is a 2% chance of exceeding the simulatedbest-case asset value. The range of asset values widens over longer time periods and for more aggressive portfolios. PLEASE REFERTO THE MONTE CARLO SIMULATION METHODOLOGY PRINTED REPORT PAGE FOR MORE INFORMATIONREGARDING THE METHODOLOGY, LIMITATIONS AND KEY ASSUMPTIONS OF MONTE CARLO SIMULATION.
AllocationMaster Report American Research Institute in Turkey
Prepared by Stephen Larkin 10

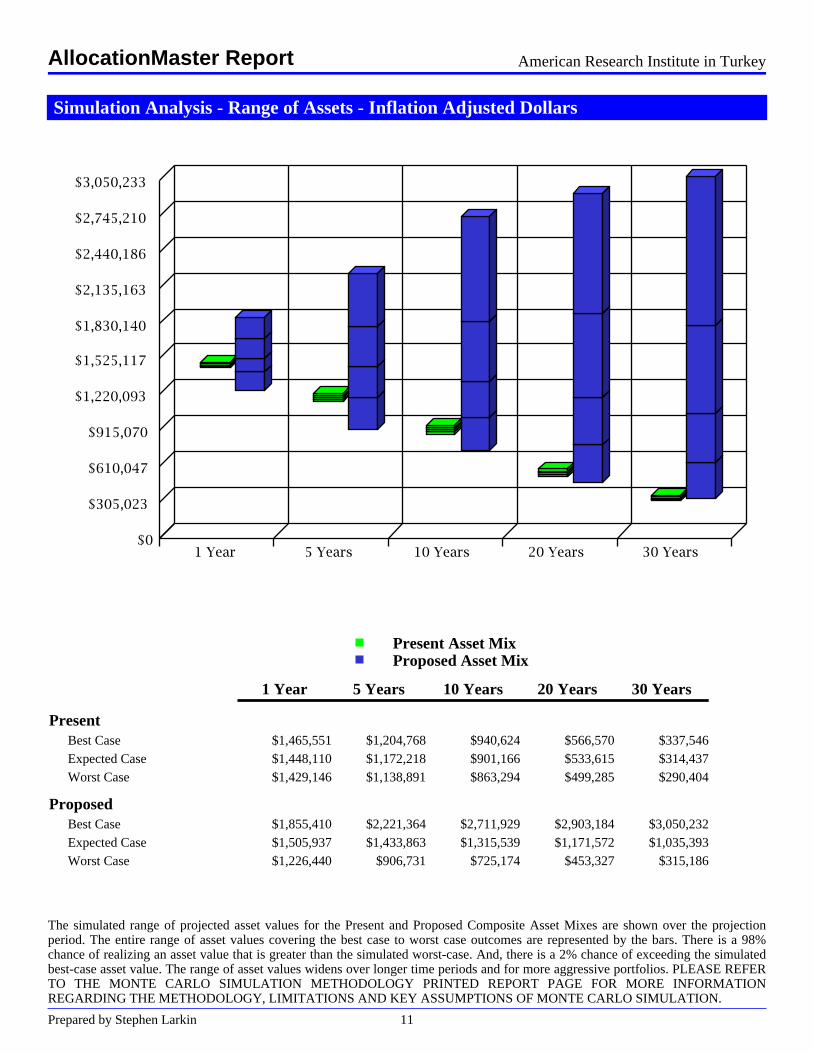
Simulation Analysis - Range of Assets - Inflation Adjusted Dollars
Present Asset MixProposed Asset Mix
1 Year 5 Years 10 Years 20 Years 30 Years
PresentBest Case $1,465,551 $1,204,768 $940,624 $566,570 $337,546Expected Case $1,448,110 $1,172,218 $901,166 $533,615 $314,437Worst Case $1,429,146 $1,138,891 $863,294 $499,285 $290,404
ProposedBest Case $1,774,588 $1,981,008 $2,216,368 $2,119,715 $1,994,494Expected Case $1,494,898 $1,379,874 $1,238,944 $1,026,117 $842,729Worst Case $1,268,623 $945,893 $758,972 $477,744 $329,459
The simulated range of projected asset values for the Present and Proposed Composite Asset Mixes are shown over the projectionperiod. The entire range of asset values covering the best case to worst case outcomes are represented by the bars. There is a 98%chance of realizing an asset value that is greater than the simulated worst-case. And, there is a 2% chance of exceeding the simulatedbest-case asset value. The range of asset values widens over longer time periods and for more aggressive portfolios. PLEASE REFERTO THE MONTE CARLO SIMULATION METHODOLOGY PRINTED REPORT PAGE FOR MORE INFORMATIONREGARDING THE METHODOLOGY, LIMITATIONS AND KEY ASSUMPTIONS OF MONTE CARLO SIMULATION.
AllocationMaster Report American Research Institute in Turkey
Prepared by Stephen Larkin 11
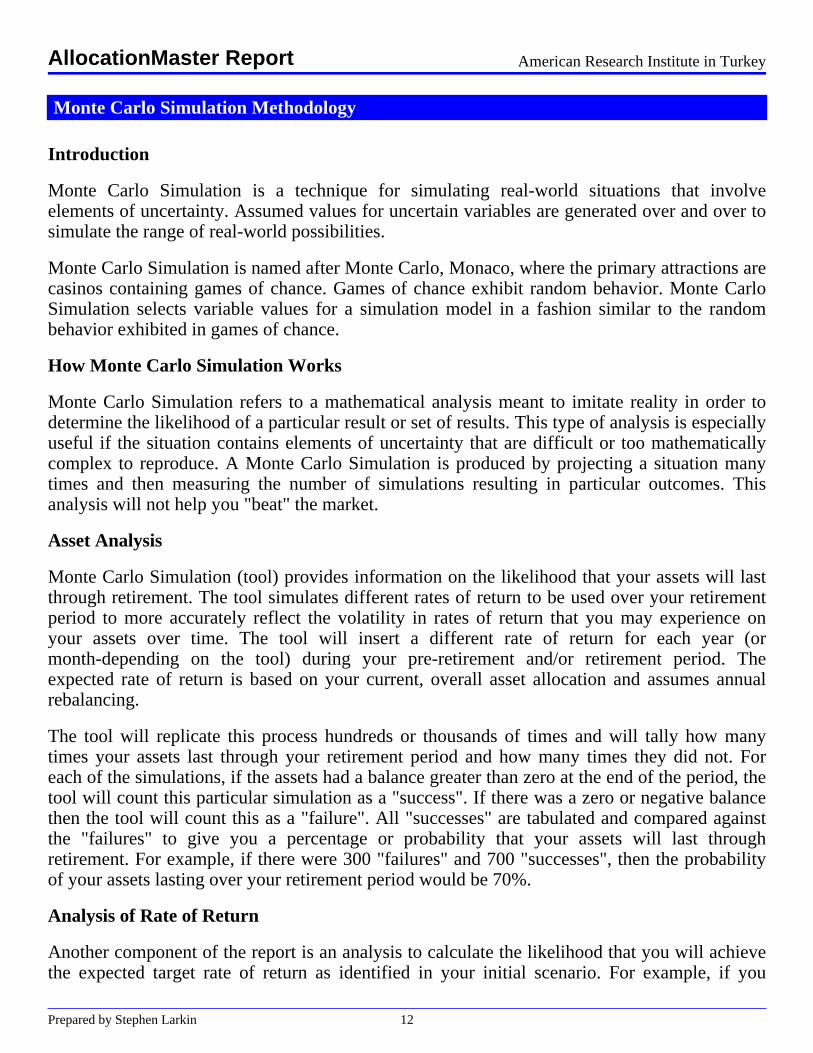
Monte Carlo Simulation Methodology
Introduction
Monte Carlo Simulation is a technique for simulating real-world situations that involveelements of uncertainty. Assumed values for uncertain variables are generated over and over tosimulate the range of real-world possibilities.
Monte Carlo Simulation is named after Monte Carlo, Monaco, where the primary attractions arecasinos containing games of chance. Games of chance exhibit random behavior. Monte CarloSimulation selects variable values for a simulation model in a fashion similar to the randombehavior exhibited in games of chance.
How Monte Carlo Simulation Works
Monte Carlo Simulation refers to a mathematical analysis meant to imitate reality in order todetermine the likelihood of a particular result or set of results. This type of analysis is especiallyuseful if the situation contains elements of uncertainty that are difficult or too mathematicallycomplex to reproduce. A Monte Carlo Simulation is produced by projecting a situation manytimes and then measuring the number of simulations resulting in particular outcomes. Thisanalysis will not help you "beat" the market.
Asset Analysis
Monte Carlo Simulation (tool) provides information on the likelihood that your assets will lastthrough retirement. The tool simulates different rates of return to be used over your retirementperiod to more accurately reflect the volatility in rates of return that you may experience onyour assets over time. The tool will insert a different rate of return for each year (ormonth-depending on the tool) during your pre-retirement and/or retirement period. Theexpected rate of return is based on your current, overall asset allocation and assumes annualrebalancing.
The tool will replicate this process hundreds or thousands of times and will tally how manytimes your assets last through your retirement period and how many times they did not. Foreach of the simulations, if the assets had a balance greater than zero at the end of the period, thetool will count this particular simulation as a "success". If there was a zero or negative balancethen the tool will count this as a "failure". All "successes" are tabulated and compared againstthe "failures" to give you a percentage or probability that your assets will last throughretirement. For example, if there were 300 "failures" and 700 "successes", then the probabilityof your assets lasting over your retirement period would be 70%.
Analysis of Rate of Return
Another component of the report is an analysis to calculate the likelihood that you will achievethe expected target rate of return as identified in your initial scenario. For example, if you
AllocationMaster Report American Research Institute in Turkey
Prepared by Stephen Larkin 12

stated, on average, that you expect a 6% rate of return, the tool will perform the same analysisas identified above and will tally how many times your portfolio had an expected average rateof return of 6% or greater. This would be counted as a "success". In addition, in the hundreds orthousands of Monte Carlo Simulations performed, if the tool recorded 650 instances when theexpected average rate of return was 6% or greater and recorded 350 instances when theexpected average rate of return was below 6%, then the probability of your average rate ofreturn achieving your target return (6%) would be 65%.
Use of Standard Deviation and Correlations
Standard Deviation is an important concept in understanding Monte Carlo Simulation. StandardDeviation for an Asset Class represents its estimated average annual investment risk duringeach year of the projection period. It measures the potential magnitude of any positiveover-performance or negative under-performance of an Asset Class from its Expected Return.The higher the standard deviation, the wider the range of returns possible in any one year.Assuming a normal bell curve for returns, two standard deviations represent approximately 95%of possible outcomes. In this analysis, the Monte Carlo Simulation always assumes themaximum of two standard deviations; therefore, results will vary from the report approximately5% of the time. As with any portfolio allocation, there is a risk that the estimated rate of returnis higher or lower than that estimated, based on the approximate 4% excluded from the analysis.
Standard Deviation
The tool randomly selects rates of return based on a range of returns using both the expectedtotal rate of return and the standard deviation (risk) for each asset class that you own in yourportfolio. The tool uses the data listed on the "Efficient Frontier – Proposed Asset Classes" pageto perform the calculations.
Correlations
Correlations are also used in the tool and compares assets to one another. The Correlationsmeasure the degree of relationship between two Asset Classes and are a standardized measurewhich can be between -1.00 and +1.00.
Interpreting Correlations
· Perfectly Positively Correlated: The Correlation is +1.00. The returns of two Asset Classesmove exactly in lock-step with one another.
· Perfectly Negatively Correlated: The Correlation is -1.00. The returns of two Asset Classesmove in exactly opposite directions from one another.
· Uncorrelated: The Correlation is 0.00. Two Asset Classes have no relationship between themovement of their returns.
AllocationMaster Report American Research Institute in Turkey
Prepared by Stephen Larkin 13

Assumptions
In order to perform the simulations, the tool must have a beginning basis for factors that affectyour situation. The specifics of your situation have been entered in the analysis data youprovided and include, but are not limited to, historical market returns, standard deviations,withdrawal amounts, contribution amounts, retirement periods, and income and expenseestimates.
Monte Carlo Simulation’s Use of Asset Classes
The Monte Carlo Simulation calculations are based on asset classes rather than specificsecurities or investments. Each security is categorized under an assigned asset class and thatasset class has a corresponding index. This index is used to view historical performance and riskcharacteristics, as well as, in any estimates for future possible performance and riskcharacteristics.
Monte Carlo Simulation’s Asset Class Assumptions
The asset class assumptions used in the Monte Carlo Simulation are located on the ScenarioAssumptions page in the printed report. The key elements in determining Asset Class CapitalMarket Assumptions include, but are not limited to, quarterly reviews of the markets, expectedfuture results based loosely on historical performance, quarterly reviews by analytical peoplewho are close to the industry and understand portfolio modeling techniques, historical datacontained in our Index Histories Database, etc.
Limitations
The average outcome is the outcome with the highest specific probability; however, averagescan be misleading. For example, assume it takes an average of 30 minutes to get to the airportgate. If you leave for the gate just 30 minutes before takeoff, you’ll miss your plane half of thetime!
Changes in Your Financial Situation May Vary these Results
Since Monte Carlo Simulation is based on a number of factors which you provided, if yourfinancial situation changes, the results of the report may vary. For instance, if your assetallocation changes, the simulation results may also change because asset allocation is a primaryfactor in the analysis. In addition, if you change any other factor relied upon for the simulationsuch as your expected target rate of return, withdrawal(s), income, or expenses, your resultsmay vary.
IMPORTANT: The projections or other information generated by the Monte Carlo Simulationtool regarding the likelihood of various investment outcomes are hypothetical in nature, do notreflect actual investment results and are not guarantees of future results.
AllocationMaster Report American Research Institute in Turkey
Prepared by Stephen Larkin 14

Product Selection
The Monte Carlo Simulation (tool) calculations are based on asset classes rather than specificsecurities or investments. The tool does not provide preferential treatment to any specificsecurity or investment.
Conclusion
Statistics tell us that if you flip a coin, the probability is 1 out of 2 (50%) that the coin will landheads up. A simulation analysis could be performed that flips the coin many times. The resultsof such an analysis would confirm that the probability of heads is 50%.
With the roll of the dice, a simulation analysis might be used to determine the probability ofrolling any number between 2 and 12 on a set of dice. The results should show that theprobability of rolling a 7 is 6 out of 36 or 16.67% and the probability of rolling a 2 is 1 out of 36or 2.78%.
These examples illustrate applications of a simulation analysis where the results are knownbased on statistics. Your financial future is less predictable because many factors are involved.A simulation analysis helps illustrate and measure possible financial futures and measure theprobability of achieving them; therefore, providing clients information on their retirementsituation.
If you have questions about this report, please contact your financial advisor.
AllocationMaster Report American Research Institute in Turkey
Prepared by Stephen Larkin 15

Implementation Plan Disclosure
The Implementation tool does not provide preferential treatment to any specific security or investment. Thedatabase to determine specific security assignation to asset classes is populated by data through an independentthird party company. The information contained herein has been derived from sources considered reliable, butno independent verification has been made and no guarantee can be made as to its accuracy or completeness.
Products such as mutual funds, exchange traded funds, money market funds, equities and variable annuitysubaccounts may be part of this recommendation. These products are sold only by prospectus. Please carefullyread the investment company’s prospectus for information concerning features of the products, investmentobjectives, risks, surrender periods, penalties, fees and any other internal expenses. A prospectus can beobtained from your investment professional and should be carefully read before investing. Please informyour investment professional of any concerns raised by any of the information contained within this reportincluding asset class and/or security assignation.
AllocationMaster Report American Research Institute in Turkey
Prepared by Stephen Larkin 16

Glossary - Key Terms
Aggressive Investment Posture - Asset mixes that have relatively more risk will often provide higher potential returns,with greater uncertainty. Sometimes, aggressive asset mixes do not produce higher returns than more conservative assetmixes.
Asset Allocation - The process of determining what proportions of your portfolio holdings are to be invested in thevarious asset classes.
Asset Class - A standard term which broadly defines a category of potential investments.
Asset Mix - The percentage weightings (or mix) of different asset classes to be held in the portfolio. There may beseparate asset mixes for the taxable and tax-deferred holdings in a portfolio.
Conservative Investment Posture - Asset mixes that have relatively low risk in general will often also have lowerlong-term returns than more aggressive asset mixes, with more certainty.
Current Dollars - A forecast of the asset value stated in terms of the actual dollars held, not in terms of purchasing power.
Dividend Yield - The Dividend Yield for an Asset Class is its estimated average annual dividends and are included in theoverall Yield statistics for the portfolio. The Dividend Yield is the portion of the Expected Return for the Asset Class thatwill be earned each year in the form of dividends.
Efficient Frontier - Plots the asset mixes, ranging from conservative to aggressive, that provide the best trade-off of riskand return. These "efficient" asset mixes provide (1) the maximum available assumed return for a given level of risk and(2) the minimum available level of risk for a given level of assumed return.
Expected Return - The Expected Return is the annual return expected to be achieved on average over the ProjectionPeriod. Remember that this is not intended as a guarantee or meant to reflect the performance of any investment product.It is simply a historical return based on an index.
Inflation Dollars - A forecast of the asset value measured in terms of purchasing power. Because of inflation, investmentdollars will probably not be able to buy as much in the future as they can today.
Non-Qualified Assets (NQ) - Assets that are currently subject to federal, state and local taxes.
Non-Qualified Tax Deferred Assets (NQTD) - Assets that will be allowed to accumulate tax-deferred for the purpose ofmeeting long-term retirement income needs. These assets are normally invested in annuities.
Qualified Assets (Q) - Assets that will be allowed to accumulate tax-free investment earnings until withdrawn atretirement. These assets are normally invested in a 401(k), 403(b), SEP, Keogh or IRA.
Risk - The unpredictability of investment returns. The chance that the actual return from investment in an asset class willbe different from its assumed return. Risk is measured statistically using standard deviation.
Sharpe Ratio - A measure of incremental assumed return (in inflation dollars) provided by an asset class or asset mix fortaking additional risk. Higher values of the Sharpe Ratio are desirable. Measured as excess return (expected return less therisk-free return) divided by risk (standard deviation).
Standard Deviation - An estimate of the possible future dispersion (or divergence) of the actual returns from an asset classaround its expected return. The standard deviation for an asset class represents its estimated average annual investmentrisk. Investment risk is based on the notion of uncertainty. The less certain it is that an asset class will generate its return,the higher the risk of that asset class.
Total Return - The combined return in current income and capital appreciation from investment in an asset class.
AllocationMaster Report American Research Institute in Turkey
Prepared by Stephen Larkin 17

Turnover Rate - The Turnover Rate for an Asset Class is the estimated average annual portion of the holdings in the AssetClass that are expected to be bought and sold each year.
Yield - The current cash income received from investment in an asset class. Bonds provide yield in the form of interestpayments and stocks through dividends.
AllocationMaster Report American Research Institute in Turkey
Prepared by Stephen Larkin 18

Notes
.
.
.
.
.
.
.
.
.
.
.
.
.
.
.
.
.
.
.
.
.
.
.
.
.
.
.
.
.
.
.
AllocationMaster Report American Research Institute in Turkey
Prepared by Stephen Larkin 19

AllocationMaster Report
Prepared for:
American Research Institute in Turkey(50/50 Allocation- 5% Spend)
March 04, 2011
Prepared by:
Stephen Larkin
1735 MARKET STPhiladelphia, PA 19103-7589

Table of Contents
Client Data Inputs .... 3Scenario Assumptions .... 4Asset Mix Comparison - Non-Qualified Assets .... 5Hypothetical Projected Assets - Actual Dollars .... 6Financial Forecast - Proposed Mix - Composite - Actual Dollars .... 7Financial Forecast - Present Mix - Composite - Inflation Adjusted Dollars .... 8Simulation Analysis - Range of Returns (After-Tax) .... 9Simulation Analysis - Range of Assets .... 10Simulation Analysis - Range of Assets - Inflation Adjusted Dollars .... 11Implementation Plan Disclosure .... 12Glossary - Key Terms .... 13
This asset allocation analysis is provided to you for informational purposes only. Actual investment results may be materially differentfrom the projected performance results portrayed. This report uses information that is considered reliable, but it does not represent thatthe information is accurate or complete, and the report may not be relied upon as such. The report is not intended to be either anexpressed or implied guaranty of actual performance. It is not intended to supply tax or legal advice. There is no solicitation to buy orsell securities. The deduction of advisory fees, brokerage or other commissions, and any other expenses that would have been paidmay not be reflected in the analysis. The results portrayed reflect the reinvestment of dividends and other earnings.
AllocationMaster Report American Research Institute in Turkey
Prepared by Stephen Larkin 2

Client Data Inputs
Federal Income Tax Rate:State Income Tax Rate:Federal Capital Gains Tax Rate:State Capital Gains Tax Rate:
0.00%0.00%0.00%0.00%
Non-Qualified Fee:Qualified Fee:Non-Qual Tax-Deferred Fee:
1.25%1.25%1.25%
Future Federal Income Tax Rate:Future State Income Tax Rate:Future Federal Capital Gains Tax Rate:Future State Capital Gains Tax Rate:
Starting Year:
0.00%0.00%0.00%0.00%
2011
Non-Qualified Assets
Market % of Cost # ofAsset Class Product Name Value Total Basis Shares Hold Symbol
Cash Equivalents $1,525,833 100% $1,525,833 0.0 No
Total* $1,525,833
Qualified Assets
Market % of Cost # ofAsset Class Product Name Value Total Basis Shares Hold Symbol
Total* $0
Other Spending Goals
Spend 5.00% of Non-Qual Market Value
*The amount shown includes only those assets that have been assigned to an asset class.
AllocationMaster Report American Research Institute in Turkey
Prepared by Stephen Larkin 3

Scenario Assumptions
Scenario AssumptionsAsset Class Index Proxy Return Risk Yield Dividend TurnoverCash Equivalents FED 3-Mo T-Bill (S) 2.50% 0.60% 3.50% 0.00% 100.00%Taxable Bonds BarCapAggregateBnd 4.00% 4.00% 5.00% 0.00% 40.00%Tax-Exempt Bonds FED 3-Mo T-Bill (S) 3.60% 3.80% 4.00% 0.00% 40.00%High Yield BarCap High Yield 7.00% 8.50% 7.00% 0.00% 40.00%Large Cap Stocks S&P 500 Composite 8.00% 16.70% 0.00% 1.80% 5.00%Mid Cap Stocks S&P 400 MidCap 8.75% 19.70% 0.00% 1.25% 20.00%Small Cap Stocks RUSS 2000 Index 9.50% 21.70% 0.00% 1.50% 10.00%Real Estate FED 3-Mo T-Bill (S) 7.50% 13.00% 3.50% 0.00% 15.00%Long/Short Hedge HFRI FundofFundComp 7.50% 9.00% 0.00% 0.00% 75.00%Absolute Ret Hedge HFRI FundofFundComp 6.00% 7.00% 0.00% 0.00% 75.00%Private Equity CAMB US Private Eqty 12.00% 21.00% 0.00% 0.00% 10.00%International Stocks MSCI EAFE Index-$ 7.80% 17.80% 0.00% 1.00% 10.00%Emerging Mkts MSCI Emerg Free-$ 10.00% 25.00% 0.00% 0.00% 10.00%Commodities S&P GSCI Index 7.00% 21.00% 3.50% 0.00% 100.00%Managed Futures BARC CTA Index 6.00% 6.00% 6.30% 0.00% 100.00%
Inflation Rate: 2.50%
The long-term capital market assumptions were developed and reviewed by the SunGard Assumptions Committee. The Committeerelies on the input and expertise of a range of product managers and analysts and is based upon what they believe is appropriate. TheCommittee's goal in asset allocation modeling work is to provide underlying assumptions that will help advisors guide their clientsinto a long-term investment strategy that is appropriate for that client's financial situation and tolerance for risk. Key elements inSunGard's assessment of the capital market assumptions include: 1) Quarterly reviews of the markets, loosely based upon historicalperformance and expected future results; 2) Historical data contained in SunGard's Index Histories Database including contracts withvendors such as Morningstar, Barclay's Capital, Citigroup, The Conference Board, and the Commodities Research Board, etc. Thedata goes back to 1960 or date of inception of the index and is supplemented with information from the annual Stocks, Bonds, Billsand Inflation Yearbook for data back to 1926 on major markets.
AllocationMaster Report American Research Institute in Turkey
Prepared by Stephen Larkin 4

Asset Mix Comparison - Non-Qualified AssetsPresent Asset Mix Proposed Asset Mix
Present Asset Mix Proposed Asset Mix AdjustmentCash Equivalents $1,525,833 100.00% $0 0.00% ($1,525,833)Tax-Exempt Bonds $0 0.00% $717,142 47.00% $717,142Large Cap Stocks $0 0.00% $442,492 29.00% $442,492Mid Cap Stocks $0 0.00% $68,662 4.50% $68,662Small Cap Stocks $0 0.00% $30,517 2.00% $30,517International Stocks $0 0.00% $106,808 7.00% $106,808Emerging Mkts $0 0.00% $99,179 6.50% $99,179Commodities $0 0.00% $15,258 1.00% $15,258Managed Futures $0 0.00% $45,775 3.00% $45,775
Total $1,525,833 100.00% $1,525,833 100.00%
Before-Tax Gross Return 2.50% 6.04%Before-Tax Net Return 1.25% 4.79%After-Tax Net Return 1.25% 4.79%Standard Deviation (Risk) 0.60% 8.04%Sharpe Ratio -3.75 0.16After-Tax Yield 2.25% 1.63%
This is for illustrative purposes only. Past performance is not an indication of future returns.
AllocationMaster Report American Research Institute in Turkey
Prepared by Stephen Larkin 5

Hypothetical Projected Assets - Actual Dollars
Present Asset MixProposed Asset Mix
The Projected Assets as shown above represent the projected Asset Value for the Present Asset Mix and the Proposed Asset Mix overthe projection period, using broad sector return assumption in line with historic returns. Implicit in these assumptions is that theinvestment returns would theoretically match the historic returns and based on this assumption, the graph indicates whether you wouldbe expected to have sufficient assets to meet your financial goals. The Asset Value shown is the beginning of year after-tax marketvalue for your combined Non-Qualified and Qualified assets. As individual investment returns may vary substantially, there can be noguarantee or promise of achieving the goals as stated above. These assumptions are also true of the Financial Forecast tables thatfollow.
AllocationMaster Report American Research Institute in Turkey
Prepared by Stephen Larkin 6

Financial Forecast - Proposed Mix - Composite - Actual DollarsAsset Financial Current Capital Addt'l Net $
Date Value Goals Income Gains Taxes Contribs Change3/ 2011 $1,525,833 $76,292 $23,380 $49,735 $0 $0 ($3,178)3/ 2012 $1,522,655 $76,133 $23,331 $49,631 $0 $0 ($3,171)3/ 2013 $1,519,485 $75,974 $23,282 $49,528 $0 $0 ($3,164)3/ 2014 $1,516,320 $75,816 $23,234 $49,424 $0 $0 ($3,158)3/ 2015 $1,513,162 $75,658 $23,185 $49,322 $0 $0 ($3,151)3/ 2016 $1,510,011 $75,501 $23,137 $49,219 $0 $0 ($3,145)3/ 2017 $1,506,867 $75,343 $23,089 $49,116 $0 $0 ($3,138)3/ 2018 $1,503,729 $75,186 $23,041 $49,014 $0 $0 ($3,132)3/ 2019 $1,500,597 $75,030 $22,993 $48,912 $0 $0 ($3,125)3/ 2020 $1,497,472 $74,874 $22,945 $48,810 $0 $0 ($3,118)3/ 2021 $1,494,354 $74,718 $22,897 $48,708 $0 $0 ($3,112)3/ 2022 $1,491,242 $74,562 $22,850 $48,607 $0 $0 ($3,106)3/ 2023 $1,488,136 $74,407 $22,802 $48,506 $0 $0 ($3,099)3/ 2024 $1,485,037 $74,252 $22,754 $48,405 $0 $0 ($3,093)3/ 2025 $1,481,945 $74,097 $22,707 $48,304 $0 $0 ($3,086)3/ 2026 $1,478,858 $73,943 $22,660 $48,203 $0 $0 ($3,080)3/ 2027 $1,475,779 $73,789 $22,613 $48,103 $0 $0 ($3,073)3/ 2028 $1,472,705 $73,635 $22,566 $48,003 $0 $0 ($3,067)3/ 2029 $1,469,638 $73,482 $22,519 $47,903 $0 $0 ($3,061)3/ 2030 $1,466,578 $73,329 $22,472 $47,803 $0 $0 ($3,054)3/ 2031 $1,463,524 $73,176 $22,425 $47,704 $0 $0 ($3,048)3/ 2032 $1,460,476 $73,024 $22,378 $47,604 $0 $0 ($3,041)3/ 2033 $1,457,435 $72,872 $22,332 $47,505 $0 $0 ($3,035)3/ 2034 $1,454,399 $72,720 $22,285 $47,406 $0 $0 ($3,029)3/ 2035 $1,451,371 $72,569 $22,239 $47,307 $0 $0 ($3,022)3/ 2036 $1,448,348 $72,417 $22,192 $47,209 $0 $0 ($3,016)3/ 2037 $1,445,332 $72,267 $22,146 $47,111 $0 $0 ($3,010)3/ 2038 $1,442,322 $72,116 $22,100 $47,012 $0 $0 ($3,004)3/ 2039 $1,439,318 $71,966 $22,054 $46,915 $0 $0 ($2,997)3/ 2040 $1,436,321 $71,816 $22,008 $46,817 $0 $0 ($2,991)3/ 2041 $1,433,330
AllocationMaster Report American Research Institute in Turkey
Prepared by Stephen Larkin 7

Financial Forecast - Present Mix - Composite - Inflation Adjusted DollarsAsset Financial Current Capital Addt'l Net $
Date Value Goals Income Gains Taxes Contribs Change3/ 2011 $1,525,833 $76,292 $34,331 ($51,078) $0 $0 ($93,039)3/ 2012 $1,432,794 $71,640 $32,238 ($47,964) $0 $0 ($87,366)3/ 2013 $1,345,429 $67,271 $30,272 ($45,039) $0 $0 ($82,038)3/ 2014 $1,263,391 $63,170 $28,426 ($42,293) $0 $0 ($77,036)3/ 2015 $1,186,355 $59,318 $26,693 ($39,714) $0 $0 ($72,339)3/ 2016 $1,114,016 $55,701 $25,065 ($37,292) $0 $0 ($67,928)3/ 2017 $1,046,088 $52,304 $23,537 ($35,018) $0 $0 ($63,786)3/ 2018 $982,302 $49,115 $22,102 ($32,883) $0 $0 ($59,896)3/ 2019 $922,406 $46,120 $20,754 ($30,878) $0 $0 ($56,244)3/ 2020 $866,161 $43,308 $19,489 ($28,995) $0 $0 ($52,815)3/ 2021 $813,347 $40,667 $18,300 ($27,227) $0 $0 ($49,594)3/ 2022 $763,752 $38,188 $17,184 ($25,567) $0 $0 ($46,570)3/ 2023 $717,182 $35,859 $16,137 ($24,008) $0 $0 ($43,731)3/ 2024 $673,452 $33,673 $15,153 ($22,544) $0 $0 ($41,064)3/ 2025 $632,387 $31,619 $14,229 ($21,170) $0 $0 ($38,560)3/ 2026 $593,827 $29,691 $13,361 ($19,879) $0 $0 ($36,209)3/ 2027 $557,618 $27,881 $12,546 ($18,667) $0 $0 ($34,001)3/ 2028 $523,617 $26,181 $11,781 ($17,528) $0 $0 ($31,928)3/ 2029 $491,689 $24,584 $11,063 ($16,460) $0 $0 ($29,981)3/ 2030 $461,708 $23,085 $10,388 ($15,456) $0 $0 ($28,153)3/ 2031 $433,555 $21,678 $9,755 ($14,514) $0 $0 ($26,436)3/ 2032 $407,119 $20,356 $9,160 ($13,629) $0 $0 ($24,824)3/ 2033 $382,295 $19,115 $8,602 ($12,798) $0 $0 ($23,311)3/ 2034 $358,984 $17,949 $8,077 ($12,017) $0 $0 ($21,889)3/ 2035 $337,095 $16,855 $7,585 ($11,284) $0 $0 ($20,555)3/ 2036 $316,540 $15,827 $7,122 ($10,596) $0 $0 ($19,301)3/ 2037 $297,239 $14,862 $6,688 ($9,950) $0 $0 ($18,124)3/ 2038 $279,115 $13,956 $6,280 ($9,344) $0 $0 ($17,019)3/ 2039 $262,095 $13,105 $5,897 ($8,774) $0 $0 ($15,981)3/ 2040 $246,114 $12,306 $5,538 ($8,239) $0 $0 ($15,007)3/ 2041 $231,107
AllocationMaster Report American Research Institute in Turkey
Prepared by Stephen Larkin 8

Simulation Analysis - Range of Returns (After-Tax)
Present Asset MixProposed Asset Mix
Probability of Exceeding Return* 1 Year 5 Years 10 Years 20 Years 30 Years
Present2% 2.4% 1.8% 1.6% 1.5% 1.5%16% 1.8% 1.5% 1.4% 1.4% 1.4%50% 1.2% 1.3% 1.3% 1.2% 1.2%84% 0.7% 1.0% 1.1% 1.1% 1.1%98% -0.0% 0.7% 0.9% 1.0% 1.0%
Proposed2% 23.8% 12.0% 10.0% 8.4% 7.5%16% 13.4% 7.8% 7.1% 6.1% 6.0%50% 4.2% 4.5% 4.5% 4.5% 4.4%84% -3.4% 1.1% 1.9% 2.8% 3.0%98% -11.6% -2.4% -0.5% 1.0% 1.6%
* The Probability of Exceeding Return column shows the likelihood of exceeding the after-tax compound returns shown in theTime Horizons. For example, in the Proposed Portfolio, there is a 2% likelihood of exceeding 23.8% and a 98% likelihood ofexceeding -11.6% when all simulated returns are considered at 1 Year.
The simulated range of annualized compound returns for the Present and Proposed Composite Asset Mixes are shown over theprojection period. The expected ranges of returns are represented by the bars. There is a 98% chance of realizing a return that isgreater than the simulated worst case return. And, there is a 2% chance of exceeding the simulated best case return. The expectedrange of returns narrows over longer time periods and for more conservative portfolios. PLEASE REFER TO THE MONTE CARLOSIMULATION METHODOLOGY PRINTED REPORT PAGE FOR MORE INFORMATION REGARDING THEMETHODOLOGY, LIMITATIONS AND KEY ASSUMPTIONS OF MONTE CARLO SIMULATION.
AllocationMaster Report American Research Institute in Turkey
Prepared by Stephen Larkin 9

Simulation Analysis - Range of Assets
Present Asset MixProposed Asset Mix
1 Year 5 Years 10 Years 20 Years 30 Years
PresentBest Case $1,486,931 $1,294,786 $1,086,313 $755,485 $519,625Expected Case $1,469,055 $1,259,447 $1,040,279 $711,101 $483,694Worst Case $1,449,616 $1,223,272 $996,113 $664,890 $446,355
ProposedBest Case $1,803,695 $2,139,418 $2,581,085 $2,863,000 $3,122,039Expected Case $1,517,013 $1,484,878 $1,434,233 $1,375,817 $1,307,954Worst Case $1,285,081 $1,013,913 $874,160 $635,459 $506,747
The simulated range of projected asset values for the Present and Proposed Composite Asset Mixes are shown over the projectionperiod. The entire range of asset values covering the best case to worst case outcomes are represented by the bars. There is a 98%chance of realizing an asset value that is greater than the simulated worst-case. And, there is a 2% chance of exceeding the simulatedbest-case asset value. The range of asset values widens over longer time periods and for more aggressive portfolios. PLEASE REFERTO THE MONTE CARLO SIMULATION METHODOLOGY PRINTED REPORT PAGE FOR MORE INFORMATIONREGARDING THE METHODOLOGY, LIMITATIONS AND KEY ASSUMPTIONS OF MONTE CARLO SIMULATION.
AllocationMaster Report American Research Institute in Turkey
Prepared by Stephen Larkin 10

Simulation Analysis - Range of Assets - Inflation Adjusted Dollars
Present Asset MixProposed Asset Mix
1 Year 5 Years 10 Years 20 Years 30 Years
PresentBest Case $1,450,665 $1,144,402 $848,626 $461,051 $247,727Expected Case $1,433,224 $1,113,168 $812,664 $433,965 $230,598Worst Case $1,414,259 $1,081,195 $778,162 $405,763 $212,796
ProposedBest Case $1,759,702 $1,890,934 $2,016,339 $1,747,206 $1,488,409Expected Case $1,480,012 $1,312,416 $1,120,421 $839,621 $623,558Worst Case $1,253,737 $896,152 $682,892 $387,802 $241,588
The simulated range of projected asset values for the Present and Proposed Composite Asset Mixes are shown over the projectionperiod. The entire range of asset values covering the best case to worst case outcomes are represented by the bars. There is a 98%chance of realizing an asset value that is greater than the simulated worst-case. And, there is a 2% chance of exceeding the simulatedbest-case asset value. The range of asset values widens over longer time periods and for more aggressive portfolios. PLEASE REFERTO THE MONTE CARLO SIMULATION METHODOLOGY PRINTED REPORT PAGE FOR MORE INFORMATIONREGARDING THE METHODOLOGY, LIMITATIONS AND KEY ASSUMPTIONS OF MONTE CARLO SIMULATION.
AllocationMaster Report American Research Institute in Turkey
Prepared by Stephen Larkin 11

Implementation Plan Disclosure
The Implementation tool does not provide preferential treatment to any specific security or investment. Thedatabase to determine specific security assignation to asset classes is populated by data through an independentthird party company. The information contained herein has been derived from sources considered reliable, butno independent verification has been made and no guarantee can be made as to its accuracy or completeness.
Products such as mutual funds, exchange traded funds, money market funds, equities and variable annuitysubaccounts may be part of this recommendation. These products are sold only by prospectus. Please carefullyread the investment company’s prospectus for information concerning features of the products, investmentobjectives, risks, surrender periods, penalties, fees and any other internal expenses. A prospectus can beobtained from your investment professional and should be carefully read before investing. Please informyour investment professional of any concerns raised by any of the information contained within this reportincluding asset class and/or security assignation.
AllocationMaster Report American Research Institute in Turkey
Prepared by Stephen Larkin 12

Glossary - Key Terms
Aggressive Investment Posture - Asset mixes that have relatively more risk will often provide higher potential returns,with greater uncertainty. Sometimes, aggressive asset mixes do not produce higher returns than more conservative assetmixes.
Asset Allocation - The process of determining what proportions of your portfolio holdings are to be invested in thevarious asset classes.
Asset Class - A standard term which broadly defines a category of potential investments.
Asset Mix - The percentage weightings (or mix) of different asset classes to be held in the portfolio. There may beseparate asset mixes for the taxable and tax-deferred holdings in a portfolio.
Conservative Investment Posture - Asset mixes that have relatively low risk in general will often also have lowerlong-term returns than more aggressive asset mixes, with more certainty.
Current Dollars - A forecast of the asset value stated in terms of the actual dollars held, not in terms of purchasing power.
Dividend Yield - The Dividend Yield for an Asset Class is its estimated average annual dividends and are included in theoverall Yield statistics for the portfolio. The Dividend Yield is the portion of the Expected Return for the Asset Class thatwill be earned each year in the form of dividends.
Efficient Frontier - Plots the asset mixes, ranging from conservative to aggressive, that provide the best trade-off of riskand return. These "efficient" asset mixes provide (1) the maximum available assumed return for a given level of risk and(2) the minimum available level of risk for a given level of assumed return.
Expected Return - The Expected Return is the annual return expected to be achieved on average over the ProjectionPeriod. Remember that this is not intended as a guarantee or meant to reflect the performance of any investment product.It is simply a historical return based on an index.
Inflation Dollars - A forecast of the asset value measured in terms of purchasing power. Because of inflation, investmentdollars will probably not be able to buy as much in the future as they can today.
Non-Qualified Assets (NQ) - Assets that are currently subject to federal, state and local taxes.
Non-Qualified Tax Deferred Assets (NQTD) - Assets that will be allowed to accumulate tax-deferred for the purpose ofmeeting long-term retirement income needs. These assets are normally invested in annuities.
Qualified Assets (Q) - Assets that will be allowed to accumulate tax-free investment earnings until withdrawn atretirement. These assets are normally invested in a 401(k), 403(b), SEP, Keogh or IRA.
Risk - The unpredictability of investment returns. The chance that the actual return from investment in an asset class willbe different from its assumed return. Risk is measured statistically using standard deviation.
Sharpe Ratio - A measure of incremental assumed return (in inflation dollars) provided by an asset class or asset mix fortaking additional risk. Higher values of the Sharpe Ratio are desirable. Measured as excess return (expected return less therisk-free return) divided by risk (standard deviation).
Standard Deviation - An estimate of the possible future dispersion (or divergence) of the actual returns from an asset classaround its expected return. The standard deviation for an asset class represents its estimated average annual investmentrisk. Investment risk is based on the notion of uncertainty. The less certain it is that an asset class will generate its return,the higher the risk of that asset class.
Total Return - The combined return in current income and capital appreciation from investment in an asset class.
AllocationMaster Report American Research Institute in Turkey
Prepared by Stephen Larkin 13

Turnover Rate - The Turnover Rate for an Asset Class is the estimated average annual portion of the holdings in the AssetClass that are expected to be bought and sold each year.
Yield - The current cash income received from investment in an asset class. Bonds provide yield in the form of interestpayments and stocks through dividends.
AllocationMaster Report American Research Institute in Turkey
Prepared by Stephen Larkin 14

Notes
.
.
.
.
.
.
.
.
.
.
.
.
.
.
.
.
.
.
.
.
.
.
.
.
.
.
.
.
.
.
.
AllocationMaster Report American Research Institute in Turkey
Prepared by Stephen Larkin 15

AllocationMaster Report
Prepared for:
American Research Institute in Turkey(70/30 Allocation- 4% Spend)
March 04, 2011
Prepared by:
Stephen Larkin
1735 MARKET STPhiladelphia, PA 19103-7589

Table of Contents
Client Data Inputs .... 3Scenario Assumptions .... 4Asset Mix Comparison - Non-Qualified Assets .... 5Hypothetical Projected Assets - Actual Dollars .... 6Financial Forecast - Proposed Mix - Composite - Actual Dollars .... 7Financial Forecast - Proposed Mix - Composite - Inflation Adjusted Dollars .... 8Simulation Analysis - Range of Returns (After-Tax) .... 9Simulation Analysis - Range of Assets .... 10Simulation Analysis - Range of Assets - Inflation Adjusted Dollars .... 11Implementation Plan Disclosure .... 12Glossary - Key Terms .... 13
This asset allocation analysis is provided to you for informational purposes only. Actual investment results may be materially differentfrom the projected performance results portrayed. This report uses information that is considered reliable, but it does not represent thatthe information is accurate or complete, and the report may not be relied upon as such. The report is not intended to be either anexpressed or implied guaranty of actual performance. It is not intended to supply tax or legal advice. There is no solicitation to buy orsell securities. The deduction of advisory fees, brokerage or other commissions, and any other expenses that would have been paidmay not be reflected in the analysis. The results portrayed reflect the reinvestment of dividends and other earnings.
AllocationMaster Report American Research Institute in Turkey
Prepared by Stephen Larkin 2

Client Data Inputs
Federal Income Tax Rate:State Income Tax Rate:Federal Capital Gains Tax Rate:State Capital Gains Tax Rate:
0.00%0.00%0.00%0.00%
Non-Qualified Fee:Qualified Fee:Non-Qual Tax-Deferred Fee:
1.25%1.25%1.25%
Future Federal Income Tax Rate:Future State Income Tax Rate:Future Federal Capital Gains Tax Rate:Future State Capital Gains Tax Rate:
Starting Year:
0.00%0.00%0.00%0.00%
2011
Non-Qualified Assets
Market % of Cost # ofAsset Class Product Name Value Total Basis Shares Hold Symbol
Cash Equivalents $1,525,833 100% $1,525,833 0.0 No
Total* $1,525,833
Qualified Assets
Market % of Cost # ofAsset Class Product Name Value Total Basis Shares Hold Symbol
Total* $0
Other Spending Goals
Spend 4.00% of Non-Qual Market Value
*The amount shown includes only those assets that have been assigned to an asset class.
AllocationMaster Report American Research Institute in Turkey
Prepared by Stephen Larkin 3

Scenario Assumptions
Scenario AssumptionsAsset Class Index Proxy Return Risk Yield Dividend TurnoverCash Equivalents FED 3-Mo T-Bill (S) 2.50% 0.60% 3.50% 0.00% 100.00%Taxable Bonds BarCapAggregateBnd 4.00% 4.00% 5.00% 0.00% 40.00%Tax-Exempt Bonds FED 3-Mo T-Bill (S) 3.60% 3.80% 4.00% 0.00% 40.00%High Yield BarCap High Yield 7.00% 8.50% 7.00% 0.00% 40.00%Large Cap Stocks S&P 500 Composite 8.00% 16.70% 0.00% 1.80% 5.00%Mid Cap Stocks S&P 400 MidCap 8.75% 19.70% 0.00% 1.25% 20.00%Small Cap Stocks RUSS 2000 Index 9.50% 21.70% 0.00% 1.50% 10.00%Real Estate FED 3-Mo T-Bill (S) 7.50% 13.00% 3.50% 0.00% 15.00%Long/Short Hedge HFRI FundofFundComp 7.50% 9.00% 0.00% 0.00% 75.00%Absolute Ret Hedge HFRI FundofFundComp 6.00% 7.00% 0.00% 0.00% 75.00%Private Equity CAMB US Private Eqty 12.00% 21.00% 0.00% 0.00% 10.00%International Stocks MSCI EAFE Index-$ 7.80% 17.80% 0.00% 1.00% 10.00%Emerging Mkts MSCI Emerg Free-$ 10.00% 25.00% 0.00% 0.00% 10.00%Commodities S&P GSCI Index 7.00% 21.00% 3.50% 0.00% 100.00%Managed Futures BARC CTA Index 6.00% 6.00% 6.30% 0.00% 100.00%
Inflation Rate: 2.50%
The long-term capital market assumptions were developed and reviewed by the SunGard Assumptions Committee. The Committeerelies on the input and expertise of a range of product managers and analysts and is based upon what they believe is appropriate. TheCommittee's goal in asset allocation modeling work is to provide underlying assumptions that will help advisors guide their clientsinto a long-term investment strategy that is appropriate for that client's financial situation and tolerance for risk. Key elements inSunGard's assessment of the capital market assumptions include: 1) Quarterly reviews of the markets, loosely based upon historicalperformance and expected future results; 2) Historical data contained in SunGard's Index Histories Database including contracts withvendors such as Morningstar, Barclay's Capital, Citigroup, The Conference Board, and the Commodities Research Board, etc. Thedata goes back to 1960 or date of inception of the index and is supplemented with information from the annual Stocks, Bonds, Billsand Inflation Yearbook for data back to 1926 on major markets.
AllocationMaster Report American Research Institute in Turkey
Prepared by Stephen Larkin 4

Asset Mix Comparison - Non-Qualified AssetsPresent Asset Mix Proposed Asset Mix
Present Asset Mix Proposed Asset Mix AdjustmentCash Equivalents $1,525,833 100.00% $0 0.00% ($1,525,833)Tax-Exempt Bonds $0 0.00% $404,346 26.50% $404,346Large Cap Stocks $0 0.00% $508,102 33.30% $508,102Mid Cap Stocks $0 0.00% $80,869 5.30% $80,869Small Cap Stocks $0 0.00% $39,672 2.60% $39,672Long/Short Hedge $0 0.00% $128,170 8.40% $128,170International Stocks $0 0.00% $160,212 10.50% $160,212Emerging Mkts $0 0.00% $137,325 9.00% $137,325Commodities $0 0.00% $21,362 1.40% $21,362Managed Futures $0 0.00% $45,775 3.00% $45,775
Total $1,525,833 100.00% $1,525,833 100.00%
Before-Tax Gross Return 2.50% 6.96%Before-Tax Net Return 1.25% 5.71%After-Tax Net Return 1.25% 5.71%Standard Deviation (Risk) 0.60% 10.12%Sharpe Ratio -3.75 0.22After-Tax Yield 2.25% 1.10%
This is for illustrative purposes only. Past performance is not an indication of future returns.
AllocationMaster Report American Research Institute in Turkey
Prepared by Stephen Larkin 5

Hypothetical Projected Assets - Actual Dollars
Present Asset MixProposed Asset Mix
The Projected Assets as shown above represent the projected Asset Value for the Present Asset Mix and the Proposed Asset Mix overthe projection period, using broad sector return assumption in line with historic returns. Implicit in these assumptions is that theinvestment returns would theoretically match the historic returns and based on this assumption, the graph indicates whether you wouldbe expected to have sufficient assets to meet your financial goals. The Asset Value shown is the beginning of year after-tax marketvalue for your combined Non-Qualified and Qualified assets. As individual investment returns may vary substantially, there can be noguarantee or promise of achieving the goals as stated above. These assumptions are also true of the Financial Forecast tables thatfollow.
AllocationMaster Report American Research Institute in Turkey
Prepared by Stephen Larkin 6

Financial Forecast - Proposed Mix - Composite - Actual DollarsAsset Financial Current Capital Addt'l Net $
Date Value Goals Income Gains Taxes Contribs Change3/ 2011 $1,525,833 $61,033 $13,086 $73,974 $0 $0 $26,0273/ 2012 $1,551,860 $62,074 $13,310 $75,236 $0 $0 $26,4713/ 2013 $1,578,331 $63,133 $13,537 $76,519 $0 $0 $26,9223/ 2014 $1,605,253 $64,210 $13,767 $77,824 $0 $0 $27,3823/ 2015 $1,632,635 $65,305 $14,002 $79,152 $0 $0 $27,8493/ 2016 $1,660,483 $66,419 $14,241 $80,502 $0 $0 $28,3243/ 2017 $1,688,807 $67,552 $14,484 $81,875 $0 $0 $28,8073/ 2018 $1,717,614 $68,705 $14,731 $83,272 $0 $0 $29,2983/ 2019 $1,746,912 $69,876 $14,982 $84,692 $0 $0 $29,7983/ 2020 $1,776,710 $71,068 $15,238 $86,137 $0 $0 $30,3063/ 2021 $1,807,016 $72,281 $15,498 $87,606 $0 $0 $30,8233/ 2022 $1,837,839 $73,514 $15,762 $89,100 $0 $0 $31,3493/ 2023 $1,869,188 $74,768 $16,031 $90,620 $0 $0 $31,8843/ 2024 $1,901,072 $76,043 $16,305 $92,166 $0 $0 $32,4283/ 2025 $1,933,500 $77,340 $16,583 $93,738 $0 $0 $32,9813/ 2026 $1,966,480 $78,659 $16,866 $95,337 $0 $0 $33,5433/ 2027 $2,000,024 $80,001 $17,153 $96,963 $0 $0 $34,1153/ 2028 $2,034,139 $81,366 $17,446 $98,617 $0 $0 $34,6973/ 2029 $2,068,836 $82,753 $17,743 $100,299 $0 $0 $35,2893/ 2030 $2,104,125 $84,165 $18,046 $102,010 $0 $0 $35,8913/ 2031 $2,140,017 $85,601 $18,354 $103,750 $0 $0 $36,5033/ 2032 $2,176,520 $87,061 $18,667 $105,520 $0 $0 $37,1263/ 2033 $2,213,646 $88,546 $18,985 $107,320 $0 $0 $37,7593/ 2034 $2,251,405 $90,056 $19,309 $109,150 $0 $0 $38,4033/ 2035 $2,289,809 $91,592 $19,639 $111,012 $0 $0 $39,0583/ 2036 $2,328,867 $93,155 $19,974 $112,906 $0 $0 $39,7253/ 2037 $2,368,592 $94,744 $20,314 $114,832 $0 $0 $40,4023/ 2038 $2,408,994 $96,360 $20,661 $116,790 $0 $0 $41,0913/ 2039 $2,450,085 $98,003 $21,013 $118,783 $0 $0 $41,7923/ 2040 $2,491,878 $99,675 $21,372 $120,809 $0 $0 $42,5053/ 2041 $2,534,383
AllocationMaster Report American Research Institute in Turkey
Prepared by Stephen Larkin 7

Financial Forecast - Proposed Mix - Composite - Inflation Adjusted DollarsAsset Financial Current Capital Addt'l Net $
Date Value Goals Income Gains Taxes Contribs Change3/ 2011 $1,525,833 $61,033 $13,086 $36,124 $0 $0 ($11,823)3/ 2012 $1,514,010 $60,560 $12,985 $35,844 $0 $0 ($11,732)3/ 2013 $1,502,278 $60,091 $12,884 $35,566 $0 $0 ($11,641)3/ 2014 $1,490,637 $59,625 $12,784 $35,290 $0 $0 ($11,551)3/ 2015 $1,479,086 $59,163 $12,685 $35,017 $0 $0 ($11,461)3/ 2016 $1,467,625 $58,705 $12,587 $34,746 $0 $0 ($11,372)3/ 2017 $1,456,253 $58,250 $12,490 $34,476 $0 $0 ($11,284)3/ 2018 $1,444,969 $57,799 $12,393 $34,209 $0 $0 ($11,197)3/ 2019 $1,433,772 $57,351 $12,297 $33,944 $0 $0 ($11,110)3/ 2020 $1,422,662 $56,906 $12,201 $33,681 $0 $0 ($11,024)3/ 2021 $1,411,638 $56,466 $12,107 $33,420 $0 $0 ($10,938)3/ 2022 $1,400,700 $56,028 $12,013 $33,161 $0 $0 ($10,854)3/ 2023 $1,389,846 $55,594 $11,920 $32,904 $0 $0 ($10,770)3/ 2024 $1,379,076 $55,163 $11,828 $32,649 $0 $0 ($10,686)3/ 2025 $1,368,390 $54,736 $11,736 $32,396 $0 $0 ($10,603)3/ 2026 $1,357,787 $54,311 $11,645 $32,145 $0 $0 ($10,521)3/ 2027 $1,347,266 $53,891 $11,555 $31,896 $0 $0 ($10,440)3/ 2028 $1,336,826 $53,473 $11,465 $31,649 $0 $0 ($10,359)3/ 2029 $1,326,467 $53,059 $11,376 $31,404 $0 $0 ($10,279)3/ 2030 $1,316,189 $52,648 $11,288 $31,160 $0 $0 ($10,199)3/ 2031 $1,305,990 $52,240 $11,201 $30,919 $0 $0 ($10,120)3/ 2032 $1,295,870 $51,835 $11,114 $30,679 $0 $0 ($10,041)3/ 2033 $1,285,829 $51,433 $11,028 $30,442 $0 $0 ($9,964)3/ 2034 $1,275,865 $51,035 $10,942 $30,206 $0 $0 ($9,886)3/ 2035 $1,265,979 $50,639 $10,858 $29,972 $0 $0 ($9,810)3/ 2036 $1,256,169 $50,247 $10,774 $29,739 $0 $0 ($9,734)3/ 2037 $1,246,435 $49,857 $10,690 $29,509 $0 $0 ($9,658)3/ 2038 $1,236,777 $49,471 $10,607 $29,280 $0 $0 ($9,584)3/ 2039 $1,227,193 $49,088 $10,525 $29,053 $0 $0 ($9,509)3/ 2040 $1,217,684 $48,707 $10,443 $28,828 $0 $0 ($9,436)3/ 2041 $1,208,248
AllocationMaster Report American Research Institute in Turkey
Prepared by Stephen Larkin 8

Simulation Analysis - Range of Returns (After-Tax)
Present Asset MixProposed Asset Mix
Probability of Exceeding Return* 1 Year 5 Years 10 Years 20 Years 30 Years
Present2% 2.6% 1.8% 1.7% 1.5% 1.5%16% 1.9% 1.5% 1.4% 1.4% 1.4%50% 1.3% 1.2% 1.2% 1.2% 1.2%84% 0.6% 1.0% 1.1% 1.1% 1.1%98% 0.0% 0.7% 0.9% 1.0% 1.0%
Proposed2% 30.6% 15.2% 12.4% 9.8% 8.7%16% 16.3% 9.5% 8.1% 7.1% 6.9%50% 4.8% 5.0% 5.3% 5.3% 5.2%84% -4.9% 0.8% 2.3% 3.0% 3.6%98% -12.5% -2.9% -0.9% 1.1% 1.8%
* The Probability of Exceeding Return column shows the likelihood of exceeding the after-tax compound returns shown in theTime Horizons. For example, in the Proposed Portfolio, there is a 2% likelihood of exceeding 30.6% and a 98% likelihood ofexceeding -12.5% when all simulated returns are considered at 1 Year.
The simulated range of annualized compound returns for the Present and Proposed Composite Asset Mixes are shown over theprojection period. The expected ranges of returns are represented by the bars. There is a 98% chance of realizing a return that isgreater than the simulated worst case return. And, there is a 2% chance of exceeding the simulated best case return. The expectedrange of returns narrows over longer time periods and for more conservative portfolios. PLEASE REFER TO THE MONTE CARLOSIMULATION METHODOLOGY PRINTED REPORT PAGE FOR MORE INFORMATION REGARDING THEMETHODOLOGY, LIMITATIONS AND KEY ASSUMPTIONS OF MONTE CARLO SIMULATION.
AllocationMaster Report American Research Institute in Turkey
Prepared by Stephen Larkin 9

Simulation Analysis - Range of Assets
Present Asset MixProposed Asset Mix
1 Year 5 Years 10 Years 20 Years 30 Years
PresentBest Case $1,502,189 $1,363,084 $1,204,078 $928,391 $708,026Expected Case $1,484,313 $1,326,257 $1,153,569 $874,391 $659,554Worst Case $1,464,874 $1,288,551 $1,105,089 $818,136 $609,142
ProposedBest Case $1,901,795 $2,513,270 $3,471,499 $4,757,205 $6,398,067Expected Case $1,543,585 $1,622,285 $1,684,001 $1,919,757 $2,171,806Worst Case $1,257,101 $1,025,883 $928,284 $742,829 $661,124
The simulated range of projected asset values for the Present and Proposed Composite Asset Mixes are shown over the projectionperiod. The entire range of asset values covering the best case to worst case outcomes are represented by the bars. There is a 98%chance of realizing an asset value that is greater than the simulated worst-case. And, there is a 2% chance of exceeding the simulatedbest-case asset value. The range of asset values widens over longer time periods and for more aggressive portfolios. PLEASE REFERTO THE MONTE CARLO SIMULATION METHODOLOGY PRINTED REPORT PAGE FOR MORE INFORMATIONREGARDING THE METHODOLOGY, LIMITATIONS AND KEY ASSUMPTIONS OF MONTE CARLO SIMULATION.
AllocationMaster Report American Research Institute in Turkey
Prepared by Stephen Larkin 10
Simulation Analysis - Range of Assets - Inflation Adjusted Dollars
Present Asset MixProposed Asset Mix
1 Year 5 Years 10 Years 20 Years 30 Years
PresentBest Case $1,465,551 $1,204,768 $940,624 $566,570 $337,546Expected Case $1,448,110 $1,172,218 $901,166 $533,615 $314,437Worst Case $1,429,146 $1,138,891 $863,294 $499,285 $290,404
ProposedBest Case $1,855,410 $2,221,364 $2,711,929 $2,903,184 $3,050,232Expected Case $1,505,937 $1,433,863 $1,315,539 $1,171,572 $1,035,393Worst Case $1,226,440 $906,731 $725,174 $453,327 $315,186
The simulated range of projected asset values for the Present and Proposed Composite Asset Mixes are shown over the projectionperiod. The entire range of asset values covering the best case to worst case outcomes are represented by the bars. There is a 98%chance of realizing an asset value that is greater than the simulated worst-case. And, there is a 2% chance of exceeding the simulatedbest-case asset value. The range of asset values widens over longer time periods and for more aggressive portfolios. PLEASE REFERTO THE MONTE CARLO SIMULATION METHODOLOGY PRINTED REPORT PAGE FOR MORE INFORMATIONREGARDING THE METHODOLOGY, LIMITATIONS AND KEY ASSUMPTIONS OF MONTE CARLO SIMULATION.
AllocationMaster Report American Research Institute in Turkey
Prepared by Stephen Larkin 11

Implementation Plan Disclosure
The Implementation tool does not provide preferential treatment to any specific security or investment. Thedatabase to determine specific security assignation to asset classes is populated by data through an independentthird party company. The information contained herein has been derived from sources considered reliable, butno independent verification has been made and no guarantee can be made as to its accuracy or completeness.
Products such as mutual funds, exchange traded funds, money market funds, equities and variable annuitysubaccounts may be part of this recommendation. These products are sold only by prospectus. Please carefullyread the investment company’s prospectus for information concerning features of the products, investmentobjectives, risks, surrender periods, penalties, fees and any other internal expenses. A prospectus can beobtained from your investment professional and should be carefully read before investing. Please informyour investment professional of any concerns raised by any of the information contained within this reportincluding asset class and/or security assignation.
AllocationMaster Report American Research Institute in Turkey
Prepared by Stephen Larkin 12

Glossary - Key Terms
Aggressive Investment Posture - Asset mixes that have relatively more risk will often provide higher potential returns,with greater uncertainty. Sometimes, aggressive asset mixes do not produce higher returns than more conservative assetmixes.
Asset Allocation - The process of determining what proportions of your portfolio holdings are to be invested in thevarious asset classes.
Asset Class - A standard term which broadly defines a category of potential investments.
Asset Mix - The percentage weightings (or mix) of different asset classes to be held in the portfolio. There may beseparate asset mixes for the taxable and tax-deferred holdings in a portfolio.
Conservative Investment Posture - Asset mixes that have relatively low risk in general will often also have lowerlong-term returns than more aggressive asset mixes, with more certainty.
Current Dollars - A forecast of the asset value stated in terms of the actual dollars held, not in terms of purchasing power.
Dividend Yield - The Dividend Yield for an Asset Class is its estimated average annual dividends and are included in theoverall Yield statistics for the portfolio. The Dividend Yield is the portion of the Expected Return for the Asset Class thatwill be earned each year in the form of dividends.
Efficient Frontier - Plots the asset mixes, ranging from conservative to aggressive, that provide the best trade-off of riskand return. These "efficient" asset mixes provide (1) the maximum available assumed return for a given level of risk and(2) the minimum available level of risk for a given level of assumed return.
Expected Return - The Expected Return is the annual return expected to be achieved on average over the ProjectionPeriod. Remember that this is not intended as a guarantee or meant to reflect the performance of any investment product.It is simply a historical return based on an index.
Inflation Dollars - A forecast of the asset value measured in terms of purchasing power. Because of inflation, investmentdollars will probably not be able to buy as much in the future as they can today.
Non-Qualified Assets (NQ) - Assets that are currently subject to federal, state and local taxes.
Non-Qualified Tax Deferred Assets (NQTD) - Assets that will be allowed to accumulate tax-deferred for the purpose ofmeeting long-term retirement income needs. These assets are normally invested in annuities.
Qualified Assets (Q) - Assets that will be allowed to accumulate tax-free investment earnings until withdrawn atretirement. These assets are normally invested in a 401(k), 403(b), SEP, Keogh or IRA.
Risk - The unpredictability of investment returns. The chance that the actual return from investment in an asset class willbe different from its assumed return. Risk is measured statistically using standard deviation.
Sharpe Ratio - A measure of incremental assumed return (in inflation dollars) provided by an asset class or asset mix fortaking additional risk. Higher values of the Sharpe Ratio are desirable. Measured as excess return (expected return less therisk-free return) divided by risk (standard deviation).
Standard Deviation - An estimate of the possible future dispersion (or divergence) of the actual returns from an asset classaround its expected return. The standard deviation for an asset class represents its estimated average annual investmentrisk. Investment risk is based on the notion of uncertainty. The less certain it is that an asset class will generate its return,the higher the risk of that asset class.
Total Return - The combined return in current income and capital appreciation from investment in an asset class.
AllocationMaster Report American Research Institute in Turkey
Prepared by Stephen Larkin 13

Turnover Rate - The Turnover Rate for an Asset Class is the estimated average annual portion of the holdings in the AssetClass that are expected to be bought and sold each year.
Yield - The current cash income received from investment in an asset class. Bonds provide yield in the form of interestpayments and stocks through dividends.
AllocationMaster Report American Research Institute in Turkey
Prepared by Stephen Larkin 14

Notes
.
.
.
.
.
.
.
.
.
.
.
.
.
.
.
.
.
.
.
.
.
.
.
.
.
.
.
.
.
.
.
AllocationMaster Report American Research Institute in Turkey
Prepared by Stephen Larkin 15

AllocationMaster Report
Prepared for:
American Research Institute in Turkey(70/30 Allocation- 5% Spend)
March 04, 2011
Prepared by:
Stephen Larkin
1735 MARKET STPhiladelphia, PA 19103-7589

Table of Contents
Client Data Inputs .... 3Scenario Assumptions .... 4Asset Mix Comparison - Non-Qualified Assets .... 5Hypothetical Projected Assets - Actual Dollars .... 6Financial Forecast - Proposed Mix - Composite - Actual Dollars .... 7Financial Forecast - Proposed Mix - Composite - Inflation Adjusted Dollars .... 8Simulation Analysis - Range of Returns (After-Tax) .... 9Simulation Analysis - Range of Assets .... 10Simulation Analysis - Range of Assets - Inflation Adjusted Dollars .... 11Implementation Plan Disclosure .... 12Glossary - Key Terms .... 13
This asset allocation analysis is provided to you for informational purposes only. Actual investment results may be materially differentfrom the projected performance results portrayed. This report uses information that is considered reliable, but it does not represent thatthe information is accurate or complete, and the report may not be relied upon as such. The report is not intended to be either anexpressed or implied guaranty of actual performance. It is not intended to supply tax or legal advice. There is no solicitation to buy orsell securities. The deduction of advisory fees, brokerage or other commissions, and any other expenses that would have been paidmay not be reflected in the analysis. The results portrayed reflect the reinvestment of dividends and other earnings.
AllocationMaster Report American Research Institute in Turkey
Prepared by Stephen Larkin 2

Client Data Inputs
Federal Income Tax Rate:State Income Tax Rate:Federal Capital Gains Tax Rate:State Capital Gains Tax Rate:
0.00%0.00%0.00%0.00%
Non-Qualified Fee:Qualified Fee:Non-Qual Tax-Deferred Fee:
1.25%1.25%1.25%
Future Federal Income Tax Rate:Future State Income Tax Rate:Future Federal Capital Gains Tax Rate:Future State Capital Gains Tax Rate:
Starting Year:
0.00%0.00%0.00%0.00%
2011
Non-Qualified Assets
Market % of Cost # ofAsset Class Product Name Value Total Basis Shares Hold Symbol
Cash Equivalents $1,525,833 100% $1,525,833 0.0 No
Total* $1,525,833
Qualified Assets
Market % of Cost # ofAsset Class Product Name Value Total Basis Shares Hold Symbol
Total* $0
Other Spending Goals
Spend 5.00% of Non-Qual Market Value
*The amount shown includes only those assets that have been assigned to an asset class.
AllocationMaster Report American Research Institute in Turkey
Prepared by Stephen Larkin 3
Scenario Assumptions
Scenario AssumptionsAsset Class Index Proxy Return Risk Yield Dividend TurnoverCash Equivalents FED 3-Mo T-Bill (S) 2.50% 0.60% 3.50% 0.00% 100.00%Taxable Bonds BarCapAggregateBnd 4.00% 4.00% 5.00% 0.00% 40.00%Tax-Exempt Bonds FED 3-Mo T-Bill (S) 3.60% 3.80% 4.00% 0.00% 40.00%High Yield BarCap High Yield 7.00% 8.50% 7.00% 0.00% 40.00%Large Cap Stocks S&P 500 Composite 8.00% 16.70% 0.00% 1.80% 5.00%Mid Cap Stocks S&P 400 MidCap 8.75% 19.70% 0.00% 1.25% 20.00%Small Cap Stocks RUSS 2000 Index 9.50% 21.70% 0.00% 1.50% 10.00%Real Estate FED 3-Mo T-Bill (S) 7.50% 13.00% 3.50% 0.00% 15.00%Long/Short Hedge HFRI FundofFundComp 7.50% 9.00% 0.00% 0.00% 75.00%Absolute Ret Hedge HFRI FundofFundComp 6.00% 7.00% 0.00% 0.00% 75.00%Private Equity CAMB US Private Eqty 12.00% 21.00% 0.00% 0.00% 10.00%International Stocks MSCI EAFE Index-$ 7.80% 17.80% 0.00% 1.00% 10.00%Emerging Mkts MSCI Emerg Free-$ 10.00% 25.00% 0.00% 0.00% 10.00%Commodities S&P GSCI Index 7.00% 21.00% 3.50% 0.00% 100.00%Managed Futures BARC CTA Index 6.00% 6.00% 6.30% 0.00% 100.00%
Inflation Rate: 2.50%
The long-term capital market assumptions were developed and reviewed by the SunGard Assumptions Committee. The Committeerelies on the input and expertise of a range of product managers and analysts and is based upon what they believe is appropriate. TheCommittee's goal in asset allocation modeling work is to provide underlying assumptions that will help advisors guide their clientsinto a long-term investment strategy that is appropriate for that client's financial situation and tolerance for risk. Key elements inSunGard's assessment of the capital market assumptions include: 1) Quarterly reviews of the markets, loosely based upon historicalperformance and expected future results; 2) Historical data contained in SunGard's Index Histories Database including contracts withvendors such as Morningstar, Barclay's Capital, Citigroup, The Conference Board, and the Commodities Research Board, etc. Thedata goes back to 1960 or date of inception of the index and is supplemented with information from the annual Stocks, Bonds, Billsand Inflation Yearbook for data back to 1926 on major markets.
AllocationMaster Report American Research Institute in Turkey
Prepared by Stephen Larkin 4

Asset Mix Comparison - Non-Qualified AssetsPresent Asset Mix Proposed Asset Mix
Present Asset Mix Proposed Asset Mix AdjustmentCash Equivalents $1,525,833 100.00% $0 0.00% ($1,525,833)Tax-Exempt Bonds $0 0.00% $404,346 26.50% $404,346Large Cap Stocks $0 0.00% $508,102 33.30% $508,102Mid Cap Stocks $0 0.00% $80,869 5.30% $80,869Small Cap Stocks $0 0.00% $39,672 2.60% $39,672Long/Short Hedge $0 0.00% $128,170 8.40% $128,170International Stocks $0 0.00% $160,212 10.50% $160,212Emerging Mkts $0 0.00% $137,325 9.00% $137,325Commodities $0 0.00% $21,362 1.40% $21,362Managed Futures $0 0.00% $45,775 3.00% $45,775
Total $1,525,833 100.00% $1,525,833 100.00%
Before-Tax Gross Return 2.50% 6.96%Before-Tax Net Return 1.25% 5.71%After-Tax Net Return 1.25% 5.71%Standard Deviation (Risk) 0.60% 10.12%Sharpe Ratio -3.75 0.22After-Tax Yield 2.25% 1.10%
This is for illustrative purposes only. Past performance is not an indication of future returns.
AllocationMaster Report American Research Institute in Turkey
Prepared by Stephen Larkin 5

Hypothetical Projected Assets - Actual Dollars
Present Asset MixProposed Asset Mix
The Projected Assets as shown above represent the projected Asset Value for the Present Asset Mix and the Proposed Asset Mix overthe projection period, using broad sector return assumption in line with historic returns. Implicit in these assumptions is that theinvestment returns would theoretically match the historic returns and based on this assumption, the graph indicates whether you wouldbe expected to have sufficient assets to meet your financial goals. The Asset Value shown is the beginning of year after-tax marketvalue for your combined Non-Qualified and Qualified assets. As individual investment returns may vary substantially, there can be noguarantee or promise of achieving the goals as stated above. These assumptions are also true of the Financial Forecast tables thatfollow.
AllocationMaster Report American Research Institute in Turkey
Prepared by Stephen Larkin 6

Financial Forecast - Proposed Mix - Composite - Actual DollarsAsset Financial Current Capital Addt'l Net $
Date Value Goals Income Gains Taxes Contribs Change3/ 2011 $1,525,833 $76,292 $13,086 $73,974 $0 $0 $10,7693/ 2012 $1,536,602 $76,830 $13,179 $74,496 $0 $0 $10,8453/ 2013 $1,547,446 $77,372 $13,272 $75,022 $0 $0 $10,9213/ 2014 $1,558,367 $77,918 $13,365 $75,551 $0 $0 $10,9983/ 2015 $1,569,365 $78,468 $13,460 $76,084 $0 $0 $11,0763/ 2016 $1,580,441 $79,022 $13,555 $76,621 $0 $0 $11,1543/ 2017 $1,591,595 $79,580 $13,650 $77,162 $0 $0 $11,2333/ 2018 $1,602,828 $80,141 $13,747 $77,707 $0 $0 $11,3123/ 2019 $1,614,140 $80,707 $13,844 $78,255 $0 $0 $11,3923/ 2020 $1,625,532 $81,277 $13,941 $78,807 $0 $0 $11,4723/ 2021 $1,637,004 $81,850 $14,040 $79,364 $0 $0 $11,5533/ 2022 $1,648,557 $82,428 $14,139 $79,924 $0 $0 $11,6353/ 2023 $1,660,192 $83,010 $14,239 $80,488 $0 $0 $11,7173/ 2024 $1,671,908 $83,595 $14,339 $81,056 $0 $0 $11,7993/ 2025 $1,683,708 $84,185 $14,440 $81,628 $0 $0 $11,8833/ 2026 $1,695,591 $84,780 $14,542 $82,204 $0 $0 $11,9673/ 2027 $1,707,557 $85,378 $14,645 $82,784 $0 $0 $12,0513/ 2028 $1,719,608 $85,980 $14,748 $83,368 $0 $0 $12,1363/ 2029 $1,731,745 $86,587 $14,852 $83,957 $0 $0 $12,2223/ 2030 $1,743,966 $87,198 $14,957 $84,549 $0 $0 $12,3083/ 2031 $1,756,274 $87,814 $15,063 $85,146 $0 $0 $12,3953/ 2032 $1,768,669 $88,433 $15,169 $85,747 $0 $0 $12,4823/ 2033 $1,781,152 $89,058 $15,276 $86,352 $0 $0 $12,5703/ 2034 $1,793,722 $89,686 $15,384 $86,961 $0 $0 $12,6593/ 2035 $1,806,381 $90,319 $15,492 $87,575 $0 $0 $12,7493/ 2036 $1,819,130 $90,956 $15,602 $88,193 $0 $0 $12,8393/ 2037 $1,831,968 $91,598 $15,712 $88,816 $0 $0 $12,9293/ 2038 $1,844,898 $92,245 $15,823 $89,442 $0 $0 $13,0203/ 2039 $1,857,918 $92,896 $15,934 $90,074 $0 $0 $13,1123/ 2040 $1,871,030 $93,552 $16,047 $90,709 $0 $0 $13,2053/ 2041 $1,884,235
AllocationMaster Report American Research Institute in Turkey
Prepared by Stephen Larkin 7

Financial Forecast - Proposed Mix - Composite - Inflation Adjusted DollarsAsset Financial Current Capital Addt'l Net $
Date Value Goals Income Gains Taxes Contribs Change3/ 2011 $1,525,833 $76,292 $13,086 $36,496 $0 $0 ($26,710)3/ 2012 $1,499,123 $74,956 $12,857 $35,857 $0 $0 ($26,242)3/ 2013 $1,472,882 $73,644 $12,632 $35,229 $0 $0 ($25,783)3/ 2014 $1,447,099 $72,355 $12,411 $34,613 $0 $0 ($25,331)3/ 2015 $1,421,768 $71,088 $12,194 $34,007 $0 $0 ($24,888)3/ 2016 $1,396,880 $69,844 $11,980 $33,411 $0 $0 ($24,452)3/ 2017 $1,372,428 $68,621 $11,771 $32,827 $0 $0 ($24,024)3/ 2018 $1,348,403 $67,420 $11,565 $32,252 $0 $0 ($23,604)3/ 2019 $1,324,800 $66,240 $11,362 $31,687 $0 $0 ($23,190)3/ 2020 $1,301,609 $65,080 $11,163 $31,133 $0 $0 ($22,785)3/ 2021 $1,278,825 $63,941 $10,968 $30,588 $0 $0 ($22,386)3/ 2022 $1,256,439 $62,822 $10,776 $30,052 $0 $0 ($21,994)3/ 2023 $1,234,445 $61,722 $10,587 $29,526 $0 $0 ($21,609)3/ 2024 $1,212,836 $60,642 $10,402 $29,009 $0 $0 ($21,231)3/ 2025 $1,191,606 $59,580 $10,220 $28,502 $0 $0 ($20,859)3/ 2026 $1,170,747 $58,537 $10,041 $28,003 $0 $0 ($20,494)3/ 2027 $1,150,253 $57,513 $9,865 $27,512 $0 $0 ($20,135)3/ 2028 $1,130,118 $56,506 $9,692 $27,031 $0 $0 ($19,783)3/ 2029 $1,110,336 $55,517 $9,523 $26,558 $0 $0 ($19,436)3/ 2030 $1,090,899 $54,545 $9,356 $26,093 $0 $0 ($19,096)3/ 2031 $1,071,803 $53,590 $9,192 $25,636 $0 $0 ($18,762)3/ 2032 $1,053,041 $52,652 $9,031 $25,187 $0 $0 ($18,433)3/ 2033 $1,034,608 $51,730 $8,873 $24,746 $0 $0 ($18,111)3/ 2034 $1,016,497 $50,825 $8,718 $24,313 $0 $0 ($17,794)3/ 2035 $998,704 $49,935 $8,565 $23,888 $0 $0 ($17,482)3/ 2036 $981,222 $49,061 $8,415 $23,469 $0 $0 ($17,176)3/ 2037 $964,045 $48,202 $8,268 $23,059 $0 $0 ($16,875)3/ 2038 $947,170 $47,358 $8,123 $22,655 $0 $0 ($16,580)3/ 2039 $930,590 $46,529 $7,981 $22,258 $0 $0 ($16,290)3/ 2040 $914,300 $45,715 $7,841 $21,869 $0 $0 ($16,005)3/ 2041 $898,295
AllocationMaster Report American Research Institute in Turkey
Prepared by Stephen Larkin 8

Simulation Analysis - Range of Returns (After-Tax)
Present Asset MixProposed Asset Mix
Probability of Exceeding Return* 1 Year 5 Years 10 Years 20 Years 30 Years
Present2% 2.5% 1.9% 1.7% 1.5% 1.5%16% 1.8% 1.5% 1.4% 1.4% 1.4%50% 1.3% 1.2% 1.2% 1.2% 1.2%84% 0.6% 1.0% 1.1% 1.1% 1.1%98% 0.1% 0.7% 0.8% 1.0% 1.0%
Proposed2% 29.7% 15.3% 12.3% 10.2% 8.9%16% 14.4% 9.8% 8.5% 7.6% 7.1%50% 5.1% 5.1% 5.3% 5.2% 5.2%84% -3.8% 0.6% 2.0% 2.8% 3.5%98% -14.3% -4.5% -1.2% 0.5% 1.5%
* The Probability of Exceeding Return column shows the likelihood of exceeding the after-tax compound returns shown in theTime Horizons. For example, in the Proposed Portfolio, there is a 2% likelihood of exceeding 29.7% and a 98% likelihood ofexceeding -14.3% when all simulated returns are considered at 1 Year.
The simulated range of annualized compound returns for the Present and Proposed Composite Asset Mixes are shown over theprojection period. The expected ranges of returns are represented by the bars. There is a 98% chance of realizing a return that isgreater than the simulated worst case return. And, there is a 2% chance of exceeding the simulated best case return. The expectedrange of returns narrows over longer time periods and for more conservative portfolios. PLEASE REFER TO THE MONTE CARLOSIMULATION METHODOLOGY PRINTED REPORT PAGE FOR MORE INFORMATION REGARDING THEMETHODOLOGY, LIMITATIONS AND KEY ASSUMPTIONS OF MONTE CARLO SIMULATION.
AllocationMaster Report American Research Institute in Turkey
Prepared by Stephen Larkin 9

Simulation Analysis - Range of Assets
Present Asset MixProposed Asset Mix
1 Year 5 Years 10 Years 20 Years 30 Years
PresentBest Case $1,486,931 $1,294,786 $1,086,313 $755,485 $519,625Expected Case $1,469,055 $1,259,447 $1,040,279 $711,101 $483,694Worst Case $1,449,616 $1,223,272 $996,113 $664,890 $446,355
ProposedBest Case $1,886,537 $2,400,870 $3,162,577 $3,931,901 $4,793,414Expected Case $1,528,327 $1,543,563 $1,523,484 $1,572,920 $1,609,921Worst Case $1,241,843 $971,331 $834,596 $602,256 $484,046
The simulated range of projected asset values for the Present and Proposed Composite Asset Mixes are shown over the projectionperiod. The entire range of asset values covering the best case to worst case outcomes are represented by the bars. There is a 98%chance of realizing an asset value that is greater than the simulated worst-case. And, there is a 2% chance of exceeding the simulatedbest-case asset value. The range of asset values widens over longer time periods and for more aggressive portfolios. PLEASE REFERTO THE MONTE CARLO SIMULATION METHODOLOGY PRINTED REPORT PAGE FOR MORE INFORMATIONREGARDING THE METHODOLOGY, LIMITATIONS AND KEY ASSUMPTIONS OF MONTE CARLO SIMULATION.
AllocationMaster Report American Research Institute in Turkey
Prepared by Stephen Larkin 10

Simulation Analysis - Range of Assets - Inflation Adjusted Dollars
Present Asset MixProposed Asset Mix
1 Year 5 Years 10 Years 20 Years 30 Years
PresentBest Case $1,450,665 $1,144,402 $848,626 $461,051 $247,727Expected Case $1,433,224 $1,113,168 $812,664 $433,965 $230,598Worst Case $1,414,259 $1,081,195 $778,162 $405,763 $212,796
ProposedBest Case $1,840,524 $2,122,019 $2,470,600 $2,399,525 $2,285,225Expected Case $1,491,051 $1,364,284 $1,190,144 $959,907 $767,518Worst Case $1,211,554 $858,515 $651,985 $367,539 $230,765
The simulated range of projected asset values for the Present and Proposed Composite Asset Mixes are shown over the projectionperiod. The entire range of asset values covering the best case to worst case outcomes are represented by the bars. There is a 98%chance of realizing an asset value that is greater than the simulated worst-case. And, there is a 2% chance of exceeding the simulatedbest-case asset value. The range of asset values widens over longer time periods and for more aggressive portfolios. PLEASE REFERTO THE MONTE CARLO SIMULATION METHODOLOGY PRINTED REPORT PAGE FOR MORE INFORMATIONREGARDING THE METHODOLOGY, LIMITATIONS AND KEY ASSUMPTIONS OF MONTE CARLO SIMULATION.
AllocationMaster Report American Research Institute in Turkey
Prepared by Stephen Larkin 11

Implementation Plan Disclosure
The Implementation tool does not provide preferential treatment to any specific security or investment. Thedatabase to determine specific security assignation to asset classes is populated by data through an independentthird party company. The information contained herein has been derived from sources considered reliable, butno independent verification has been made and no guarantee can be made as to its accuracy or completeness.
Products such as mutual funds, exchange traded funds, money market funds, equities and variable annuitysubaccounts may be part of this recommendation. These products are sold only by prospectus. Please carefullyread the investment company’s prospectus for information concerning features of the products, investmentobjectives, risks, surrender periods, penalties, fees and any other internal expenses. A prospectus can beobtained from your investment professional and should be carefully read before investing. Please informyour investment professional of any concerns raised by any of the information contained within this reportincluding asset class and/or security assignation.
AllocationMaster Report American Research Institute in Turkey
Prepared by Stephen Larkin 12
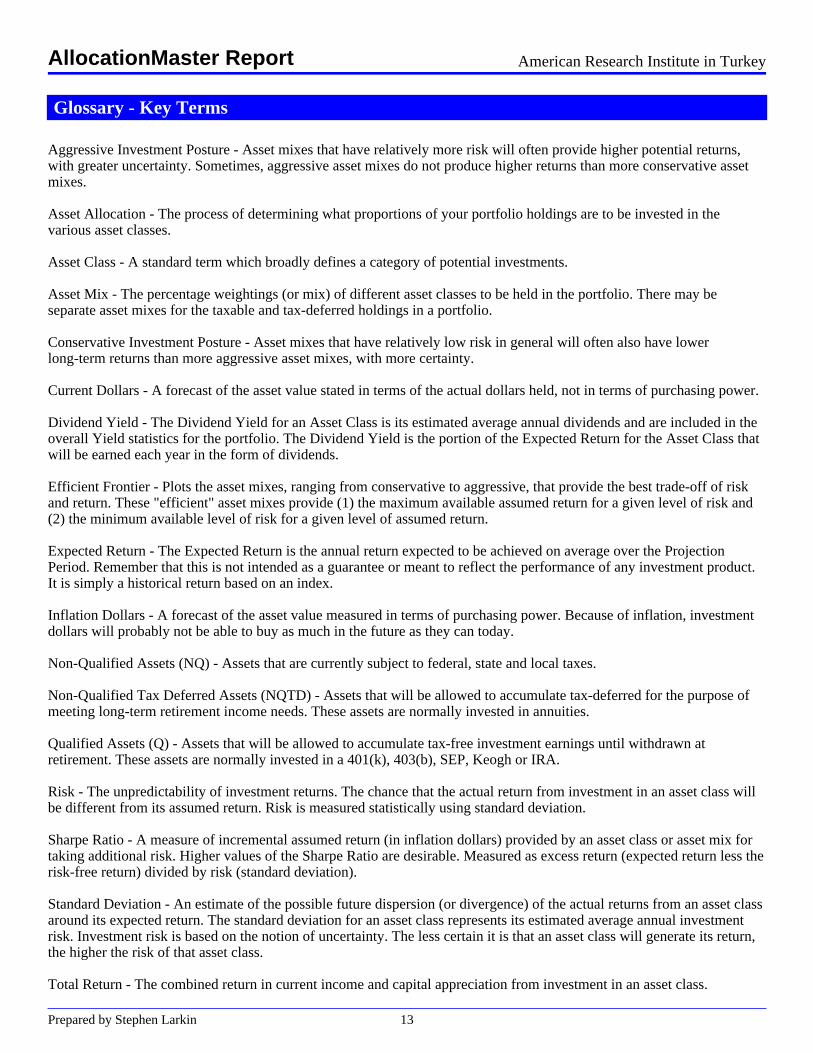
Glossary - Key Terms
Aggressive Investment Posture - Asset mixes that have relatively more risk will often provide higher potential returns,with greater uncertainty. Sometimes, aggressive asset mixes do not produce higher returns than more conservative assetmixes.
Asset Allocation - The process of determining what proportions of your portfolio holdings are to be invested in thevarious asset classes.
Asset Class - A standard term which broadly defines a category of potential investments.
Asset Mix - The percentage weightings (or mix) of different asset classes to be held in the portfolio. There may beseparate asset mixes for the taxable and tax-deferred holdings in a portfolio.
Conservative Investment Posture - Asset mixes that have relatively low risk in general will often also have lowerlong-term returns than more aggressive asset mixes, with more certainty.
Current Dollars - A forecast of the asset value stated in terms of the actual dollars held, not in terms of purchasing power.
Dividend Yield - The Dividend Yield for an Asset Class is its estimated average annual dividends and are included in theoverall Yield statistics for the portfolio. The Dividend Yield is the portion of the Expected Return for the Asset Class thatwill be earned each year in the form of dividends.
Efficient Frontier - Plots the asset mixes, ranging from conservative to aggressive, that provide the best trade-off of riskand return. These "efficient" asset mixes provide (1) the maximum available assumed return for a given level of risk and(2) the minimum available level of risk for a given level of assumed return.
Expected Return - The Expected Return is the annual return expected to be achieved on average over the ProjectionPeriod. Remember that this is not intended as a guarantee or meant to reflect the performance of any investment product.It is simply a historical return based on an index.
Inflation Dollars - A forecast of the asset value measured in terms of purchasing power. Because of inflation, investmentdollars will probably not be able to buy as much in the future as they can today.
Non-Qualified Assets (NQ) - Assets that are currently subject to federal, state and local taxes.
Non-Qualified Tax Deferred Assets (NQTD) - Assets that will be allowed to accumulate tax-deferred for the purpose ofmeeting long-term retirement income needs. These assets are normally invested in annuities.
Qualified Assets (Q) - Assets that will be allowed to accumulate tax-free investment earnings until withdrawn atretirement. These assets are normally invested in a 401(k), 403(b), SEP, Keogh or IRA.
Risk - The unpredictability of investment returns. The chance that the actual return from investment in an asset class willbe different from its assumed return. Risk is measured statistically using standard deviation.
Sharpe Ratio - A measure of incremental assumed return (in inflation dollars) provided by an asset class or asset mix fortaking additional risk. Higher values of the Sharpe Ratio are desirable. Measured as excess return (expected return less therisk-free return) divided by risk (standard deviation).
Standard Deviation - An estimate of the possible future dispersion (or divergence) of the actual returns from an asset classaround its expected return. The standard deviation for an asset class represents its estimated average annual investmentrisk. Investment risk is based on the notion of uncertainty. The less certain it is that an asset class will generate its return,the higher the risk of that asset class.
Total Return - The combined return in current income and capital appreciation from investment in an asset class.
AllocationMaster Report American Research Institute in Turkey
Prepared by Stephen Larkin 13

Turnover Rate - The Turnover Rate for an Asset Class is the estimated average annual portion of the holdings in the AssetClass that are expected to be bought and sold each year.
Yield - The current cash income received from investment in an asset class. Bonds provide yield in the form of interestpayments and stocks through dividends.
AllocationMaster Report American Research Institute in Turkey
Prepared by Stephen Larkin 14

Notes
.
.
.
.
.
.
.
.
.
.
.
.
.
.
.
.
.
.
.
.
.
.
.
.
.
.
.
.
.
.
.
AllocationMaster Report American Research Institute in Turkey
Prepared by Stephen Larkin 15