Embed Size (px)
Citation preview
Allozyme variation in some marine mussel species at anthropogenic stress and normal conditions
Nikiforov S.M.
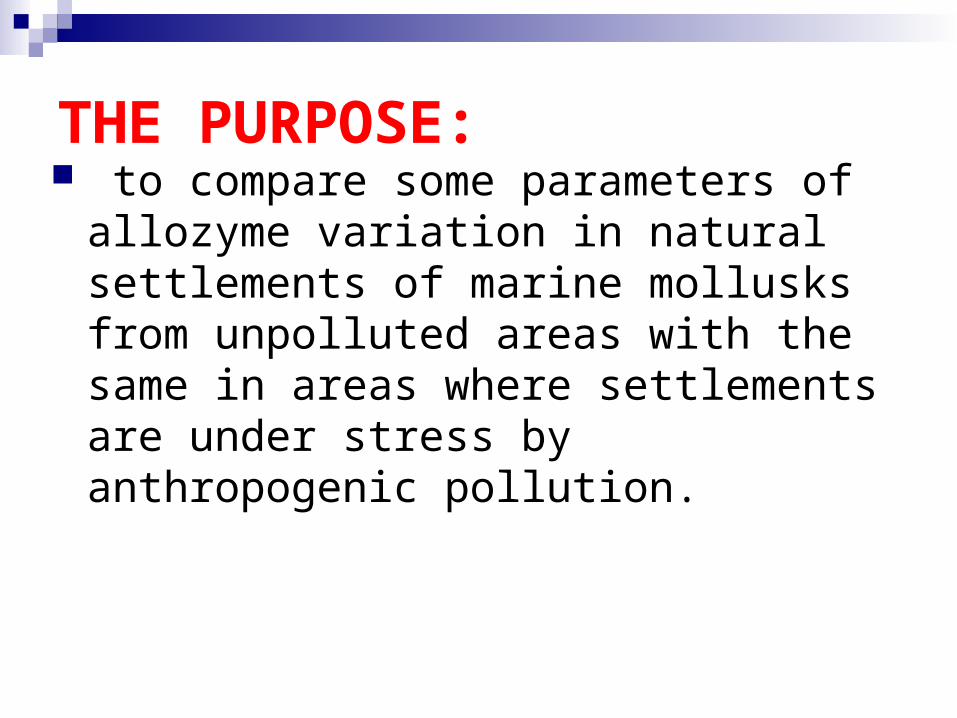
THE PURPOSE: to compare some parameters of allozyme
variation in natural settlements of marine mollusks from unpolluted areas with the same in areas where settlements are under stress by anthropogenic pollution.
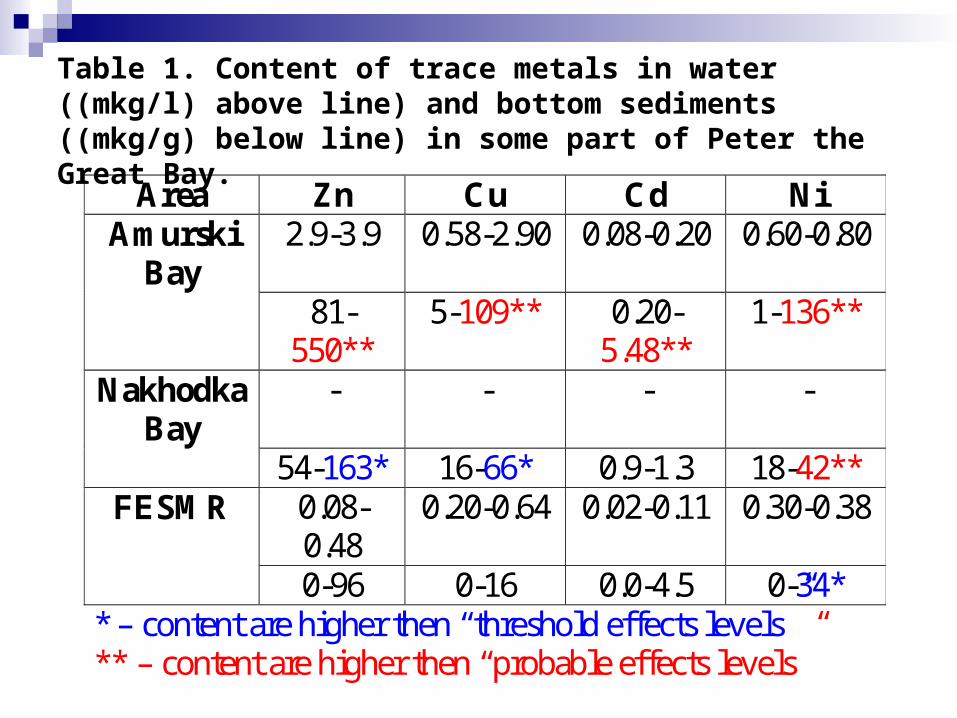
Table 1. Content of trace metals in water ((mkg/l) above line) and bottom sediments ((mkg/g) below line) in some part of Peter the Great Bay.
Area Zn Cu Cd Ni Amurski
Bay 2.9-3.9 0.58-2.90 0.08-0.20 0.60-0.80
81-550**
5-109** 0.20-5.48**
1-136**
Nakhodka Bay
- - - -
54-163* 16-66* 0.9-1.3 18-42** FESMR 0.08-
0.48 0.20-0.64 0.02-0.11 0.30-0.38
0-96 0-16 0.0-4.5 0-34* * – content are higher then “threshold effects levels” ** – content are higher then “probable effects levels”
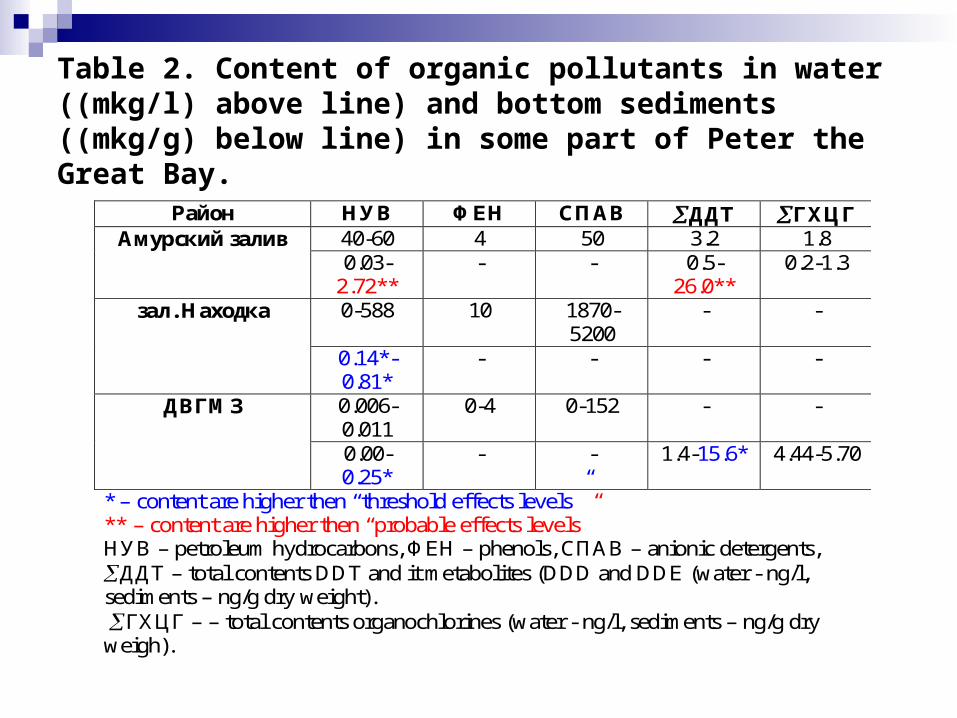
Table 2. Content of organic pollutants in water ((mkg/l) above line) and bottom sediments ((mkg/g) below line) in some part of Peter the Great Bay.
Район НУВ ФЕН СПАВ ДДТ ГХЦГ Амурский залив 40-60 4 50 3.2 1.8
0.03-2.72**
- - 0.5-26.0**
0.2-1.3
зал. Находка 0-588 10 1870-5200
- -
0.14*-0.81*
- - - -
ДВГМЗ 0.006-0.011
0-4 0-152 - -
0.00-0.25*
- - 1.4-15.6* 4.44-5.70
* – content are higher then “threshold effects levels” ** – content are higher then “probable effects levels” НУВ – petroleum hydrocarbons, ФЕН – phenols, СПАВ – anionic detergents, ДДТ – total contents DDT and it metabolites (DDD and DDE (water - ng/l, sediments – ng/g dry weight). ГХЦГ – – total contents organochlorines (water - ng/l, sediments – ng/g dry weigh).
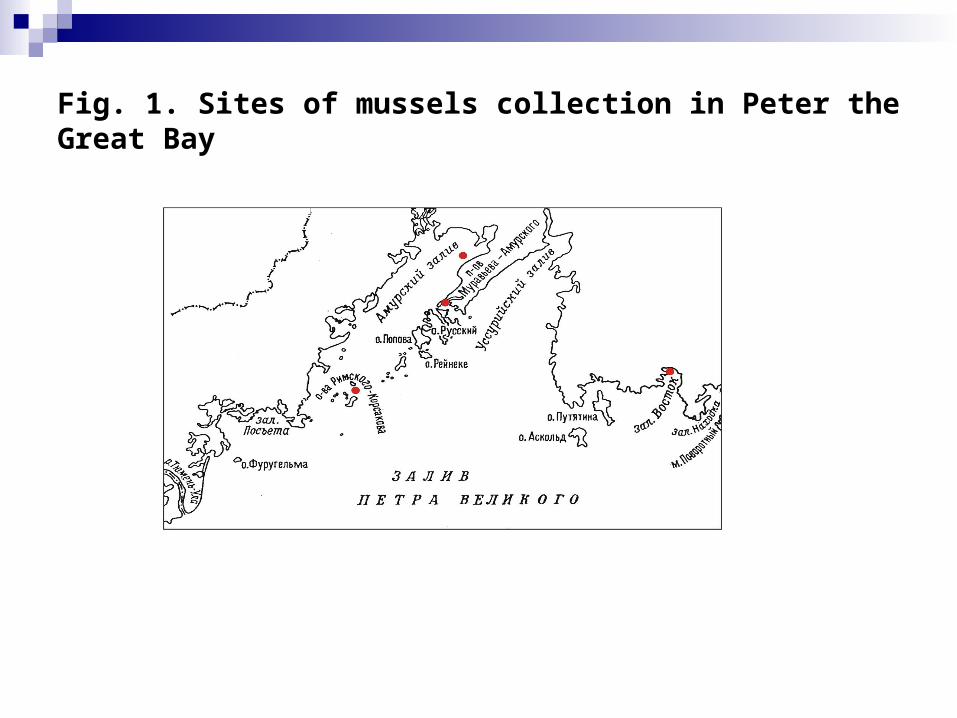
Fig. 1. Sites of mussels collection in Peter the Great Bay
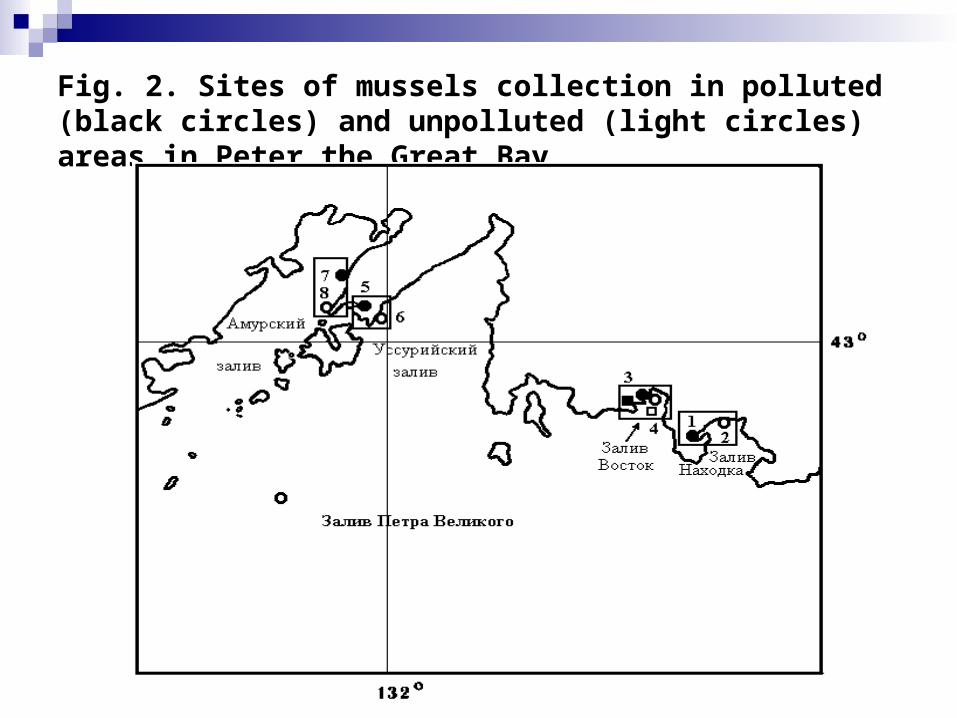
Fig. 2. Sites of mussels collection in polluted (black circles) and unpolluted (light circles) areas in Peter the Great Bay
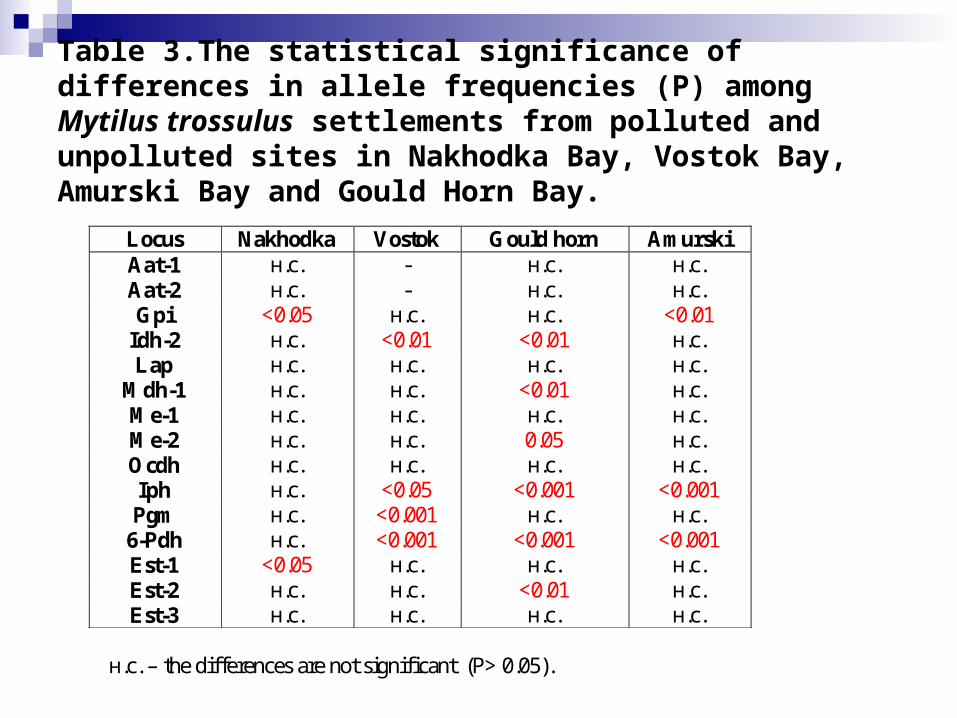
Table 3.The statistical significance of differences in allele frequencies (Р) among Mytilus trossulus settlements from polluted and unpolluted sites in Nakhodka Bay, Vostok Bay, Amurski Bay and Gould Horn Bay.
н.с. – the differences are not significant (P> 0.05).
Locus Nakhodka Vostok Gould horn Amurski Ааt-1 н.с. - н.с. н.с. Ааt-2 н.с. - н.с. н.с. Gpi <0.05 н.с. н.с. <0.01
Idh-2 н.с. <0.01 <0.01 н.с. Lap н.с. н.с. н.с. н.с.
Mdh-1 н.с. н.с. <0.01 н.с. Ме-1 н.с. н.с. н.с. н.с. Ме-2 н.с. н.с. 0.05 н.с. Оcdh н.с. н.с. н.с. н.с. Iph н.с. <0.05 <0.001 <0.001 Pgm н.с. <0.001 н.с. н.с.
6-Pdh н.с. <0.001 <0.001 <0.001 Est-1 <0.05 н.с. н.с. н.с. Est-2 н.с. н.с. <0.01 н.с. Est-3 н.с. н.с. н.с. н.с.
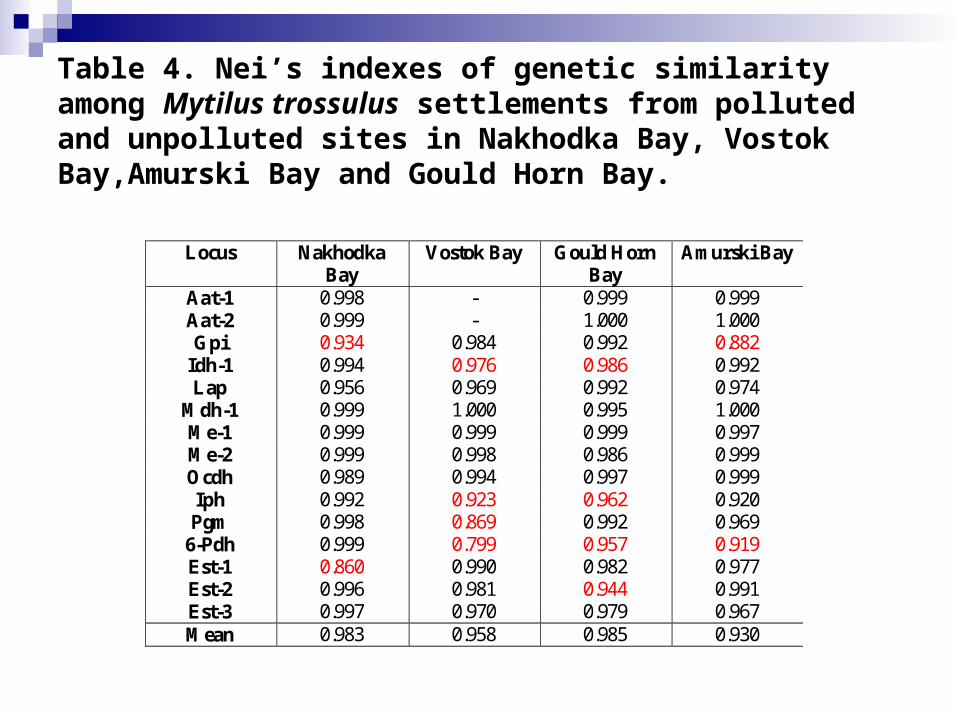
Table 4. Nei’s indexes of genetic similarity among Mytilus trossulus settlements from polluted and unpolluted sites in Nakhodka Bay, Vostok Bay,Amurski Bay and Gould Horn Bay.
Locus Nakhodka Bay
Vostok Bay Gould Horn Bay
Amurski Bay
Ааt-1 0.998 - 0.999 0.999 Ааt-2 0.999 - 1.000 1.000 Gpi 0.934 0.984 0.992 0.882
Idh-1 0.994 0.976 0.986 0.992 Lap 0.956 0.969 0.992 0.974
Мdh-1 0.999 1.000 0.995 1.000 Ме-1 0.999 0.999 0.999 0.997 Ме-2 0.999 0.998 0.986 0.999 Оcdh 0.989 0.994 0.997 0.999 Iph 0.992 0.923 0.962 0.920 Pgm 0.998 0.869 0.992 0.969
6-Pdh 0.999 0.799 0.957 0.919 Est-1 0.860 0.990 0.982 0.977 Est-2 0.996 0.981 0.944 0.991 Est-3 0.997 0.970 0.979 0.967 Mean 0.983 0.958 0.985 0.930
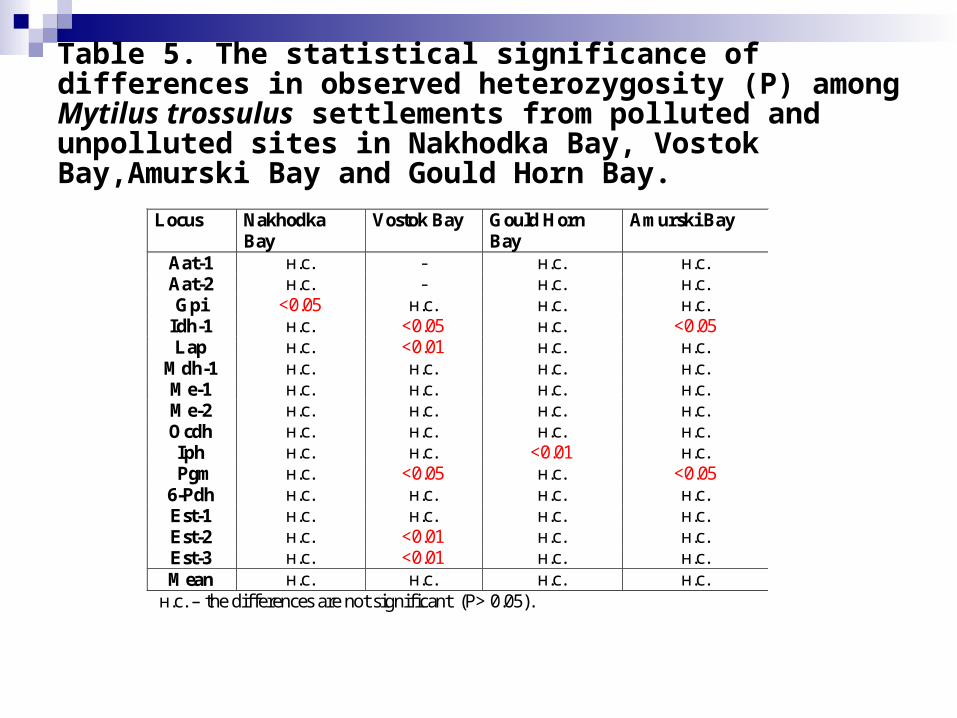
Table 5. The statistical significance of differences in observed heterozygosity (P) among Mytilus trossulus settlements from polluted and unpolluted sites in Nakhodka Bay, Vostok Bay,Amurski Bay and Gould Horn Bay.
Locus Nakhodka Bay
Vostok Bay Gould Horn Bay
Amurski Bay
Ааt-1 н.с. - н.с. н.с. Ааt-2 н.с. - н.с. н.с. Gpi <0.05 н.с. н.с. н.с.
Idh-1 н.с. <0.05 н.с. <0.05 Lap н.с. <0.01 н.с. н.с.
Мdh-1 н.с. н.с. н.с. н.с. Ме-1 н.с. н.с. н.с. н.с. Ме-2 н.с. н.с. н.с. н.с. Оcdh н.с. н.с. н.с. н.с. Iph н.с. н.с. <0.01 н.с.
Pgm н.с. <0.05 н.с. <0.05 6-Pdh н.с. н.с. н.с. н.с. Est-1 н.с. н.с. н.с. н.с. Est-2 н.с. <0.01 н.с. н.с. Est-3 н.с. <0.01 н.с. н.с.
Mean н.с. н.с. н.с. н.с. н.с. – the differences are not significant (P> 0.05).
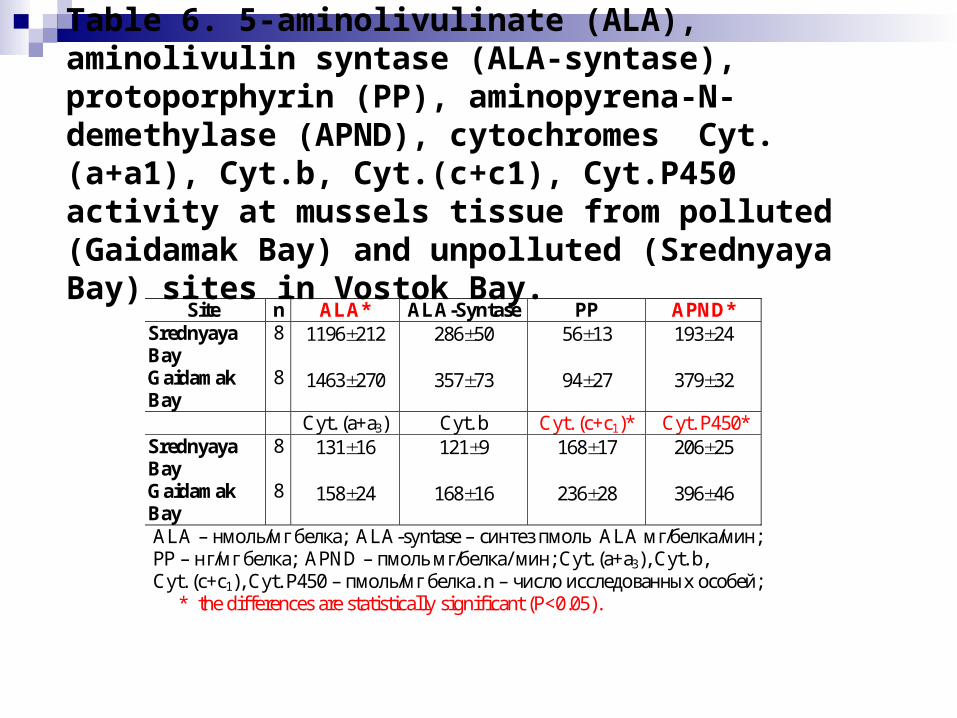
Table 6. 5-aminolivulinate (ALA), aminolivulin syntase (ALA-syntase), protoporphyrin (PP), aminopyrena-N-demethylase (APND), cytochromes Cyt.(a+a1), Cyt.b, Cyt.(c+c1), Cyt.P450 activity at mussels tissue from polluted (Gaidamak Bay) and unpolluted (Srednyaya Bay) sites in Vostok Bay.
Site n ALA* ALA-Syntase PP APND* Srednyaya Bay Gaidamak Bay
8
8
1196212
1463270
28650
35773
5613
9427
19324
37932
Cyt. (a+a3) Cyt. b Cyt. (c+c1)* Cyt. P450* Srednyaya Bay Gaidamak Bay
8
8
13116
15824
1219
16816
16817
23628
20625
39646
ALA – нмоль/мг белка; ALA-syntase – синтез пмоль ALA мг/белка/мин; РР – нг/мг белка; APND – пмоль мг/белка/ мин; Cyt. (a+a3), Cyt. b, Cyt. (c+c1), Cyt. P450 – пмоль/мг белка. n – число исследованных особей;
* the differences are statistically significant (Р<0.05).
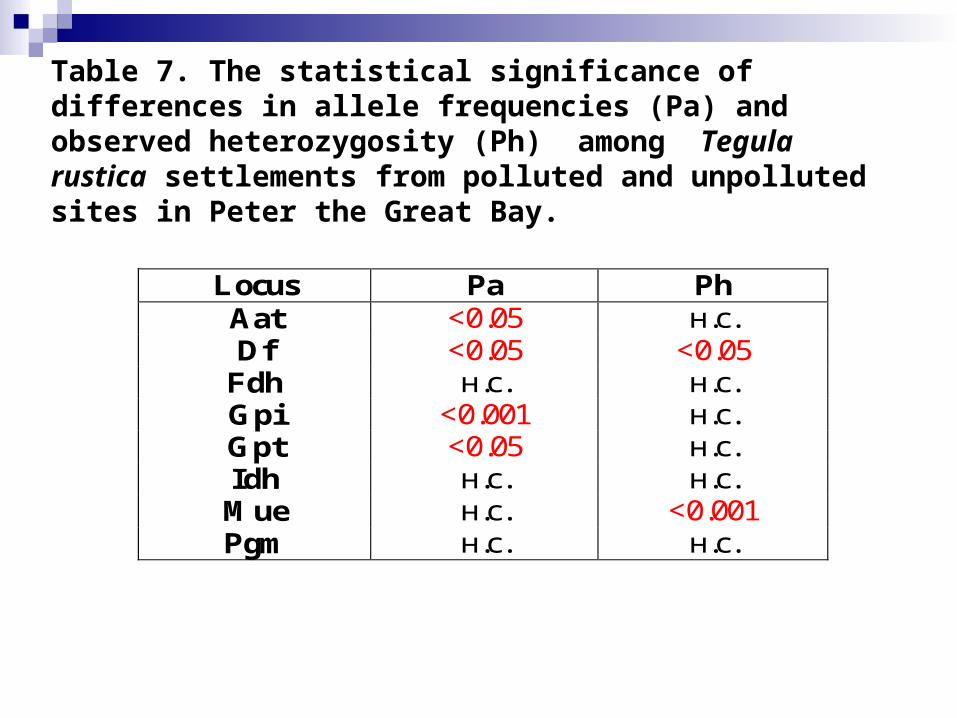
Table 7. The statistical significance of differences in allele frequencies (Pa) and observed heterozygosity (Ph) among Tegula rustica settlements from polluted and unpolluted sites in Peter the Great Bay.
Locus Ра Рh Ааt <0.05 н.с. Df <0.05 <0.05
Fdh н.с. н.с. Gpi <0.001 н.с. Gpt <0.05 н.с. Idh н.с. н.с. Мue н.с. <0.001 Pgm н.с. н.с.
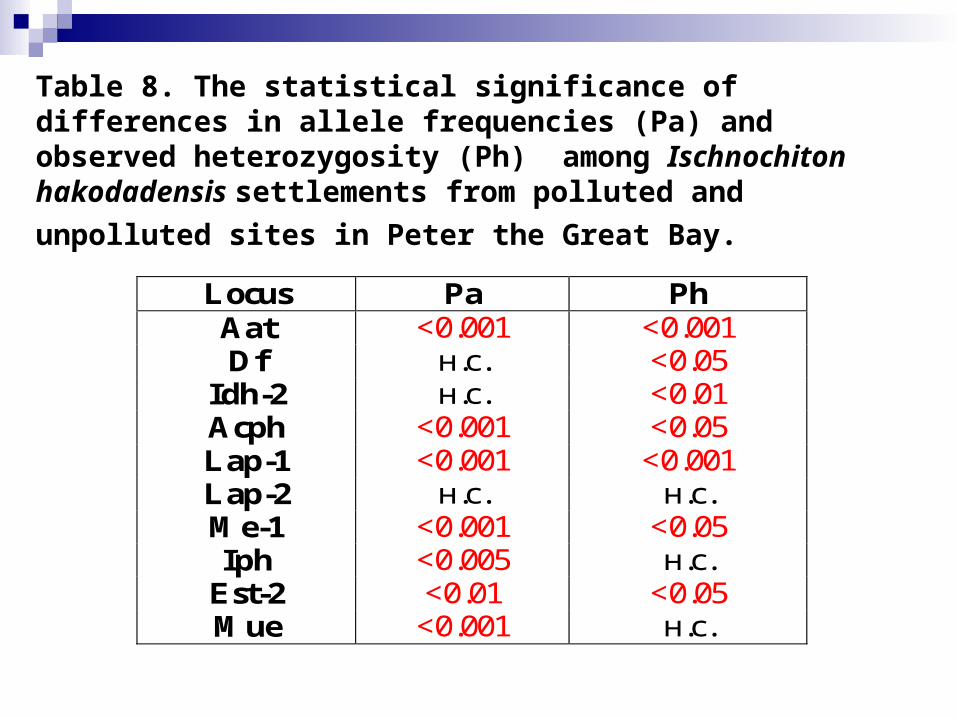
Table 8. The statistical significance of differences in allele frequencies (Pa) and observed heterozygosity (Ph) among Ischnochiton hakodadensis settlements from polluted and
unpolluted sites in Peter the Great Bay.
Locus Ра Рh Ааt <0.001 <0.001 Df н.с. <0.05
Idh-2 н.с. <0.01 Acph <0.001 <0.05 Lap-1 <0.001 <0.001 Lap-2 н.с. н.с. Ме-1 <0.001 <0.05 Iph <0.005 н.с.
Est-2 <0.01 <0.05 Mue <0.001 н.с.
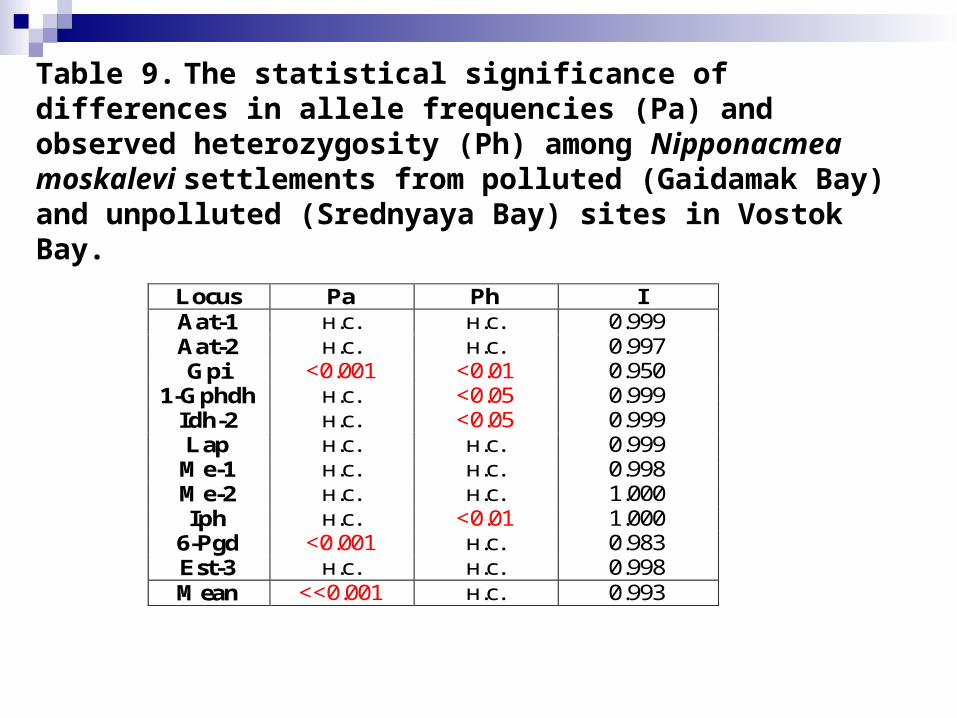
Table 9. The statistical significance of differences in allele frequencies (Pa) and observed heterozygosity (Ph) among Nipponacmea moskalevi settlements from polluted (Gaidamak Bay) and unpolluted (Srednyaya Bay) sites in Vostok Bay.
Locus Ра Рh I Ааt-1 н.с. н.с. 0.999 Ааt-2 н.с. н.с. 0.997 Gpi <0.001 <0.01 0.950
1-Gphdh н.с. <0.05 0.999 Idh-2 н.с. <0.05 0.999 Lap н.с. н.с. 0.999 Ме-1 н.с. н.с. 0.998 Ме-2 н.с. н.с. 1.000 Iph н.с. <0.01 1.000
6-Pgd <0.001 н.с. 0.983 Est-3 н.с. н.с. 0.998 Mean <<0.001 н.с. 0.993
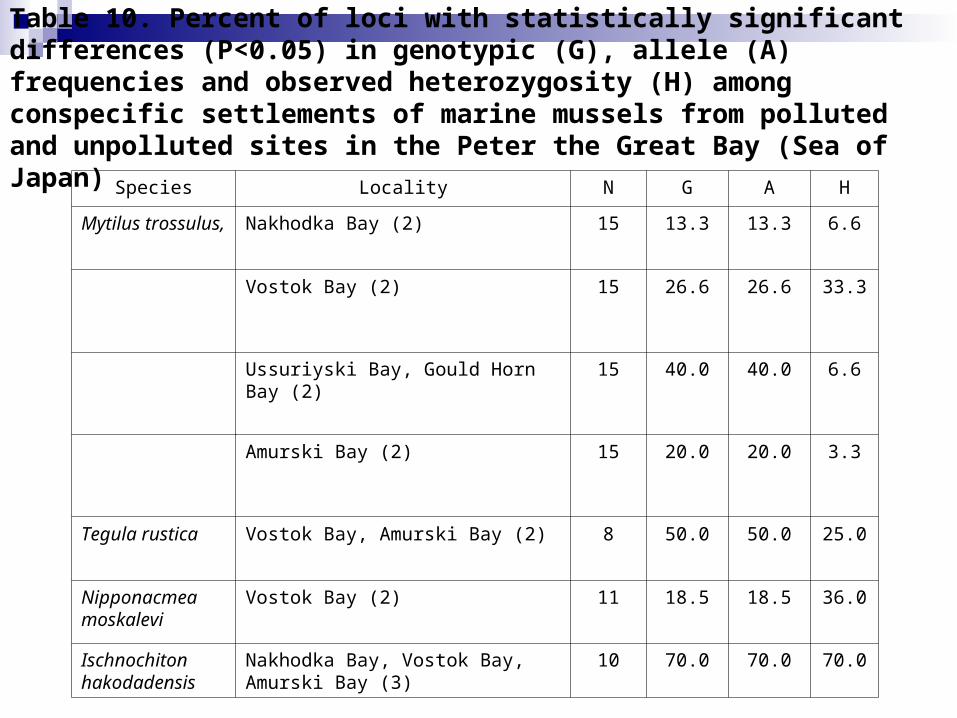
Table 10. Percent of loci with statistically significant differences (P<0.05) in genotypic (G), allele (A) frequencies and observed heterozygosity (H) among conspecific settlements of marine mussels from polluted and unpolluted sites in the Peter the Great Bay (Sea of Japan)
Species Locality N G A H
Mytilus trossulus, Nakhodka Bay (2) 15 13.3 13.3 6.6
Vostok Bay (2) 15 26.6 26.6 33.3
Ussuriyski Bay, Gould Horn Bay (2) 15 40.0 40.0 6.6
Amurski Bay (2) 15 20.0 20.0 3.3
Tegula rustica Vostok Bay, Amurski Bay (2) 8 50.0 50.0 25.0
Nipponacmea moskalevi
Vostok Bay (2) 11 18.5 18.5 36.0
Ischnochiton hakodadensis
Nakhodka Bay, Vostok Bay, Amurski Bay (3)
10 70.0 70.0 70.0
CONCLUSIONS: We were found the statistically significant differences in allele
frequencies and in level of observed heterozygosity at some loci by comparison settlements from polluted and unpolluted sites of 4 species marine mollusks in Peter the Great Bay. The greater part of observed differences were cause by rare genotypes and rare alleles.
The per sent of losi which are subject to natural selection is quite high.
An absents the differences in mean heterozygosity among mollusk settlements from polluted and unpolluted sites are not consistent with the hypothesis of selective advantage of high-heterozygosity genotypes under anthropogenic pollution stress.
An estimations of differences in genotype and allele frequencies and in level of observed heterozygosity at some loci may be the variables for monitoring of quality sea environments.
Our data are in agreement with the theory of the adaptive significance of allozyme polymorphism.

THANK YOU FOR ATTENTION!