Embed Size (px)
Citation preview

ALMA WeatherInstrumentation Specification
SCID-90.03.00.00-010-A-SPE
2009–04–06
Description Document
Jeff Mangum
Change Record

ALMA Weather
Instrumentation Specification
Doc#: SCID-90.03.00.00-010-A-SPEDate: 2009–04–06Status: DraftPage 2
Revision Date Author Section/ RemarksPage affected
1 2005-08-12 Jeff Mangum All Initial Draft (based on other docs)2 2006-08-30 Jeff Mangum All Updated siting requirements3 2006-10-20 Jeff Mangum All Updated tower spec4 2006-12-01 Jeff Mangum All Added site and ambient condition specs5 2007-07-30 Jeff Mangum All Added selected vendor and instrumentation
information6 2007-08-13 Jeff Mangum 2.1 Modify pressure sensor description to reflect
change from Class A to Class B sensor7 2008-02-13 Jeff Mangum 4 Update data recording description8 2008-03-10 Jeff Mangum 4 Add brief description of SBC-GX533 and
necessary configuration details (asdetermined from prototyping)
9 2008-04-17 Jeff Mangum 3 Added detailed installation requirements10 2008-07-25 Jeff Mangum 4 Final installation requirements defined11 2009-04-06 Jeff Mangum B Added analysis of different Tdp to RH expressions$Id: ALMAWeatherInstrumentationDescription.tex,v 1.11 2009/04/06 20:17:51 jmangum Exp $
Contents
1 Specifications and Requirements 31.1 Environmental Requirements . . . . . . . . . . . . . . . . . . . . . . . . . . . . . . . . . . . . 31.2 Instrument Requirements . . . . . . . . . . . . . . . . . . . . . . . . . . . . . . . . . . . . . . 3
2 Weather Device Descriptions 42.1 Barometric Pressure, Ambient Temperature, and Relative Humidity . . . . . . . . . . . . . . 42.2 Wind Speed and Direction . . . . . . . . . . . . . . . . . . . . . . . . . . . . . . . . . . . . . 5
3 Installation Logistics 53.1 Locations . . . . . . . . . . . . . . . . . . . . . . . . . . . . . . . . . . . . . . . . . . . . . . . 53.2 Measurement Device Mount . . . . . . . . . . . . . . . . . . . . . . . . . . . . . . . . . . . . 53.3 Instrument Accessory Enclosure . . . . . . . . . . . . . . . . . . . . . . . . . . . . . . . . . . 7
4 Weather Instrument Data Recording and Monitoring 74.1 SBC Configuration Issues . . . . . . . . . . . . . . . . . . . . . . . . . . . . . . . . . . . . . . 94.2 WMT50 Instrument Readout Settings . . . . . . . . . . . . . . . . . . . . . . . . . . . . . . . 94.3 Data File Size . . . . . . . . . . . . . . . . . . . . . . . . . . . . . . . . . . . . . . . . . . . . 9
A Relationship Between Acoustic, Virtual, and Ambient Temperature 10
B Relationship Between Relative Humidity, Dew Point Temperature, and Surface Tempera-ture 11
Create Date: 2009–04–06 Page 2 Contact author: Jeff Mangum

ALMA Weather
Instrumentation Specification
Doc#: SCID-90.03.00.00-010-A-SPEDate: 2009–04–06Status: DraftPage 3
1 Specifications and Requirements
In the following we describe the weather measurement instrumentation required for ALMA. The choice of theseinstruments is based on requirements for measurement of the barometric pressure (Ps), ambient temperature(Ts), relative humidity (RH), wind speed (Ws), and wind direction (Wd) described in [Richer & Mangum(2005)].This document also contains a specification for the instrument towers upon which a variety of devices, includingthese instruments, can be installed.
1.1 Environmental Requirements
The ALMA Weather Instrumentation shall operate with no degradation when experiencing any combination ofthe following environmental conditions1.
— Ambient Temperature: -20◦C ≤ T ≤ 30◦C.— Ambient Temperature Gradients: ±0.6◦C in 10 minutes, ±1.8◦C in 30 minutes.— Wind: Speeds up to 20 m/s.— Solar Flux: Full solar loading from any direction, with solar flux up to 1290 W/m2.— Dust: fine particles 1 micrometer in diameter or greater.
The general operational environment will be an outdoor location on the ALMA site at 5000m elevation.
1.2 Instrument Requirements
Table 1 lists the required accuracy for the ALMA weather instrumentation derived from[Richer & Mangum(2005)] and [Mangum(2001)]. These performance specifications stem from the ALMACalibration Specifications and Requirements ([ALMA Dudes(2005)]) which relate mainly to pointing andamplitude calibration. The requirements on P, T, and RH are driven by the need to calculate the atmosphericrefraction to better than 0.′′2. The requirements on the wind vector measurement are driven by:
— The need to correlate antenna deformation and oscillation due to wind;— Verify wind homogeneity over the terrain around the antennas;— Minimize measurement corruption due to downwind turbulence from adjacent antennas.
Table 1: Surface Weather Measurement Requirements
Parameter Symbol Required Accuracy and Range Sampling RateBarometric Pressure Ps 0.5 mb, 500–1060 mb 0.017 Hz (1 minute)Ambient Temperature Ts 0.1 C, −30–+40 C 0.017 Hz (1 minute)Relative Humidity RH 1.0%, 0-100% 0.017 Hz (1 minute)Wind Speed Ws 0.5 m/s, 0–60 m/s 1-10 HzWind Direction Wd 5 deg, 0–360 deg 1-10 HzNOTE: Require at least 5 of each instrument.
An additional requirement is that we sample the ambient weather conditions well-enough over the ALMAsite to be able to interpolate P, T, and RH to any antenna location on the site. As we have no informationregarding the variation of these weather parameters over the site, higher weight has been given to the desire toprovide a larger number of measurement devices.
1The conditions described represent the union of the ALMA antenna primary and secondary performance conditions.
Create Date: 2009–04–06 Page 3 Contact author: Jeff Mangum

ALMA Weather
Instrumentation Specification
Doc#: SCID-90.03.00.00-010-A-SPEDate: 2009–04–06Status: DraftPage 4
Figure 1: Clockwise from top: PTU300 P, T, and RH sensor, HMT330MIK meteorological installation kit, andWMT50 sonic anemometer.
2 Weather Device Descriptions
In the following we list the weather instrumentation devices chosen and their performance specifications.
2.1 Barometric Pressure, Ambient Temperature, and Relative Humidity
The Vaisala PTU300 Combined Pressure, Humidity, and Temperature Transmitter has been chosen for themeasurement of these three important atmospheric quantities. The techincal performace data for each sensoris listed in Table 2. A Vaisala HMT330MIK Meteorological Installation Kit will be used to mount the PTU300on a pole or tower. Figure 1 show pictures of the PTU300 and HMT330MIK devices. For a description of thecorrespondence between RH, dew point temperature, and ambient (surface) temperature, see Appendix A.
Table 2: Weather Measurement Device Technical Specifications
Device Parameter Accuracy RangeClass B Ps ±0.25 mb 50–1100 hPa / −40–+60 CPT100 RTD 1/3 Class B IEC 751 Ts ±0.20–0.3 C −20–+40 CHUMICAP 180C RH ±(1.0 + 0.008× reading) % −20–+40 C / 0-100% RHWMT50 Ws/Wd max(±0.3m/s,±3%)/±3 deg 0–35 m/s / 0–360 deg
Create Date: 2009–04–06 Page 4 Contact author: Jeff Mangum

ALMA Weather
Instrumentation Specification
Doc#: SCID-90.03.00.00-010-A-SPEDate: 2009–04–06Status: DraftPage 5
2.2 Wind Speed and Direction
For wind speed and direction measurement the WMT50 sonic anenometer has been chosen. Table 2 lists itsspecifications, while Figure 1 shows its mug shot. For a description of the correspondence between “sonic virtualtemperature” (the quantity measured by sonic anenometers) and wind speed, see Appendix A.
3 Installation Logistics
In each of the following sections I list the installation infrastructural requirements for each component of theweather instrument installation. Figure 2 shows a sketch of a standard weather instrument installation. Table 3lists the approximate costs for each component of a weather instrument installation.
Table 3: Weather Station Components
Component Vendor Model Cost Power RequirementsP/T/RH Sensor Vaisala PTU300 2760 Euro 100–240 VAC / 50-60 Hzb
Wind Sensor Vaisala WMT50 1169 Euro 5–30 VDCc
Computer Arcoma SBC-GX533 500 Euro Powered from enclosureComputer Enclosure Arcoma SBC-GX533 ICE 100 Euro 90–132/180–264 VAC or 9–36 VDCPole Site IPT Specified . . . . . . . . .Instrument Enclosure Hoffman CSD16128 200 Euro . . .a Now EuroTech.b Has own power supply module which converts input VAC to 5–30 VDC.c One each for both communications and heating systems.
3.1 Locations
Locations for each weather station have been chosen based on the following criteria:— Location (dt):
1. 20m < dt < 50m from any antenna.
2. dt > 100m from any other structure.
— . 100 m of elevation change between stations along each arm of the ALMA array configuration— Sufficient sampling along each arm of the ALMA array configuration to allow interpolation of
(P,T,RH,Ws,Wdir) measurements.Based on these criteria locations for each of 12 weather station installations have been chosen (Table 4).
3.2 Measurement Device Mount
The instrument mounting heights and locations for each of the 12 weather instrument towers should be assignedbased on the following requirements:
1. 100 mm diameter pole (to interface with Vaisala HMT330MIK meteorological installation kit; see Fig-ure 1).
2. Height (ht): 10 m.
Create Date: 2009–04–06 Page 5 Contact author: Jeff Mangum

ALMA Weather
Instrumentation Specification
Doc#: SCID-90.03.00.00-010-A-SPEDate: 2009–04–06Status: DraftPage 6
AC Power
Enclosure
Pole
Concrete Foundation
P/T/RH SensorPTU300
WMT50Sonic Anemometer
PTU300 Measurement Transmitter
Temperature Sensor
Ethernet
Figure 2: Sketch of a standard weather instrument installation.
Create Date: 2009–04–06 Page 6 Contact author: Jeff Mangum

ALMA Weather
Instrumentation Specification
Doc#: SCID-90.03.00.00-010-A-SPEDate: 2009–04–06Status: DraftPage 7
Table 4: ALMA Weather Station Locationsa
Pad Name Pad ID UTM-X UTM-y Priorityb
West ArmW1 Y50 620125.00 7453657.00 1W5 Y46 623451.00 7455040.00 1W8 Y42 625901.90 7457210.20 1A130 142 626124.00 7452986.00 1South ArmS9 Y39 634062.00 7447310.00 1S7 Y32 632668.20 7451111.20 1S1 Y29 629490.20 7450388.20 1Pampa la Bola ArmP13 Y28 633309.90 7462869.20 1P10 Y24 631556.80 7458399.50 1A129 141 628978.00 7454297.00 1Array CenterA71 83 627706.03 7453210.35 1OSF . . . . . . . . . 2a Based on “configs 11Apr07.xls” spreadsheet
of antenna pad locations.b Installation priority.
3. Concrete base.
4. Power and ethernet access.
3.3 Instrument Accessory Enclosure
The instrument enclosure will be located at the base of the instrument mount and will house:— Weather instrument measurement computer (SBC-GX533)— Ethernet switch (optional)— Network/power surge suppressor (APC SurgeArrest)— USB to Serial converter (optional)
The specifications for the suggested vendor and model are as follows:— Hoffman model CSD16128— Wall-Mount Type 4/12 Enclosure— HxWxD = 406x305x203 mm— 16 Ga steel construction
4 Weather Instrument Data Recording and Monitoring
Each weather instrumentation tower will include an Arcom SBC-GX533 embedded linux computer in a weatherprotective enclosure. All weather instrumentation measurements are read at a default rate of 0.5 Hz with thiscomputer using a simple Python script, which subsequently writes these measurements to a file. The ALMA
Create Date: 2009–04–06 Page 7 Contact author: Jeff Mangum

ALMA Weather
Instrumentation Specification
Doc#: SCID-90.03.00.00-010-A-SPEDate: 2009–04–06Status: DraftPage 8
monitor and control database then fetches the measurements by reading the output data files. Extraction andperusal of these data can then be done using a simple GUI.
The following list describes the relevant Python scripts and associated libraries and files:
ReadWS.py: Master Python script which reads the weather instruments. Uses pyserial library to communi-cate with weather devices using RS232 interface. Writes output to file wsYYYYMMDD.dat (time tag isMJD).
GetValues.py: Python script called by ReadWS.py which formats the data string read from each weatherdevice and does a sanity check of the values.
date2MJD.py: Python script called by ReadWS.py which calculates Modified Julian Day.
StatusWS.py: Python script which checks the status of the weather instruments and writes this informationto a file called wsstatusYYYYMMDDhhmmss.dat (time tag is MJD).
The format for the output weather measurement file wsYYYYMMDD.dat is a single line output per mea-surement as follows:
54509.6409375 Dn=245D Dm=263D Dx=278D Sn=0.0M Sm=0.1M Sx=0.1M P= 976.5hPa T= 22.4’CTD= 5.4’C 0 0 0
where the values are
MJD: Modified Julian Date (days)
Dn: Wind direction minimum (deg)
Dm: Wind direction average (deg)
Dx: Wind direction maximum (deg)
Sn: Wind speed minimum (m/s)
Sm: Wind speed average (m/s)
Sx: Wind speed maximum (m/s)
P: Pressure (hPa)
T: Ambient Temperature (C)
TD: Dew Point Temperature (C)
#: WMT communications flag (0=good; 1=bad)
#: PTU communications flag (0=good; 1=bad)
#: Verification code for PTU and WMT sanity check (0=good; 1=bad)
Create Date: 2009–04–06 Page 8 Contact author: Jeff Mangum

ALMA Weather
Instrumentation Specification
Doc#: SCID-90.03.00.00-010-A-SPEDate: 2009–04–06Status: DraftPage 9
4.1 SBC Configuration Issues
During prototyping several issues related to the setup of the SBC-GX533 were uncovered and resolved:
IRQ Assignment for CF Card: Arcom Embedded Linux (AEL) uses “IRQ-sharing” to multiplex the limitednumber of serial ports available on X86 hardware. With a default BIOS configuration this will result inthe same IRQ being assigned to COM2 and the CF Card. You must set the IRQ used by the CF Card tosomething unique (like 9) or all hell will break loose.
Default Serial Port Setting: The default serial port settings are “u+rw”, where the owner is root. Theseneed to be set to “o+rw” to allow a general user account to use them.
4.2 WMT50 Instrument Readout Settings
The wind speed and direction statistical measures (minimum, maximum, and average) are calculated by theWMT50 based on settings made at the WMT50. Those settings are made with a setup command in theReadWS.py script, whose values are currently as follows (see the Vaisala WMT50 Product Documentation forfurther information):
I: Sensor update interval (5 seconds)
A: Sensor averaging time (3 seconds)
U: Speed unit (m/s)
D: Direction correction (0 deg)
N: NMEA wind formatter (W)
F: Sensor sampling rate (4 Hz)
These setup values can be catered to the averaging method used when importing the weather station valuesinto the metadata database.
4.3 Data File Size
The current output format (see §4) produces ascii data at a rate of approximately 188 kB per hour. It wouldthen take approximately 444 days of continuous reading to fill 2 GB of storage. The current (test) Arcom SBCcontains a 4 GB conpact flash card. A purging cron job will be developed to keep the onboard data storage ator below 2 GB.
References
[ALMA Dudes(2005)] ALMA Calibration Specifications and Requirements (2005-09-26 Draft), ALMA-90.03.00.00-001-A-SPE
[Barenburg(1974)] Barenbrug, A.W.T., 1974, “Psychrometry and Psychrometric Charts”, 3rd Edition, CapeTown, S.A.: Cape and Transvaal Printers Ltd.
[Buck(1981)] Buck (1981), “New Equations for Computing Vapor Pressure and Enhancement Factor”,J. Appl. Met., 20, 1527-1532
Create Date: 2009–04–06 Page 9 Contact author: Jeff Mangum

ALMA Weather
Instrumentation Specification
Doc#: SCID-90.03.00.00-010-A-SPEDate: 2009–04–06Status: DraftPage 10
[Buck(2001)] Buck (2001), “Model CR-4 Hygrometer Operating Manual”
[Mangum(2001)] Mangum (2001), “A Telescope Pointing Algorithm for ALMA”, ALMA Memo 366
[Richer & Mangum(2005)] Richer & Mangum (2005), “Ancillary Calibration Instruments: Specifications andRequirements”, ALMA SCID-90-05.13.00-001-A-SPE
[Sonntag(1990)] Sonntag, D. 1990, Z. Meteorol., 70 (5), pp. 340-344, “Important New Values of the PhysicalConstants of 1986, Vapour Pressure Formulations based on the IST-90 and Psychrometer Formulae”
A Relationship Between Acoustic, Virtual, and Ambient Tempera-ture
Sonic anenometers measure a quantity called the “sonic virtual temperature”. This sonic virtual temperatureis defined as
Tsv = a(v2
s + v2n
)(1)
where vn is the velocity component normal to the sonic path used to measure the speed of sound, a = 2.48 ×10⁻³Ks2/m2, and vs is the speed of sound. Tsv is simply the temperature associated with the sound speed inthe gas. Note that the sonic anemometer outputs three orthogonal wind components (u,v,w) plus the speed ofsound, vs. This means that vn is defined as follows
v2n = v2 +
(u + w)2
2(2)
This sonic virtual temperature is related to a fictitious temperature used by meteorologists called the “virtualtemperature”. The virtual temperature is defined as the temperature that dry air would have if its pressure andspecific volume were equal to those of a given sample of moist air. Basically, the virtual temperature constructallows meteorologists to use the equation of state for dry air even though moisture is present. The virtualtemperature Tv is related to the sonic virtual temperature Tsv as follows
Tsv = Tv
(1 + 0.32
e
Ps
)(3)
where e is the vapour pressure (in mb), Ps is the absolute pressure (in mb), and the temperatures are in degreesK. The relationship between Tv and ambient temperature Ts is
Ts = Tv
(1 + 0.378
e
Ps
)(4)
where the units and symbols are the same as in the relation between Tsv and Tv.In summary, the USA-1 sonic anomemeter will measure Tsv, which is related to Ts as follows
Ts = Tsv
(1 + 0.378 e
Ps
)(1 + 0.32 e
Ps
) (5)
Create Date: 2009–04–06 Page 10 Contact author: Jeff Mangum

ALMA Weather
Instrumentation Specification
Doc#: SCID-90.03.00.00-010-A-SPEDate: 2009–04–06Status: DraftPage 11
B Relationship Between Relative Humidity, Dew Point Tempera-ture, and Surface Temperature
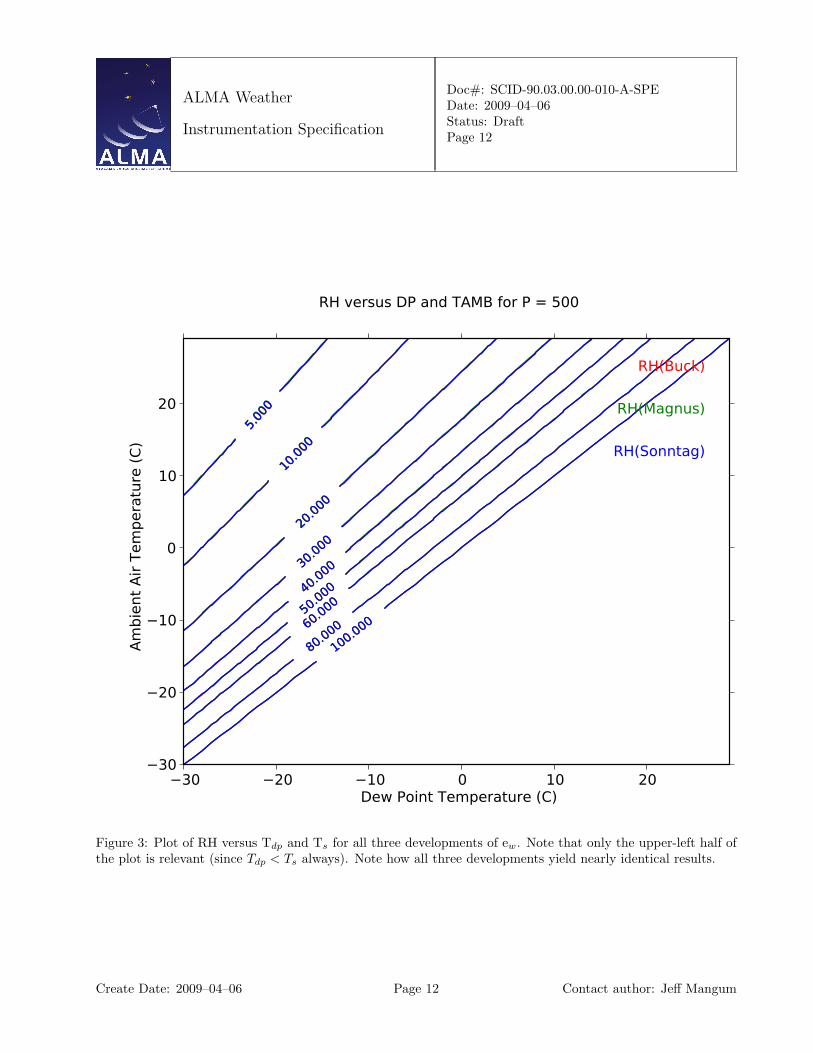
There are several rather good expressions for the vapour pressure above water (ew in mb) or ice (ei in mb)that one can use to relate the relative humidity (RH), dew point temperature (Tdp in C), and surface airtemperature (Ts in C) (see [Buck(1981)], [Buck(2001)], [Barenburg(1974)] (for the Magnus-Tetens formula),and [Sonntag(1990)]). The Buck formalism is a bit different in that it includes a slight ambient pressure (P inhPa) dependence which is quantified in terms of an “enhancement factor” (EF2). These relations for ew or ei
can be used in the following to derive the RH in terms of Tdp and Ts:
RH = 100× ew(Tdp)ew(Ts)
(6)
= 100× ei(Tdp)ei(Ts)
(7)
where the Buck relations are given by:
eBuckw (T ) = EF
{6.1121 exp
[(18.678− T
234.5
)(T
T + 257.14
)]}(8)
eBucki (T ) = EF
{6.1115 exp
[(23.036− T
333.7
)(T
T + 279.82
)]}(9)
EF = 1 + 10−4[2.2 + P
(0.0383 + 6.4× 10⁻⁶T 2
)](10)
the Magnus-Tetens relations are given by:
eMagnusw (T ) = 6.1121 exp
[(18.678− T
234.5
)(T
T + 257.14
)](11)
eMagnusi (T ) = 6.1115 exp
[(23.036− T
333.7
)(T
T + 279.82
)](12)
and the Sonntag relations are given by:
ln(
eSonntagw (T )
100
)=
−6096.9385T
+ 21.2409642− 0.02711193T + 1.673952× 10⁻⁵T 2 + (13)
2.433502 ln(T )
ln
(eSonntagi (T )
100
)=
−6024.5282T
+ 29.32707− 0.010613868T − 1.3198825× 10⁻⁵T 2 − (14)
0.49382577 ln(T )(15)
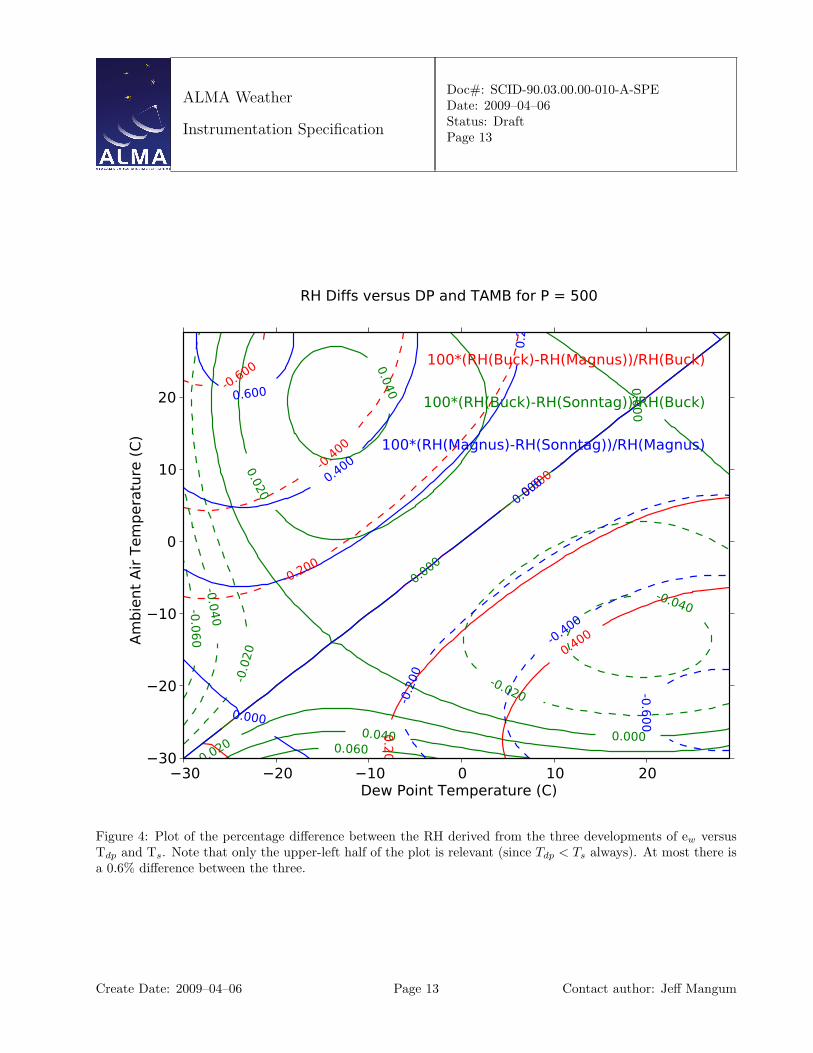
Plots of the RH calculated for each of these expressions and the percentage difference between them areshown in Figures 3 and 4.
2Note that the equation for EF in [Buck(2001)] contains two typographical errors.
Create Date: 2009–04–06 Page 11 Contact author: Jeff Mangum
ALMA Weather
Instrumentation Specification
Doc#: SCID-90.03.00.00-010-A-SPEDate: 2009–04–06Status: DraftPage 12
30 20 10 0 10 20Dew Point Temperature (C)
30
20
10
0
10
20
Am
bie
nt
Air
Tem
pera
ture
(C
)
RH(Buck)
RH(Magnus)
RH(Sonntag)
5.00
010
.000
20.0
00
30.0
00
40.000
50.000
60.000
80.000
100.000
5.00
010
.000
20.0
00
30.0
00
40.000
50.000
60.000
80.000
100.000
5.00
010
.000
20.0
00
30.0
00
40.000
50.000
60.000
80.000
100.000
RH versus DP and TAMB for P = 500
Figure 3: Plot of RH versus Tdp and Ts for all three developments of ew. Note that only the upper-left half ofthe plot is relevant (since Tdp < Ts always). Note how all three developments yield nearly identical results.
Create Date: 2009–04–06 Page 12 Contact author: Jeff Mangum
ALMA Weather
Instrumentation Specification
Doc#: SCID-90.03.00.00-010-A-SPEDate: 2009–04–06Status: DraftPage 13
30 20 10 0 10 20Dew Point Temperature (C)
30
20
10
0
10
20
Am
bie
nt
Air
Tem
pera
ture
(C
)
100*(RH(Buck)-RH(Magnus))/RH(Buck)
100*(RH(Buck)-RH(Sonntag))/RH(Buck)
100*(RH(Magnus)-RH(Sonntag))/RH(Magnus)
-0.600
-0.4
00
-0.200
0.000
0.2
00
0.400-0
.060
-0.0
40
-0.040
-0.0
20
-0.020
0.000
0.0
00
0.000
0.020
0.020
0.040
0.0
40
0.060
-0.6
00
-0.400
-0.2
00
0.000
0.000
0.2
00
0.400
0.600
RH Diffs versus DP and TAMB for P = 500
Figure 4: Plot of the percentage difference between the RH derived from the three developments of ew versusTdp and Ts. Note that only the upper-left half of the plot is relevant (since Tdp < Ts always). At most there isa 0.6% difference between the three.
Create Date: 2009–04–06 Page 13 Contact author: Jeff Mangum