Embed Size (px)
Citation preview
ANNUAL REPORT 2015
Along the Silk Road

As a labyrinth of interconnected trade routes
spanning across the Asian continent, the Silk
Road was once the main network that linked
the East with the Mediterranean world for
over a century.
Due to the fusion of cultures and ideas along
these ancient routes, the global influence
of the Silk Road on the rich civilisations,
discoveries and living legacies of arts and
architecture is undeniable.
This year at Askari Bank, we bring to light
the magnificent history of the Silk Road
and its pivotal role in shaping our geopolitical
dynamics. For us, this is a deep reflection
of the shared culture and camaraderie that
continues to exist along the Silk Road –
beckoning us to discover the promise
that it holds for the future.
a rich past, a fruitful present,a promising future
Along the Silk Road:
ANNUAL REPORT ASKARI BANK LIMITED 2015
Along the Silk Road
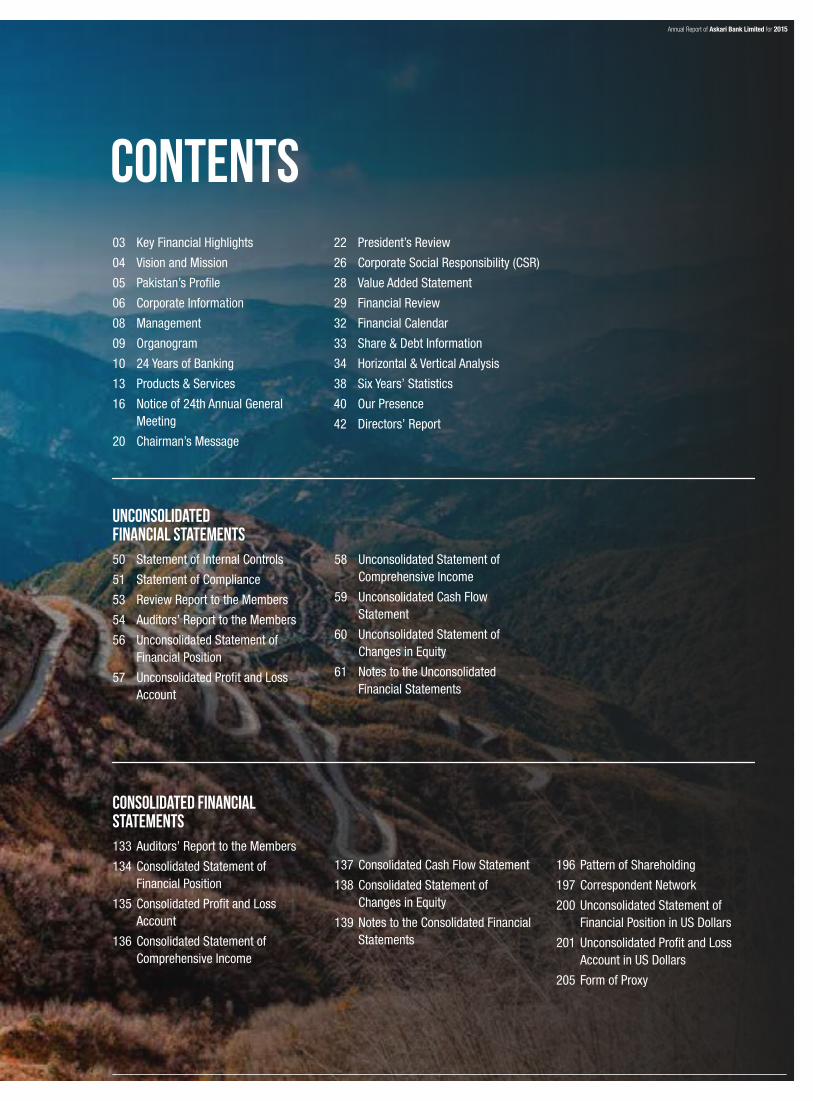
CONTENTS03 Key Financial Highlights
04 Vision and Mission
05 Pakistan’s Profile
06 Corporate Information
08 Management
09 Organogram
10 24 Years of Banking
13 Products & Services
16 Notice of 24th Annual General Meeting
20 Chairman’s Message
22 President’s Review
26 Corporate Social Responsibility (CSR)
28 Value Added Statement
29 Financial Review
32 Financial Calendar
33 Share & Debt Information
34 Horizontal & Vertical Analysis
38 Six Years’ Statistics
40 Our Presence
42 Directors’ Report
UnconsolidatedFinancial Statements50 Statement of Internal Controls
51 Statement of Compliance
53 Review Report to the Members
54 Auditors’ Report to the Members
56 Unconsolidated Statement of Financial Position
57 Unconsolidated Profit and Loss Account
58 Unconsolidated Statement of Comprehensive Income
59 Unconsolidated Cash Flow Statement
60 Unconsolidated Statement of Changes in Equity
61 Notes to the Unconsolidated Financial Statements
Consolidated Financial Statements 133 Auditors’ Report to the Members
134 Consolidated Statement of Financial Position
135 Consolidated Profit and Loss Account
136 Consolidated Statement of Comprehensive Income
137 Consolidated Cash Flow Statement
138 Consolidated Statement of Changes in Equity
139 Notes to the Consolidated Financial Statements
196 Pattern of Shareholding
197 Correspondent Network
200 Unconsolidated Statement of Financial Position in US Dollars
201 Unconsolidated Profit and Loss Account in US Dollars
205 Form of Proxy
Annual Report of Askari Bank Limited for 2015

The Silk Road was not a trade route that existed solely for the purpose of trading silk. Many other commodities were also traded; from gold and ivory to exotic animals and plants. However, of all the precious goods crossing this area, silk earned a special place in western society. The trade route to the
a taste for luxury the world embracesprecious goods
East was seen by the Romans as a route for silk more than anything else. Interestingly, however, the name `Silk Road’ itself does not originate from the Romans, but is infact a nineteenth century term “Seidenstraße”, coined by German scholar Ferdinand von Richthofen.
Along the Silk Road
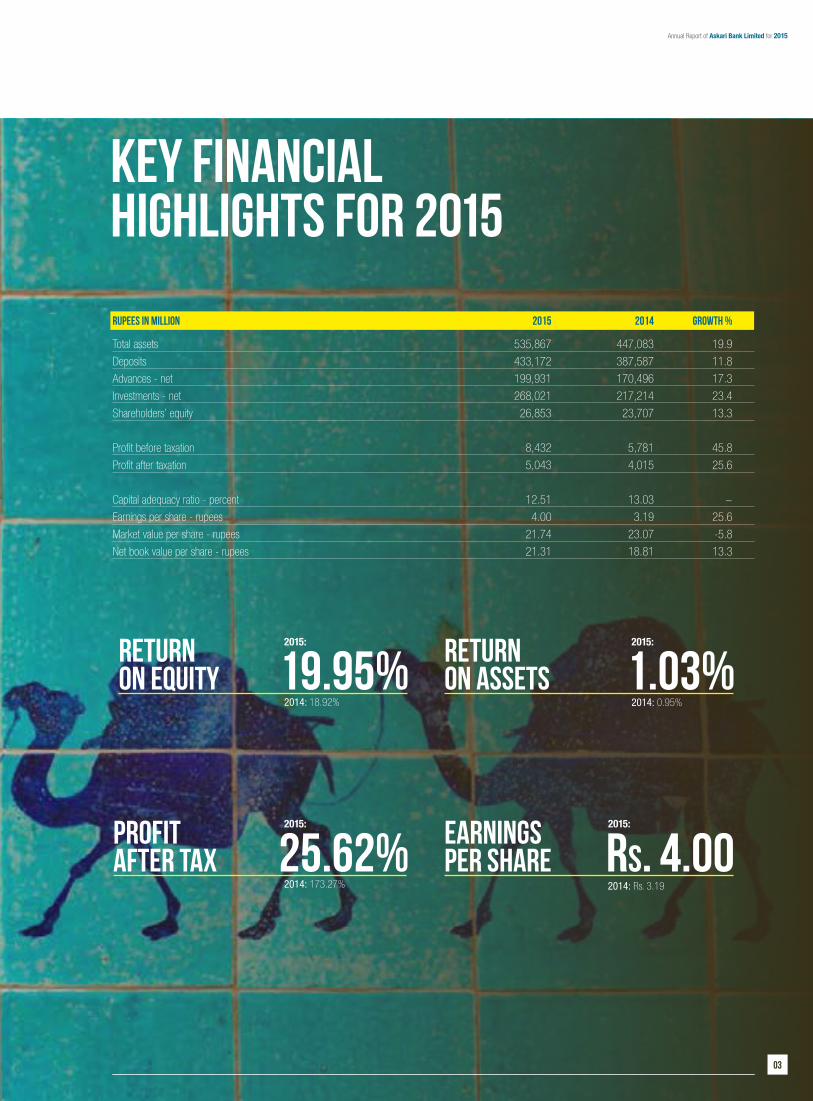
KEY FINANCIAL HIGHLIGHTS FOR 2015
Rupees in million 2015 2014 Growth %
Total assets 535,867 447,083 19.9
Deposits 433,172 387,587 11.8
Advances - net 199,931 170,496 17.3
Investments - net 268,021 217,214 23.4
Shareholders’ equity 26,853 23,707 13.3
Profit before taxation 8,432 5,781 45.8
Profit after taxation 5,043 4,015 25.6
Capital adequacy ratio - percent 12.51 13.03 ~
Earnings per share - rupees 4.00 3.19 25.6
Market value per share - rupees 21.74 23.07 -5.8
Net book value per share - rupees 21.31 18.81 13.3
25.62%2014: 173.27%
1.03%2014: 0.95%
19.95%Returnon Equity
PROFITAFTER TAX
Returnon ASSETS
EARNINGSPER SHARE
2014: 18.92%
2015:
2015:
2015:
2015:
Rs. 4.002014: Rs. 3.19
Annual Report of Askari Bank Limited for 2015

VISIONTo be the bank of first choice in the region
MISSIONTo be the leading private sector bank in Pakistan with an international presence, delivering quality service through innovative technology and effective human resource management in a modern and progressive organizational culture of meritocracy, maintaining high ethical and professional standards, while providing enhanced value to all our stakeholders, and contributing to society
Along the Silk Road
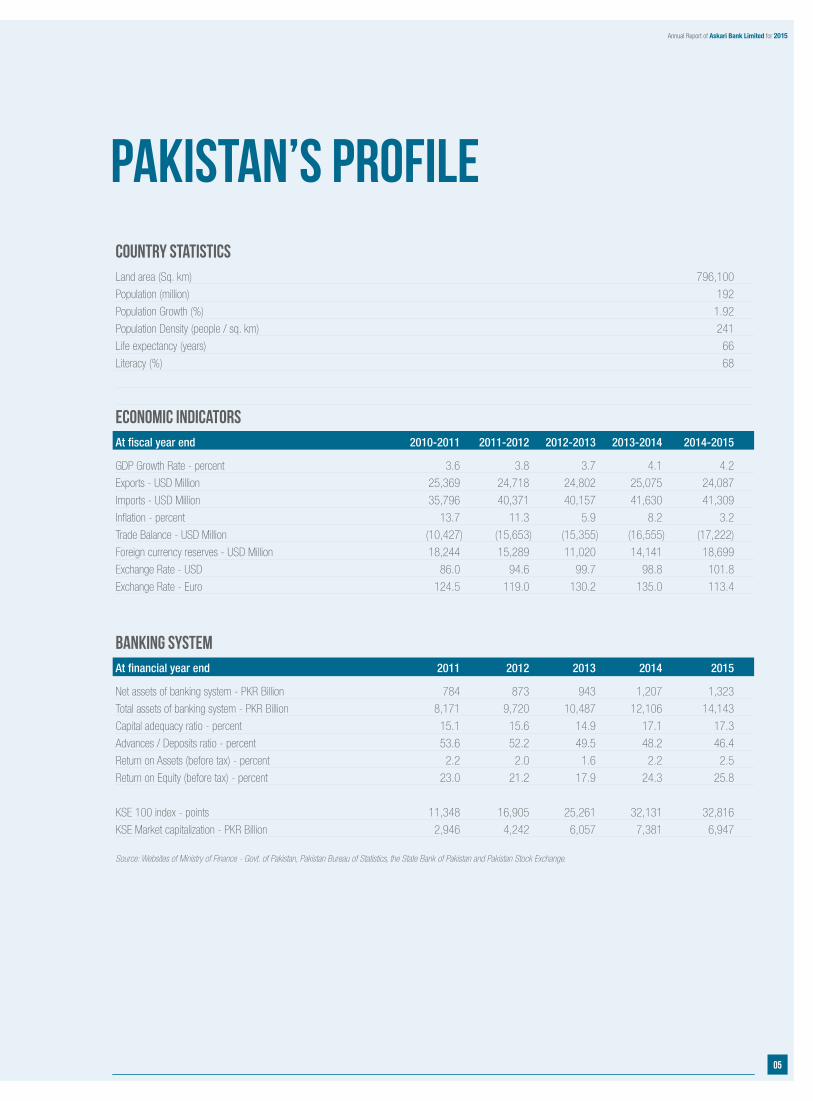
PAKISTAN’S PROFILECountry Statistics Land area (Sq. km) 796,100
Population (million) 192
Population Growth (%) 1.92
Population Density (people / sq. km) 241
Life expectancy (years) 66
Literacy (%) 68
Economic IndicatorsAt fiscal year end 2010-2011 2011-2012 2012-2013 2013-2014 2014-2015
GDP Growth Rate - percent 3.6 3.8 3.7 4.1 4.2
Exports - USD Million 25,369 24,718 24,802 25,075 24,087
Imports - USD Million 35,796 40,371 40,157 41,630 41,309
Inflation - percent 13.7 11.3 5.9 8.2 3.2
Trade Balance - USD Million (10,427) (15,653) (15,355) (16,555) (17,222)
Foreign currency reserves - USD Million 18,244 15,289 11,020 14,141 18,699
Exchange Rate - USD 86.0 94.6 99.7 98.8 101.8
Exchange Rate - Euro 124.5 119.0 130.2 135.0 113.4
Banking SystemAt financial year end 2011 2012 2013 2014 2015
Net assets of banking system - PKR Billion 784 873 943 1,207 1,323
Total assets of banking system - PKR Billion 8,171 9,720 10,487 12,106 14,143
Capital adequacy ratio - percent 15.1 15.6 14.9 17.1 17.3
Advances / Deposits ratio - percent 53.6 52.2 49.5 48.2 46.4
Return on Assets (before tax) - percent 2.2 2.0 1.6 2.2 2.5
Return on Equity (before tax) - percent 23.0 21.2 17.9 24.3 25.8
KSE 100 index - points 11,348 16,905 25,261 32,131 32,816
KSE Market capitalization - PKR Billion 2,946 4,242 6,057 7,381 6,947
Source: Websites of Ministry of Finance - Govt. of Pakistan, Pakistan Bureau of Statistics, the State Bank of Pakistan and Pakistan Stock Exchange.
05
Annual Report of Askari Bank Limited for 2015
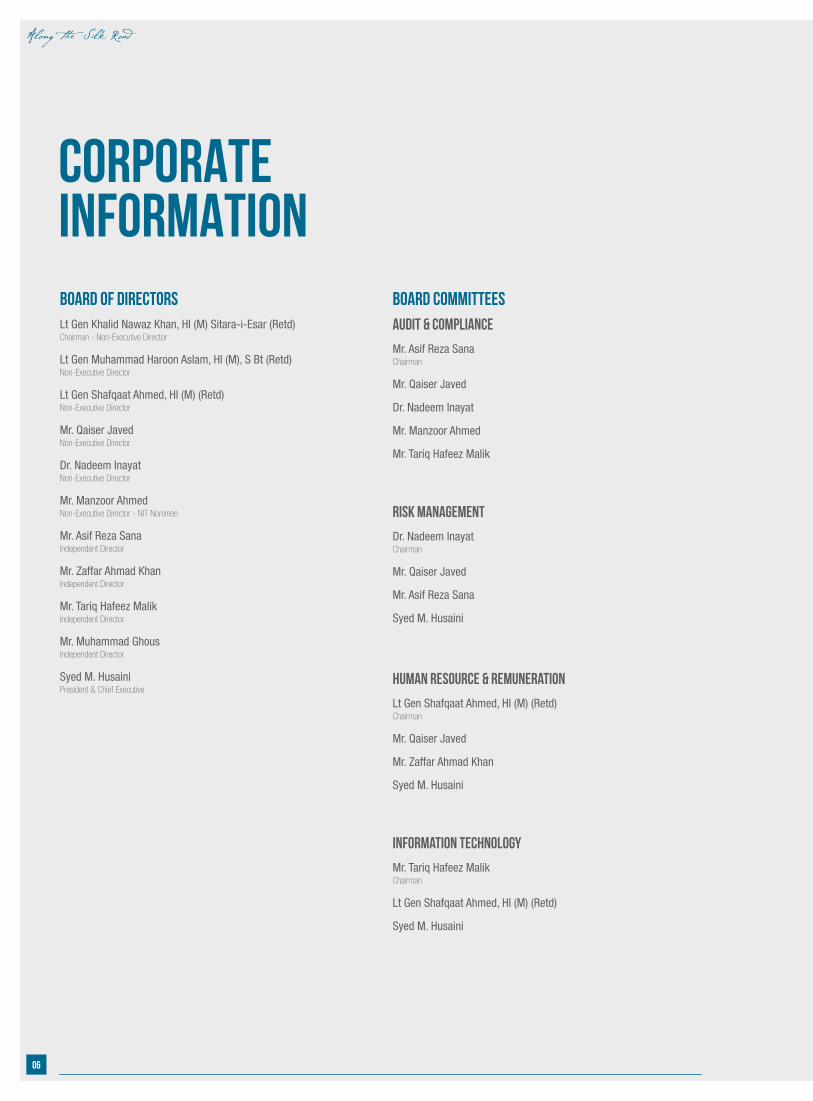
CORPORATE INFORMATIONBoard of DirectorsLt Gen Khalid Nawaz Khan, HI (M) Sitara-i-Esar (Retd)Chairman - Non-Executive Director
Lt Gen Muhammad Haroon Aslam, HI (M), S Bt (Retd) Non-Executive Director
Lt Gen Shafqaat Ahmed, HI (M) (Retd) Non-Executive Director
Mr. Qaiser JavedNon-Executive Director
Dr. Nadeem InayatNon-Executive Director
Mr. Manzoor Ahmed Non-Executive Director - NIT Nominee
Mr. Asif Reza Sana Independent Director
Mr. Zaffar Ahmad Khan Independent Director
Mr. Tariq Hafeez Malik Independent Director
Mr. Muhammad Ghous Independent Director
Syed M. Husaini President & Chief Executive
Board Committeesaudit & compliance
Mr. Asif Reza SanaChairman
Mr. Qaiser Javed
Dr. Nadeem Inayat
Mr. Manzoor Ahmed
Mr. Tariq Hafeez Malik
Risk Management
Dr. Nadeem InayatChairman
Mr. Qaiser Javed
Mr. Asif Reza Sana
Syed M. Husaini
Human Resource & Remuneration
Lt Gen Shafqaat Ahmed, HI (M) (Retd) Chairman
Mr. Qaiser Javed
Mr. Zaffar Ahmad Khan
Syed M. Husaini
Information Technology
Mr. Tariq Hafeez MalikChairman
Lt Gen Shafqaat Ahmed, HI (M) (Retd)
Syed M. Husaini
06
Along the Silk Road
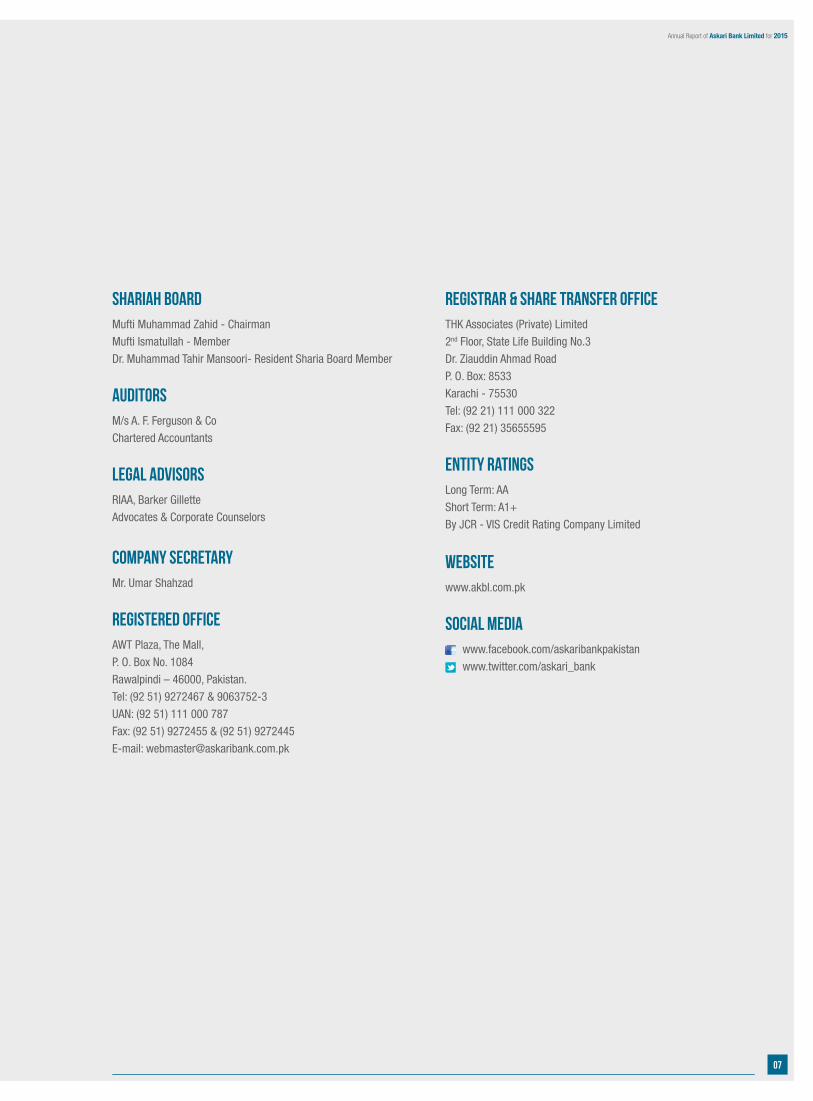
Shariah BOARDMufti Muhammad Zahid - Chairman
Mufti Ismatullah - Member
Dr. Muhammad Tahir Mansoori- Resident Sharia Board Member
AuditorsM/s A. F. Ferguson & Co
Chartered Accountants
Legal AdvisorsRIAA, Barker Gillette
Advocates & Corporate Counselors
Company SecretaryMr. Umar Shahzad
Registered OfficeAWT Plaza, The Mall,
P. O. Box No. 1084
Rawalpindi – 46000, Pakistan.
Tel: (92 51) 9272467 & 9063752-3
UAN: (92 51) 111 000 787
Fax: (92 51) 9272455 & (92 51) 9272445
E-mail: [email protected]
Registrar & Share Transfer OfficeTHK Associates (Private) Limited
2nd Floor, State Life Building No.3
Dr. Ziauddin Ahmad Road
P. O. Box: 8533
Karachi - 75530
Tel: (92 21) 111 000 322
Fax: (92 21) 35655595
Entity RatingsLong Term: AA
Short Term: A1+
By JCR - VIS Credit Rating Company Limited
Websitewww.akbl.com.pk
SOCIAL MEDIA www.facebook.com/askaribankpakistan
www.twitter.com/askari_bank
07
Annual Report of Askari Bank Limited for 2015
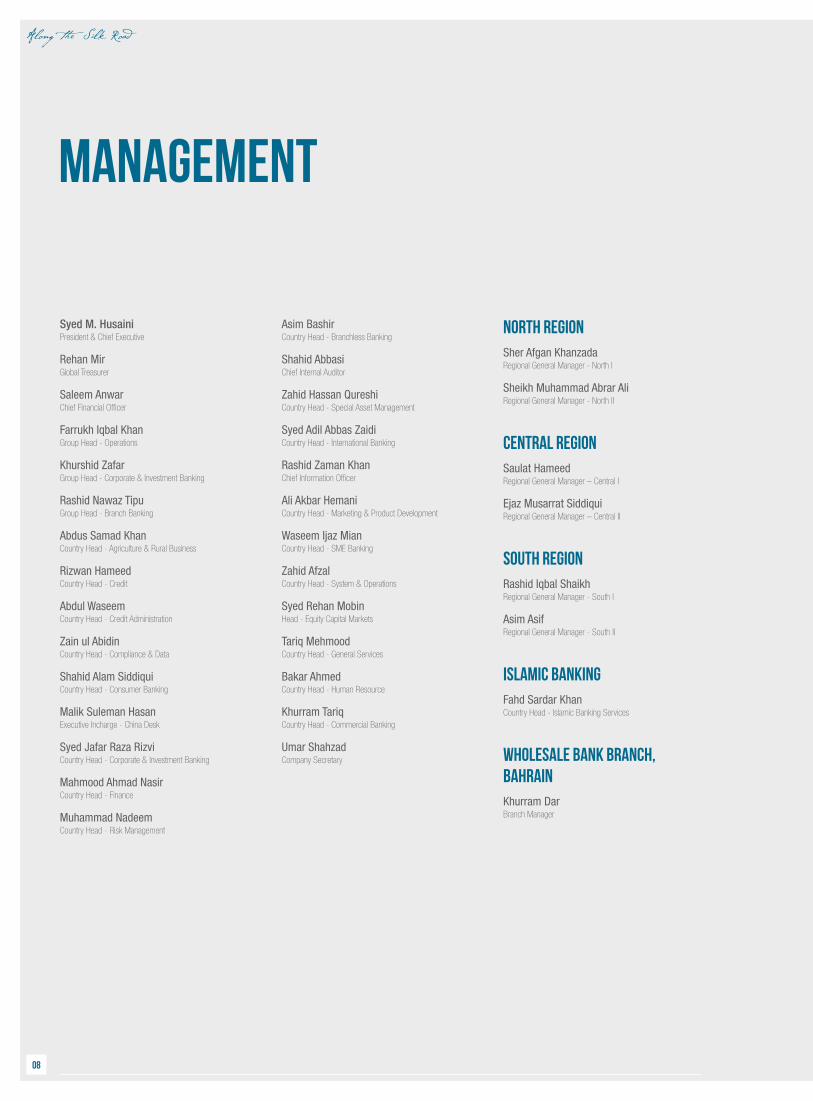
MANAGEMENT
Syed M. HusainiPresident & Chief Executive
Rehan MirGlobal Treasurer
Saleem AnwarChief Financial Officer
Farrukh Iqbal KhanGroup Head - Operations
Khurshid ZafarGroup Head - Corporate & Investment Banking
Rashid Nawaz TipuGroup Head - Branch Banking
Abdus Samad KhanCountry Head - Agriculture & Rural Business
Rizwan HameedCountry Head - Credit
Abdul WaseemCountry Head - Credit Administration
Zain ul AbidinCountry Head - Compliance & Data
Shahid Alam SiddiquiCountry Head - Consumer Banking
Malik Suleman HasanExecutive Incharge - China Desk
Syed Jafar Raza RizviCountry Head - Corporate & Investment Banking
Mahmood Ahmad NasirCountry Head - Finance
Muhammad NadeemCountry Head - Risk Management
Asim BashirCountry Head - Branchless Banking
Shahid AbbasiChief Internal Auditor
Zahid Hassan QureshiCountry Head - Special Asset Management
Syed Adil Abbas ZaidiCountry Head - International Banking
Rashid Zaman KhanChief Information Officer
Ali Akbar HemaniCountry Head - Marketing & Product Development
Waseem Ijaz MianCountry Head - SME Banking
Zahid AfzalCountry Head - System & Operations
Syed Rehan Mobin Head - Equity Capital Markets
Tariq MehmoodCountry Head - General Services
Bakar AhmedCountry Head - Human Resource
Khurram TariqCountry Head - Commercial Banking
Umar ShahzadCompany Secretary
North RegionSher Afgan KhanzadaRegional General Manager - North I
Sheikh Muhammad Abrar AliRegional General Manager - North II
Central RegionSaulat HameedRegional General Manager – Central I
Ejaz Musarrat SiddiquiRegional General Manager – Central II
South RegionRashid Iqbal ShaikhRegional General Manager - South I
Asim AsifRegional General Manager - South II
Islamic BankingFahd Sardar KhanCountry Head - Islamic Banking Services
Wholesale Bank Branch, BahrainKhurram DarBranch Manager
08
Along the Silk Road
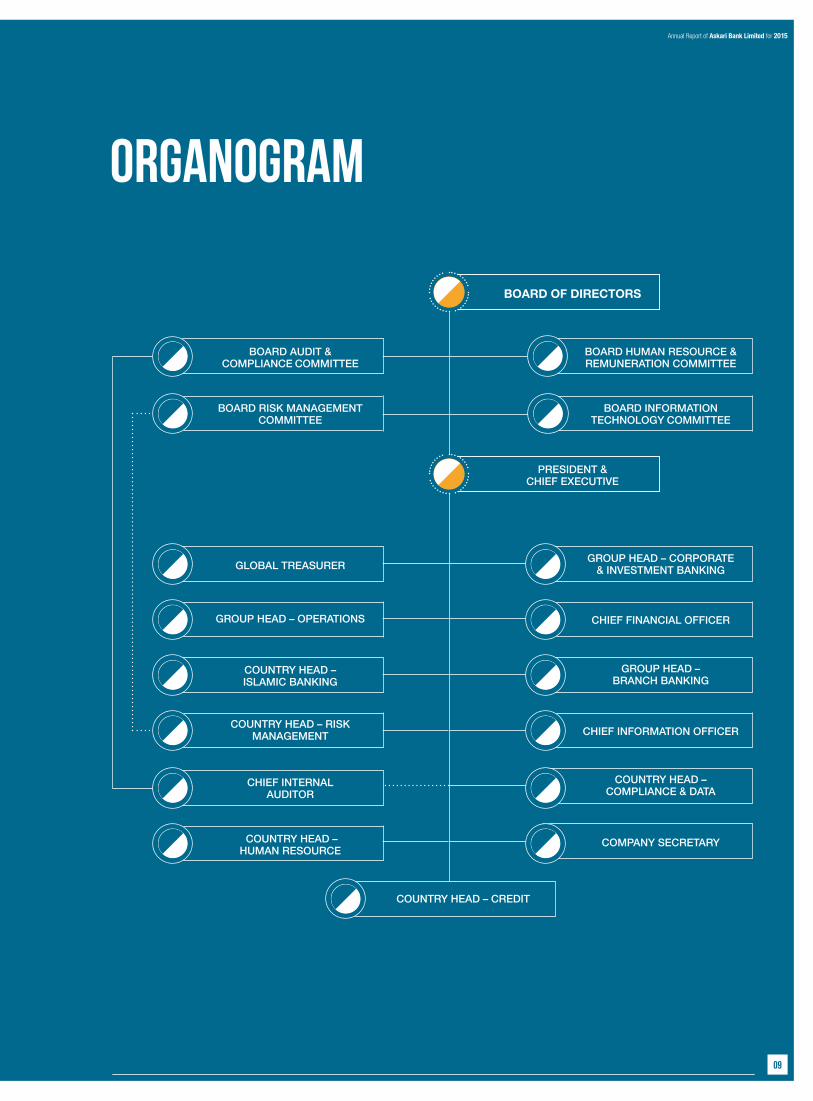
Organogram
BOARD OF DIRECTORS
PRESIDENT & CHIEF EXECUTIVE
GLOBAL TREASURER
COUNTRY HEAD – RISK MANAGEMENT
GROUP HEAD – OPERATIONS
COUNTRY HEAD – HUMAN RESOURCE
COUNTRY HEAD – CREDIT
GROUP HEAD – CORPORATE & INVESTMENT BANKING
COUNTRY HEAD – COMPLIANCE & DATA
GROUP HEAD – BRANCH BANKING
COUNTRY HEAD – ISLAMIC BANKING
CHIEF INTERNAL AUDITOR
CHIEF FINANCIAL OFFICER
COMPANY SECRETARY
CHIEF INFORMATION OFFICER
BOARD AUDIT & COMPLIANCE COMMITTEE
BOARD HUMAN RESOURCE & REMUNERATION COMMITTEE
BOARD INFORMATION TECHNOLOGY COMMITTEE
BOARD RISK MANAGEMENT COMMITTEE
09
Annual Report of Askari Bank Limited for 2015
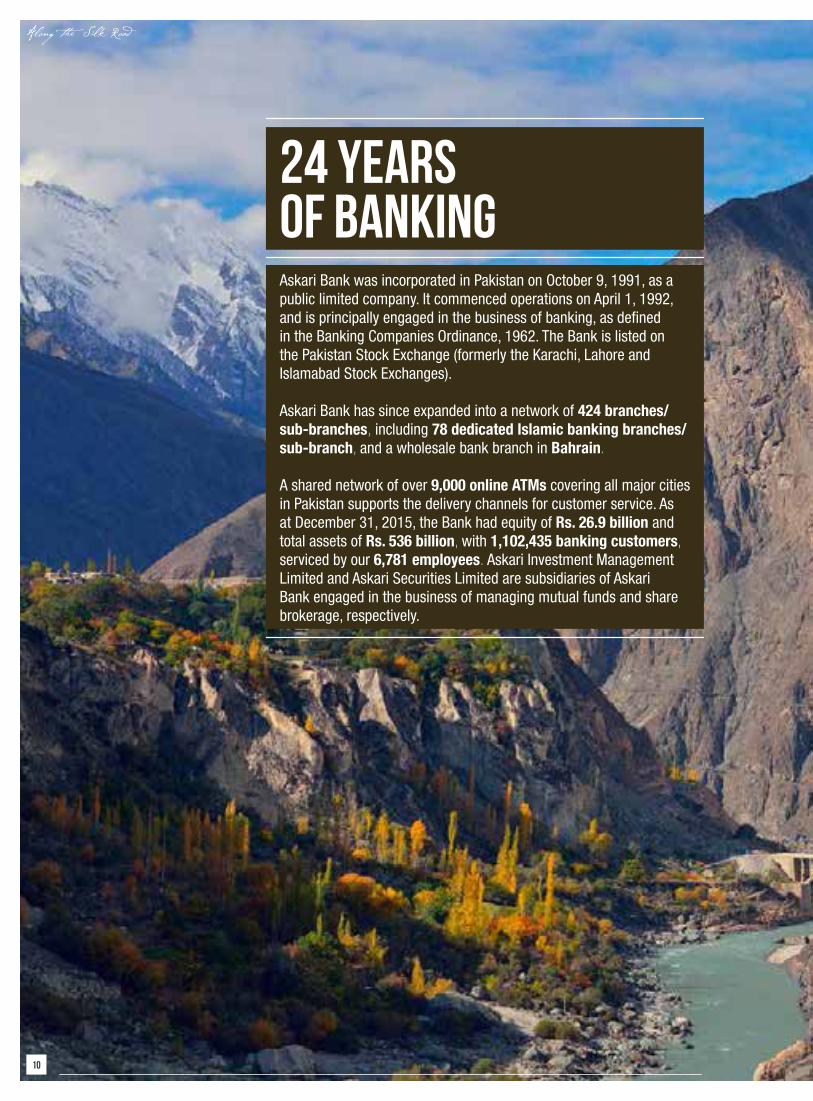
24 YEARS OF BANKINGAskari Bank was incorporated in Pakistan on October 9, 1991, as a public limited company. It commenced operations on April 1, 1992, and is principally engaged in the business of banking, as defined in the Banking Companies Ordinance, 1962. The Bank is listed on the Pakistan Stock Exchange (formerly the Karachi, Lahore and Islamabad Stock Exchanges).
Askari Bank has since expanded into a network of 424 branches/sub-branches, including 78 dedicated Islamic banking branches/sub-branch, and a wholesale bank branch in Bahrain.
A shared network of over 9,000 online ATMs covering all major cities in Pakistan supports the delivery channels for customer service. As at December 31, 2015, the Bank had equity of Rs. 26.9 billion and total assets of Rs. 536 billion, with 1,102,435 banking customers, serviced by our 6,781 employees. Askari Investment Management Limited and Askari Securities Limited are subsidiaries of Askari Bank engaged in the business of managing mutual funds and share brokerage, respectively.
Along the Silk Road

the emergence of new crossroads in asiaWith time, trade between China and the western regions of Persia and Middle East grew substantially. In 330 B.C., Alexander the Great of Macedon conquered the Iranian Empire and brought the aesthetics of Greek culture to these areas. In fact, it is believed that the residents of the Hunza valley in the Karakoram region are direct descendants of the army of Alexander. The Karakoram Highway now runs through this valley on its way from Pakistan to Kashgar, and the resulting blend of cultures has influenced the style of craftsmanship along the Road.
a melting-pot of art and culture
Annual Report of Askari Bank Limited for 2015

One of the most important exchanges along the Road was religion. Buddhism came to China along the northern branch of this Road, where it was effectively derived from the ancient kingdom of Gandhara. The discovery of Buddhist heritage sites and relics in Takht-i-Bahi, Mingora, Swat and Taxila indicates that this civilisation emerged from some areas of present day Pakistan.
the Gandhara dynastyan empire is born
12
Along the Silk Road
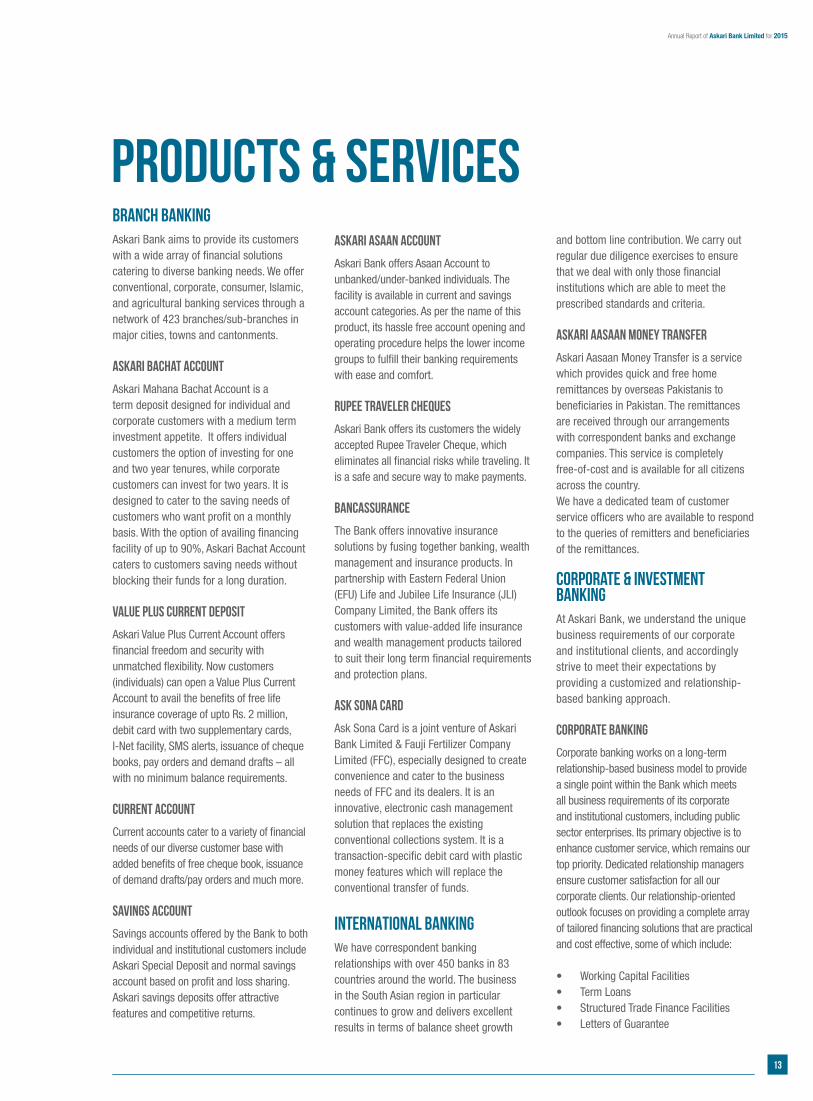
PRODUCTS & SERVICESBranch BankingAskari Bank aims to provide its customers with a wide array of financial solutions catering to diverse banking needs. We offer conventional, corporate, consumer, Islamic, and agricultural banking services through a network of 423 branches/sub-branches in major cities, towns and cantonments.
Askari Bachat Account
Askari Mahana Bachat Account is a term deposit designed for individual and corporate customers with a medium term investment appetite. It offers individual customers the option of investing for one and two year tenures, while corporate customers can invest for two years. It is designed to cater to the saving needs of customers who want profit on a monthly basis. With the option of availing financing facility of up to 90%, Askari Bachat Account caters to customers saving needs without blocking their funds for a long duration.
Value Plus Current Deposit
Askari Value Plus Current Account offers financial freedom and security with unmatched flexibility. Now customers (individuals) can open a Value Plus Current Account to avail the benefits of free life insurance coverage of upto Rs. 2 million, debit card with two supplementary cards, I-Net facility, SMS alerts, issuance of cheque books, pay orders and demand drafts – all with no minimum balance requirements.
Current Account
Current accounts cater to a variety of financial needs of our diverse customer base with added benefits of free cheque book, issuance of demand drafts/pay orders and much more.
Savings Account
Savings accounts offered by the Bank to both individual and institutional customers include Askari Special Deposit and normal savings account based on profit and loss sharing. Askari savings deposits offer attractive features and competitive returns.
Askari Asaan Account
Askari Bank offers Asaan Account to unbanked/under-banked individuals. The facility is available in current and savings account categories. As per the name of this product, its hassle free account opening and operating procedure helps the lower income groups to fulfill their banking requirements with ease and comfort.
Rupee Traveler Cheques
Askari Bank offers its customers the widely accepted Rupee Traveler Cheque, which eliminates all financial risks while traveling. It is a safe and secure way to make payments.
Bancassurance
The Bank offers innovative insurance solutions by fusing together banking, wealth management and insurance products. In partnership with Eastern Federal Union (EFU) Life and Jubilee Life Insurance (JLI)Company Limited, the Bank offers its customers with value-added life insurance and wealth management products tailored to suit their long term financial requirements and protection plans.
ASK Sona Card
Ask Sona Card is a joint venture of Askari Bank Limited & Fauji Fertilizer Company Limited (FFC), especially designed to create convenience and cater to the business needs of FFC and its dealers. It is an innovative, electronic cash management solution that replaces the existing conventional collections system. It is a transaction-specific debit card with plastic money features which will replace the conventional transfer of funds.
INTERNATIONAL BankingWe have correspondent banking relationships with over 450 banks in 83 countries around the world. The business in the South Asian region in particular continues to grow and delivers excellent results in terms of balance sheet growth
and bottom line contribution. We carry out regular due diligence exercises to ensure that we deal with only those financial institutions which are able to meet the prescribed standards and criteria.
Askari Aasaan Money Transfer
Askari Aasaan Money Transfer is a service which provides quick and free home remittances by overseas Pakistanis to beneficiaries in Pakistan. The remittances are received through our arrangements with correspondent banks and exchange companies. This service is completely free-of-cost and is available for all citizens across the country. We have a dedicated team of customer service officers who are available to respond to the queries of remitters and beneficiaries of the remittances.
Corporate & Investment BankingAt Askari Bank, we understand the unique business requirements of our corporate and institutional clients, and accordingly strive to meet their expectations by providing a customized and relationship-based banking approach.
Corporate Banking
Corporate banking works on a long-term relationship-based business model to provide a single point within the Bank which meets all business requirements of its corporate and institutional customers, including public sector enterprises. Its primary objective is to enhance customer service, which remains our top priority. Dedicated relationship managers ensure customer satisfaction for all our corporate clients. Our relationship-oriented outlook focuses on providing a complete array of tailored financing solutions that are practical and cost effective, some of which include:
• Working Capital Facilities • Term Loans • Structured Trade Finance Facilities • Letters of Guarantee
13
Annual Report of Askari Bank Limited for 2015
• Letters of Credit • Fund Transfers/Remittances • Bill Discounting • Export Financing • Receivable Discounting
Investment Banking
Investment banking focuses on the origination and execution of a range of financial advisory and capital raising services to corporate and institutional clients. It also manages the Bank’s proprietary investments in local equity and debt markets. Investment banking offers various tailored financial solutions including debt syndications, project finance and advisory services, debt placements through capital markets as well as structured trade finance facilities. Whether a company is seeking to access the local or cross border syndications and debt capital markets, project financing needs, advisory services related to Mergers and Acquisitions and a or local equity capital markets for raising capital, our Investment banking is well positioned to provide due assistance. We tailor the right structured solutions to meet our customers’ needs in order to enhance business wealth and market competitiveness.
Commercial & sme bankingWe offer a divers range of financial solutions designed to suit the unique needs of our commercial and SME customer base.
Commercial Banking
Commercial Banking serves the middle tier segment by providing both general and tailored solutions encompassing all financial needs of the borrower ranging from project financing to working capital requirements/payroll management. Dedicated relationship managers at our credit hubs provide personalized solutions to our customers.
Small and Medium Enterprises (SME) Banking
Askari Bank has been playing a significant role in the development of the SME sector by providing customers with the opportunity to access credit through strategically located Regional Credit Hubs as well as our branches across the country. The Bank also offers trade expertise and awareness on trade related activity through these access points, where specialized credit resources
and empowered relationship management teams dedicatedly serve SMEs at the grass-root level.
Consumer BankingConsumer banking provides financing facilities to individuals through prudent, customer-centric policies and quality services that aim to make our customers’ experiences more interactive and intuitive. We are focused on broadening our outreach and expanding our presence in accordance with the needs of our customers across the country through direct sales as well as through our branch network. Special attention is given to business opportunities involving strategic alliances, with greater emphasis on a secured form of consumer lending so as to increase product offerings and improve the quality of our asset portfolio. We are committed to providing solutions and services that meet our customers’ needs at every stage of life.
Ask4Car
It is an auto financing product for new, used, and imported vehicles at a competitive markup and easy and quick processing without any hidden costs.
Personal Finance
With unmatched financing features in terms of loan amount, payback period and affordable monthly installments, Askari Bank’s personal finance makes sure that our customer gets the most out of their loan. The product tenure ranges from one to five years and is designed primarily for salaried individuals.
Mortgage Finance
Whether our customers plan to construct a house, buy a constructed house, or renovate a house, Askari Mortgage Finance enables them to pursue their goal without any hassle. Askari Mortgage Finance is a premium house financing product for customers belonging to the upper, upper middle and middle income groups.
Master Credit Card
Askari Bank offers a competitive suite of Classic, Gold, Corporate and Platinum Master Credit Cards that provide superior services, travel privileges and shopping
pleasures, along with reward points and transactional alerts through SMS as an enhanced security feature.
Askari World Master Card
Askari Bank pioneered Pakistan’s first ever “World MasterCard” in collaboration with MasterCard international. Askari World Master Card is specifically developed for customers seeking high-class service worldwide.
Askari Branchless BankingAskari Bank launched branchless banking jointly with China Mobile Pakistan under the brand name of “Timepey” in 2012. With this initiative, banking has become even more convenient and efficient as customers can safely send and receive funds anytime, anywhere across the country. A wide network of Timepey shops across Pakistan are fully equipped to handle the day-to-day needs of the customers. The following transactions are currently being handled under this program:
Government to Person (G2P) Disbursement:
Timepey has disbursed 14 tranches of over Rs14 billion cash assistance from the Federal Disaster Management Authority (FDMA) Government of Pakistan to the displaced people of South Waziristan.
Timepey Money Transfer
Customers can send and receive money from any Timepey outlet in the most efficient, secure and convenient manner. The facilities include person-to-person, government-to-person, person-to-account, account-to-person and account-to-account funds transfers.
Timepey Utility Bill Payment
Timepey account and non-account holders can pay all their utility bills through Timepey instantly and without any charges. Simply dial *888# from your mobile phone or visit any Timepay agent for cash payment.
PRODUCTS & SERVICES
14
Along the Silk Road
Timepey mobile top-up
Customers can purchase prepaid airtime and pay postpaid bills anytime, anywhere from their own mobile phone. This service is available to Zong customers who have a Timepey account.
Agricultural BankingAgricultural banking products and services are specifically designed for Pakistan’s farming and rural business segment. This function of the Bank aims to extend credits on softer terms to farmers, both on revolving as well as term basis. Recently the markup rate was brought down to make this facility available at grass-root levels so as to enhance not only the agricultural output, but to also become a source of better living standards for farmers who do not have access to low cost funding.
Agricultural banking products and services are offered across the country through efficient delivery channels under a control mechanism with minimum turnaround time for loan application approvals. The Bank has set up a vibrant program for fresh lendings under revised parameters, enabling farmers to avail financing in an easy, accessible and affordable manner.
• Kissan Ever Green Finance • Kissan Tractor Finance • Kissan Livestock Development Finance • Kissan Farm Mechanization Finance • Kissan Aabpashi Finance
Islamic Banking Under the guidance of its Shariah Board and professional bankers, Askari Islamic banking offers a diversified range of Shariah compliant products and services to its valued customers to fulfill their banking needs through its 78 dedicated Islamic banking branches (including 3 sub-branches) in 28 cities spread across the country.
Islamic Deposit Products
Our customers enjoy the freedom to choose from a wide array of deposit products that offer flexible term deposit schemes, current accounts and savings accounts.
Our Ahsan Munafa product is a chequing account that offers higher than expected
monthly returns, calculated on a daily product basis. Askari Halal Savings Account is tailored to meet all business requirements of our customers and offers a host of value-added services. Askari Islamic Investment Certificate is a Mudarabah-based term deposit product that allows customers to invest their savings for different tenors ranging from 3 months to 5 years, and earn Halal returns on a periodic basis. Askari Islamic Asaan Account was introduced this year and is available in current and savings account categories.
Islamic Consumer Banking Products
On the consumer banking front, Askari Ijarah Bis Sayyarah allows customers to get the car of their choice, while Askari Home Musharakah allows customers to purchase, build or renovate a home. Customers can also transfer existing house financing facilities from other financial institutions to Askari Islamic banking under Askari Home Musharakah.
Islamic Corporate Banking
Our continuous efforts to provide a diversified range of Shariah compliant, innovative financial products and solutions to corporate and commercial clients continue to win us new relationships. Working capital facilities are primarily provided under Murabaha, Salam and Istisna while our term facilities are rendered under the Diminishing Musharakah and Ijarah mode of Islamic finance.
Alternate Delivery ChannelsInternet (I.NET) Banking
Askari’s i.net banking assures convenient banking from the comfort of your home as customers are no longer required to wait in long and worrisome queues for a financial transaction, balance inquiry, statement of accounts, funds transfer, utility bill payment etc. In addition to these services, our i.net banking also added the following services in 2015:
• Online Banker’s Cheques can now be delivered to your doorstep
• Online Investment in Mutual Funds managed by Askari Investment Management Limited - a wholly owned subsidiary.
• Online Insurance premium payment of EFU & JLI
• Online payment for the purchase of Shaheen Airline Tickets
• Online LUMS fee payment
Mobile Banking
Askari mobile banking solution provides customers with convenient access to their accounts from their mobile phones, anytime, anywhere. We offer three types of mobile banking solutions to our customers:
• Askari Lite Mobile Banking – browser-based solution• Askari USSD Mobile Banking –
available to all mutual customers of Askari Bank and Ufone
• Askari Mobile Application – for Android, IOS, & Windows
Call Center
Our Call Center provides a single point of contact to all callers and offers real-time information on products and services. It also attends customers’ requests and handles their queries around the clock.
Automated Teller Machine (ATM)
Askari Bank is a member of two electronic ATM inter-bank connectivity platforms i.e., MNET and 1-link. Through this shared network of more than 9,000 online ATMs, including more than 467 Askari Bank ATMs, we provide services in all major cities of Pakistan.
ASKARI Visa Debit Card
You can manage your account, withdraw cash, make purchases and transfer your funds through Askari Visa Debit Card, which offers the conveniences of a credit card without the hassle of monthly bills and interest charges. There are no minimum balance requirements for the issuance or retention of the VISA Debit Card, which is available in Classic and Gold categories.
* Above referred products and services are subject to
various terms and conditions. For further details about
the products listed above or additional offerings of Askari
Bank, you may contact us at UAN 111-000-787 or visit
our website www.akbl.com.pk
15
Annual Report of Askari Bank Limited for 2015
NOTICE OF THE 24th
ANNUAL GENERAL MEETINGNotice is hereby given that the 24th Annual General Meeting of the shareholders of Askari Bank Limited (the Bank) will be held on Wednesday, March 30, 2016 at 10:00 am at Pearl Continental Hotel, Rawalpindi to transact the following business:
Ordinary Business:1. To confirm the minutes of the 23rd Annual General Meeting held on March 31, 2015.
2. To receive, consider and adopt the financial statements of the Bank for the year ended December 31, 2015 together with the Directors’ and
Auditors’ Reports thereon.
3. To appoint auditors for the year ending December 31, 2016 and to fix their remuneration. The present auditors, M/s A. F. Ferguson & Co.,
Chartered Accountants, being eligible, have offered themselves for re-appointment.
4. To approve, as recommended by the Directors, payment of final cash dividend @ 12.50% i.e. Rs.1.25 per share for the financial year 2015, in
addition to 10% interim cash dividend already paid.
5. To consider any other business as may be placed before the meeting with the permission of the Chair.
By Order of the Board
Umar Shahzad Company Secretary
Rawalpindi
March 01, 2016
NOTES1. The Share Transfer books of the Bank will remain closed from
March 22, 2016 to March 30, 2016 (both days inclusive).
Transfers received at M/s THK Associates (Private) Limited,
Second Floor, State Life Building # 3, Dr. Ziauddin Ahmad Road,
Karachi-75530, the Registrar and Share Transfer Office of the
Bank at the close of the business on March 21, 2016 will be
treated in time.
2. A member entitled to attend and vote at the meeting is entitled
to appoint a proxy to attend and vote for him/her. No person
shall act as a proxy, who is not a member of the Bank except
that Government of Pakistan [GoP] or SBP or corporate entity
may appoint a person who is not a member.
3. The instrument appointing a proxy should be signed by the
member or his/her attorney duly authorized in writing. If the
member is a corporate entity (other than GoP and SBP), its
common seal should be affixed on the instrument.
4. The instrument appointing a proxy, together with attested copy
of Power of Attorney or Board Resolution, if any, under which it is
signed or a notarially certified copy thereof, should be deposited,
with the Company Secretary, Askari Bank Limited, 1st Floor, AWT
Plaza, The Mall, P.O. Box No. 1084, Rawalpindi not less than 48
hours before the time of holding the meeting.
5. If a member appoints more than one proxy, and more than
one instrument of proxy is deposited by a member, all such
instruments of proxy shall be rendered invalid. The proxy form
shall be witnessed by two persons whose names, addresses
and CNIC numbers shall be mentioned on the form.
16
Along the Silk Road
6. Copy of the CNIC or passport of the beneficial owners shall be
furnished with the proxy form. The proxy shall produce his / her
original CNIC or original passport at the time of attending the
meeting.
7. In case of individual shareholder, Original Computerized National
Identity Card (CNIC) or original passport while for, the CDC
account holder or sub-account holder and or the person whose
securities are in group account and their registration details are
uploaded as per the regulations, his / her authentication would
be made by showing his / her Original Computerized National
Identity Card (CNIC) or original passport along with participant(s)
ID Number and their account numbers. In case of GoP / SBP /
corporate entity, the Board of Directors’ resolution / power of
attorney with specimen signature shall be submitted along with
proxy form to the Bank.
8. In compliance of amendments made by the Government of
Pakistan through Finance Act, 2015 in Section 150 of the
Income Tax Ordinance, 2001 whereby rates are enhanced for
deduction of withholding tax on the amount of dividend paid by
the companies/banks. These rates are as follows:
a) For filers of income tax returns - 12.50%
b) For non-filers of income tax returns - 17.50%
And to enable the Bank to make tax deduction on the amount
of cash dividend @ 12.50% instead of 17.50% all shareholders
whose names are not entered into the Active Tax payers List
(ATL) provided on the website of FBR, despite the fact that they
are filers, are advised to make sure that their names are entered
into ATL before the date of payment of the cash dividend,
otherwise tax on their cash dividend (as and when declared) will
be deducted @ 17.50% instead of 12.50%.
Moreover, all shareholders who hold shares jointly, are
requested to provide shareholding proportions of principal
shareholder and joint holder(s) in respect of shares held by them
to our Share Registrar M/s. THK Associates (Pvt) Ltd), in writing
as follows:
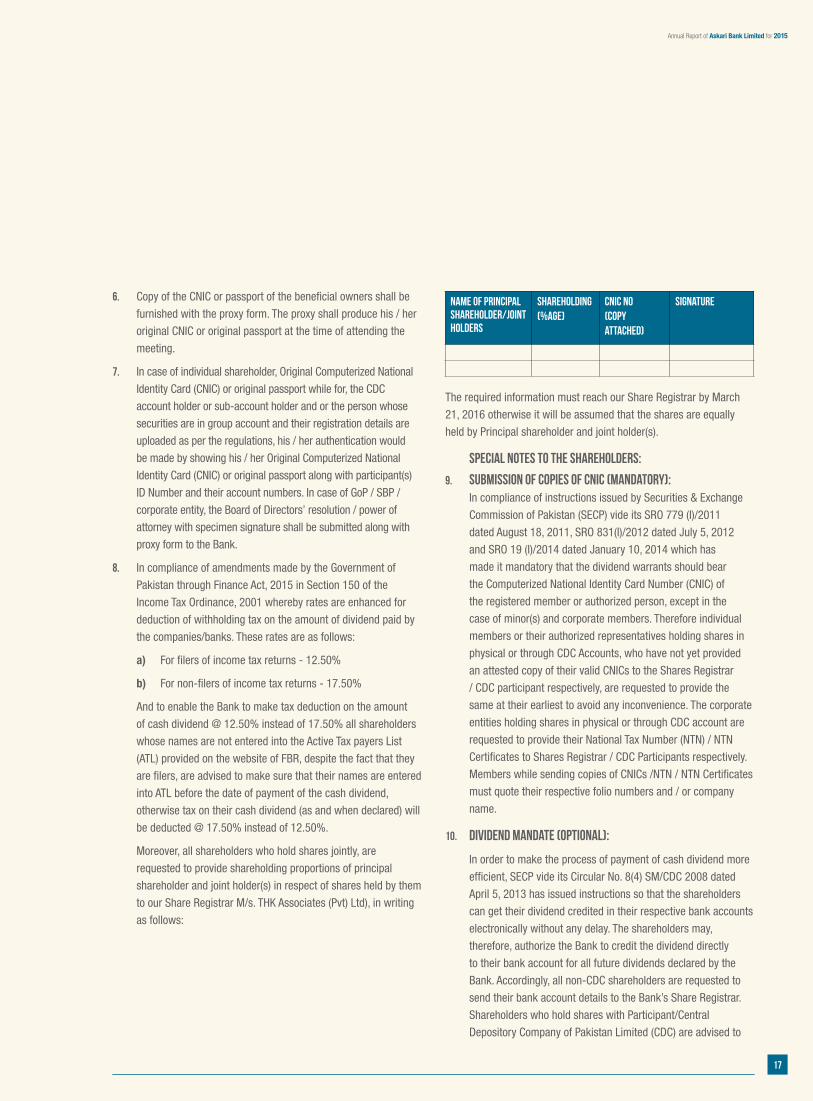
Name of Principal Shareholder/Joint Holders
Shareholding (%age)
CNIC No(copy attached)
Signature
The required information must reach our Share Registrar by March
21, 2016 otherwise it will be assumed that the shares are equally
held by Principal shareholder and joint holder(s).
Special Notes to the Shareholders:
9. Submission of Copies of CNIC (Mandatory): In compliance of instructions issued by Securities & Exchange
Commission of Pakistan (SECP) vide its SRO 779 (I)/2011
dated August 18, 2011, SRO 831(I)/2012 dated July 5, 2012
and SRO 19 (I)/2014 dated January 10, 2014 which has
made it mandatory that the dividend warrants should bear
the Computerized National Identity Card Number (CNIC) of
the registered member or authorized person, except in the
case of minor(s) and corporate members. Therefore individual
members or their authorized representatives holding shares in
physical or through CDC Accounts, who have not yet provided
an attested copy of their valid CNICs to the Shares Registrar
/ CDC participant respectively, are requested to provide the
same at their earliest to avoid any inconvenience. The corporate
entities holding shares in physical or through CDC account are
requested to provide their National Tax Number (NTN) / NTN
Certificates to Shares Registrar / CDC Participants respectively.
Members while sending copies of CNICs /NTN / NTN Certificates
must quote their respective folio numbers and / or company
name.
10. Dividend Mandate (Optional):
In order to make the process of payment of cash dividend more
efficient, SECP vide its Circular No. 8(4) SM/CDC 2008 dated
April 5, 2013 has issued instructions so that the shareholders
can get their dividend credited in their respective bank accounts
electronically without any delay. The shareholders may,
therefore, authorize the Bank to credit the dividend directly
to their bank account for all future dividends declared by the
Bank. Accordingly, all non-CDC shareholders are requested to
send their bank account details to the Bank’s Share Registrar.
Shareholders who hold shares with Participant/Central
Depository Company of Pakistan Limited (CDC) are advised to
17
Annual Report of Askari Bank Limited for 2015
NOTICE OF THE 24th
ANNUAL GENERAL MEETING
provide the mandate to the concerned Stock Broker / Central
Depository Company of Pakistan Limited.
Please note that giving bank mandate for dividend payment
is optional and in case shareholders do not wish to avail this
facility, dividend will be paid by sending dividend warrant at
given registered address.
11. Transmission of Audited Financial Statements & Notices to members through email (Optional):
In compliance of S.R.O. 787(I)/2014 of SECP dated September
8, 2014, which has allowed the circulation of soft copies of
Audited Financial Statements along with Notice of Annual
General Meeting to the members through e-mail, the Bank
has made available on its website (www.akbl.com.pk), a
Standard Request Form, which members, who wish to receive
soft copies of Audited Financial Statements along with Notice
of AGM, may use to communicate their e-mail address and
consent, along with their postal and e-mail address to Share
Registrar to whom such requests shall be sent. Since this
facility is optional, therefore, if shareholders do not wish to
avail this facility please ignore this option and in such case,
Notice and Audited Financial Statements will be sent at the
registered addresses, as per normal practice.
12. Consent for Video Conference Facility: In compliance of Circular No. 10 dated May 21, 2014 of
Securities & Exchange Commission of Pakistan (SECP),
shareholders of the Bank are informed that they can also avail
video conference facility in Lahore & Karachi. In this regard,
please fill the following and submit to registered address of the
Bank 10 days before holding of general meeting.
If the Bank receives consent from members holding
in aggregate 10 % or more shareholding residing at a
geographical location, to participate in the meeting through
video conference at least 10 days prior to date of meeting, the
Bank will arrange video conference facility in that city subject
to availability of such facility in that city.
The Bank will intimate members regarding venue of video
conference facility at least 5 days before the date of general
meeting along with complete information necessary to enable
them to access such facility.
I/We,---------------- of --------------------, being a member of
Askari Bank Limited, holder of ----------- Ordinary Share(s) as
per Register Folio No./CDC Sub-Account No. ----------- hereby
opt for video conference facility at ------------ .
__________________
Signature of Member
13. Change of Address: Members are requested to immediately notify any change
in their addresses to the Bank’s Shares Registrar, M/s. THK
Associates Pvt. Ltd.
18
Along the Silk Road
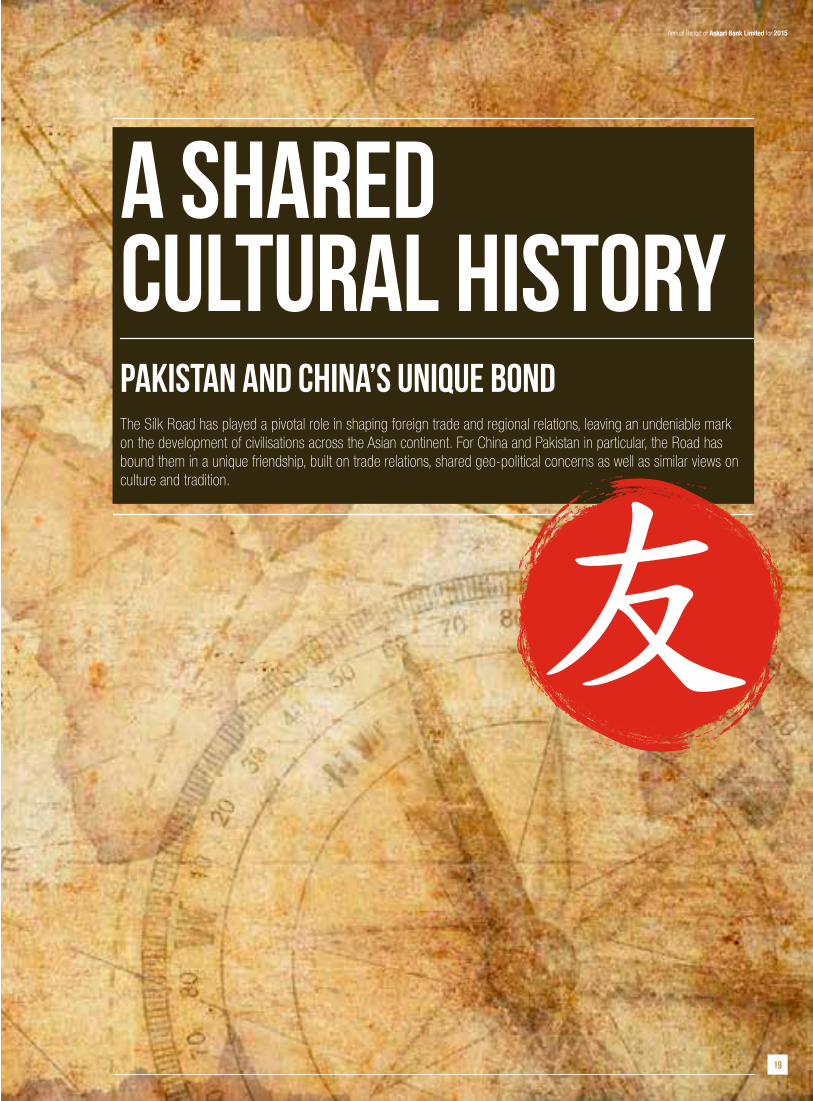
a shared cultural historyThe Silk Road has played a pivotal role in shaping foreign trade and regional relations, leaving an undeniable mark on the development of civilisations across the Asian continent. For China and Pakistan in particular, the Road has bound them in a unique friendship, built on trade relations, shared geo-political concerns as well as similar views on culture and tradition.
Pakistan and China’s unique bond
Annual Report of Askari Bank Limited for 2015
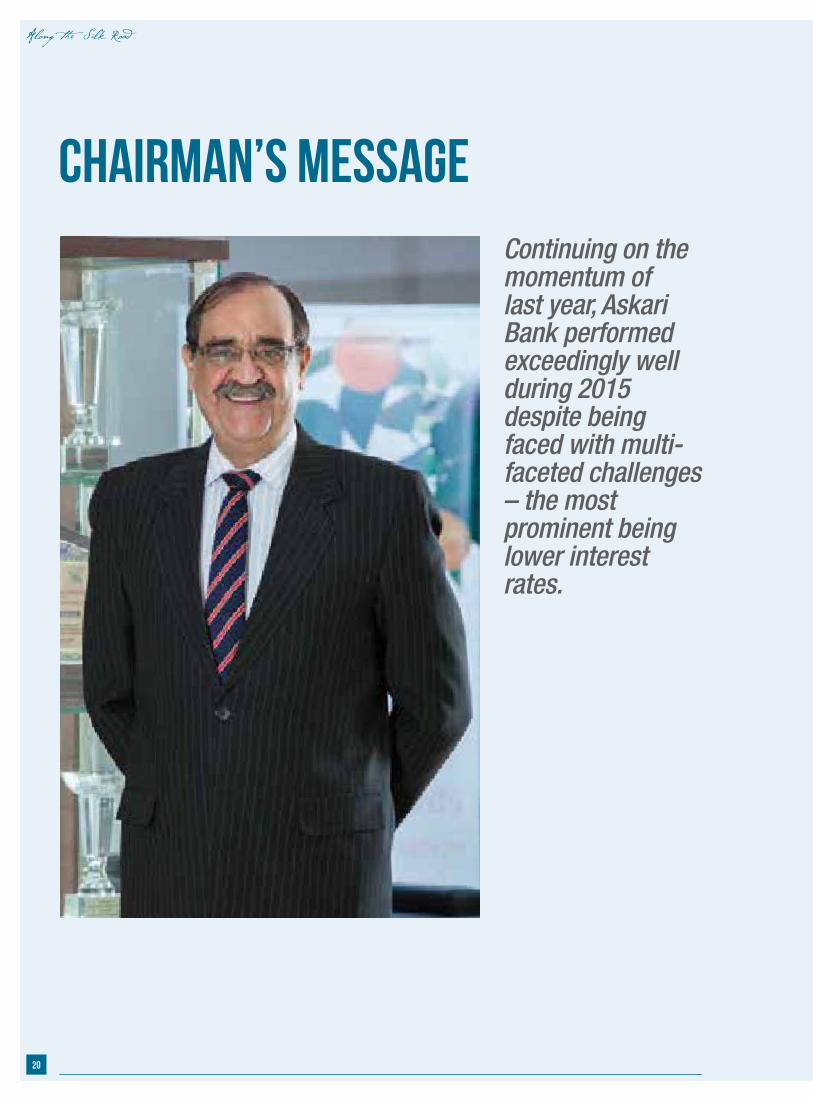
CHAIRMAN’S MESSAGE Continuing on the momentum of last year, Askari Bank performed exceedingly well during 2015 despite being faced with multi-faceted challenges – the most prominent being lower interest rates.
20
Along the Silk Road
The financial results of the Bank reflect healthy growth in quality
assets, earnings and shareholders’ equity. The growth was enabled
by a strategy focusing on diverse mix of asset portfolios, augmented
with a strong risk management framework, emphasis on technology
and optimization of efficiencies through rationalization of processes
and capacity building. The profit before tax of Rs.8.43 billion
remained 46 percent higher than last year; while profit after tax of
Rs.5.04 billion against Rs.4.01 billion last year, recorded a growth
of 26 percent. Based on these financial results, the Board is pleased
to announce a final cash dividend of Rs.1.25 per share (i.e.12.5
percent), making the total cash dividend of Rs.2.25 per share (i.e.
22.25 percent) for the year 2015.
The Bank’s approach to sustainable business is driven by the spirit
of partnership with its customers as present day banking must
extend far beyond transactions. As an institution that continues
to foster savings, Askari Bank revels in its strength of nurturing
enduring relationships. Alongside, we strive to ensure that our
employees respect the values, and practice the highest ethical
standards expected of them. We firmly believe in the highest
standards of good governance which are about instilling trust leading
to effective, transparent and accountable governance. We consider
these standards as indispensable in creating long term value for the
stakeholders and must be pursued uncompromisingly to uphold the
Bank’s well established ASKARI brand and reputation as a safe and
sound Bank.
We remain committed to excellence in all aspects of our business,
including product quality and knowledge, business advisory,
customized and innovative financial solutions and service delivery.
We will further build upon our recent successes and harness
business opportunities to review our strategies in keeping with the
changing socio-economic dynamics.
As we look to the year ahead and beyond, we see the regional
developments playing an important role in the macro-economic
growth of Pakistan, particularly the China-Pakistan-Economic-
Corridor, which will be the key area of focus and financial sector
will seek to collaborate and forge partnerships across different
projects and opportunities arising out of the Corridor. We look forward
to capture win-win opportunities in the areas of trade finance,
infrastructure development and industrial projects, as we expand our
branch footprint and international presence for enhanced customer
convenience in supporting the economic growth of Pakistan.
My heart felt gratitude to our customers who have continued to build
stronger relationships enabling us to record excellent performance. I
take this opportunity to extend my wholehearted appreciation to the
management and staff for their indefatigable commitment and hard
work that have resulted in such exceptional results. We shall continue
to rely on their dedicated support and commitment in taking Askari
Bank forward together to even greater heights. Insha Allah!
Lt Gen Khalid Nawaz KhanHI (M) (Retd), Sitara-i-Esar
February 15, 2016
21
Annual Report of Askari Bank Limited for 2015
PRESIDENT’S REVIEW 2015 was yet another successful year for Askari Bank; marked by exceptional performance, despite a challenging milieu for the banking industry i.e. lower interest margins, weak credit growth, and persistent structural constraints.
22
Along the Silk Road
The developments in macroeconomic indicators resulted in continued stance of monetary easing, which began in 2014. During the year under review, the State Bank of Pakistan (SBP) policy rate reduced to a multi-decade low at 6.5 percent – a cumulative reduction of 300 bps during 2015. The reduction in commodity and oil prices significantly contributed towards improvement in current account deficit and foreign exchange reserves. These developments also led to upgrade in Pakistan’s sovereign ratings by international rating agencies.
Despite these positives, the credit to private sector remained subdued during most of 2015. The reduction in commodity prices also reduced demand for working capital and trade finance. On the other hand, real cost of borrowing is still considered high as decline in inflation is steeper than fall in lending rates. These factors together with long standing structural constraints i.e., power shortages and weak external demand, were primarily responsible for slowdown in credit growth. Resultantly, fixed income bonds offering attractive returns remained a preferred alternate for the banking sector.
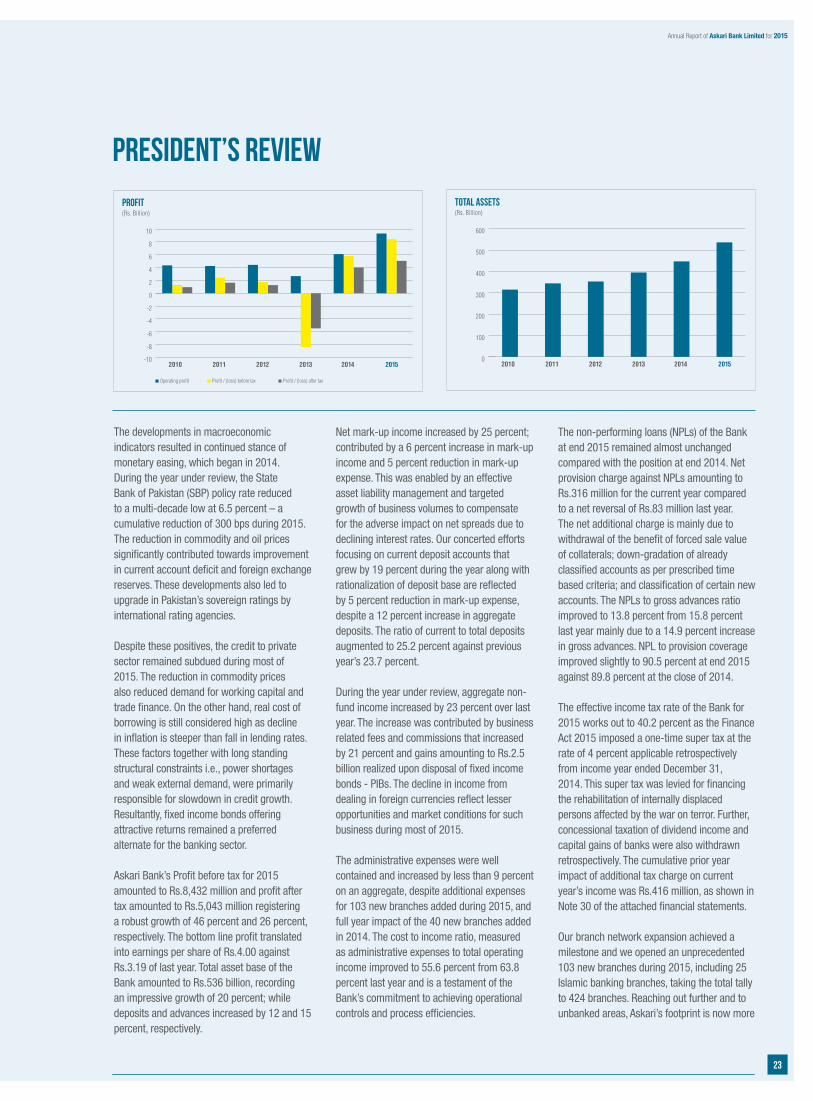
Askari Bank’s Profit before tax for 2015 amounted to Rs.8,432 million and profit after tax amounted to Rs.5,043 million registering a robust growth of 46 percent and 26 percent, respectively. The bottom line profit translated into earnings per share of Rs.4.00 against Rs.3.19 of last year. Total asset base of the Bank amounted to Rs.536 billion, recording an impressive growth of 20 percent; while deposits and advances increased by 12 and 15 percent, respectively.
Net mark-up income increased by 25 percent; contributed by a 6 percent increase in mark-up income and 5 percent reduction in mark-up expense. This was enabled by an effective asset liability management and targeted growth of business volumes to compensate for the adverse impact on net spreads due to declining interest rates. Our concerted efforts focusing on current deposit accounts that grew by 19 percent during the year along with rationalization of deposit base are reflected by 5 percent reduction in mark-up expense, despite a 12 percent increase in aggregate deposits. The ratio of current to total deposits augmented to 25.2 percent against previous year’s 23.7 percent.
During the year under review, aggregate non-fund income increased by 23 percent over last year. The increase was contributed by business related fees and commissions that increased by 21 percent and gains amounting to Rs.2.5 billion realized upon disposal of fixed income bonds - PIBs. The decline in income from dealing in foreign currencies reflect lesser opportunities and market conditions for such business during most of 2015.
The administrative expenses were well contained and increased by less than 9 percent on an aggregate, despite additional expenses for 103 new branches added during 2015, and full year impact of the 40 new branches added in 2014. The cost to income ratio, measured as administrative expenses to total operating income improved to 55.6 percent from 63.8 percent last year and is a testament of the Bank’s commitment to achieving operational controls and process efficiencies.
The non-performing loans (NPLs) of the Bank at end 2015 remained almost unchanged compared with the position at end 2014. Net provision charge against NPLs amounting to Rs.316 million for the current year compared to a net reversal of Rs.83 million last year. The net additional charge is mainly due to withdrawal of the benefit of forced sale value of collaterals; down-gradation of already classified accounts as per prescribed time based criteria; and classification of certain new accounts. The NPLs to gross advances ratio improved to 13.8 percent from 15.8 percent last year mainly due to a 14.9 percent increase in gross advances. NPL to provision coverage improved slightly to 90.5 percent at end 2015 against 89.8 percent at the close of 2014.
The effective income tax rate of the Bank for 2015 works out to 40.2 percent as the Finance Act 2015 imposed a one-time super tax at the rate of 4 percent applicable retrospectively from income year ended December 31, 2014. This super tax was levied for financing the rehabilitation of internally displaced persons affected by the war on terror. Further, concessional taxation of dividend income and capital gains of banks were also withdrawn retrospectively. The cumulative prior year impact of additional tax charge on current year’s income was Rs.416 million, as shown in Note 30 of the attached financial statements.
Our branch network expansion achieved a milestone and we opened an unprecedented 103 new branches during 2015, including 25 Islamic banking branches, taking the total tally to 424 branches. Reaching out further and to unbanked areas, Askari’s footprint is now more
PRESIDENT’S REVIEW
Profit / (loss) after taxProfit / (loss) before taxOperating profit
Profit(Rs. Billion)
201520142013201220112010-10
-8
-6
-4
-2
0
2
4
6
8
10
TOTAL ASSETS(Rs. Billion)
2015201420132012201120100
100
200
300
400
500
600
23
Annual Report of Askari Bank Limited for 2015
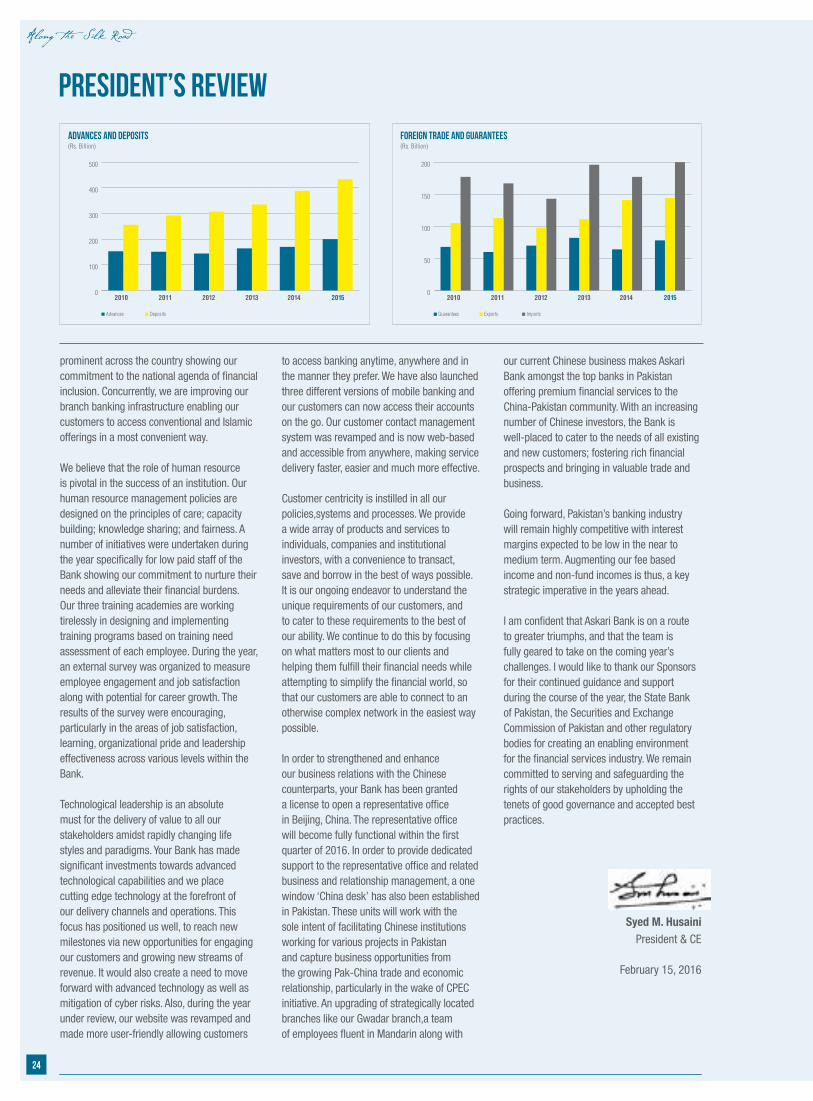
PRESIDENT’S REVIEW Advances and Deposits(Rs. Billion)
2015201420132012201120100
100
200
300
400
500
DepositsAdvances
Foreign Trade and Guarantees(Rs. Billion)
2015201420132012201120100
50
100
150
200
ImportsExportsGuarantees
prominent across the country showing our commitment to the national agenda of financial inclusion. Concurrently, we are improving our branch banking infrastructure enabling our customers to access conventional and Islamic offerings in a most convenient way.
We believe that the role of human resource is pivotal in the success of an institution. Our human resource management policies are designed on the principles of care; capacity building; knowledge sharing; and fairness. A number of initiatives were undertaken during the year specifically for low paid staff of the Bank showing our commitment to nurture their needs and alleviate their financial burdens. Our three training academies are working tirelessly in designing and implementing training programs based on training need assessment of each employee. During the year, an external survey was organized to measure employee engagement and job satisfaction along with potential for career growth. The results of the survey were encouraging, particularly in the areas of job satisfaction, learning, organizational pride and leadership effectiveness across various levels within the Bank.
Technological leadership is an absolute must for the delivery of value to all our stakeholders amidst rapidly changing life styles and paradigms. Your Bank has made significant investments towards advanced technological capabilities and we place cutting edge technology at the forefront of our delivery channels and operations. This focus has positioned us well, to reach new milestones via new opportunities for engaging our customers and growing new streams of revenue. It would also create a need to move forward with advanced technology as well as mitigation of cyber risks. Also, during the year under review, our website was revamped and made more user-friendly allowing customers
to access banking anytime, anywhere and in the manner they prefer. We have also launched three different versions of mobile banking and our customers can now access their accounts on the go. Our customer contact management system was revamped and is now web-based and accessible from anywhere, making service delivery faster, easier and much more effective.
Customer centricity is instilled in all our policies,systems and processes. We provide a wide array of products and services to individuals, companies and institutional investors, with a convenience to transact, save and borrow in the best of ways possible.It is our ongoing endeavor to understand the unique requirements of our customers, and to cater to these requirements to the best of our ability. We continue to do this by focusing on what matters most to our clients and helping them fulfill their financial needs while attempting to simplify the financial world, so that our customers are able to connect to an otherwise complex network in the easiest way possible.
In order to strengthened and enhance our business relations with the Chinese counterparts, your Bank has been granted a license to open a representative office in Beijing, China. The representative office will become fully functional within the first quarter of 2016. In order to provide dedicated support to the representative office and related business and relationship management, a one window ‘China desk’ has also been established in Pakistan. These units will work with the sole intent of facilitating Chinese institutions working for various projects in Pakistan and capture business opportunities from the growing Pak-China trade and economic relationship, particularly in the wake of CPEC initiative. An upgrading of strategically located branches like our Gwadar branch,a team of employees fluent in Mandarin along with
our current Chinese business makes Askari Bank amongst the top banks in Pakistan offering premium financial services to the China-Pakistan community. With an increasing number of Chinese investors, the Bank is well-placed to cater to the needs of all existing and new customers; fostering rich financial prospects and bringing in valuable trade and business.
Going forward, Pakistan’s banking industry will remain highly competitive with interest margins expected to be low in the near to medium term. Augmenting our fee based income and non-fund incomes is thus, a key strategic imperative in the years ahead.
I am confident that Askari Bank is on a route to greater triumphs, and that the team is fully geared to take on the coming year’s challenges. I would like to thank our Sponsors for their continued guidance and support during the course of the year, the State Bank of Pakistan, the Securities and Exchange Commission of Pakistan and other regulatory bodies for creating an enabling environment for the financial services industry. We remain committed to serving and safeguarding the rights of our stakeholders by upholding the tenets of good governance and accepted best practices.
Syed M. HusainiPresident & CE
February 15, 2016
24
Along the Silk Road

a love offolk art
Both nations share a great passion for diverse folk art. Fromvivacious kite-flying to entertaining puppetry, the Chinese andPakistani societies have adopted these recreational activities as a way of life. Music resonates within the cultural fabric of both as well - where the Chinese make use of erhu, dizi, pipa and zheng in their symphonies, the Pakistanis use tambooro, daffli, dholak and tabla in their musical compositions. And where the latter celebrate with bhangra, ho jamalo, khattak dance and luddi, the Chinese express their joy through the dragon dance, lion dance and dunhuang dance with equal warmth and spirit.
SYMPHONY, puppetry andkite-flying phenomenons
Annual Report of Askari Bank Limited for 2015
CORPORATE SOCIAL RESPONSIBILITY (CSR)
Taking care of employees beyond contractual commitments is one
of our CSR priorities. Looking after them and their children ensures
the long-term and wide-spread success of not only Askari Bank, but
also the entire country and its continuing generations. The in-house
training program for the graduate children of our underprivileged
employees is running successfully. Under the program, the children
of less privileged employees are given paid training and guaranteed
employment is offered to the successful candidates.
We have also developed a system through which we can help the
ailing children of our underprivileged staff by creating a database
of all such children and ensuring that they are provided with timely
medical assistance. We are simultaneously working on creating
awareness to tackle such medical issues appropriately and in a
timely manner across the institution.
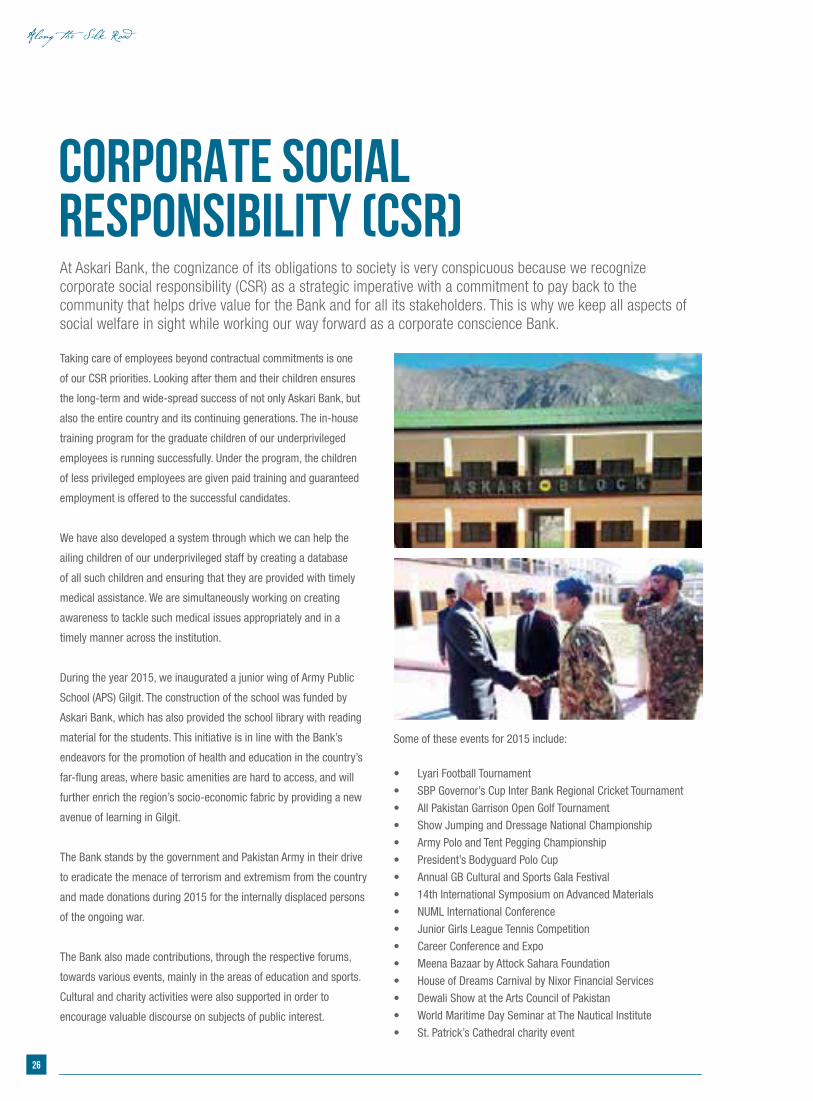
During the year 2015, we inaugurated a junior wing of Army Public
School (APS) Gilgit. The construction of the school was funded by
Askari Bank, which has also provided the school library with reading
material for the students. This initiative is in line with the Bank’s
endeavors for the promotion of health and education in the country’s
far-flung areas, where basic amenities are hard to access, and will
further enrich the region’s socio-economic fabric by providing a new
avenue of learning in Gilgit.
The Bank stands by the government and Pakistan Army in their drive
to eradicate the menace of terrorism and extremism from the country
and made donations during 2015 for the internally displaced persons
of the ongoing war.
The Bank also made contributions, through the respective forums,
towards various events, mainly in the areas of education and sports.
Cultural and charity activities were also supported in order to
encourage valuable discourse on subjects of public interest.
Some of these events for 2015 include:
• Lyari Football Tournament
• SBP Governor’s Cup Inter Bank Regional Cricket Tournament
• All Pakistan Garrison Open Golf Tournament
• Show Jumping and Dressage National Championship
• Army Polo and Tent Pegging Championship
• President’s Bodyguard Polo Cup
• Annual GB Cultural and Sports Gala Festival
• 14th International Symposium on Advanced Materials
• NUML International Conference
• Junior Girls League Tennis Competition
• Career Conference and Expo
• Meena Bazaar by Attock Sahara Foundation
• House of Dreams Carnival by Nixor Financial Services
• Dewali Show at the Arts Council of Pakistan
• World Maritime Day Seminar at The Nautical Institute
• St. Patrick’s Cathedral charity event
At Askari Bank, the cognizance of its obligations to society is very conspicuous because we recognize corporate social responsibility (CSR) as a strategic imperative with a commitment to pay back to the community that helps drive value for the Bank and for all its stakeholders. This is why we keep all aspects of social welfare in sight while working our way forward as a corporate conscience Bank.
26
Along the Silk Road

the spirit of festivityAt present, there are a few distinct festivals that showcase the heritage and cultural similarities of both China and Pakistan. The Khunjerab-Pamir Cultural Festival in Hunza features music, traditional sports, cultural dances, goods and photo exhibitions that celebrate the legacy of this region’s glorious past during the time of the ancient Silk Road.
united to celebrate our shared roots
Annual Report of Askari Bank Limited for 2015
VALUE ADDED STATEMENT FOR THE YEAR ENDED DECEMBER 31, 2015
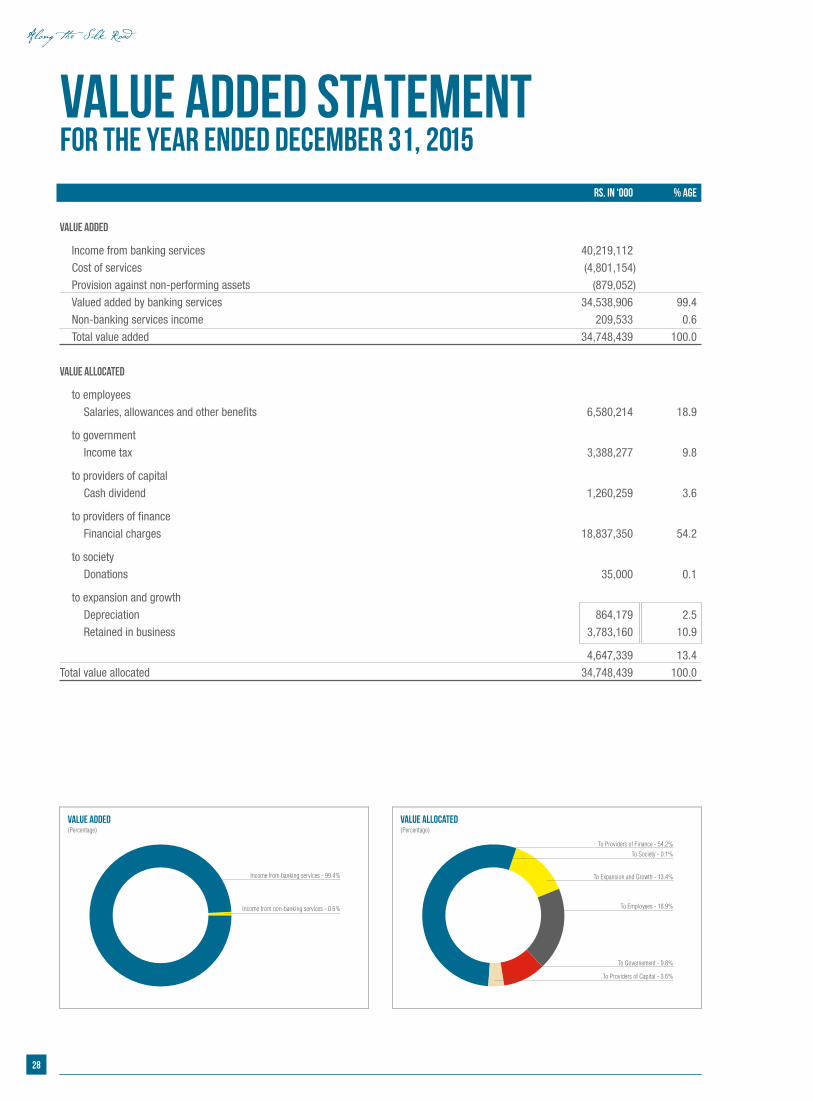
(Percentage)
Income from banking services - 99.4%
Income from non-banking services - 0.6%
Value Added Value Allocated
To Providers of Finance - 54.2%
To Expansion and Growth - 13.4%
To Society - 0.1%
To Employees - 18.9%
To Governement - 9.8%
To Providers of Capital - 3.6%
(Percentage)
Rs. in ‘000 % age
Value Added
Income from banking services 40,219,112
Cost of services (4,801,154)
Provision against non-performing assets (879,052)
Valued added by banking services 34,538,906 99.4
Non-banking services income 209,533 0.6
Total value added 34,748,439 100.0
Value Allocated
to employees
Salaries, allowances and other benefits 6,580,214 18.9
to government
Income tax 3,388,277 9.8
to providers of capital
Cash dividend 1,260,259 3.6
to providers of finance
Financial charges 18,837,350 54.2
to society
Donations 35,000 0.1
to expansion and growth
Depreciation 864,179 2.5
Retained in business 3,783,160 10.9
4,647,339 13.4
Total value allocated 34,748,439 100.0
28
Along the Silk Road
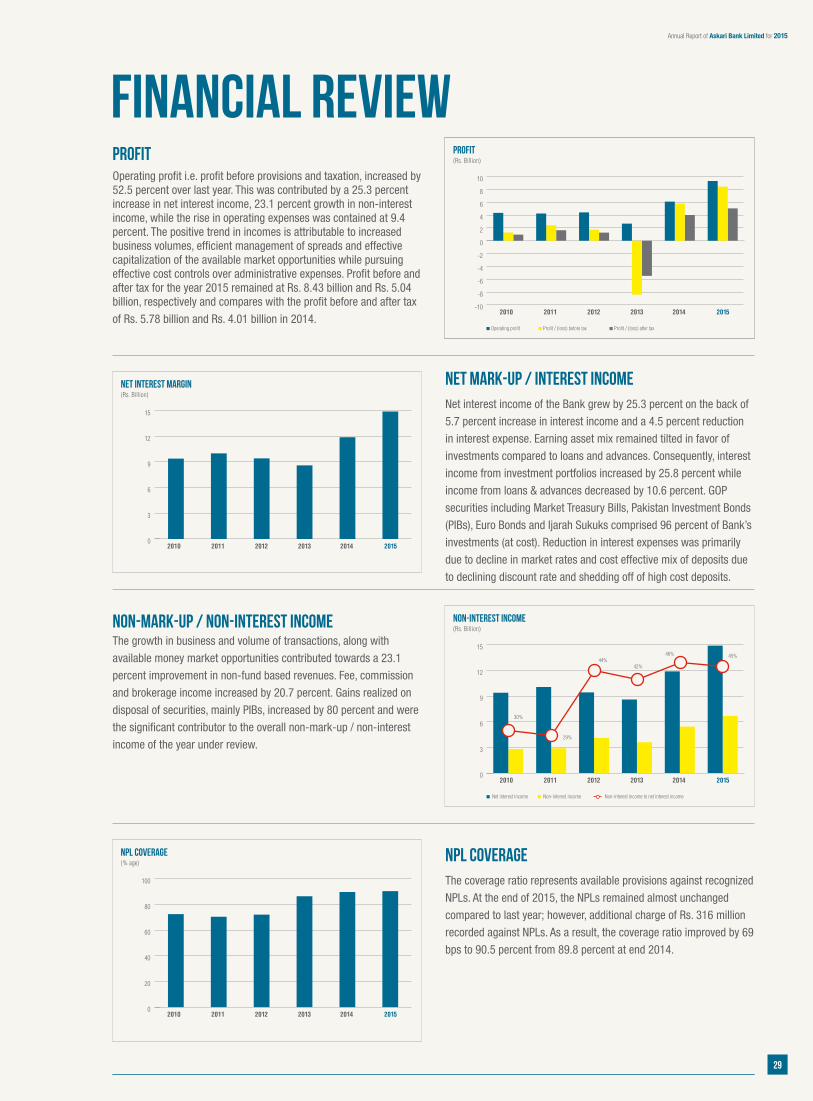
ProfitOperating profit i.e. profit before provisions and taxation, increased by 52.5 percent over last year. This was contributed by a 25.3 percent increase in net interest income, 23.1 percent growth in non-interest income, while the rise in operating expenses was contained at 9.4 percent. The positive trend in incomes is attributable to increased business volumes, efficient management of spreads and effective capitalization of the available market opportunities while pursuing effective cost controls over administrative expenses. Profit before and after tax for the year 2015 remained at Rs. 8.43 billion and Rs. 5.04 billion, respectively and compares with the profit before and after tax
of Rs. 5.78 billion and Rs. 4.01 billion in 2014.
Profit / (loss) after taxProfit / (loss) before taxOperating profit
Profit(Rs. Billion)
201520142013201220112010-10
-8
-6
-4
-2
0
2
4
6
8
10
Net mark-up / interest Income Net interest income of the Bank grew by 25.3 percent on the back of
5.7 percent increase in interest income and a 4.5 percent reduction
in interest expense. Earning asset mix remained tilted in favor of
investments compared to loans and advances. Consequently, interest
income from investment portfolios increased by 25.8 percent while
income from loans & advances decreased by 10.6 percent. GOP
securities including Market Treasury Bills, Pakistan Investment Bonds
(PIBs), Euro Bonds and Ijarah Sukuks comprised 96 percent of Bank’s
investments (at cost). Reduction in interest expenses was primarily
due to decline in market rates and cost effective mix of deposits due
to declining discount rate and shedding off of high cost deposits.
Non-mark-up / non-interest Income The growth in business and volume of transactions, along with
available money market opportunities contributed towards a 23.1
percent improvement in non-fund based revenues. Fee, commission
and brokerage income increased by 20.7 percent. Gains realized on
disposal of securities, mainly PIBs, increased by 80 percent and were
the significant contributor to the overall non-mark-up / non-interest
income of the year under review.
NPL CoverageThe coverage ratio represents available provisions against recognized
NPLs. At the end of 2015, the NPLs remained almost unchanged
compared to last year; however, additional charge of Rs. 316 million
recorded against NPLs. As a result, the coverage ratio improved by 69
bps to 90.5 percent from 89.8 percent at end 2014.
FINANCIAL REVIEW
Non-interest Income(Rs. Billion)
2015201420132012201120100
3
6
9
12
15
Net interest income Non-interest income Non-interest income to net interest income
30%
29%
45%44%
42%
46%
NPL Coverage(% age)
2015201420132012201120100
20
40
60
80
100
Net Interest Margin(Rs. Billion)
2015201420132012201120100
3
6
9
12
15
29
Annual Report of Askari Bank Limited for 2015
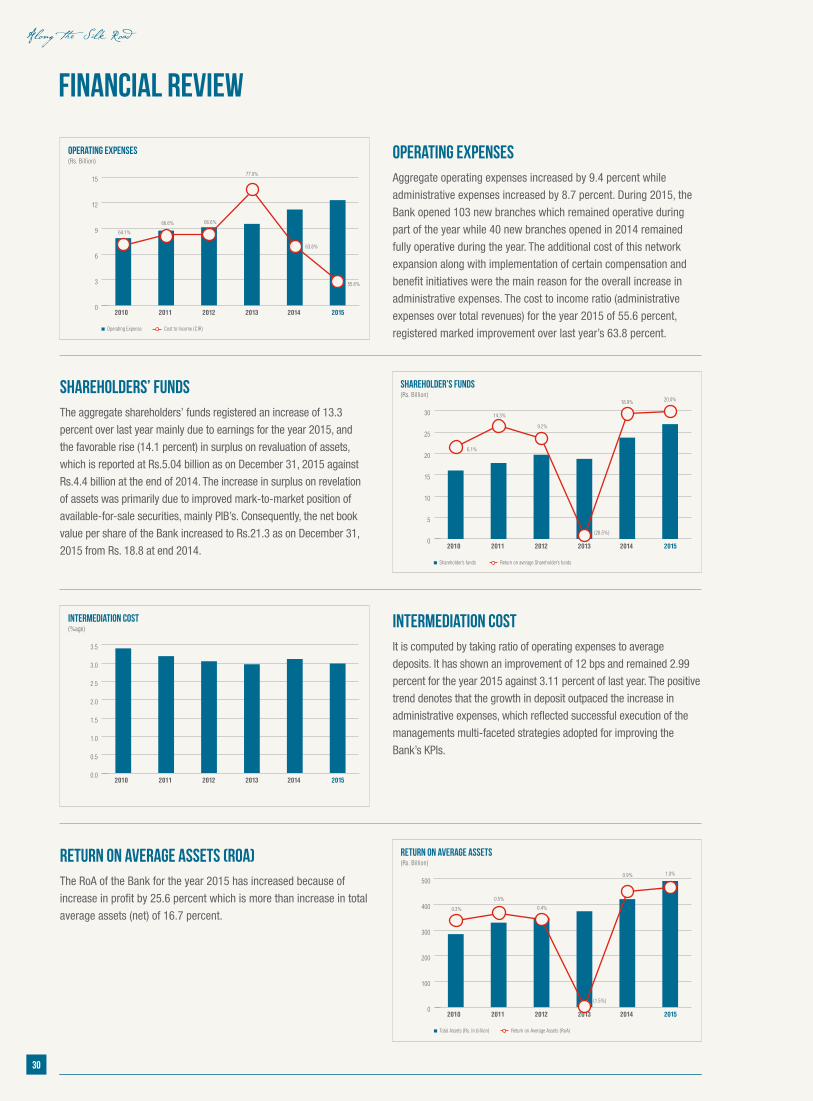
Operating expenses Aggregate operating expenses increased by 9.4 percent while
administrative expenses increased by 8.7 percent. During 2015, the
Bank opened 103 new branches which remained operative during
part of the year while 40 new branches opened in 2014 remained
fully operative during the year. The additional cost of this network
expansion along with implementation of certain compensation and
benefit initiatives were the main reason for the overall increase in
administrative expenses. The cost to income ratio (administrative
expenses over total revenues) for the year 2015 of 55.6 percent,
registered marked improvement over last year’s 63.8 percent.
Shareholders’ funds The aggregate shareholders’ funds registered an increase of 13.3
percent over last year mainly due to earnings for the year 2015, and
the favorable rise (14.1 percent) in surplus on revaluation of assets,
which is reported at Rs.5.04 billion as on December 31, 2015 against
Rs.4.4 billion at the end of 2014. The increase in surplus on revelation
of assets was primarily due to improved mark-to-market position of
available-for-sale securities, mainly PIB’s. Consequently, the net book
value per share of the Bank increased to Rs.21.3 as on December 31,
2015 from Rs. 18.8 at end 2014.
Intermediation cost It is computed by taking ratio of operating expenses to average
deposits. It has shown an improvement of 12 bps and remained 2.99
percent for the year 2015 against 3.11 percent of last year. The positive
trend denotes that the growth in deposit outpaced the increase in
administrative expenses, which reflected successful execution of the
managements multi-faceted strategies adopted for improving the
Bank’s KPIs.
Return on average assets (RoA) The RoA of the Bank for the year 2015 has increased because of
increase in profit by 25.6 percent which is more than increase in total
average assets (net) of 16.7 percent.
FINANCIAL REVIEW
Shareholder’s Funds(Rs. Billion)
2015201420132012201120100
5
10
15
20
25
30
6.1%
14.3%
20.0%
9.2%
(28.5%)
18.9%
Shareholder’s funds Return on average Shareholder’s funds
Operating Expenses(Rs. Billion)
2015201420132012201120100
3
6
9
12
15
Operating Expense
64.1%
66.6%
55.6%
66.6%
77.0%
63.8%
Cost to Income (CIR)
Intermediation Cost(%age)
2015201420132012201120100.0
0.5
1.0
1.5
2.0
2.5
3.0
3.5
Return on average assets(Rs. Billion)
2015201420132012201120100
100
200
300
400
500
0.3%
0.5%
1.0%
0.4%
(1.5%)
0.9%
Total Assets (Rs. In billion) Return on Average Assets (RoA)
30
Along the Silk Road
2015201420132012201120100
50
100
150
200
250
Gross Advances NPLs as % of Gross Advances
Non-performing Loans(Rs. Billion)
12.8%
14.1%
16.3% 17.2%
15.8%
13.8%
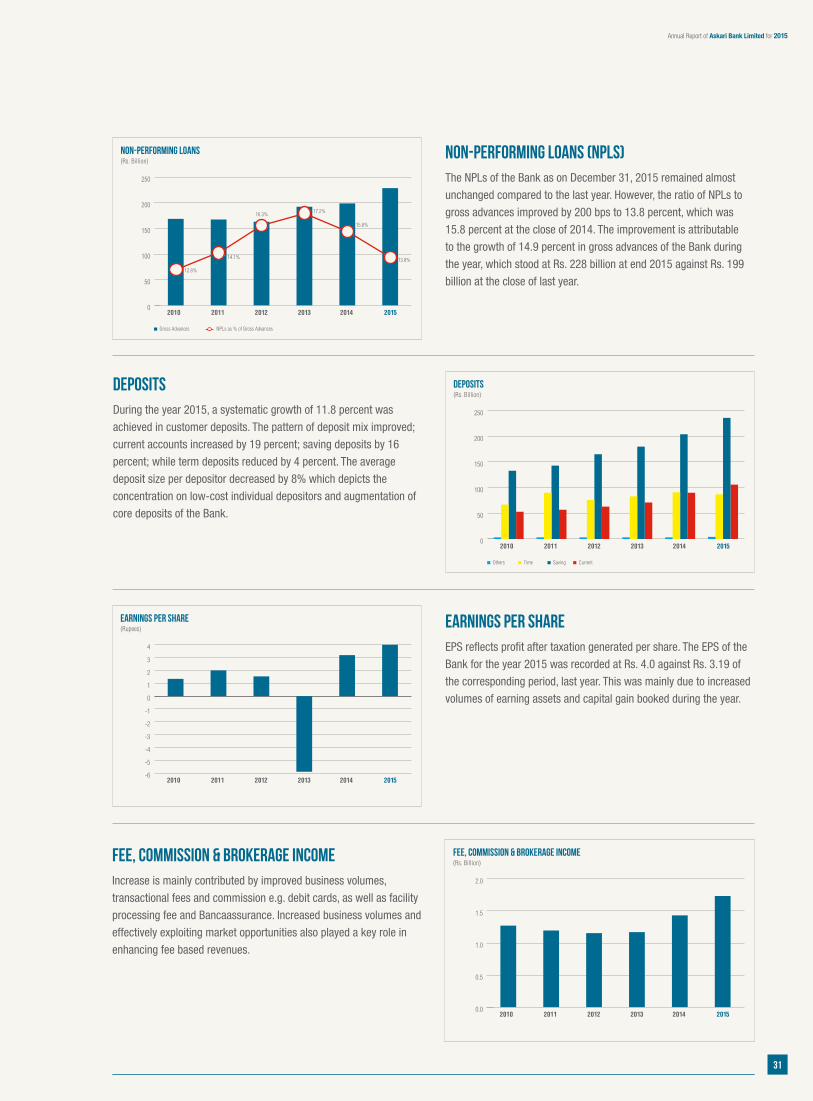
Non-performing loans (NPLs) The NPLs of the Bank as on December 31, 2015 remained almost
unchanged compared to the last year. However, the ratio of NPLs to
gross advances improved by 200 bps to 13.8 percent, which was
15.8 percent at the close of 2014. The improvement is attributable
to the growth of 14.9 percent in gross advances of the Bank during
the year, which stood at Rs. 228 billion at end 2015 against Rs. 199
billion at the close of last year.
Deposits During the year 2015, a systematic growth of 11.8 percent was
achieved in customer deposits. The pattern of deposit mix improved;
current accounts increased by 19 percent; saving deposits by 16
percent; while term deposits reduced by 4 percent. The average
deposit size per depositor decreased by 8% which depicts the
concentration on low-cost individual depositors and augmentation of
core deposits of the Bank.
Earnings per shareEPS reflects profit after taxation generated per share. The EPS of the
Bank for the year 2015 was recorded at Rs. 4.0 against Rs. 3.19 of
the corresponding period, last year. This was mainly due to increased
volumes of earning assets and capital gain booked during the year.
Fee, Commission & Brokerage Income Increase is mainly contributed by improved business volumes,
transactional fees and commission e.g. debit cards, as well as facility
processing fee and Bancaassurance. Increased business volumes and
effectively exploiting market opportunities also played a key role in
enhancing fee based revenues.
EARNINGS PER SHARE(Rupees)
201520142013201220112010-6
-5
-4
-3
-2
-1
0
1
2
3
4
Fee, Commission & Brokerage Income(Rs. Billion)
2015201420132012201120100.0
0.5
1.0
1.5
2.0
Deposits(Rs. Billion)
2015201420132012201120100
50
100
150
200
250
Time Saving CurrentOthers
31
Annual Report of Askari Bank Limited for 2015
FINANCIAL CALENDAR2015
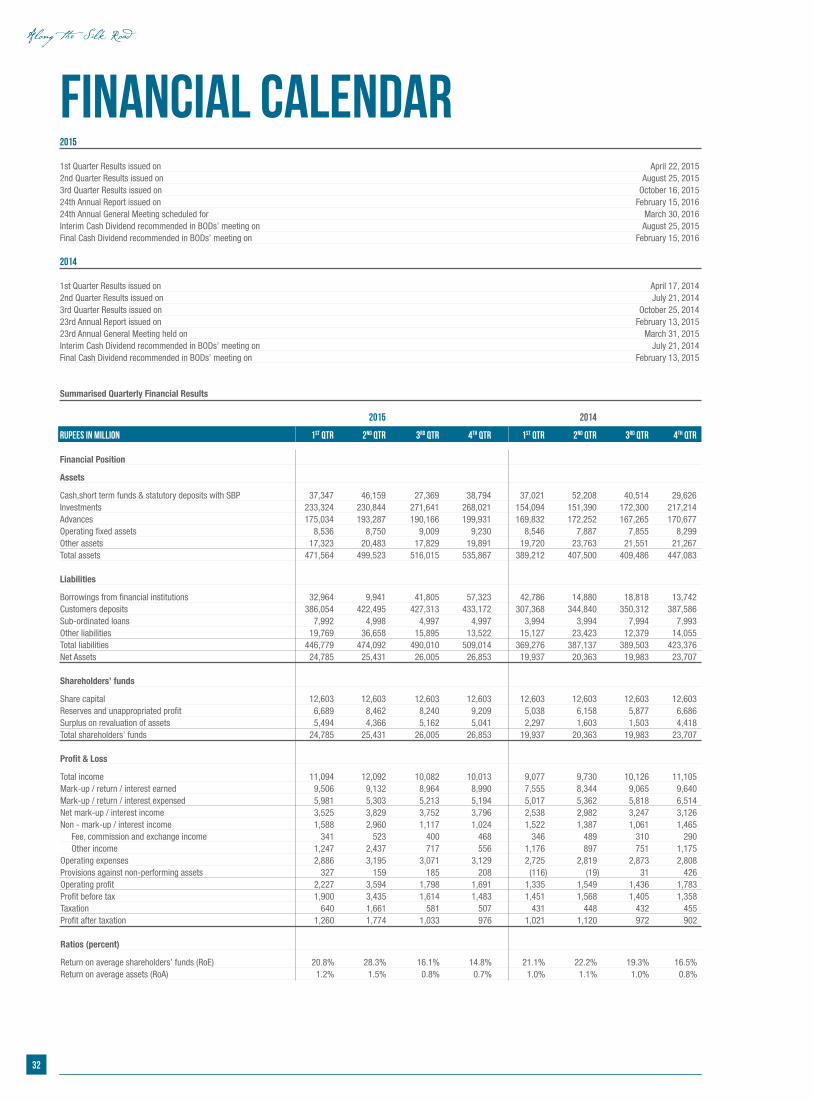
1st Quarter Results issued on April 22, 20152nd Quarter Results issued on August 25, 20153rd Quarter Results issued on October 16, 201524th Annual Report issued on February 15, 201624th Annual General Meeting scheduled for March 30, 2016Interim Cash Dividend recommended in BODs’ meeting on August 25, 2015Final Cash Dividend recommended in BODs’ meeting on February 15, 2016 2014
1st Quarter Results issued on April 17, 20142nd Quarter Results issued on July 21, 20143rd Quarter Results issued on October 25, 201423rd Annual Report issued on February 13, 201523rd Annual General Meeting held on March 31, 2015Interim Cash Dividend recommended in BODs’ meeting on July 21, 2014Final Cash Dividend recommended in BODs’ meeting on February 13, 2015
Summarised Quarterly Financial Results
2015 2014
Rupees in million 1st Qtr 2nd Qtr 3rd Qtr 4th Qtr 1st Qtr 2nd Qtr 3rd Qtr 4th Qtr
Financial Position
Assets
Cash,short term funds & statutory deposits with SBP 37,347 46,159 27,369 38,794 37,021 52,208 40,514 29,626 Investments 233,324 230,844 271,641 268,021 154,094 151,390 172,300 217,214 Advances 175,034 193,287 190,166 199,931 169,832 172,252 167,265 170,677 Operating fixed assets 8,536 8,750 9,009 9,230 8,546 7,887 7,855 8,299 Other assets 17,323 20,483 17,829 19,891 19,720 23,763 21,551 21,267 Total assets 471,564 499,523 516,015 535,867 389,212 407,500 409,486 447,083
Liabilities
Borrowings from financial institutions 32,964 9,941 41,805 57,323 42,786 14,880 18,818 13,742 Customers deposits 386,054 422,495 427,313 433,172 307,368 344,840 350,312 387,586 Sub-ordinated loans 7,992 4,998 4,997 4,997 3,994 3,994 7,994 7,993 Other liabilities 19,769 36,658 15,895 13,522 15,127 23,423 12,379 14,055 Total liabilities 446,779 474,092 490,010 509,014 369,276 387,137 389,503 423,376 Net Assets 24,785 25,431 26,005 26,853 19,937 20,363 19,983 23,707 Shareholders’ funds
Share capital 12,603 12,603 12,603 12,603 12,603 12,603 12,603 12,603 Reserves and unappropriated profit 6,689 8,462 8,240 9,209 5,038 6,158 5,877 6,686 Surplus on revaluation of assets 5,494 4,366 5,162 5,041 2,297 1,603 1,503 4,418 Total shareholders’ funds 24,785 25,431 26,005 26,853 19,937 20,363 19,983 23,707
Profit & Loss
Total income 11,094 12,092 10,082 10,013 9,077 9,730 10,126 11,105 Mark-up / return / interest earned 9,506 9,132 8,964 8,990 7,555 8,344 9,065 9,640 Mark-up / return / interest expensed 5,981 5,303 5,213 5,194 5,017 5,362 5,818 6,514 Net mark-up / interest income 3,525 3,829 3,752 3,796 2,538 2,982 3,247 3,126 Non - mark-up / interest income 1,588 2,960 1,117 1,024 1,522 1,387 1,061 1,465 Fee, commission and exchange income 341 523 400 468 346 489 310 290 Other income 1,247 2,437 717 556 1,176 897 751 1,175 Operating expenses 2,886 3,195 3,071 3,129 2,725 2,819 2,873 2,808 Provisions against non-performing assets 327 159 185 208 (116) (19) 31 426 Operating profit 2,227 3,594 1,798 1,691 1,335 1,549 1,436 1,783 Profit before tax 1,900 3,435 1,614 1,483 1,451 1,568 1,405 1,358 Taxation 640 1,661 581 507 431 448 432 455 Profit after taxation 1,260 1,774 1,033 976 1,021 1,120 972 902 Ratios (percent)
Return on average shareholders’ funds (RoE) 20.8% 28.3% 16.1% 14.8% 21.1% 22.2% 19.3% 16.5%Return on average assets (RoA) 1.2% 1.5% 0.8% 0.7% 1.0% 1.1% 1.0% 0.8%
32
Along the Silk Road
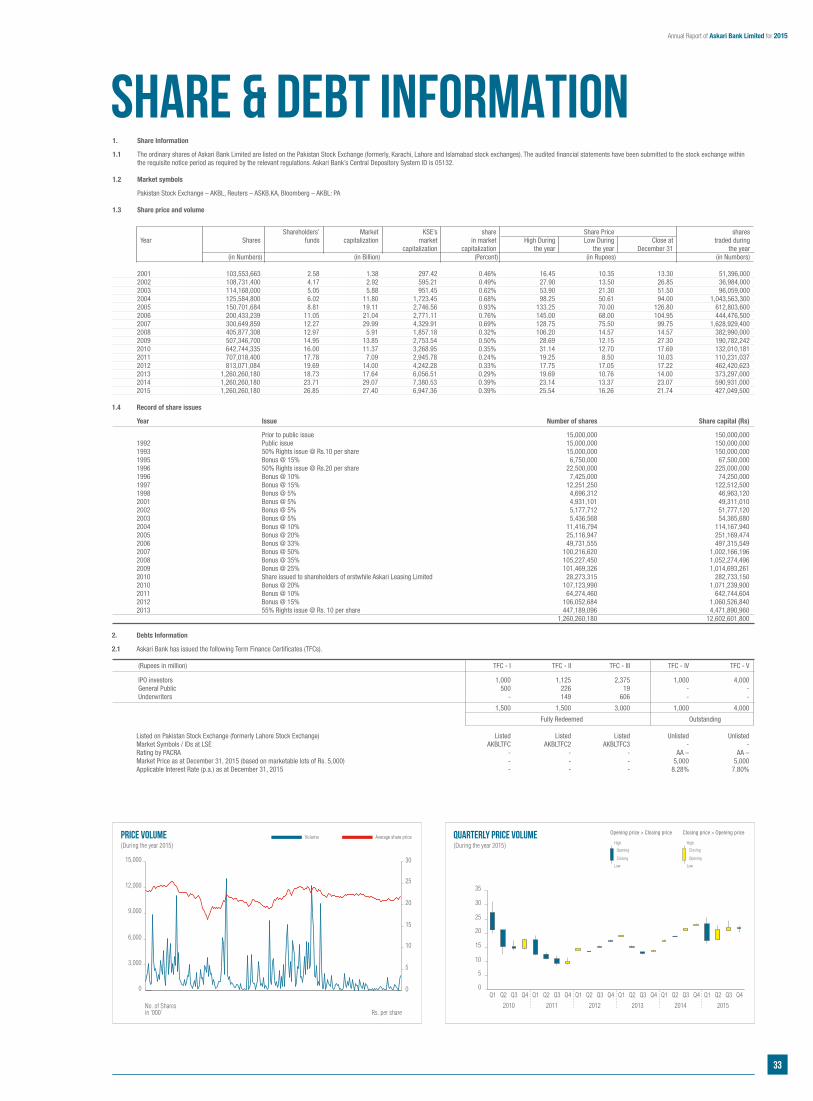
SHARE & DEBT INFORMATION1. Share Information
1.1 The ordinary shares of Askari Bank Limited are listed on the Pakistan Stock Exchange (formerly, Karachi, Lahore and Islamabad stock exchanges). The audited financial statements have been submitted to the stock exchange within the requisite notice period as required by the relevant regulations. Askari Bank’s Central Depository System ID is 05132.
1.2 Market symbols
Pakistan Stock Exchange – AKBL, Reuters – ASKB.KA, Bloomberg – AKBL: PA 1.3 Share price and volume
Shareholders’ Market KSE’s share Share Price shares Year Shares funds capitalization market in market High During Low During Close at traded during capitalization capitalization the year the year December 31 the year (in Numbers) (in Billion) (Percent) (in Rupees) (in Numbers)
2001 103,553,663 2.58 1.38 297.42 0.46% 16.45 10.35 13.30 51,396,000 2002 108,731,400 4.17 2.92 595.21 0.49% 27.90 13.50 26.85 36,984,000 2003 114,168,000 5.05 5.88 951.45 0.62% 53.90 21.30 51.50 96,059,000 2004 125,584,800 6.02 11.80 1,723.45 0.68% 98.25 50.61 94.00 1,043,563,300 2005 150,701,684 8.81 19.11 2,746.56 0.93% 133.25 70.00 126.80 612,803,600 2006 200,433,239 11.05 21.04 2,771.11 0.76% 145.00 68.00 104.95 444,476,500 2007 300,649,859 12.27 29.99 4,329.91 0.69% 128.75 75.50 99.75 1,628,929,400 2008 405,877,308 12.97 5.91 1,857.18 0.32% 106.20 14.57 14.57 382,990,000 2009 507,346,700 14.95 13.85 2,753.54 0.50% 28.69 12.15 27.30 190,782,242 2010 642,744,335 16.00 11.37 3,268.95 0.35% 31.14 12.70 17.69 132,010,181 2011 707,018,400 17.78 7.09 2,945.78 0.24% 19.25 8.50 10.03 110,231,037 2012 813,071,084 19.69 14.00 4,242.28 0.33% 17.75 17.05 17.22 462,420,623 2013 1,260,260,180 18.73 17.64 6,056.51 0.29% 19.69 10.76 14.00 373,297,000 2014 1,260,260,180 23.71 29.07 7,380.53 0.39% 23.14 13.37 23.07 590,931,000 2015 1,260,260,180 26.85 27.40 6,947.36 0.39% 25.54 16.26 21.74 427,049,500
1.4 Record of share issues
Year Issue Number of shares Share capital (Rs)
Prior to public issue 15,000,000 150,000,000 1992 Public issue 15,000,000 150,000,000 1993 50% Rights issue @ Rs.10 per share 15,000,000 150,000,000 1995 Bonus @ 15% 6,750,000 67,500,000 1996 50% Rights issue @ Rs.20 per share 22,500,000 225,000,000 1996 Bonus @ 10% 7,425,000 74,250,000 1997 Bonus @ 15% 12,251,250 122,512,500 1998 Bonus @ 5% 4,696,312 46,963,120 2001 Bonus @ 5% 4,931,101 49,311,010 2002 Bonus @ 5% 5,177,712 51,777,120 2003 Bonus @ 5% 5,436,568 54,365,680 2004 Bonus @ 10% 11,416,794 114,167,940 2005 Bonus @ 20% 25,116,947 251,169,474 2006 Bonus @ 33% 49,731,555 497,315,549 2007 Bonus @ 50% 100,216,620 1,002,166,196 2008 Bonus @ 35% 105,227,450 1,052,274,496 2009 Bonus @ 25% 101,469,326 1,014,693,261 2010 Share issued to shareholders of erstwhile Askari Leasing Limited 28,273,315 282,733,150 2010 Bonus @ 20% 107,123,990 1,071,239,900 2011 Bonus @ 10% 64,274,460 642,744,604 2012 Bonus @ 15% 106,052,684 1,060,526,840 2013 55% Rights issue @ Rs. 10 per share 447,189,096 4,471,890,960 1,260,260,180 12,602,601,800 2. Debts Information
2.1 Askari Bank has issued the following Term Finance Certificates (TFCs). (Rupees in million) TFC - I TFC - II TFC - III TFC - IV TFC - V
IPO investors 1,000 1,125 2,375 1,000 4,000 General Public 500 226 19 - - Underwriters - 149 606 - -
1,500 1,500 3,000 1,000 4,000
Fully Redeemed Outstanding Listed on Pakistan Stock Exchange (formerly Lahore Stock Exchange) Listed Listed Listed Unlisted Unlisted Market Symbols / IDs at LSE AKBLTFC AKBLTFC2 AKBLTFC3 - - Rating by PACRA - - - AA – AA – Market Price as at December 31, 2015 (based on marketable lots of Rs. 5,000) - - - 5,000 5,000 Applicable Interest Rate (p.a.) as at December 31, 2015 - - - 8.28% 7.80%
PRICE VOLUME(During the year 2015)
No. of Sharesin ‘000’ Rs. per share
Average share priceVolume
0
3,000
6,000
9,000
12,000
15,000
0
5
10
15
20
25
30
QUARTERLY PRICE VOLUME(During the year 2015)
0
5
10
15
20
30
25
35
Q1
2010
Q2
Q3
Q4
Q1
2011
Q2
Q3
Q4
Q1
2012
Q2
Q3
Q4
Q1
2013
Q2
Q3
Q4
Q1
2014
Q2
Q3
Q4
Q1
2015
Q2
Q3
Q4
Opening price > Closing price
High
Opening
Closing
Low
Closing price > Opening price
High
Closing
Opening
Low
33
Annual Report of Askari Bank Limited for 2015
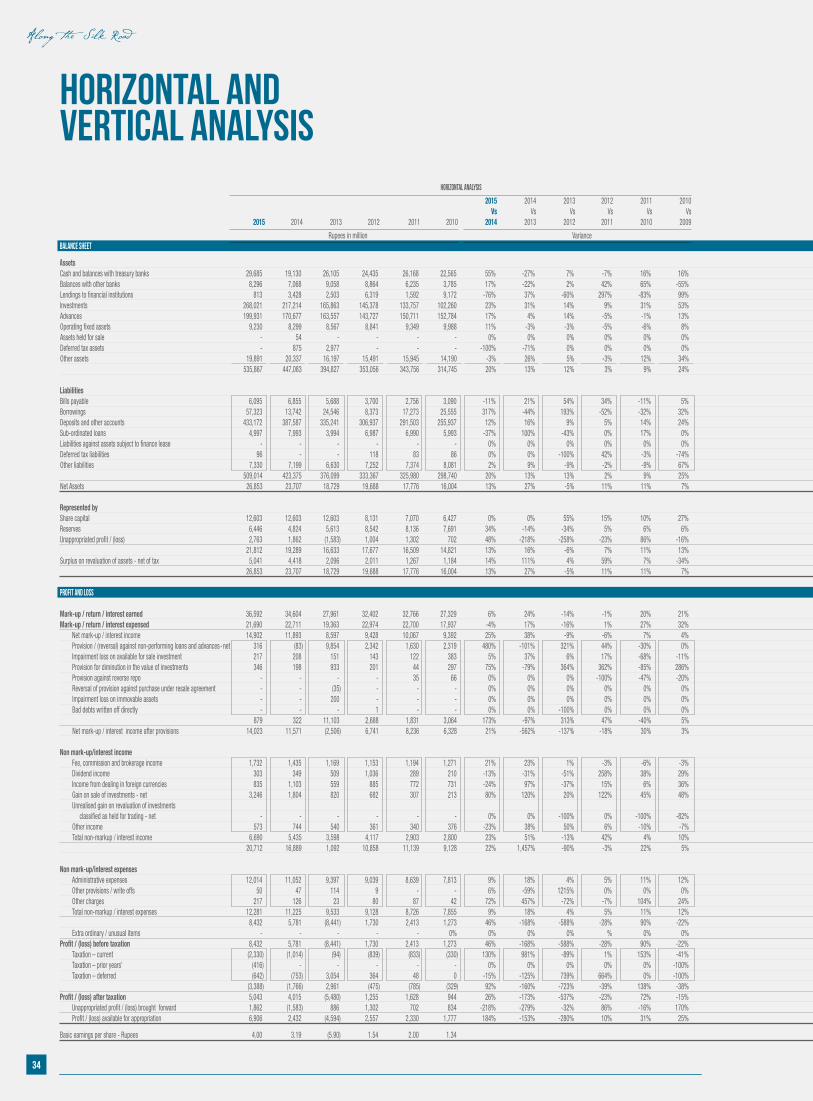
HORIZONTAL ANDVERTICAL ANALYSIS Horizontal Analysis Vertical Analysis
2015 2014 2013 2012 2011 2010 Vs Vs Vs Vs Vs Vs 2015 2014 2013 2012 2011 2010 2014 2013 2012 2011 2010 2009 2015 2014 2013 2012 2011 2010 2015 2014 2013 2012 2011 2010
Rupees in million Variance Rupees in ‘000 Composition BALANCE SHEET BALANCE SHEET
Assets Cash and balances with treasury banks 29,685 19,130 26,105 24,435 26,168 22,565 55% -27% 7% -7% 16% 16% Cash and balances with treasury banks 29,685 19,130 26,105 24,435 26,168 22,565 6% 4% 7% 7% 8% 7%Balances with other banks 8,296 7,068 9,058 8,864 6,235 3,785 17% -22% 2% 42% 65% -55% Balances with other banks 8,296 7,068 9,058 8,864 6,235 3,785 2% 2% 2% 3% 2% 1%Lendings to financial institutions 813 3,428 2,503 6,319 1,592 9,172 -76% 37% -60% 297% -83% 99% Lendings to financial institutions 813 3,428 2,503 6,319 1,592 9,172 0% 1% 1% 2% 0% 3%Investments 268,021 217,214 165,863 145,378 133,757 102,260 23% 31% 14% 9% 31% 53% Investments 268,021 217,214 165,863 145,378 133,757 102,260 50% 49% 42% 41% 39% 32%Advances 199,931 170,677 163,557 143,727 150,711 152,784 17% 4% 14% -5% -1% 13% Advances 199,931 170,677 163,557 143,727 150,711 152,784 37% 38% 41% 41% 44% 49%Operating fixed assets 9,230 8,299 8,567 8,841 9,349 9,988 11% -3% -3% -5% -6% 8% Operating fixed assets 9,230 8,299 8,567 8,841 9,349 9,988 2% 2% 2% 3% 3% 3%Assets held for sale - 54 - - - - 0% 0% 0% 0% 0% 0% Assets held for sale - 54 Deferred tax assets - 875 2,977 - - - -100% -71% 0% 0% 0% 0% Deferred tax assets - 875 2,977 - - - 0% 0% 1% 0% 0% 0%Other assets 19,891 20,337 16,197 15,491 15,945 14,190 -3% 26% 5% -3% 12% 34% Other assets 19,891 20,337 16,197 15,491 15,945 14,190 4% 5% 4% 4% 5% 5% 535,867 447,083 394,827 353,056 343,756 314,745 20% 13% 12% 3% 9% 24% 535,867 447,029 394,827 353,056 343,756 314,745 100% 100% 100% 100% 100% 100% Liabilities LiabilitiesBills payable 6,095 6,855 5,688 3,700 2,756 3,090 -11% 21% 54% 34% -11% 5% Bills payable 6,095 6,855 5,688 3,700 2,756 3,090 1% 2% 2% 1% 1% 1%Borrowings 57,323 13,742 24,546 8,373 17,273 25,555 317% -44% 193% -52% -32% 32% Borrowings 57,323 13,742 24,546 8,373 17,273 25,555 11% 3% 7% 3% 5% 9%Deposits and other accounts 433,172 387,587 335,241 306,937 291,503 255,937 12% 16% 9% 5% 14% 24% Deposits and other accounts 433,172 387,587 335,241 306,937 291,503 255,937 85% 92% 89% 92% 89% 86%Sub-ordinated loans 4,997 7,993 3,994 6,987 6,990 5,993 -37% 100% -43% 0% 17% 0% Sub-ordinated loans 4,997 7,993 3,994 6,987 6,990 5,993 1% 2% 1% 2% 2% 2%Liabilities against assets subject to finance lease - - - - - - 0% 0% 0% 0% 0% 0% Liabilities against assets subject to finance lease - - - - - - 0% 0% 0% 0% 0% 0%Deferred tax liabilities 96 - - 118 83 86 0% 0% -100% 42% -3% -74% Deferred tax liabilities 96 - - 118 83 86 0% 0% 0% 0% 0% 0%Other liabilities 7,330 7,199 6,630 7,252 7,374 8,081 2% 9% -9% -2% -9% 67% Other liabilities 7,330 7,199 6,630 7,252 7,374 8,081 1% 2% 2% 2% 2% 3% 509,014 423,375 376,099 333,367 325,980 298,740 20% 13% 13% 2% 9% 25% 509,014 423,375 376,099 333,367 325,980 298,740 100% 100% 100% 100% 100% 100%Net Assets 26,853 23,707 18,729 19,688 17,776 16,004 13% 27% -5% 11% 11% 7% Net Assets 26,853 23,707 18,729 19,688 17,776 16,004 5% 5% 5% 6% 5% 5% Represented by Represented by Share capital 12,603 12,603 12,603 8,131 7,070 6,427 0% 0% 55% 15% 10% 27% Share capital 12,603 12,603 12,603 8,131 7,070 6,427 53% 53% 67% 40% 40% 32%Reserves 6,446 4,824 5,613 8,542 8,136 7,691 34% -14% -34% 5% 6% 6% Reserves 6,446 4,824 5,613 8,542 8,136 7,691 27% 20% 30% 46% 48% 45%Unappropriated profit / (loss) 2,763 1,862 (1,583) 1,004 1,302 702 48% -218% -258% -23% 86% -16% Unappropriated profit / (loss) 2,763 1,862 (1,583) 1,004 1,302 702 12% 8% -8% 7% 4% 5% 21,812 19,289 16,633 17,677 16,509 14,821 13% 16% -6% 7% 11% 13% 21,812 19,289 16,633 17,677 16,509 14,821 92% 81% 89% 93% 93% 82%Surplus on revaluation of assets - net of tax 5,041 4,418 2,096 2,011 1,267 1,184 14% 111% 4% 59% 7% -34% Surplus on revaluation of assets - net of tax 5,041 4,418 2,096 2,011 1,267 1,184 21% 19% 11% 7% 7% 11% 26,853 23,707 18,729 19,688 17,776 16,004 13% 27% -5% 11% 11% 7% 26,853 23,707 18,729 19,688 17,776 16,004 113% 100% 100% 100% 100% 100%
PROFIT AND LOSS Mark-up / return / interest earned 36,592 34,604 27,961 32,402 32,766 27,329 6% 24% -14% -1% 20% 21% Mark-up / return / interest earned 36,592 34,604 27,961 32,402 32,766 27,329 100% 100% 100% 100% 100% 100%Mark-up / return / interest expensed 21,690 22,711 19,363 22,974 22,700 17,937 -4% 17% -16% 1% 27% 32% Mark-up / return / interest expensed 21,690 22,711 19,363 22,974 22,700 17,937 59% 66% 69% 71% 69% 66% Net mark-up / interest income 14,902 11,893 8,597 9,428 10,067 9,392 25% 38% -9% -6% 7% 4% Net mark-up / interest income 14,902 11,893 8,597 9,428 10,067 9,392 41% 34% 31% 29% 31% 34% Provision / (reversal) against non-performing loans and advances - net 316 (83) 9,854 2,342 1,630 2,319 480% -101% 321% 44% -30% 0% Provision / (reversal) against non-performing loans and advances - net 316 (83) 9,854 2,342 1,630 2,319 1% 0% 35% 7% 5% 8% Impairment loss on available for sale investment 217 208 151 143 122 383 5% 37% 6% 17% -68% -11% Impairment loss on available for sale investment 217 208 151 143 122 383 1% 1% 1% 0% 0% 1% Provision for diminution in the value of investments 346 198 933 201 44 297 75% -79% 364% 362% -85% 286% Provision for diminution in the value of investments 346 198 933 201 44 297 1% 1% 3% 1% 0% 1% Provision against reverse repo - - - - 35 66 0% 0% 0% -100% -47% -20% Provision against reverse repo - - - - 35 66 0% 0% 0% 0% 0% 0% Reversal of provision against purchase under resale agreement - - (35) - - - 0% 0% 0% 0% 0% 0% Reversal of provision against purchase under resale agreement - - (35) - - - Impairment loss on immovable assets - - 200 - - - 0% 0% 0% 0% 0% 0% Impairment loss on immovable assets - - 200 Bad debts written off directly - - - 1 - - 0% 0% -100% 0% 0% 0% Bad debts written off directly - - - 1 - - 0% 0% 0% 0% 0% 0% 879 322 11,103 2,688 1,831 3,064 173% -97% 313% 47% -40% 5% 879 322 11,103 2,688 1,831 3,064 2% 1% 40% 8% 6% 11% Net mark-up / interest income after provisions 14,023 11,571 (2,506) 6,741 8,236 6,328 21% -562% -137% -18% 30% 3% Net mark-up / interest income after provisions 14,023 11,571 (2,506) 6,741 0 8,236 6,328 38% 33% -9% 21% 25% 23%
Non mark-up/interest income Non mark-up/interest income Fee, commission and brokerage income 1,732 1,435 1,169 1,153 1,194 1,271 21% 23% 1% -3% -6% -3% Fee, commission and brokerage income 1,732 1,435 1,169 1,153 1,194 1,271 5% 4% 4% 4% 4% 5% Dividend income 303 349 509 1,036 289 210 -13% -31% -51% 258% 38% 29% Dividend income 303 349 509 1,036 289 210 1% 1% 2% 3% 1% 1% Income from dealing in foreign currencies 835 1,103 559 885 772 731 -24% 97% -37% 15% 6% 36% Income from dealing in foreign currencies 835 1,103 559 885 772 731 2% 3% 2% 3% 2% 3% Gain on sale of investments - net 3,246 1,804 820 682 307 213 80% 120% 20% 122% 45% 48% Gain on sale of investments - net 3,246 1,804 820 682 307 213 9% 5% 3% 2% 1% 1% Unrealised gain on revaluation of investments Unrealised gain on revaluation of investments classified as held for trading - net - - - - - - 0% 0% -100% 0% -100% -82% classified as held for trading - net - - - - - (0) 0% 0% 0% 0% 0% 0% Other income 573 744 540 361 340 376 -23% 38% 50% 6% -10% -7% Other income 573 744 540 361 340 376 2% 2% 2% 1% 1% 1% Total non-markup / interest income 6,690 5,435 3,598 4,117 2,903 2,800 23% 51% -13% 42% 4% 10% Total non-markup / interest income 6,690 5,435 3,598 4,117 2,903 2,800 18% 15% 13% 13% 9% 10% 20,712 16,889 1,092 10,858 11,139 9,128 22% 1,457% -90% -3% 22% 5% 20,712 17,007 1,092 10,858 11,139 9,128 57% 49% 4% 34% 34% 33%
Non mark-up/interest expenses Non mark-up/interest expenses Administrative expenses 12,014 11,052 9,397 9,039 8,639 7,813 9% 18% 4% 5% 11% 12% Administrative expenses 12,014 11,052 9,397 9,039 8,639 7,813 33% 32% 34% 28% 26% 29% Other provisions / write offs 50 47 114 9 - - 6% -59% 1215% 0% 0% 0% Other provisions / write offs 50 47 114 9 - - 0% 0% 0% 0% 0% 0% Other charges 217 126 23 80 87 42 72% 457% -72% -7% 104% 24% Other charges 217 126 23 80 87 42 1% 0% 0% 0% 0% 0% Total non-markup / interest expenses 12,281 11,225 9,533 9,128 8,726 7,855 9% 18% 4% 5% 11% 12% Total non-markup / interest expenses 12,281 11,225 9,533 9,128 8,726 7,855 34% 32% 34% 28% 27% 29% 8,432 5,781 (8,441) 1,730 2,413 1,273 46% -168% -588% -28% 90% -22% 8,432 5,781 (8,441) 1,730 2,413 1,273 23% 17% -30% 5% 7% 5% Extra ordinary / unusual items - - - - - 0% 0% 0% 0% % 0% 0% Extra ordinary / unusual items - - - - - - 0% 0% 0% 0% 0% 0%Profit / (loss) before taxation 8,432 5,781 (8,441) 1,730 2,413 1,273 46% -168% -588% -28% 90% -22% Profit / (loss) before taxation 8,432 5,781 (8,441) 1,730 2,413 1,273 23% 17% -30% 5% 7% 5% Taxation – current (2,330) (1,014) (94) (839) (833) (330) 130% 981% -89% 1% 153% -41% Taxation – current (2,330) (1,014) (94) (839) (833) (330) -6% -3% 0% -3% -3% -1% Taxation – prior years’ (416) - - - - - 0% 0% 0% 0% 0% -100% Taxation – prior years’ (416) - - - - - -1% 0% 0% 0% 0% 0% Taxation – deferred (642) (753) 3,054 364 48 0 -15% -125% 739% 664% 0% -100% Taxation – deferred (642) (753) 3,054 364 48 0 -2% -2% 11% 1% 0% 0% (3,388) (1,766) 2,961 (475) (785) (329) 92% -160% -723% -39% 138% -38% (3,388) (1,766) 2,961 (475) (785) (329) -9% -5% 11% -1% -2% -1%Profit / (loss) after taxation 5,043 4,015 (5,480) 1,255 1,628 944 26% -173% -537% -23% 72% -15% Profit / (loss) after taxation 5,043 4,015 (5,480) 1,255 1,628 944 14% 12% -20% 4% 5% 3% Unappropriated profit / (loss) brought forward 1,862 (1,583) 886 1,302 702 834 -218% -279% -32% 86% -16% 170% Unappropriated profit / (loss) brought forward 1,862 (1,583) 886 1,302 702 834 5% -5% 3% 4% 2% 3% Profit / (loss) available for appropriation 6,906 2,432 (4,594) 2,557 2,330 1,777 184% -153% -280% 10% 31% 25% Profit / (loss) available for appropriation 6,906 2,432 (4,594) 2,557 2,330 1,777 19% 7% -16% 8% 7% 7%
Basic earnings per share - Rupees 4.00 3.19 (5.90) 1.54 2.00 1.34
34
Along the Silk Road
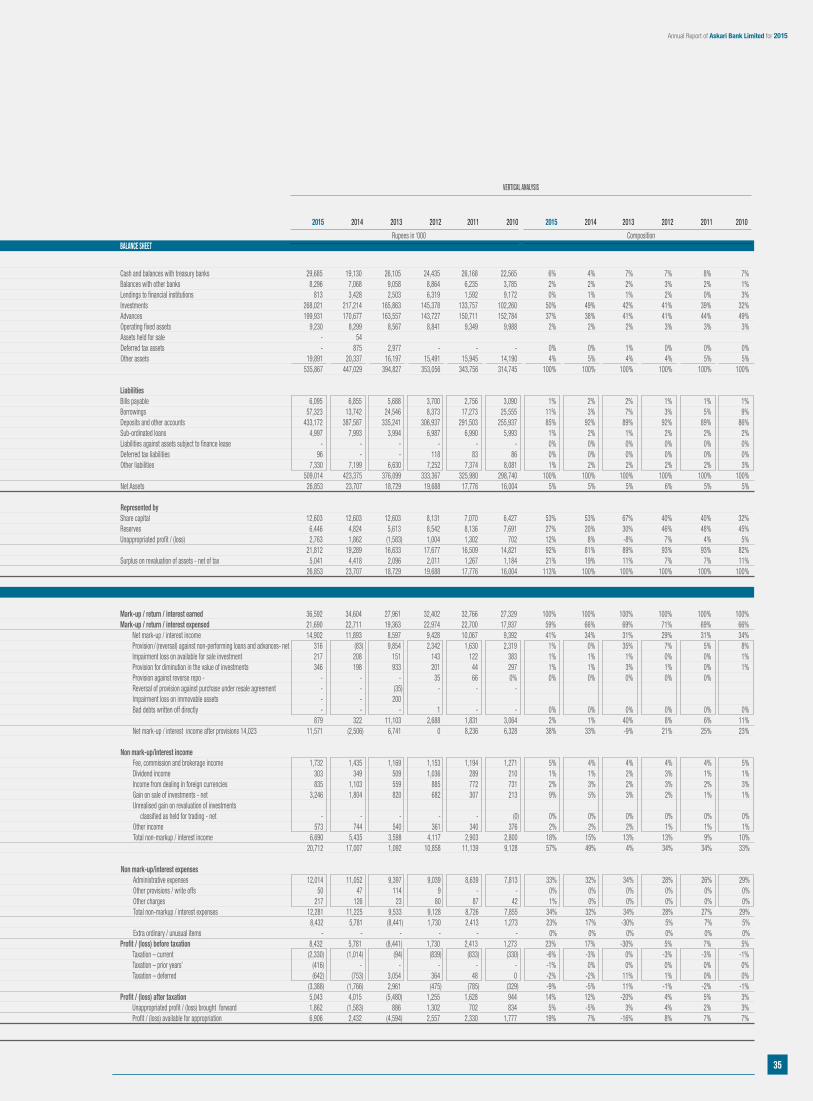
Horizontal Analysis Vertical Analysis
2015 2014 2013 2012 2011 2010 Vs Vs Vs Vs Vs Vs 2015 2014 2013 2012 2011 2010 2014 2013 2012 2011 2010 2009 2015 2014 2013 2012 2011 2010 2015 2014 2013 2012 2011 2010
Rupees in million Variance Rupees in ‘000 Composition BALANCE SHEET BALANCE SHEET
Assets Cash and balances with treasury banks 29,685 19,130 26,105 24,435 26,168 22,565 55% -27% 7% -7% 16% 16% Cash and balances with treasury banks 29,685 19,130 26,105 24,435 26,168 22,565 6% 4% 7% 7% 8% 7%Balances with other banks 8,296 7,068 9,058 8,864 6,235 3,785 17% -22% 2% 42% 65% -55% Balances with other banks 8,296 7,068 9,058 8,864 6,235 3,785 2% 2% 2% 3% 2% 1%Lendings to financial institutions 813 3,428 2,503 6,319 1,592 9,172 -76% 37% -60% 297% -83% 99% Lendings to financial institutions 813 3,428 2,503 6,319 1,592 9,172 0% 1% 1% 2% 0% 3%Investments 268,021 217,214 165,863 145,378 133,757 102,260 23% 31% 14% 9% 31% 53% Investments 268,021 217,214 165,863 145,378 133,757 102,260 50% 49% 42% 41% 39% 32%Advances 199,931 170,677 163,557 143,727 150,711 152,784 17% 4% 14% -5% -1% 13% Advances 199,931 170,677 163,557 143,727 150,711 152,784 37% 38% 41% 41% 44% 49%Operating fixed assets 9,230 8,299 8,567 8,841 9,349 9,988 11% -3% -3% -5% -6% 8% Operating fixed assets 9,230 8,299 8,567 8,841 9,349 9,988 2% 2% 2% 3% 3% 3%Assets held for sale - 54 - - - - 0% 0% 0% 0% 0% 0% Assets held for sale - 54 Deferred tax assets - 875 2,977 - - - -100% -71% 0% 0% 0% 0% Deferred tax assets - 875 2,977 - - - 0% 0% 1% 0% 0% 0%Other assets 19,891 20,337 16,197 15,491 15,945 14,190 -3% 26% 5% -3% 12% 34% Other assets 19,891 20,337 16,197 15,491 15,945 14,190 4% 5% 4% 4% 5% 5% 535,867 447,083 394,827 353,056 343,756 314,745 20% 13% 12% 3% 9% 24% 535,867 447,029 394,827 353,056 343,756 314,745 100% 100% 100% 100% 100% 100% Liabilities LiabilitiesBills payable 6,095 6,855 5,688 3,700 2,756 3,090 -11% 21% 54% 34% -11% 5% Bills payable 6,095 6,855 5,688 3,700 2,756 3,090 1% 2% 2% 1% 1% 1%Borrowings 57,323 13,742 24,546 8,373 17,273 25,555 317% -44% 193% -52% -32% 32% Borrowings 57,323 13,742 24,546 8,373 17,273 25,555 11% 3% 7% 3% 5% 9%Deposits and other accounts 433,172 387,587 335,241 306,937 291,503 255,937 12% 16% 9% 5% 14% 24% Deposits and other accounts 433,172 387,587 335,241 306,937 291,503 255,937 85% 92% 89% 92% 89% 86%Sub-ordinated loans 4,997 7,993 3,994 6,987 6,990 5,993 -37% 100% -43% 0% 17% 0% Sub-ordinated loans 4,997 7,993 3,994 6,987 6,990 5,993 1% 2% 1% 2% 2% 2%Liabilities against assets subject to finance lease - - - - - - 0% 0% 0% 0% 0% 0% Liabilities against assets subject to finance lease - - - - - - 0% 0% 0% 0% 0% 0%Deferred tax liabilities 96 - - 118 83 86 0% 0% -100% 42% -3% -74% Deferred tax liabilities 96 - - 118 83 86 0% 0% 0% 0% 0% 0%Other liabilities 7,330 7,199 6,630 7,252 7,374 8,081 2% 9% -9% -2% -9% 67% Other liabilities 7,330 7,199 6,630 7,252 7,374 8,081 1% 2% 2% 2% 2% 3% 509,014 423,375 376,099 333,367 325,980 298,740 20% 13% 13% 2% 9% 25% 509,014 423,375 376,099 333,367 325,980 298,740 100% 100% 100% 100% 100% 100%Net Assets 26,853 23,707 18,729 19,688 17,776 16,004 13% 27% -5% 11% 11% 7% Net Assets 26,853 23,707 18,729 19,688 17,776 16,004 5% 5% 5% 6% 5% 5% Represented by Represented by Share capital 12,603 12,603 12,603 8,131 7,070 6,427 0% 0% 55% 15% 10% 27% Share capital 12,603 12,603 12,603 8,131 7,070 6,427 53% 53% 67% 40% 40% 32%Reserves 6,446 4,824 5,613 8,542 8,136 7,691 34% -14% -34% 5% 6% 6% Reserves 6,446 4,824 5,613 8,542 8,136 7,691 27% 20% 30% 46% 48% 45%Unappropriated profit / (loss) 2,763 1,862 (1,583) 1,004 1,302 702 48% -218% -258% -23% 86% -16% Unappropriated profit / (loss) 2,763 1,862 (1,583) 1,004 1,302 702 12% 8% -8% 7% 4% 5% 21,812 19,289 16,633 17,677 16,509 14,821 13% 16% -6% 7% 11% 13% 21,812 19,289 16,633 17,677 16,509 14,821 92% 81% 89% 93% 93% 82%Surplus on revaluation of assets - net of tax 5,041 4,418 2,096 2,011 1,267 1,184 14% 111% 4% 59% 7% -34% Surplus on revaluation of assets - net of tax 5,041 4,418 2,096 2,011 1,267 1,184 21% 19% 11% 7% 7% 11% 26,853 23,707 18,729 19,688 17,776 16,004 13% 27% -5% 11% 11% 7% 26,853 23,707 18,729 19,688 17,776 16,004 113% 100% 100% 100% 100% 100%
PROFIT AND LOSS Mark-up / return / interest earned 36,592 34,604 27,961 32,402 32,766 27,329 6% 24% -14% -1% 20% 21% Mark-up / return / interest earned 36,592 34,604 27,961 32,402 32,766 27,329 100% 100% 100% 100% 100% 100%Mark-up / return / interest expensed 21,690 22,711 19,363 22,974 22,700 17,937 -4% 17% -16% 1% 27% 32% Mark-up / return / interest expensed 21,690 22,711 19,363 22,974 22,700 17,937 59% 66% 69% 71% 69% 66% Net mark-up / interest income 14,902 11,893 8,597 9,428 10,067 9,392 25% 38% -9% -6% 7% 4% Net mark-up / interest income 14,902 11,893 8,597 9,428 10,067 9,392 41% 34% 31% 29% 31% 34% Provision / (reversal) against non-performing loans and advances - net 316 (83) 9,854 2,342 1,630 2,319 480% -101% 321% 44% -30% 0% Provision / (reversal) against non-performing loans and advances - net 316 (83) 9,854 2,342 1,630 2,319 1% 0% 35% 7% 5% 8% Impairment loss on available for sale investment 217 208 151 143 122 383 5% 37% 6% 17% -68% -11% Impairment loss on available for sale investment 217 208 151 143 122 383 1% 1% 1% 0% 0% 1% Provision for diminution in the value of investments 346 198 933 201 44 297 75% -79% 364% 362% -85% 286% Provision for diminution in the value of investments 346 198 933 201 44 297 1% 1% 3% 1% 0% 1% Provision against reverse repo - - - - 35 66 0% 0% 0% -100% -47% -20% Provision against reverse repo - - - - 35 66 0% 0% 0% 0% 0% 0% Reversal of provision against purchase under resale agreement - - (35) - - - 0% 0% 0% 0% 0% 0% Reversal of provision against purchase under resale agreement - - (35) - - - Impairment loss on immovable assets - - 200 - - - 0% 0% 0% 0% 0% 0% Impairment loss on immovable assets - - 200 Bad debts written off directly - - - 1 - - 0% 0% -100% 0% 0% 0% Bad debts written off directly - - - 1 - - 0% 0% 0% 0% 0% 0% 879 322 11,103 2,688 1,831 3,064 173% -97% 313% 47% -40% 5% 879 322 11,103 2,688 1,831 3,064 2% 1% 40% 8% 6% 11% Net mark-up / interest income after provisions 14,023 11,571 (2,506) 6,741 8,236 6,328 21% -562% -137% -18% 30% 3% Net mark-up / interest income after provisions 14,023 11,571 (2,506) 6,741 0 8,236 6,328 38% 33% -9% 21% 25% 23%
Non mark-up/interest income Non mark-up/interest income Fee, commission and brokerage income 1,732 1,435 1,169 1,153 1,194 1,271 21% 23% 1% -3% -6% -3% Fee, commission and brokerage income 1,732 1,435 1,169 1,153 1,194 1,271 5% 4% 4% 4% 4% 5% Dividend income 303 349 509 1,036 289 210 -13% -31% -51% 258% 38% 29% Dividend income 303 349 509 1,036 289 210 1% 1% 2% 3% 1% 1% Income from dealing in foreign currencies 835 1,103 559 885 772 731 -24% 97% -37% 15% 6% 36% Income from dealing in foreign currencies 835 1,103 559 885 772 731 2% 3% 2% 3% 2% 3% Gain on sale of investments - net 3,246 1,804 820 682 307 213 80% 120% 20% 122% 45% 48% Gain on sale of investments - net 3,246 1,804 820 682 307 213 9% 5% 3% 2% 1% 1% Unrealised gain on revaluation of investments Unrealised gain on revaluation of investments classified as held for trading - net - - - - - - 0% 0% -100% 0% -100% -82% classified as held for trading - net - - - - - (0) 0% 0% 0% 0% 0% 0% Other income 573 744 540 361 340 376 -23% 38% 50% 6% -10% -7% Other income 573 744 540 361 340 376 2% 2% 2% 1% 1% 1% Total non-markup / interest income 6,690 5,435 3,598 4,117 2,903 2,800 23% 51% -13% 42% 4% 10% Total non-markup / interest income 6,690 5,435 3,598 4,117 2,903 2,800 18% 15% 13% 13% 9% 10% 20,712 16,889 1,092 10,858 11,139 9,128 22% 1,457% -90% -3% 22% 5% 20,712 17,007 1,092 10,858 11,139 9,128 57% 49% 4% 34% 34% 33%
Non mark-up/interest expenses Non mark-up/interest expenses Administrative expenses 12,014 11,052 9,397 9,039 8,639 7,813 9% 18% 4% 5% 11% 12% Administrative expenses 12,014 11,052 9,397 9,039 8,639 7,813 33% 32% 34% 28% 26% 29% Other provisions / write offs 50 47 114 9 - - 6% -59% 1215% 0% 0% 0% Other provisions / write offs 50 47 114 9 - - 0% 0% 0% 0% 0% 0% Other charges 217 126 23 80 87 42 72% 457% -72% -7% 104% 24% Other charges 217 126 23 80 87 42 1% 0% 0% 0% 0% 0% Total non-markup / interest expenses 12,281 11,225 9,533 9,128 8,726 7,855 9% 18% 4% 5% 11% 12% Total non-markup / interest expenses 12,281 11,225 9,533 9,128 8,726 7,855 34% 32% 34% 28% 27% 29% 8,432 5,781 (8,441) 1,730 2,413 1,273 46% -168% -588% -28% 90% -22% 8,432 5,781 (8,441) 1,730 2,413 1,273 23% 17% -30% 5% 7% 5% Extra ordinary / unusual items - - - - - 0% 0% 0% 0% % 0% 0% Extra ordinary / unusual items - - - - - - 0% 0% 0% 0% 0% 0%Profit / (loss) before taxation 8,432 5,781 (8,441) 1,730 2,413 1,273 46% -168% -588% -28% 90% -22% Profit / (loss) before taxation 8,432 5,781 (8,441) 1,730 2,413 1,273 23% 17% -30% 5% 7% 5% Taxation – current (2,330) (1,014) (94) (839) (833) (330) 130% 981% -89% 1% 153% -41% Taxation – current (2,330) (1,014) (94) (839) (833) (330) -6% -3% 0% -3% -3% -1% Taxation – prior years’ (416) - - - - - 0% 0% 0% 0% 0% -100% Taxation – prior years’ (416) - - - - - -1% 0% 0% 0% 0% 0% Taxation – deferred (642) (753) 3,054 364 48 0 -15% -125% 739% 664% 0% -100% Taxation – deferred (642) (753) 3,054 364 48 0 -2% -2% 11% 1% 0% 0% (3,388) (1,766) 2,961 (475) (785) (329) 92% -160% -723% -39% 138% -38% (3,388) (1,766) 2,961 (475) (785) (329) -9% -5% 11% -1% -2% -1%Profit / (loss) after taxation 5,043 4,015 (5,480) 1,255 1,628 944 26% -173% -537% -23% 72% -15% Profit / (loss) after taxation 5,043 4,015 (5,480) 1,255 1,628 944 14% 12% -20% 4% 5% 3% Unappropriated profit / (loss) brought forward 1,862 (1,583) 886 1,302 702 834 -218% -279% -32% 86% -16% 170% Unappropriated profit / (loss) brought forward 1,862 (1,583) 886 1,302 702 834 5% -5% 3% 4% 2% 3% Profit / (loss) available for appropriation 6,906 2,432 (4,594) 2,557 2,330 1,777 184% -153% -280% 10% 31% 25% Profit / (loss) available for appropriation 6,906 2,432 (4,594) 2,557 2,330 1,777 19% 7% -16% 8% 7% 7%
Basic earnings per share - Rupees 4.00 3.19 (5.90) 1.54 2.00 1.34
35
Annual Report of Askari Bank Limited for 2015
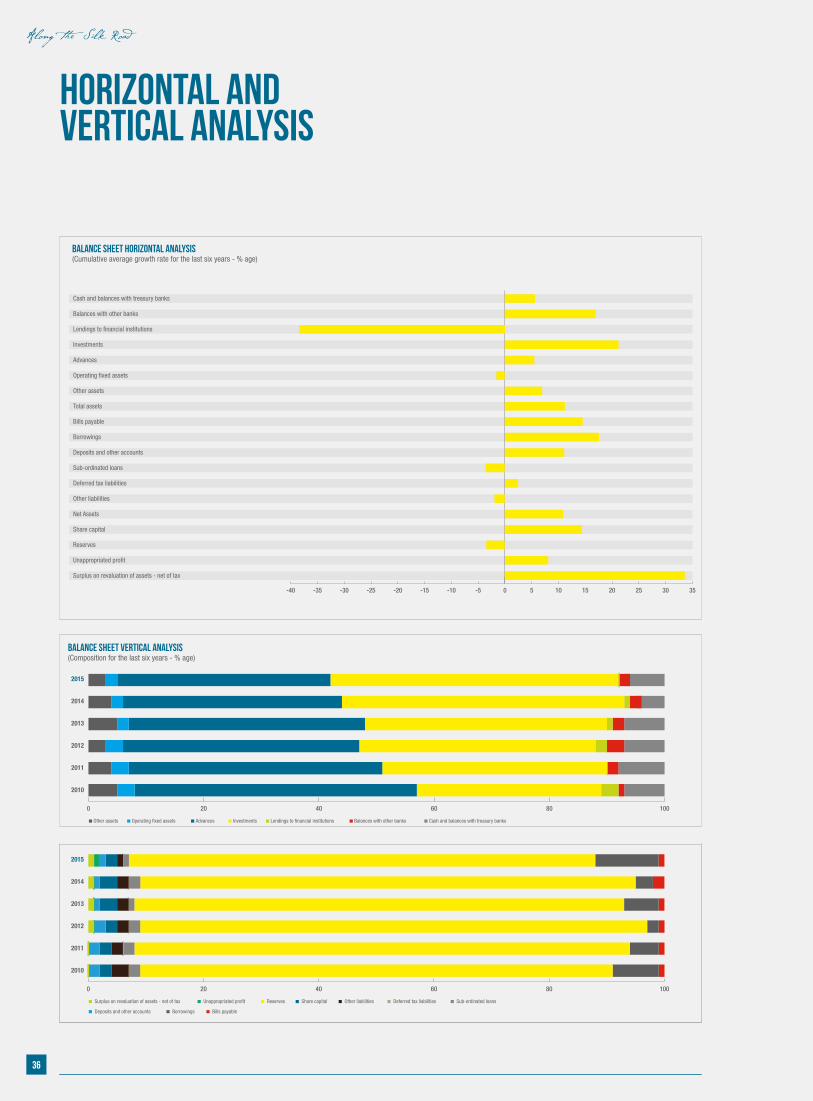
Balance Sheet Vertical Analysis(Composition for the last six years - % age)
Other assets Operating �xed assets Advances Investments Lendings to �nancial institutions Balances with other banks Cash and balances with treasury banks
0 20 40 60 80 100
2015
2014
2013
2012
2011
2010
Balance Sheet Vertical Analysis(Composition for the last six years)
Surplus on revaluation of assets - net of tax Unappropriated pro�t Reserves Share capital Other liabilities Deferred tax liabilities Sub-ordinated loans
Deposits and other accounts Borrowings Bills payable
0 20 40 60 80 100
2015
2014
2013
2012
2011
2010
HORIZONTAL ANDVERTICAL ANALYSIS
Balance Sheet Horizontal Analysis(Cumulative average growth rate for the last six years - % age)
Cash and balances with treasury banks
Balances with other banks
Lendings to �nancial institutions
Investments
Advances
Operating �xed assets
Other assets
Total assets
Bills payable
Borrowings
Deposits and other accounts
Sub-ordinated loans
Deferred tax liabilities
Other liabilities
Net Assets
Share capital
Reserves
Unappropriated pro�t
Surplus on revaluation of assets - net of tax
-40 -35 -30 -25 -20 -15 -10 -5 0 5 10 15 20 25 30 35
36
Along the Silk Road

building on a history of solidarityOver the years, Pakistan and China have become “all weather” strategic and diplomatic partners in South Asia. Given their illustrious history, both nations have decided to expand their relationship in a much broader spectrum. In 2015, President Xi Jinping announced the launch of the China Pakistan Economic Corridor (CPEC) as the flagship project of a broader “One Belt, One Road” initiative. Under CPEC, China plans to invest in the development of Pakistan’s infrastructure, energy initiatives, industrial projects and trade, connecting the Pakistani port city of Gwadar with the city of Kashgar in China’s Xinjiang Uyghur Autonomous Region through a road network in the process.
recreating the twenty-first century silk road
Annual Report of Askari Bank Limited for 2015
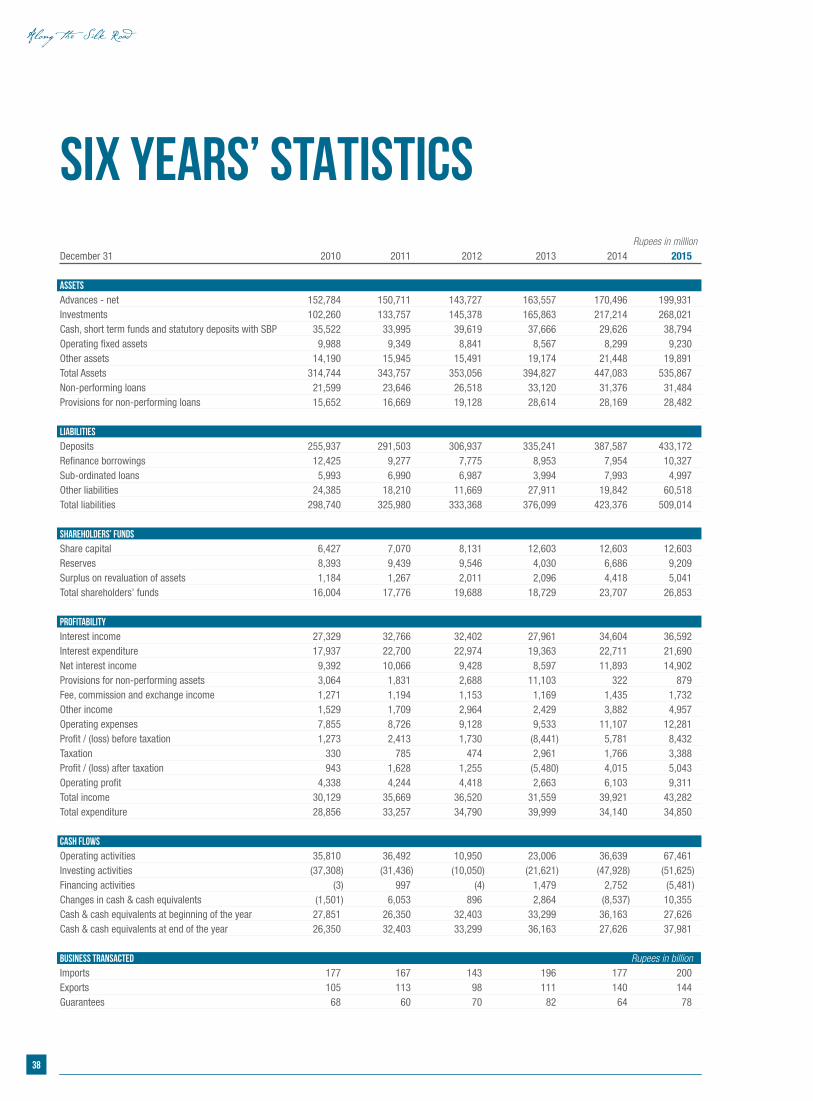
SIX YEARS’ STATISTICS Rupees in millionDecember 31 2010 2011 2012 2013 2014 2015
Assets
Advances - net 152,784 150,711 143,727 163,557 170,496 199,931 Investments 102,260 133,757 145,378 165,863 217,214 268,021 Cash, short term funds and statutory deposits with SBP 35,522 33,995 39,619 37,666 29,626 38,794 Operating fixed assets 9,988 9,349 8,841 8,567 8,299 9,230 Other assets 14,190 15,945 15,491 19,174 21,448 19,891 Total Assets 314,744 343,757 353,056 394,827 447,083 535,867 Non-performing loans 21,599 23,646 26,518 33,120 31,376 31,484 Provisions for non-performing loans 15,652 16,669 19,128 28,614 28,169 28,482
Liabilities
Deposits 255,937 291,503 306,937 335,241 387,587 433,172 Refinance borrowings 12,425 9,277 7,775 8,953 7,954 10,327 Sub-ordinated loans 5,993 6,990 6,987 3,994 7,993 4,997 Other liabilities 24,385 18,210 11,669 27,911 19,842 60,518 Total liabilities 298,740 325,980 333,368 376,099 423,376 509,014
Shareholders’ funds
Share capital 6,427 7,070 8,131 12,603 12,603 12,603 Reserves 8,393 9,439 9,546 4,030 6,686 9,209 Surplus on revaluation of assets 1,184 1,267 2,011 2,096 4,418 5,041 Total shareholders’ funds 16,004 17,776 19,688 18,729 23,707 26,853
Profitability
Interest income 27,329 32,766 32,402 27,961 34,604 36,592 Interest expenditure 17,937 22,700 22,974 19,363 22,711 21,690 Net interest income 9,392 10,066 9,428 8,597 11,893 14,902 Provisions for non-performing assets 3,064 1,831 2,688 11,103 322 879 Fee, commission and exchange income 1,271 1,194 1,153 1,169 1,435 1,732 Other income 1,529 1,709 2,964 2,429 3,882 4,957 Operating expenses 7,855 8,726 9,128 9,533 11,107 12,281 Profit / (loss) before taxation 1,273 2,413 1,730 (8,441) 5,781 8,432 Taxation 330 785 474 2,961 1,766 3,388 Profit / (loss) after taxation 943 1,628 1,255 (5,480) 4,015 5,043 Operating profit 4,338 4,244 4,418 2,663 6,103 9,311 Total income 30,129 35,669 36,520 31,559 39,921 43,282 Total expenditure 28,856 33,257 34,790 39,999 34,140 34,850
Cash flows Operating activities 35,810 36,492 10,950 23,006 36,639 67,461 Investing activities (37,308) (31,436) (10,050) (21,621) (47,928) (51,625)Financing activities (3) 997 (4) 1,479 2,752 (5,481)Changes in cash & cash equivalents (1,501) 6,053 896 2,864 (8,537) 10,355 Cash & cash equivalents at beginning of the year 27,851 26,350 32,403 33,299 36,163 27,626 Cash & cash equivalents at end of the year 26,350 32,403 33,299 36,163 27,626 37,981 Business transacted Rupees in billion Imports 177 167 143 196 177 200 Exports 105 113 98 111 140 144 Guarantees 68 60 70 82 64 78
38
Along the Silk Road
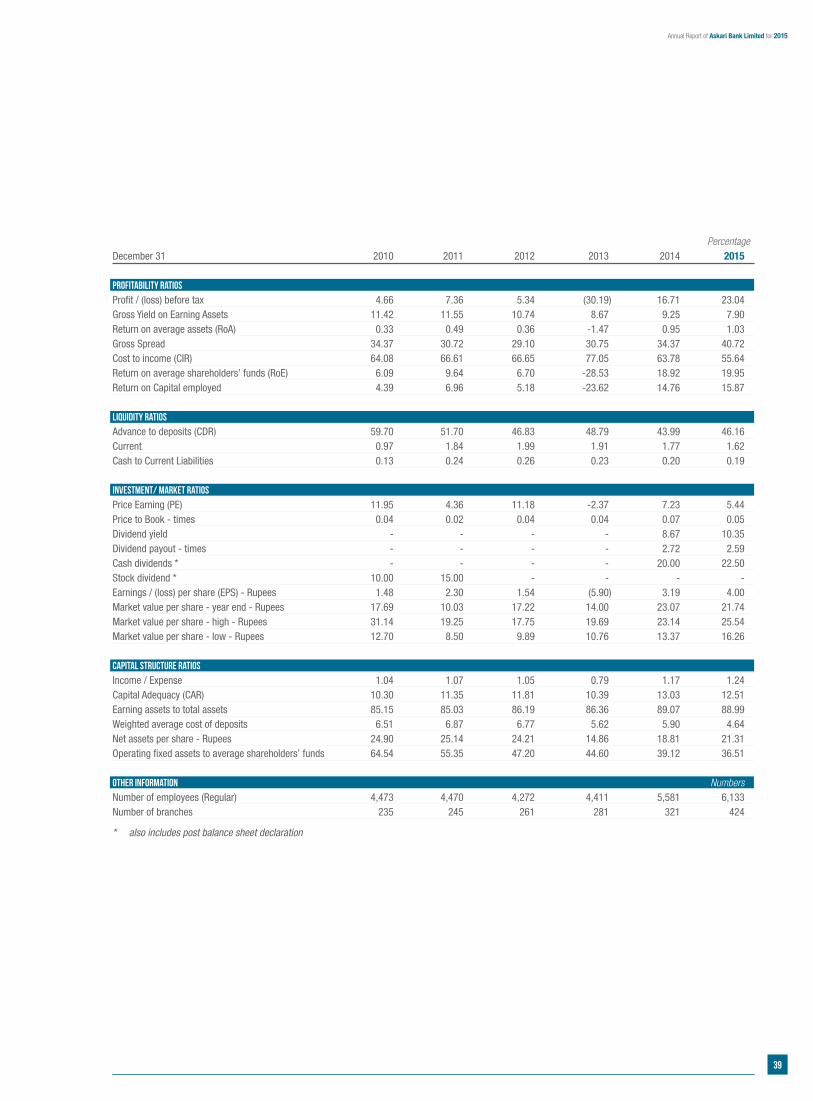
PercentageDecember 31 2010 2011 2012 2013 2014 2015
Profitability Ratios
Profit / (loss) before tax 4.66 7.36 5.34 (30.19) 16.71 23.04Gross Yield on Earning Assets 11.42 11.55 10.74 8.67 9.25 7.90Return on average assets (RoA) 0.33 0.49 0.36 -1.47 0.95 1.03Gross Spread 34.37 30.72 29.10 30.75 34.37 40.72Cost to income (CIR) 64.08 66.61 66.65 77.05 63.78 55.64 Return on average shareholders’ funds (RoE) 6.09 9.64 6.70 -28.53 18.92 19.95Return on Capital employed 4.39 6.96 5.18 -23.62 14.76 15.87 Liquidity Ratios Advance to deposits (CDR) 59.70 51.70 46.83 48.79 43.99 46.16Current 0.97 1.84 1.99 1.91 1.77 1.62Cash to Current Liabilities 0.13 0.24 0.26 0.23 0.20 0.19 Investment/ market Ratios
Price Earning (PE) 11.95 4.36 11.18 -2.37 7.23 5.44Price to Book - times 0.04 0.02 0.04 0.04 0.07 0.05Dividend yield - - - - 8.67 10.35 Dividend payout - times - - - - 2.72 2.59 Cash dividends * - - - - 20.00 22.50 Stock dividend * 10.00 15.00 - - - - Earnings / (loss) per share (EPS) - Rupees 1.48 2.30 1.54 (5.90) 3.19 4.00 Market value per share - year end - Rupees 17.69 10.03 17.22 14.00 23.07 21.74Market value per share - high - Rupees 31.14 19.25 17.75 19.69 23.14 25.54Market value per share - low - Rupees 12.70 8.50 9.89 10.76 13.37 16.26 Capital Structure Ratios Income / Expense 1.04 1.07 1.05 0.79 1.17 1.24Capital Adequacy (CAR) 10.30 11.35 11.81 10.39 13.03 12.51Earning assets to total assets 85.15 85.03 86.19 86.36 89.07 88.99Weighted average cost of deposits 6.51 6.87 6.77 5.62 5.90 4.64Net assets per share - Rupees 24.90 25.14 24.21 14.86 18.81 21.31Operating fixed assets to average shareholders’ funds 64.54 55.35 47.20 44.60 39.12 36.51
Other information NumbersNumber of employees (Regular) 4,473 4,470 4,272 4,411 5,581 6,133 Number of branches 235 245 261 281 321 424
* also includes post balance sheet declaration
39
Annual Report of Askari Bank Limited for 2015
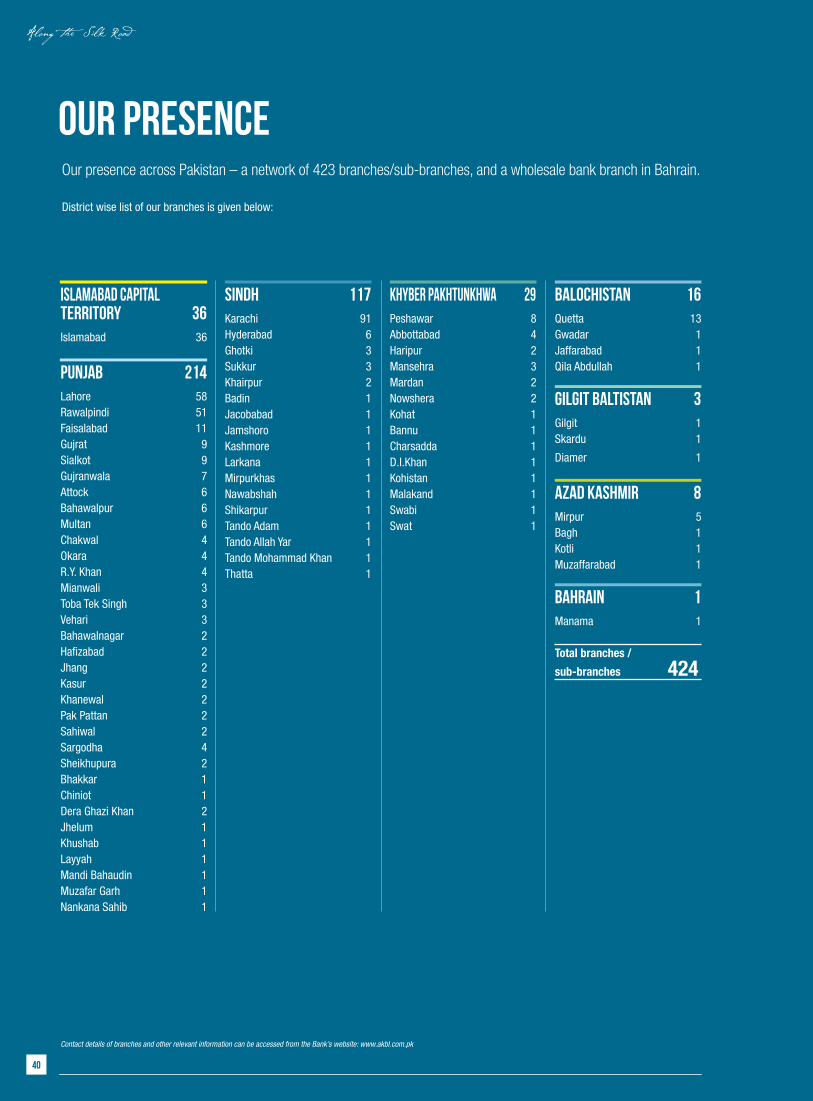
OUR PRESENCEOur presence across Pakistan – a network of 423 branches/sub-branches, and a wholesale bank branch in Bahrain.
District wise list of our branches is given below:
Contact details of branches and other relevant information can be accessed from the Bank’s website: www.akbl.com.pk
islamabad Capital Territory 36Islamabad 36
Punjab 214Lahore 58Rawalpindi 51Faisalabad 11Gujrat 9Sialkot 9Gujranwala 7Attock 6Bahawalpur 6Multan 6Chakwal 4Okara 4R.Y. Khan 4Mianwali 3Toba Tek Singh 3Vehari 3Bahawalnagar 2Hafizabad 2Jhang 2Kasur 2Khanewal 2Pak Pattan 2Sahiwal 2Sargodha 4Sheikhupura 2Bhakkar 1Chiniot 1Dera Ghazi Khan 2Jhelum 1Khushab 1Layyah 1Mandi Bahaudin 1Muzafar Garh 1Nankana Sahib 1
Sindh 117Karachi 91Hyderabad 6Ghotki 3Sukkur 3Khairpur 2Badin 1Jacobabad 1Jamshoro 1Kashmore 1Larkana 1Mirpurkhas 1Nawabshah 1Shikarpur 1Tando Adam 1Tando Allah Yar 1Tando Mohammad Khan 1Thatta 1
Khyber Pakhtunkhwa 29Peshawar 8Abbottabad 4Haripur 2Mansehra 3Mardan 2Nowshera 2Kohat 1Bannu 1Charsadda 1D.I.Khan 1Kohistan 1Malakand 1Swabi 1Swat 1
Balochistan 16Quetta 13Gwadar 1Jaffarabad 1Qila Abdullah 1
Gilgit Baltistan 3Gilgit 1Skardu 1
Diamer 1
Azad Kashmir 8Mirpur 5Bagh 1Kotli 1Muzaffarabad 1
BAHRAIN 1Manama 1 Total branches /
sub-branches 424
40
Along the Silk Road
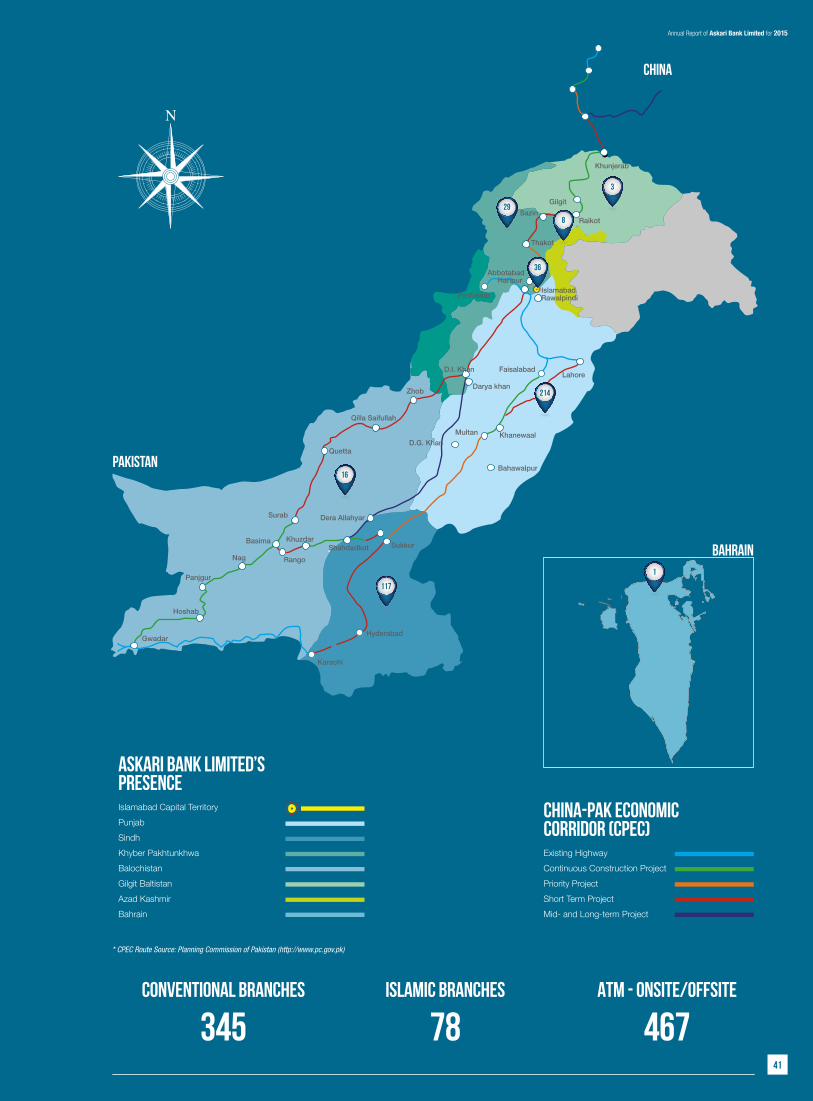
Conventional BrancheS
345ISLAMIC BrancheS
78ATM - Onsite/offsite
467
BAHRAIN
CHINA-PAK ECONOMICCORRIDOR (CPEC)Existing HighwayContinuous Construction ProjectPriority ProjectShort Term ProjectMid- and Long-term Project
Askari Bank Limited’s PresenceIslamabad Capital TerritoryPunjabSindhKhyber PakhtunkhwaBalochistanGilgit BaltistanAzad KashmirBahrain
* CPEC Route Source: Planning Commission of Pakistan (http://www.pc.gov.pk)
PAKISTAN
CHINA
Bahawalpur
KhanewaalMultanD.G. Khan
Quetta
Qilla Saifullah
Hyderabad
Shahdadkot Sukkur
Dera Allahyar
Panjgur
Hoshab
Nag
Basima
Surab
Khuzdar
Rango
Karachi
Gwadar
Lahore
Zhob Darya khan
Faisalabad
Peshawar IslamabadRawalpindi
Khunjerab
Gilgit
RaikotSazin
D.I. Khan
214
16
117
36
8
29
3
AbbotabadHaripur
Thakot
1
41
Annual Report of Askari Bank Limited for 2015
Directors’ Report tothe ShareholdersThe Directors present the 24th Annual Report of Askari Bank Limited along with the audited financial statements and Auditors’ reports thereon, for the year ended December 31, 2015.
The EconomyPakistan’s economy showed resilience
during fiscal 2015 and performed better
than last year as reflected by GDP growth of
4.2 percent. Fiscal 2015 witnessed greater
economic stability on the back of a unified
strategy to resolve the menace of terrorism.
The implementation of this strategy is
yielding improvements in the overall security
situation paving the way for revival of
investors’ confidence.
The key macroeconomic indicators
including foreign exchange reserves, foreign
remittances, reduction in fiscal deficit,
inflation and current account position
reflected marked improvement. Consequent
upon a sharp reduction in global commodity
prices, core inflation of the country declined
sharply during fiscal 2015, reflecting
adequate food supplies and the transmission
into domestic prices of lower international
prices for oil and other commodities.
The current account deficit narrowed in
current fiscal on the back of low oil prices
favourably impacting import, larger inflows
under the Coalition Support Fund, and robust
workers’ remittances. As a result, the foreign
exchange reserves of the country reached
an all-time high.
The monetary policy stance changed
to monetary easing as ceiling rate of
the interest rate corridor reduced by a
cumulative 300 bps to 7.0 percent by end
2015, which now stands at a multi-decade
low of 6.5 percent. Though the credit to
private sector did not show reciprocity
to the declining rates during fiscal 2015
depicting structural constraints i.e., power
shortages and weak external demand as
the prime impediments for credit growth.
However, the first half of fiscal 2016 shows
some respite as credit to private sector has
started to show improvement and it appears
that credit cycle has entered in uptake
phase, and with improvement in large-scale
manufacturing, borrowing for working
capital and fixed investment is likely to
increase. Also, lending opportunities exist
in relatively under-served segments; SME,
agriculture, and consumer.
Future economic environment is expected
to remain conducive for the country as the
outlook for international oil and commodity
prices remains subdued. The headline
inflation is expected to remain below
the target and this trend will continue to
generate positive impacts for trade balance.
Prospects for large-scale manufacturing will
remain subject to progress on power supply.
The historic China-Pakistan-Economic-
Corridor (CPEC) linking the city of Kashgar
in China to the Pakistani port of Gwadar will
significantly boost private investment and
economic growth in the coming years.
Review of Askari Bank’s PerformanceAskari Bank’s profit before taxation
increased by a healthy 45.8 percent to
Rs.8,432 million for full year 2015. Profit
after taxation amounted to Rs.5,043 million,
registering an increase of 25.6 percent over
last year’s Rs.4,015 million due to additional
tax charge for prior year as a result of
enactment of super tax and uniform tax on
all income. The current period’s tax charge
has also increased as a result of applicability
of uniform tax rate. The Bank has reported
earnings of Rs.4.00 per share as against Rs.
3.19 per share for 2014.
This strong performance was primarily driven
by a 24.6 percent in aggregate revenues, Net
mark-up revenues increased by 25 percent;
contributed by a 16.8 percent increase in
average balance sheet, active shedding of
costly deposits and greater focus on growth
of current accounts; which increased by
19 percent during the year under review.
Resultantly, the aggregate cost of funds
declined by 4.5 percent while the shift of
investment portfolio from short term Treasury
Bills to long term PIBs was the main reason
for a 5.7 percent increase in the overall yields
from earning assets.
Aggregate non mark-up revenues increased
by 23.1 percent to Rs.6,689 million
contributed by a 20.7 percent increase in
fees, commissions and investment banking
revenues, supported by strong performance
of our treasury in successfully leveraging
on money market opportunities as reflected
by a significant rise in gains from fixed
income bonds.
During 2015, Askari Bank continued
investing in people, technology,
infrastructure and geographical expansion 42
Along the Silk Road
in line with the philosophy of improved
customer service while contributing towards
country’s financial inclusion agenda.
Consequently, the administrative expenses
increased by 8.7 percent over the previous
year. However, the cost to income ratio
declined from 63.8 percent in 2014 to
55.6 percent for 2015 mainly due to strong
revenue growth.
The deposit base of the Bank grew to
Rs.433 billion at December 31, 2015 from
Rs.388 billion at the close of previous
year, registering an increase of 12 percent.
Deposit mix showed an impressive
improvement as non-remunerative current
accounts registered a notable 19.1 percent
growth during the year. The growth in
current accounts along with a 12 percent
increase in PLS saving deposits, augmented
well in rationalizing overall costs of deposits
as the Bank pursued a targeted reduction in
high cost deposits.
Advances registered a growth of 15
percent during the year to close at Rs.228
billion. Bank’s lending strategy remained
focussed on building quality assets.
Non-performing loans (NPLs) remained
stable at Rs.31,484 million, while the
provision coverage ratio against non-
performing loans improved to 90.5 percent
at December 31, 2015 as against 89.8
percent at the close of year 2014.
AppropriationsThe Board of Directors recommends the following appropriations for the year ended December
31, 2015:
(Rs. in ‘000) 2015 2014
Appropriations:
Profit after taxation 5,043,418 4,014,932
Effect of recognition of actuarial loss (11,161) (89,464)
Profit available for appropriation 5,032,257 3,925,468
Transfer to statutory reserve (1,008,684) (802,986)
Interim cash dividend (1,260,259) (1,260,259)
Final cash dividend - (1,260,259)
Transfer to general reserve - (601,964)
Accumulated profit carried forward 2,763,314 –
Earnings per share - Rupees 4.00 3.19
DIVIDENDIn addition to the above, the Board has recommended a final cash dividend of 12.5 percent for
the year ended December 31, 2015.
Capital Adequacy RatioBank’s capital adequacy ratio under Basel-III stood at 12.51 percent at December 31, 2015
compared to the regulatory threshold of 10.25 percent. The ratio declined from 13.03 percent
at the close of 2014 as the Bank reduced reliance on Tier-II capital while the risk assets grew
at a pace faster than the growth of Tier-I capital. However, the ratio of Tier-I capital to risk
weighted assets registered improvement from 8.69 percent to 8.90 percent as a result of
internal capital generation.
Entity and TFC RatingsJCR-VIS Credit Rating Company Limited has maintained long-term rating of the Bank at ‘AA’
that reflected a very low expectation of credit risk and not being significantly vulnerable to
foreseeable events. The short-term rating is at the highest level of ‘A1+’.
The ratings takes into account implicit support available to the Bank from its principal
shareholder, the Fauji Group, which is one of the largest business conglomerates in Pakistan
with a well-diversified and strong presence in various sectors of the economy.
43
Annual Report of Askari Bank Limited for 2015
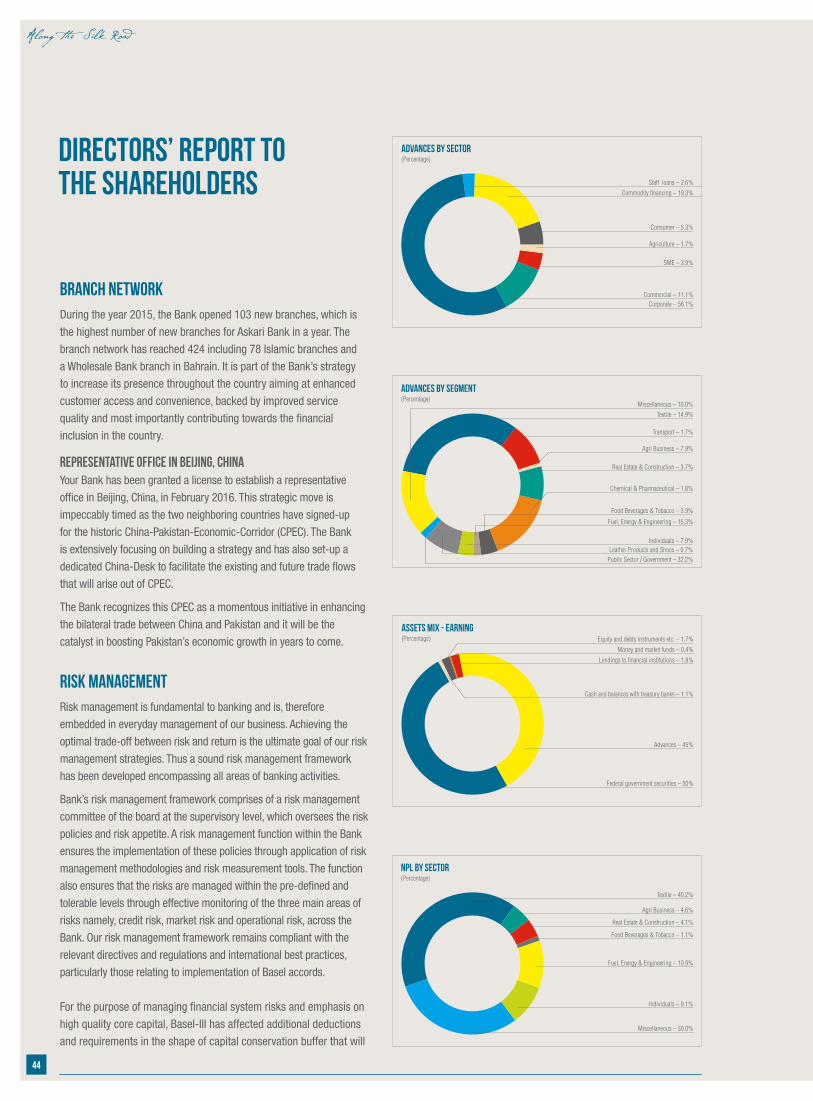
Directors’ Report tothe Shareholders
Branch NetworkDuring the year 2015, the Bank opened 103 new branches, which is
the highest number of new branches for Askari Bank in a year. The
branch network has reached 424 including 78 Islamic branches and
a Wholesale Bank branch in Bahrain. It is part of the Bank’s strategy
to increase its presence throughout the country aiming at enhanced
customer access and convenience, backed by improved service
quality and most importantly contributing towards the financial
inclusion in the country.
Representative Office in Beijing, ChinaYour Bank has been granted a license to establish a representative
office in Beijing, China, in February 2016. This strategic move is
impeccably timed as the two neighboring countries have signed-up
for the historic China-Pakistan-Economic-Corridor (CPEC). The Bank
is extensively focusing on building a strategy and has also set-up a
dedicated China-Desk to facilitate the existing and future trade flows
that will arise out of CPEC.
The Bank recognizes this CPEC as a momentous initiative in enhancing
the bilateral trade between China and Pakistan and it will be the
catalyst in boosting Pakistan’s economic growth in years to come.
Risk ManagementRisk management is fundamental to banking and is, therefore
embedded in everyday management of our business. Achieving the
optimal trade-off between risk and return is the ultimate goal of our risk
management strategies. Thus a sound risk management framework
has been developed encompassing all areas of banking activities.
Bank’s risk management framework comprises of a risk management
committee of the board at the supervisory level, which oversees the risk
policies and risk appetite. A risk management function within the Bank
ensures the implementation of these policies through application of risk
management methodologies and risk measurement tools. The function
also ensures that the risks are managed within the pre-defined and
tolerable levels through effective monitoring of the three main areas of
risks namely, credit risk, market risk and operational risk, across the
Bank. Our risk management framework remains compliant with the
relevant directives and regulations and international best practices,
particularly those relating to implementation of Basel accords.
For the purpose of managing financial system risks and emphasis on
high quality core capital, Basel-III has affected additional deductions
and requirements in the shape of capital conservation buffer that will
Advances by Sector(Percentage)
Corporate – 56.1%
Staff loans – 2.6%
Commodity financing – 19.3%
Consumer – 5.3%
Agriculture – 1.7%
SME – 3.9%
Commercial – 11.1%
Advances by Segment(Percentage)
Miscellaneous – 10.0%Textile – 14.9%
Transport – 1.7%
Agri Business – 7.9%
Real Estate & Construction – 3.7%
Chemical & Pharmaceutical – 1.8%
Food Beverages & Tobacco – 3.9%
Fuel, Energy & Engineering – 15.3%
Individuals – 7.9%Leather Products and Shoes – 0.7%
Public Sector / Government – 32.2%
NPL by Sector(Percentage)
Miscellaneous – 30.0%
Textile – 40.2%
Agri Business – 4.6%
Real Estate & Construction – 4.1%
Food Beverages & Tobacco – 1.1%
Fuel, Energy & Engineering – 10.9%
Individuals – 9.1%
ASSETS MIX - EARNING(Percentage)
Federal government securities – 50%
Equity and debts instruments etc. – 1.7%
Money and market funds – 0.4%
Lendings to financial institutions – 1.8%
Cash and balances with treasury banks – 1.1%
Advances – 45%
44
Along the Silk Road
ultimately raise the CAR threshold to 12.5
percent in the year 2019 and introduction
of a third capital standard in the shape of
leverage ratio. During the transition period,
the Bank is taking necessary steps to
remain fully compliant with Basel-III. These
cover areas including capital generation,
investment strategies and capacity build-up
/ process automation to adapt under the
new regime. The entire Basel-III compliance
plan has been aided with capital adequacy
projections, risk appetite framework and
impact assessment tools.
Corporate Social ResponsibilityCaring and nurturing the communities where
we live and operate is Bank’s raison d’etre.
As a responsible corporate body, the Bank
considers it obligatory to invest in projects
designed for the uplift of the communities
and societies where it operates. In this
direction, our key areas of focus include,
rehabilitation works, education, health
care, and sports. During the year, the Bank
contributed for the relief and rehabilitation
of the internally displaced persons. Also,
contributions were made for the construction
and provision of facilities in educational
institutions, particularly in less developed
areas of the country. The Bank’s support for
sponsoring events in the areas of health and
sports remained available throughout the
year 2015, on a consistent basis.
Subsidiary companiesThe Bank’s wholly owned subsidiary,
Askari Investment Management Limited
(AIML) manages mutual funds and is also
engaged in advisory services for institutional
clients. Askari Bank also holds controlling
interest of 74 percent in Askari Securities
Limited (ASL) which offers share brokerage,
investment advisory and consultancy services.
Consolidated financial statements of the Bank,
AIML and ASL for the year ended December
31, 2015 are included in this annual report.
Human ResourceEmployee care and growth are the
key elements of our human resource
management system. Our aim is to make
Askari Bank an employer of first choice.
Therefore we encourage an open and caring
culture where employees are respected for
their knowledge, capability and commitment
to building relationships beyond
transactions, as we believe that the effective
role of employees in all areas of banking is
a key to the Bank’s success. Therefore, we
focus on developing an individual who is
inspired, motivated and professional and has
the depth and capacity to impact not only on
value creation for the Bank but also for the
industry, and the nation at large.
Our training and development programs
are carefully carved for knowledge
sharing and capacity building with a view
to enable employees to shoulder higher
level of responsibilities. An effective
employee grievance handling mechanism
is in place for aggrieved employees. The
compensation and reward schemes of the
Bank commensurate to responsibility levels
and market norms. The Bank gives special
attention to less earning employees and
certain initiatives solely benefiting them
were implemented during 2015.
Corporate and Financial Reporting Framework• The financial statements, prepared by the
management of the Bank present fairly its
state of affairs, the results of its operations,
and changes in equity and cash flows.
• Proper books of accounts of the Bank
have been maintained.
• Accounting policies have been
consistently applied in preparation
of these financial statements except
as stated in the notes to the financial
statements and accounting estimates
are based on reasonable and prudent
judgment.
• International Accounting, Islamic and
Shariah Standards, as applicable to
banking companies in Pakistan, have
been followed in preparation of these
financial statements.
• The system of internal control, which
is in place, is being continuously
reviewed by the internal audit
department as are other such
procedures. Such review processes
will continue with a view to removing
any weakness and mitigating risk.
• The Board of Directors is satisfied
with the Bank’s ability to continue as a
going concern.
• There has been no material deviation
from the best practices of corporate
governance as detailed in the Listing
Regulation No. 35 of the Karachi Stock
Exchange Limited.
• Key operating data and financial data
for the last six years, in a summarized
form, is included in this report.
• There are no statutory payments on
account of taxes, duties, levies and
charges which are outstanding as of
December 31, 2015, except as disclosed
in annexed financial statements.
• The following is the fair value of
investments as at December 31, 2015:
– Provident Fund Rs.3,298 million, based
on un-audited financial statements
(December 31, 2014: Rs. 2,752 million)
– Gratuity Fund Rs.1,558 million, based
on un-audited financial statements
(December 31, 2014: Rs. 1,375 million)
• During 2015, six meetings of the Board
of Directors were held. Attendance by
each Director was as follows:
45
Annual Report of Askari Bank Limited for 2015
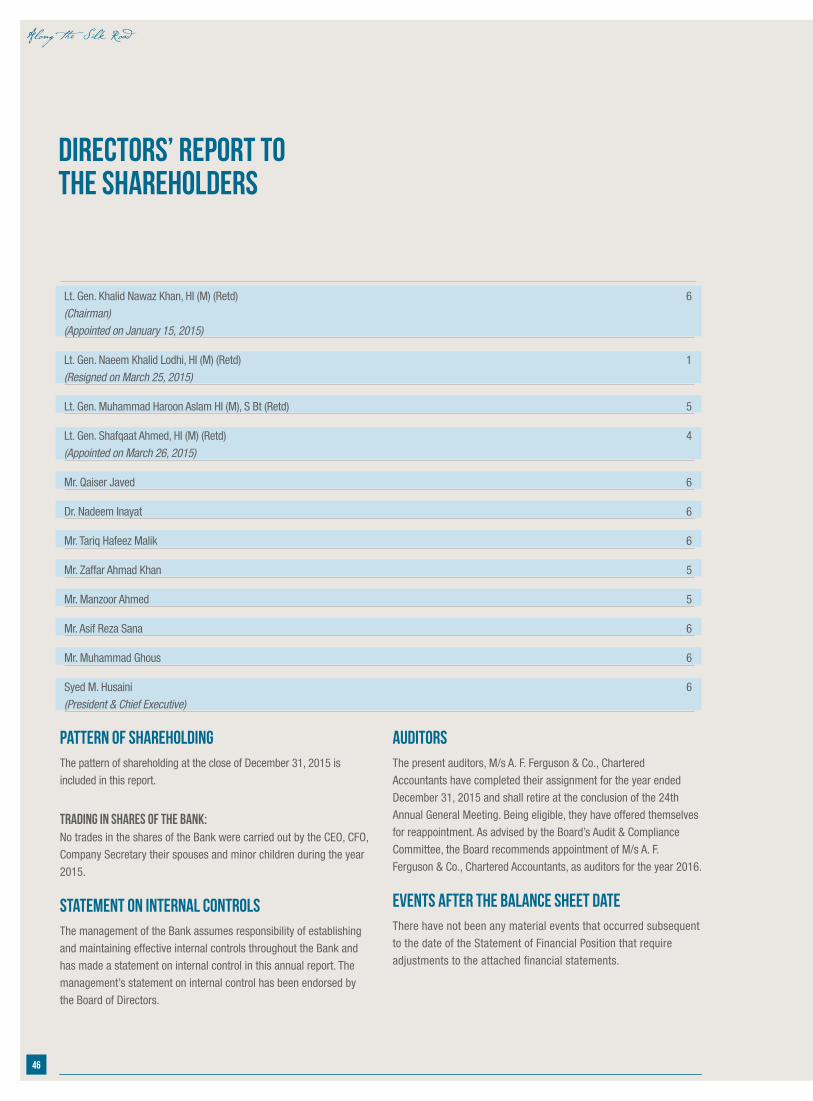
Pattern of ShareholdingThe pattern of shareholding at the close of December 31, 2015 is
included in this report.
Trading in shares of the Bank:No trades in the shares of the Bank were carried out by the CEO, CFO,
Company Secretary their spouses and minor children during the year
2015.
Statement on Internal ControlsThe management of the Bank assumes responsibility of establishing
and maintaining effective internal controls throughout the Bank and
has made a statement on internal control in this annual report. The
management’s statement on internal control has been endorsed by
the Board of Directors.
Directors’ Report tothe Shareholders
Lt. Gen. Khalid Nawaz Khan, HI (M) (Retd) 6
(Chairman)
(Appointed on January 15, 2015)
Lt. Gen. Naeem Khalid Lodhi, HI (M) (Retd) 1
(Resigned on March 25, 2015)
Lt. Gen. Muhammad Haroon Aslam HI (M), S Bt (Retd) 5
Lt. Gen. Shafqaat Ahmed, HI (M) (Retd) 4
(Appointed on March 26, 2015)
Mr. Qaiser Javed 6
Dr. Nadeem Inayat 6
Mr. Tariq Hafeez Malik 6
Mr. Zaffar Ahmad Khan 5
Mr. Manzoor Ahmed 5
Mr. Asif Reza Sana 6
Mr. Muhammad Ghous 6
Syed M. Husaini 6
(President & Chief Executive)
AuditorsThe present auditors, M/s A. F. Ferguson & Co., Chartered
Accountants have completed their assignment for the year ended
December 31, 2015 and shall retire at the conclusion of the 24th
Annual General Meeting. Being eligible, they have offered themselves
for reappointment. As advised by the Board’s Audit & Compliance
Committee, the Board recommends appointment of M/s A. F.
Ferguson & Co., Chartered Accountants, as auditors for the year 2016.
Events after the balance sheet dateThere have not been any material events that occurred subsequent
to the date of the Statement of Financial Position that require
adjustments to the attached financial statements.
46
Along the Silk Road

THE NEXT ERA OF DEVELOPMENTWith plans for the game-changing CPEC now set in motion, a whole new realm of opportunities has opened up for both China and Pakistan. The Corridor will serve as a cultural bridge between both countries, while boosting trade, economic growth and advancement side by side.
joining hands for a prosperous future
Annual Report of Askari Bank Limited for 2015
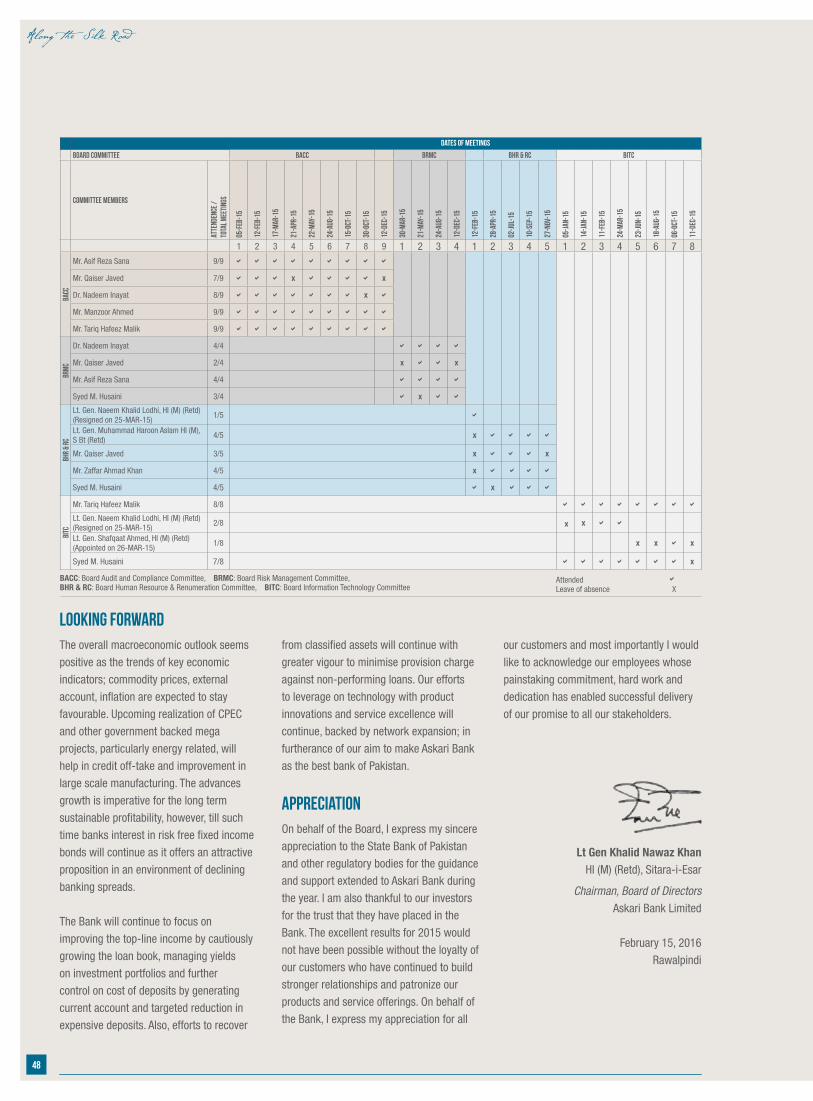
Dates of Meetings
Board Committee BACC BRMC BHR & RC BITC
Committee Members
Atte
nden
ce /
tota
l mee
ting
s
05-F
eb-1
5
12-F
eb-1
5
17-M
ar-1
5
21-A
pr-1
5
22-M
ay-1
5
24-A
ug-1
5
15-O
ct-1
5
30-O
ct-1
5
12-D
ec-1
5
30-M
ar-1
5
21-M
ay-1
5
24-A
ug-1
5
12-D
ec-1
5
12-F
eb-1
5
28-A
pr-1
5
02-Ju
l-15
10-S
ep-1
5
27-N
ov-1
5
05-Ja
n-15
14-Ja
n-15
11-F
eb-1
5
24-M
ar-1
5
23-Ju
n-15
18-A
ug-1
5
06-O
ct-1
5
11-D
ec-1
5
1 2 3 4 5 6 7 8 9 1 2 3 4 1 2 3 4 5 1 2 3 4 5 6 7 8
BACC
Mr. Asif Reza Sana 9/9 a a a a a a a a a
Mr. Qaiser Javed 7/9 a a a x a a a a x
Dr. Nadeem Inayat 8/9 a a a a a a a x a
Mr. Manzoor Ahmed 9/9 a a a a a a a a a
Mr. Tariq Hafeez Malik 9/9 a a a a a a a a a
BRM
C
Dr. Nadeem Inayat 4/4 a a a a
Mr. Qaiser Javed 2/4 x a a x
Mr. Asif Reza Sana 4/4 a a a a
Syed M. Husaini 3/4 a x a a
BHR
& RC
Lt. Gen. Naeem Khalid Lodhi, HI (M) (Retd) (Resigned on 25-MAR-15)
1/5 a
Lt. Gen. Muhammad Haroon Aslam HI (M), S Bt (Retd)
4/5 x a a a a
Mr. Qaiser Javed 3/5 x a a a x
Mr. Zaffar Ahmad Khan 4/5 x a a a a
Syed M. Husaini 4/5 a x a a a
BITC
Mr. Tariq Hafeez Malik 8/8 a a a a a a a a
Lt. Gen. Naeem Khalid Lodhi, HI (M) (Retd) (Resigned on 25-MAR-15)
2/8 x x a a
Lt. Gen. Shafqaat Ahmed, HI (M) (Retd) (Appointed on 26-MAR-15)
1/8 x x a x
Syed M. Husaini 7/8 a a a a a a a x
Attended aLeave of absence X
BACC: Board Audit and Compliance Committee, BRMC: Board Risk Management Committee,BHR & RC: Board Human Resource & Renumeration Committee, BITC: Board Information Technology Committee
Looking forwardThe overall macroeconomic outlook seems
positive as the trends of key economic
indicators; commodity prices, external
account, inflation are expected to stay
favourable. Upcoming realization of CPEC
and other government backed mega
projects, particularly energy related, will
help in credit off-take and improvement in
large scale manufacturing. The advances
growth is imperative for the long term
sustainable profitability, however, till such
time banks interest in risk free fixed income
bonds will continue as it offers an attractive
proposition in an environment of declining
banking spreads.
The Bank will continue to focus on
improving the top-line income by cautiously
growing the loan book, managing yields
on investment portfolios and further
control on cost of deposits by generating
current account and targeted reduction in
expensive deposits. Also, efforts to recover
from classified assets will continue with
greater vigour to minimise provision charge
against non-performing loans. Our efforts
to leverage on technology with product
innovations and service excellence will
continue, backed by network expansion; in
furtherance of our aim to make Askari Bank
as the best bank of Pakistan.
AppreciationOn behalf of the Board, I express my sincere
appreciation to the State Bank of Pakistan
and other regulatory bodies for the guidance
and support extended to Askari Bank during
the year. I am also thankful to our investors
for the trust that they have placed in the
Bank. The excellent results for 2015 would
not have been possible without the loyalty of
our customers who have continued to build
stronger relationships and patronize our
products and service offerings. On behalf of
the Bank, I express my appreciation for all
our customers and most importantly I would
like to acknowledge our employees whose
painstaking commitment, hard work and
dedication has enabled successful delivery
of our promise to all our stakeholders.
Lt Gen Khalid Nawaz KhanHI (M) (Retd), Sitara-i-Esar
Chairman, Board of Directors
Askari Bank Limited
February 15, 2016
Rawalpindi
48
Along the Silk Road

49
Annual Report of Askari Bank Limited for 2015
Unconsolidated Financial Statements of
Askari Bank LimitedFor the year ended December 31, 2015
50
Statement of Internal Controls
The Management of Askari Bank Limited (the Bank) assumes full responsibility for establishing and maintaining effective system of internal
controls throughout the Bank to ensure reliable, accurate and fair financial reporting, effectiveness of operations and compliance with
applicable laws and regulations. Management understands that the effective maintenance of the internal controls system is an ongoing
process under the ownership of the management. All significant policies and procedural manuals are in place; and the review, revision, and
improvement to keep them updated to cope with latest challenges is actively pursued by the management.
Architecture of the Bank’s internal control system involves different levels of monitoring activities i.e. line management, Compliance &
Data Division (CDD) and Audit & Inspection Division (AID). The Bank’s AID is independent from line management and reviews the adequacy
and implementation of control activities across the Bank as well as implementation of and compliance with all the prescribed policies and
procedures.
All significant and material findings pointed out by the internal, external auditors and regulators are addressed on priority basis by CDD.
The function also actively monitors implementation of the corrective / remedial measure to ensure that identified risks are mitigated to
safeguarding the interest of the Bank.
In compliance with the SBP’s directives, the Bank had completed the implementation of Road map regarding Internal Controls over Financial
Reporting (ICFR) on September 30, 2012. This included detailed documentation of the existing processes, comprehensive evaluation of
controls both at entity as well as activity level, development of detailed remedial action plans for the gaps identified as a result of such
evaluation and devising comprehensive testing plans of the controls of all processes. The documentation including the testing results has
been reviewed by the external auditors and a Long Form Report (LFR) for the year ended December 31, 2014 was submitted to State Bank
of Pakistan (SBP) on April 28, 2015 in compliance with the regulatory requirement. Based on the LFR, SBP has granted exemption to the
Bank from the requirement of submission of LFR by the external auditors and advised to submit annual assessment report as envisaged in
Para 2.3 of the OSED, SBP circular No. O1 dated February 07, 2014 due by March 31, 2016.
During the year under review, we have endeavored to follow the guidelines issued by SBP on internal controls for evaluation and management
of significant risks and we will continue to endeavor for further improvements in Internal Controls System.
While an internal controls system is effectively implemented and monitored; however, due to inherent limitations, internal controls system
is designed to manage rather than eliminate the risk of failure to achieve the desired objectives and can only provide reasonable and not
absolute assurance against material misstatement or loss.
Saleem Anwar Syed M. Husaini Chief Financial Officer President & Chief Executive
February 15, 2016
51
Annual Report of Askari Bank Limited for 2015
Statement of ComplianceWith the Code of Corporate Governance for the year ended December 31, 2015
This statement is being presented to comply with the Regulation G-1 of the Prudential Regulations for Corporate / Commercial Banking issued by the State Bank of Pakistan and Code of Corporate Governance (the CCG) contained in Rule No. 5.19 of Rule Book of Pakistan Stock Exchange Limited, for the purpose of establishing a framework of good governance, whereby a listed company is managed in compliance with the best practices of corporate governance.
Askari Bank Limited (the Bank) has applied the principles contained in the CCG in the following manner:
1. The Bank encourages representation of independent, non-executive directors and directors representing minority interests on its board of directors. At present the board includes:
Category Name
Non-Executive Directors Lt Gen Khalid Nawaz Khan, HI (M) (Retd) - Chairman
Lt Gen Muhammad Haroon Aslam, HI (M), S Bt (Retd)
Lt Gen Shafqaat Ahmed, HI (M), S Bt (Retd)
Mr. Qaiser Javed
Dr. Nadeem Inayat
Mr. Manzoor Ahmed - Nominee NIT
Independent Directors Mr. Asif Reza Sana
Mr. Zaffar Ahmad Khan
Mr. Tariq Hafeez Malik
Mr. Muhammad Ghous
Executive Directors Syed M. Husaini, President & CE
The independent directors meet the criteria of independence under clause i (b) of the CCG.
2. The directors have confirmed that none of them is serving as a director on more than seven listed companies, including Askari Bank Limited.
3. All the resident directors of the Bank are registered as taxpayers and none of them has defaulted in payment of any loan to a banking company, a DFI or an NBFI or, being a member of a stock exchange, has been declared as a defaulter by that stock exchange.
4. During the year, 2 casual vacancies occurred on the Board which were filled up by the Board within stipulated time.
5. The Bank has prepared a statement of “Code of Conduct”, and has ensured that appropriate steps have been taken to disseminate it throughout the Bank along with its supporting policies and procedures.
6. The Board has developed a vision / mission statement, overall corporate strategy and has approved significant policies of the Bank. A complete record of particulars of significant policies along with the dates on which they were approved or amended has been maintained.
7. All the powers of the Board have been duly exercised and decisions on material transactions, including appointment and determination of remuneration and terms and conditions of employment of the President & Chief Executive, and non-executive directors, have been taken by the Board / shareholders.
8. The meetings of the Board were presided over by the Chairman and the Board met at least once in every quarter. Written notices of the Board meetings, along with agenda and working papers, were circulated at least seven days before the meetings. The minutes of the meetings were appropriately recorded and circulated.
9. The directors of the Bank are well conversant with their duties and responsibilities. Five directors attended training program during the year.
10. The Board has not approved any new appointment of Chief Financial Officer (CFO), Company Secretary or Head of Internal Audit.
11. The Directors’ Report for this year has been prepared in compliance with the requirements of the CCG and fully describes the salient matters required to be disclosed.
52
12. The financial statements of the Bank were duly endorsed by the President & Chief Executive and the Chief Financial Officer before approval of the Board.
13. The directors, President & Chief Executive and executives do not hold any interest in the shares of the Bank other than that disclosed in the pattern of shareholding.
14. The Bank has complied with all the corporate and financial reporting requirements of the CCG.
15. The Board has formed a Board Audit & Compliance Committee (BACC). It comprises 5 members, of whom 3 members are non-executive directors and 2 members are independent directors, including the Chairman of the Committee.
16. The meetings of the Board Audit & Compliance Committee (BACC) were held at least once every quarter prior to approval of interim and final results of the Bank as required by the CCG. The Terms of Reference of the Committee have been formed and advised to the Committee for compliance.
17. The Board has formed a Board Human Resource & Remuneration Committee (BHR&RC). It comprises 4 members, of whom 1 member is executive director, 1 member is independent director and 2 members are non-executive directors, including the Chairman of the Committee.
18. The Board has set-up an effective internal audit function which is considered suitably qualified and experienced for the purpose and is conversant with the policies and procedures of the Bank.
19. The statutory auditors of the Bank have confirmed that they have been given a satisfactory rating under the quality control review program of the Institute of Chartered Accountants of Pakistan (ICAP), that they or any of the partners of the firm, their spouses and minor children do not hold shares of the Bank and that the firm and all its partners are in compliance with International Federation of Accountants (IFAC) guidelines on Code of Ethics, as adopted by the ICAP.
20. The statutory auditors or the persons associated with them have not been appointed to provide other services except in accordance with the Rule Book and the auditors have confirmed that they have observed IFAC guidelines in this regard.
21. The ‘closed period’, prior to the announcement of interim / final results, and business decisions, which may materially affect the market price of Bank’s shares, was determined and intimated to directors, employees and stock exchanges.
22. Material / price sensitive information has been disseminated among all market participants at once through stock exchanges.
23. We confirm that all other material principles enshrined in the CCG have been complied with.
For and on behalf of the Board
Rawalpindi Lt Gen Khalid Nawaz Khan February 15, 2016 HI(M), Sitara-i-Esar (Retd) Chairman
Statement of ComplianceWith the Code of Corporate Governance for the year ended December 31, 2015
53
Annual Report of Askari Bank Limited for 2015
Review Report to the Memberson Statement of Compliance with THE Code of Corporate Governance
We have reviewed the enclosed Directors’ Statement of Compliance with the best practices (the Statement) contained in the Code of Corporate Governance (the Code) prepared by the Board of Directors of Askari Bank Limited, (the Bank) for the year ended December 31, 2015 to comply with the requirements of Regulation G-1 of the Prudential Regulations for Corporate / Commercial Banking issued by the State Bank of Pakistan and Rule No. 5.19 of the Rule Book issued by Pakistan Stock Exchange, where the Bank is listed.
The responsibility for compliance with the Code is that of the Board of Directors (the Board) of the Bank. Our responsibility is to review, to the extent where such compliance can be objectively verified, whether the Statement reflects the status of the Bank’s compliance with theprovisions of the Code and report if it does not and to highlight any non-compliance with the requirements of the Code. A review is limited primarily to inquiries of the Bank’s personnel and review of various documents prepared by the Bank to comply with the Code.
As a part of our audit of the financial statements we are required to obtain an understanding of the accounting and internal control systems sufficient to plan the audit and develop an effective audit approach. We are not required to consider whether the Board’s statement on internal control covers all risks and controls, or to form an opinion on the effectiveness of such internal controls, the Bank’s corporate governance procedures and risks.
The Code requires the Bank to place before the Audit Committee, and upon recommendation of the Audit Committee, place before the Board for their review and approval of its related party transactions distinguishing between transactions carried out on terms equivalent to those that prevail in arm’s length transactions and transactions which are not executed at arm’s length price and recording proper justification for using such alternative pricing mechanism. We are only required and have ensured compliance of this requirement to the extent of the approval of the related party transactions by the Board upon recommendation of the Audit Committee. We have not carried out any procedures to determine whether the related party transactions were undertaken at arm’s length price or not.
Based on our review, nothing has come to our attention which causes us to believe that the Statement does not appropriately reflect the Bank’s compliance, in all material respects, with the best practices contained in the Code as applicable to the Bank for the year endedDecember 31, 2015.
Chartered AccountantsIslamabadEngagement partner: S. Haider Abbas
Date: February 15, 2016
A.F. FERGUSON & CO.
A.F. FERGUSON & CO., Chartered Accountants, a member firm of the PWC networkPIA Building. 3rd Floor, 49 Blue Area, Fazl-ul-Haq Road, P.O. Box 3021, Islamabad-44000, PakistanTel: +92 (51) 2273457-60 / 2604934-37; Fax: +92 (51) 2277924; <www.pwc.com/pk>
Karachi: State Life Building No. 1-C, I.I. Chundrigar Road, P.O. Box 4716, Karachi-74000, Pakistan; Tel: +92 (21) 32426682-5/32426711-5; Fax: +92 (21) 32415007Lahore: 23-C, Aziz Avenue, Canal Bank, Gulberg V, P.O. Box 39, Lahore-54660, Pakistan; Tel: +92 (42) 35715864-71; Fax: +92 (42) 35715872Kabul: Apartment No 3, 3rd Floor, Doost Tower, Haji Yaqub Square, Kabul, Afghanistan; Tel +93 (779) 315320
54
We have audited the annexed unconsolidated statement of financial position of Askari Bank Limited (the Bank) as at December 31, 2015
and the related unconsolidated profit and loss account, unconsolidated statement of comprehensive income, unconsolidated cash flow
statement and unconsolidated statement of changes in equity together with the notes forming part thereof (here in after referred to as
the ‘financial statements’) for the year then ended, in which are incorporated the unaudited certified returns from the branches except for
twenty five branches which have been audited by us and one branch audited by auditors abroad and we state that we have obtained all the
information and explanations which, to the best of our knowledge and belief, were necessary for the purposes of our audit.
It is the responsibility of the Bank’s Board of Directors to establish and maintain a system of internal control, and prepare and present the
financial statements in conformity with the approved accounting standards and the requirements of the Banking Companies Ordinance,
1962 (LVII of 1962), and the Companies Ordinance, 1984 (XLVII of 1984). Our responsibility is to express an opinion on these statements
based on our audit.
We conducted our audit in accordance with the International Standards on Auditing as applicable in Pakistan. These standards require
that we plan and perform the audit to obtain reasonable assurance about whether the financial statements are free of any material
misstatement. An audit includes examining, on a test basis, evidence supporting amounts and disclosures in the financial statements.
An audit also includes assessing accounting policies and significant estimates made by management, as well as, evaluating the overall
presentation of the financial statements. We believe that our audit provides a reasonable basis for our opinion and after due verification,
which in case of loans and advances covered more than sixty percent of the total loans and advances of the Bank, we report that:
a) in our opinion, proper books of account have been kept by the Bank as required by the Companies Ordinance, 1984 (XLVII of 1984),
and the returns referred to above received from the branches have been found adequate for the purposes of our audit;
b) in our opinion:
i) the unconsolidated statement of financial position and unconsolidated profit and loss account together with the notes
thereon have been drawn up in conformity with the Banking Companies Ordinance, 1962 (LVII of 1962) and the Companies
Ordinance, 1984 (XLVII of 1984), and are in agreement with the books of account and are further in accordance with
accounting policies consistently applied;
Auditors’ Report to the Members
A.F. FERGUSON & CO.
A.F. FERGUSON & CO., Chartered Accountants, a member firm of the PWC networkPIA Building. 3rd Floor, 49 Blue Area, Fazl-ul-Haq Road, P.O. Box 3021, Islamabad-44000, PakistanTel: +92 (51) 2273457-60 / 2604934-37; Fax: +92 (51) 2277924; <www.pwc.com/pk>
Karachi: State Life Building No. 1-C, I.I. Chundrigar Road, P.O. Box 4716, Karachi-74000, Pakistan; Tel: +92 (21) 32426682-5/32426711-5; Fax: +92 (21) 32415007Lahore: 23-C, Aziz Avenue, Canal Bank, Gulberg V, P.O. Box 39, Lahore-54660, Pakistan; Tel: +92 (42) 35715864-71; Fax: +92 (42) 35715872Kabul: Apartment No 3, 3rd Floor, Doost Tower, Haji Yaqub Square, Kabul, Afghanistan; Tel +93 (779) 315320
55
Annual Report of Askari Bank Limited for 2015
ii) the expenditure incurred during the year was for the purpose of the Bank’s business; and
iii) the business conducted, investments made and the expenditure incurred during the year were in accordance with the
objects of the Bank and the transactions of the Bank which have come to our notice have been within the powers of the
Bank;
c) in our opinion and to the best of our information and according to the explanations given to us, the unconsolidated statement of
financial position, unconsolidated profit and loss account, unconsolidated statement of comprehensive income, unconsolidated
cash flow statement and unconsolidated statement of changes in equity together with the notes forming part thereof conform with
approved accounting standards as applicable in Pakistan, and give the information required by the Banking Companies Ordinance,
1962 (LVII of 1962) and the Companies Ordinance, 1984 (XLVII of 1984), in the manner so required and give a true and fair view of
the state of the Bank’s affairs as at December 31, 2015 and its true balance of the profit, its comprehensive income, its cash flows
and changes in equity for the year then ended; and
d) in our opinion Zakat deductible at source under the Zakat and Ushr Ordinance, 1980 (XVIII of 1980), was deducted by the Bank and
deposited in the Central Zakat Fund established under section 7 of that Ordinance.
The unconsolidated financial statements of the Bank for the year ended December 31, 2014 were audited by another firm of Chartered
Accountants who had expressed an unqualified opinion thereon vide their report dated February 13, 2015.
Chartered AccountantsIslamabadEngagement partner: S. Haider Abbas
Date: February 15, 2016
A.F. FERGUSON & CO.
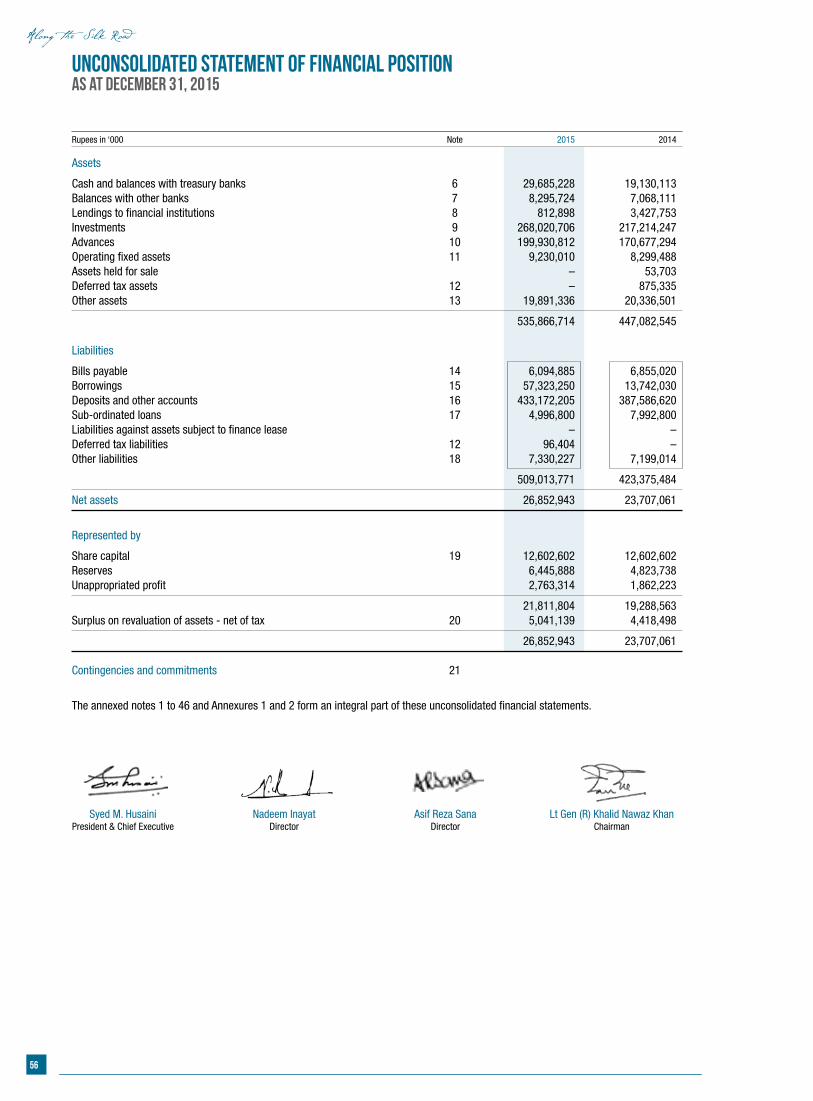
56
Nadeem InayatDirector
Syed M. HusainiPresident & Chief Executive
Asif Reza SanaDirector
Lt Gen (R) Khalid Nawaz KhanChairman
Unconsolidated Statement of Financial PositionAs at December 31, 2015
Rupees in ‘000 Note 2015 2014
Assets
Cash and balances with treasury banks 6 29,685,228 19,130,113 Balances with other banks 7 8,295,724 7,068,111 Lendings to financial institutions 8 812,898 3,427,753 Investments 9 268,020,706 217,214,247 Advances 10 199,930,812 170,677,294 Operating fixed assets 11 9,230,010 8,299,488 Assets held for sale – 53,703 Deferred tax assets 12 – 875,335 Other assets 13 19,891,336 20,336,501
535,866,714 447,082,545 Liabilities
Bills payable 14 6,094,885 6,855,020 Borrowings 15 57,323,250 13,742,030 Deposits and other accounts 16 433,172,205 387,586,620 Sub-ordinated loans 17 4,996,800 7,992,800 Liabilities against assets subject to finance lease – –Deferred tax liabilities 12 96,404 –Other liabilities 18 7,330,227 7,199,014
509,013,771 423,375,484
Net assets 26,852,943 23,707,061
Represented by
Share capital 19 12,602,602 12,602,602 Reserves 6,445,888 4,823,738 Unappropriated profit 2,763,314 1,862,223
21,811,804 19,288,563 Surplus on revaluation of assets - net of tax 20 5,041,139 4,418,498
26,852,943 23,707,061
Contingencies and commitments 21
The annexed notes 1 to 46 and Annexures 1 and 2 form an integral part of these unconsolidated financial statements.
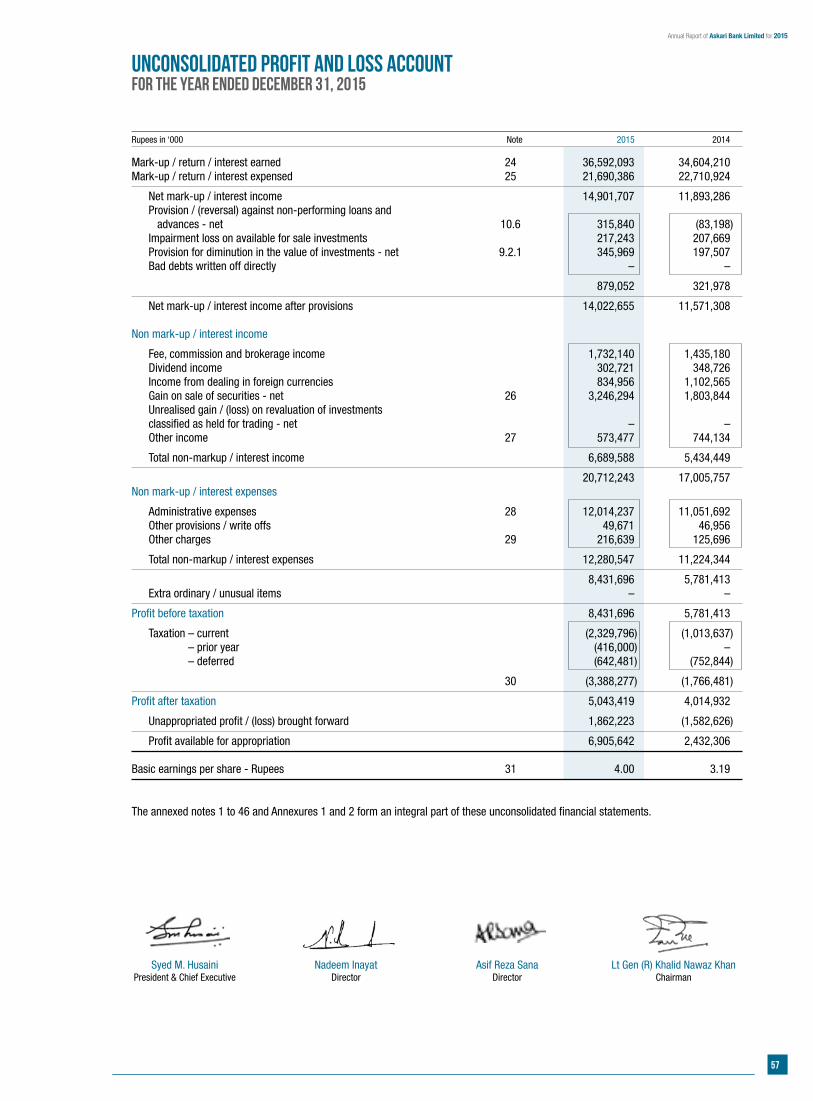
57
Annual Report of Askari Bank Limited for 2015
Nadeem InayatDirector
Syed M. HusainiPresident & Chief Executive
Asif Reza SanaDirector
Lt Gen (R) Khalid Nawaz KhanChairman
Unconsolidated Profit and Loss AccountFor the year ended December 31, 2015
Rupees in ‘000 Note 2015 2014
Mark-up / return / interest earned 24 36,592,093 34,604,210 Mark-up / return / interest expensed 25 21,690,386 22,710,924
Net mark-up / interest income 14,901,707 11,893,286 Provision / (reversal) against non-performing loans and advances - net 10.6 315,840 (83,198) Impairment loss on available for sale investments 217,243 207,669 Provision for diminution in the value of investments - net 9.2.1 345,969 197,507 Bad debts written off directly – –
879,052 321,978
Net mark-up / interest income after provisions 14,022,655 11,571,308 Non mark-up / interest income
Fee, commission and brokerage income 1,732,140 1,435,180 Dividend income 302,721 348,726 Income from dealing in foreign currencies 834,956 1,102,565 Gain on sale of securities - net 26 3,246,294 1,803,844 Unrealised gain / (loss) on revaluation of investments classified as held for trading - net – – Other income 27 573,477 744,134
Total non-markup / interest income 6,689,588 5,434,449
20,712,243 17,005,757 Non mark-up / interest expenses
Administrative expenses 28 12,014,237 11,051,692 Other provisions / write offs 49,671 46,956 Other charges 29 216,639 125,696
Total non-markup / interest expenses 12,280,547 11,224,344
8,431,696 5,781,413 Extra ordinary / unusual items – –
Profit before taxation 8,431,696 5,781,413
Taxation – current (2,329,796) (1,013,637) Taxation – prior year (416,000) – Taxation – deferred (642,481) (752,844)
30 (3,388,277) (1,766,481)
Profit after taxation 5,043,419 4,014,932
Unappropriated profit / (loss) brought forward 1,862,223 (1,582,626)
Profit available for appropriation 6,905,642 2,432,306 Basic earnings per share - Rupees 31 4.00 3.19 The annexed notes 1 to 46 and Annexures 1 and 2 form an integral part of these unconsolidated financial statements.
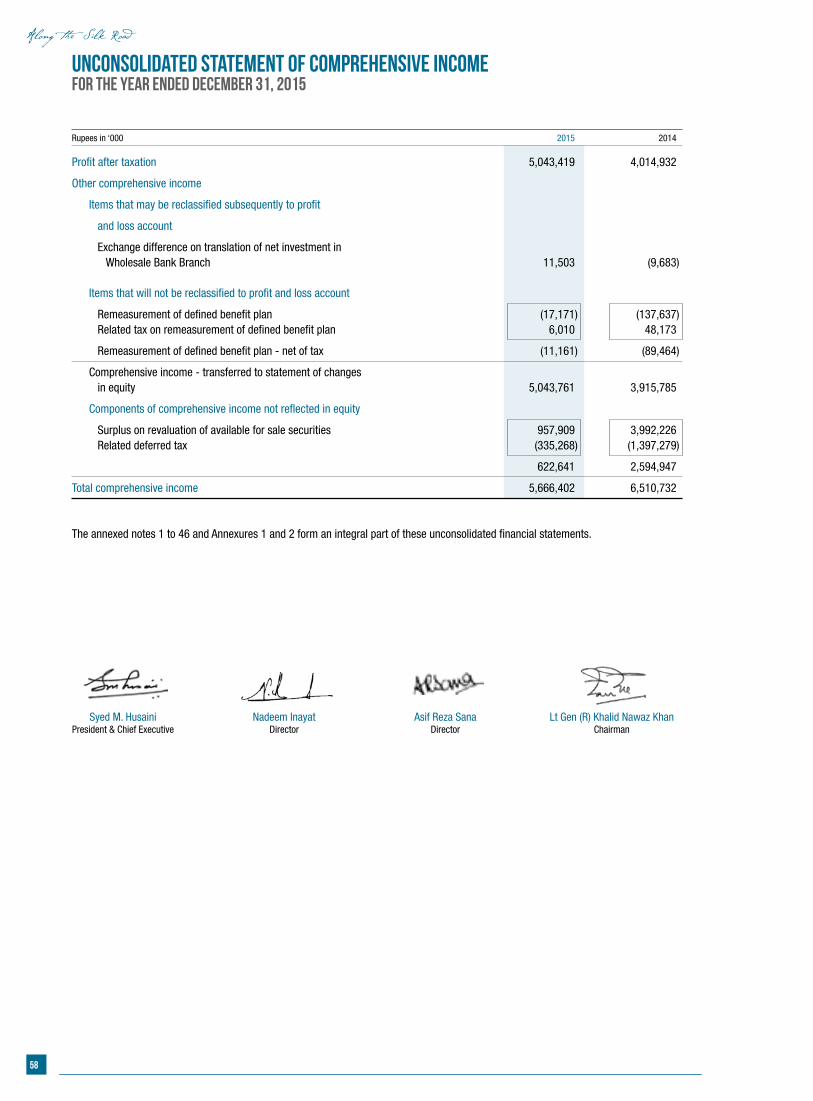
58
Nadeem InayatDirector
Syed M. HusainiPresident & Chief Executive
Asif Reza SanaDirector
Lt Gen (R) Khalid Nawaz KhanChairman
Unconsolidated Statement of Comprehensive IncomeFor the year ended December 31, 2015
Rupees in ‘000 2015 2014
Profit after taxation 5,043,419 4,014,932
Other comprehensive income
Items that may be reclassified subsequently to profit
and loss account
Exchange difference on translation of net investment in Wholesale Bank Branch 11,503 (9,683) Items that will not be reclassified to profit and loss account
Remeasurement of defined benefit plan (17,171) (137,637) Related tax on remeasurement of defined benefit plan 6,010 48,173
Remeasurement of defined benefit plan - net of tax (11,161) (89,464)
Comprehensive income - transferred to statement of changes in equity 5,043,761 3,915,785
Components of comprehensive income not reflected in equity
Surplus on revaluation of available for sale securities 957,909 3,992,226 Related deferred tax (335,268) (1,397,279)
622,641 2,594,947
Total comprehensive income 5,666,402 6,510,732
The annexed notes 1 to 46 and Annexures 1 and 2 form an integral part of these unconsolidated financial statements.
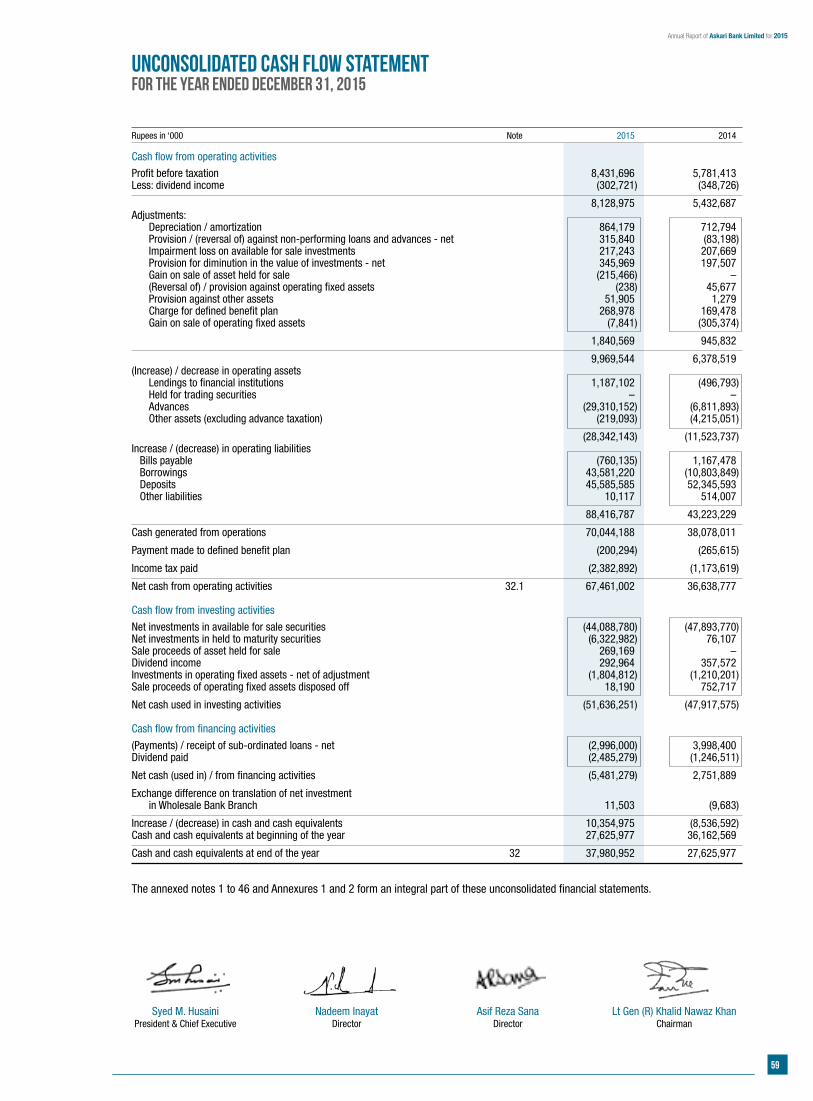
59
Annual Report of Askari Bank Limited for 2015
Nadeem InayatDirector
Syed M. HusainiPresident & Chief Executive
Asif Reza SanaDirector
Lt Gen (R) Khalid Nawaz KhanChairman
Rupees in ‘000 Note 2015 2014
Cash flow from operating activities
Profit before taxation 8,431,696 5,781,413 Less: dividend income (302,721) (348,726)
8,128,975 5,432,687 Adjustments: Depreciation / amortization 864,179 712,794 Provision / (reversal of) against non-performing loans and advances - net 315,840 (83,198) Impairment loss on available for sale investments 217,243 207,669 Provision for diminution in the value of investments - net 345,969 197,507 Gain on sale of asset held for sale (215,466) – (Reversal of) / provision against operating fixed assets (238) 45,677 Provision against other assets 51,905 1,279 Charge for defined benefit plan 268,978 169,478 Gain on sale of operating fixed assets (7,841) (305,374)
1,840,569 945,832
9,969,544 6,378,519 (Increase) / decrease in operating assets Lendings to financial institutions 1,187,102 (496,793) Held for trading securities – – Advances (29,310,152) (6,811,893) Other assets (excluding advance taxation) (219,093) (4,215,051)
(28,342,143) (11,523,737)Increase / (decrease) in operating liabilities Bills payable (760,135) 1,167,478 Borrowings 43,581,220 (10,803,849) Deposits 45,585,585 52,345,593 Other liabilities 10,117 514,007
88,416,787 43,223,229
Cash generated from operations 70,044,188 38,078,011
Payment made to defined benefit plan (200,294) (265,615)
Income tax paid (2,382,892) (1,173,619)
Net cash from operating activities 32.1 67,461,002 36,638,777 Cash flow from investing activities
Net investments in available for sale securities (44,088,780) (47,893,770)Net investments in held to maturity securities (6,322,982) 76,107 Sale proceeds of asset held for sale 269,169 – Dividend income 292,964 357,572 Investments in operating fixed assets - net of adjustment (1,804,812) (1,210,201)Sale proceeds of operating fixed assets disposed off 18,190 752,717
Net cash used in investing activities (51,636,251) (47,917,575) Cash flow from financing activities
(Payments) / receipt of sub-ordinated loans - net (2,996,000) 3,998,400 Dividend paid (2,485,279) (1,246,511)
Net cash (used in) / from financing activities (5,481,279) 2,751,889
Exchange difference on translation of net investment in Wholesale Bank Branch 11,503 (9,683)
Increase / (decrease) in cash and cash equivalents 10,354,975 (8,536,592)Cash and cash equivalents at beginning of the year 27,625,977 36,162,569
Cash and cash equivalents at end of the year 32 37,980,952 27,625,977 The annexed notes 1 to 46 and Annexures 1 and 2 form an integral part of these unconsolidated financial statements.
Unconsolidated Cash Flow StatementFor the year ended December 31, 2015
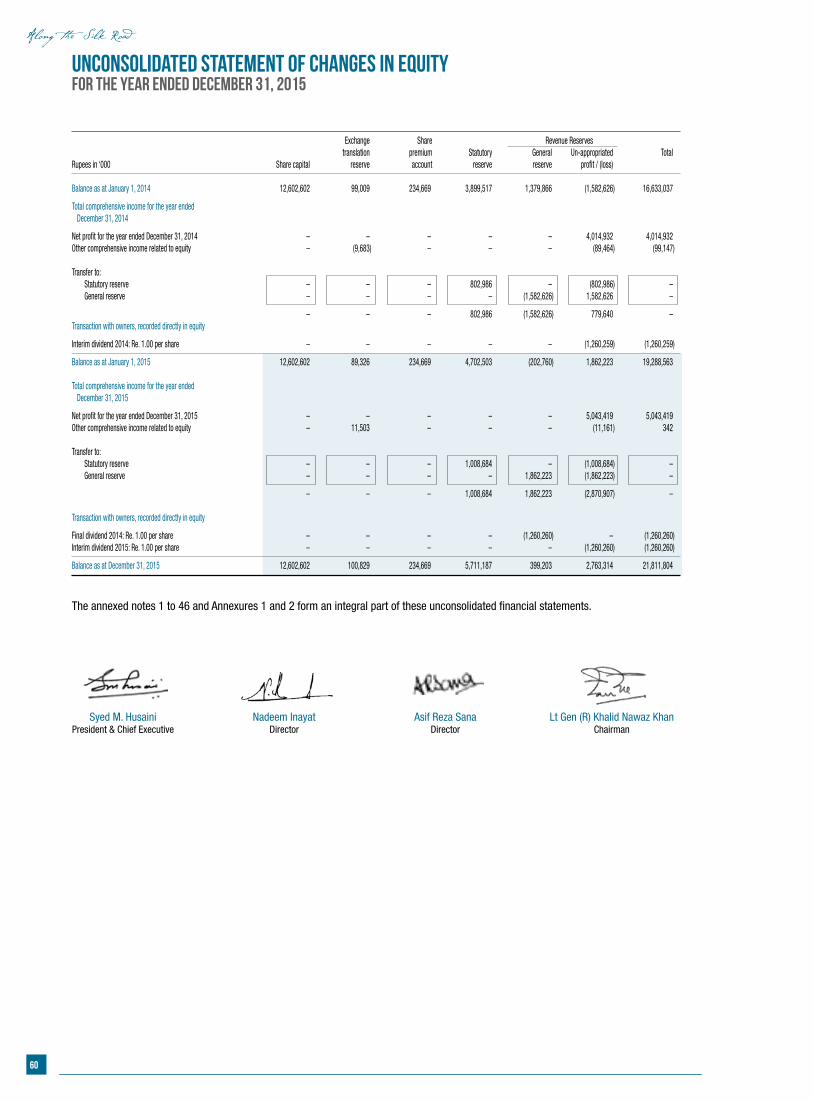
60
Nadeem InayatDirector
Syed M. HusainiPresident & Chief Executive
Asif Reza SanaDirector
Lt Gen (R) Khalid Nawaz KhanChairman
Exchange Share Revenue Reserves translation premium Statutory General Un-appropriated TotalRupees in ‘000 Share capital reserve account reserve reserve profit / (loss) Balance as at January 1, 2014 12,602,602 99,009 234,669 3,899,517 1,379,866 (1,582,626) 16,633,037
Total comprehensive income for the year ended December 31, 2014
Net profit for the year ended December 31, 2014 – – – – – 4,014,932 4,014,932 Other comprehensive income related to equity – (9,683) – – – (89,464) (99,147) Transfer to: Statutory reserve – – – 802,986 – (802,986) – General reserve – – – – (1,582,626) 1,582,626 –
– – – 802,986 (1,582,626) 779,640 – Transaction with owners, recorded directly in equity
Interim dividend 2014: Re. 1.00 per share – – – – – (1,260,259) (1,260,259)
Balance as at January 1, 2015 12,602,602 89,326 234,669 4,702,503 (202,760) 1,862,223 19,288,563 Total comprehensive income for the year ended December 31, 2015
Net profit for the year ended December 31, 2015 – – – – – 5,043,419 5,043,419 Other comprehensive income related to equity – 11,503 – – – (11,161) 342 Transfer to: Statutory reserve – – – 1,008,684 – (1,008,684) – General reserve – – – – 1,862,223 (1,862,223) –
– – – 1,008,684 1,862,223 (2,870,907) – Transaction with owners, recorded directly in equity
Final dividend 2014: Re. 1.00 per share – – – – (1,260,260) – (1,260,260)Interim dividend 2015: Re. 1.00 per share – – – – – (1,260,260) (1,260,260)
Balance as at December 31, 2015 12,602,602 100,829 234,669 5,711,187 399,203 2,763,314 21,811,804
The annexed notes 1 to 46 and Annexures 1 and 2 form an integral part of these unconsolidated financial statements.
Unconsolidated Statement of Changes in EquityFor the year ended December 31, 2015
61
Annual Report of Askari Bank Limited for 2015
1. STATUS AND NATURE OF BUSINESS
1.1 Askari Bank Limited (the Bank) was incorporated in Pakistan on October 9, 1991 as a Public Limited Company and is listed on the Pakistan Stock Exchange (formerly Karachi, Lahore and Islamabad Stock Exchanges). The registered office of the Bank is situated at AWT Plaza, The Mall, Rawalpindi. The Bank is a scheduled commercial bank and is principally engaged in the business of banking as defined in the Banking Companies Ordinance, 1962. The Fauji Consortium: comprising of Fauji Foundation (FF), Fauji Fertilizer Company Limited (FFCL) and Fauji Fertilizer Bin Qasim Limited (FFBL) collectively owned 71.91 percent shares of the Bank as on December 31, 2015. The ultimate parent of the Bank is Fauji Foundation. The Bank has 424 branches (2014: 321 branches); 423 in Pakistan and Azad Jammu and Kashmir, including 75 (2014: 53) Islamic Banking branches, 32 (2014: 31) sub-branches and a Wholesale Bank Branch in the Kingdom of Bahrain.
2. BASIS OF PRESENTATION
2.1 These unconsolidated financial statements have been presented in accordance with the requirements of format prescribed by the State Bank of Pakistan’s BSD Circular No. 4 dated February 17, 2006.
2.2 These unconsolidated financial statements are separate financial statements of the Bank in which the investments in subsidiaries and associates are stated at cost and have not been accounted for on the basis of reported results and net assets of the investees which is done in consolidated financial statements.
2.3 In accordance with the directives of the Federal Government regarding shifting of the banking system to Islamic modes, the SBP has issued various circulars from time to time. One permissible form of trade related mode of financing comprises of purchase of goods by the Bank from its customers and resale to them at appropriate mark-up in price on a deferred payment basis. The purchases and sales arising under these arrangements are not reflected in these unconsolidated financial statements as such but are restricted to the amount of facilities actually utilized and the appropriate portion of mark-up thereon.
2.4 The financial results of the Islamic banking branches have been consolidated in these unconsolidated financial statements for reporting purposes, after eliminating material inter-branch transactions / balances. Key figures of the Islamic banking branches are disclosed in Annexure-2 to these unconsolidated financial statements.
2.5 Items included in the unconsolidated financial statements are measured using the currency of the primary economic environment in which the Bank operates. The unconsolidated financial statements are presented in Pak Rupee which is the Bank’s functional and presentation currency. Figures have been rounded off to the nearest thousand of rupees unless otherwise stated.
3. STATEMENT OF COMPLIANCE
These unconsolidated financial statements have been prepared in accordance with the approved accounting standards as applicable in Pakistan and the requirements of the Companies Ordinance, 1984 and the Banking Companies Ordinance, 1962. Approved accounting standards comprise of such International Financial Reporting Standards (IFRS) issued by the International Accounting Standard Board (IASB) and Islamic Financial Accounting Standards (IFAS) issued by the Institute of Chartered Accountants of Pakistan (ICAP) as are notified under the Companies Ordinance, 1984, provisions of and directives issued under the Companies Ordinance, 1984 and the Banking Companies Ordinance, 1962 or directives issued by the Securities and Exchange Commission of Pakistan and the State Bank of Pakistan (SBP). In case the requirements differ, the provisions of and directives issued under the Companies Ordinance, 1984 and the Banking Companies Ordinance, 1962 and the directives issued by SBP shall prevail.
International Accounting Standard 39, “Financial Instruments: Recognition and Measurement”, International Accounting Standard 40, “Investment Property” and International Financial Reporting Standard 7, “Financial Instruments: Disclosure” are not applicable to banking companies in Pakistan. Accordingly, the requirements of these Standards have not been considered in the preparation of these unconsolidated financial statements. Accordingly, investments have been classified and valued in accordance with the requirements prescribed by the SBP through various circulars.
3.1 Standards, interpretations and amendments to approved accounting standards that are not yet effective
a) The following amendments and interpretations to published accounting standards were effective during the year and have been adopted by the Bank:
Effective date (annual periods beginning on or after)
IFRS 3 Business Combinations (Amendments) July 1, 2014 IFRS 8 Operating Segments (Amendments) July 1, 2014 IAS 1 Presentation of Financial Statements (Amendments) July 1, 2014 IAS 16 Property, Plant and Equipment (Amendments) July 1, 2014 IAS 19 Employee Benefits (Amendments) July 1, 2014 IAS 24 Related Party Disclosures (Amendments) July 1, 2014 IAS 38 Intangible Assets (Amendments) July 1, 2014
Notes to the Unconsolidated Financial StatementsFor the year ended December 31, 2015
62
b) The following standard has been issued by the International Accounting Standards Board (IASB), which is yet to be notified by the Securities and Exchange Commission of Pakistan (SECP) for the purpose of its applicability in Pakistan:
effective date (Annual periods beginning On or after)
IFRS 1 First-Time Adoption of International Financial Reporting Standards July 1, 2009
c) Following standards and amendments were notified by SECP for the purpose of their applicability in Pakistan from annual periods beginning on or after January 1, 2015.
IFRS 10 Consolidated Financial Statements IFRS 11 Joint Arrangements IFRS 12 Disclosure of Interests in Other Entities IFRS 13 Fair Value Measurement IAS 27 Separate Financial Statements IAS 28 Investments in Associates and Joint Ventures IFRS 10 Consolidated Financial Statements (Amendments) IFRS 12 Disclosure of Interests in Other Entities (Amendments) IFRS 13 Fair Value Measurement (Amendments) IAS 27 Separate Financial Statements (Amendments)
d) Following standards and amendments to published accounting standards will be effective in future periods and have not been early adopted by the Bank.
Effective date (annual periods beginning on or after)
IFRS 5 Non-current Assets Held for Sale and Discontinued January 1, 2016 Operations (Amendments) IFRS 7 Financial Instruments: Disclosures (Amendments) January 1, 2016 IFRS 9 Financial Instruments January 1, 2018 IFRS 10 Consolidated Financial Statements (Amendments) January 1, 2016 IFRS 11 Joint Arrangements (Amendments) January 1, 2016 IFRS 12 Disclosure of interests in Other Entities (Amendments) January 1, 2016 IFRS 14 Regulatory Deferral Accounts January 1, 2016 IFRS 15 Revenue from Contracts with Customers January 1, 2017 IAS 1 Presentation of Financial Statements (Amendments) January 1, 2016 IAS 16 Property, Plant and Equipment (Amendments) January 1, 2016 IAS 19 Employee Benefits (Amendments) January 1, 2016 IAS 27 Separate Financial Statements (Amendments) January 1, 2016 IAS 28 Investments in Associates and Joint Ventures (Amendments) January 1, 2016 IAS 34 Interim Financial Reporting (Amendments) January 1, 2016 IAS 38 Intangible Assets (Amendments) January 1, 2016
The management anticipates that adoption of above standards and amendments in future periods will have no material impact on the Bank’s financial statements other than in presentation/disclosure.
4. BASIS OF MEASUREMENT
These unconsolidated financial statements have been prepared under the historical cost convention as modified for certain investments which are carried at fair value, freehold and leasehold land which are shown at revalued amounts and staff retirement gratuity and compensated absences which are carried at present value of defined benefit obligations net of fair value of plan assets.
Notes to the Unconsolidated Financial StatementsFor the year ended December 31, 2015
63
Annual Report of Askari Bank Limited for 2015
Use of critical accounting estimates and judgments
The preparation of unconsolidated financial statements in conformity with approved accounting standards as applicable in Pakistan requires the use of certain accounting estimates. It also requires management to exercise its judgement in the process of applying the Bank’s accounting policies. The Bank uses estimates and assumptions concerning the future. The resulting accounting estimate will, by definition, seldom equal the related actual results. Estimates and judgments are continually evaluated and are based on historical experience and other factors, including expectations of future events that are believed to be reasonable under the circumstances. The areas involving a higher degree of judgment or complexity, or areas where assumptions and estimates are significant to the financial statements are as follow:
i) classification of investments (note 5.4) ii) provision against investments (note 5.4), advances (note 5.5), operating fixed assets (note 5.6) and other assets (note 5.7) iii) valuation and impairment of available for sale securities (note 5.4) iv) useful life of property and equipment, intangible assets and revaluation of land (note 5.6) v) taxation (note 5.9) vi) staff retirement benefits (note 5.10)
5. SUMMARY OF SIGNIFICANT ACCOUNTING POLICIES
The accounting policies set out below have been applied consistently to all periods presented in these financial statements. 5.1 Assets held for sale
Non-current assets and associated liabilities are classified as held for sale when their carrying amount will be recovered principally through a sale transaction rather than continuing use and a sale is highly probable. Assets designated as held for sale are held at the lower of carrying amount at designation and fair value less costs to sell.
5.2 Cash and cash equivalents
Cash and cash equivalents comprise of cash and balances with treasury banks, balances with other banks and call money lendings.
5.3 Sale and repurchase agreements
Securities sold under repurchase agreement (repo) are retained in the unconsolidated financial statements as investments and a liability for consideration received is included in borrowings. Conversely, consideration for securities purchased under resale agreement (reverse repo) are included in lendings to financial institutions. The difference between sale and repurchase / purchase and resale price is recognized as mark-up / return expensed and earned on a time proportion basis as the case may be. Repo and reverse repo balances are reflected under borrowings from and lendings to financial institutions respectively.
5.4 Investments
Investments are classified as follows:
Held for trading
These represent securities acquired with the intention to trade by taking advantage of short-term market / interest rate movements. These are marked to market and surplus / deficit arising on revaluation of ‘held for trading’ investments is taken to profit and loss account in accordance with the requirements prescribed by the SBP through various circulars.
Available for sale
These represent securities which do not fall under ‘held for trading’ or ‘held to maturity’ categories. In accordance with the requirements of the SBP’s BSD Circular No. 20 dated August 04, 2000 and BPRD circular 06 dated June 26, 2014, available for sale securities for which ready quotations are available on Reuters Page (PKRV) or Stock Exchanges are valued at market value and the resulting surplus / deficit is taken through “Statement of Comprehensive Income” and is shown below the shareholders’ equity in the unconsolidated statement of financial position. Where the decline in prices of available for sale equity securities is significant and prolonged, it is considered impaired and included in profit and loss account. Impairment loss on available for sale debt securities is determined in accordance with the requirements of Prudential Regulations issued by the SBP.
Unquoted equity securities are valued at the lower of cost and break-up value. Break-up value of equity securities is calculated with reference to the net assets of the investee as per the latest audited financial statements. If the break-up value is less than cost the difference is included in profit and loss account. Unquoted debt securities are valued using the market value of secondary market where available.
Investments in other unquoted securities are valued at cost less impairment losses, determined in accordance with the requirements of Prudential Regulations issued by the SBP.
64
Held to maturity
These represent securities acquired with the intention and ability to hold them upto maturity. These are carried at amortized cost less impairment, determined in accordance with the requirements of Prudential Regulations issued by the SBP.
Investment in subsidiaries and associate
Investments in subsidiaries and associate are carried at cost less impairment, if any.
All purchases and sale of investment that require delivery within the time frame established by regulations or market convention are recognized at the trade date, which is the date the Bank commits to purchase or sell the investments.
5.5 Advances
Advances are stated net of provisions for non-performing advances. Provision for advances is determined in accordance with the requirements of the Prudential Regulations issued by the SBP from time to time. In addition, a general provision is maintained for advances other than consumer and small entities advances as per details given in note 10.6.3.
The provisions against non-performing advances are charged to the profit and loss account. Advances are written off when there is no realistic prospect of recovery.
Consequent to the adoption of IFAS-2, ijarahs booked under IFAS-2 are stated at cost less accumulated depreciation and impairment, if any, and are shown under advances.
Depreciation on Ijarah assets is charged to profit and loss account by applying the straight line method whereby the depreciable value of Ijarah assets is written off over the Ijarah period. The Bank charges depreciation from the date of delivery of respective assets to Mustajir upto the date of maturity / termination of Ijarah agreement.
Leases where the Bank transfers substantially all the risks and rewards incidental to ownership of an asset to the lessee are classified as finance leases. A receivable is recognized at an amount equal to the present value of the lease payments including any guaranteed residual value. Finance lease receivables are included in advances to the customers.
Murabaha transactions are reflected as receivable at the invoiced amount. Actual sale and purchase are not reflected as the goods are purchased by the customer as agent of the Bank and all documents relating to purchase are in customers’ name.
In Salam, the seller undertakes to supply specific goods to the Bank at a future date in consideration of a price fully paid in advance at the time the contract of sale is made.
In Musharaka a relationship is established under a contract by the mutual consent of the Bank and the customer for sharing of profits and losses arising from a joint enterprise or venture.
Diminishing Musharaka (DM) is a form of co-ownership in which Bank and the customer share the ownership of a tangible asset in an agreed proportion and customer undertakes to buy in periodic installments the proportionate share of the Bank until the title to such tangible asset is completely transferred to the customer.
In Istisna, a contract of sale is made whereby the Bank places an order, to manufacture, assemble or construct, specific commodity to be delivered at a future date.
5.6 Capital work-in-progress, operating fixed assets and depreciation
Capital work-in-progress
Capital work-in-progress is stated at cost less impairment losses, if any.
Tangible assets
Fixed assets are stated at cost less impairment losses and accumulated depreciation except for freehold / leasehold land. Land is carried at revalued amounts which is not depreciated.
Land is revalued by professionally qualified valuers with sufficient regularity to ensure that the net carrying amount does not differ materially from their fair value. Surplus / (deficit) arising on revaluation of fixed assets is credited / (debited) to the surplus on revaluation of assets account and is shown below the shareholders’ equity in the unconsolidated statement of financial position. Except to the extent actually realized on disposal of land which are revalued, the surplus on revaluation of land shall not be applied to set-off or reduce any deficit or loss, whether past, current or future, or in any manner applied, adjusted or treated so as to add to the income, profit or surplus of the Bank or utilized directly or indirectly by way of dividend or bonus.
Intangible assets
Intangible assets are carried at cost less accumulated amortization and impairment losses, if any.
Notes to the Unconsolidated Financial StatementsFor the year ended December 31, 2015
65
Annual Report of Askari Bank Limited for 2015
Depreciation / amortization
Depreciation / amortization is computed on monthly basis over the estimated useful lives of the related assets at the rates set out in note 11.2 and 11.3 respectively on monthly basis. The cost of assets is depreciated / amortized on the diminishing balance method, except for vehicles, carpets, renovations, other assets and intangibles which are depreciated / amortized on a straight line basis. Depreciation / amortization is charged for the full month of purchase / acquisition / availability for use of an asset while no depreciation / amortization is charged in the month of disposal of an asset. Maintenance and normal repairs are charged to profit and loss account as and when incurred. Major renewals and improvements are capitalized. Gains and losses on disposal of operating fixed assets are taken to the profit and loss account.
In making estimates of the depreciation / amortization, the management uses useful life and residual value which reflects the pattern in which economic benefits are expected to be consumed by the Bank. The useful life and the residual value are reviewed at each financial year end and any change in these estimates in future years might effect the carrying amounts of the respective item of operating fixed assets with the corresponding effect on depreciation / amortization charge.
5.7 Impairment
The carrying amount of the Bank’s assets are reviewed at the reporting date to determine whether there is any indication of impairment. If such indications exist, the asset’s recoverable amount is estimated in order to determine the extent of the impairment loss, if any. Impairment loss is recognized as expense in the unconsolidated profit and loss account. An impairment loss is reversed only to the extent that the asset’s carrying amount does not exceed the carrying amount that would have been determined, net of depreciation or amortization, if no impairment loss had been recognized.
5.8 Deposits
Deposits are recorded at the fair value of proceeds received. Markup accrued on deposits is recognized separately as part of other liabilities and is charged to profit and loss account on a time proportion basis.
The Bank generates deposits in two modes i.e. “Qard” and “Modaraba” under Islamic Banking Operations. Deposits taken on Qard basis are classified as ‘Current Accounts’ and deposits generated on Modaraba basis are classified as ‘Saving Accounts’ and ‘Fixed Deposit Accounts’.
5.9 Taxation
Income tax on the profit or loss for the year comprises current and deferred tax. Income tax is recognized in the unconsolidated profit and loss account, except to the extent that it relates to items recognized directly in other comprehensive income or below equity, in which case it is recognized in other comprehensive income or below equity.
Current
Provision for current tax is the expected tax payable on the taxable profit for the year using tax rates applicable at the date of unconsolidated statement of financial position and any adjustment to tax payable for previous years.
Deferred
Deferred tax is provided for by using the balance sheet liability method, providing for temporary differences between the carrying amounts of assets and liabilities for financial reporting purposes and the amount used for taxation purposes. The amount of deferred tax provided is based on the expected manner of realization or settlement of the carrying amount of assets and liabilities using tax rates enacted or substantively enacted at the date of unconsolidated statement of financial position. A deferred tax asset is recognized only to the extent that it is probable that the future taxable profit will be available and credits can be utilized. Deferred tax assets are reduced to the extent it is no longer probable that the related tax benefit will be realized.
Deferred tax, on revaluation of investments, if any, is recognized as an adjustment to surplus / (deficit) arising on such revaluation.
5.10 Staff retirement benefits
Defined benefit plan
The Bank operates an approved funded gratuity scheme for all its regular employees. Contributions are made in accordance with the actuarial recommendation. The actuarial valuation is carried out periodically using “Projected Unit Credit Method”.
Defined contribution plan
The Bank operates a recognized provident fund scheme for all its regular employees for which equal monthly contributions are made both by the Bank and by the employees at the rate of 8.33% of the basic salary of the employee.
66
Compensated absences
The Bank provides compensated absences to all its regular employees. Liability for unfunded scheme is recognized on the basis of actuarial valuation using the “Projected Unit Credit Method”. Provision for the year is charged to unconsolidated profit and loss account. The amount recognized in the unconsolidated statement of financial position represents the present value of defined benefit obligations.
5.11 Revenue recognition
Mark-up / interest on advances and return on investments is recognized on accrual basis except on classified advances and investments which is recognized on receipt basis. Mark-up / interest on rescheduled / restructured advances and investments is recognized as permitted by the regulations of the SBP or overseas regulatory authority of the country where branch operates, except where in the opinion of the management it would not be prudent to do so.
Fees, commission and brokerage income is recognized at the time of performance of service.
Dividend income is recognized when Bank’s right to receive the income is established.
Gains and losses on sale of investments are included in income currently.
Financing method is used in accounting for income from lease financing. Under this method, the unearned lease income (excess of the sum of the total lease rentals and estimated residual value over the cost of leased assets) is deferred and taken to income over the term of the lease period so as to produce a constant periodic rate of return on the outstanding net investment in lease. Repossessed vehicles on account of loan default are recorded in memorandum account.
Unrealized lease income is suspended on classified leases, in accordance with the requirements of the Prudential Regulations issued by the SBP. Gains / losses on termination of lease contracts, documentation charges, front-end fees and other lease income are recognized as income on receipt basis.
Profit on Murabaha sale transaction not due for the payment is deferred by recording a credit to the “Deferred Murabaha Income” account.
Profits on Musharaka and Diminishing Musharaka financings are recognized on accrual basis. Profit required to be suspended in compliance with the Prudential Regulations issued by the SBP is recorded on receipt basis.
Revenue on Salam finance is recognized at the time of sale of al-muslam fihi (salam goods).
The rentals received / receivable on Ijarahs under IFAS-2 are recorded as income / revenue.
The Bank recognizes revenue on Istisna finance at the time of sale of Al-Masnoo (Istisna Goods).
5.12 Foreign currencies
Foreign currency transactions
Foreign currency transactions are translated into Pak. Rupee at the exchange rates prevailing on the date of transaction. Monetary assets and liabilities in foreign currencies are translated to Pak. Rupee at the exchange rates prevailing at the reporting date. Outstanding foreign bills purchased are valued at the rates applicable to the remaining maturities. Exchange gains and losses are included in unconsolidated profit and loss account currently.
Foreign operation
The assets and liabilities of Wholesale Bank Branch are translated to Pak. Rupee at exchange rates prevailing at the date of unconsolidated statement of financial position. The results of foreign operations are translated at the average rate of exchange for the year.
Translation gains and losses
Translation gains and losses arising on revaluation of net investment in foreign operations are taken to equity under “Exchange Translation Reserve” through other comprehensive income and on disposal are recognized in unconsolidated profit and loss account.
Commitments
Commitments for outstanding forward foreign exchange contracts are valued at the rates applicable to the remaining maturities.
5.13 Provisions
Provisions are recognized when there are present, legal or constructive obligations as a result of past events, it is probable that an outflow of resources embodying economic benefits will be required to settle the obligation and a reliable estimate of the amounts can be made. Provision for guarantee claims and other off balance sheet obligations is recognized when intimated and reasonable certainty exists to settle the obligations. Expected recoveries are recognized by debiting customer accounts. Charge to unconsolidated profit and loss account is stated net off expected recoveries.
Notes to the Unconsolidated Financial StatementsFor the year ended December 31, 2015
67
Annual Report of Askari Bank Limited for 2015
5.14 Off-setting
Financial assets and financial liabilities are only set-off and the net amount is reported in the unconsolidated financial statements when there is a legally enforceable right to set-off the recognized amount and the Bank intends either to settle on a net basis, or to realize the assets and to settle the liabilities simultaneously.
5.15 Financial assets and liabilities
Financial assets and financial liabilities are recognized at the time when the Bank becomes a party to the contractual provision of the instrument. Financial assets are de-recognized when the contractual right to future cash flows from the asset expires or is transferred along with the risk and reward of the asset. Financial liabilities are de-recognized when obligation specific in the contract is discharged, cancelled or expired. Any gain or loss on de-recognition of the financial asset and liability is recognized in the profit and loss account of the current period. The particular recognition and subsequent measurement methods adopted for significant financial assets and financial liabilities are disclosed in the individual policy statements associated with them.
5.16 Derivative financial instruments
Derivative financial instruments are initially recognized at fair value on the date on which the derivative contract is entered into and are subsequently remeasured at fair value using appropriate valuation techniques. All derivative financial instruments are carried as assets when fair value is positive and liabilities when fair value is negative. Any change in the fair value of derivative financial instruments is taken to the profit and loss account.
5.17 Appropriations subsequent to date of unconsolidated statement of financial position
Appropriations subsequent to year end are recognized during the year in which those appropriations are made.
5.18 Segment reporting
A segment is a distinguishable component of the Bank that is engaged in providing products or services (business segment) or in providing product or services within a particular economic environment (geographical segment), which is subject to risks and rewards that are different from those of other segments. The Bank’s primary format of reporting is based on business segments.
5.18.1 Business segment
Corporate finance
Corporate financing includes corporate and investment banking activities such as mergers and acquisition, underwriting, privatization, securitization, IPO’s related activities and secondary private placements.
Trading and Sales
Trading and sales includes the Bank’s treasury and money market activities.
Retail Banking
Retail banking segment provides services to small borrowers and include loans, deposits and other transactions with retail customers and credit card business.
Commercial Banking
Commercial banking segment provides services related to project finance, export finance, trade finance, leasing, lending, guarantees, bills of exchange and deposits from corporate customers.
Payment and settlement
Payment and settlement includes income from payments and collections, funds transfer, clearing and settlement.
Agency services
Agency services include income from rent of lockers provided to customers.
5.18.2 Geographical segments
The Bank operates in two geographic regions; Pakistan and the Middle East.
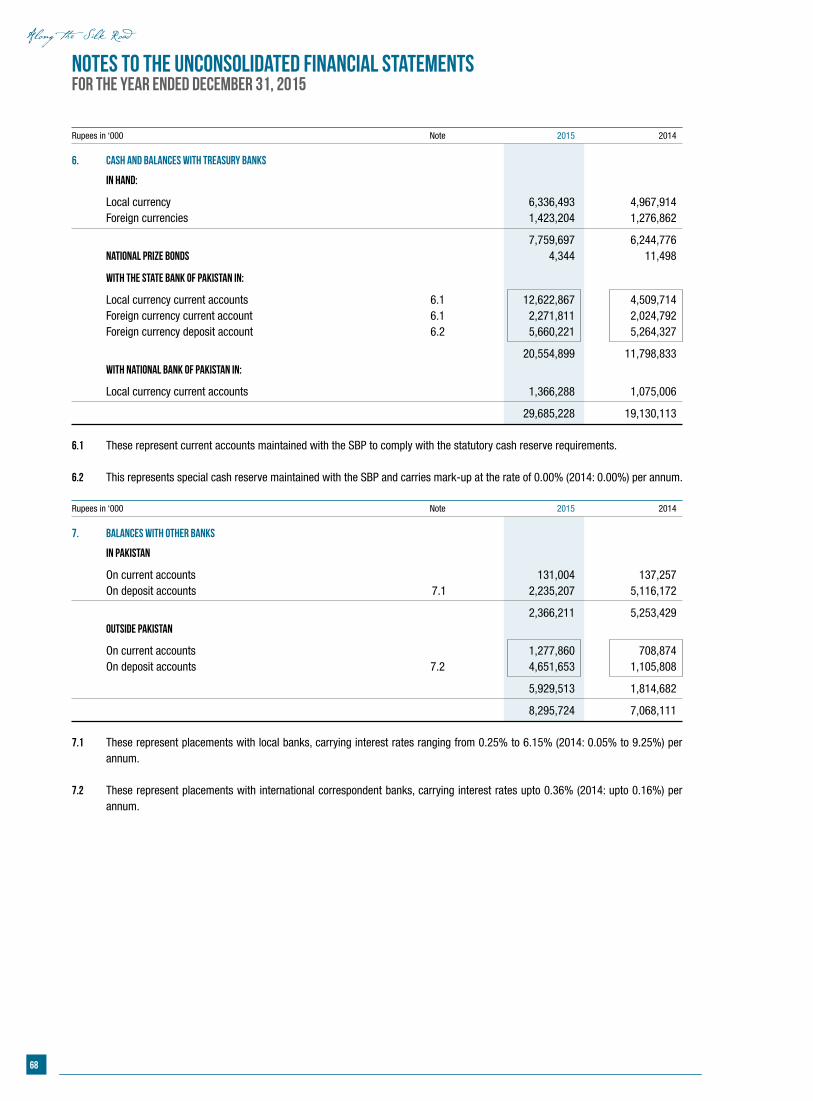
68
Notes to the Unconsolidated Financial StatementsFor the year ended December 31, 2015
Rupees in ‘000 Note 2015 2014
6. CASH AND BALANCES WITH TREASURY BANKS
In Hand:
Local currency 6,336,493 4,967,914 Foreign currencies 1,423,204 1,276,862
7,759,697 6,244,776 National Prize Bonds 4,344 11,498
With the State Bank of Pakistan in:
Local currency current accounts 6.1 12,622,867 4,509,714 Foreign currency current account 6.1 2,271,811 2,024,792 Foreign currency deposit account 6.2 5,660,221 5,264,327
20,554,899 11,798,833 With National Bank of Pakistan in:
Local currency current accounts 1,366,288 1,075,006
29,685,228 19,130,113 6.1 These represent current accounts maintained with the SBP to comply with the statutory cash reserve requirements. 6.2 This represents special cash reserve maintained with the SBP and carries mark-up at the rate of 0.00% (2014: 0.00%) per annum.
Rupees in ‘000 Note 2015 2014
7. BALANCES WITH OTHER BANKS
In Pakistan
On current accounts 131,004 137,257 On deposit accounts 7.1 2,235,207 5,116,172
2,366,211 5,253,429 Outside Pakistan
On current accounts 1,277,860 708,874 On deposit accounts 7.2 4,651,653 1,105,808
5,929,513 1,814,682
8,295,724 7,068,111 7.1 These represent placements with local banks, carrying interest rates ranging from 0.25% to 6.15% (2014: 0.05% to 9.25%) per
annum. 7.2 These represent placements with international correspondent banks, carrying interest rates upto 0.36% (2014: upto 0.16%) per
annum.
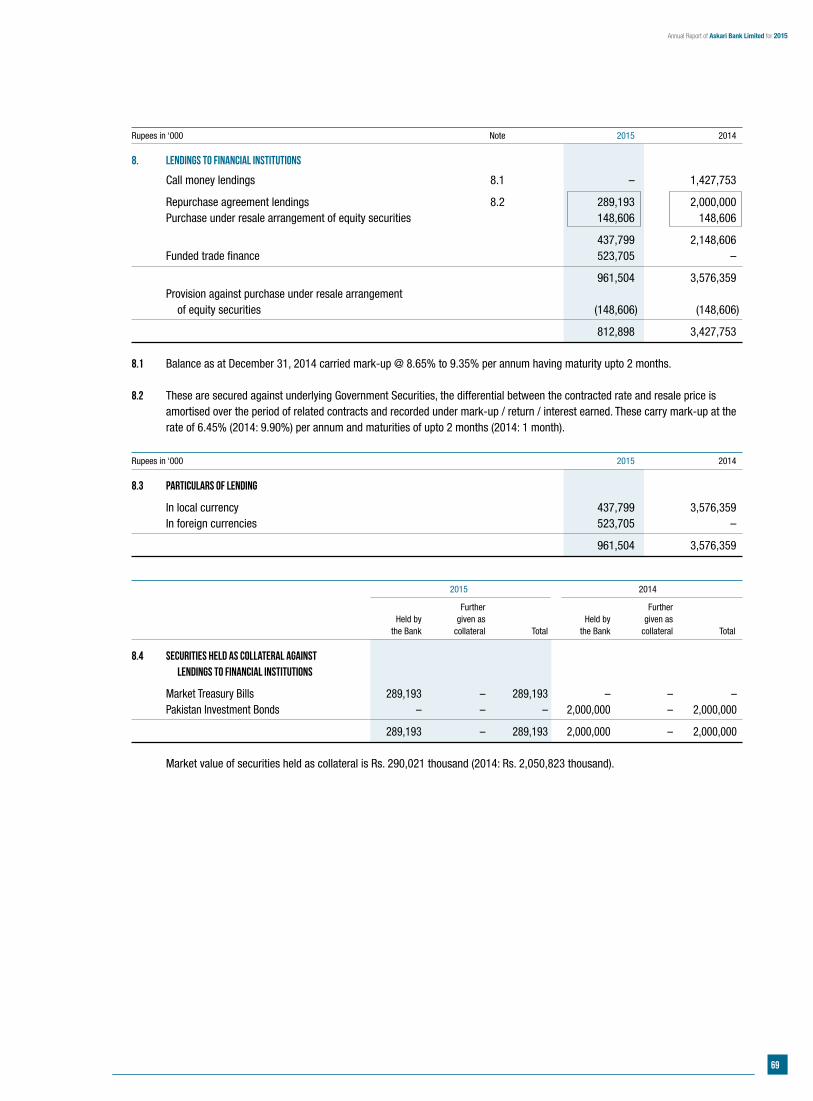
69
Annual Report of Askari Bank Limited for 2015
Rupees in ‘000 Note 2015 2014
8. LENDINGS TO FINANCIAL INSTITUTIONS
Call money lendings 8.1 – 1,427,753
Repurchase agreement lendings 8.2 289,193 2,000,000 Purchase under resale arrangement of equity securities 148,606 148,606
437,799 2,148,606 Funded trade finance 523,705 –
961,504 3,576,359 Provision against purchase under resale arrangement of equity securities (148,606) (148,606)
812,898 3,427,753
8.1 Balance as at December 31, 2014 carried mark-up @ 8.65% to 9.35% per annum having maturity upto 2 months. 8.2 These are secured against underlying Government Securities, the differential between the contracted rate and resale price is
amortised over the period of related contracts and recorded under mark-up / return / interest earned. These carry mark-up at the rate of 6.45% (2014: 9.90%) per annum and maturities of upto 2 months (2014: 1 month).
Rupees in ‘000 2015 2014
8.3 Particulars of lending
In local currency 437,799 3,576,359 In foreign currencies 523,705 –
961,504 3,576,359 2015 2014
Further Further Held by given as Held by given as the Bank collateral Total the Bank collateral Total
8.4 Securities held as collateral against lendings to financial institutions
Market Treasury Bills 289,193 – 289,193 – – – Pakistan Investment Bonds – – – 2,000,000 – 2,000,000
289,193 – 289,193 2,000,000 – 2,000,000 Market value of securities held as collateral is Rs. 290,021 thousand (2014: Rs. 2,050,823 thousand).
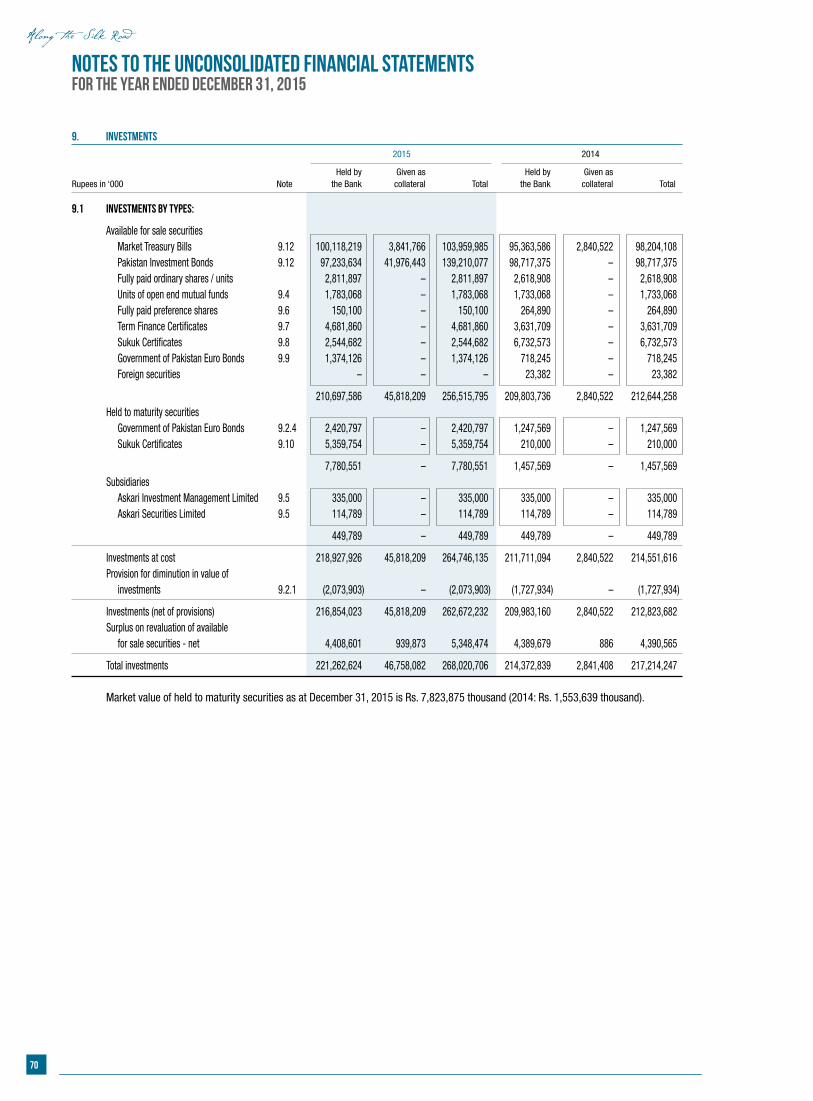
70
Notes to the Unconsolidated Financial StatementsFor the year ended December 31, 2015
9. INVESTMENTS
2015 2014
Held by Given as Held by Given asRupees in ‘000 Note the Bank collateral Total the Bank collateral Total
9.1 Investments by types:
Available for sale securities Market Treasury Bills 9.12 100,118,219 3,841,766 103,959,985 95,363,586 2,840,522 98,204,108 Pakistan Investment Bonds 9.12 97,233,634 41,976,443 139,210,077 98,717,375 – 98,717,375 Fully paid ordinary shares / units 2,811,897 – 2,811,897 2,618,908 – 2,618,908 Units of open end mutual funds 9.4 1,783,068 – 1,783,068 1,733,068 – 1,733,068 Fully paid preference shares 9.6 150,100 – 150,100 264,890 – 264,890 Term Finance Certificates 9.7 4,681,860 – 4,681,860 3,631,709 – 3,631,709 Sukuk Certificates 9.8 2,544,682 – 2,544,682 6,732,573 – 6,732,573 Government of Pakistan Euro Bonds 9.9 1,374,126 – 1,374,126 718,245 – 718,245 Foreign securities – – – 23,382 – 23,382
210,697,586 45,818,209 256,515,795 209,803,736 2,840,522 212,644,258 Held to maturity securities Government of Pakistan Euro Bonds 9.2.4 2,420,797 – 2,420,797 1,247,569 – 1,247,569 Sukuk Certificates 9.10 5,359,754 – 5,359,754 210,000 – 210,000
7,780,551 – 7,780,551 1,457,569 – 1,457,569 Subsidiaries Askari Investment Management Limited 9.5 335,000 – 335,000 335,000 – 335,000 Askari Securities Limited 9.5 114,789 – 114,789 114,789 – 114,789
449,789 – 449,789 449,789 – 449,789
Investments at cost 218,927,926 45,818,209 264,746,135 211,711,094 2,840,522 214,551,616 Provision for diminution in value of investments 9.2.1 (2,073,903) – (2,073,903) (1,727,934) – (1,727,934)
Investments (net of provisions) 216,854,023 45,818,209 262,672,232 209,983,160 2,840,522 212,823,682 Surplus on revaluation of available for sale securities - net 4,408,601 939,873 5,348,474 4,389,679 886 4,390,565
Total investments 221,262,624 46,758,082 268,020,706 214,372,839 2,841,408 217,214,247 Market value of held to maturity securities as at December 31, 2015 is Rs. 7,823,875 thousand (2014: Rs. 1,553,639 thousand).
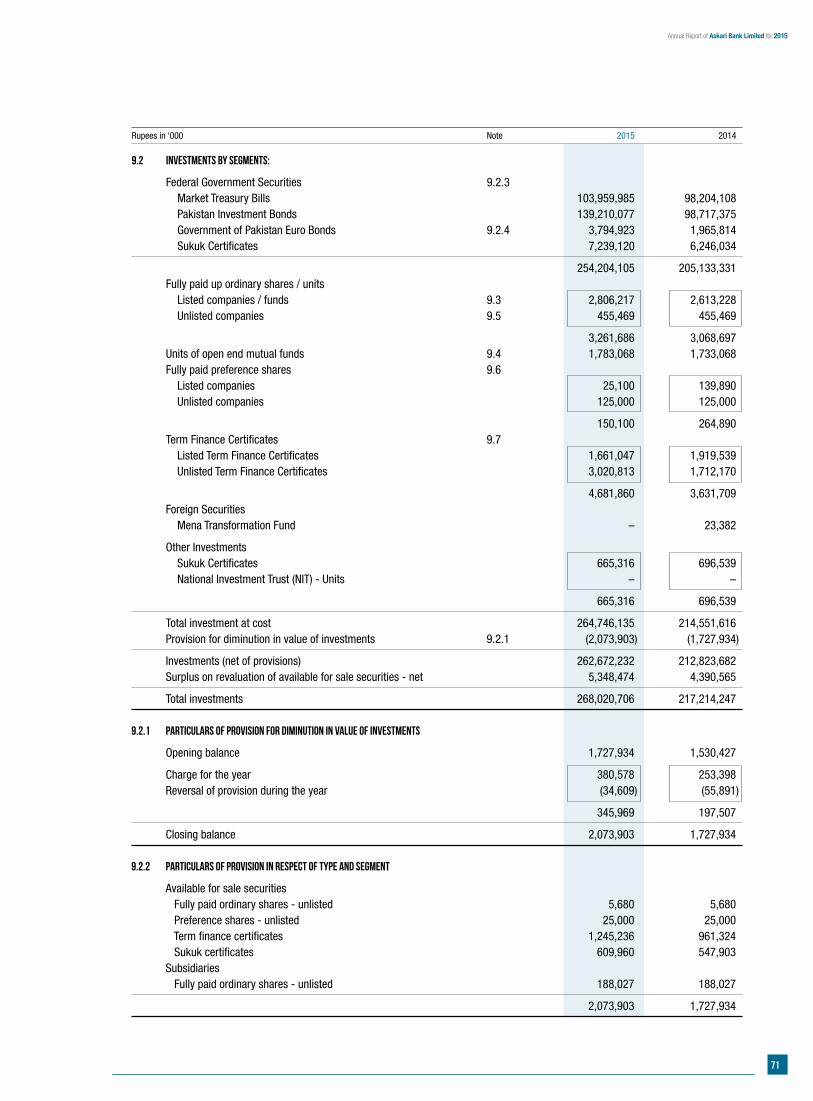
71
Annual Report of Askari Bank Limited for 2015
Rupees in ‘000 Note 2015 2014
9.2 Investments by segments:
Federal Government Securities 9.2.3 Market Treasury Bills 103,959,985 98,204,108 Pakistan Investment Bonds 139,210,077 98,717,375 Government of Pakistan Euro Bonds 9.2.4 3,794,923 1,965,814 Sukuk Certificates 7,239,120 6,246,034
254,204,105 205,133,331 Fully paid up ordinary shares / units Listed companies / funds 9.3 2,806,217 2,613,228 Unlisted companies 9.5 455,469 455,469
3,261,686 3,068,697 Units of open end mutual funds 9.4 1,783,068 1,733,068 Fully paid preference shares 9.6 Listed companies 25,100 139,890 Unlisted companies 125,000 125,000
150,100 264,890 Term Finance Certificates 9.7 Listed Term Finance Certificates 1,661,047 1,919,539 Unlisted Term Finance Certificates 3,020,813 1,712,170
4,681,860 3,631,709 Foreign Securities Mena Transformation Fund – 23,382
Other Investments Sukuk Certificates 665,316 696,539 National Investment Trust (NIT) - Units – –
665,316 696,539
Total investment at cost 264,746,135 214,551,616 Provision for diminution in value of investments 9.2.1 (2,073,903) (1,727,934)
Investments (net of provisions) 262,672,232 212,823,682 Surplus on revaluation of available for sale securities - net 5,348,474 4,390,565
Total investments 268,020,706 217,214,247 9.2.1 Particulars of provision for diminution in value of investments
Opening balance 1,727,934 1,530,427
Charge for the year 380,578 253,398 Reversal of provision during the year (34,609) (55,891)
345,969 197,507
Closing balance 2,073,903 1,727,934 9.2.2 Particulars of provision in respect of type and segment
Available for sale securities Fully paid ordinary shares - unlisted 5,680 5,680 Preference shares - unlisted 25,000 25,000 Term finance certificates 1,245,236 961,324 Sukuk certificates 609,960 547,903 Subsidiaries Fully paid ordinary shares - unlisted 188,027 188,027
2,073,903 1,727,934
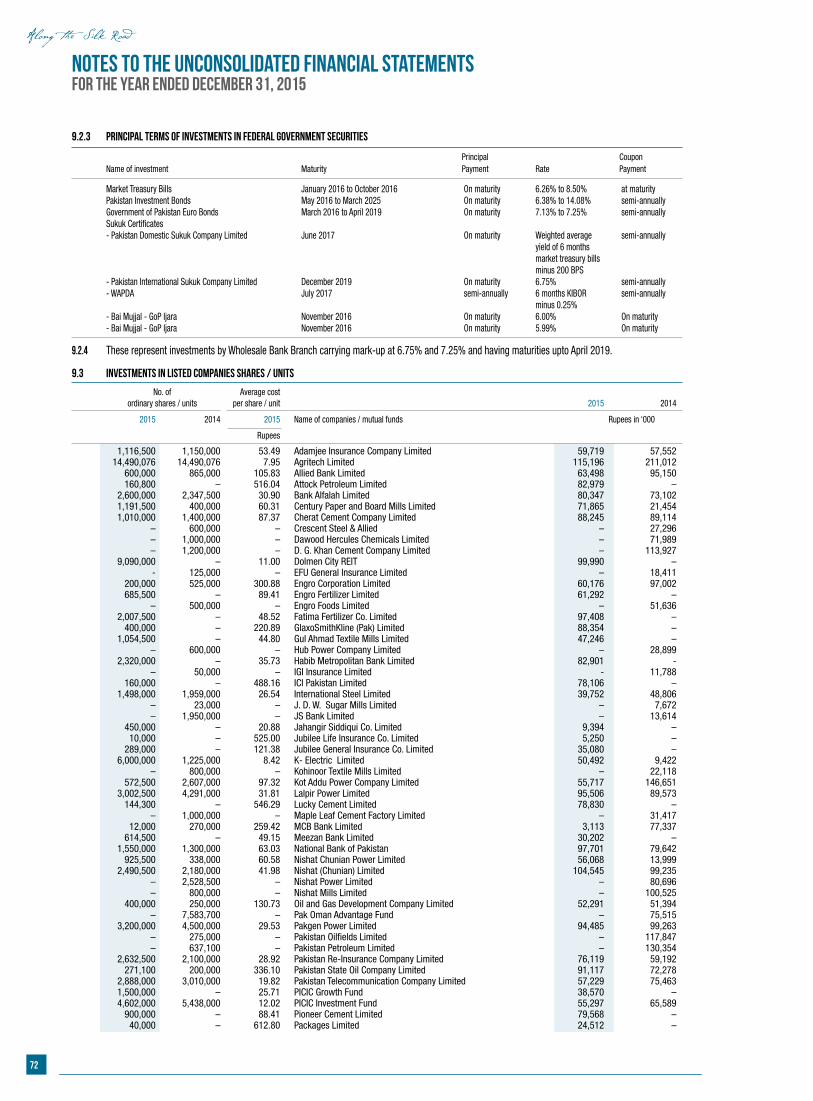
72
9.2.3 Principal terms of investments in Federal Government Securities
Principal Coupon Name of investment Maturity Payment Rate Payment
Market Treasury Bills January 2016 to October 2016 On maturity 6.26% to 8.50% at maturity Pakistan Investment Bonds May 2016 to March 2025 On maturity 6.38% to 14.08% semi-annually Government of Pakistan Euro Bonds March 2016 to April 2019 On maturity 7.13% to 7.25% semi-annually Sukuk Certificates - Pakistan Domestic Sukuk Company Limited June 2017 On maturity Weighted average semi-annually yield of 6 months market treasury bills minus 200 BPS - Pakistan International Sukuk Company Limited December 2019 On maturity 6.75% semi-annually - WAPDA July 2017 semi-annually 6 months KIBOR semi-annually minus 0.25% - Bai Mujjal - GoP Ijara November 2016 On maturity 6.00% On maturity - Bai Mujjal - GoP Ijara November 2016 On maturity 5.99% On maturity 9.2.4 These represent investments by Wholesale Bank Branch carrying mark-up at 6.75% and 7.25% and having maturities upto April 2019.
9.3 Investments in listed companies shares / units
No. of Average cost ordinary shares / units per share / unit 2015 2014
2015 2014 2015 Name of companies / mutual funds Rupees in ‘000
Rupees
1,116,500 1,150,000 53.49 Adamjee Insurance Company Limited 59,719 57,552 14,490,076 14,490,076 7.95 Agritech Limited 115,196 211,012 600,000 865,000 105.83 Allied Bank Limited 63,498 95,150 160,800 – 516.04 Attock Petroleum Limited 82,979 – 2,600,000 2,347,500 30.90 Bank Alfalah Limited 80,347 73,102 1,191,500 400,000 60.31 Century Paper and Board Mills Limited 71,865 21,454 1,010,000 1,400,000 87.37 Cherat Cement Company Limited 88,245 89,114 – 600,000 – Crescent Steel & Allied – 27,296 – 1,000,000 – Dawood Hercules Chemicals Limited – 71,989 – 1,200,000 – D. G. Khan Cement Company Limited – 113,927 9,090,000 – 11.00 Dolmen City REIT 99,990 – - 125,000 – EFU General Insurance Limited – 18,411 200,000 525,000 300.88 Engro Corporation Limited 60,176 97,002 685,500 – 89.41 Engro Fertilizer Limited 61,292 – – 500,000 – Engro Foods Limited – 51,636 2,007,500 – 48.52 Fatima Fertilizer Co. Limited 97,408 – 400,000 – 220.89 GlaxoSmithKline (Pak) Limited 88,354 – 1,054,500 – 44.80 Gul Ahmad Textile Mills Limited 47,246 – – 600,000 – Hub Power Company Limited – 28,899 2,320,000 – 35.73 Habib Metropolitan Bank Limited 82,901 - – 50,000 – IGI Insurance Limited - 11,788 160,000 – 488.16 ICI Pakistan Limited 78,106 – 1,498,000 1,959,000 26.54 International Steel Limited 39,752 48,806 – 23,000 – J. D. W. Sugar Mills Limited – 7,672 – 1,950,000 – JS Bank Limited – 13,614 450,000 – 20.88 Jahangir Siddiqui Co. Limited 9,394 – 10,000 – 525.00 Jubilee Life Insurance Co. Limited 5,250 – 289,000 – 121.38 Jubilee General Insurance Co. Limited 35,080 – 6,000,000 1,225,000 8.42 K- Electric Limited 50,492 9,422 – 800,000 – Kohinoor Textile Mills Limited – 22,118 572,500 2,607,000 97.32 Kot Addu Power Company Limited 55,717 146,651 3,002,500 4,291,000 31.81 Lalpir Power Limited 95,506 89,573 144,300 – 546.29 Lucky Cement Limited 78,830 – – 1,000,000 – Maple Leaf Cement Factory Limited – 31,417 12,000 270,000 259.42 MCB Bank Limited 3,113 77,337 614,500 – 49.15 Meezan Bank Limited 30,202 – 1,550,000 1,300,000 63.03 National Bank of Pakistan 97,701 79,642 925,500 338,000 60.58 Nishat Chunian Power Limited 56,068 13,999 2,490,500 2,180,000 41.98 Nishat (Chunian) Limited 104,545 99,235 – 2,528,500 – Nishat Power Limited – 80,696 – 800,000 – Nishat Mills Limited – 100,525 400,000 250,000 130.73 Oil and Gas Development Company Limited 52,291 51,394 – 7,583,700 – Pak Oman Advantage Fund – 75,515 3,200,000 4,500,000 29.53 Pakgen Power Limited 94,485 99,263 – 275,000 – Pakistan Oilfields Limited – 117,847 – 637,100 – Pakistan Petroleum Limited – 130,354 2,632,500 2,100,000 28.92 Pakistan Re-Insurance Company Limited 76,119 59,192 271,100 200,000 336.10 Pakistan State Oil Company Limited 91,117 72,278 2,888,000 3,010,000 19.82 Pakistan Telecommunication Company Limited 57,229 75,463 1,500,000 – 25.71 PICIC Growth Fund 38,570 – 4,602,000 5,438,000 12.02 PICIC Investment Fund 55,297 65,589 900,000 – 88.41 Pioneer Cement Limited 79,568 – 40,000 – 612.80 Packages Limited 24,512 –
Notes to the Unconsolidated Financial StatementsFor the year ended December 31, 2015
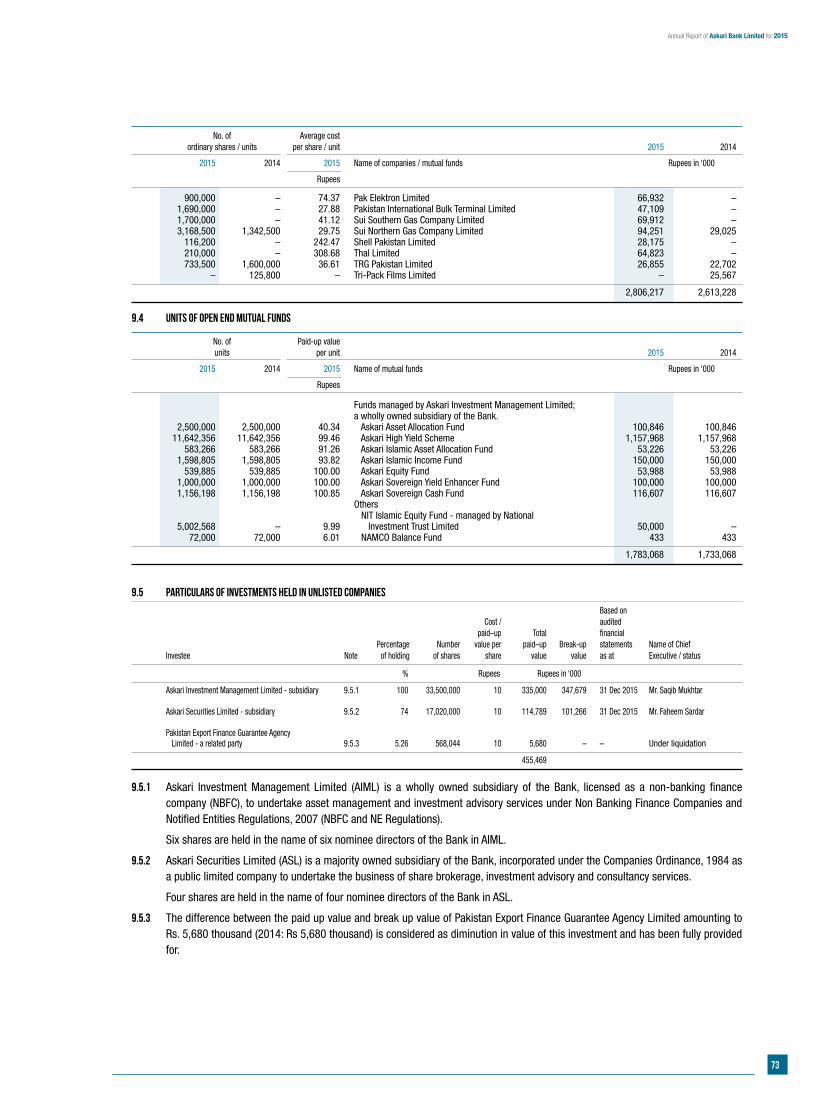
73
Annual Report of Askari Bank Limited for 2015
No. of Average cost ordinary shares / units per share / unit 2015 2014
2015 2014 2015 Name of companies / mutual funds Rupees in ‘000
Rupees
No. of Paid-up value units per unit 2015 2014
2015 2014 2015 Name of mutual funds Rupees in ‘000
Rupees
900,000 – 74.37 Pak Elektron Limited 66,932 – 1,690,000 – 27.88 Pakistan International Bulk Terminal Limited 47,109 – 1,700,000 – 41.12 Sui Southern Gas Company Limited 69,912 – 3,168,500 1,342,500 29.75 Sui Northern Gas Company Limited 94,251 29,025 116,200 – 242.47 Shell Pakistan Limited 28,175 – 210,000 – 308.68 Thal Limited 64,823 – 733,500 1,600,000 36.61 TRG Pakistan Limited 26,855 22,702 – 125,800 – Tri-Pack Films Limited – 25,567
2,806,217 2,613,228
9.4 Units of open end mutual funds
Funds managed by Askari Investment Management Limited; a wholly owned subsidiary of the Bank. 2,500,000 2,500,000 40.34 Askari Asset Allocation Fund 100,846 100,846 11,642,356 11,642,356 99.46 Askari High Yield Scheme 1,157,968 1,157,968 583,266 583,266 91.26 Askari Islamic Asset Allocation Fund 53,226 53,226 1,598,805 1,598,805 93.82 Askari Islamic Income Fund 150,000 150,000 539,885 539,885 100.00 Askari Equity Fund 53,988 53,988 1,000,000 1,000,000 100.00 Askari Sovereign Yield Enhancer Fund 100,000 100,000 1,156,198 1,156,198 100.85 Askari Sovereign Cash Fund 116,607 116,607 Others NIT Islamic Equity Fund - managed by National 5,002,568 – 9.99 Investment Trust Limited 50,000 – 72,000 72,000 6.01 NAMCO Balance Fund 433 433
1,783,068 1,733,068
9.5 Particulars of investments held in unlisted companies
Based on Cost / audited paid–up Total financial Percentage Number value per paid–up Break-up statements Name of Chief Investee Note of holding of shares share value value as at Executive / status
% Rupees Rupees in ‘000
Askari Investment Management Limited - subsidiary 9.5.1 100 33,500,000 10 335,000 347,679 31 Dec 2015 Mr. Saqib Mukhtar Askari Securities Limited - subsidiary 9.5.2 74 17,020,000 10 114,789 101,266 31 Dec 2015 Mr. Faheem Sardar Pakistan Export Finance Guarantee Agency Limited - a related party 9.5.3 5.26 568,044 10 5,680 – – Under liquidation
455,469
9.5.1 Askari Investment Management Limited (AIML) is a wholly owned subsidiary of the Bank, licensed as a non-banking finance company (NBFC), to undertake asset management and investment advisory services under Non Banking Finance Companies and Notified Entities Regulations, 2007 (NBFC and NE Regulations).
Six shares are held in the name of six nominee directors of the Bank in AIML.
9.5.2 Askari Securities Limited (ASL) is a majority owned subsidiary of the Bank, incorporated under the Companies Ordinance, 1984 as a public limited company to undertake the business of share brokerage, investment advisory and consultancy services.
Four shares are held in the name of four nominee directors of the Bank in ASL.
9.5.3 The difference between the paid up value and break up value of Pakistan Export Finance Guarantee Agency Limited amounting to Rs. 5,680 thousand (2014: Rs 5,680 thousand) is considered as diminution in value of this investment and has been fully provided for.
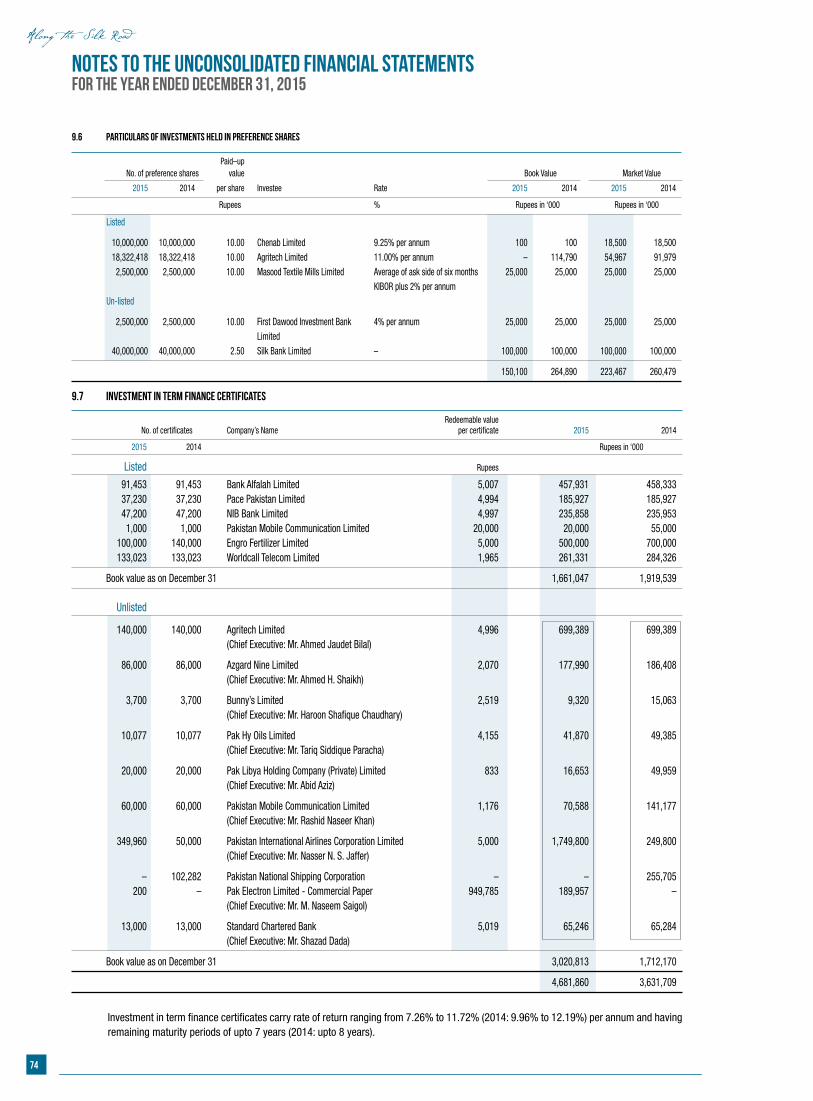
74
Notes to the Unconsolidated Financial StatementsFor the year ended December 31, 2015
9.6 Particulars of investments held in preference shares
Paid–up No. of preference shares value Book Value Market Value
2015 2014 per share Investee Rate 2015 2014 2015 2014
Rupees % Rupees in ‘000 Rupees in ‘000
Listed
10,000,000 10,000,000 10.00 Chenab Limited 9.25% per annum 100 100 18,500 18,500 18,322,418 18,322,418 10.00 Agritech Limited 11.00% per annum – 114,790 54,967 91,979 2,500,000 2,500,000 10.00 Masood Textile Mills Limited Average of ask side of six months 25,000 25,000 25,000 25,000 KIBOR plus 2% per annum Un-listed
2,500,000 2,500,000 10.00 First Dawood Investment Bank 4% per annum 25,000 25,000 25,000 25,000 Limited 40,000,000 40,000,000 2.50 Silk Bank Limited – 100,000 100,000 100,000 100,000
150,100 264,890 223,467 260,479
9.7 Investment in Term Finance Certificates
Redeemable value No. of certificates Company’s Name per certificate 2015 2014
2015 2014 Rupees in ‘000
Listed Rupees
91,453 91,453 Bank Alfalah Limited 5,007 457,931 458,333 37,230 37,230 Pace Pakistan Limited 4,994 185,927 185,927 47,200 47,200 NIB Bank Limited 4,997 235,858 235,953 1,000 1,000 Pakistan Mobile Communication Limited 20,000 20,000 55,000 100,000 140,000 Engro Fertilizer Limited 5,000 500,000 700,000 133,023 133,023 Worldcall Telecom Limited 1,965 261,331 284,326
Book value as on December 31 1,661,047 1,919,539
Unlisted
140,000 140,000 Agritech Limited 4,996 699,389 699,389 (Chief Executive: Mr. Ahmed Jaudet Bilal)
86,000 86,000 Azgard Nine Limited 2,070 177,990 186,408 (Chief Executive: Mr. Ahmed H. Shaikh)
3,700 3,700 Bunny’s Limited 2,519 9,320 15,063 (Chief Executive: Mr. Haroon Shafique Chaudhary)
10,077 10,077 Pak Hy Oils Limited 4,155 41,870 49,385 (Chief Executive: Mr. Tariq Siddique Paracha)
20,000 20,000 Pak Libya Holding Company (Private) Limited 833 16,653 49,959 (Chief Executive: Mr. Abid Aziz)
60,000 60,000 Pakistan Mobile Communication Limited 1,176 70,588 141,177 (Chief Executive: Mr. Rashid Naseer Khan)
349,960 50,000 Pakistan International Airlines Corporation Limited 5,000 1,749,800 249,800 (Chief Executive: Mr. Nasser N. S. Jaffer)
– 102,282 Pakistan National Shipping Corporation – – 255,705 200 – Pak Electron Limited - Commercial Paper 949,785 189,957 – (Chief Executive: Mr. M. Naseem Saigol)
13,000 13,000 Standard Chartered Bank 5,019 65,246 65,284 (Chief Executive: Mr. Shazad Dada)
Book value as on December 31 3,020,813 1,712,170
4,681,860 3,631,709
Investment in term finance certificates carry rate of return ranging from 7.26% to 11.72% (2014: 9.96% to 12.19%) per annum and having
remaining maturity periods of upto 7 years (2014: upto 8 years).
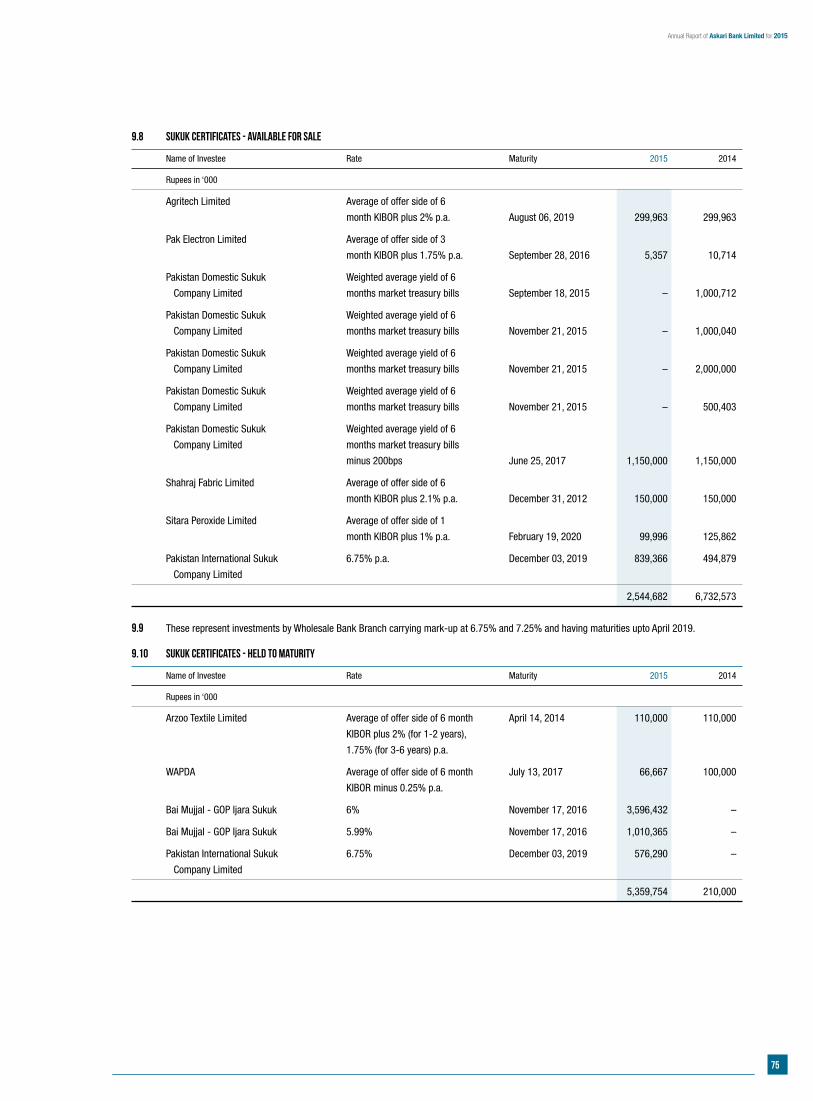
75
Annual Report of Askari Bank Limited for 2015
9.8 Sukuk Certificates - Available for sale
Name of Investee Rate Maturity 2015 2014
Rupees in ‘000
Agritech Limited Average of offer side of 6
month KIBOR plus 2% p.a. August 06, 2019 299,963 299,963
Pak Electron Limited Average of offer side of 3
month KIBOR plus 1.75% p.a. September 28, 2016 5,357 10,714
Pakistan Domestic Sukuk Weighted average yield of 6
Company Limited months market treasury bills September 18, 2015 – 1,000,712
Pakistan Domestic Sukuk Weighted average yield of 6
Company Limited months market treasury bills November 21, 2015 – 1,000,040
Pakistan Domestic Sukuk Weighted average yield of 6
Company Limited months market treasury bills November 21, 2015 – 2,000,000
Pakistan Domestic Sukuk Weighted average yield of 6
Company Limited months market treasury bills November 21, 2015 – 500,403
Pakistan Domestic Sukuk Weighted average yield of 6
Company Limited months market treasury bills
minus 200bps June 25, 2017 1,150,000 1,150,000
Shahraj Fabric Limited Average of offer side of 6
month KIBOR plus 2.1% p.a. December 31, 2012 150,000 150,000
Sitara Peroxide Limited Average of offer side of 1
month KIBOR plus 1% p.a. February 19, 2020 99,996 125,862
Pakistan International Sukuk 6.75% p.a. December 03, 2019 839,366 494,879
Company Limited
2,544,682 6,732,573
9.9 These represent investments by Wholesale Bank Branch carrying mark-up at 6.75% and 7.25% and having maturities upto April 2019.
Arzoo Textile Limited Average of offer side of 6 month April 14, 2014 110,000 110,000
KIBOR plus 2% (for 1-2 years),
1.75% (for 3-6 years) p.a.
WAPDA Average of offer side of 6 month July 13, 2017 66,667 100,000
KIBOR minus 0.25% p.a.
Bai Mujjal - GOP Ijara Sukuk 6% November 17, 2016 3,596,432 –
Bai Mujjal - GOP Ijara Sukuk 5.99% November 17, 2016 1,010,365 –
Pakistan International Sukuk 6.75% December 03, 2019 576,290 –
Company Limited
5,359,754 210,000
9.10 Sukuk Certificates - Held to maturity
Name of Investee Rate Maturity 2015 2014
Rupees in ‘000
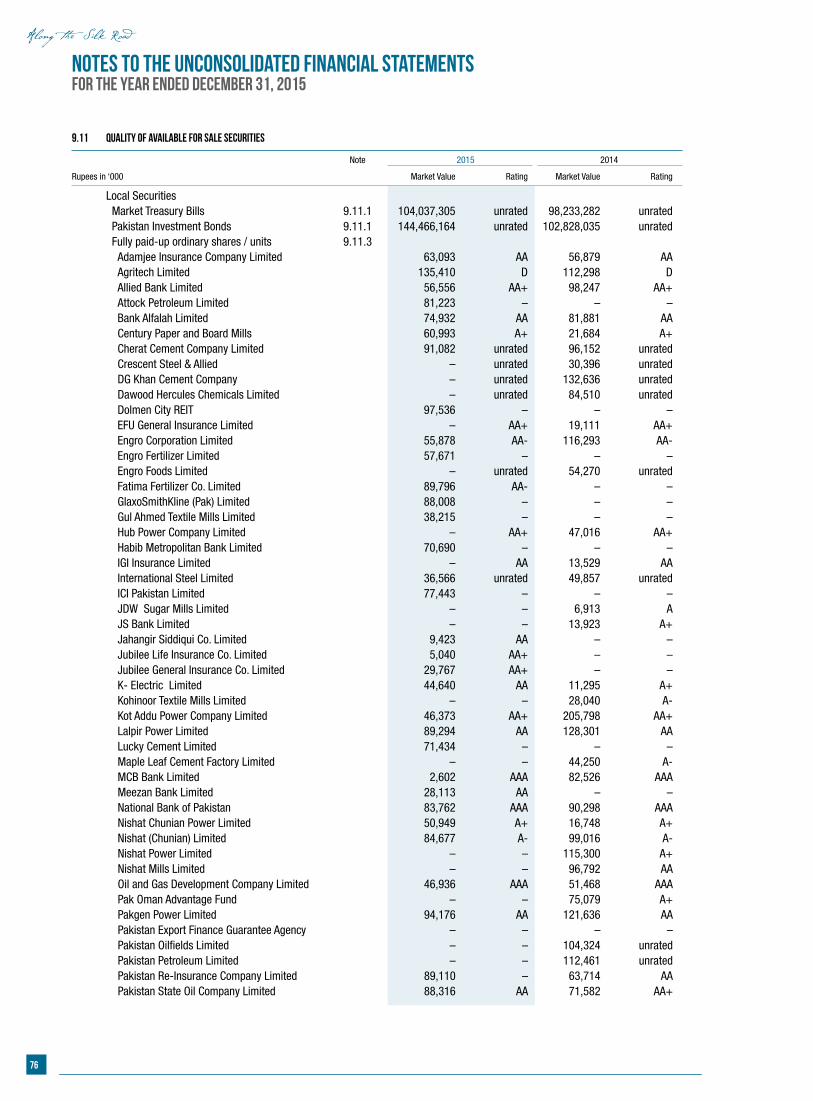
76
Notes to the Unconsolidated Financial StatementsFor the year ended December 31, 2015
9.11 Quality of available for sale securities
Note 2015 2014
Rupees in ‘000 Market Value Rating Market Value Rating
Local Securities Market Treasury Bills 9.11.1 104,037,305 unrated 98,233,282 unrated Pakistan Investment Bonds 9.11.1 144,466,164 unrated 102,828,035 unrated Fully paid-up ordinary shares / units 9.11.3 Adamjee Insurance Company Limited 63,093 AA 56,879 AA Agritech Limited 135,410 D 112,298 D Allied Bank Limited 56,556 AA+ 98,247 AA+ Attock Petroleum Limited 81,223 – – – Bank Alfalah Limited 74,932 AA 81,881 AA Century Paper and Board Mills 60,993 A+ 21,684 A+ Cherat Cement Company Limited 91,082 unrated 96,152 unrated Crescent Steel & Allied – unrated 30,396 unrated DG Khan Cement Company – unrated 132,636 unrated Dawood Hercules Chemicals Limited – unrated 84,510 unrated Dolmen City REIT 97,536 – – – EFU General Insurance Limited – AA+ 19,111 AA+ Engro Corporation Limited 55,878 AA- 116,293 AA- Engro Fertilizer Limited 57,671 – – – Engro Foods Limited – unrated 54,270 unrated Fatima Fertilizer Co. Limited 89,796 AA- – – GlaxoSmithKline (Pak) Limited 88,008 – – – Gul Ahmed Textile Mills Limited 38,215 – – –
Hub Power Company Limited – AA+ 47,016 AA+ Habib Metropolitan Bank Limited 70,690 – – – IGI Insurance Limited – AA 13,529 AA International Steel Limited 36,566 unrated 49,857 unrated ICI Pakistan Limited 77,443 – – – JDW Sugar Mills Limited – – 6,913 A JS Bank Limited – – 13,923 A+ Jahangir Siddiqui Co. Limited 9,423 AA – – Jubilee Life Insurance Co. Limited 5,040 AA+ – – Jubilee General Insurance Co. Limited 29,767 AA+ – – K- Electric Limited 44,640 AA 11,295 A+ Kohinoor Textile Mills Limited – – 28,040 A- Kot Addu Power Company Limited 46,373 AA+ 205,798 AA+ Lalpir Power Limited 89,294 AA 128,301 AA Lucky Cement Limited 71,434 – – – Maple Leaf Cement Factory Limited – – 44,250 A- MCB Bank Limited 2,602 AAA 82,526 AAA Meezan Bank Limited 28,113 AA – – National Bank of Pakistan 83,762 AAA 90,298 AAA Nishat Chunian Power Limited 50,949 A+ 16,748 A+ Nishat (Chunian) Limited 84,677 A- 99,016 A- Nishat Power Limited – – 115,300 A+ Nishat Mills Limited – – 96,792 AA Oil and Gas Development Company Limited 46,936 AAA 51,468 AAA Pak Oman Advantage Fund – – 75,079 A+ Pakgen Power Limited 94,176 AA 121,636 AA Pakistan Export Finance Guarantee Agency – – – – Pakistan Oilfields Limited – – 104,324 unrated Pakistan Petroleum Limited – – 112,461 unrated Pakistan Re-Insurance Company Limited 89,110 – 63,714 AA Pakistan State Oil Company Limited 88,316 AA 71,582 AA+
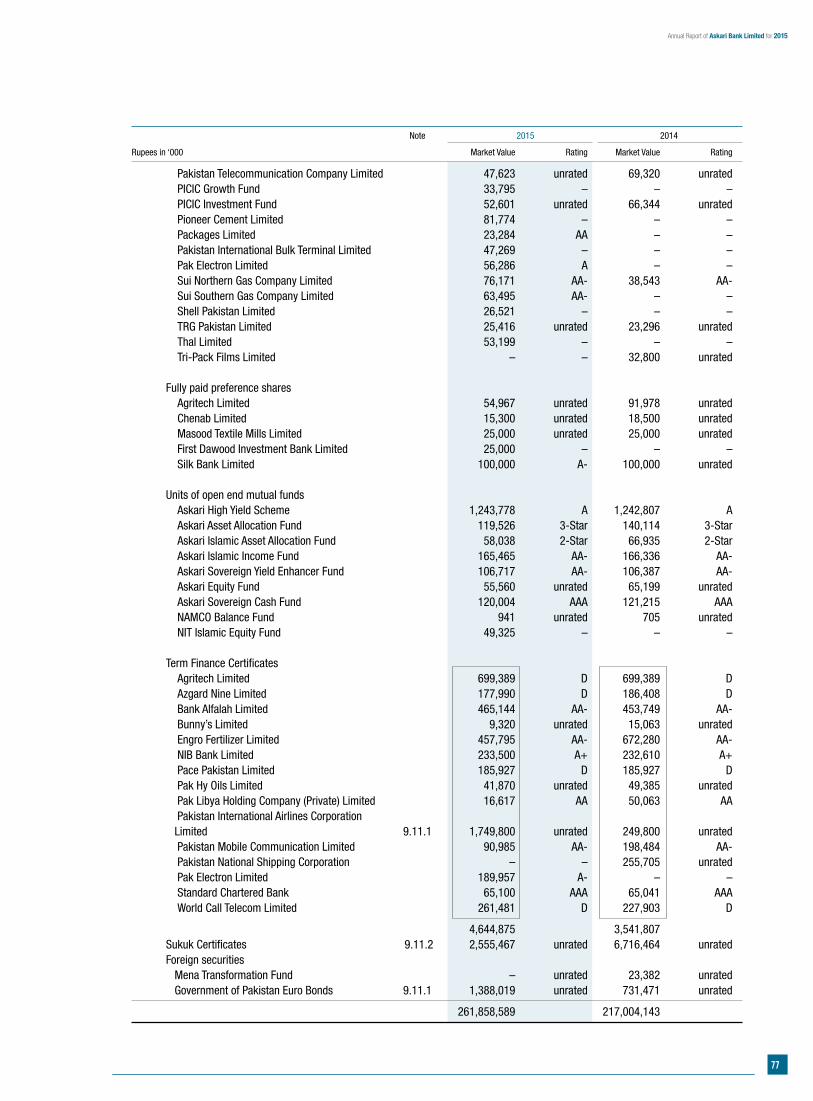
77
Annual Report of Askari Bank Limited for 2015
Note 2015 2014
Rupees in ‘000 Market Value Rating Market Value Rating
Pakistan Telecommunication Company Limited 47,623 unrated 69,320 unrated PICIC Growth Fund 33,795 – – – PICIC Investment Fund 52,601 unrated 66,344 unrated Pioneer Cement Limited 81,774 – – – Packages Limited 23,284 AA – – Pakistan International Bulk Terminal Limited 47,269 – – – Pak Electron Limited 56,286 A – – Sui Northern Gas Company Limited 76,171 AA- 38,543 AA- Sui Southern Gas Company Limited 63,495 AA- – – Shell Pakistan Limited 26,521 – – – TRG Pakistan Limited 25,416 unrated 23,296 unrated Thal Limited 53,199 – – – Tri-Pack Films Limited – – 32,800 unrated Fully paid preference shares Agritech Limited 54,967 unrated 91,978 unrated Chenab Limited 15,300 unrated 18,500 unrated Masood Textile Mills Limited 25,000 unrated 25,000 unrated First Dawood Investment Bank Limited 25,000 – – – Silk Bank Limited 100,000 A- 100,000 unrated Units of open end mutual funds Askari High Yield Scheme 1,243,778 A 1,242,807 A Askari Asset Allocation Fund 119,526 3-Star 140,114 3-Star Askari Islamic Asset Allocation Fund 58,038 2-Star 66,935 2-Star Askari Islamic Income Fund 165,465 AA- 166,336 AA- Askari Sovereign Yield Enhancer Fund 106,717 AA- 106,387 AA- Askari Equity Fund 55,560 unrated 65,199 unrated Askari Sovereign Cash Fund 120,004 AAA 121,215 AAA NAMCO Balance Fund 941 unrated 705 unrated NIT Islamic Equity Fund 49,325 – – –
Term Finance Certificates Agritech Limited 699,389 D 699,389 D Azgard Nine Limited 177,990 D 186,408 D Bank Alfalah Limited 465,144 AA- 453,749 AA- Bunny’s Limited 9,320 unrated 15,063 unrated Engro Fertilizer Limited 457,795 AA- 672,280 AA- NIB Bank Limited 233,500 A+ 232,610 A+ Pace Pakistan Limited 185,927 D 185,927 D Pak Hy Oils Limited 41,870 unrated 49,385 unrated Pak Libya Holding Company (Private) Limited 16,617 AA 50,063 AA Pakistan International Airlines Corporation Limited 9.11.1 1,749,800 unrated 249,800 unrated Pakistan Mobile Communication Limited 90,985 AA- 198,484 AA- Pakistan National Shipping Corporation – – 255,705 unrated Pak Electron Limited 189,957 A- – – Standard Chartered Bank 65,100 AAA 65,041 AAA World Call Telecom Limited 261,481 D 227,903 D
4,644,875 3,541,807 Sukuk Certificates 9.11.2 2,555,467 unrated 6,716,464 unrated Foreign securities Mena Transformation Fund – unrated 23,382 unrated Government of Pakistan Euro Bonds 9.11.1 1,388,019 unrated 731,471 unrated
261,858,589 217,004,143
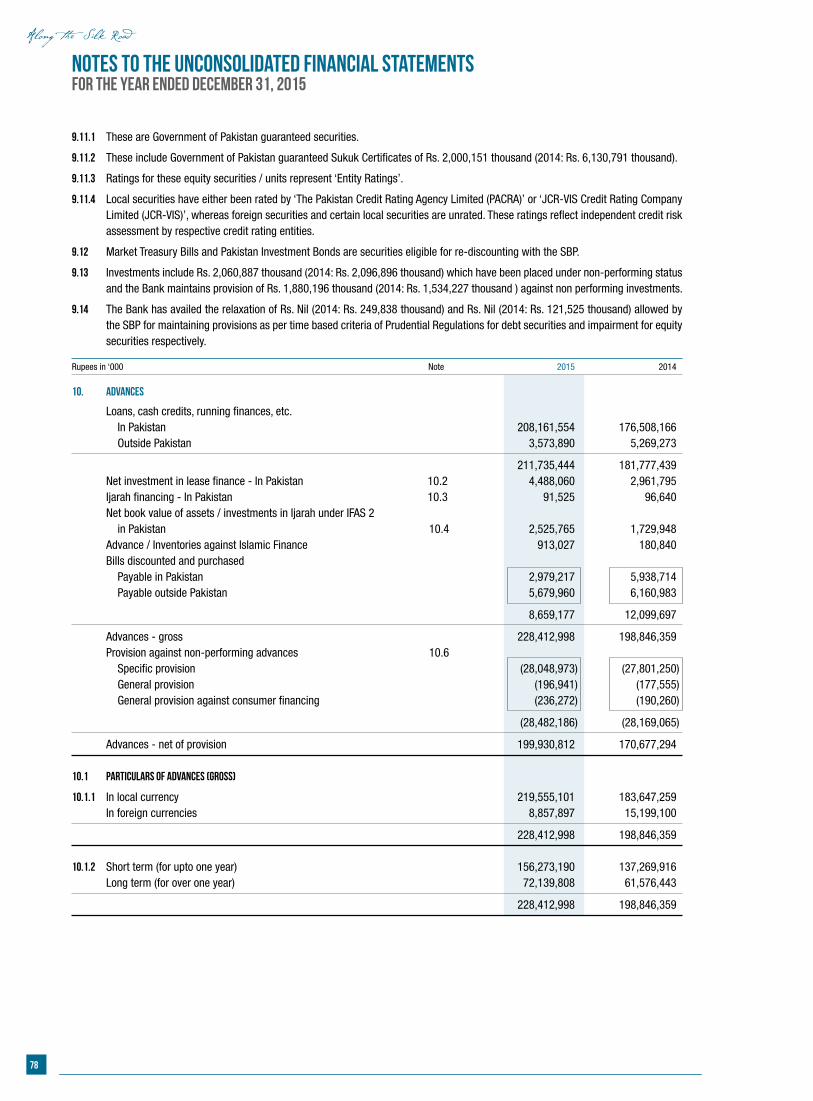
78
Notes to the Unconsolidated Financial StatementsFor the year ended December 31, 2015
9.11.1 These are Government of Pakistan guaranteed securities.
9.11.2 These include Government of Pakistan guaranteed Sukuk Certificates of Rs. 2,000,151 thousand (2014: Rs. 6,130,791 thousand).
9.11.3 Ratings for these equity securities / units represent ‘Entity Ratings’.
9.11.4 Local securities have either been rated by ‘The Pakistan Credit Rating Agency Limited (PACRA)’ or ‘JCR-VIS Credit Rating Company Limited (JCR-VIS)’, whereas foreign securities and certain local securities are unrated. These ratings reflect independent credit risk assessment by respective credit rating entities.
9.12 Market Treasury Bills and Pakistan Investment Bonds are securities eligible for re-discounting with the SBP.
9.13 Investments include Rs. 2,060,887 thousand (2014: Rs. 2,096,896 thousand) which have been placed under non-performing status and the Bank maintains provision of Rs. 1,880,196 thousand (2014: Rs. 1,534,227 thousand ) against non performing investments.
9.14 The Bank has availed the relaxation of Rs. Nil (2014: Rs. 249,838 thousand) and Rs. Nil (2014: Rs. 121,525 thousand) allowed by the SBP for maintaining provisions as per time based criteria of Prudential Regulations for debt securities and impairment for equity securities respectively.
Rupees in ‘000 Note 2015 2014
10. ADVANCES
Loans, cash credits, running finances, etc. In Pakistan 208,161,554 176,508,166 Outside Pakistan 3,573,890 5,269,273
211,735,444 181,777,439 Net investment in lease finance - In Pakistan 10.2 4,488,060 2,961,795 Ijarah financing - In Pakistan 10.3 91,525 96,640 Net book value of assets / investments in Ijarah under IFAS 2 in Pakistan 10.4 2,525,765 1,729,948 Advance / Inventories against Islamic Finance 913,027 180,840 Bills discounted and purchased Payable in Pakistan 2,979,217 5,938,714 Payable outside Pakistan 5,679,960 6,160,983
8,659,177 12,099,697
Advances - gross 228,412,998 198,846,359 Provision against non-performing advances 10.6 Specific provision (28,048,973) (27,801,250) General provision (196,941) (177,555) General provision against consumer financing (236,272) (190,260)
(28,482,186) (28,169,065)
Advances - net of provision 199,930,812 170,677,294 10.1 Particulars of advances (Gross)
10.1.1 In local currency 219,555,101 183,647,259 In foreign currencies 8,857,897 15,199,100
228,412,998 198,846,359 10.1.2 Short term (for upto one year) 156,273,190 137,269,916 Long term (for over one year) 72,139,808 61,576,443
228,412,998 198,846,359
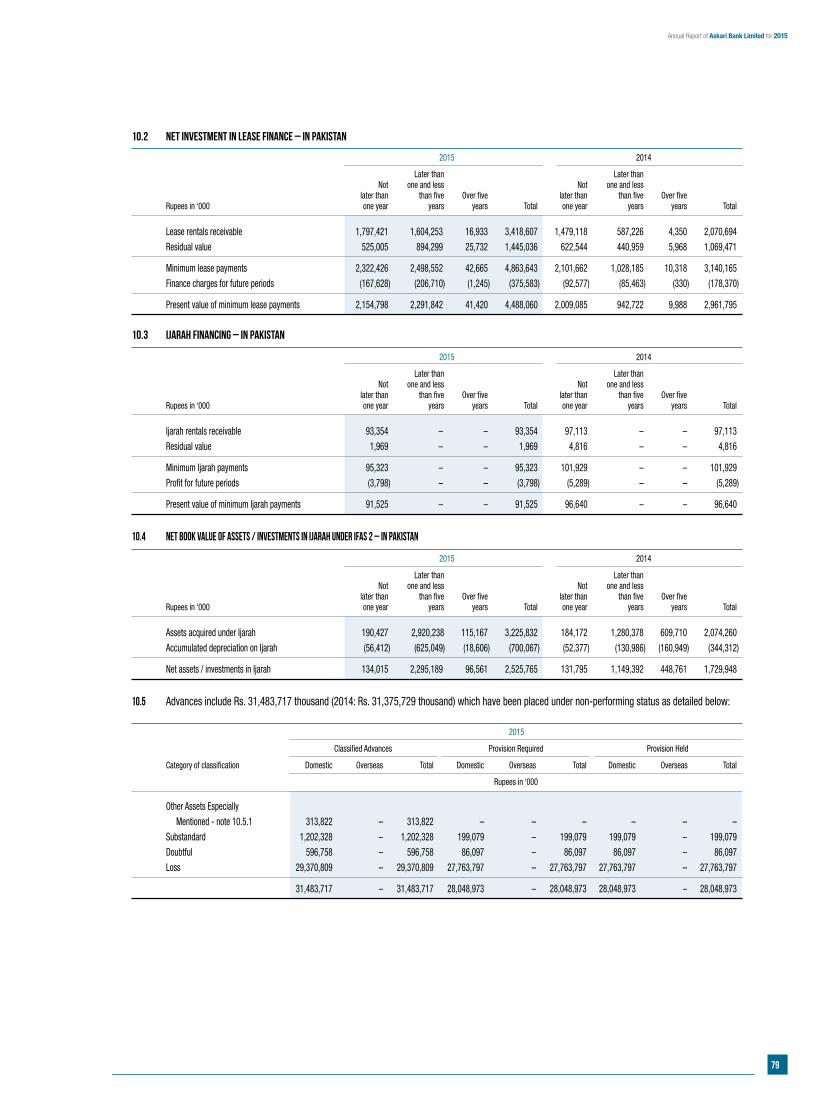
79
Annual Report of Askari Bank Limited for 2015
10.2 Net investment in lease finance – In Pakistan
2015 2014
Later than Later than Not one and less Not one and less later than than five Over five later than than five Over five Rupees in ‘000 one year years years Total one year years years Total
Lease rentals receivable 1,797,421 1,604,253 16,933 3,418,607 1,479,118 587,226 4,350 2,070,694
Residual value 525,005 894,299 25,732 1,445,036 622,544 440,959 5,968 1,069,471
Minimum lease payments 2,322,426 2,498,552 42,665 4,863,643 2,101,662 1,028,185 10,318 3,140,165
Finance charges for future periods (167,628) (206,710) (1,245) (375,583) (92,577) (85,463) (330) (178,370)
Present value of minimum lease payments 2,154,798 2,291,842 41,420 4,488,060 2,009,085 942,722 9,988 2,961,795
10.3 Ijarah financing – In Pakistan
2015 2014
Later than Later than Not one and less Not one and less later than than five Over five later than than five Over five Rupees in ‘000 one year years years Total one year years years Total
Ijarah rentals receivable 93,354 – – 93,354 97,113 – – 97,113
Residual value 1,969 – – 1,969 4,816 – – 4,816
Minimum Ijarah payments 95,323 – – 95,323 101,929 – – 101,929
Profit for future periods (3,798) – – (3,798) (5,289) – – (5,289)
Present value of minimum Ijarah payments 91,525 – – 91,525 96,640 – – 96,640
10.4 Net book value of assets / investments in Ijarah under IFAS 2 – In Pakistan
2015 2014
Later than Later than Not one and less Not one and less later than than five Over five later than than five Over five Rupees in ‘000 one year years years Total one year years years Total
Assets acquired under Ijarah 190,427 2,920,238 115,167 3,225,832 184,172 1,280,378 609,710 2,074,260
Accumulated depreciation on Ijarah (56,412) (625,049) (18,606) (700,067) (52,377) (130,986) (160,949) (344,312)
Net assets / investments in Ijarah 134,015 2,295,189 96,561 2,525,765 131,795 1,149,392 448,761 1,729,948
10.5 Advances include Rs. 31,483,717 thousand (2014: Rs. 31,375,729 thousand) which have been placed under non-performing status as detailed below:
2015
Classified Advances Provision Required Provision Held
Category of classification Domestic Overseas Total Domestic Overseas Total Domestic Overseas Total
Rupees in ‘000
Other Assets Especially
Mentioned - note 10.5.1 313,822 – 313,822 – – – – – –
Substandard 1,202,328 – 1,202,328 199,079 – 199,079 199,079 – 199,079
Doubtful 596,758 – 596,758 86,097 – 86,097 86,097 – 86,097
Loss 29,370,809 – 29,370,809 27,763,797 – 27,763,797 27,763,797 – 27,763,797
31,483,717 – 31,483,717 28,048,973 – 28,048,973 28,048,973 – 28,048,973
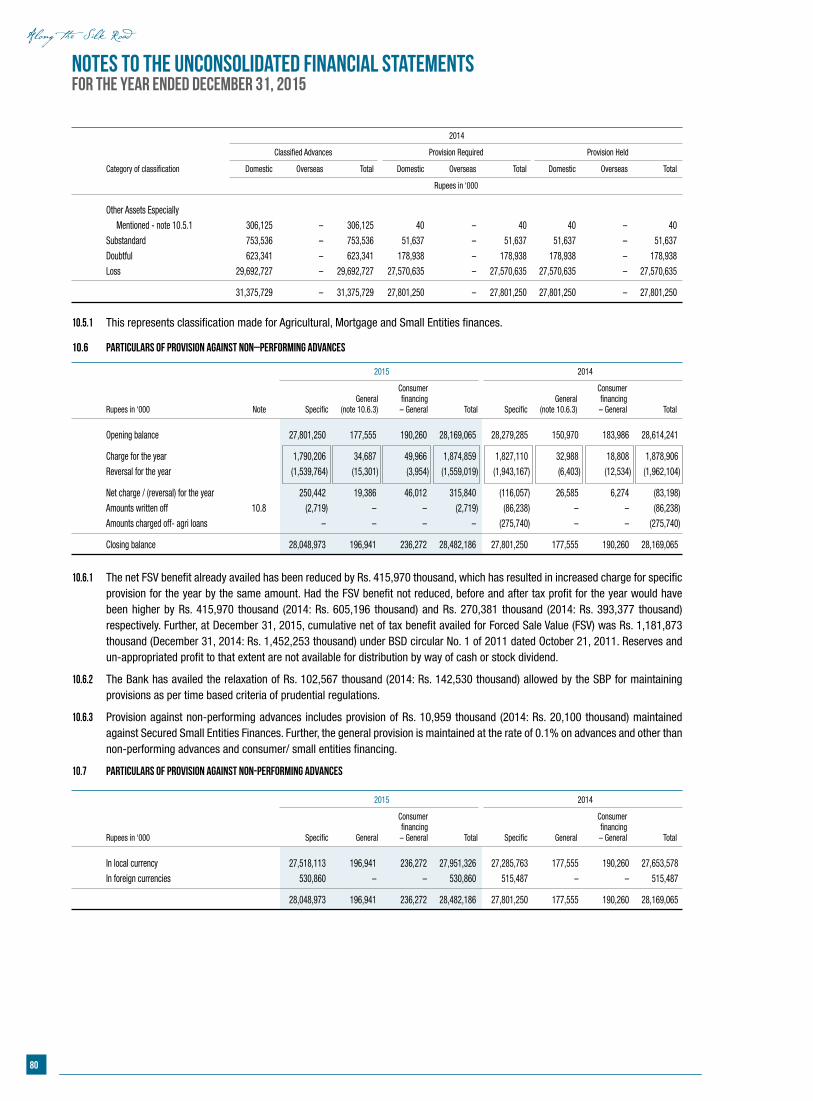
80
Notes to the Unconsolidated Financial StatementsFor the year ended December 31, 2015
2014
Classified Advances Provision Required Provision Held
Category of classification Domestic Overseas Total Domestic Overseas Total Domestic Overseas Total
Rupees in ‘000
Other Assets Especially
Mentioned - note 10.5.1 306,125 – 306,125 40 – 40 40 – 40
Substandard 753,536 – 753,536 51,637 – 51,637 51,637 – 51,637
Doubtful 623,341 – 623,341 178,938 – 178,938 178,938 – 178,938
Loss 29,692,727 – 29,692,727 27,570,635 – 27,570,635 27,570,635 – 27,570,635
31,375,729 – 31,375,729 27,801,250 – 27,801,250 27,801,250 – 27,801,250
10.5.1 This represents classification made for Agricultural, Mortgage and Small Entities finances.
10.6 Particulars of provision against non–performing advances
2015 2014
Consumer Consumer General financing General financing Rupees in ‘000 Note Specific (note 10.6.3) – General Total Specific (note 10.6.3) – General Total
Opening balance 27,801,250 177,555 190,260 28,169,065 28,279,285 150,970 183,986 28,614,241
Charge for the year 1,790,206 34,687 49,966 1,874,859 1,827,110 32,988 18,808 1,878,906
Reversal for the year (1,539,764) (15,301) (3,954) (1,559,019) (1,943,167) (6,403) (12,534) (1,962,104)
Net charge / (reversal) for the year 250,442 19,386 46,012 315,840 (116,057) 26,585 6,274 (83,198)
Amounts written off 10.8 (2,719) – – (2,719) (86,238) – – (86,238)
Amounts charged off- agri loans – – – – (275,740) – – (275,740)
Closing balance 28,048,973 196,941 236,272 28,482,186 27,801,250 177,555 190,260 28,169,065
10.6.1 The net FSV benefit already availed has been reduced by Rs. 415,970 thousand, which has resulted in increased charge for specific provision for the year by the same amount. Had the FSV benefit not reduced, before and after tax profit for the year would have been higher by Rs. 415,970 thousand (2014: Rs. 605,196 thousand) and Rs. 270,381 thousand (2014: Rs. 393,377 thousand) respectively. Further, at December 31, 2015, cumulative net of tax benefit availed for Forced Sale Value (FSV) was Rs. 1,181,873 thousand (December 31, 2014: Rs. 1,452,253 thousand) under BSD circular No. 1 of 2011 dated October 21, 2011. Reserves and un-appropriated profit to that extent are not available for distribution by way of cash or stock dividend.
10.6.2 The Bank has availed the relaxation of Rs. 102,567 thousand (2014: Rs. 142,530 thousand) allowed by the SBP for maintaining provisions as per time based criteria of prudential regulations.
10.6.3 Provision against non-performing advances includes provision of Rs. 10,959 thousand (2014: Rs. 20,100 thousand) maintained against Secured Small Entities Finances. Further, the general provision is maintained at the rate of 0.1% on advances and other than non-performing advances and consumer/ small entities financing.
10.7 Particulars of provision against non-performing advances
2015 2014
Consumer Consumer financing financing Rupees in ‘000 Specific General – General Total Specific General – General Total
In local currency 27,518,113 196,941 236,272 27,951,326 27,285,763 177,555 190,260 27,653,578
In foreign currencies 530,860 – – 530,860 515,487 – – 515,487
28,048,973 196,941 236,272 28,482,186 27,801,250 177,555 190,260 28,169,065
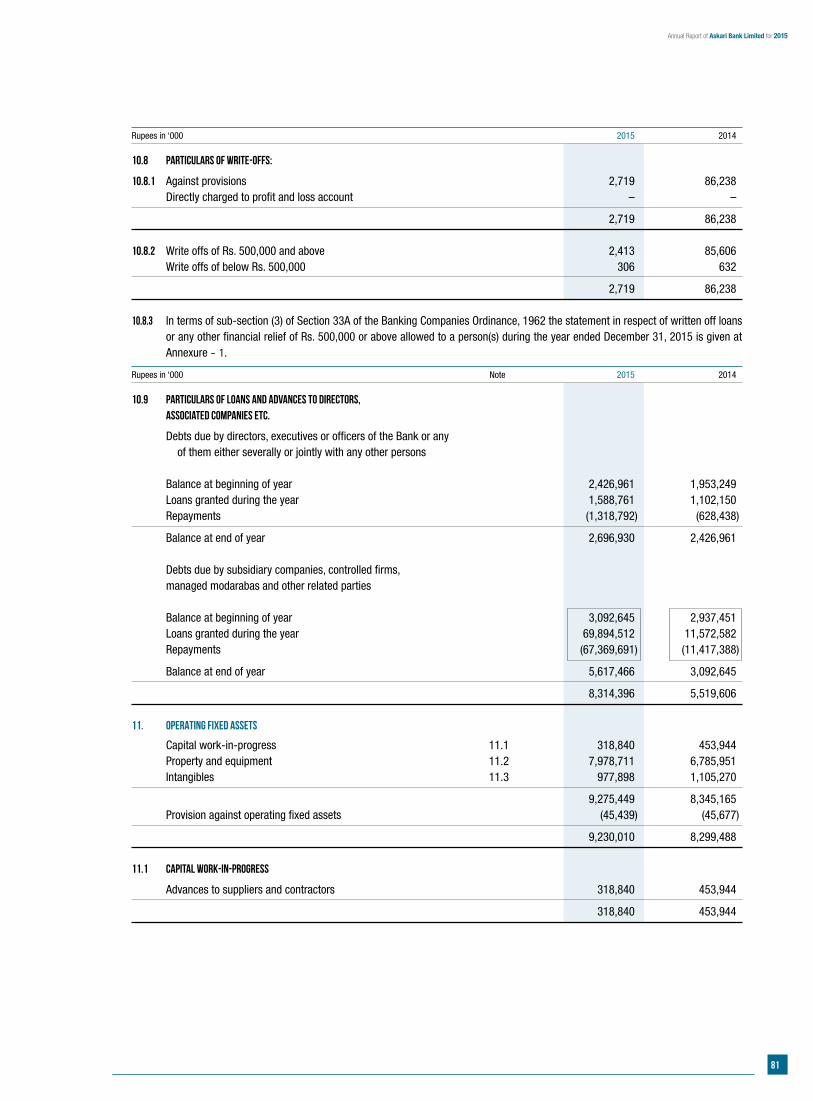
81
Annual Report of Askari Bank Limited for 2015
Rupees in ‘000 2015 2014
10.8 Particulars of write-offs:
10.8.1 Against provisions 2,719 86,238 Directly charged to profit and loss account – –
2,719 86,238
10.8.2 Write offs of Rs. 500,000 and above 2,413 85,606 Write offs of below Rs. 500,000 306 632
2,719 86,238 10.8.3 In terms of sub-section (3) of Section 33A of the Banking Companies Ordinance, 1962 the statement in respect of written off loans
or any other financial relief of Rs. 500,000 or above allowed to a person(s) during the year ended December 31, 2015 is given at Annexure - 1.
Rupees in ‘000 Note 2015 2014
10.9 Particulars of loans and advances to directors, associated companies etc.
Debts due by directors, executives or officers of the Bank or any of them either severally or jointly with any other persons Balance at beginning of year 2,426,961 1,953,249 Loans granted during the year 1,588,761 1,102,150 Repayments (1,318,792) (628,438)
Balance at end of year 2,696,930 2,426,961 Debts due by subsidiary companies, controlled firms, managed modarabas and other related parties Balance at beginning of year 3,092,645 2,937,451 Loans granted during the year 69,894,512 11,572,582 Repayments (67,369,691) (11,417,388)
Balance at end of year 5,617,466 3,092,645
8,314,396 5,519,606 11. OPERATING FIXED ASSETS
Capital work-in-progress 11.1 318,840 453,944 Property and equipment 11.2 7,978,711 6,785,951 Intangibles 11.3 977,898 1,105,270
9,275,449 8,345,165 Provision against operating fixed assets (45,439) (45,677)
9,230,010 8,299,488 11.1 Capital work-in-progress
Advances to suppliers and contractors 318,840 453,944
318,840 453,944
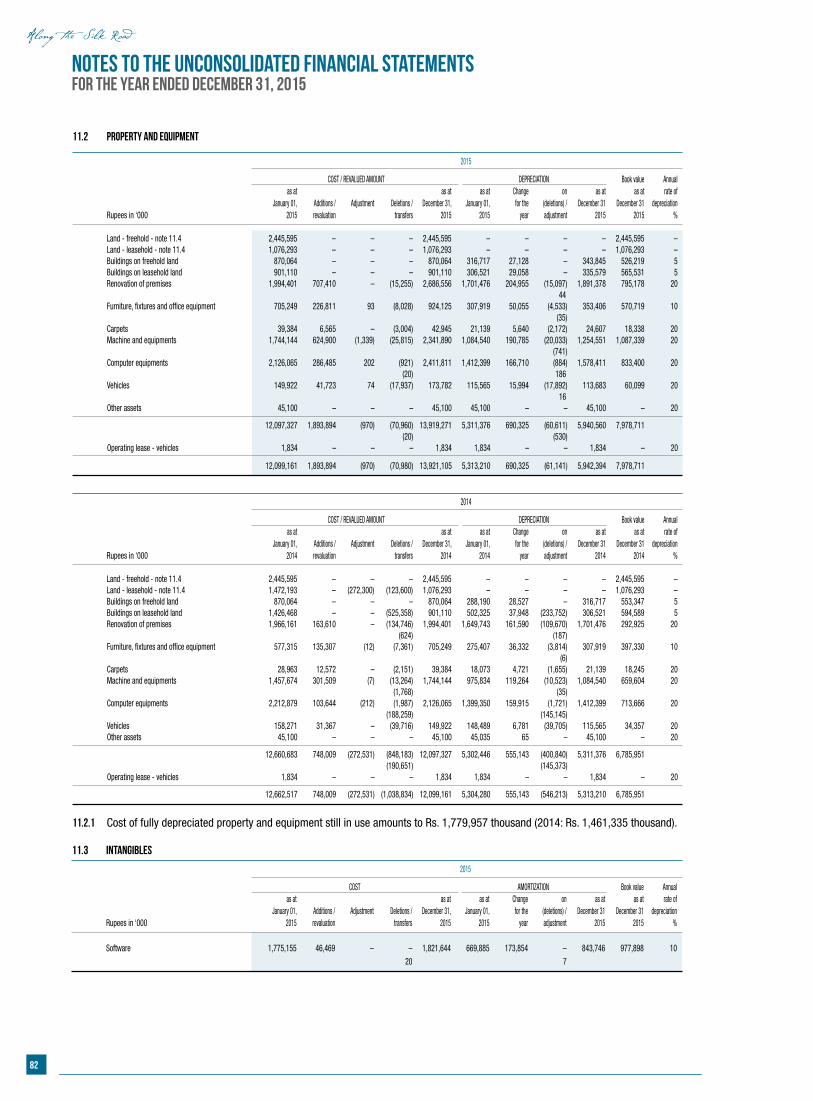
82
Notes to the Unconsolidated Financial StatementsFor the year ended December 31, 2015
11.2 Property and equipment
2015
COST / REVALUED AMOUNT DEPRECIATION Book value Annual as at as at as at Change on as at as at rate of January 01, Additions / Adjustment Deletions / December 31, January 01, for the (deletions) / December 31 December 31 depreciation Rupees in ‘000 2015 revaluation transfers 2015 2015 year adjustment 2015 2015 %
Land - freehold - note 11.4 2,445,595 – – – 2,445,595 – – – – 2,445,595 – Land - leasehold - note 11.4 1,076,293 – – – 1,076,293 – – – – 1,076,293 – Buildings on freehold land 870,064 – – – 870,064 316,717 27,128 – 343,845 526,219 5 Buildings on leasehold land 901,110 – – – 901,110 306,521 29,058 – 335,579 565,531 5 Renovation of premises 1,994,401 707,410 – (15,255) 2,686,556 1,701,476 204,955 (15,097) 1,891,378 795,178 20 44 Furniture, fixtures and office equipment 705,249 226,811 93 (8,028) 924,125 307,919 50,055 (4,533) 353,406 570,719 10 (35) Carpets 39,384 6,565 – (3,004) 42,945 21,139 5,640 (2,172) 24,607 18,338 20 Machine and equipments 1,744,144 624,900 (1,339) (25,815) 2,341,890 1,084,540 190,785 (20,033) 1,254,551 1,087,339 20 (741) Computer equipments 2,126,065 286,485 202 (921) 2,411,811 1,412,399 166,710 (884) 1,578,411 833,400 20 (20) 186 Vehicles 149,922 41,723 74 (17,937) 173,782 115,565 15,994 (17,892) 113,683 60,099 20 16 Other assets 45,100 – – – 45,100 45,100 – – 45,100 – 20
12,097,327 1,893,894 (970) (70,960) 13,919,271 5,311,376 690,325 (60,611) 5,940,560 7,978,711 (20) (530) Operating lease - vehicles 1,834 – – – 1,834 1,834 – – 1,834 – 20
12,099,161 1,893,894 (970) (70,980) 13,921,105 5,313,210 690,325 (61,141) 5,942,394 7,978,711
2014
COST / REVALUED AMOUNT DEPRECIATION Book value Annual as at as at as at Change on as at as at rate of January 01, Additions / Adjustment Deletions / December 31, January 01, for the (deletions) / December 31 December 31 depreciation Rupees in ‘000 2014 revaluation transfers 2014 2014 year adjustment 2014 2014 %
Land - freehold - note 11.4 2,445,595 – – – 2,445,595 – – – – 2,445,595 – Land - leasehold - note 11.4 1,472,193 – (272,300) (123,600) 1,076,293 – – – – 1,076,293 – Buildings on freehold land 870,064 – – – 870,064 288,190 28,527 – 316,717 553,347 5 Buildings on leasehold land 1,426,468 – – (525,358) 901,110 502,325 37,948 (233,752) 306,521 594,589 5 Renovation of premises 1,966,161 163,610 – (134,746) 1,994,401 1,649,743 161,590 (109,670) 1,701,476 292,925 20 (624) (187) Furniture, fixtures and office equipment 577,315 135,307 (12) (7,361) 705,249 275,407 36,332 (3,814) 307,919 397,330 10 (6) Carpets 28,963 12,572 – (2,151) 39,384 18,073 4,721 (1,655) 21,139 18,245 20 Machine and equipments 1,457,674 301,509 (7) (13,264) 1,744,144 975,834 119,264 (10,523) 1,084,540 659,604 20 (1,768) (35) Computer equipments 2,212,879 103,644 (212) (1,987) 2,126,065 1,399,350 159,915 (1,721) 1,412,399 713,666 20 (188,259) (145,145) Vehicles 158,271 31,367 – (39,716) 149,922 148,489 6,781 (39,705) 115,565 34,357 20 Other assets 45,100 – – – 45,100 45,035 65 – 45,100 – 20
12,660,683 748,009 (272,531) (848,183) 12,097,327 5,302,446 555,143 (400,840) 5,311,376 6,785,951 (190,651) (145,373) Operating lease - vehicles 1,834 – – – 1,834 1,834 – – 1,834 – 20
12,662,517 748,009 (272,531) (1,038,834) 12,099,161 5,304,280 555,143 (546,213) 5,313,210 6,785,951
11.2.1 Cost of fully depreciated property and equipment still in use amounts to Rs. 1,779,957 thousand (2014: Rs. 1,461,335 thousand).
11.3 Intangibles
2015
COST AMORTIZATION Book value Annual as at as at as at Change on as at as at rate of January 01, Additions / Adjustment Deletions / December 31, January 01, for the (deletions) / December 31 December 31 depreciation Rupees in ‘000 2015 revaluation transfers 2015 2015 year adjustment 2015 2015 %
Software 1,775,155 46,469 – – 1,821,644 669,885 173,854 – 843,746 977,898 10 20 7
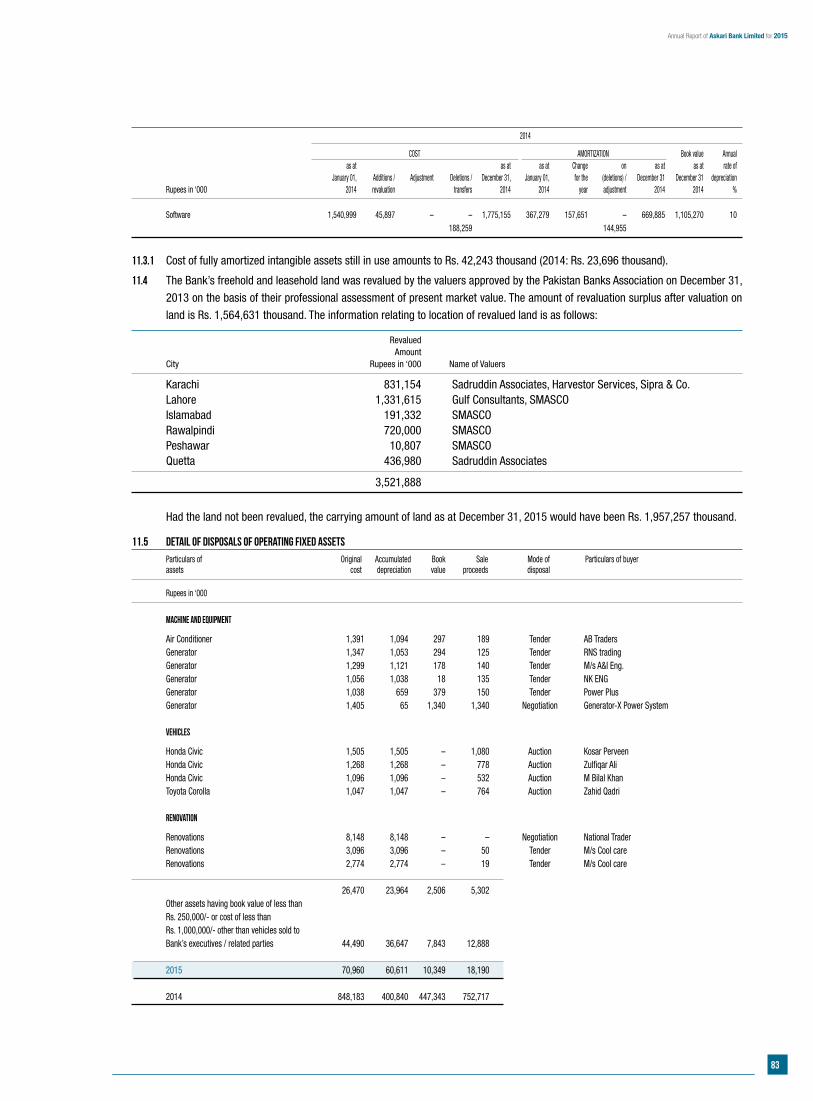
83
Annual Report of Askari Bank Limited for 2015
2014
COST AMORTIZATION Book value Annual as at as at as at Change on as at as at rate of January 01, Additions / Adjustment Deletions / December 31, January 01, for the (deletions) / December 31 December 31 depreciation Rupees in ‘000 2014 revaluation transfers 2014 2014 year adjustment 2014 2014 %
Software 1,540,999 45,897 – – 1,775,155 367,279 157,651 – 669,885 1,105,270 10 188,259 144,955
11.3.1 Cost of fully amortized intangible assets still in use amounts to Rs. 42,243 thousand (2014: Rs. 23,696 thousand).
11.4 The Bank’s freehold and leasehold land was revalued by the valuers approved by the Pakistan Banks Association on December 31,
2013 on the basis of their professional assessment of present market value. The amount of revaluation surplus after valuation on
land is Rs. 1,564,631 thousand. The information relating to location of revalued land is as follows:
Revalued Amount City Rupees in ‘000 Name of Valuers
Karachi 831,154 Sadruddin Associates, Harvestor Services, Sipra & Co. Lahore 1,331,615 Gulf Consultants, SMASCO Islamabad 191,332 SMASCO Rawalpindi 720,000 SMASCO Peshawar 10,807 SMASCO Quetta 436,980 Sadruddin Associates
3,521,888
Had the land not been revalued, the carrying amount of land as at December 31, 2015 would have been Rs. 1,957,257 thousand.
11.5 Detail of disposals of operating fixed assets
Particulars of Original Accumulated Book Sale Mode of Particulars of buyer assets cost depreciation value proceeds disposal
Rupees in ‘000
Machine and Equipment
Air Conditioner 1,391 1,094 297 189 Tender AB Traders Generator 1,347 1,053 294 125 Tender RNS trading Generator 1,299 1,121 178 140 Tender M/s A&I Eng. Generator 1,056 1,038 18 135 Tender NK ENG Generator 1,038 659 379 150 Tender Power Plus Generator 1,405 65 1,340 1,340 Negotiation Generator-X Power System Vehicles
Honda Civic 1,505 1,505 – 1,080 Auction Kosar Perveen Honda Civic 1,268 1,268 – 778 Auction Zulfiqar Ali Honda Civic 1,096 1,096 – 532 Auction M Bilal Khan Toyota Corolla 1,047 1,047 – 764 Auction Zahid Qadri Renovation
Renovations 8,148 8,148 – – Negotiation National Trader Renovations 3,096 3,096 – 50 Tender M/s Cool care Renovations 2,774 2,774 – 19 Tender M/s Cool care 26,470 23,964 2,506 5,302 Other assets having book value of less than Rs. 250,000/- or cost of less than Rs. 1,000,000/- other than vehicles sold to Bank’s executives / related parties 44,490 36,647 7,843 12,888 2015 70,960 60,611 10,349 18,190 2014 848,183 400,840 447,343 752,717
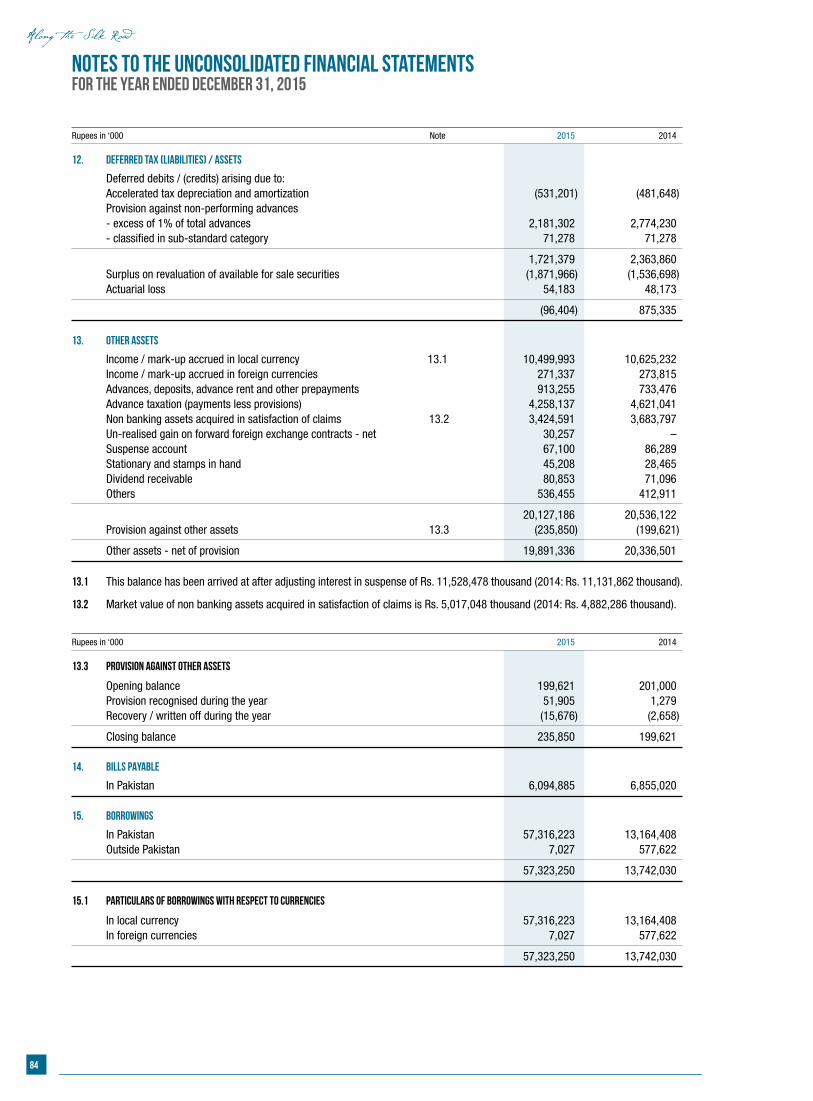
84
Notes to the Unconsolidated Financial StatementsFor the year ended December 31, 2015
Rupees in ‘000 Note 2015 2014
12. DEFERRED TAX (LIABILITIES) / ASSETS
Deferred debits / (credits) arising due to: Accelerated tax depreciation and amortization (531,201) (481,648) Provision against non-performing advances - excess of 1% of total advances 2,181,302 2,774,230 - classified in sub-standard category 71,278 71,278
1,721,379 2,363,860 Surplus on revaluation of available for sale securities (1,871,966) (1,536,698) Actuarial loss 54,183 48,173
(96,404) 875,335
13. OTHER ASSETS
Income / mark-up accrued in local currency 13.1 10,499,993 10,625,232 Income / mark-up accrued in foreign currencies 271,337 273,815 Advances, deposits, advance rent and other prepayments 913,255 733,476 Advance taxation (payments less provisions) 4,258,137 4,621,041 Non banking assets acquired in satisfaction of claims 13.2 3,424,591 3,683,797 Un-realised gain on forward foreign exchange contracts - net 30,257 – Suspense account 67,100 86,289 Stationary and stamps in hand 45,208 28,465 Dividend receivable 80,853 71,096 Others 536,455 412,911
20,127,186 20,536,122 Provision against other assets 13.3 (235,850) (199,621)
Other assets - net of provision 19,891,336 20,336,501 13.1 This balance has been arrived at after adjusting interest in suspense of Rs. 11,528,478 thousand (2014: Rs. 11,131,862 thousand).
13.2 Market value of non banking assets acquired in satisfaction of claims is Rs. 5,017,048 thousand (2014: Rs. 4,882,286 thousand).
Rupees in ‘000 2015 2014
13.3 Provision against other assets
Opening balance 199,621 201,000 Provision recognised during the year 51,905 1,279 Recovery / written off during the year (15,676) (2,658)
Closing balance 235,850 199,621 14. BILLS PAYABLE
In Pakistan 6,094,885 6,855,020 15. BORROWINGS
In Pakistan 57,316,223 13,164,408 Outside Pakistan 7,027 577,622
57,323,250 13,742,030 15.1 Particulars of borrowings with respect to currencies
In local currency 57,316,223 13,164,408 In foreign currencies 7,027 577,622
57,323,250 13,742,030
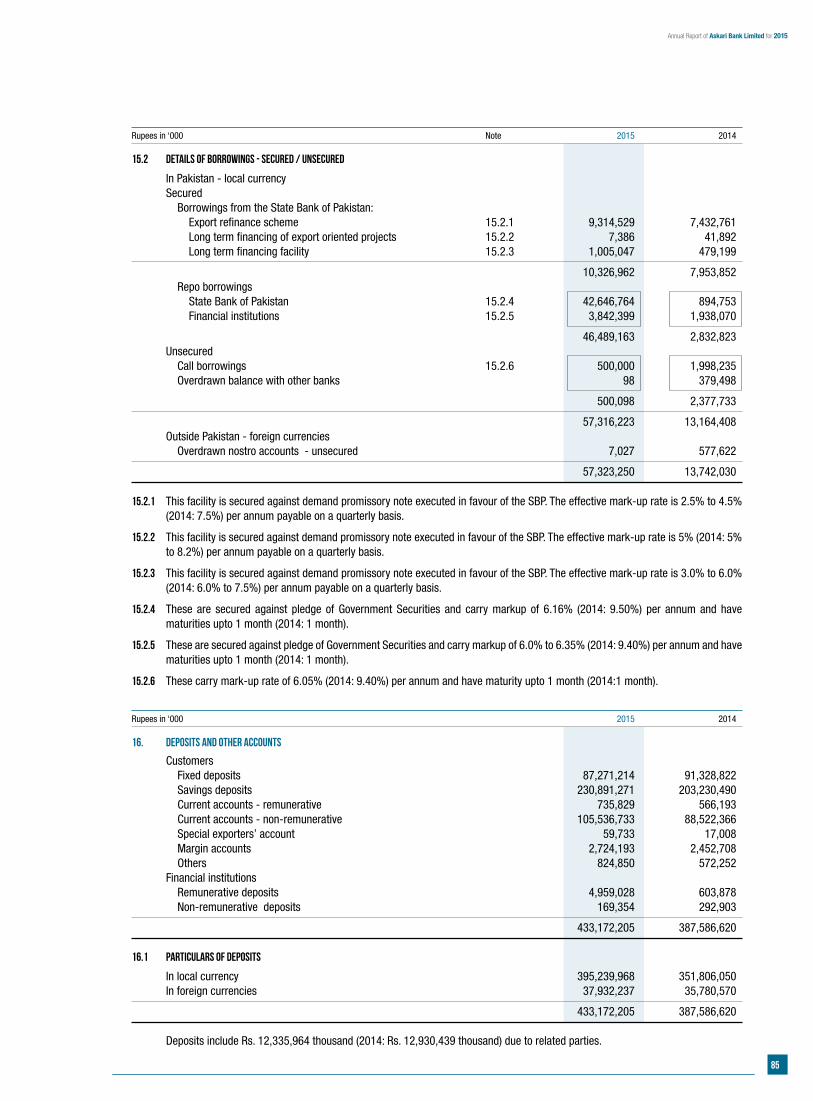
85
Annual Report of Askari Bank Limited for 2015
Rupees in ‘000 Note 2015 2014
15.2 Details of borrowings - secured / unsecured
In Pakistan - local currency Secured Borrowings from the State Bank of Pakistan: Export refinance scheme 15.2.1 9,314,529 7,432,761 Long term financing of export oriented projects 15.2.2 7,386 41,892 Long term financing facility 15.2.3 1,005,047 479,199
10,326,962 7,953,852 Repo borrowings State Bank of Pakistan 15.2.4 42,646,764 894,753 Financial institutions 15.2.5 3,842,399 1,938,070
46,489,163 2,832,823 Unsecured Call borrowings 15.2.6 500,000 1,998,235 Overdrawn balance with other banks 98 379,498
500,098 2,377,733
57,316,223 13,164,408 Outside Pakistan - foreign currencies Overdrawn nostro accounts - unsecured 7,027 577,622
57,323,250 13,742,030 15.2.1 This facility is secured against demand promissory note executed in favour of the SBP. The effective mark-up rate is 2.5% to 4.5%
(2014: 7.5%) per annum payable on a quarterly basis.
15.2.2 This facility is secured against demand promissory note executed in favour of the SBP. The effective mark-up rate is 5% (2014: 5% to 8.2%) per annum payable on a quarterly basis.
15.2.3 This facility is secured against demand promissory note executed in favour of the SBP. The effective mark-up rate is 3.0% to 6.0% (2014: 6.0% to 7.5%) per annum payable on a quarterly basis.
15.2.4 These are secured against pledge of Government Securities and carry markup of 6.16% (2014: 9.50%) per annum and have maturities upto 1 month (2014: 1 month).
15.2.5 These are secured against pledge of Government Securities and carry markup of 6.0% to 6.35% (2014: 9.40%) per annum and have maturities upto 1 month (2014: 1 month).
15.2.6 These carry mark-up rate of 6.05% (2014: 9.40%) per annum and have maturity upto 1 month (2014:1 month).
Rupees in ‘000 2015 2014
16. DEPOSITS AND OTHER ACCOUNTS
Customers Fixed deposits 87,271,214 91,328,822 Savings deposits 230,891,271 203,230,490 Current accounts - remunerative 735,829 566,193 Current accounts - non-remunerative 105,536,733 88,522,366 Special exporters’ account 59,733 17,008 Margin accounts 2,724,193 2,452,708 Others 824,850 572,252 Financial institutions Remunerative deposits 4,959,028 603,878 Non-remunerative deposits 169,354 292,903
433,172,205 387,586,620 16.1 Particulars of deposits
In local currency 395,239,968 351,806,050 In foreign currencies 37,932,237 35,780,570
433,172,205 387,586,620 Deposits include Rs. 12,335,964 thousand (2014: Rs. 12,930,439 thousand) due to related parties.
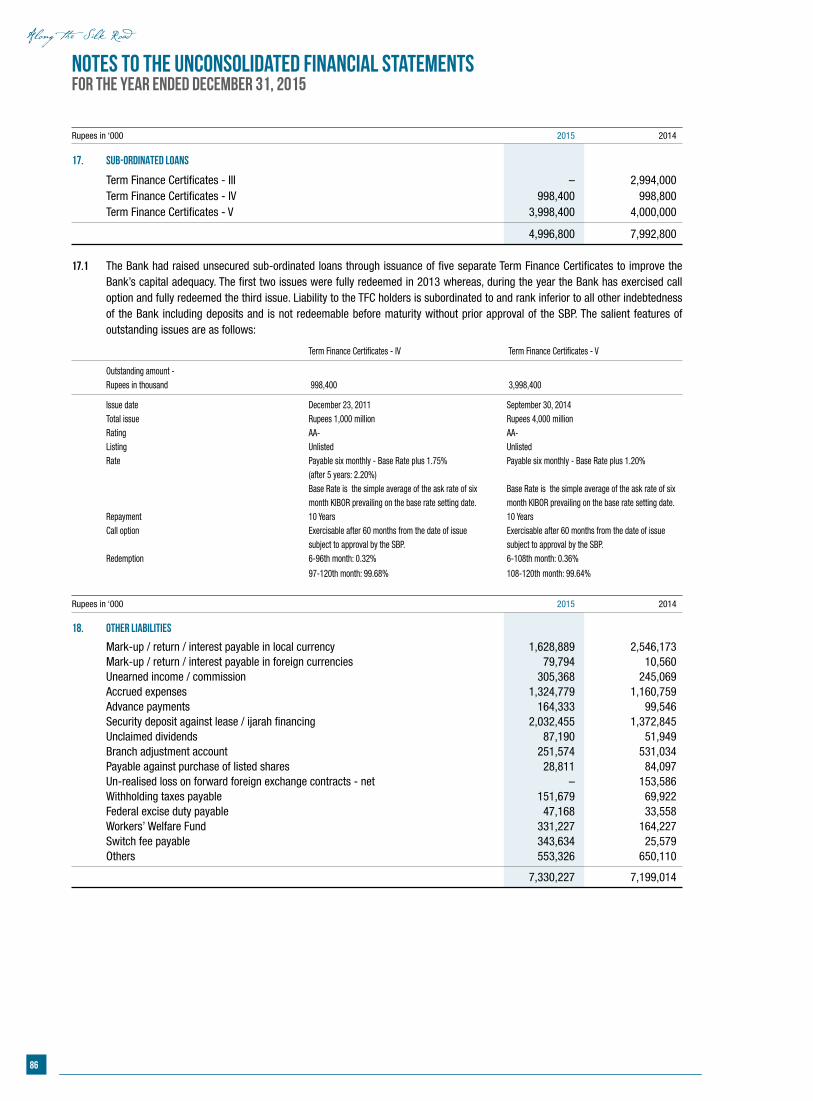
86
Notes to the Unconsolidated Financial StatementsFor the year ended December 31, 2015
Rupees in ‘000 2015 2014
17. SUB-ORDINATED LOANS
Term Finance Certificates - III – 2,994,000 Term Finance Certificates - IV 998,400 998,800 Term Finance Certificates - V 3,998,400 4,000,000
4,996,800 7,992,800 17.1 The Bank had raised unsecured sub-ordinated loans through issuance of five separate Term Finance Certificates to improve the
Bank’s capital adequacy. The first two issues were fully redeemed in 2013 whereas, during the year the Bank has exercised call option and fully redeemed the third issue. Liability to the TFC holders is subordinated to and rank inferior to all other indebtedness of the Bank including deposits and is not redeemable before maturity without prior approval of the SBP. The salient features of outstanding issues are as follows:
Term Finance Certificates - IV Term Finance Certificates - V
Outstanding amount - Rupees in thousand 998,400 3,998,400
Issue date December 23, 2011 September 30, 2014 Total issue Rupees 1,000 million Rupees 4,000 million Rating AA- AA- Listing Unlisted Unlisted Rate Payable six monthly - Base Rate plus 1.75% Payable six monthly - Base Rate plus 1.20% (after 5 years: 2.20%) Base Rate is the simple average of the ask rate of six Base Rate is the simple average of the ask rate of six month KIBOR prevailing on the base rate setting date. month KIBOR prevailing on the base rate setting date. Repayment 10 Years 10 Years Call option Exercisable after 60 months from the date of issue Exercisable after 60 months from the date of issue subject to approval by the SBP. subject to approval by the SBP. Redemption 6-96th month: 0.32% 6-108th month: 0.36%
97-120th month: 99.68% 108-120th month: 99.64% Rupees in ‘000 2015 2014
18. OTHER LIABILITIES
Mark-up / return / interest payable in local currency 1,628,889 2,546,173 Mark-up / return / interest payable in foreign currencies 79,794 10,560 Unearned income / commission 305,368 245,069 Accrued expenses 1,324,779 1,160,759 Advance payments 164,333 99,546 Security deposit against lease / ijarah financing 2,032,455 1,372,845 Unclaimed dividends 87,190 51,949 Branch adjustment account 251,574 531,034 Payable against purchase of listed shares 28,811 84,097 Un-realised loss on forward foreign exchange contracts - net – 153,586 Withholding taxes payable 151,679 69,922 Federal excise duty payable 47,168 33,558 Workers’ Welfare Fund 331,227 164,227 Switch fee payable 343,634 25,579 Others 553,326 650,110
7,330,227 7,199,014
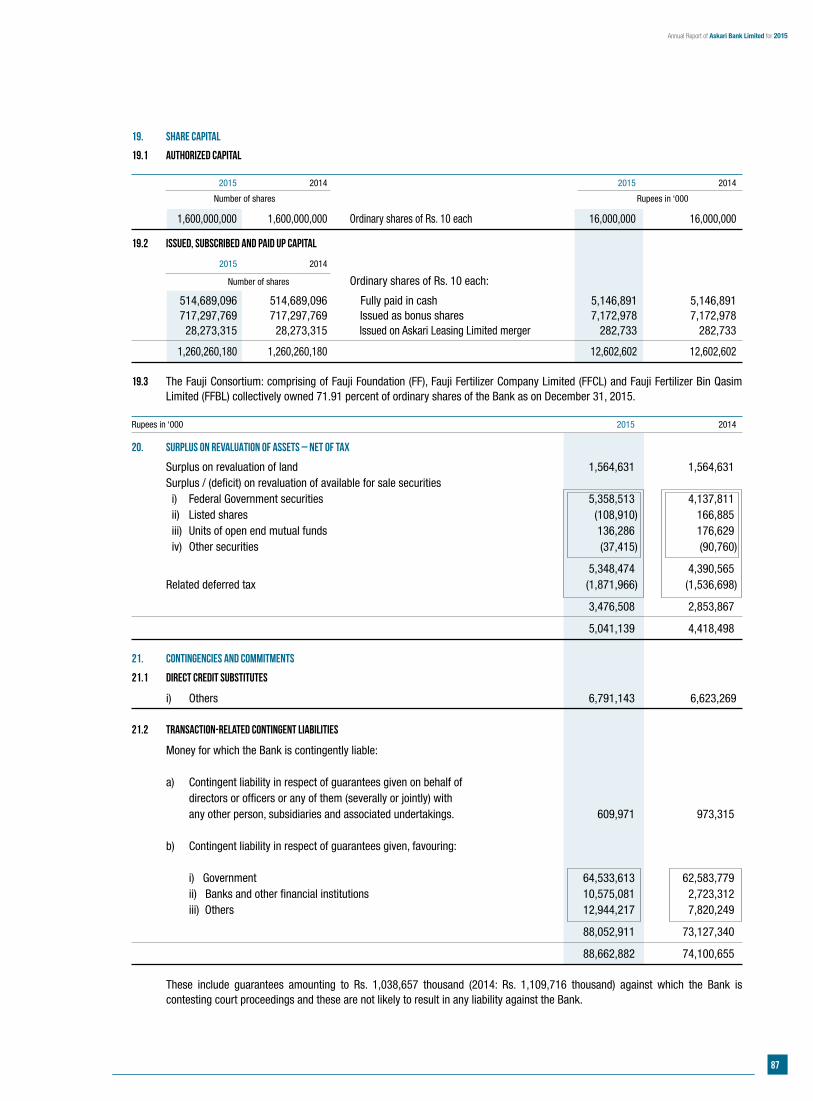
87
Annual Report of Askari Bank Limited for 2015
19. share capital
19.1 Authorized capital
2015 2014 2015 2014
Number of shares Rupees in ‘000
1,600,000,000 1,600,000,000 Ordinary shares of Rs. 10 each 16,000,000 16,000,000
19.2 Issued, subscribed and paid up capital
2015 2014
Number of shares Ordinary shares of Rs. 10 each:
514,689,096 514,689,096 Fully paid in cash 5,146,891 5,146,891 717,297,769 717,297,769 Issued as bonus shares 7,172,978 7,172,978 28,273,315 28,273,315 Issued on Askari Leasing Limited merger 282,733 282,733
1,260,260,180 1,260,260,180 12,602,602 12,602,602
19.3 The Fauji Consortium: comprising of Fauji Foundation (FF), Fauji Fertilizer Company Limited (FFCL) and Fauji Fertilizer Bin Qasim Limited (FFBL) collectively owned 71.91 percent of ordinary shares of the Bank as on December 31, 2015.
Rupees in ‘000 2015 2014
20. SURPLUS ON REVALUATION OF ASSETS – NET OF TAX
Surplus on revaluation of land 1,564,631 1,564,631 Surplus / (deficit) on revaluation of available for sale securities i) Federal Government securities 5,358,513 4,137,811 ii) Listed shares (108,910) 166,885 iii) Units of open end mutual funds 136,286 176,629 iv) Other securities (37,415) (90,760)
5,348,474 4,390,565 Related deferred tax (1,871,966) (1,536,698)
3,476,508 2,853,867
5,041,139 4,418,498
21. CONTINGENCIES AND COMMITMENTS
21.1 Direct credit substitutes
i) Others 6,791,143 6,623,269 21.2 Transaction-related contingent liabilities
Money for which the Bank is contingently liable: a) Contingent liability in respect of guarantees given on behalf of directors or officers or any of them (severally or jointly) with any other person, subsidiaries and associated undertakings. 609,971 973,315 b) Contingent liability in respect of guarantees given, favouring: i) Government 64,533,613 62,583,779 ii) Banks and other financial institutions 10,575,081 2,723,312 iii) Others 12,944,217 7,820,249
88,052,911 73,127,340
88,662,882 74,100,655 These include guarantees amounting to Rs. 1,038,657 thousand (2014: Rs. 1,109,716 thousand) against which the Bank is
contesting court proceedings and these are not likely to result in any liability against the Bank.
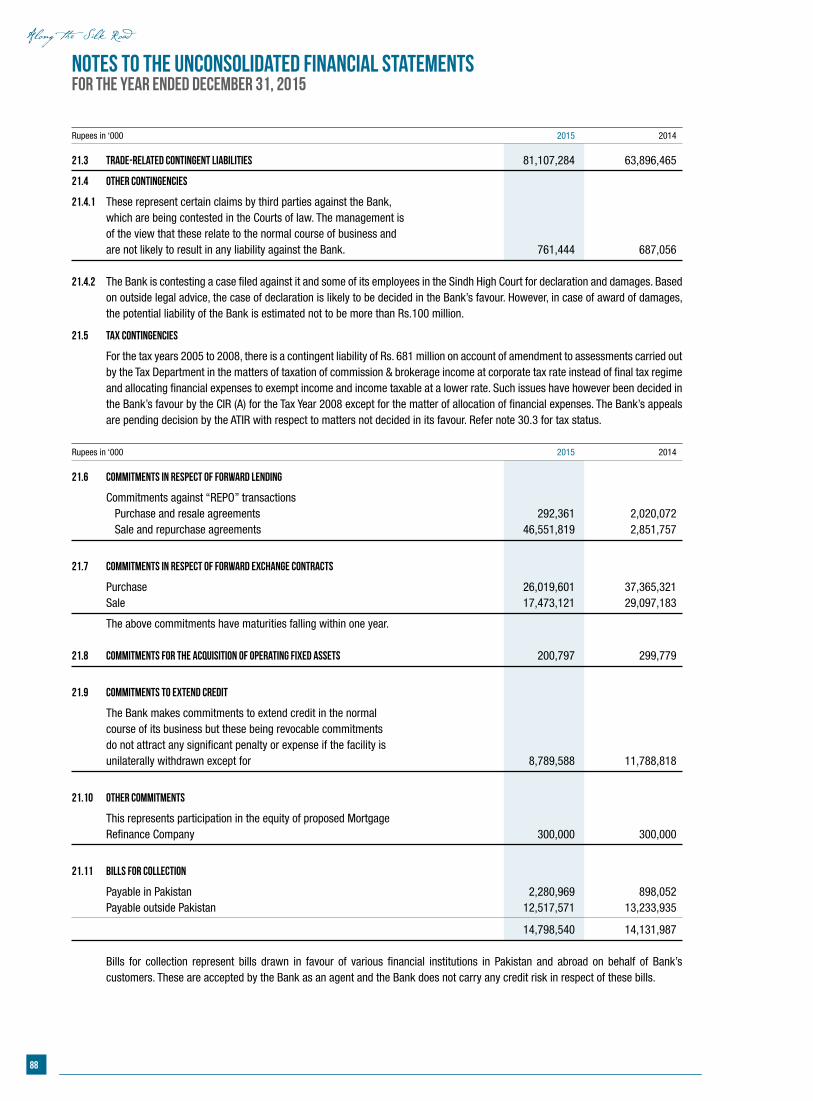
88
Notes to the Unconsolidated Financial StatementsFor the year ended December 31, 2015
Rupees in ‘000 2015 2014
21.3 Trade-related contingent liabilities 81,107,284 63,896,465
21.4 Other contingencies
21.4.1 These represent certain claims by third parties against the Bank, which are being contested in the Courts of law. The management is of the view that these relate to the normal course of business and are not likely to result in any liability against the Bank. 761,444 687,056 21.4.2 The Bank is contesting a case filed against it and some of its employees in the Sindh High Court for declaration and damages. Based
on outside legal advice, the case of declaration is likely to be decided in the Bank’s favour. However, in case of award of damages, the potential liability of the Bank is estimated not to be more than Rs.100 million.
21.5 Tax Contingencies
For the tax years 2005 to 2008, there is a contingent liability of Rs. 681 million on account of amendment to assessments carried out by the Tax Department in the matters of taxation of commission & brokerage income at corporate tax rate instead of final tax regime and allocating financial expenses to exempt income and income taxable at a lower rate. Such issues have however been decided in the Bank’s favour by the CIR (A) for the Tax Year 2008 except for the matter of allocation of financial expenses. The Bank’s appeals are pending decision by the ATIR with respect to matters not decided in its favour. Refer note 30.3 for tax status.
Rupees in ‘000 2015 2014
21.6 Commitments in respect of forward lending
Commitments against “REPO” transactions Purchase and resale agreements 292,361 2,020,072 Sale and repurchase agreements 46,551,819 2,851,757
21.7 Commitments in respect of forward exchange contracts
Purchase 26,019,601 37,365,321 Sale 17,473,121 29,097,183
The above commitments have maturities falling within one year. 21.8 Commitments for the acquisition of operating fixed assets 200,797 299,779
21.9 Commitments to extend credit
The Bank makes commitments to extend credit in the normal course of its business but these being revocable commitments do not attract any significant penalty or expense if the facility is unilaterally withdrawn except for 8,789,588 11,788,818
21.10 Other commitments
This represents participation in the equity of proposed Mortgage Refinance Company 300,000 300,000
21.11 Bills for collection
Payable in Pakistan 2,280,969 898,052 Payable outside Pakistan 12,517,571 13,233,935
14,798,540 14,131,987 Bills for collection represent bills drawn in favour of various financial institutions in Pakistan and abroad on behalf of Bank’s
customers. These are accepted by the Bank as an agent and the Bank does not carry any credit risk in respect of these bills.
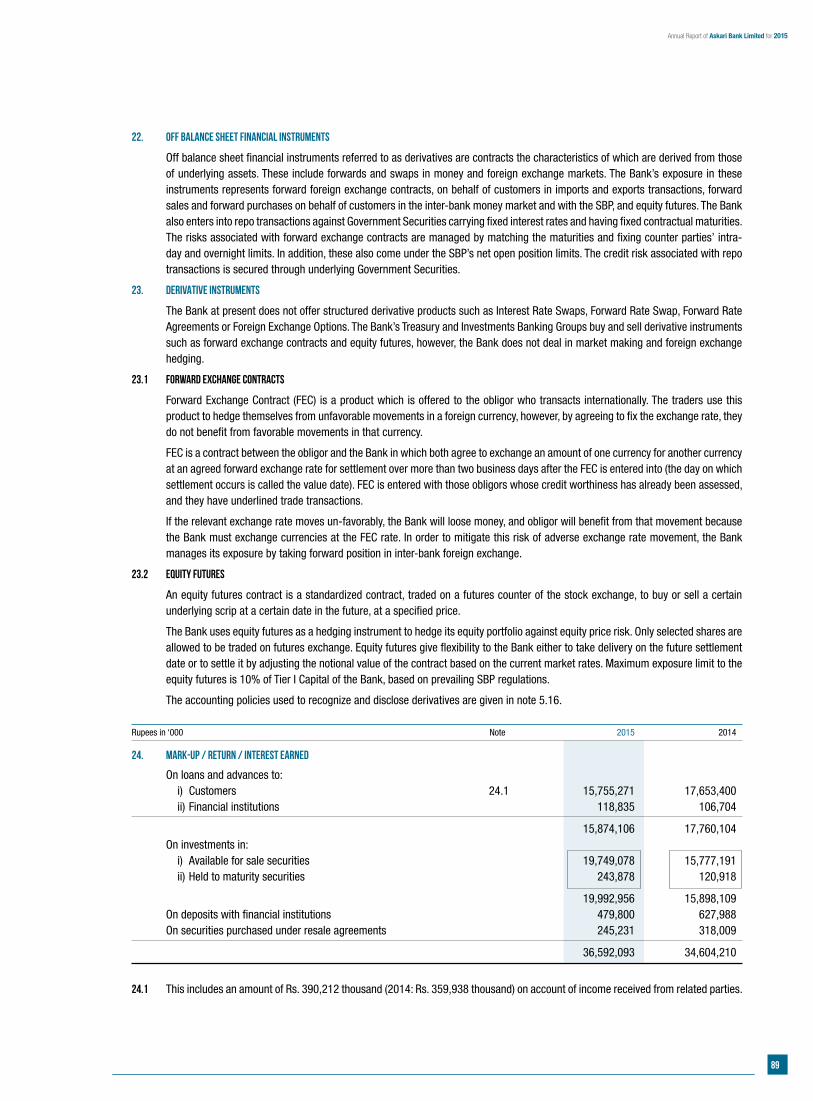
89
Annual Report of Askari Bank Limited for 2015
22. OFF BALANCE SHEET FINANCIAL INSTRUMENTS
Off balance sheet financial instruments referred to as derivatives are contracts the characteristics of which are derived from those of underlying assets. These include forwards and swaps in money and foreign exchange markets. The Bank’s exposure in these instruments represents forward foreign exchange contracts, on behalf of customers in imports and exports transactions, forward sales and forward purchases on behalf of customers in the inter-bank money market and with the SBP, and equity futures. The Bank also enters into repo transactions against Government Securities carrying fixed interest rates and having fixed contractual maturities. The risks associated with forward exchange contracts are managed by matching the maturities and fixing counter parties’ intra-day and overnight limits. In addition, these also come under the SBP’s net open position limits. The credit risk associated with repo transactions is secured through underlying Government Securities.
23. DERIVATIVE INSTRUMENTS
The Bank at present does not offer structured derivative products such as Interest Rate Swaps, Forward Rate Swap, Forward Rate Agreements or Foreign Exchange Options. The Bank’s Treasury and Investments Banking Groups buy and sell derivative instruments such as forward exchange contracts and equity futures, however, the Bank does not deal in market making and foreign exchange hedging.
23.1 Forward exchange contracts
Forward Exchange Contract (FEC) is a product which is offered to the obligor who transacts internationally. The traders use this product to hedge themselves from unfavorable movements in a foreign currency, however, by agreeing to fix the exchange rate, they do not benefit from favorable movements in that currency.
FEC is a contract between the obligor and the Bank in which both agree to exchange an amount of one currency for another currency at an agreed forward exchange rate for settlement over more than two business days after the FEC is entered into (the day on which settlement occurs is called the value date). FEC is entered with those obligors whose credit worthiness has already been assessed, and they have underlined trade transactions.
If the relevant exchange rate moves un-favorably, the Bank will loose money, and obligor will benefit from that movement because the Bank must exchange currencies at the FEC rate. In order to mitigate this risk of adverse exchange rate movement, the Bank manages its exposure by taking forward position in inter-bank foreign exchange.
23.2 Equity futures
An equity futures contract is a standardized contract, traded on a futures counter of the stock exchange, to buy or sell a certain underlying scrip at a certain date in the future, at a specified price.
The Bank uses equity futures as a hedging instrument to hedge its equity portfolio against equity price risk. Only selected shares are allowed to be traded on futures exchange. Equity futures give flexibility to the Bank either to take delivery on the future settlement date or to settle it by adjusting the notional value of the contract based on the current market rates. Maximum exposure limit to the equity futures is 10% of Tier I Capital of the Bank, based on prevailing SBP regulations.
The accounting policies used to recognize and disclose derivatives are given in note 5.16.
Rupees in ‘000 Note 2015 2014
24. MARK-UP / RETURN / INTEREST EARNED
On loans and advances to: i) Customers 24.1 15,755,271 17,653,400 ii) Financial institutions 118,835 106,704
15,874,106 17,760,104 On investments in: i) Available for sale securities 19,749,078 15,777,191 ii) Held to maturity securities 243,878 120,918
19,992,956 15,898,109 On deposits with financial institutions 479,800 627,988 On securities purchased under resale agreements 245,231 318,009
36,592,093 34,604,210
24.1 This includes an amount of Rs. 390,212 thousand (2014: Rs. 359,938 thousand) on account of income received from related parties.
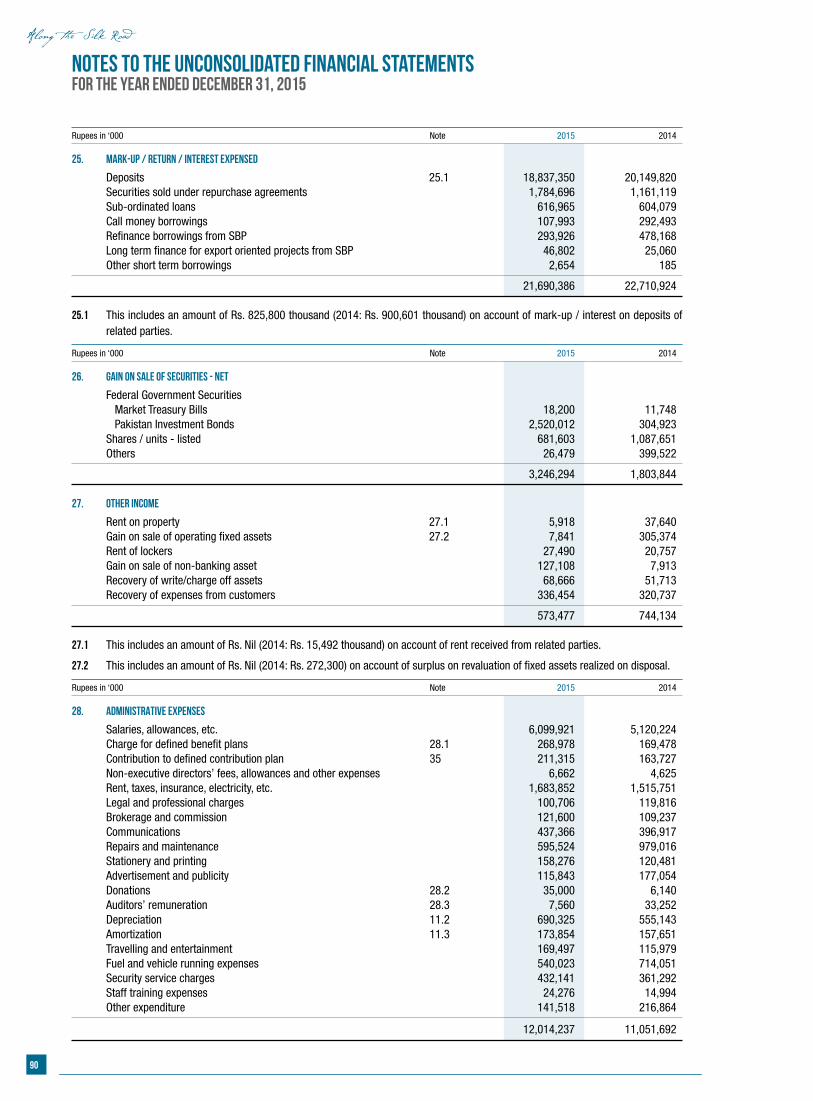
90
Notes to the Unconsolidated Financial StatementsFor the year ended December 31, 2015
Rupees in ‘000 Note 2015 2014
25. MARK-UP / RETURN / INTEREST EXPENSED
Deposits 25.1 18,837,350 20,149,820 Securities sold under repurchase agreements 1,784,696 1,161,119 Sub-ordinated loans 616,965 604,079 Call money borrowings 107,993 292,493 Refinance borrowings from SBP 293,926 478,168 Long term finance for export oriented projects from SBP 46,802 25,060 Other short term borrowings 2,654 185
21,690,386 22,710,924
25.1 This includes an amount of Rs. 825,800 thousand (2014: Rs. 900,601 thousand) on account of mark-up / interest on deposits of related parties.
Rupees in ‘000 Note 2015 2014
26. GAIN ON SALE OF SECURITIES - NET
Federal Government Securities Market Treasury Bills 18,200 11,748 Pakistan Investment Bonds 2,520,012 304,923 Shares / units - listed 681,603 1,087,651 Others 26,479 399,522
3,246,294 1,803,844 27. OTHER INCOME
Rent on property 27.1 5,918 37,640 Gain on sale of operating fixed assets 27.2 7,841 305,374 Rent of lockers 27,490 20,757 Gain on sale of non-banking asset 127,108 7,913 Recovery of write/charge off assets 68,666 51,713 Recovery of expenses from customers 336,454 320,737
573,477 744,134 27.1 This includes an amount of Rs. Nil (2014: Rs. 15,492 thousand) on account of rent received from related parties.
27.2 This includes an amount of Rs. Nil (2014: Rs. 272,300) on account of surplus on revaluation of fixed assets realized on disposal.
Rupees in ‘000 Note 2015 2014
28. ADMINISTRATIVE EXPENSES
Salaries, allowances, etc. 6,099,921 5,120,224 Charge for defined benefit plans 28.1 268,978 169,478 Contribution to defined contribution plan 35 211,315 163,727 Non-executive directors’ fees, allowances and other expenses 6,662 4,625 Rent, taxes, insurance, electricity, etc. 1,683,852 1,515,751 Legal and professional charges 100,706 119,816 Brokerage and commission 121,600 109,237 Communications 437,366 396,917 Repairs and maintenance 595,524 979,016 Stationery and printing 158,276 120,481 Advertisement and publicity 115,843 177,054 Donations 28.2 35,000 6,140 Auditors’ remuneration 28.3 7,560 33,252 Depreciation 11.2 690,325 555,143 Amortization 11.3 173,854 157,651 Travelling and entertainment 169,497 115,979 Fuel and vehicle running expenses 540,023 714,051 Security service charges 432,141 361,292 Staff training expenses 24,276 14,994 Other expenditure 141,518 216,864
12,014,237 11,051,692
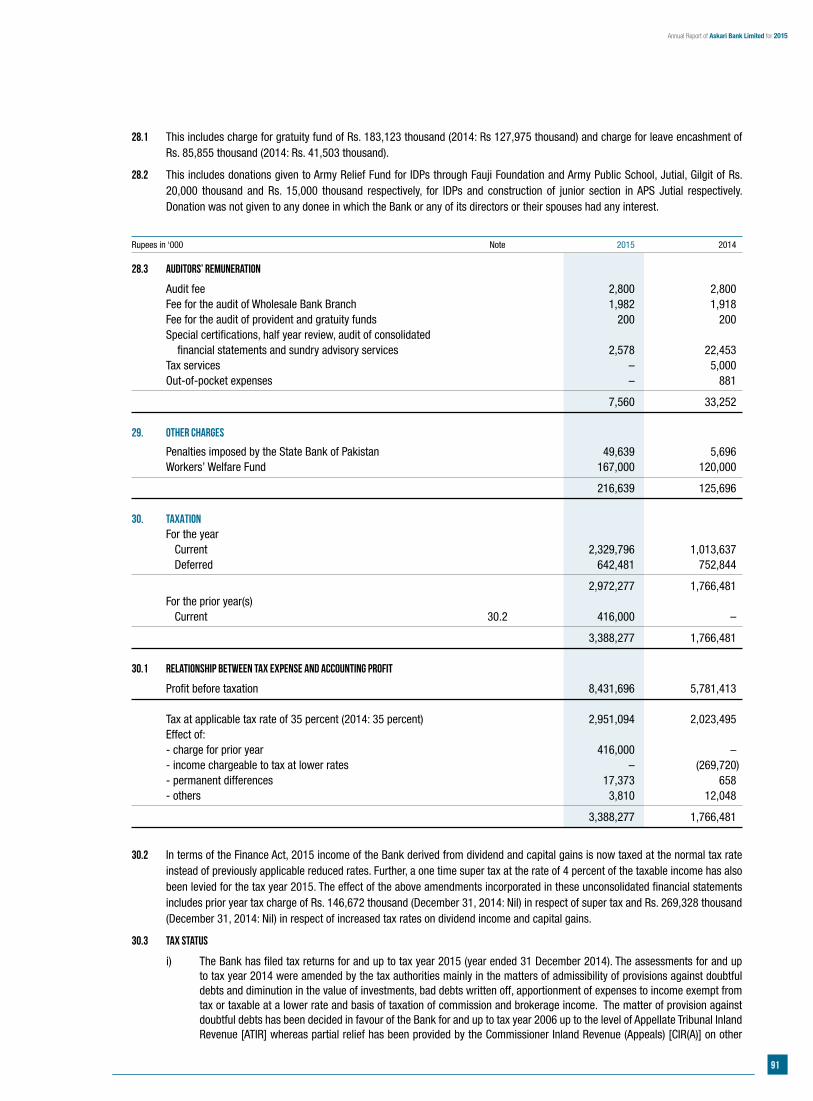
91
Annual Report of Askari Bank Limited for 2015
28.1 This includes charge for gratuity fund of Rs. 183,123 thousand (2014: Rs 127,975 thousand) and charge for leave encashment of Rs. 85,855 thousand (2014: Rs. 41,503 thousand).
28.2 This includes donations given to Army Relief Fund for IDPs through Fauji Foundation and Army Public School, Jutial, Gilgit of Rs. 20,000 thousand and Rs. 15,000 thousand respectively, for IDPs and construction of junior section in APS Jutial respectively. Donation was not given to any donee in which the Bank or any of its directors or their spouses had any interest.
Rupees in ‘000 Note 2015 2014
28.3 Auditors’ remuneration
Audit fee 2,800 2,800 Fee for the audit of Wholesale Bank Branch 1,982 1,918 Fee for the audit of provident and gratuity funds 200 200 Special certifications, half year review, audit of consolidated financial statements and sundry advisory services 2,578 22,453 Tax services – 5,000 Out-of-pocket expenses – 881
7,560 33,252 29. OTHER CHARGES
Penalties imposed by the State Bank of Pakistan 49,639 5,696 Workers’ Welfare Fund 167,000 120,000
216,639 125,696
30. TAXATION For the year Current 2,329,796 1,013,637 Deferred 642,481 752,844
2,972,277 1,766,481 For the prior year(s) Current 30.2 416,000 –
3,388,277 1,766,481 30.1 Relationship between tax expense and accounting profit
Profit before taxation 8,431,696 5,781,413 Tax at applicable tax rate of 35 percent (2014: 35 percent) 2,951,094 2,023,495 Effect of: - charge for prior year 416,000 – - income chargeable to tax at lower rates – (269,720) - permanent differences 17,373 658 - others 3,810 12,048
3,388,277 1,766,481
30.2 In terms of the Finance Act, 2015 income of the Bank derived from dividend and capital gains is now taxed at the normal tax rate instead of previously applicable reduced rates. Further, a one time super tax at the rate of 4 percent of the taxable income has also been levied for the tax year 2015. The effect of the above amendments incorporated in these unconsolidated financial statements includes prior year tax charge of Rs. 146,672 thousand (December 31, 2014: Nil) in respect of super tax and Rs. 269,328 thousand (December 31, 2014: Nil) in respect of increased tax rates on dividend income and capital gains.
30.3 Tax status
i) The Bank has filed tax returns for and up to tax year 2015 (year ended 31 December 2014). The assessments for and up to tax year 2014 were amended by the tax authorities mainly in the matters of admissibility of provisions against doubtful debts and diminution in the value of investments, bad debts written off, apportionment of expenses to income exempt from tax or taxable at a lower rate and basis of taxation of commission and brokerage income. The matter of provision against doubtful debts has been decided in favour of the Bank for and up to tax year 2006 up to the level of Appellate Tribunal Inland Revenue [ATIR] whereas partial relief has been provided by the Commissioner Inland Revenue (Appeals) [CIR(A)] on other
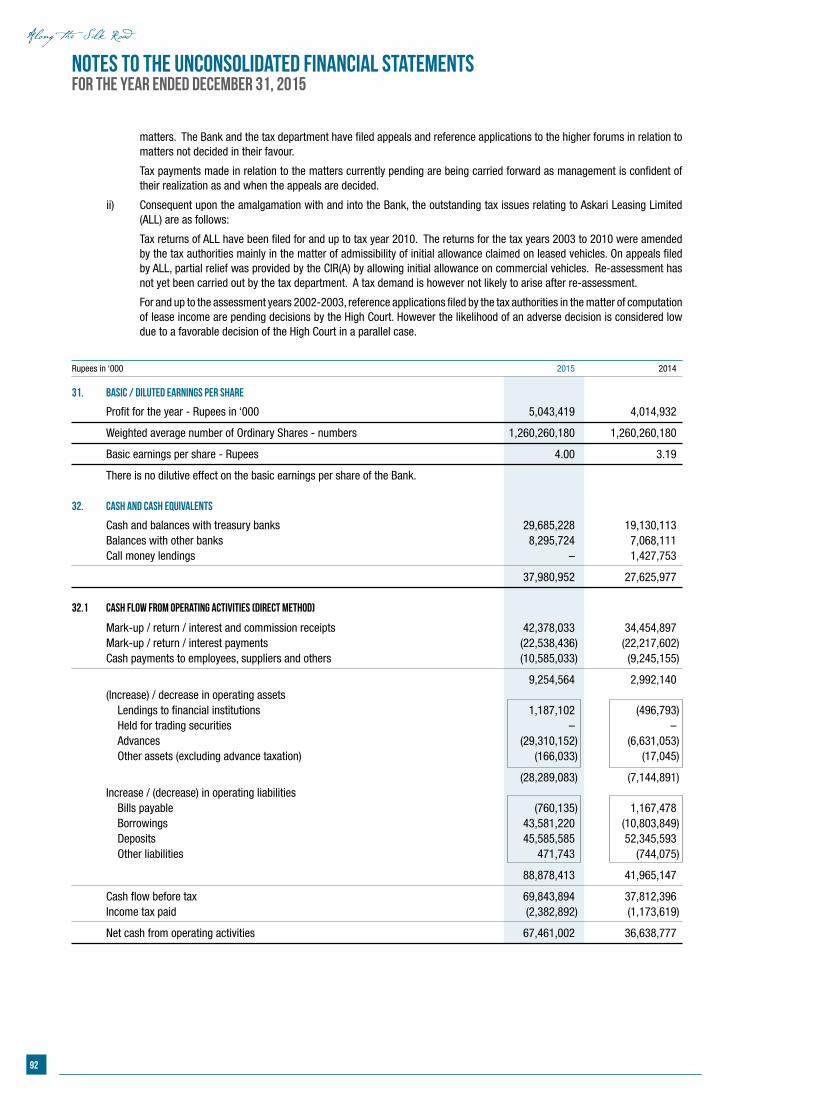
92
Notes to the Unconsolidated Financial StatementsFor the year ended December 31, 2015
matters. The Bank and the tax department have filed appeals and reference applications to the higher forums in relation to matters not decided in their favour.
Tax payments made in relation to the matters currently pending are being carried forward as management is confident of their realization as and when the appeals are decided.
ii) Consequent upon the amalgamation with and into the Bank, the outstanding tax issues relating to Askari Leasing Limited (ALL) are as follows:
Tax returns of ALL have been filed for and up to tax year 2010. The returns for the tax years 2003 to 2010 were amended by the tax authorities mainly in the matter of admissibility of initial allowance claimed on leased vehicles. On appeals filed by ALL, partial relief was provided by the CIR(A) by allowing initial allowance on commercial vehicles. Re-assessment has not yet been carried out by the tax department. A tax demand is however not likely to arise after re-assessment.
For and up to the assessment years 2002-2003, reference applications filed by the tax authorities in the matter of computation of lease income are pending decisions by the High Court. However the likelihood of an adverse decision is considered low due to a favorable decision of the High Court in a parallel case.
Rupees in ‘000 2015 2014
31. BASIC / DILUTED EARNINGS PER SHARE
Profit for the year - Rupees in ‘000 5,043,419 4,014,932
Weighted average number of Ordinary Shares - numbers 1,260,260,180 1,260,260,180
Basic earnings per share - Rupees 4.00 3.19
There is no dilutive effect on the basic earnings per share of the Bank. 32. CASH AND CASH EQUIVALENTS
Cash and balances with treasury banks 29,685,228 19,130,113 Balances with other banks 8,295,724 7,068,111 Call money lendings – 1,427,753
37,980,952 27,625,977 32.1 Cash flow from operating activities (Direct method)
Mark-up / return / interest and commission receipts 42,378,033 34,454,897 Mark-up / return / interest payments (22,538,436) (22,217,602) Cash payments to employees, suppliers and others (10,585,033) (9,245,155)
9,254,564 2,992,140 (Increase) / decrease in operating assets Lendings to financial institutions 1,187,102 (496,793) Held for trading securities – – Advances (29,310,152) (6,631,053) Other assets (excluding advance taxation) (166,033) (17,045)
(28,289,083) (7,144,891) Increase / (decrease) in operating liabilities Bills payable (760,135) 1,167,478 Borrowings 43,581,220 (10,803,849) Deposits 45,585,585 52,345,593 Other liabilities 471,743 (744,075)
88,878,413 41,965,147
Cash flow before tax 69,843,894 37,812,396 Income tax paid (2,382,892) (1,173,619)
Net cash from operating activities 67,461,002 36,638,777
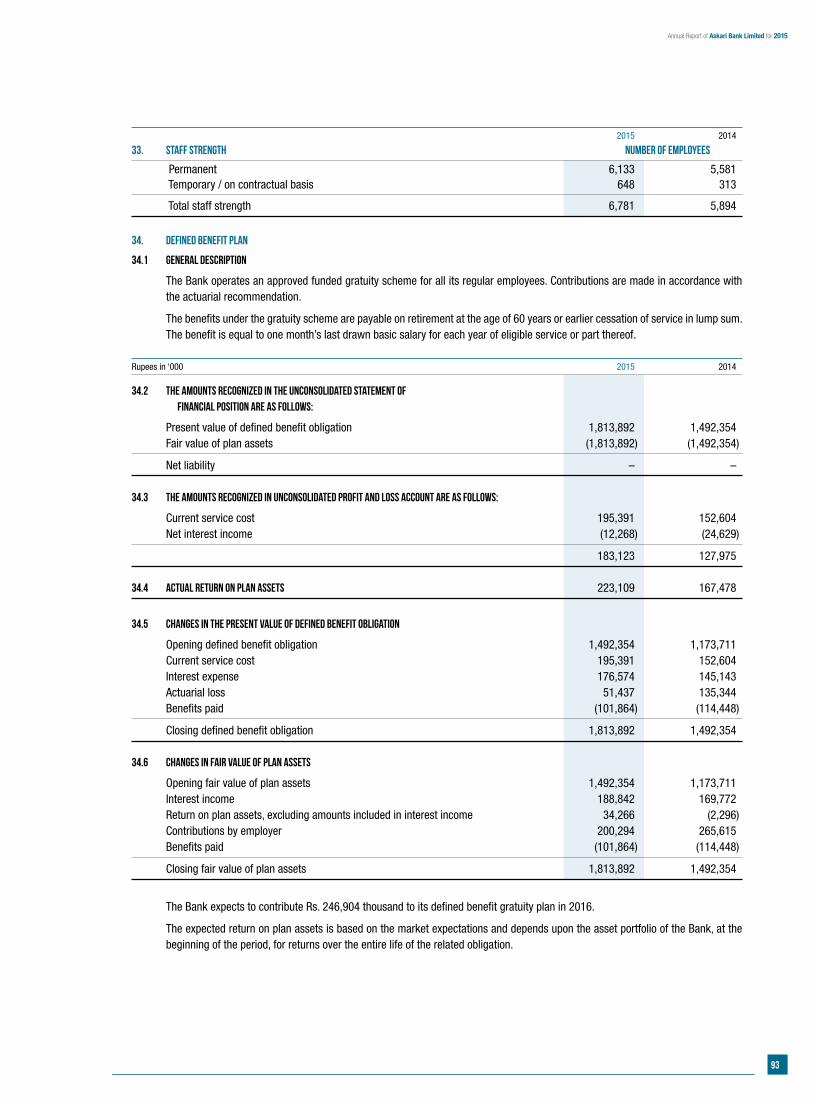
93
Annual Report of Askari Bank Limited for 2015
2015 2014
33. STAFF STRENGTH Number of employees
Permanent 6,133 5,581 Temporary / on contractual basis 648 313
Total staff strength 6,781 5,894
34. DEFINED BENEFIT PLAN
34.1 General description
The Bank operates an approved funded gratuity scheme for all its regular employees. Contributions are made in accordance with the actuarial recommendation.
The benefits under the gratuity scheme are payable on retirement at the age of 60 years or earlier cessation of service in lump sum. The benefit is equal to one month’s last drawn basic salary for each year of eligible service or part thereof.
Rupees in ‘000 2015 2014
34.2 The amounts recognized in the unconsolidated statement of financial position are as follows:
Present value of defined benefit obligation 1,813,892 1,492,354 Fair value of plan assets (1,813,892) (1,492,354)
Net liability – –
34.3 The amounts recognized in unconsolidated profit and loss account are as follows:
Current service cost 195,391 152,604 Net interest income (12,268) (24,629)
183,123 127,975 34.4 Actual return on plan assets 223,109 167,478
34.5 Changes in the present value of defined benefit obligation
Opening defined benefit obligation 1,492,354 1,173,711 Current service cost 195,391 152,604 Interest expense 176,574 145,143 Actuarial loss 51,437 135,344 Benefits paid (101,864) (114,448)
Closing defined benefit obligation 1,813,892 1,492,354 34.6 Changes in fair value of plan assets
Opening fair value of plan assets 1,492,354 1,173,711 Interest income 188,842 169,772 Return on plan assets, excluding amounts included in interest income 34,266 (2,296) Contributions by employer 200,294 265,615 Benefits paid (101,864) (114,448)
Closing fair value of plan assets 1,813,892 1,492,354
The Bank expects to contribute Rs. 246,904 thousand to its defined benefit gratuity plan in 2016.
The expected return on plan assets is based on the market expectations and depends upon the asset portfolio of the Bank, at the beginning of the period, for returns over the entire life of the related obligation.
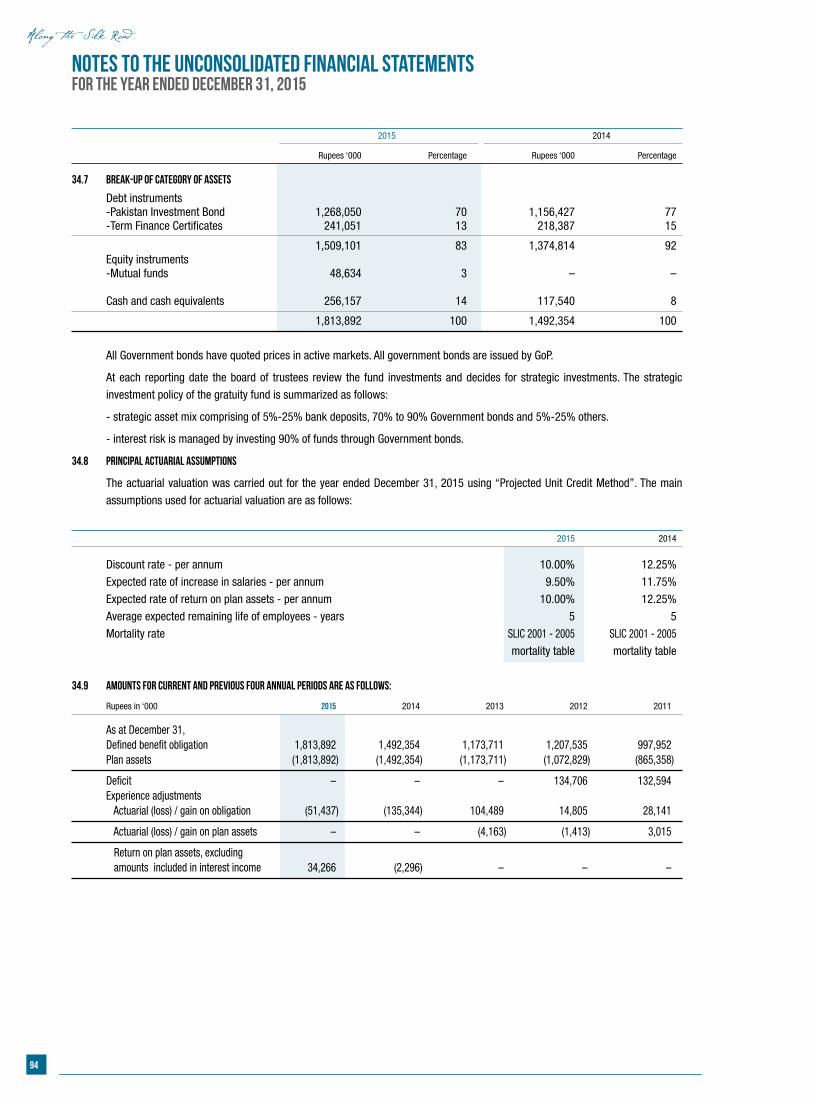
94
Notes to the Unconsolidated Financial StatementsFor the year ended December 31, 2015
2015 2014
Rupees ‘000 Percentage Rupees ‘000 Percentage
34.7 Break-up of category of assets
Debt instruments -Pakistan Investment Bond 1,268,050 70 1,156,427 77 -Term Finance Certificates 241,051 13 218,387 15
1,509,101 83 1,374,814 92 Equity instruments -Mutual funds 48,634 3 – – Cash and cash equivalents 256,157 14 117,540 8
1,813,892 100 1,492,354 100
All Government bonds have quoted prices in active markets. All government bonds are issued by GoP.
At each reporting date the board of trustees review the fund investments and decides for strategic investments. The strategic
investment policy of the gratuity fund is summarized as follows:
- strategic asset mix comprising of 5%-25% bank deposits, 70% to 90% Government bonds and 5%-25% others.
- interest risk is managed by investing 90% of funds through Government bonds.
34.8 Principal actuarial assumptions
The actuarial valuation was carried out for the year ended December 31, 2015 using “Projected Unit Credit Method”. The main
assumptions used for actuarial valuation are as follows:
2015 2014
Discount rate - per annum 10.00% 12.25%
Expected rate of increase in salaries - per annum 9.50% 11.75%
Expected rate of return on plan assets - per annum 10.00% 12.25%
Average expected remaining life of employees - years 5 5
Mortality rate SLIC 2001 - 2005 SLIC 2001 - 2005
mortality table mortality table
34.9 Amounts for current and previous four annual periods are as follows:
Rupees in ‘000 2015 2014 2013 2012 2011
As at December 31, Defined benefit obligation 1,813,892 1,492,354 1,173,711 1,207,535 997,952 Plan assets (1,813,892) (1,492,354) (1,173,711) (1,072,829) (865,358)
Deficit – – – 134,706 132,594 Experience adjustments Actuarial (loss) / gain on obligation (51,437) (135,344) 104,489 14,805 28,141
Actuarial (loss) / gain on plan assets – – (4,163) (1,413) 3,015
Return on plan assets, excluding amounts included in interest income 34,266 (2,296) – – –
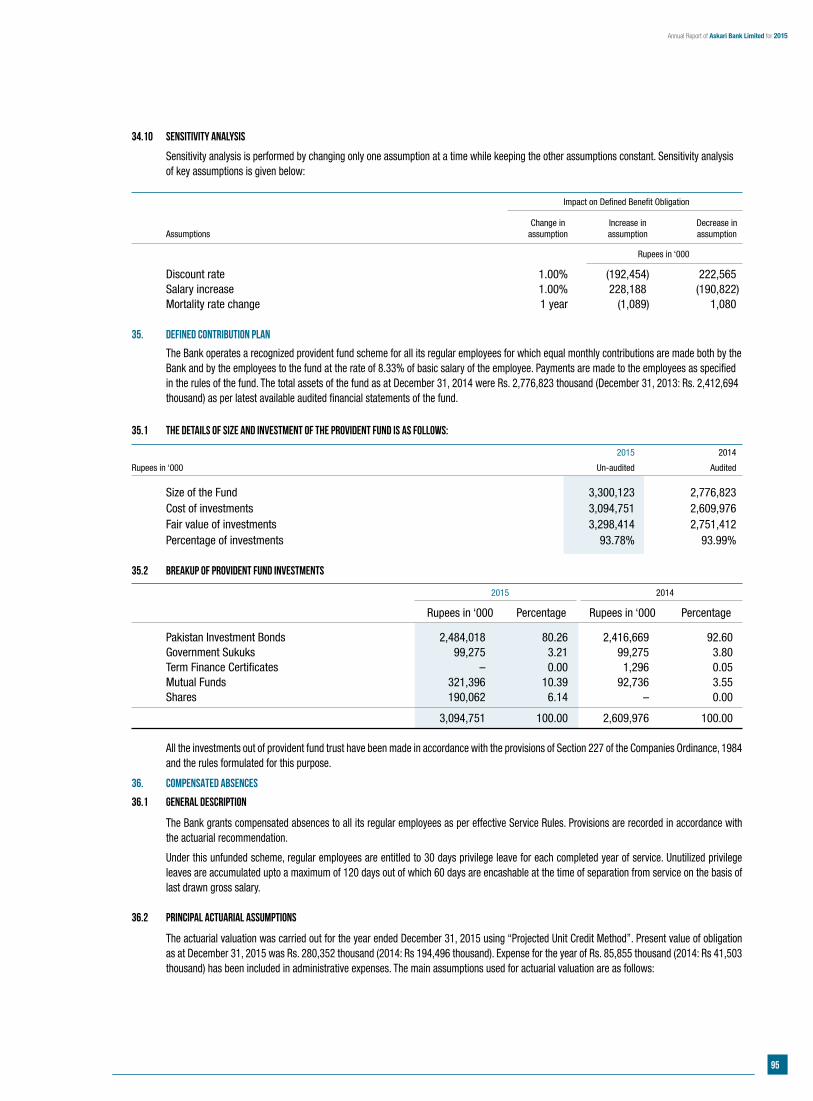
95
Annual Report of Askari Bank Limited for 2015
34.10 Sensitivity analysis
Sensitivity analysis is performed by changing only one assumption at a time while keeping the other assumptions constant. Sensitivity analysis of key assumptions is given below:
Impact on Defined Benefit Obligation
Change in Increase in Decrease in Assumptions assumption assumption assumption
Rupees in ‘000
Discount rate 1.00% (192,454) 222,565 Salary increase 1.00% 228,188 (190,822) Mortality rate change 1 year (1,089) 1,080 35. DEFINED CONTRIBUTION PLAN
The Bank operates a recognized provident fund scheme for all its regular employees for which equal monthly contributions are made both by the Bank and by the employees to the fund at the rate of 8.33% of basic salary of the employee. Payments are made to the employees as specified in the rules of the fund. The total assets of the fund as at December 31, 2014 were Rs. 2,776,823 thousand (December 31, 2013: Rs. 2,412,694 thousand) as per latest available audited financial statements of the fund.
35.1 The details of size and investment of the provident fund is as follows:
2015 2014
Rupees in ‘000 Un-audited Audited
Size of the Fund 3,300,123 2,776,823 Cost of investments 3,094,751 2,609,976 Fair value of investments 3,298,414 2,751,412 Percentage of investments 93.78% 93.99% 35.2 Breakup of provident fund investments
2015 2014
Rupees in ‘000 Percentage Rupees in ‘000 Percentage
Pakistan Investment Bonds 2,484,018 80.26 2,416,669 92.60 Government Sukuks 99,275 3.21 99,275 3.80 Term Finance Certificates – 0.00 1,296 0.05 Mutual Funds 321,396 10.39 92,736 3.55 Shares 190,062 6.14 – 0.00
3,094,751 100.00 2,609,976 100.00 All the investments out of provident fund trust have been made in accordance with the provisions of Section 227 of the Companies Ordinance, 1984
and the rules formulated for this purpose.
36. COMPENSATED ABSENCES
36.1 General description
The Bank grants compensated absences to all its regular employees as per effective Service Rules. Provisions are recorded in accordance with the actuarial recommendation.
Under this unfunded scheme, regular employees are entitled to 30 days privilege leave for each completed year of service. Unutilized privilege leaves are accumulated upto a maximum of 120 days out of which 60 days are encashable at the time of separation from service on the basis of last drawn gross salary.
36.2 Principal actuarial assumptions
The actuarial valuation was carried out for the year ended December 31, 2015 using “Projected Unit Credit Method”. Present value of obligation as at December 31, 2015 was Rs. 280,352 thousand (2014: Rs 194,496 thousand). Expense for the year of Rs. 85,855 thousand (2014: Rs 41,503 thousand) has been included in administrative expenses. The main assumptions used for actuarial valuation are as follows:
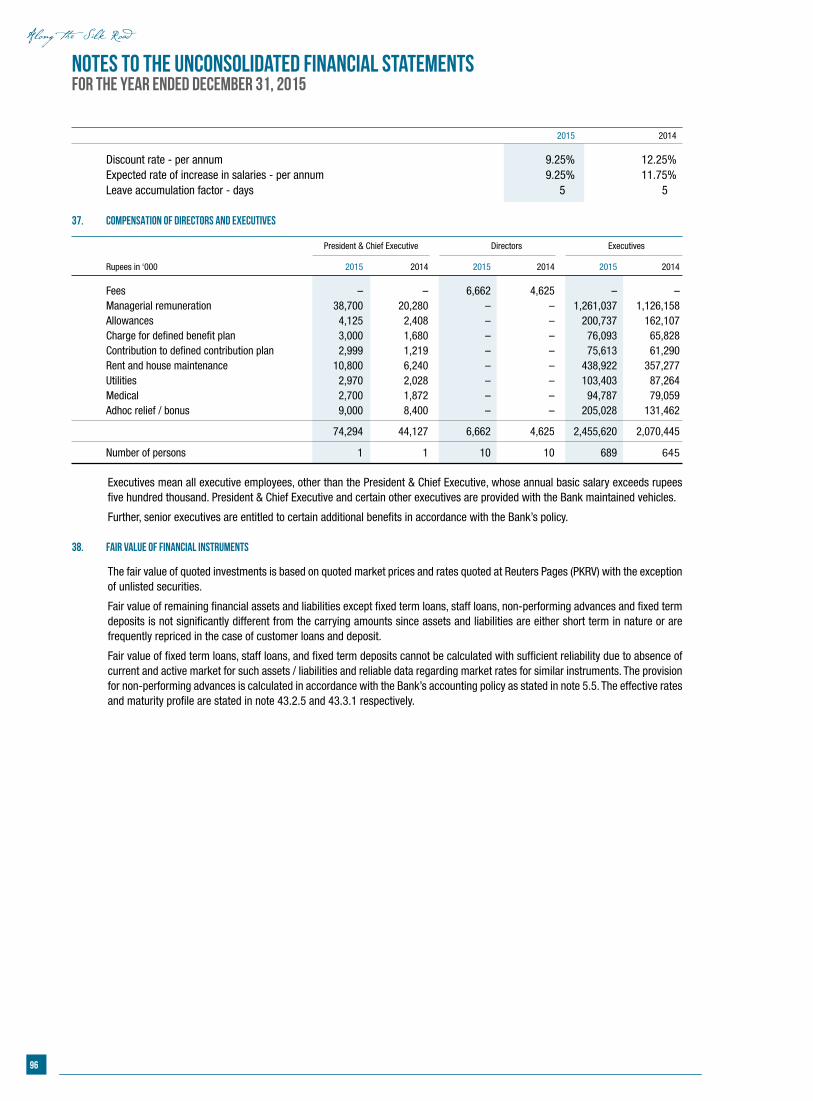
96
Notes to the Unconsolidated Financial StatementsFor the year ended December 31, 2015
2015 2014
Discount rate - per annum 9.25% 12.25% Expected rate of increase in salaries - per annum 9.25% 11.75% Leave accumulation factor - days 5 5
37. COMPENSATION OF DIRECTORS AND EXECUTIVES
President & Chief Executive Directors Executives
Rupees in ‘000 2015 2014 2015 2014 2015 2014
Fees – – 6,662 4,625 – – Managerial remuneration 38,700 20,280 – – 1,261,037 1,126,158 Allowances 4,125 2,408 – – 200,737 162,107 Charge for defined benefit plan 3,000 1,680 – – 76,093 65,828 Contribution to defined contribution plan 2,999 1,219 – – 75,613 61,290 Rent and house maintenance 10,800 6,240 – – 438,922 357,277 Utilities 2,970 2,028 – – 103,403 87,264 Medical 2,700 1,872 – – 94,787 79,059 Adhoc relief / bonus 9,000 8,400 – – 205,028 131,462
74,294 44,127 6,662 4,625 2,455,620 2,070,445
Number of persons 1 1 10 10 689 645 Executives mean all executive employees, other than the President & Chief Executive, whose annual basic salary exceeds rupees
five hundred thousand. President & Chief Executive and certain other executives are provided with the Bank maintained vehicles.
Further, senior executives are entitled to certain additional benefits in accordance with the Bank’s policy. 38. FAIR VALUE OF FINANCIAL INSTRUMENTS
The fair value of quoted investments is based on quoted market prices and rates quoted at Reuters Pages (PKRV) with the exception of unlisted securities.
Fair value of remaining financial assets and liabilities except fixed term loans, staff loans, non-performing advances and fixed term deposits is not significantly different from the carrying amounts since assets and liabilities are either short term in nature or are frequently repriced in the case of customer loans and deposit.
Fair value of fixed term loans, staff loans, and fixed term deposits cannot be calculated with sufficient reliability due to absence of current and active market for such assets / liabilities and reliable data regarding market rates for similar instruments. The provision for non-performing advances is calculated in accordance with the Bank’s accounting policy as stated in note 5.5. The effective rates and maturity profile are stated in note 43.2.5 and 43.3.1 respectively.
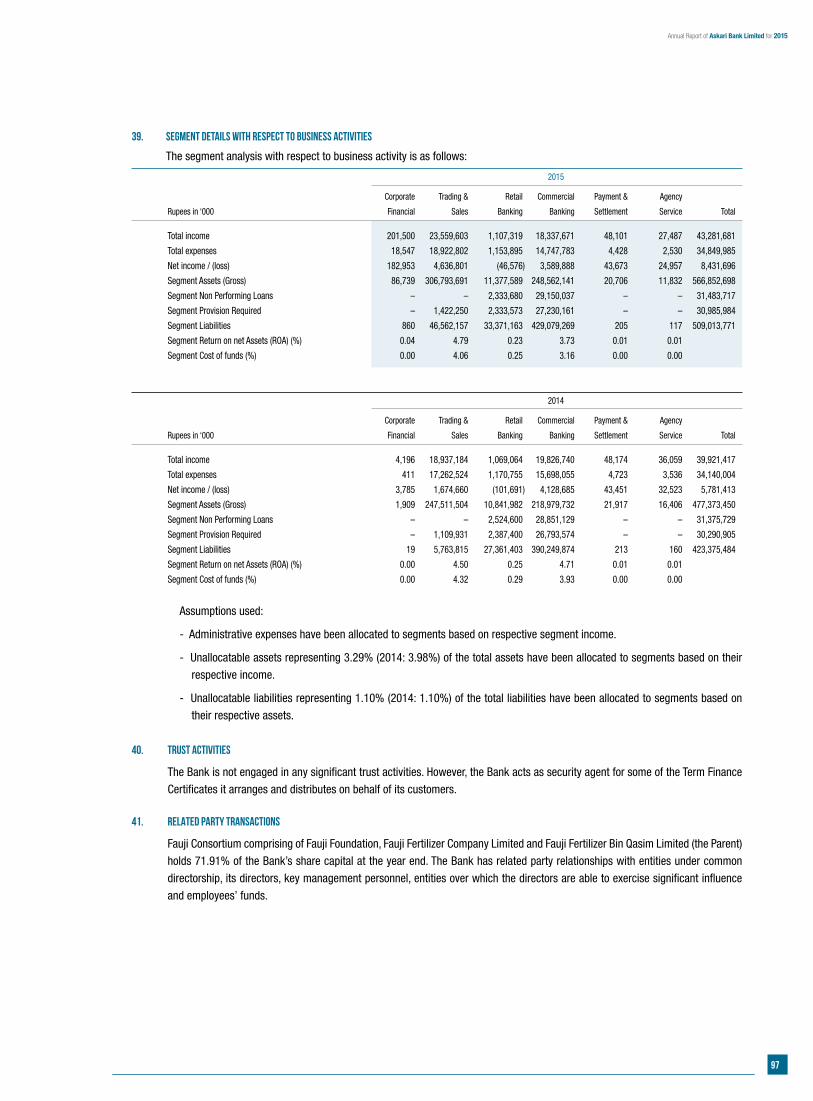
97
Annual Report of Askari Bank Limited for 2015
39. SEGMENT DETAILS WITH RESPECT TO BUSINESS ACTIVITIES
The segment analysis with respect to business activity is as follows:
2015
Corporate Trading & Retail Commercial Payment & Agency
Rupees in ‘000 Financial Sales Banking Banking Settlement Service Total
Total income 201,500 23,559,603 1,107,319 18,337,671 48,101 27,487 43,281,681
Total expenses 18,547 18,922,802 1,153,895 14,747,783 4,428 2,530 34,849,985
Net income / (loss) 182,953 4,636,801 (46,576) 3,589,888 43,673 24,957 8,431,696
Segment Assets (Gross) 86,739 306,793,691 11,377,589 248,562,141 20,706 11,832 566,852,698
Segment Non Performing Loans – – 2,333,680 29,150,037 – – 31,483,717
Segment Provision Required – 1,422,250 2,333,573 27,230,161 – – 30,985,984
Segment Liabilities 860 46,562,157 33,371,163 429,079,269 205 117 509,013,771
Segment Return on net Assets (ROA) (%) 0.04 4.79 0.23 3.73 0.01 0.01
Segment Cost of funds (%) 0.00 4.06 0.25 3.16 0.00 0.00
2014
Corporate Trading & Retail Commercial Payment & Agency
Rupees in ‘000 Financial Sales Banking Banking Settlement Service Total
Total income 4,196 18,937,184 1,069,064 19,826,740 48,174 36,059 39,921,417
Total expenses 411 17,262,524 1,170,755 15,698,055 4,723 3,536 34,140,004
Net income / (loss) 3,785 1,674,660 (101,691) 4,128,685 43,451 32,523 5,781,413
Segment Assets (Gross) 1,909 247,511,504 10,841,982 218,979,732 21,917 16,406 477,373,450
Segment Non Performing Loans – – 2,524,600 28,851,129 – – 31,375,729
Segment Provision Required – 1,109,931 2,387,400 26,793,574 – – 30,290,905
Segment Liabilities 19 5,763,815 27,361,403 390,249,874 213 160 423,375,484
Segment Return on net Assets (ROA) (%) 0.00 4.50 0.25 4.71 0.01 0.01
Segment Cost of funds (%) 0.00 4.32 0.29 3.93 0.00 0.00
Assumptions used:
- Administrative expenses have been allocated to segments based on respective segment income.
- Unallocatable assets representing 3.29% (2014: 3.98%) of the total assets have been allocated to segments based on their
respective income.
- Unallocatable liabilities representing 1.10% (2014: 1.10%) of the total liabilities have been allocated to segments based on
their respective assets.
40. TRUST ACTIVITIES
The Bank is not engaged in any significant trust activities. However, the Bank acts as security agent for some of the Term Finance
Certificates it arranges and distributes on behalf of its customers.
41. RELATED PARTY TRANSACTIONS
Fauji Consortium comprising of Fauji Foundation, Fauji Fertilizer Company Limited and Fauji Fertilizer Bin Qasim Limited (the Parent)
holds 71.91% of the Bank’s share capital at the year end. The Bank has related party relationships with entities under common
directorship, its directors, key management personnel, entities over which the directors are able to exercise significant influence
and employees’ funds.
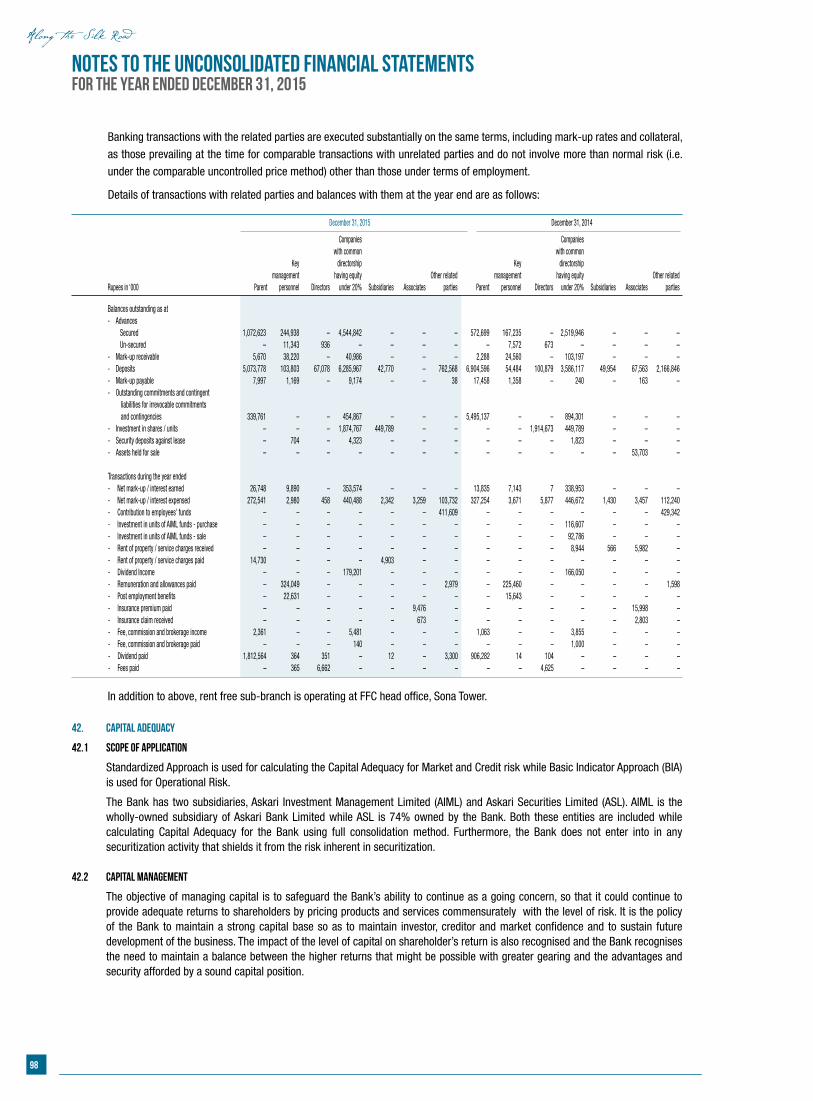
98
Notes to the Unconsolidated Financial StatementsFor the year ended December 31, 2015
Banking transactions with the related parties are executed substantially on the same terms, including mark-up rates and collateral,
as those prevailing at the time for comparable transactions with unrelated parties and do not involve more than normal risk (i.e.
under the comparable uncontrolled price method) other than those under terms of employment.
Details of transactions with related parties and balances with them at the year end are as follows:
December 31, 2015 December 31, 2014
Companies Companies with common with common Key directorship Key directorship management having equity Other related management having equity Other related Rupees in ‘000 Parent personnel Directors under 20% Subsidiaries Associates parties Parent personnel Directors under 20% Subsidiaries Associates parties
Balances outstanding as at - Advances Secured 1,072,623 244,938 – 4,544,842 – – – 572,699 167,235 – 2,519,946 – – – Un-secured – 11,343 936 – – – – – 7,572 673 – – – – - Mark-up receivable 5,670 38,220 – 40,986 – – – 2,288 24,560 – 103,197 – – – - Deposits 5,073,778 103,803 67,078 6,285,967 42,770 – 762,568 6,904,596 54,484 100,879 3,586,117 49,954 67,563 2,166,846 - Mark-up payable 7,997 1,169 – 9,174 – – 38 17,458 1,358 – 240 – 163 – - Outstanding commitments and contingent liabilities for irrevocable commitments and contingencies 339,761 – – 454,867 – – – 5,495,137 – – 894,301 – – – - Investment in shares / units – – – 1,874,767 449,789 – – – – 1,914,673 449,789 – – – - Security deposits against lease – 704 – 4,323 – – – – – – 1,823 – – – - Assets held for sale – – – – – – – – – – – – 53,703 – Transactions during the year ended - Net mark-up / interest earned 26,748 9,890 – 353,574 – – – 13,835 7,143 7 338,953 – – – - Net mark-up / interest expensed 272,541 2,980 458 440,488 2,342 3,259 103,732 327,254 3,671 5,877 446,672 1,430 3,457 112,240 - Contribution to employees’ funds – – – – – – 411,609 – – – – – – 429,342 - Investment in units of AIML funds - purchase – – – – – – – – – – 116,607 – – – - Investment in units of AIML funds - sale – – – – – – – – – – 92,786 – – – - Rent of property / service charges received – – – – – – – – – – 8,944 566 5,982 – - Rent of property / service charges paid 14,730 – – – 4,903 – – – – – – – – – - Dividend Income – – – 179,201 – – – – – – 166,050 – – – - Remuneration and allowances paid – 324,049 – – – – 2,979 – 225,460 – – – – 1,598 - Post employment benefits – 22,631 – – – – – – 15,643 – – – – – - Insurance premium paid – – – – – 9,476 – – – – – – 15,998 – - Insurance claim received – – – – – 673 – – – – – – 2,803 – - Fee, commission and brokerage income 2,361 – – 5,481 – – – 1,063 – – 3,855 – – – - Fee, commission and brokerage paid – – – 140 – – – – – – 1,000 – – – - Dividend paid 1,812,564 364 351 – 12 – 3,300 906,282 14 104 – – – – - Fees paid – 365 6,662 – – – – – – 4,625 – – – –
In addition to above, rent free sub-branch is operating at FFC head office, Sona Tower.
42. CAPITAL ADEQUACY
42.1 Scope of Application
Standardized Approach is used for calculating the Capital Adequacy for Market and Credit risk while Basic Indicator Approach (BIA) is used for Operational Risk.
The Bank has two subsidiaries, Askari Investment Management Limited (AIML) and Askari Securities Limited (ASL). AIML is the wholly-owned subsidiary of Askari Bank Limited while ASL is 74% owned by the Bank. Both these entities are included while calculating Capital Adequacy for the Bank using full consolidation method. Furthermore, the Bank does not enter into in any securitization activity that shields it from the risk inherent in securitization.
42.2 Capital Management
The objective of managing capital is to safeguard the Bank’s ability to continue as a going concern, so that it could continue to provide adequate returns to shareholders by pricing products and services commensurately with the level of risk. It is the policy of the Bank to maintain a strong capital base so as to maintain investor, creditor and market confidence and to sustain future development of the business. The impact of the level of capital on shareholder’s return is also recognised and the Bank recognises the need to maintain a balance between the higher returns that might be possible with greater gearing and the advantages and security afforded by a sound capital position.
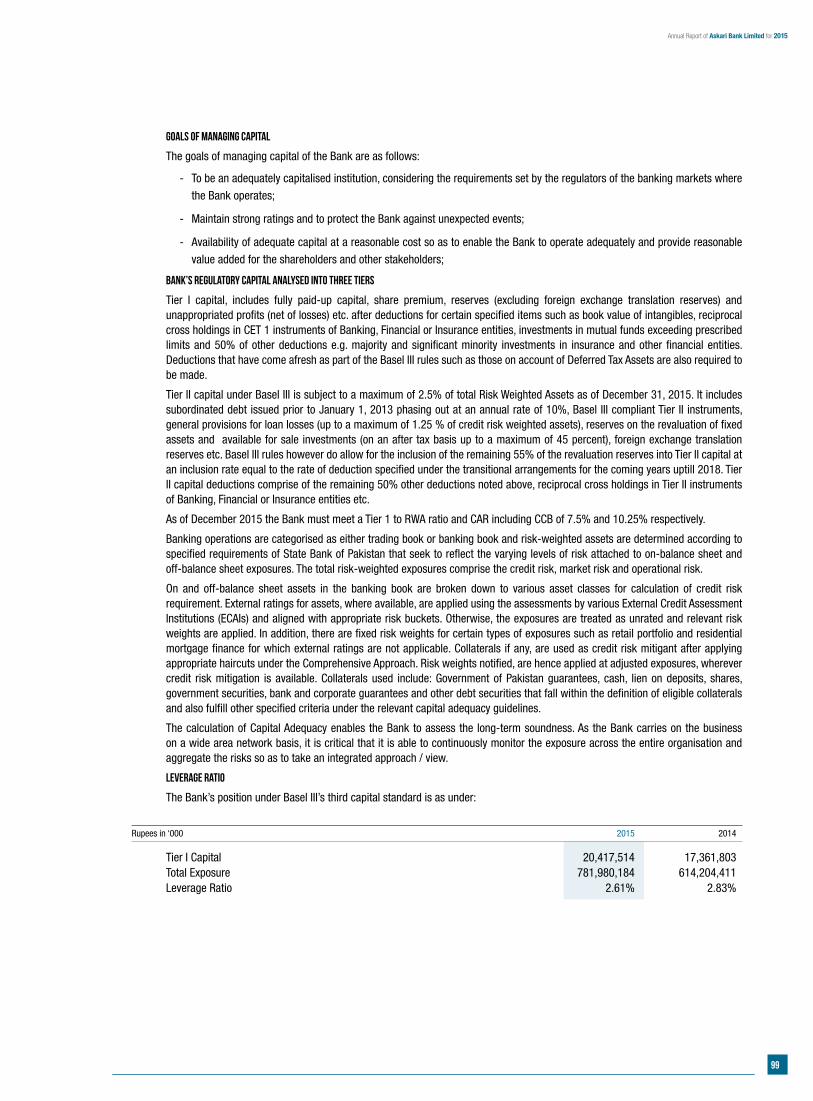
99
Annual Report of Askari Bank Limited for 2015
Goals of managing capital
The goals of managing capital of the Bank are as follows:
- To be an adequately capitalised institution, considering the requirements set by the regulators of the banking markets where
the Bank operates;
- Maintain strong ratings and to protect the Bank against unexpected events;
- Availability of adequate capital at a reasonable cost so as to enable the Bank to operate adequately and provide reasonable
value added for the shareholders and other stakeholders;
Bank’s regulatory capital analysed into three tiers
Tier I capital, includes fully paid-up capital, share premium, reserves (excluding foreign exchange translation reserves) and unappropriated profits (net of losses) etc. after deductions for certain specified items such as book value of intangibles, reciprocal cross holdings in CET 1 instruments of Banking, Financial or Insurance entities, investments in mutual funds exceeding prescribed limits and 50% of other deductions e.g. majority and significant minority investments in insurance and other financial entities. Deductions that have come afresh as part of the Basel III rules such as those on account of Deferred Tax Assets are also required to be made.
Tier II capital under Basel III is subject to a maximum of 2.5% of total Risk Weighted Assets as of December 31, 2015. It includes subordinated debt issued prior to January 1, 2013 phasing out at an annual rate of 10%, Basel III compliant Tier II instruments, general provisions for loan losses (up to a maximum of 1.25 % of credit risk weighted assets), reserves on the revaluation of fixed assets and available for sale investments (on an after tax basis up to a maximum of 45 percent), foreign exchange translation reserves etc. Basel III rules however do allow for the inclusion of the remaining 55% of the revaluation reserves into Tier II capital at an inclusion rate equal to the rate of deduction specified under the transitional arrangements for the coming years uptill 2018. Tier II capital deductions comprise of the remaining 50% other deductions noted above, reciprocal cross holdings in Tier II instruments of Banking, Financial or Insurance entities etc.
As of December 2015 the Bank must meet a Tier 1 to RWA ratio and CAR including CCB of 7.5% and 10.25% respectively.
Banking operations are categorised as either trading book or banking book and risk-weighted assets are determined according to specified requirements of State Bank of Pakistan that seek to reflect the varying levels of risk attached to on-balance sheet and off-balance sheet exposures. The total risk-weighted exposures comprise the credit risk, market risk and operational risk.
On and off-balance sheet assets in the banking book are broken down to various asset classes for calculation of credit risk requirement. External ratings for assets, where available, are applied using the assessments by various External Credit Assessment Institutions (ECAIs) and aligned with appropriate risk buckets. Otherwise, the exposures are treated as unrated and relevant risk weights are applied. In addition, there are fixed risk weights for certain types of exposures such as retail portfolio and residential mortgage finance for which external ratings are not applicable. Collaterals if any, are used as credit risk mitigant after applying appropriate haircuts under the Comprehensive Approach. Risk weights notified, are hence applied at adjusted exposures, wherever credit risk mitigation is available. Collaterals used include: Government of Pakistan guarantees, cash, lien on deposits, shares, government securities, bank and corporate guarantees and other debt securities that fall within the definition of eligible collaterals and also fulfill other specified criteria under the relevant capital adequacy guidelines.
The calculation of Capital Adequacy enables the Bank to assess the long-term soundness. As the Bank carries on the business on a wide area network basis, it is critical that it is able to continuously monitor the exposure across the entire organisation and aggregate the risks so as to take an integrated approach / view.
Leverage Ratio
The Bank’s position under Basel III’s third capital standard is as under:
Rupees in ‘000 2015 2014
Tier I Capital 20,417,514 17,361,803 Total Exposure 781,980,184 614,204,411 Leverage Ratio 2.61% 2.83%
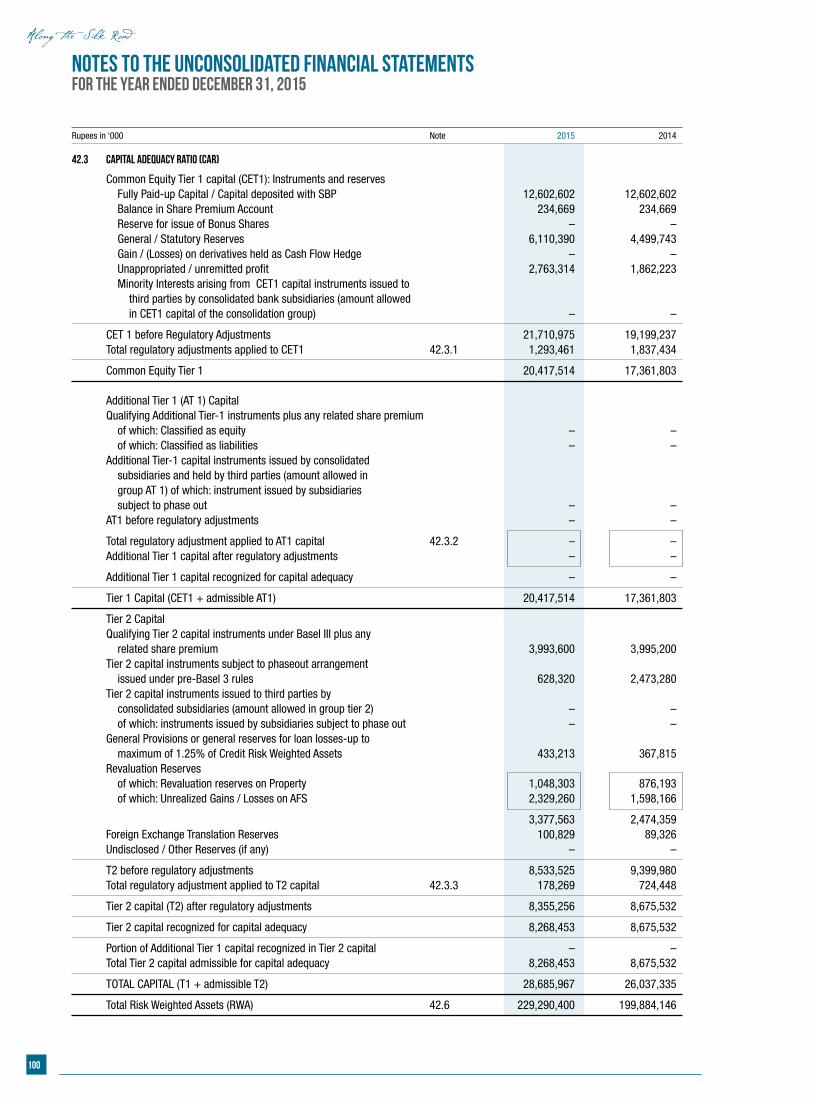
100
Notes to the Unconsolidated Financial StatementsFor the year ended December 31, 2015
Rupees in ‘000 Note 2015 2014
42.3 Capital Adequacy Ratio (CAR)
Common Equity Tier 1 capital (CET1): Instruments and reserves Fully Paid-up Capital / Capital deposited with SBP 12,602,602 12,602,602 Balance in Share Premium Account 234,669 234,669 Reserve for issue of Bonus Shares – – General / Statutory Reserves 6,110,390 4,499,743 Gain / (Losses) on derivatives held as Cash Flow Hedge – – Unappropriated / unremitted profit 2,763,314 1,862,223 Minority Interests arising from CET1 capital instruments issued to third parties by consolidated bank subsidiaries (amount allowed in CET1 capital of the consolidation group) – –
CET 1 before Regulatory Adjustments 21,710,975 19,199,237 Total regulatory adjustments applied to CET1 42.3.1 1,293,461 1,837,434
Common Equity Tier 1 20,417,514 17,361,803 Additional Tier 1 (AT 1) Capital Qualifying Additional Tier-1 instruments plus any related share premium of which: Classified as equity – – of which: Classified as liabilities – – Additional Tier-1 capital instruments issued by consolidated subsidiaries and held by third parties (amount allowed in group AT 1) of which: instrument issued by subsidiaries subject to phase out – – AT1 before regulatory adjustments – –
Total regulatory adjustment applied to AT1 capital 42.3.2 – – Additional Tier 1 capital after regulatory adjustments – –
Additional Tier 1 capital recognized for capital adequacy – –
Tier 1 Capital (CET1 + admissible AT1) 20,417,514 17,361,803
Tier 2 Capital Qualifying Tier 2 capital instruments under Basel III plus any related share premium 3,993,600 3,995,200 Tier 2 capital instruments subject to phaseout arrangement issued under pre-Basel 3 rules 628,320 2,473,280 Tier 2 capital instruments issued to third parties by consolidated subsidiaries (amount allowed in group tier 2) – – of which: instruments issued by subsidiaries subject to phase out – – General Provisions or general reserves for loan losses-up to maximum of 1.25% of Credit Risk Weighted Assets 433,213 367,815 Revaluation Reserves of which: Revaluation reserves on Property 1,048,303 876,193 of which: Unrealized Gains / Losses on AFS 2,329,260 1,598,166
3,377,563 2,474,359 Foreign Exchange Translation Reserves 100,829 89,326 Undisclosed / Other Reserves (if any) – –
T2 before regulatory adjustments 8,533,525 9,399,980 Total regulatory adjustment applied to T2 capital 42.3.3 178,269 724,448
Tier 2 capital (T2) after regulatory adjustments 8,355,256 8,675,532
Tier 2 capital recognized for capital adequacy 8,268,453 8,675,532
Portion of Additional Tier 1 capital recognized in Tier 2 capital – – Total Tier 2 capital admissible for capital adequacy 8,268,453 8,675,532
TOTAL CAPITAL (T1 + admissible T2) 28,685,967 26,037,335
Total Risk Weighted Assets (RWA) 42.6 229,290,400 199,884,146
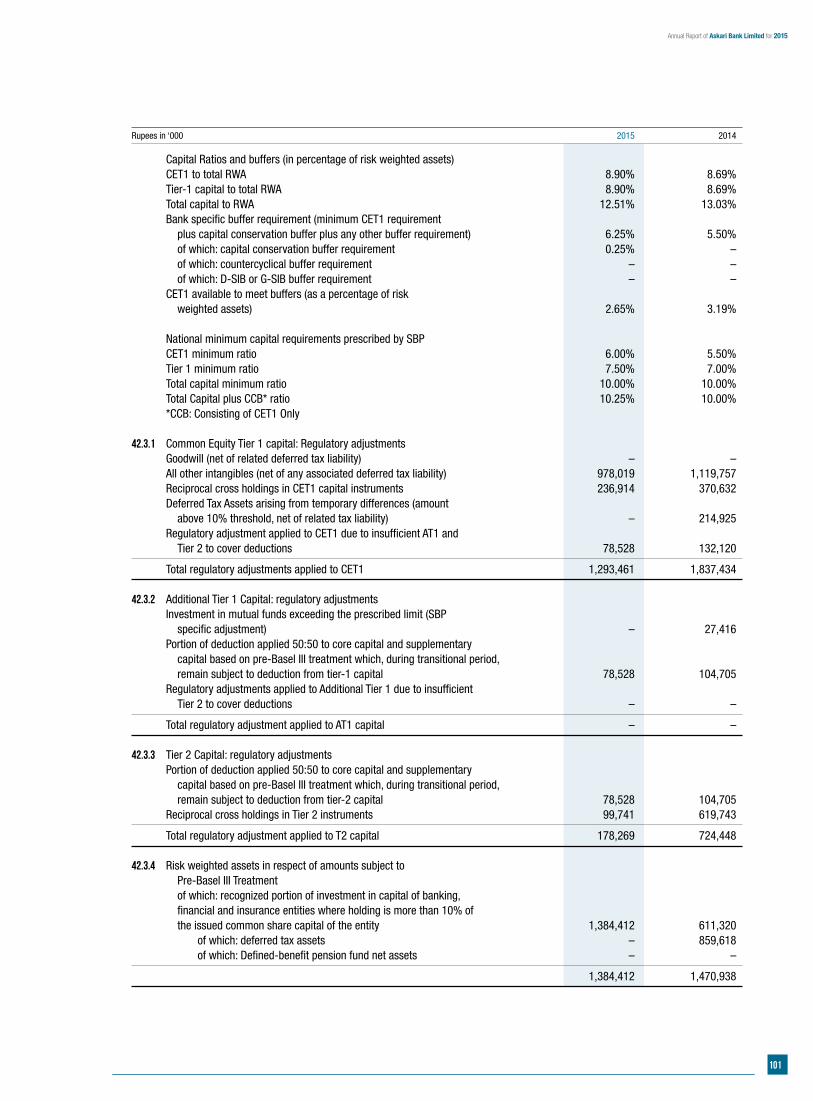
101
Annual Report of Askari Bank Limited for 2015
Rupees in ‘000 2015 2014
Capital Ratios and buffers (in percentage of risk weighted assets) CET1 to total RWA 8.90% 8.69% Tier-1 capital to total RWA 8.90% 8.69% Total capital to RWA 12.51% 13.03% Bank specific buffer requirement (minimum CET1 requirement plus capital conservation buffer plus any other buffer requirement) 6.25% 5.50% of which: capital conservation buffer requirement 0.25% – of which: countercyclical buffer requirement – – of which: D-SIB or G-SIB buffer requirement – – CET1 available to meet buffers (as a percentage of risk weighted assets) 2.65% 3.19% National minimum capital requirements prescribed by SBP CET1 minimum ratio 6.00% 5.50% Tier 1 minimum ratio 7.50% 7.00% Total capital minimum ratio 10.00% 10.00% Total Capital plus CCB* ratio 10.25% 10.00% *CCB: Consisting of CET1 Only
42.3.1 Common Equity Tier 1 capital: Regulatory adjustments Goodwill (net of related deferred tax liability) – – All other intangibles (net of any associated deferred tax liability) 978,019 1,119,757 Reciprocal cross holdings in CET1 capital instruments 236,914 370,632 Deferred Tax Assets arising from temporary differences (amount above 10% threshold, net of related tax liability) – 214,925 Regulatory adjustment applied to CET1 due to insufficient AT1 and Tier 2 to cover deductions 78,528 132,120
Total regulatory adjustments applied to CET1 1,293,461 1,837,434 42.3.2 Additional Tier 1 Capital: regulatory adjustments Investment in mutual funds exceeding the prescribed limit (SBP specific adjustment) – 27,416 Portion of deduction applied 50:50 to core capital and supplementary capital based on pre-Basel III treatment which, during transitional period, remain subject to deduction from tier-1 capital 78,528 104,705 Regulatory adjustments applied to Additional Tier 1 due to insufficient Tier 2 to cover deductions – –
Total regulatory adjustment applied to AT1 capital – – 42.3.3 Tier 2 Capital: regulatory adjustments Portion of deduction applied 50:50 to core capital and supplementary capital based on pre-Basel III treatment which, during transitional period, remain subject to deduction from tier-2 capital 78,528 104,705 Reciprocal cross holdings in Tier 2 instruments 99,741 619,743
Total regulatory adjustment applied to T2 capital 178,269 724,448 42.3.4 Risk weighted assets in respect of amounts subject to Pre-Basel III Treatment of which: recognized portion of investment in capital of banking, financial and insurance entities where holding is more than 10% of the issued common share capital of the entity 1,384,412 611,320 of which: deferred tax assets – 859,618 of which: Defined-benefit pension fund net assets – –
1,384,412 1,470,938
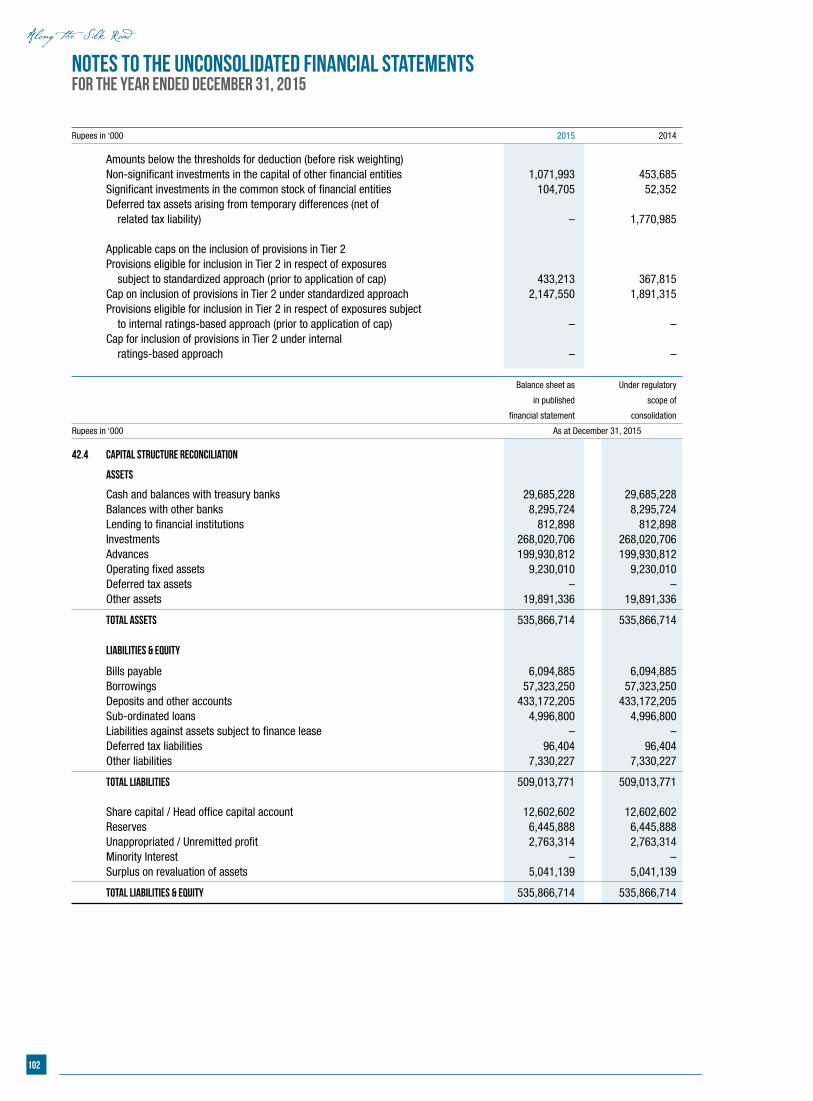
102
Notes to the Unconsolidated Financial StatementsFor the year ended December 31, 2015
Rupees in ‘000 2015 2014
Amounts below the thresholds for deduction (before risk weighting) Non-significant investments in the capital of other financial entities 1,071,993 453,685 Significant investments in the common stock of financial entities 104,705 52,352 Deferred tax assets arising from temporary differences (net of related tax liability) – 1,770,985 Applicable caps on the inclusion of provisions in Tier 2 Provisions eligible for inclusion in Tier 2 in respect of exposures subject to standardized approach (prior to application of cap) 433,213 367,815 Cap on inclusion of provisions in Tier 2 under standardized approach 2,147,550 1,891,315 Provisions eligible for inclusion in Tier 2 in respect of exposures subject to internal ratings-based approach (prior to application of cap) – – Cap for inclusion of provisions in Tier 2 under internal ratings-based approach – –
Balance sheet as Under regulatory
in published scope of
financial statement consolidation
Rupees in ‘000 As at December 31, 2015
42.4 Capital Structure Reconciliation
Assets
Cash and balances with treasury banks 29,685,228 29,685,228 Balances with other banks 8,295,724 8,295,724 Lending to financial institutions 812,898 812,898 Investments 268,020,706 268,020,706 Advances 199,930,812 199,930,812 Operating fixed assets 9,230,010 9,230,010 Deferred tax assets – – Other assets 19,891,336 19,891,336
Total assets 535,866,714 535,866,714
Liabilities & Equity
Bills payable 6,094,885 6,094,885 Borrowings 57,323,250 57,323,250 Deposits and other accounts 433,172,205 433,172,205 Sub-ordinated loans 4,996,800 4,996,800 Liabilities against assets subject to finance lease – – Deferred tax liabilities 96,404 96,404 Other liabilities 7,330,227 7,330,227
Total liabilities 509,013,771 509,013,771
Share capital / Head office capital account 12,602,602 12,602,602 Reserves 6,445,888 6,445,888 Unappropriated / Unremitted profit 2,763,314 2,763,314 Minority Interest – – Surplus on revaluation of assets 5,041,139 5,041,139
Total liabilities & equity 535,866,714 535,866,714
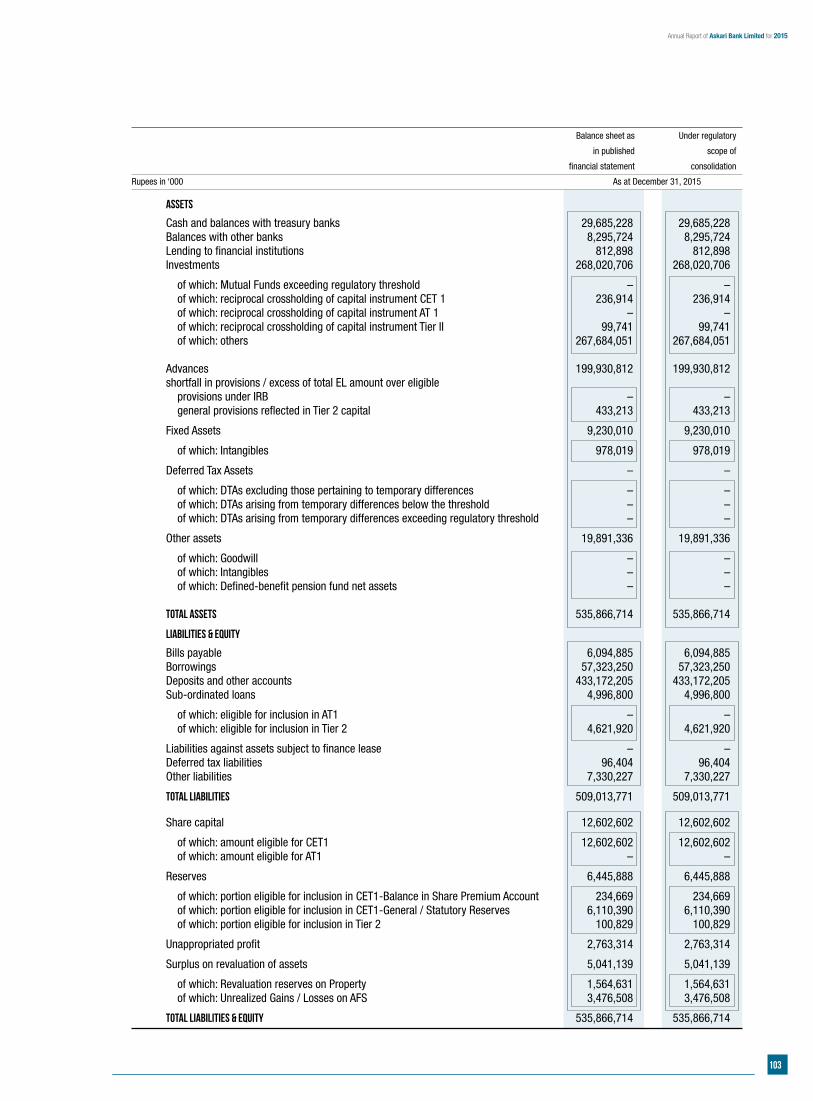
103
Annual Report of Askari Bank Limited for 2015
Balance sheet as Under regulatory
in published scope of
financial statement consolidation
Rupees in ‘000 As at December 31, 2015
Assets
Cash and balances with treasury banks 29,685,228 29,685,228 Balances with other banks 8,295,724 8,295,724 Lending to financial institutions 812,898 812,898 Investments 268,020,706 268,020,706
of which: Mutual Funds exceeding regulatory threshold – – of which: reciprocal crossholding of capital instrument CET 1 236,914 236,914 of which: reciprocal crossholding of capital instrument AT 1 – – of which: reciprocal crossholding of capital instrument Tier II 99,741 99,741 of which: others 267,684,051 267,684,051 Advances 199,930,812 199,930,812 shortfall in provisions / excess of total EL amount over eligible provisions under IRB – – general provisions reflected in Tier 2 capital 433,213 433,213
Fixed Assets 9,230,010 9,230,010
of which: Intangibles 978,019 978,019
Deferred Tax Assets – –
of which: DTAs excluding those pertaining to temporary differences – – of which: DTAs arising from temporary differences below the threshold – – of which: DTAs arising from temporary differences exceeding regulatory threshold – –
Other assets 19,891,336 19,891,336
of which: Goodwill – – of which: Intangibles – – of which: Defined-benefit pension fund net assets – –
Total assets 535,866,714 535,866,714
Liabilities & Equity
Bills payable 6,094,885 6,094,885 Borrowings 57,323,250 57,323,250 Deposits and other accounts 433,172,205 433,172,205 Sub-ordinated loans 4,996,800 4,996,800
of which: eligible for inclusion in AT1 – – of which: eligible for inclusion in Tier 2 4,621,920 4,621,920
Liabilities against assets subject to finance lease – – Deferred tax liabilities 96,404 96,404 Other liabilities 7,330,227 7,330,227
Total liabilities 509,013,771 509,013,771
Share capital 12,602,602 12,602,602
of which: amount eligible for CET1 12,602,602 12,602,602 of which: amount eligible for AT1 – –
Reserves 6,445,888 6,445,888
of which: portion eligible for inclusion in CET1-Balance in Share Premium Account 234,669 234,669 of which: portion eligible for inclusion in CET1-General / Statutory Reserves 6,110,390 6,110,390 of which: portion eligible for inclusion in Tier 2 100,829 100,829
Unappropriated profit 2,763,314 2,763,314
Surplus on revaluation of assets 5,041,139 5,041,139
of which: Revaluation reserves on Property 1,564,631 1,564,631 of which: Unrealized Gains / Losses on AFS 3,476,508 3,476,508
Total liabilities & Equity 535,866,714 535,866,714
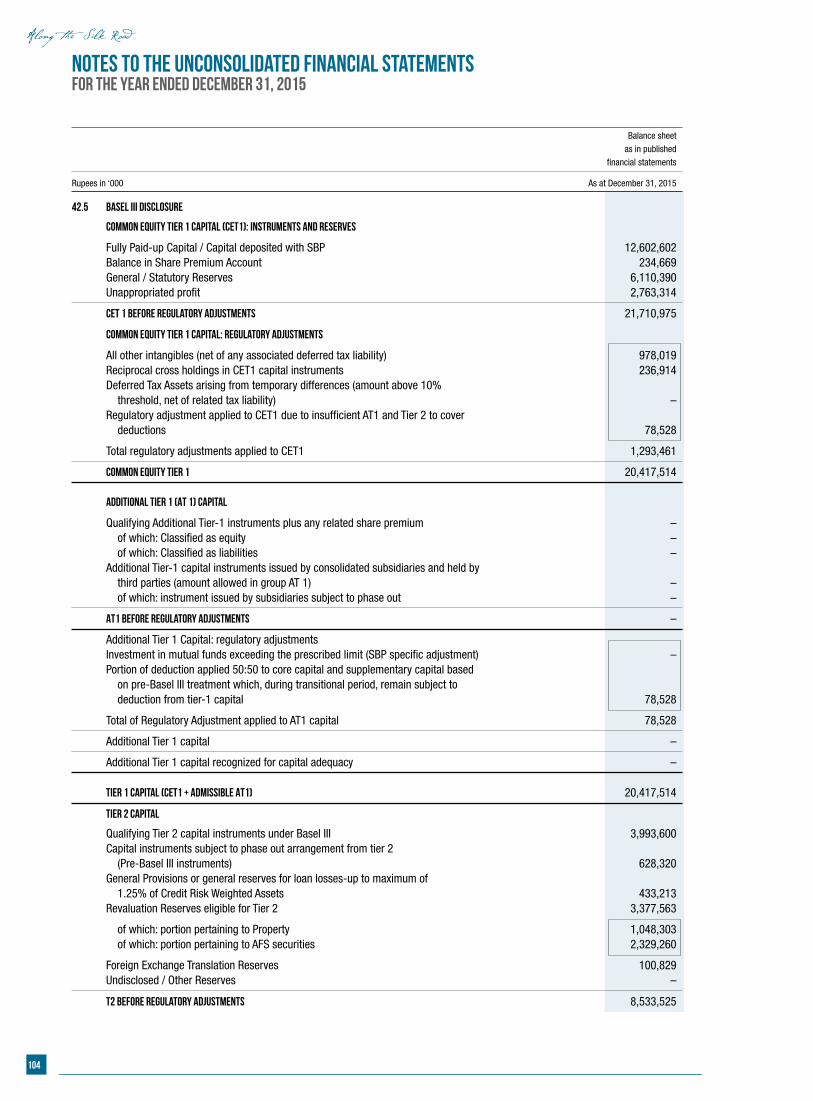
104
Notes to the Unconsolidated Financial StatementsFor the year ended December 31, 2015
Balance sheet as in published financial statements
Rupees in ‘000 As at December 31, 2015
42.5 Basel III Disclosure
Common Equity Tier 1 capital (CET1): Instruments and reserves
Fully Paid-up Capital / Capital deposited with SBP 12,602,602 Balance in Share Premium Account 234,669 General / Statutory Reserves 6,110,390 Unappropriated profit 2,763,314
CET 1 before Regulatory Adjustments 21,710,975
Common Equity Tier 1 capital: Regulatory adjustments
All other intangibles (net of any associated deferred tax liability) 978,019 Reciprocal cross holdings in CET1 capital instruments 236,914 Deferred Tax Assets arising from temporary differences (amount above 10% threshold, net of related tax liability) – Regulatory adjustment applied to CET1 due to insufficient AT1 and Tier 2 to cover deductions 78,528
Total regulatory adjustments applied to CET1 1,293,461
Common Equity Tier 1 20,417,514 Additional Tier 1 (AT 1) Capital
Qualifying Additional Tier-1 instruments plus any related share premium – of which: Classified as equity – of which: Classified as liabilities – Additional Tier-1 capital instruments issued by consolidated subsidiaries and held by third parties (amount allowed in group AT 1) – of which: instrument issued by subsidiaries subject to phase out –
AT1 before regulatory adjustments –
Additional Tier 1 Capital: regulatory adjustments Investment in mutual funds exceeding the prescribed limit (SBP specific adjustment) – Portion of deduction applied 50:50 to core capital and supplementary capital based on pre-Basel III treatment which, during transitional period, remain subject to deduction from tier-1 capital 78,528
Total of Regulatory Adjustment applied to AT1 capital 78,528
Additional Tier 1 capital –
Additional Tier 1 capital recognized for capital adequacy –
Tier 1 Capital (CET1 + admissible AT1) 20,417,514
Tier 2 Capital
Qualifying Tier 2 capital instruments under Basel III 3,993,600 Capital instruments subject to phase out arrangement from tier 2 (Pre-Basel III instruments) 628,320 General Provisions or general reserves for loan losses-up to maximum of 1.25% of Credit Risk Weighted Assets 433,213 Revaluation Reserves eligible for Tier 2 3,377,563
of which: portion pertaining to Property 1,048,303 of which: portion pertaining to AFS securities 2,329,260
Foreign Exchange Translation Reserves 100,829 Undisclosed / Other Reserves –
T2 before regulatory adjustments 8,533,525
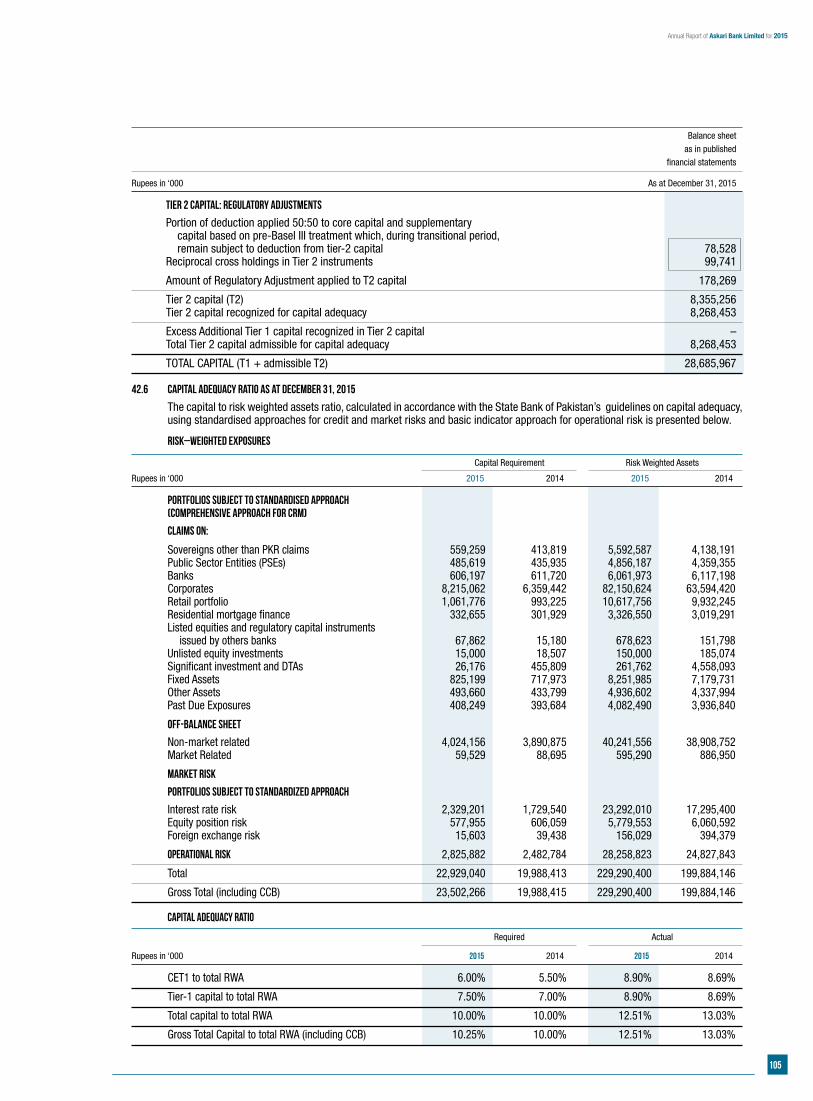
105
Annual Report of Askari Bank Limited for 2015
Balance sheet as in published financial statements
Rupees in ‘000 As at December 31, 2015
Tier 2 Capital: regulatory adjustments Portion of deduction applied 50:50 to core capital and supplementary capital based on pre-Basel III treatment which, during transitional period, remain subject to deduction from tier-2 capital 78,528 Reciprocal cross holdings in Tier 2 instruments 99,741
Amount of Regulatory Adjustment applied to T2 capital 178,269
Tier 2 capital (T2) 8,355,256 Tier 2 capital recognized for capital adequacy 8,268,453
Excess Additional Tier 1 capital recognized in Tier 2 capital – Total Tier 2 capital admissible for capital adequacy 8,268,453
TOTAL CAPITAL (T1 + admissible T2) 28,685,967
42.6 Capital adequacy ratio as at December 31, 2015
The capital to risk weighted assets ratio, calculated in accordance with the State Bank of Pakistan’s guidelines on capital adequacy, using standardised approaches for credit and market risks and basic indicator approach for operational risk is presented below.
Risk–weighted exposures
Capital Requirement Risk Weighted Assets
Rupees in ‘000 2015 2014 2015 2014
Portfolios subject to standardised approach (comprehensive approach for CRM)
Claims on:
Sovereigns other than PKR claims 559,259 413,819 5,592,587 4,138,191 Public Sector Entities (PSEs) 485,619 435,935 4,856,187 4,359,355 Banks 606,197 611,720 6,061,973 6,117,198 Corporates 8,215,062 6,359,442 82,150,624 63,594,420 Retail portfolio 1,061,776 993,225 10,617,756 9,932,245 Residential mortgage finance 332,655 301,929 3,326,550 3,019,291 Listed equities and regulatory capital instruments issued by others banks 67,862 15,180 678,623 151,798 Unlisted equity investments 15,000 18,507 150,000 185,074 Significant investment and DTAs 26,176 455,809 261,762 4,558,093 Fixed Assets 825,199 717,973 8,251,985 7,179,731 Other Assets 493,660 433,799 4,936,602 4,337,994 Past Due Exposures 408,249 393,684 4,082,490 3,936,840
Off-Balance Sheet Non-market related 4,024,156 3,890,875 40,241,556 38,908,752 Market Related 59,529 88,695 595,290 886,950
Market risk Portfolios subject to standardized approach Interest rate risk 2,329,201 1,729,540 23,292,010 17,295,400 Equity position risk 577,955 606,059 5,779,553 6,060,592 Foreign exchange risk 15,603 39,438 156,029 394,379
Operational risk 2,825,882 2,482,784 28,258,823 24,827,843
Total 22,929,040 19,988,413 229,290,400 199,884,146
Gross Total (including CCB) 23,502,266 19,988,415 229,290,400 199,884,146
Capital adequacy ratio
Required Actual
Rupees in ‘000 2015 2014 2015 2014
CET1 to total RWA 6.00% 5.50% 8.90% 8.69%
Tier-1 capital to total RWA 7.50% 7.00% 8.90% 8.69%
Total capital to total RWA 10.00% 10.00% 12.51% 13.03%
Gross Total Capital to total RWA (including CCB) 10.25% 10.00% 12.51% 13.03%
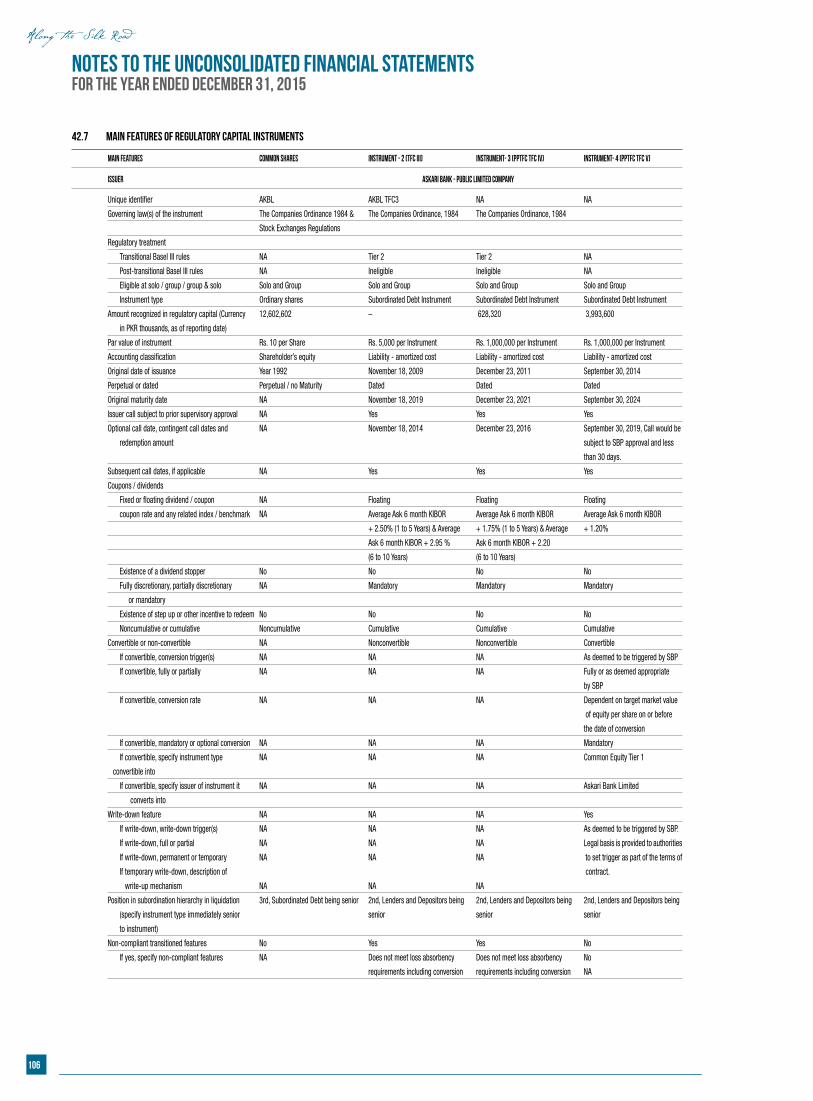
106
Notes to the Unconsolidated Financial StatementsFor the year ended December 31, 2015
42.7 Main features of regulatory capital instruments
Main Features Common Shares Instrument - 2 (TFC III) Instrument- 3 (PPTFC TFC IV) Instrument- 4 (PPTFC TFC V)
Issuer Askari Bank - Public Limited Company
Unique identifier AKBL AKBL TFC3 NA NA
Governing law(s) of the instrument The Companies Ordinance 1984 & The Companies Ordinance, 1984 The Companies Ordinance, 1984
Stock Exchanges Regulations
Regulatory treatment
Transitional Basel III rules NA Tier 2 Tier 2 NA
Post-transitional Basel III rules NA Ineligible Ineligible NA
Eligible at solo / group / group & solo Solo and Group Solo and Group Solo and Group Solo and Group
Instrument type Ordinary shares Subordinated Debt Instrument Subordinated Debt Instrument Subordinated Debt Instrument
Amount recognized in regulatory capital (Currency 12,602,602 – 628,320 3,993,600
in PKR thousands, as of reporting date)
Par value of instrument Rs. 10 per Share Rs. 5,000 per Instrument Rs. 1,000,000 per Instrument Rs. 1,000,000 per Instrument
Accounting classification Shareholder’s equity Liability - amortized cost Liability - amortized cost Liability - amortized cost
Original date of issuance Year 1992 November 18, 2009 December 23, 2011 September 30, 2014
Perpetual or dated Perpetual / no Maturity Dated Dated Dated
Original maturity date NA November 18, 2019 December 23, 2021 September 30, 2024
Issuer call subject to prior supervisory approval NA Yes Yes Yes
Optional call date, contingent call dates and NA November 18, 2014 December 23, 2016 September 30, 2019, Call would be
redemption amount subject to SBP approval and less
than 30 days.
Subsequent call dates, if applicable NA Yes Yes Yes
Coupons / dividends
Fixed or floating dividend / coupon NA Floating Floating Floating
coupon rate and any related index / benchmark NA Average Ask 6 month KIBOR Average Ask 6 month KIBOR Average Ask 6 month KIBOR
+ 2.50% (1 to 5 Years) & Average + 1.75% (1 to 5 Years) & Average + 1.20%
Ask 6 month KIBOR + 2.95 % Ask 6 month KIBOR + 2.20
(6 to 10 Years) (6 to 10 Years)
Existence of a dividend stopper No No No No
Fully discretionary, partially discretionary NA Mandatory Mandatory Mandatory
or mandatory
Existence of step up or other incentive to redeem No No No No
Noncumulative or cumulative Noncumulative Cumulative Cumulative Cumulative
Convertible or non-convertible NA Nonconvertible Nonconvertible Convertible
If convertible, conversion trigger(s) NA NA NA As deemed to be triggered by SBP
If convertible, fully or partially NA NA NA Fully or as deemed appropriate
by SBP
If convertible, conversion rate NA NA NA Dependent on target market value
of equity per share on or before
the date of conversion
If convertible, mandatory or optional conversion NA NA NA Mandatory
If convertible, specify instrument type NA NA NA Common Equity Tier 1
convertible into
If convertible, specify issuer of instrument it NA NA NA Askari Bank Limited
converts into
Write-down feature NA NA NA Yes
If write-down, write-down trigger(s) NA NA NA As deemed to be triggered by SBP.
If write-down, full or partial NA NA NA Legal basis is provided to authorities
If write-down, permanent or temporary NA NA NA to set trigger as part of the terms of
If temporary write-down, description of contract.
write-up mechanism NA NA NA
Position in subordination hierarchy in liquidation 3rd, Subordinated Debt being senior 2nd, Lenders and Depositors being 2nd, Lenders and Depositors being 2nd, Lenders and Depositors being
(specify instrument type immediately senior senior senior senior
to instrument)
Non-compliant transitioned features No Yes Yes No
If yes, specify non-compliant features NA Does not meet loss absorbency Does not meet loss absorbency No
requirements including conversion requirements including conversion NA
107
Annual Report of Askari Bank Limited for 2015
43. RISK MANAGEMENT
The Bank believes that effective risk management is of primary importance to achieve desired level of return while maintaining acceptable level of risk exposure. Robust risk management processes and framework are in place to achieve overall Bank’s objectives through a well thought out strategy, which enable the Bank to effectively manage, credit, market, operational and liquidity risk in a proactive manner.
The Bank’s approach is to ensure that risk management is deeply and firmly embedded in the culture of the Bank. All employees are therefore considered responsible for identification, measurement, monitoring and controlling risks within the scope of their assigned responsibilities. As a result of changing risk environment, the Bank continuously monitors and conducts holistic assessment of complex transactions on an integrated basis.
The Bank has a Board Risk Management Committee (BRMC) in place and is updated regularly by the Bank’s Risk Management Division. BRMC is responsible to review the extent of design and adequacy of risk management framework. BRMC oversees that risks are managed within the level of tolerance and risk appetite of the Bank.
43.1 Credit Risk:
Credit risk arises from the potential that an obligor is either unwilling to perform on an obligation or its ability is impaired resulting in economic loss to the Bank. The Bank takes necessary measures to control such risk by monitoring credit exposures, limiting transactions with specific counter parties with increased likelihood of default and continually assessing the creditworthiness of counter parties.
The Bank has built and maintains a sound loan portfolio in terms of a well defined Credit Policy and Credit Risk Policy approved by the Board of Directors. Its credit evaluation system comprises of well-designed credit appraisal, sanctioning and review procedures for the purpose of emphasizing prudence in its lending activities and ensuring quality of asset portfolio. Advances portfolio constitutes around 40% of the total asset base and is also the largest source of credit risk for the Bank. Moreover, more than 70% of Bank’s capital requirement pertains to credit risk. The Bank’s advances portfolio is well diversified across various business segments, industries and geographical locations.
Risk mitigants have been put in place at all stages of credit risk cycle i.e. identification, measurement, monitoring, controlling and reporting for effective risk management. Accordingly, portfolio monitoring function is in place at the Bank with dedicated resources to ensure that risk is not only minimized but is optimized in risk / return perspective.
Credit Risk Review is conducted at obligor as well as at portfolio level to ensure adherence to regulatory as well as the Bank’s policies and procedures. The review process ensures that a sound and proactive risk management culture is maintained across the Bank. Scope of Pre-Assessment Risk Review has been enhanced, covering the entire Corporate, Commercial and SME portfolios along with consumer and Agri Finance with in discretionary powers of HOCC. Audit and inspection division is reviewing the advances portfolio on a post approval basis.
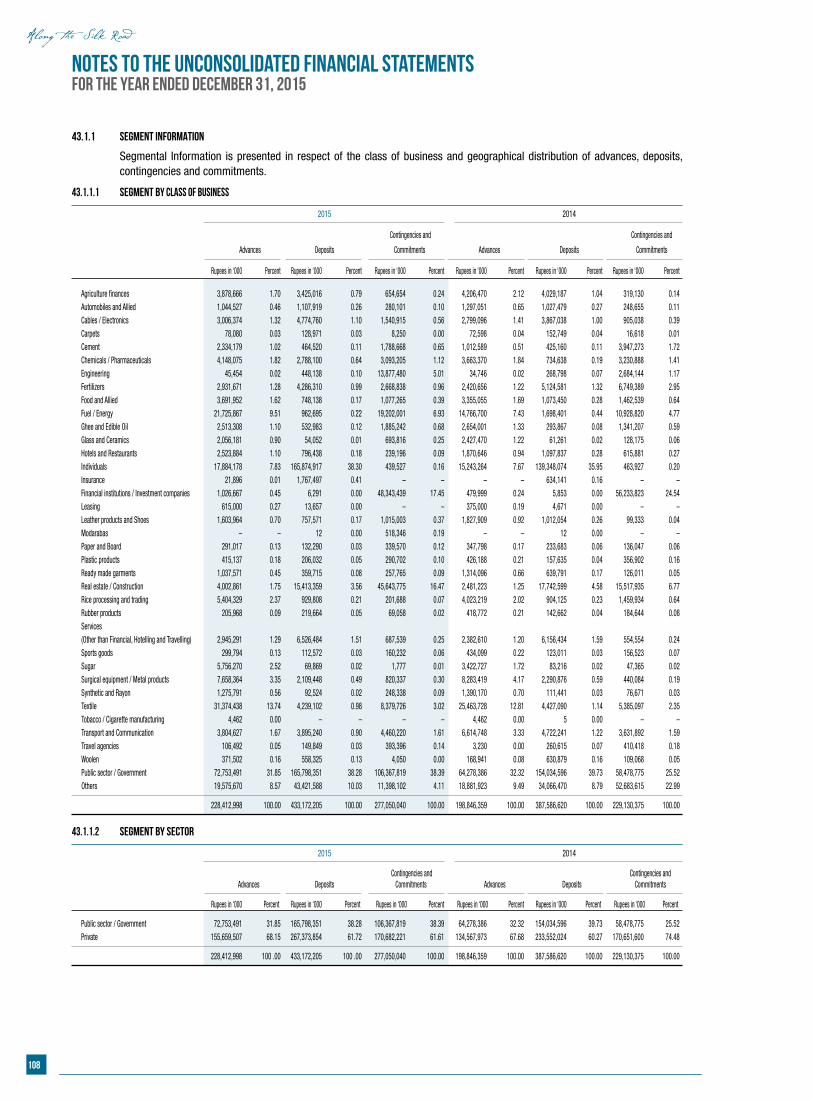
108
43.1.1 SEGMENT INFORMATION
Segmental Information is presented in respect of the class of business and geographical distribution of advances, deposits, contingencies and commitments.
43.1.1.1 Segment by class of business
2015 2014
Contingencies and Contingencies and
Advances Deposits Commitments Advances Deposits Commitments
Rupees in ‘000 Percent Rupees in ‘000 Percent Rupees in ‘000 Percent Rupees in ‘000 Percent Rupees in ‘000 Percent Rupees in ‘000 Percent
Agriculture finances 3,878,666 1.70 3,425,016 0.79 654,654 0.24 4,206,470 2.12 4,029,187 1.04 319,130 0.14 Automobiles and Allied 1,044,527 0.46 1,107,919 0.26 280,101 0.10 1,297,051 0.65 1,027,479 0.27 248,655 0.11 Cables / Electronics 3,006,374 1.32 4,774,760 1.10 1,540,915 0.56 2,799,096 1.41 3,867,038 1.00 905,038 0.39 Carpets 78,080 0.03 128,971 0.03 8,250 0.00 72,598 0.04 152,749 0.04 16,618 0.01 Cement 2,334,179 1.02 464,520 0.11 1,788,668 0.65 1,012,589 0.51 425,160 0.11 3,947,273 1.72 Chemicals / Pharmaceuticals 4,148,075 1.82 2,788,100 0.64 3,093,205 1.12 3,663,370 1.84 734,638 0.19 3,230,888 1.41 Engineering 45,454 0.02 448,138 0.10 13,877,480 5.01 34,746 0.02 268,798 0.07 2,684,144 1.17 Fertilizers 2,931,671 1.28 4,286,310 0.99 2,668,838 0.96 2,420,656 1.22 5,124,581 1.32 6,749,389 2.95 Food and Allied 3,691,952 1.62 748,138 0.17 1,077,265 0.39 3,355,055 1.69 1,073,450 0.28 1,462,539 0.64 Fuel / Energy 21,725,867 9.51 962,695 0.22 19,202,001 6.93 14,766,700 7.43 1,698,401 0.44 10,928,820 4.77 Ghee and Edible Oil 2,513,308 1.10 532,983 0.12 1,885,242 0.68 2,654,001 1.33 293,867 0.08 1,341,207 0.59 Glass and Ceramics 2,056,181 0.90 54,052 0.01 693,816 0.25 2,427,470 1.22 61,261 0.02 128,175 0.06 Hotels and Restaurants 2,523,884 1.10 796,438 0.18 239,196 0.09 1,870,646 0.94 1,097,837 0.28 615,881 0.27 Individuals 17,884,178 7.83 165,874,917 38.30 439,527 0.16 15,243,264 7.67 139,348,074 35.95 463,927 0.20 Insurance 21,896 0.01 1,767,497 0.41 – – – – 634,141 0.16 – – Financial institutions / Investment companies 1,026,667 0.45 6,291 0.00 48,343,439 17.45 479,999 0.24 5,853 0.00 56,233,823 24.54 Leasing 615,000 0.27 13,657 0.00 – – 375,000 0.19 4,671 0.00 – – Leather products and Shoes 1,603,964 0.70 757,571 0.17 1,015,003 0.37 1,827,909 0.92 1,012,054 0.26 99,333 0.04 Modarabas – – 12 0.00 518,346 0.19 – – 12 0.00 – – Paper and Board 291,017 0.13 132,290 0.03 339,570 0.12 347,798 0.17 233,683 0.06 136,047 0.06 Plastic products 415,137 0.18 206,032 0.05 290,702 0.10 426,188 0.21 157,635 0.04 356,902 0.16 Ready made garments 1,037,571 0.45 359,715 0.08 257,765 0.09 1,314,096 0.66 639,791 0.17 126,011 0.05 Real estate / Construction 4,002,861 1.75 15,413,359 3.56 45,643,775 16.47 2,481,223 1.25 17,742,599 4.58 15,517,935 6.77 Rice processing and trading 5,404,329 2.37 929,808 0.21 201,688 0.07 4,023,219 2.02 904,125 0.23 1,459,934 0.64 Rubber products 205,968 0.09 219,664 0.05 69,058 0.02 418,772 0.21 142,662 0.04 184,644 0.08 Services (Other than Financial, Hotelling and Travelling) 2,945,291 1.29 6,526,484 1.51 687,539 0.25 2,382,610 1.20 6,156,434 1.59 554,554 0.24 Sports goods 299,794 0.13 112,572 0.03 160,232 0.06 434,099 0.22 123,011 0.03 156,523 0.07 Sugar 5,756,270 2.52 69,869 0.02 1,777 0.01 3,422,727 1.72 83,216 0.02 47,365 0.02 Surgical equipment / Metal products 7,658,364 3.35 2,109,448 0.49 820,337 0.30 8,283,419 4.17 2,290,876 0.59 440,084 0.19 Synthetic and Rayon 1,275,791 0.56 92,524 0.02 248,338 0.09 1,390,170 0.70 111,441 0.03 76,671 0.03 Textile 31,374,438 13.74 4,239,102 0.98 8,379,726 3.02 25,463,728 12.81 4,427,090 1.14 5,385,097 2.35 Tobacco / Cigarette manufacturing 4,462 0.00 – – – – 4,462 0.00 5 0.00 – – Transport and Communication 3,804,627 1.67 3,895,240 0.90 4,460,220 1.61 6,614,748 3.33 4,722,241 1.22 3,631,892 1.59 Travel agencies 106,492 0.05 149,849 0.03 393,396 0.14 3,230 0.00 260,615 0.07 410,418 0.18 Woolen 371,502 0.16 558,325 0.13 4,050 0.00 168,941 0.08 630,879 0.16 109,068 0.05 Public sector / Government 72,753,491 31.85 165,798,351 38.28 106,367,819 38.39 64,278,386 32.32 154,034,596 39.73 58,478,775 25.52 Others 19,575,670 8.57 43,421,588 10.03 11,398,102 4.11 18,881,923 9.49 34,066,470 8.79 52,683,615 22.99
228,412,998 100.00 433,172,205 100.00 277,050,040 100.00 198,846,359 100.00 387,586,620 100.00 229,130,375 100.00
43.1.1.2 Segment by sector
2015 2014
Contingencies and Contingencies and Advances Deposits Commitments Advances Deposits Commitments
Rupees in ‘000 Percent Rupees in ‘000 Percent Rupees in ‘000 Percent Rupees in ‘000 Percent Rupees in ‘000 Percent Rupees in ‘000 Percent
Public sector / Government 72,753,491 31.85 165,798,351 38.28 106,367,819 38.39 64,278,386 32.32 154,034,596 39.73 58,478,775 25.52 Private 155,659,507 68.15 267,373,854 61.72 170,682,221 61.61 134,567,973 67.68 233,552,024 60.27 170,651,600 74.48
228,412,998 100 .00 433,172,205 100 .00 277,050,040 100.00 198,846,359 100.00 387,586,620 100.00 229,130,375 100.00
Notes to the Unconsolidated Financial StatementsFor the year ended December 31, 2015
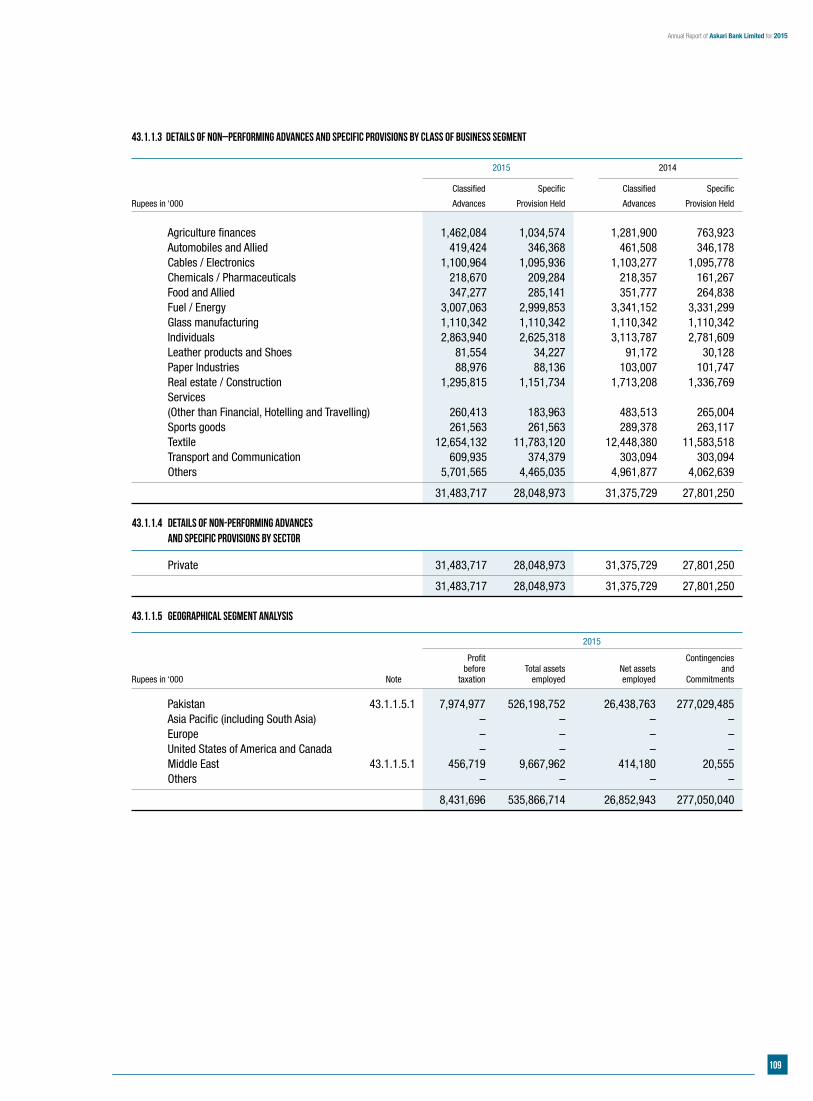
109
Annual Report of Askari Bank Limited for 2015
43.1.1.3 Details of non–performing advances and specific provisions by class of business segment
2015 2014
Classified Specific Classified Specific
Rupees in ‘000 Advances Provision Held Advances Provision Held
Agriculture finances 1,462,084 1,034,574 1,281,900 763,923 Automobiles and Allied 419,424 346,368 461,508 346,178 Cables / Electronics 1,100,964 1,095,936 1,103,277 1,095,778 Chemicals / Pharmaceuticals 218,670 209,284 218,357 161,267 Food and Allied 347,277 285,141 351,777 264,838 Fuel / Energy 3,007,063 2,999,853 3,341,152 3,331,299 Glass manufacturing 1,110,342 1,110,342 1,110,342 1,110,342 Individuals 2,863,940 2,625,318 3,113,787 2,781,609 Leather products and Shoes 81,554 34,227 91,172 30,128 Paper Industries 88,976 88,136 103,007 101,747 Real estate / Construction 1,295,815 1,151,734 1,713,208 1,336,769 Services (Other than Financial, Hotelling and Travelling) 260,413 183,963 483,513 265,004 Sports goods 261,563 261,563 289,378 263,117 Textile 12,654,132 11,783,120 12,448,380 11,583,518 Transport and Communication 609,935 374,379 303,094 303,094 Others 5,701,565 4,465,035 4,961,877 4,062,639
31,483,717 28,048,973 31,375,729 27,801,250
43.1.1.4 Details of non-performing advances and specific provisions by sector
Private 31,483,717 28,048,973 31,375,729 27,801,250
31,483,717 28,048,973 31,375,729 27,801,250
43.1.1.5 Geographical segment analysis
2015
Profit Contingencies before Total assets Net assets and Rupees in ‘000 Note taxation employed employed Commitments
Pakistan 43.1.1.5.1 7,974,977 526,198,752 26,438,763 277,029,485 Asia Pacific (including South Asia) – – – – Europe – – – – United States of America and Canada – – – – Middle East 43.1.1.5.1 456,719 9,667,962 414,180 20,555 Others – – – –
8,431,696 535,866,714 26,852,943 277,050,040
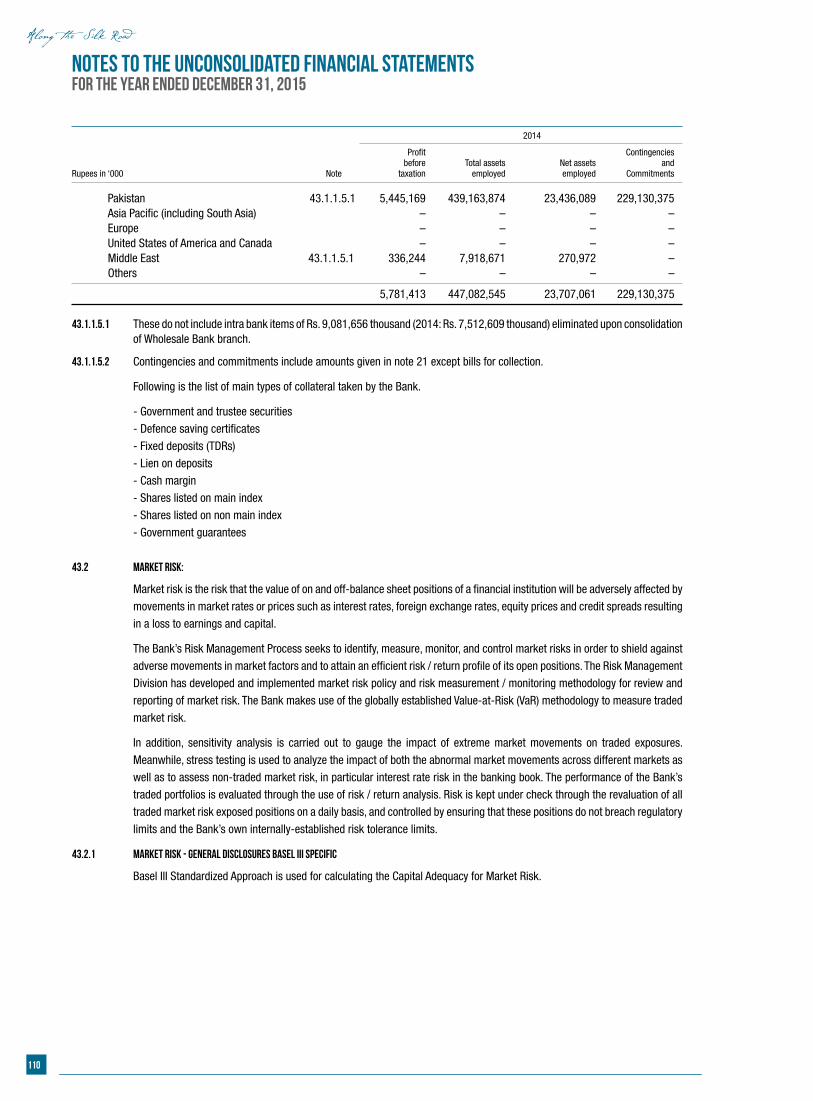
110
Notes to the Unconsolidated Financial StatementsFor the year ended December 31, 2015
2014
Profit Contingencies before Total assets Net assets and Rupees in ‘000 Note taxation employed employed Commitments
Pakistan 43.1.1.5.1 5,445,169 439,163,874 23,436,089 229,130,375 Asia Pacific (including South Asia) – – – – Europe – – – – United States of America and Canada – – – – Middle East 43.1.1.5.1 336,244 7,918,671 270,972 – Others – – – –
5,781,413 447,082,545 23,707,061 229,130,375
43.1.1.5.1 These do not include intra bank items of Rs. 9,081,656 thousand (2014: Rs. 7,512,609 thousand) eliminated upon consolidation of Wholesale Bank branch.
43.1.1.5.2 Contingencies and commitments include amounts given in note 21 except bills for collection.
Following is the list of main types of collateral taken by the Bank.
- Government and trustee securities
- Defence saving certificates
- Fixed deposits (TDRs)
- Lien on deposits
- Cash margin
- Shares listed on main index
- Shares listed on non main index
- Government guarantees
43.2 Market Risk:
Market risk is the risk that the value of on and off-balance sheet positions of a financial institution will be adversely affected by
movements in market rates or prices such as interest rates, foreign exchange rates, equity prices and credit spreads resulting
in a loss to earnings and capital.
The Bank’s Risk Management Process seeks to identify, measure, monitor, and control market risks in order to shield against
adverse movements in market factors and to attain an efficient risk / return profile of its open positions. The Risk Management
Division has developed and implemented market risk policy and risk measurement / monitoring methodology for review and
reporting of market risk. The Bank makes use of the globally established Value-at-Risk (VaR) methodology to measure traded
market risk.
In addition, sensitivity analysis is carried out to gauge the impact of extreme market movements on traded exposures.
Meanwhile, stress testing is used to analyze the impact of both the abnormal market movements across different markets as
well as to assess non-traded market risk, in particular interest rate risk in the banking book. The performance of the Bank’s
traded portfolios is evaluated through the use of risk / return analysis. Risk is kept under check through the revaluation of all
traded market risk exposed positions on a daily basis, and controlled by ensuring that these positions do not breach regulatory
limits and the Bank’s own internally-established risk tolerance limits.
43.2.1 Market risk - General disclosures Basel III specific
Basel III Standardized Approach is used for calculating the Capital Adequacy for Market Risk.

111
Annual Report of Askari Bank Limited for 2015
43.2.2 Foreign Exchange Risk
Foreign exchange risk, or the risk that the Bank’s earnings and / or capital can fluctuate due to changes in foreign exchange
rates, arises out from the Bank’s foreign exchange exposure which consists of foreign currency cash in hand, nostro / vostro
accounts, forward contracts, forward bookings with exporters, foreign bills purchased, foreign currency placements with SBP
and the Bank’s Wholesale Bank Branch, foreign currency lendings / deposits and capital investments in offshore operations.
The Bank’s treasury manages consolidated foreign exchange exposure by matching foreign currency assets and liabilities
in spot and forward. The foreign exchange exposure and nostro balances are maintained within regulatory limits and VaR is
calculated for consolidated foreign exchange exposure on a daily basis. The impact of a change in USD / PKR parity on the net
open position is also determined through daily sensitivity analysis.
2015
Net foreign
Off–balance currency
(Rupees in ‘000) Assets Liabilities sheet items exposure
Pakistan Rupees 505,731,800 470,774,633 (8,546,479) 26,410,688 U.S. Dollars 28,431,154 33,086,350 4,755,485 100,289 Pound Sterling 724,703 3,723,758 2,969,967 (29,088) Japanese Yen 8,499 34 (7,769) 696 Euro 483,010 1,418,054 845,658 (89,386) Other European Currencies 185,411 – (1,561) 183,850 Other Currencies 302,137 10,942 (15,301) 275,894
535,866,714 509,013,771 – 26,852,943
2014
Net foreign
Off–balance currency
(Rupees in ‘000) Assets Liabilities sheet items exposure
Pakistan Rupees 418,058,845 388,086,095 (8,268,138) 21,704,612 U.S. Dollars 27,283,225 30,214,510 4,102,680 1,171,395 Pound Sterling 451,812 3,564,348 3,110,137 (2,399) Japanese Yen 3,473 38 – 3,435 Euro 758,707 1,503,263 1,055,321 310,765 Other European Currencies 93,121 – – 93,121 Other Currencies 433,362 7,230 – 426,132
447,082,545 423,375,484 – 23,707,061
43.2.3 Equity position risk
Equity position risk is the risk that the value of equity positions inside the trading book and banking book will change as a
result of general and specific equity market movements. The Bank bifurcates its direct investment in equity into held for
trading, available for sale, and strategic portfolios. Held for trading equity exposures are of a short term nature and are
undertaken to earn profit by exploiting market imperfections and short term price fluctuations. Equities held in the available
for sale portfolio are with the intent to earn profit from fundamentals. Strategic investments are undertaken in line with the
long-term strategy of the Bank, i.e. to build strategic interest in other concerns. The Bank also carries indirect equity exposure
through financing against shares and reverse repos against shares.
All equity positions in the trading book are subject to exposure limits established by the Bank in conformity with the general
limits prescribed by the SBP. These limits include intraday limits, stop-loss limits, exposure limits, portfolio limits, and sectoral
limits. The Bank carries out revaluation and calculates VaR on a daily basis for equity exposures in the trading book.
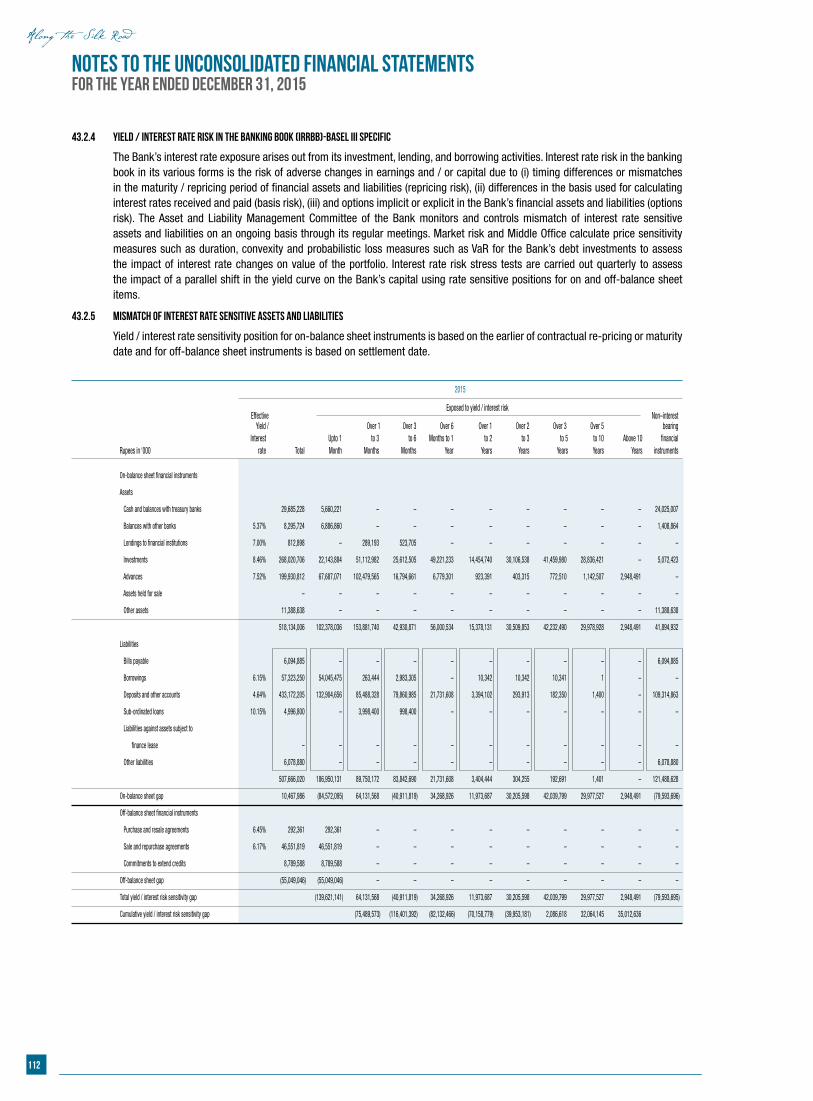
112
Notes to the Unconsolidated Financial StatementsFor the year ended December 31, 2015
43.2.4 Yield / Interest Rate Risk in the Banking Book (IRRBB)-Basel III Specific
The Bank’s interest rate exposure arises out from its investment, lending, and borrowing activities. Interest rate risk in the banking book in its various forms is the risk of adverse changes in earnings and / or capital due to (i) timing differences or mismatches in the maturity / repricing period of financial assets and liabilities (repricing risk), (ii) differences in the basis used for calculating interest rates received and paid (basis risk), (iii) and options implicit or explicit in the Bank’s financial assets and liabilities (options risk). The Asset and Liability Management Committee of the Bank monitors and controls mismatch of interest rate sensitive assets and liabilities on an ongoing basis through its regular meetings. Market risk and Middle Office calculate price sensitivity measures such as duration, convexity and probabilistic loss measures such as VaR for the Bank’s debt investments to assess the impact of interest rate changes on value of the portfolio. Interest rate risk stress tests are carried out quarterly to assess the impact of a parallel shift in the yield curve on the Bank’s capital using rate sensitive positions for on and off-balance sheet items.
43.2.5 Mismatch of interest rate sensitive assets and liabilities
Yield / interest rate sensitivity position for on-balance sheet instruments is based on the earlier of contractual re-pricing or maturity date and for off-balance sheet instruments is based on settlement date.
2015
Effective
Exposed to yield / interest risk Non–interest
Yield / Over 1 Over 3 Over 6 Over 1 Over 2 Over 3 Over 5 bearing Interest Upto 1 to 3 to 6 Months to 1 to 2 to 3 to 5 to 10 Above 10 financial Rupees in ‘000 rate Total Month Months Months Year Years Years Years Years Years instruments
On-balance sheet financial instruments
Assets
Cash and balances with treasury banks 29,685,228 5,660,221 – – – – – – – – 24,025,007
Balances with other banks 5.37% 8,295,724 6,886,860 – – – – – – – – 1,408,864
Lendings to financial institutions 7.00% 812,898 – 289,193 523,705 – – – – – – –
Investments 8.46% 268,020,706 22,143,884 51,112,982 25,612,505 49,221,233 14,454,740 30,106,538 41,459,980 28,836,421 – 5,072,423
Advances 7.52% 199,930,812 67,687,071 102,479,565 16,794,661 6,779,301 923,391 403,315 772,510 1,142,507 2,948,491 –
Assets held for sale – – – – – – – – – – –
Other assets 11,388,638 – – – – – – – – – 11,388,638
518,134,006 102,378,036 153,881,740 42,930,871 56,000,534 15,378,131 30,509,853 42,232,490 29,978,928 2,948,491 41,894,932
Liabilities
Bills payable 6,094,885 – – – – – – – – – 6,094,885
Borrowings 6.15% 57,323,250 54,045,475 263,444 2,983,305 – 10,342 10,342 10,341 1 – –
Deposits and other accounts 4.64% 433,172,205 132,904,656 85,488,328 79,860,985 21,731,608 3,394,102 293,913 182,350 1,400 – 109,314,863
Sub-ordinated loans 10.15% 4,996,800 – 3,998,400 998,400 – – – – – – –
Liabilities against assets subject to
finance lease – – – – – – – – – – –
Other liabilities 6,078,880 – – – – – – – – – 6,078,880
507,666,020 186,950,131 89,750,172 83,842,690 21,731,608 3,404,444 304,255 192,691 1,401 – 121,488,628
On-balance sheet gap 10,467,986 (84,572,095) 64,131,568 (40,911,819) 34,268,926 11,973,687 30,205,598 42,039,799 29,977,527 2,948,491 (79,593,696)
Off-balance sheet financial instruments
Purchase and resale agreements 6.45% 292,361 292,361 – – – – – – – – –
Sale and repurchase agreements 6.17% 46,551,819 46,551,819 – – – – – – – – –
Commitments to extend credits 8,789,588 8,789,588 – – – – – – – – –
Off-balance sheet gap (55,049,046) (55,049,046) – – – – – – – – –
Total yield / interest risk sensitivity gap (139,621,141) 64,131,568 (40,911,819) 34,268,926 11,973,687 30,205,598 42,039,799 29,977,527 2,948,491 (79,593,695)
Cumulative yield / interest risk sensitivity gap (75,489,573) (116,401,392) (82,132,466) (70,158,779) (39,953,181) 2,086,618 32,064,145 35,012,636
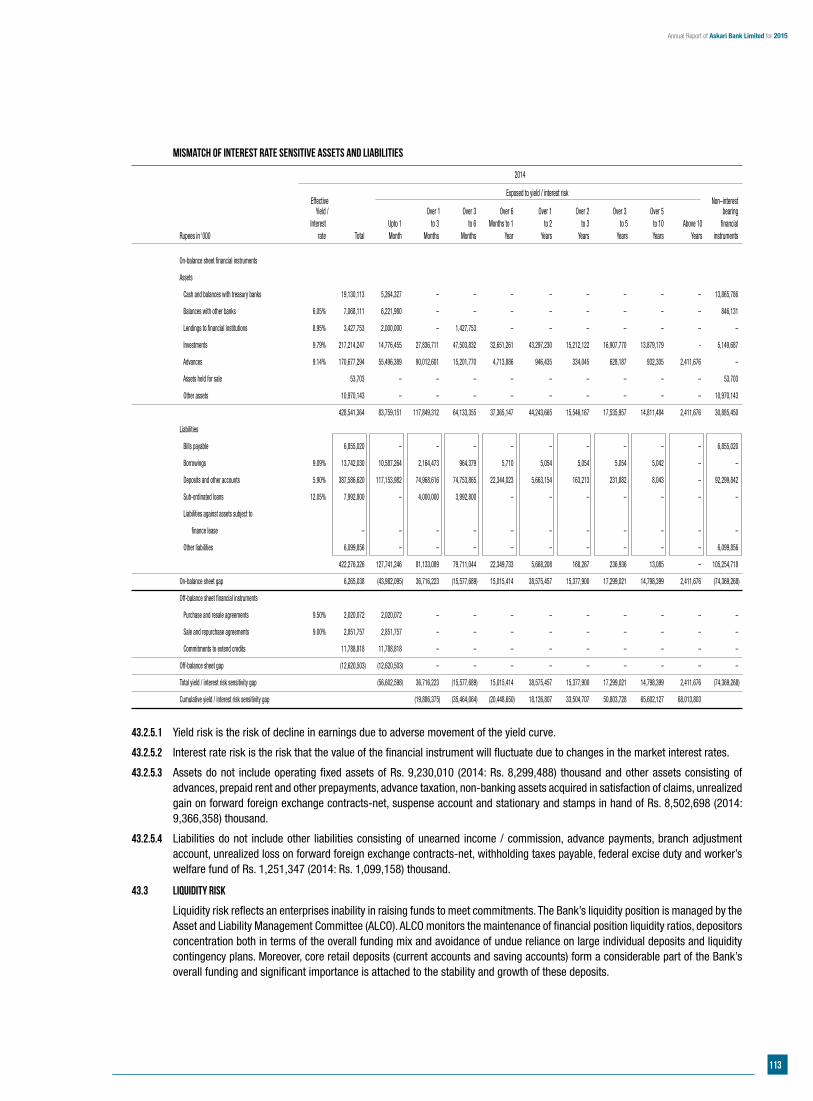
113
Annual Report of Askari Bank Limited for 2015
Mismatch of interest rate sensitive assets and liabilities
2014
Effective
Exposed to yield / interest risk Non–interest
Yield / Over 1 Over 3 Over 6 Over 1 Over 2 Over 3 Over 5 bearing Interest Upto 1 to 3 to 6 Months to 1 to 2 to 3 to 5 to 10 Above 10 financial Rupees in ‘000 rate Total Month Months Months Year Years Years Years Years Years instruments
On-balance sheet financial instruments
Assets
Cash and balances with treasury banks 19,130,113 5,264,327 – – – – – – – – 13,865,786
Balances with other banks 6.05% 7,068,111 6,221,980 – – – – – – – – 846,131
Lendings to financial institutions 8.95% 3,427,753 2,000,000 – 1,427,753 – – – – – – –
Investments 9.79% 217,214,247 14,776,455 27,836,711 47,503,832 32,651,261 43,297,230 15,212,122 16,907,770 13,879,179 - 5,149,687
Advances 9.14% 170,677,294 55,496,389 90,012,601 15,201,770 4,713,886 946,435 334,045 628,187 932,305 2,411,676 –
Assets held for sale 53,703 – – – – – – – – – 53,703
Other assets 10,970,143 – – – – – – – – – 10,970,143
428,541,364 83,759,151 117,849,312 64,133,355 37,365,147 44,243,665 15,546,167 17,535,957 14,811,484 2,411,676 30,885,450
Liabilities
Bills payable 6,855,020 – – – – – – – – – 6,855,020
Borrowings 9.09% 13,742,030 10,587,264 2,164,473 964,379 5,710 5,054 5,054 5,054 5,042 – –
Deposits and other accounts 5.90% 387,586,620 117,153,982 74,968,616 74,753,865 22,344,023 5,663,154 163,213 231,882 8,043 – 92,299,842
Sub-ordinated loans 12.05% 7,992,800 – 4,000,000 3,992,800 – – – – – – –
Liabilities against assets subject to
finance lease – – – – – – – – – – –
Other liabilities 6,099,856 – – – – – – – – – 6,099,856
422,276,326 127,741,246 81,133,089 79,711,044 22,349,733 5,668,208 168,267 236,936 13,085 – 105,254,718
On-balance sheet gap 6,265,038 (43,982,095) 36,716,223 (15,577,689) 15,015,414 38,575,457 15,377,900 17,299,021 14,798,399 2,411,676 (74,369,268)
Off-balance sheet financial instruments
Purchase and resale agreements 9.50% 2,020,072 2,020,072 – – – – – – – – –
Sale and repurchase agreements 9.00% 2,851,757 2,851,757 – – – – – – – – –
Commitments to extend credits 11,788,818 11,788,818 – – – – – – – – –
Off-balance sheet gap (12,620,503) (12,620,503) – – – – – – – – –
Total yield / interest risk sensitivity gap (56,602,598) 36,716,223 (15,577,689) 15,015,414 38,575,457 15,377,900 17,299,021 14,798,399 2,411,676 (74,369,268)
Cumulative yield / interest risk sensitivity gap (19,886,375) (35,464,064) (20,448,650) 18,126,807 33,504,707 50,803,728 65,602,127 68,013,803
43.2.5.1 Yield risk is the risk of decline in earnings due to adverse movement of the yield curve.
43.2.5.2 Interest rate risk is the risk that the value of the financial instrument will fluctuate due to changes in the market interest rates.
43.2.5.3 Assets do not include operating fixed assets of Rs. 9,230,010 (2014: Rs. 8,299,488) thousand and other assets consisting of advances, prepaid rent and other prepayments, advance taxation, non-banking assets acquired in satisfaction of claims, unrealized gain on forward foreign exchange contracts-net, suspense account and stationary and stamps in hand of Rs. 8,502,698 (2014: 9,366,358) thousand.
43.2.5.4 Liabilities do not include other liabilities consisting of unearned income / commission, advance payments, branch adjustment account, unrealized loss on forward foreign exchange contracts-net, withholding taxes payable, federal excise duty and worker’s welfare fund of Rs. 1,251,347 (2014: Rs. 1,099,158) thousand.
43.3 Liquidity Risk
Liquidity risk reflects an enterprises inability in raising funds to meet commitments. The Bank’s liquidity position is managed by the Asset and Liability Management Committee (ALCO). ALCO monitors the maintenance of financial position liquidity ratios, depositors concentration both in terms of the overall funding mix and avoidance of undue reliance on large individual deposits and liquidity contingency plans. Moreover, core retail deposits (current accounts and saving accounts) form a considerable part of the Bank’s overall funding and significant importance is attached to the stability and growth of these deposits.
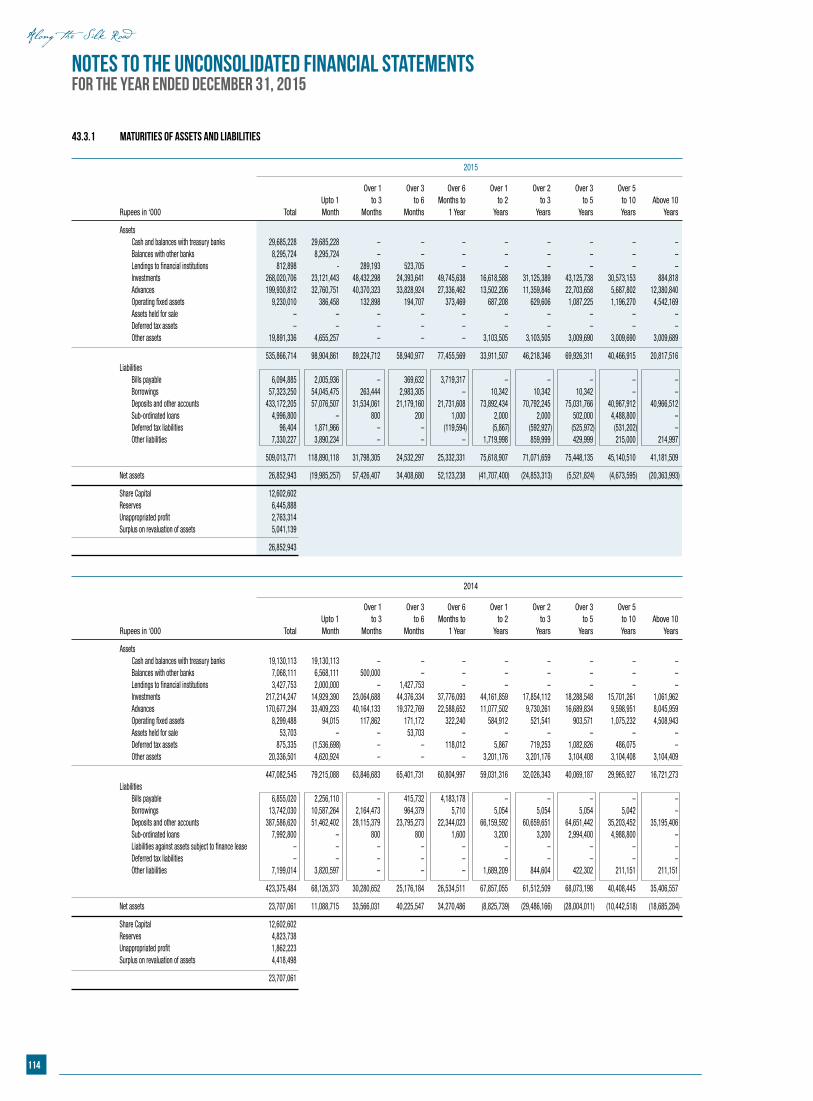
114
Notes to the Unconsolidated Financial StatementsFor the year ended December 31, 2015
43.3.1 Maturities of Assets and Liabilities
2015
Over 1 Over 3 Over 6 Over 1 Over 2 Over 3 Over 5 Upto 1 to 3 to 6 Months to to 2 to 3 to 5 to 10 Above 10 Rupees in ‘000 Total Month Months Months 1 Year Years Years Years Years Years
Assets Cash and balances with treasury banks 29,685,228 29,685,228 – – – – – – – – Balances with other banks 8,295,724 8,295,724 – – – – – – – – Lendings to financial institutions 812,898 - 289,193 523,705 – – – – – – Investments 268,020,706 23,121,443 48,432,298 24,393,641 49,745,638 16,618,588 31,125,389 43,125,738 30,573,153 884,818 Advances 199,930,812 32,760,751 40,370,323 33,828,924 27,336,462 13,502,206 11,359,846 22,703,658 5,687,802 12,380,840 Operating fixed assets 9,230,010 386,458 132,898 194,707 373,469 687,208 629,606 1,087,225 1,196,270 4,542,169 Assets held for sale – – – – – – – – – – Deferred tax assets – – – – – – – – – – Other assets 19,891,336 4,655,257 – – – 3,103,505 3,103,505 3,009,690 3,009,690 3,009,689
535,866,714 98,904,861 89,224,712 58,940,977 77,455,569 33,911,507 46,218,346 69,926,311 40,466,915 20,817,516 Liabilities Bills payable 6,094,885 2,005,936 – 369,632 3,719,317 – – – – – Borrowings 57,323,250 54,045,475 263,444 2,983,305 – 10,342 10,342 10,342 – – Deposits and other accounts 433,172,205 57,076,507 31,534,061 21,179,160 21,731,608 73,892,434 70,792,245 75,031,766 40,967,912 40,966,512 Sub-ordinated loans 4,996,800 – 800 200 1,000 2,000 2,000 502,000 4,488,800 – Deferred tax liabilities 96,404 1,871,966 – – (119,594) (5,867) (592,927) (525,972) (531,202) – Other liabilities 7,330,227 3,890,234 – – – 1,719,998 859,999 429,999 215,000 214,997
509,013,771 118,890,118 31,798,305 24,532,297 25,332,331 75,618,907 71,071,659 75,448,135 45,140,510 41,181,509
Net assets 26,852,943 (19,985,257) 57,426,407 34,408,680 52,123,238 (41,707,400) (24,853,313) (5,521,824) (4,673,595) (20,363,993)
Share Capital 12,602,602 Reserves 6,445,888 Unappropriated profit 2,763,314 Surplus on revaluation of assets 5,041,139
26,852,943
2014
Over 1 Over 3 Over 6 Over 1 Over 2 Over 3 Over 5 Upto 1 to 3 to 6 Months to to 2 to 3 to 5 to 10 Above 10 Rupees in ‘000 Total Month Months Months 1 Year Years Years Years Years Years
Assets Cash and balances with treasury banks 19,130,113 19,130,113 – – – – – – – – Balances with other banks 7,068,111 6,568,111 500,000 – – – – – – – Lendings to financial institutions 3,427,753 2,000,000 – 1,427,753 – – – – – – Investments 217,214,247 14,929,390 23,064,688 44,376,334 37,776,093 44,161,859 17,854,112 18,288,548 15,701,261 1,061,962 Advances 170,677,294 33,409,233 40,164,133 19,372,769 22,588,652 11,077,502 9,730,261 16,689,834 9,598,951 8,045,959 Operating fixed assets 8,299,488 94,015 117,862 171,172 322,240 584,912 521,541 903,571 1,075,232 4,508,943 Assets held for sale 53,703 – – 53,703 – – – – – – Deferred tax assets 875,335 (1,536,698) – – 118,012 5,867 719,253 1,082,826 486,075 – Other assets 20,336,501 4,620,924 – – – 3,201,176 3,201,176 3,104,408 3,104,408 3,104,409
447,082,545 79,215,088 63,846,683 65,401,731 60,804,997 59,031,316 32,026,343 40,069,187 29,965,927 16,721,273 Liabilities Bills payable 6,855,020 2,256,110 – 415,732 4,183,178 – – – – – Borrowings 13,742,030 10,587,264 2,164,473 964,379 5,710 5,054 5,054 5,054 5,042 – Deposits and other accounts 387,586,620 51,462,402 28,115,379 23,795,273 22,344,023 66,159,592 60,659,651 64,651,442 35,203,452 35,195,406 Sub-ordinated loans 7,992,800 – 800 800 1,600 3,200 3,200 2,994,400 4,988,800 – Liabilities against assets subject to finance lease – – – – – – – – – – Deferred tax liabilities – – – – – – – – – – Other liabilities 7,199,014 3,820,597 – – – 1,689,209 844,604 422,302 211,151 211,151
423,375,484 68,126,373 30,280,652 25,176,184 26,534,511 67,857,055 61,512,509 68,073,198 40,408,445 35,406,557
Net assets 23,707,061 11,088,715 33,566,031 40,225,547 34,270,486 (8,825,739) (29,486,166) (28,004,011) (10,442,518) (18,685,284)
Share Capital 12,602,602 Reserves 4,823,738 Unappropriated profit 1,862,223 Surplus on revaluation of assets 4,418,498
23,707,061
115
Annual Report of Askari Bank Limited for 2015
Nadeem InayatDirector
Syed M. HusainiPresident & Chief Executive
Asif Reza SanaDirector
Lt Gen (R) Khalid Nawaz KhanChairman
43.3.1.1 In compliance with the BSD circular letter No. 03 of 2011 dated February 22, 2011, all assets and liabilities with contractual maturities have been reported as per their remaining maturities, and where contractual maturities are not available, such assets and liabilities have been reported as per their expected maturities, determined on the basis of behaviour study of three years’ historic data under volatility methodology. These basis have also been approved by the Asset and Liability Management Committee (ALCO) of the Bank.
43.4 OPERATIONAL RISK
Operational risk is the risk of loss resulting from inadequate or failed internal processes, people, systems and external events. The Bank strives to manage operational risk within acceptable levels through sound operational risk management practices. Board Risk Management Committee defines the operational risk appetite and tolerance limits.
Operational risk governance structure adopted by Bank is embedded within three lines of defense: Strategic, Macro and Micro. Bank has recently updated its Operational Risk Management framework to align it with global / local best market practices. Moreover, the Bank has also formulated Operational Risk Management Committee (ORMC) which serves as a management level committee to oversee, supervise and direct operational risk framework across the Bank. Further, the committee is responsible for strengthening internal control environment through implementation of policies and procedure, enhancement in tools and reporting structures.
To ensure effectiveness, business continuity plan (BCP) and business continuity management (BCM) is adopted throughout the organization in a proactive manner by making use of requisite tools and strategies.
43.4.1 OPERATIONAL RISK DISCLOSURES BASEL III
Basel III Basic Indicator Approach is used for calculating the Capital Adequacy for Operational Risk.
44. RECLASSIFICATION OF COMPARATIVE FIGURES
There have been no significant reclassifications in these unconsolidated financial statements except amounts of Rs. 117,242 thousand and Rs. 180,840 thousand which were reclassified in 2014 from income from dealing in foreign currencies to administrative expenses and advances, deposits, advance rent and other prepayments to advances respectively.
45. GENERAL
45.1 Non-adjusting events after the balance sheet date
The Board of Directors in its meeting held on February 15, 2016 has proposed the following appropriations, which will be approved in the forthcoming Annual General Meeting. The unconsolidated financial statements for the year ended December 31, 2015 do not include the effect of the appropriations which will be accounted for in the unconsolidated financial statements for the year ending December 31, 2016 as follows:
Rupees in ‘000 2015 2014
Transfer from unappropriated profit to:
General reserve 1,187,989 1,862,233
Transfer from general reserve: Payment of final cash dividend of Rs. 1.25 per share (2014: Re. 1.00 per share) 1,575,325 1,260,260
45.2 Captions as prescribed by BSD Circular No. 4 dated February 17, 2006 issued by the SBP in respect of which there are no amounts have not been reproduced in these unconsolidated financial statements except for the unconsolidated statement of financial position and unconsolidated profit and loss account.
46. DATE OF AUTHORIZATION
These unconsolidated financial statements were authorized for issue on February 15, 2016 by the Board of Directors of the Bank.
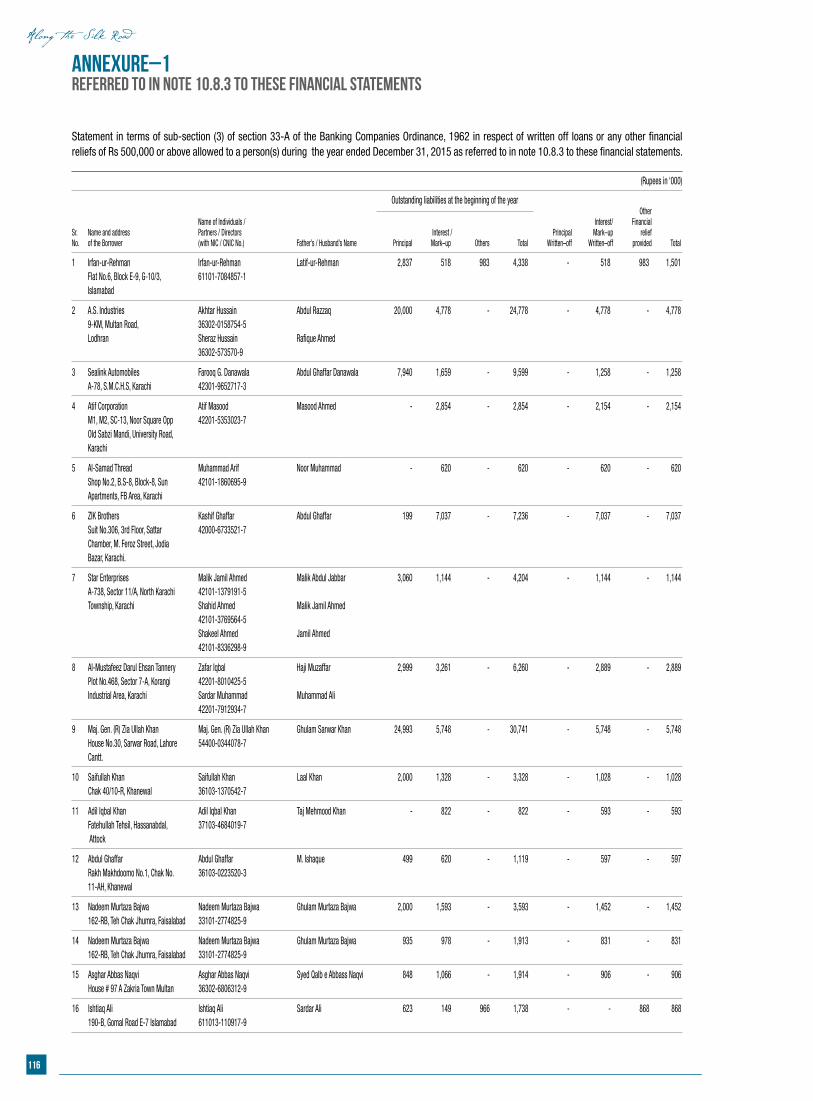
116
Annexure–1referred to in note 10.8.3 to these financial statements
Statement in terms of sub-section (3) of section 33-A of the Banking Companies Ordinance, 1962 in respect of written off loans or any other financial reliefs of Rs 500,000 or above allowed to a person(s) during the year ended December 31, 2015 as referred to in note 10.8.3 to these financial statements.
(Rupees in ‘000)
Outstanding liabilities at the beginning of the year Other Name of Individuals / Interest/ FinancialSr. Name and address Partners / Directors Interest / Principal Mark–up reliefNo. of the Borrower (with NIC / CNIC No.) Father’s / Husband’s Name Principal Mark–up Others Total Written–off Written–off provided Total
1 Irfan-ur-Rehman Irfan-ur-Rehman Latif-ur-Rehman 2,837 518 983 4,338 - 518 983 1,501 Flat No.6, Block E-9, G-10/3, 61101-7084857-1 Islamabad
2 A.S. Industries Akhtar Hussain Abdul Razzaq 20,000 4,778 - 24,778 - 4,778 - 4,778 9-KM, Multan Road, 36302-0158754-5 Lodhran Sheraz Hussain Rafique Ahmed 36302-573570-9
3 Sealink Automobiles Farooq G. Danawala Abdul Ghaffar Danawala 7,940 1,659 - 9,599 - 1,258 - 1,258 A-78, S.M.C.H.S, Karachi 42301-9652717-3
4 Atif Corporation Atif Masood Masood Ahmed - 2,854 - 2,854 - 2,154 - 2,154 M1, M2, SC-13, Noor Square Opp 42201-5353023-7 Old Sabzi Mandi, University Road, Karachi
5 Al-Samad Thread Muhammad Arif Noor Muhammad - 620 - 620 - 620 - 620 Shop No.2, B.S-8, Block-8, Sun 42101-1860695-9 Apartments, FB Area, Karachi
6 ZIK Brothers Kashif Ghaffar Abdul Ghaffar 199 7,037 - 7,236 - 7,037 - 7,037 Suit No.306, 3rd Floor, Sattar 42000-6733521-7 Chamber, M. Feroz Street, Jodia Bazar, Karachi.
7 Star Enterprises Malik Jamil Ahmed Malik Abdul Jabbar 3,060 1,144 - 4,204 - 1,144 - 1,144 A-738, Sector 11/A, North Karachi 42101-1379191-5 Township, Karachi Shahid Ahmed Malik Jamil Ahmed 42101-3769564-5 Shakeel Ahmed Jamil Ahmed 42101-8336298-9
8 Al-Mustafeez Darul Ehsan Tannery Zafar Iqbal Haji Muzaffar 2,999 3,261 - 6,260 - 2,889 - 2,889 Plot No.468, Sector 7-A, Korangi 42201-8010425-5 Industrial Area, Karachi Sardar Muhammad Muhammad Ali 42201-7912934-7
9 Maj. Gen. (R) Zia Ullah Khan Maj. Gen. (R) Zia Ullah Khan Ghulam Sarwar Khan 24,993 5,748 - 30,741 - 5,748 - 5,748 House No.30, Sarwar Road, Lahore 54400-0344078-7 Cantt.
10 Saifullah Khan Saifullah Khan Laal Khan 2,000 1,328 - 3,328 - 1,028 - 1,028 Chak 40/10-R, Khanewal 36103-1370542-7
11 Adil Iqbal Khan Adil Iqbal Khan Taj Mehmood Khan - 822 - 822 - 593 - 593 Fatehullah Tehsil, Hassanabdal, 37103-4684019-7 Attock
12 Abdul Ghaffar Abdul Ghaffar M. Ishaque 499 620 - 1,119 - 597 - 597 Rakh Makhdoomo No.1, Chak No. 36103-0223520-3 11-AH, Khanewal
13 Nadeem Murtaza Bajwa Nadeem Murtaza Bajwa Ghulam Murtaza Bajwa 2,000 1,593 - 3,593 - 1,452 - 1,452 162-RB, Teh Chak Jhumra, Faisalabad 33101-2774825-9
14 Nadeem Murtaza Bajwa Nadeem Murtaza Bajwa Ghulam Murtaza Bajwa 935 978 - 1,913 - 831 - 831 162-RB, Teh Chak Jhumra, Faisalabad 33101-2774825-9
15 Asghar Abbas Naqvi Asghar Abbas Naqvi Syed Qalb e Abbass Naqvi 848 1,066 - 1,914 - 906 - 906 House # 97 A Zakria Town Multan 36302-6806312-9
16 Ishtiaq Ali Ishtiaq Ali Sardar Ali 623 149 966 1,738 - - 868 868 190-B, Gomal Road E-7 Islamabad 611013-110917-9
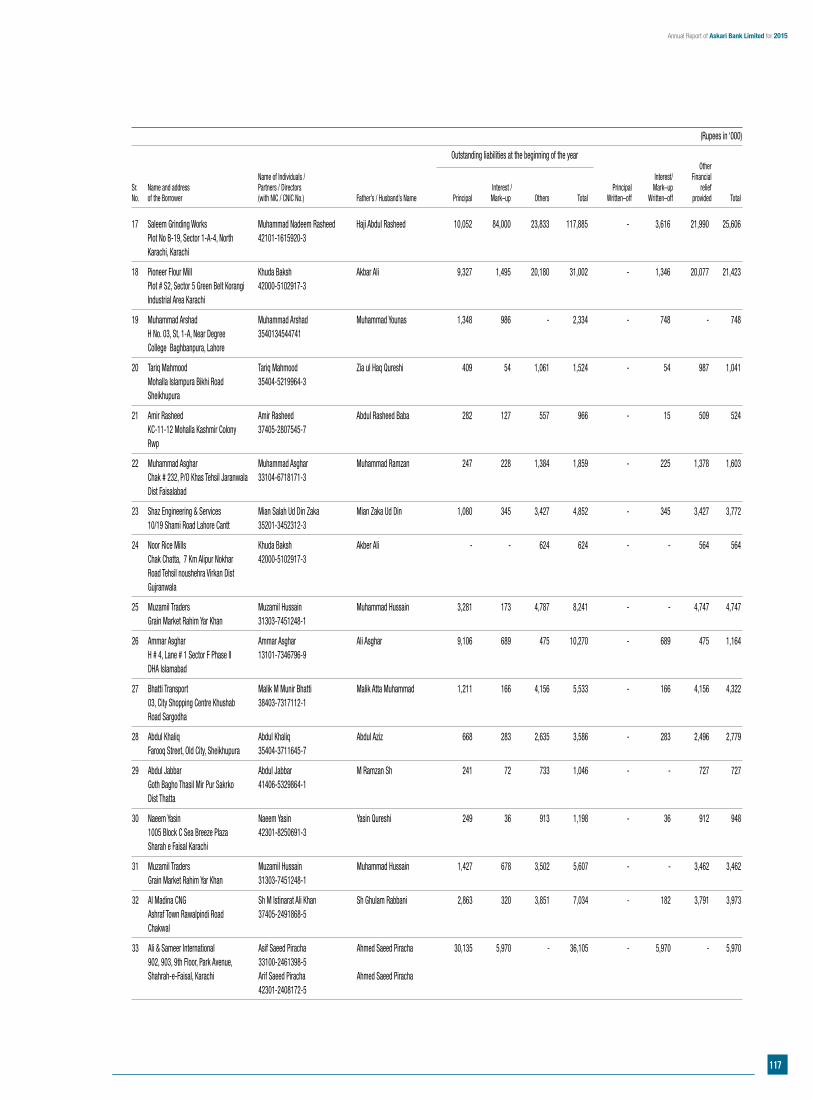
117
Annual Report of Askari Bank Limited for 2015
(Rupees in ‘000)
Outstanding liabilities at the beginning of the year Other Name of Individuals / Interest/ FinancialSr. Name and address Partners / Directors Interest / Principal Mark–up reliefNo. of the Borrower (with NIC / CNIC No.) Father’s / Husband’s Name Principal Mark–up Others Total Written–off Written–off provided Total
17 Saleem Grinding Works Muhammad Nadeem Rasheed Haji Abdul Rasheed 10,052 84,000 23,833 117,885 - 3,616 21,990 25,606 Plot No B-19, Sector 1-A-4, North 42101-1615920-3 Karachi, Karachi
18 Pioneer Flour Mill Khuda Baksh Akbar Ali 9,327 1,495 20,180 31,002 - 1,346 20,077 21,423 Plot # S2, Sector 5 Green Belt Korangi 42000-5102917-3 Industrial Area Karachi
19 Muhammad Arshad Muhammad Arshad Muhammad Younas 1,348 986 - 2,334 - 748 - 748 H No. 03, St, 1-A, Near Degree 3540134544741 College Baghbanpura, Lahore
20 Tariq Mahmood Tariq Mahmood Zia ul Haq Qureshi 409 54 1,061 1,524 - 54 987 1,041 Mohalla Islampura Bikhi Road 35404-5219964-3 Sheikhupura
21 Amir Rasheed Amir Rasheed Abdul Rasheed Baba 282 127 557 966 - 15 509 524 KC-11-12 Mohalla Kashmir Colony 37405-2807545-7 Rwp
22 Muhammad Asghar Muhammad Asghar Muhammad Ramzan 247 228 1,384 1,859 - 225 1,378 1,603 Chak # 232, P/O Khas Tehsil Jaranwala 33104-6718171-3 Dist Faisalabad
23 Shaz Engineering & Services Mian Salah Ud Din Zaka Mian Zaka Ud Din 1,080 345 3,427 4,852 - 345 3,427 3,772 10/19 Shami Road Lahore Cantt 35201-3452312-3
24 Noor Rice Mills Khuda Baksh Akber Ali - - 624 624 - - 564 564 Chak Chatta, 7 Km Alipur Nokhar 42000-5102917-3 Road Tehsil noushehra Virkan Dist Gujranwala
25 Muzamil Traders Muzamil Hussain Muhammad Hussain 3,281 173 4,787 8,241 - - 4,747 4,747 Grain Market Rahim Yar Khan 31303-7451248-1
26 Ammar Asghar Ammar Asghar Ali Asghar 9,106 689 475 10,270 - 689 475 1,164 H # 4, Lane # 1 Sector F Phase II 13101-7346796-9 DHA Islamabad
27 Bhatti Transport Malik M Munir Bhatti Malik Atta Muhammad 1,211 166 4,156 5,533 - 166 4,156 4,322 03, City Shopping Centre Khushab 38403-7317112-1 Road Sargodha
28 Abdul Khaliq Abdul Khaliq Abdul Aziz 668 283 2,635 3,586 - 283 2,496 2,779 Farooq Street, Old City, Sheikhupura 35404-3711645-7
29 Abdul Jabbar Abdul Jabbar M Ramzan Sh 241 72 733 1,046 - - 727 727 Goth Bagho Thasil Mir Pur Sakrko 41406-5329864-1 Dist Thatta
30 Naeem Yasin Naeem Yasin Yasin Qureshi 249 36 913 1,198 - 36 912 948 1005 Block C Sea Breeze Plaza 42301-8250691-3 Sharah e Faisal Karachi
31 Muzamil Traders Muzamil Hussain Muhammad Hussain 1,427 678 3,502 5,607 - - 3,462 3,462 Grain Market Rahim Yar Khan 31303-7451248-1
32 Al Madina CNG Sh M Istinarat Ali Khan Sh Ghulam Rabbani 2,863 320 3,851 7,034 - 182 3,791 3,973 Ashraf Town Rawalpindi Road 37405-2491868-5 Chakwal
33 Ali & Sameer International Asif Saeed Piracha Ahmed Saeed Piracha 30,135 5,970 - 36,105 - 5,970 - 5,970 902, 903, 9th Floor, Park Avenue, 33100-2461398-5 Shahrah-e-Faisal, Karachi Arif Saeed Piracha Ahmed Saeed Piracha 42301-2408172-5
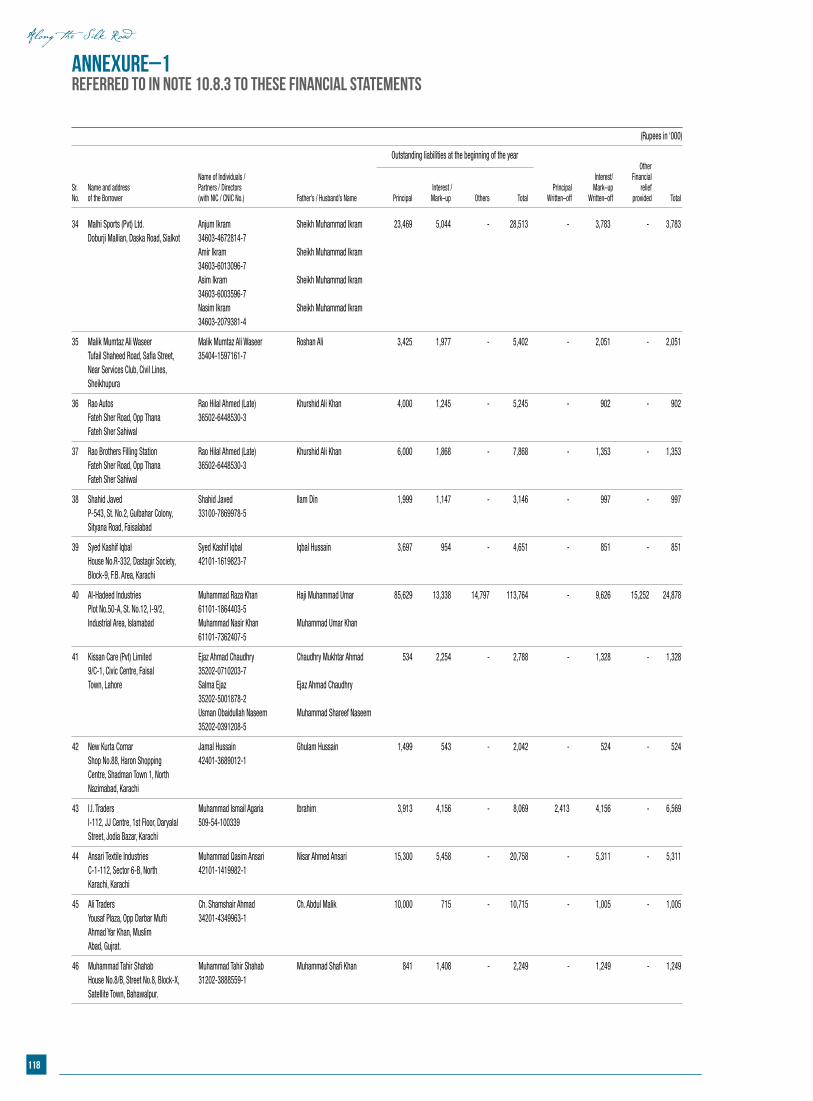
118
Annexure–1referred to in note 10.8.3 to these financial statements
(Rupees in ‘000)
Outstanding liabilities at the beginning of the year Other Name of Individuals / Interest/ FinancialSr. Name and address Partners / Directors Interest / Principal Mark–up reliefNo. of the Borrower (with NIC / CNIC No.) Father’s / Husband’s Name Principal Mark–up Others Total Written–off Written–off provided Total
34 Malhi Sports (Pvt) Ltd. Anjum Ikram Sheikh Muhammad Ikram 23,469 5,044 - 28,513 - 3,783 - 3,783 Doburji Mallian, Daska Road, Sialkot 34603-4672814-7 Amir Ikram Sheikh Muhammad Ikram 34603-6013096-7 Asim Ikram Sheikh Muhammad Ikram 34603-6003596-7 Nasim Ikram Sheikh Muhammad Ikram 34603-2079381-4
35 Malik Mumtaz Ali Waseer Malik Mumtaz Ali Waseer Roshan Ali 3,425 1,977 - 5,402 - 2,051 - 2,051 Tufail Shaheed Road, Safia Street, 35404-1597161-7 Near Services Club, Civil Lines, Sheikhupura
36 Rao Autos Rao Hilal Ahmed (Late) Khurshid Ali Khan 4,000 1,245 - 5,245 - 902 - 902 Fateh Sher Road, Opp Thana 36502-6448530-3 Fateh Sher Sahiwal
37 Rao Brothers Filling Station Rao Hilal Ahmed (Late) Khurshid Ali Khan 6,000 1,868 - 7,868 - 1,353 - 1,353 Fateh Sher Road, Opp Thana 36502-6448530-3 Fateh Sher Sahiwal
38 Shahid Javed Shahid Javed Ilam Din 1,999 1,147 - 3,146 - 997 - 997 P-543, St. No.2, Gulbahar Colony, 33100-7869978-5 Sityana Road, Faisalabad
39 Syed Kashif Iqbal Syed Kashif Iqbal Iqbal Hussain 3,697 954 - 4,651 - 851 - 851 House No.R-332, Dastagir Society, 42101-1619823-7 Block-9, F.B. Area, Karachi
40 Al-Hadeed Industries Muhammad Raza Khan Haji Muhammad Umar 85,629 13,338 14,797 113,764 - 9,626 15,252 24,878 Plot No.50-A, St. No.12, I-9/2, 61101-1864403-5 Industrial Area, Islamabad Muhammad Nasir Khan Muhammad Umar Khan 61101-7362407-5
41 Kissan Care (Pvt) Limited Ejaz Ahmad Chaudhry Chaudhry Mukhtar Ahmad 534 2,254 - 2,788 - 1,328 - 1,328 9/C-1, Civic Centre, Faisal 35202-0710203-7 Town, Lahore Salma Ejaz Ejaz Ahmad Chaudhry 35202-5001878-2 Usman Obaidullah Naseem Muhammad Shareef Naseem 35202-0391208-5
42 New Kurta Cornar Jamal Hussain Ghulam Hussain 1,499 543 - 2,042 - 524 - 524 Shop No.88, Haron Shopping 42401-3689012-1 Centre, Shadman Town 1, North Nazimabad, Karachi
43 I.I. Traders Muhammad Ismail Agaria Ibrahim 3,913 4,156 - 8,069 2,413 4,156 - 6,569 I-112, JJ Centre, 1st Floor, Daryalal 509-54-100339 Street, Jodia Bazar, Karachi
44 Ansari Textile Industries Muhammad Qasim Ansari Nisar Ahmed Ansari 15,300 5,458 - 20,758 - 5,311 - 5,311 C-1-112, Sector 6-B, North 42101-1419982-1 Karachi, Karachi
45 Ali Traders Ch. Shamshair Ahmad Ch. Abdul Malik 10,000 715 - 10,715 - 1,005 - 1,005 Yousaf Plaza, Opp Darbar Mufti 34201-4349963-1 Ahmad Yar Khan, Muslim Abad, Gujrat.
46 Muhammad Tahir Shahab Muhammad Tahir Shahab Muhammad Shafi Khan 841 1,408 - 2,249 - 1,249 - 1,249 House No.8/B, Street No.8, Block-X, 31202-3888559-1 Satellite Town, Bahawalpur.
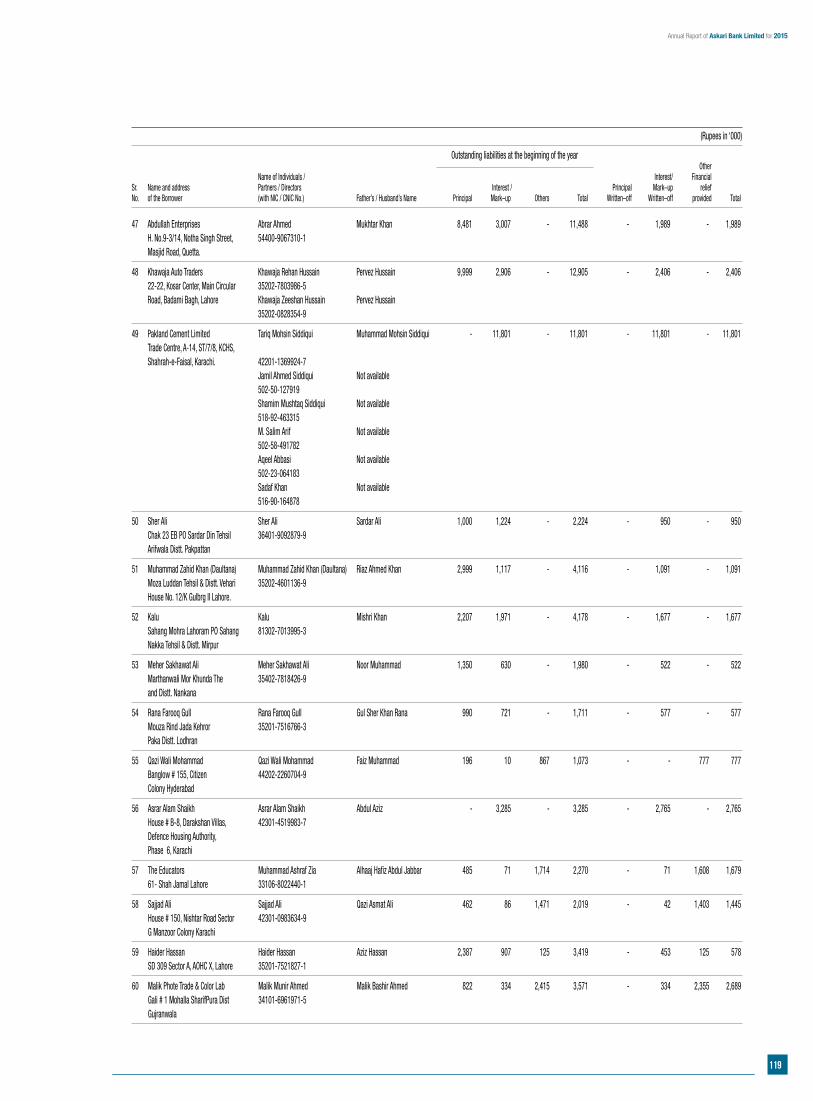
119
Annual Report of Askari Bank Limited for 2015
(Rupees in ‘000)
Outstanding liabilities at the beginning of the year Other Name of Individuals / Interest/ FinancialSr. Name and address Partners / Directors Interest / Principal Mark–up reliefNo. of the Borrower (with NIC / CNIC No.) Father’s / Husband’s Name Principal Mark–up Others Total Written–off Written–off provided Total
47 Abdullah Enterprises Abrar Ahmed Mukhtar Khan 8,481 3,007 - 11,488 - 1,989 - 1,989 H. No.9-3/14, Notha Singh Street, 54400-9067310-1 Masjid Road, Quetta.
48 Khawaja Auto Traders Khawaja Rehan Hussain Pervez Hussain 9,999 2,906 - 12,905 - 2,406 - 2,406 22-22, Kosar Center, Main Circular 35202-7803986-5 Road, Badami Bagh, Lahore Khawaja Zeeshan Hussain Pervez Hussain 35202-0828354-9
49 Pakland Cement Limited Tariq Mohsin Siddiqui Muhammad Mohsin Siddiqui - 11,801 - 11,801 - 11,801 - 11,801 Trade Centre, A-14, ST/7/8, KCHS, Shahrah-e-Faisal, Karachi. 42201-1369924-7 Jamil Ahmed Siddiqui Not available 502-50-127919 Shamim Mushtaq Siddiqui Not available 518-92-463315 M. Salim Arif Not available 502-58-491782 Aqeel Abbasi Not available 502-23-064183 Sadaf Khan Not available 516-90-164878
50 Sher Ali Sher Ali Sardar Ali 1,000 1,224 - 2,224 - 950 - 950 Chak 23 EB PO Sardar Din Tehsil 36401-9092879-9 Arifwala Distt. Pakpattan
51 Muhammad Zahid Khan (Daultana) Muhammad Zahid Khan (Daultana) Riaz Ahmed Khan 2,999 1,117 - 4,116 - 1,091 - 1,091 Moza Luddan Tehsil & Distt. Vehari 35202-4601136-9 House No. 12/K Gulbrg II Lahore.
52 Kalu Kalu Mishri Khan 2,207 1,971 - 4,178 - 1,677 - 1,677 Sahang Mohra Lahoram PO Sahang 81302-7013995-3 Nakka Tehsil & Distt. Mirpur
53 Meher Sakhawat Ali Meher Sakhawat Ali Noor Muhammad 1,350 630 - 1,980 - 522 - 522 Marthanwali Mor Khunda The 35402-7818426-9 and Distt. Nankana
54 Rana Farooq Gull Rana Farooq Gull Gul Sher Khan Rana 990 721 - 1,711 - 577 - 577 Mouza Rind Jada Kehror 35201-7516766-3 Paka Distt. Lodhran
55 Qazi Wali Mohammad Qazi Wali Mohammad Faiz Muhammad 196 10 867 1,073 - - 777 777 Banglow # 155, Citizen 44202-2260704-9 Colony Hyderabad
56 Asrar Alam Shaikh Asrar Alam Shaikh Abdul Aziz - 3,285 - 3,285 - 2,765 - 2,765 House # B-8, Darakshan Villas, 42301-4519983-7 Defence Housing Authority, Phase 6, Karachi
57 The Educators Muhammad Ashraf Zia Alhaaj Hafiz Abdul Jabbar 485 71 1,714 2,270 - 71 1,608 1,679 61- Shah Jamal Lahore 33106-8022440-1
58 Sajjad Ali Sajjad Ali Qazi Asmat Ali 462 86 1,471 2,019 - 42 1,403 1,445 House # 150, Nishtar Road Sector 42301-0983634-9 G Manzoor Colony Karachi
59 Haider Hassan Haider Hassan Aziz Hassan 2,387 907 125 3,419 - 453 125 578 SD 309 Sector A, AOHC X, Lahore 35201-7521827-1
60 Malik Phote Trade & Color Lab Malik Munir Ahmed Malik Bashir Ahmed 822 334 2,415 3,571 - 334 2,355 2,689 Gali # 1 Mohalla SharifPura Dist 34101-6961971-5 Gujranwala
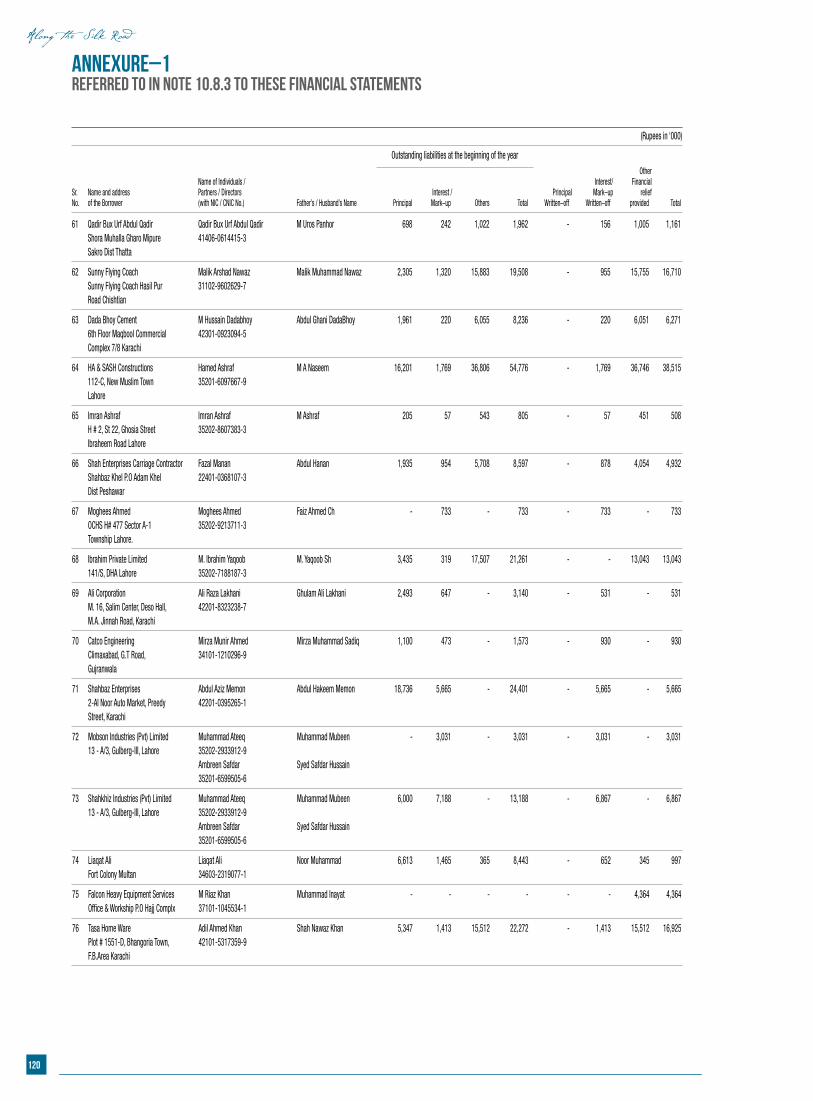
120
(Rupees in ‘000)
Outstanding liabilities at the beginning of the year
Other Name of Individuals / Interest/ FinancialSr. Name and address Partners / Directors Interest / Principal Mark–up reliefNo. of the Borrower (with NIC / CNIC No.) Father’s / Husband’s Name Principal Mark–up Others Total Written–off Written–off provided Total
Annexure–1referred to in note 10.8.3 to these financial statements
61 Qadir Bux Urf Abdul Qadir Qadir Bux Urf Abdul Qadir M Uros Panhor 698 242 1,022 1,962 - 156 1,005 1,161 Shora Muhalla Gharo Mipure 41406-0614415-3 Sakro Dist Thatta
62 Sunny Flying Coach Malik Arshad Nawaz Malik Muhammad Nawaz 2,305 1,320 15,883 19,508 - 955 15,755 16,710 Sunny Flying Coach Hasil Pur 31102-9602629-7 Road Chishtian
63 Dada Bhoy Cement M Hussain Dadabhoy Abdul Ghani DadaBhoy 1,961 220 6,055 8,236 - 220 6,051 6,271 6th Floor Maqbool Commercial 42301-0923094-5 Complex 7/8 Karachi
64 HA & SASH Constructions Hamed Ashraf M A Naseem 16,201 1,769 36,806 54,776 - 1,769 36,746 38,515 112-C, New Muslim Town 35201-6097667-9 Lahore
65 Imran Ashraf Imran Ashraf M Ashraf 205 57 543 805 - 57 451 508 H # 2, St 22, Ghosia Street 35202-8607383-3 Ibraheem Road Lahore
66 Shah Enterprises Carriage Contractor Fazal Manan Abdul Hanan 1,935 954 5,708 8,597 - 878 4,054 4,932 Shahbaz Khel P.O Adam Khel 22401-0368107-3 Dist Peshawar
67 Moghees Ahmed Moghees Ahmed Faiz Ahmed Ch - 733 - 733 - 733 - 733 OCHS H# 477 Sector A-1 35202-9213711-3 Township Lahore.
68 Ibrahim Private Limited M. Ibrahim Yaqoob M. Yaqoob Sh 3,435 319 17,507 21,261 - - 13,043 13,043 141/S, DHA Lahore 35202-7188187-3
69 Ali Corporation Ali Raza Lakhani Ghulam Ali Lakhani 2,493 647 - 3,140 - 531 - 531 M. 16, Salim Center, Deso Hall, 42201-8323238-7 M.A. Jinnah Road, Karachi
70 Catco Engineering Mirza Munir Ahmed Mirza Muhammad Sadiq 1,100 473 - 1,573 - 930 - 930 Climaxabad, G.T Road, 34101-1210296-9 Gujranwala
71 Shahbaz Enterprises Abdul Aziz Memon Abdul Hakeem Memon 18,736 5,665 - 24,401 - 5,665 - 5,665 2-Al Noor Auto Market, Preedy 42201-0395265-1 Street, Karachi
72 Mobson Industries (Pvt) Limited Muhammad Ateeq Muhammad Mubeen - 3,031 - 3,031 - 3,031 - 3,031 13 - A/3, Gulberg-III, Lahore 35202-2933912-9 Ambreen Safdar Syed Safdar Hussain 35201-6599505-6
73 Shahkhiz Industries (Pvt) Limited Muhammad Ateeq Muhammad Mubeen 6,000 7,188 - 13,188 - 6,867 - 6,867 13 - A/3, Gulberg-III, Lahore 35202-2933912-9 Ambreen Safdar Syed Safdar Hussain 35201-6599505-6
74 Liaqat Ali Liaqat Ali Noor Muhammad 6,613 1,465 365 8,443 - 652 345 997 Fort Colony Multan 34603-2319077-1
75 Falcon Heavy Equipment Services M Riaz Khan Muhammad Inayat - - - - - - 4,364 4,364 Office & Workship P.O Hajj Complx 37101-1045534-1
76 Tasa Home Ware Adil Ahmed Khan Shah Nawaz Khan 5,347 1,413 15,512 22,272 - 1,413 15,512 16,925 Plot # 1551-D, Bhangoria Town, 42101-5317359-9 F.B.Area Karachi
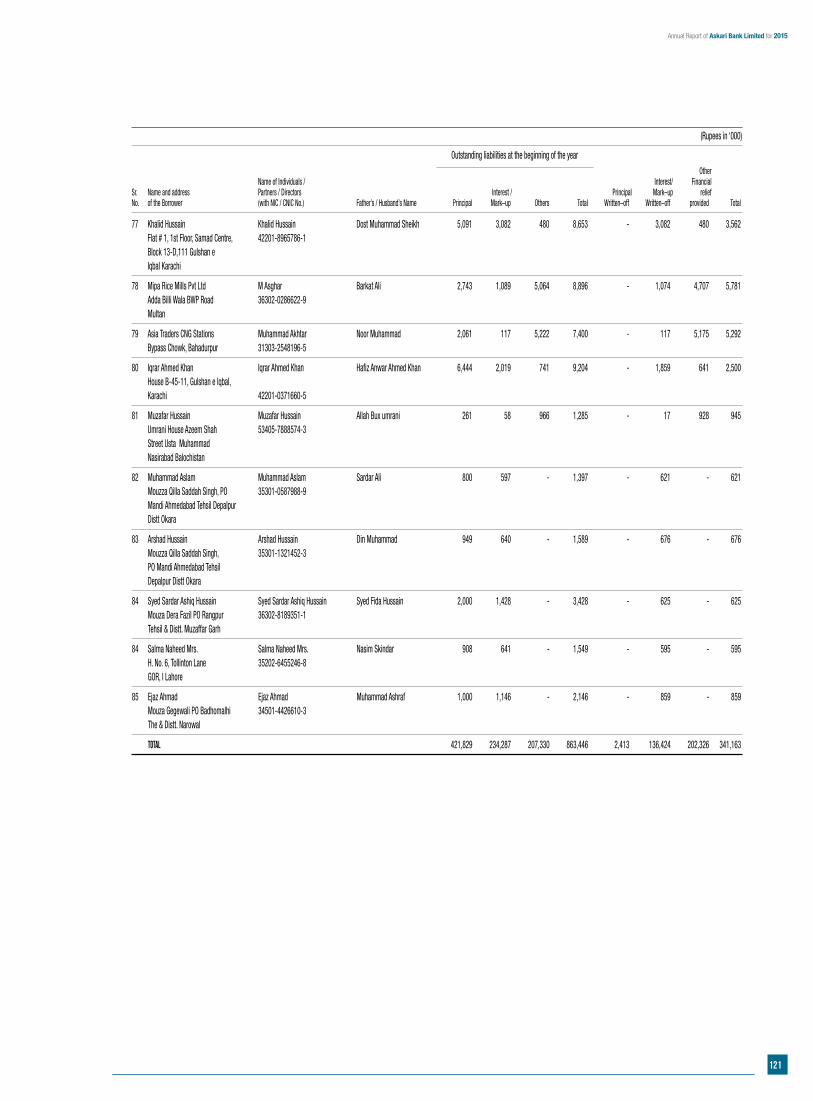
121
Annual Report of Askari Bank Limited for 2015
(Rupees in ‘000)
Outstanding liabilities at the beginning of the year
Other Name of Individuals / Interest/ FinancialSr. Name and address Partners / Directors Interest / Principal Mark–up reliefNo. of the Borrower (with NIC / CNIC No.) Father’s / Husband’s Name Principal Mark–up Others Total Written–off Written–off provided Total
77 Khalid Hussain Khalid Hussain Dost Muhammad Sheikh 5,091 3,082 480 8,653 - 3,082 480 3,562 Flat # 1, 1st Floor, Samad Centre, 42201-8965786-1 Block 13-D,111 Gulshan e Iqbal Karachi
78 Mipa Rice Mills Pvt Ltd M Asghar Barkat Ali 2,743 1,089 5,064 8,896 - 1,074 4,707 5,781 Adda Billi Wala BWP Road 36302-0286622-9 Multan
79 Asia Traders CNG Stations Muhammad Akhtar Noor Muhammad 2,061 117 5,222 7,400 - 117 5,175 5,292 Bypass Chowk, Bahadurpur 31303-2548196-5
80 Iqrar Ahmed Khan Iqrar Ahmed Khan Hafiz Anwar Ahmed Khan 6,444 2,019 741 9,204 - 1,859 641 2,500 House B-45-11, Gulshan e Iqbal, Karachi 42201-0371660-5
81 Muzafar Hussain Muzafar Hussain Allah Bux umrani 261 58 966 1,285 - 17 928 945 Umrani House Azeem Shah 53405-7888574-3 Street Usta Muhammad Nasirabad Balochistan
82 Muhammad Aslam Muhammad Aslam Sardar Ali 800 597 - 1,397 - 621 - 621 Mouzza Qilla Saddah Singh, PO 35301-0587988-9 Mandi Ahmedabad Tehsil Depalpur Distt Okara
83 Arshad Hussain Arshad Hussain Din Muhammad 949 640 - 1,589 - 676 - 676 Mouzza Qilla Saddah Singh, 35301-1321452-3 PO Mandi Ahmedabad Tehsil Depalpur Distt Okara
84 Syed Sardar Ashiq Hussain Syed Sardar Ashiq Hussain Syed Fida Hussain 2,000 1,428 - 3,428 - 625 - 625 Mouza Dera Fazil PO Rangpur 36302-8189351-1 Tehsil & Distt. Muzaffar Garh
84 Salma Naheed Mrs. Salma Naheed Mrs. Nasim Skindar 908 641 - 1,549 - 595 - 595 H. No. 6, Tollinton Lane 35202-6455246-8 GOR, I Lahore
85 Ejaz Ahmad Ejaz Ahmad Muhammad Ashraf 1,000 1,146 - 2,146 - 859 - 859 Mouza Gegewali PO Badhomalhi 34501-4426610-3 The & Distt. Narowal
TOTAL 421,829 234,287 207,330 863,446 2,413 136,424 202,326 341,163
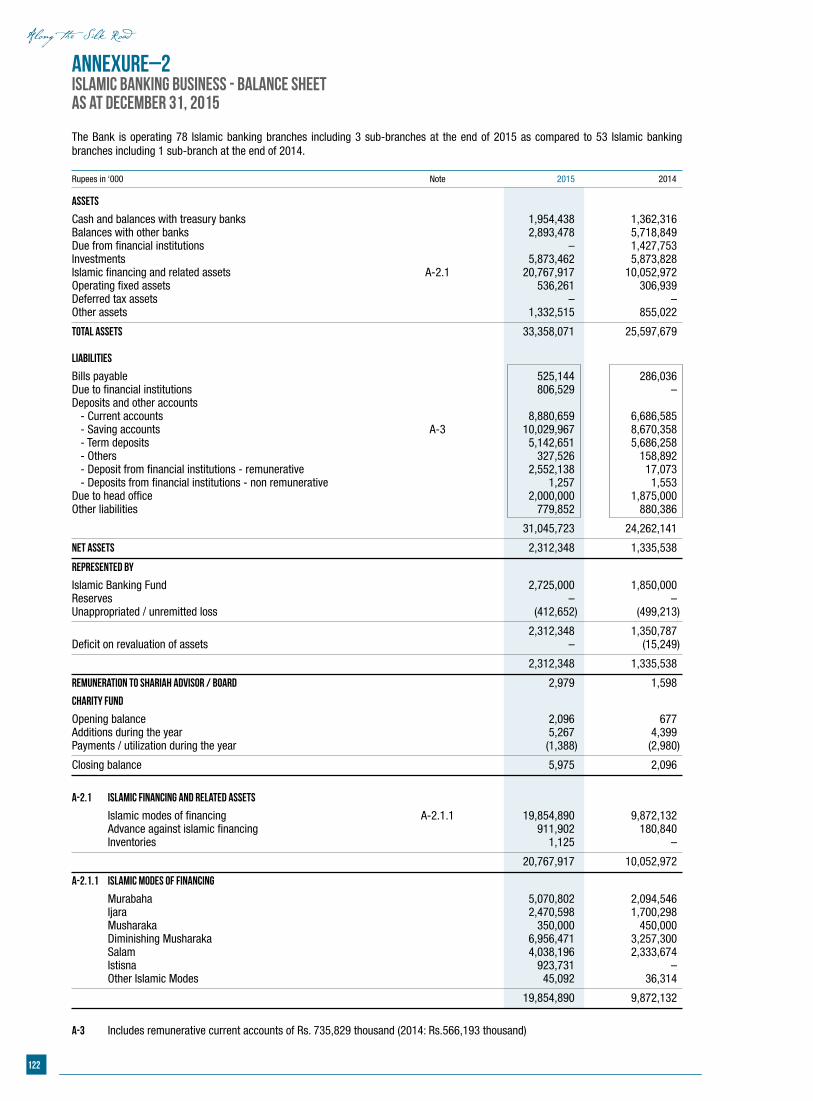
122
Annexure–2Islamic Banking Business - Balance SheetAs at December 31, 2015
The Bank is operating 78 Islamic banking branches including 3 sub-branches at the end of 2015 as compared to 53 Islamic banking branches including 1 sub-branch at the end of 2014.
Rupees in ‘000 Note 2015 2014
ASSETS
Cash and balances with treasury banks 1,954,438 1,362,316 Balances with other banks 2,893,478 5,718,849 Due from financial institutions – 1,427,753 Investments 5,873,462 5,873,828 Islamic financing and related assets A-2.1 20,767,917 10,052,972 Operating fixed assets 536,261 306,939 Deferred tax assets – – Other assets 1,332,515 855,022
Total Assets 33,358,071 25,597,679 LIABILITIES
Bills payable 525,144 286,036 Due to financial institutions 806,529 – Deposits and other accounts - Current accounts 8,880,659 6,686,585 - Saving accounts A-3 10,029,967 8,670,358 - Term deposits 5,142,651 5,686,258 - Others 327,526 158,892 - Deposit from financial institutions - remunerative 2,552,138 17,073 - Deposits from financial institutions - non remunerative 1,257 1,553 Due to head office 2,000,000 1,875,000 Other liabilities 779,852 880,386
31,045,723 24,262,141
NET ASSETS 2,312,348 1,335,538
REPRESENTED BY
Islamic Banking Fund 2,725,000 1,850,000 Reserves – – Unappropriated / unremitted loss (412,652) (499,213)
2,312,348 1,350,787 Deficit on revaluation of assets – (15,249)
2,312,348 1,335,538
Remuneration to Shariah Advisor / Board 2,979 1,598
CHARITY FUND
Opening balance 2,096 677 Additions during the year 5,267 4,399 Payments / utilization during the year (1,388) (2,980)
Closing balance 5,975 2,096
A-2.1 Islamic Financing and Related Assets
Islamic modes of financing A-2.1.1 19,854,890 9,872,132 Advance against islamic financing 911,902 180,840 Inventories 1,125 –
20,767,917 10,052,972
A-2.1.1 Islamic modes of Financing
Murabaha 5,070,802 2,094,546 Ijara 2,470,598 1,700,298 Musharaka 350,000 450,000 Diminishing Musharaka 6,956,471 3,257,300 Salam 4,038,196 2,333,674 Istisna 923,731 – Other Islamic Modes 45,092 36,314
19,854,890 9,872,132
A-3 Includes remunerative current accounts of Rs. 735,829 thousand (2014: Rs.566,193 thousand)
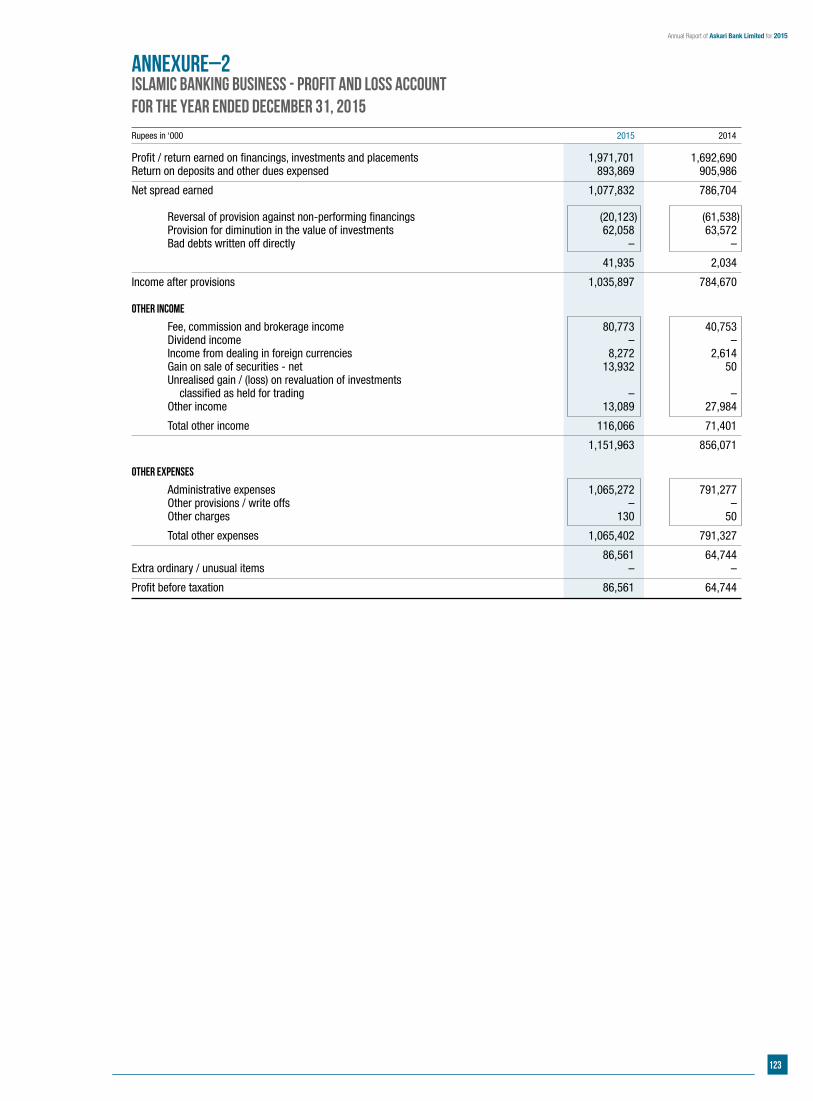
123
Annual Report of Askari Bank Limited for 2015
Annexure–2Islamic Banking Business - Profit and Loss AccountFor the year ended December 31, 2015
Rupees in ‘000 2015 2014
Profit / return earned on financings, investments and placements 1,971,701 1,692,690 Return on deposits and other dues expensed 893,869 905,986
Net spread earned 1,077,832 786,704 Reversal of provision against non-performing financings (20,123) (61,538) Provision for diminution in the value of investments 62,058 63,572 Bad debts written off directly – –
41,935 2,034
Income after provisions 1,035,897 784,670 Other Income
Fee, commission and brokerage income 80,773 40,753 Dividend income – – Income from dealing in foreign currencies 8,272 2,614 Gain on sale of securities - net 13,932 50 Unrealised gain / (loss) on revaluation of investments classified as held for trading – – Other income 13,089 27,984
Total other income 116,066 71,401
1,151,963 856,071 Other expenses
Administrative expenses 1,065,272 791,277 Other provisions / write offs – – Other charges 130 50
Total other expenses 1,065,402 791,327
86,561 64,744 Extra ordinary / unusual items – –
Profit before taxation 86,561 64,744
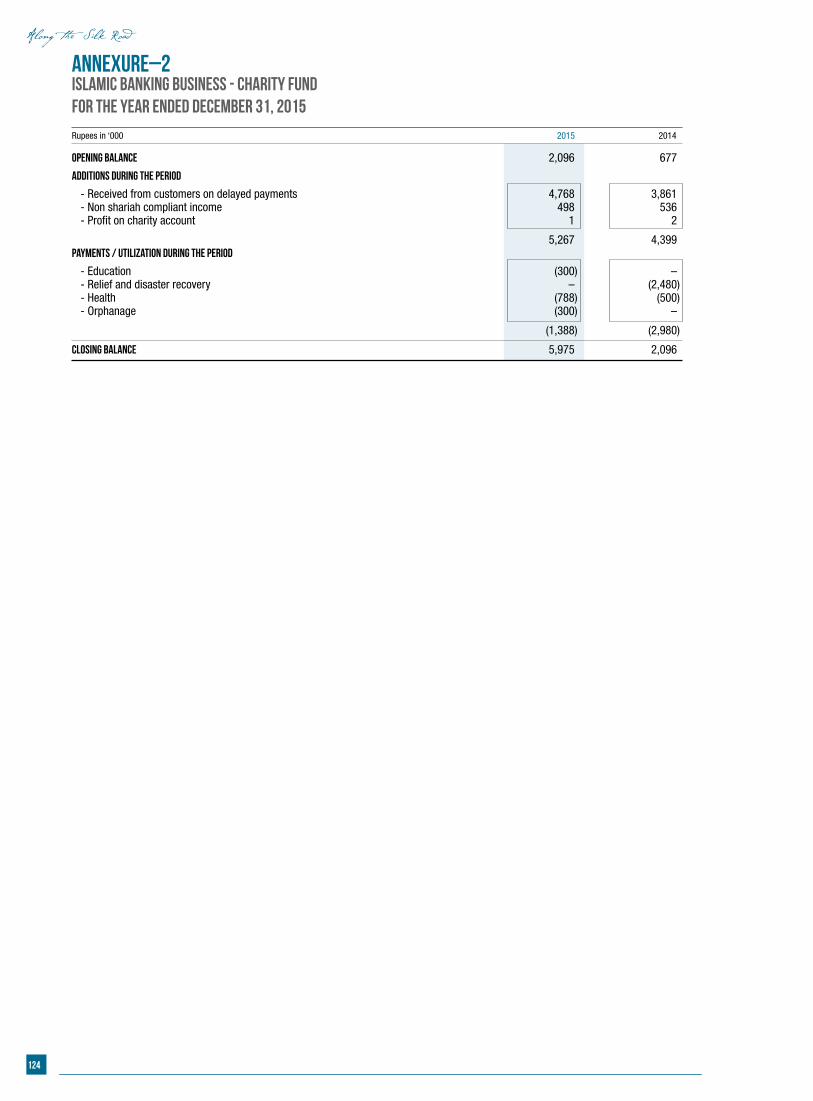
124
Annexure–2Islamic Banking Business - Charity Fund For the year ended December 31, 2015
Rupees in ‘000 2015 2014
Opening balance 2,096 677
Additions during the period
- Received from customers on delayed payments 4,768 3,861 - Non shariah compliant income 498 536 - Profit on charity account 1 2
5,267 4,399 Payments / utilization during the period
- Education (300) – - Relief and disaster recovery – (2,480) - Health (788) (500) - Orphanage (300) –
(1,388) (2,980)
Closing balance 5,975 2,096
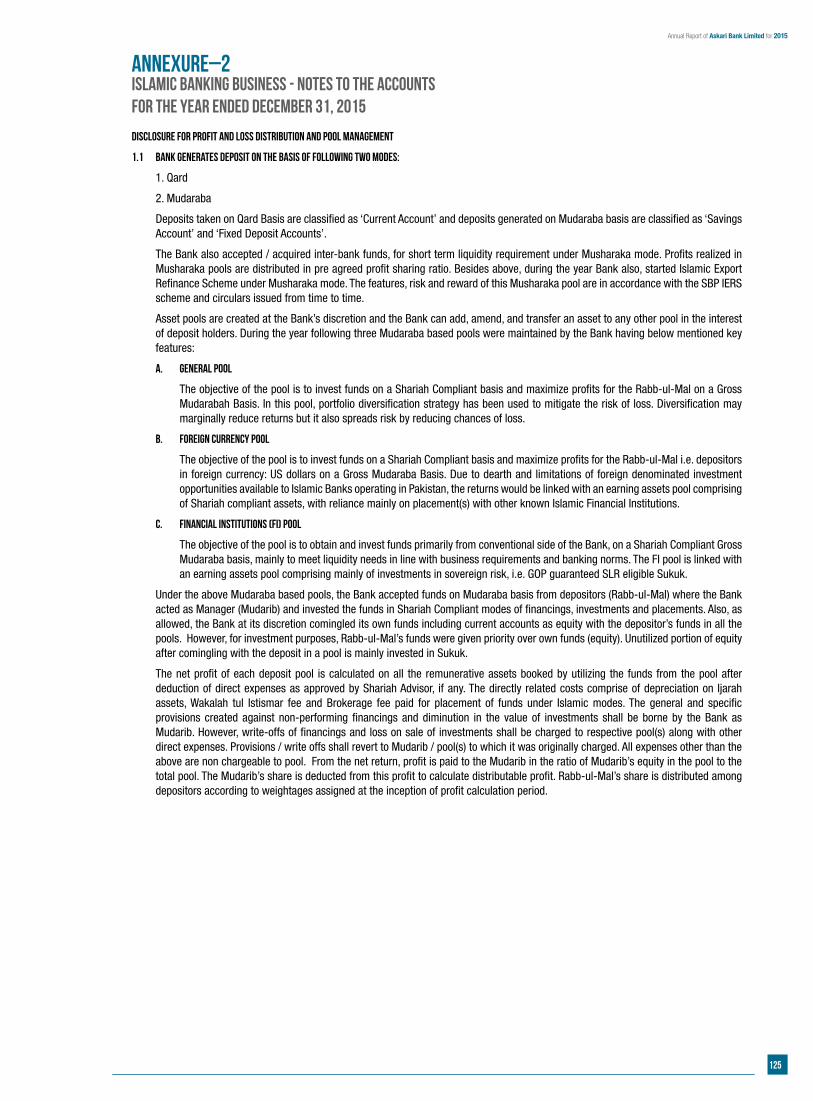
125
Annual Report of Askari Bank Limited for 2015
Annexure–2Islamic Banking Business - Notes to the accountsFor the year ended December 31, 2015
Disclosure for profit and loss distribution and pool management
1.1 Bank generates deposit on the basis of following two modes:
1. Qard
2. Mudaraba
Deposits taken on Qard Basis are classified as ‘Current Account’ and deposits generated on Mudaraba basis are classified as ‘Savings Account’ and ‘Fixed Deposit Accounts’.
The Bank also accepted / acquired inter-bank funds, for short term liquidity requirement under Musharaka mode. Profits realized in Musharaka pools are distributed in pre agreed profit sharing ratio. Besides above, during the year Bank also, started Islamic Export Refinance Scheme under Musharaka mode. The features, risk and reward of this Musharaka pool are in accordance with the SBP IERS scheme and circulars issued from time to time.
Asset pools are created at the Bank’s discretion and the Bank can add, amend, and transfer an asset to any other pool in the interest of deposit holders. During the year following three Mudaraba based pools were maintained by the Bank having below mentioned key features:
a. General Pool
The objective of the pool is to invest funds on a Shariah Compliant basis and maximize profits for the Rabb-ul-Mal on a Gross Mudarabah Basis. In this pool, portfolio diversification strategy has been used to mitigate the risk of loss. Diversification may marginally reduce returns but it also spreads risk by reducing chances of loss.
b. Foreign Currency Pool
The objective of the pool is to invest funds on a Shariah Compliant basis and maximize profits for the Rabb-ul-Mal i.e. depositors in foreign currency: US dollars on a Gross Mudaraba Basis. Due to dearth and limitations of foreign denominated investment opportunities available to Islamic Banks operating in Pakistan, the returns would be linked with an earning assets pool comprising of Shariah compliant assets, with reliance mainly on placement(s) with other known Islamic Financial Institutions.
c. Financial Institutions (FI) Pool
The objective of the pool is to obtain and invest funds primarily from conventional side of the Bank, on a Shariah Compliant Gross Mudaraba basis, mainly to meet liquidity needs in line with business requirements and banking norms. The FI pool is linked with an earning assets pool comprising mainly of investments in sovereign risk, i.e. GOP guaranteed SLR eligible Sukuk.
Under the above Mudaraba based pools, the Bank accepted funds on Mudaraba basis from depositors (Rabb-ul-Mal) where the Bank acted as Manager (Mudarib) and invested the funds in Shariah Compliant modes of financings, investments and placements. Also, as allowed, the Bank at its discretion comingled its own funds including current accounts as equity with the depositor’s funds in all the pools. However, for investment purposes, Rabb-ul-Mal’s funds were given priority over own funds (equity). Unutilized portion of equity after comingling with the deposit in a pool is mainly invested in Sukuk.
The net profit of each deposit pool is calculated on all the remunerative assets booked by utilizing the funds from the pool after deduction of direct expenses as approved by Shariah Advisor, if any. The directly related costs comprise of depreciation on Ijarah assets, Wakalah tul Istismar fee and Brokerage fee paid for placement of funds under Islamic modes. The general and specific provisions created against non-performing financings and diminution in the value of investments shall be borne by the Bank as Mudarib. However, write-offs of financings and loss on sale of investments shall be charged to respective pool(s) along with other direct expenses. Provisions / write offs shall revert to Mudarib / pool(s) to which it was originally charged. All expenses other than the above are non chargeable to pool. From the net return, profit is paid to the Mudarib in the ratio of Mudarib’s equity in the pool to the total pool. The Mudarib’s share is deducted from this profit to calculate distributable profit. Rabb-ul-Mal’s share is distributed among depositors according to weightages assigned at the inception of profit calculation period.
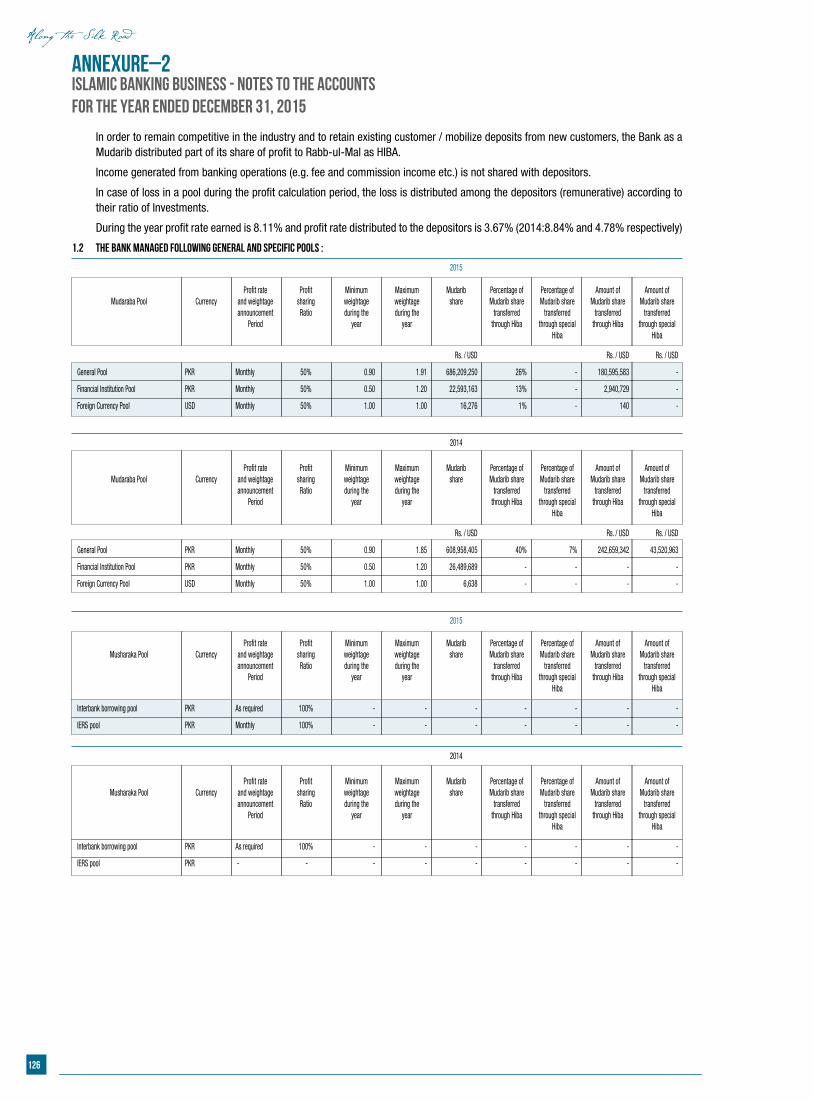
126
Annexure–2Islamic Banking Business - Notes to the accounts For the year ended December 31, 2015
In order to remain competitive in the industry and to retain existing customer / mobilize deposits from new customers, the Bank as a Mudarib distributed part of its share of profit to Rabb-ul-Mal as HIBA.
Income generated from banking operations (e.g. fee and commission income etc.) is not shared with depositors.
In case of loss in a pool during the profit calculation period, the loss is distributed among the depositors (remunerative) according to their ratio of Investments.
During the year profit rate earned is 8.11% and profit rate distributed to the depositors is 3.67% (2014:8.84% and 4.78% respectively)
1.2 The Bank managed following General and Specific Pools :
2015 Profit rate Profit Minimum Maximum Mudarib Percentage of Percentage of Amount of Amount of Mudaraba Pool Currency and weightage sharing weightage weightage share Mudarib share Mudarib share Mudarib share Mudarib share announcement Ratio during the during the transferred transferred transferred transferred Period year year through Hiba through special through Hiba through special Hiba Hiba
Rs. / USD Rs. / USD Rs. / USD
General Pool PKR Monthly 50% 0.90 1.91 686,209,250 26% - 180,595,583 -
Financial Institution Pool PKR Monthly 50% 0.50 1.20 22,593,163 13% - 2,940,729 -
Foreign Currency Pool USD Monthly 50% 1.00 1.00 16,276 1% - 140 -
2014
Profit rate Profit Minimum Maximum Mudarib Percentage of Percentage of Amount of Amount of Mudaraba Pool Currency and weightage sharing weightage weightage share Mudarib share Mudarib share Mudarib share Mudarib share announcement Ratio during the during the transferred transferred transferred transferred Period year year through Hiba through special through Hiba through special Hiba Hiba
Rs. / USD Rs. / USD Rs. / USD
General Pool PKR Monthly 50% 0.90 1.85 608,958,405 40% 7% 242,659,342 43,520,963
Financial Institution Pool PKR Monthly 50% 0.50 1.20 26,489,689 - - - -
Foreign Currency Pool USD Monthly 50% 1.00 1.00 6,638 - - - -
2015 Profit rate Profit Minimum Maximum Mudarib Percentage of Percentage of Amount of Amount of Musharaka Pool Currency and weightage sharing weightage weightage share Mudarib share Mudarib share Mudarib share Mudarib share announcement Ratio during the during the transferred transferred transferred transferred Period year year through Hiba through special through Hiba through special Hiba Hiba
Interbank borrowing pool PKR As required 100% - - - - - - -
IERS pool PKR Monthly 100% - - - - - - -
2014
Profit rate Profit Minimum Maximum Mudarib Percentage of Percentage of Amount of Amount of Musharaka Pool Currency and weightage sharing weightage weightage share Mudarib share Mudarib share Mudarib share Mudarib share announcement Ratio during the during the transferred transferred transferred transferred Period year year through Hiba through special through Hiba through special Hiba Hiba
Interbank borrowing pool PKR As required 100% - - - - - - -
IERS pool PKR - - - - - - - - -
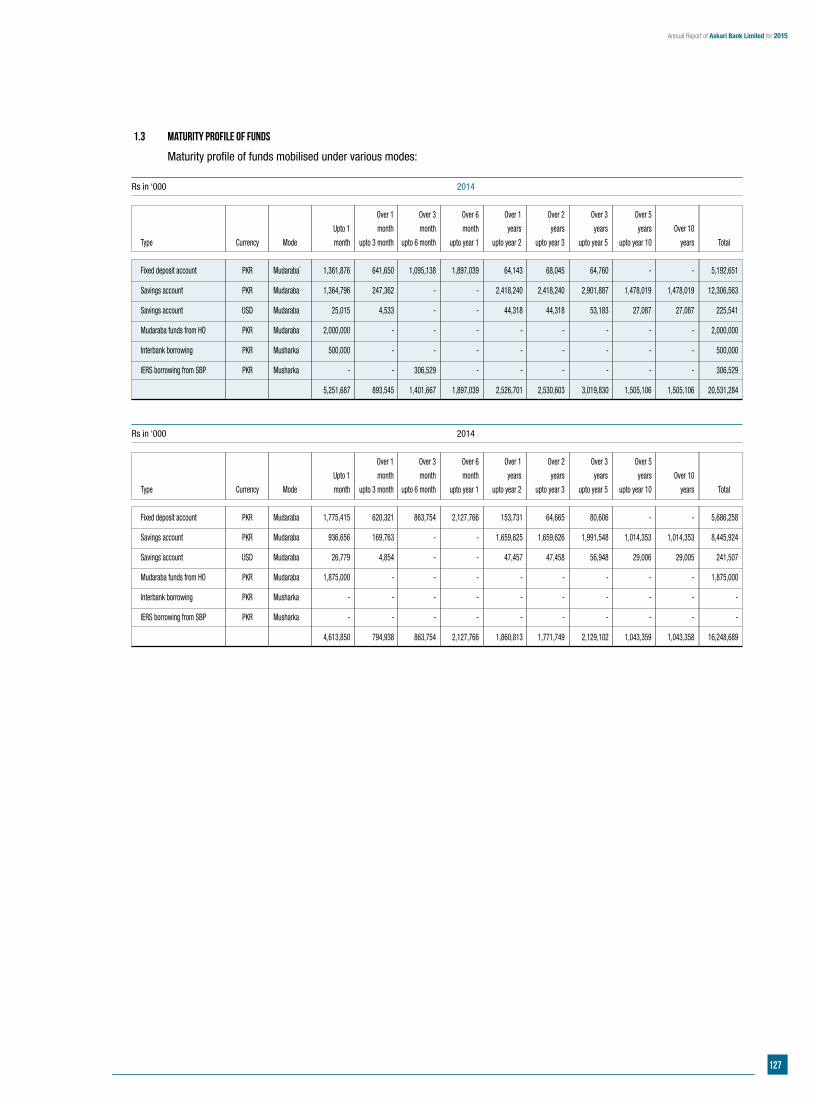
127
Annual Report of Askari Bank Limited for 2015
1.3 Maturity profile of funds
Maturity profile of funds mobilised under various modes:
Rs in ‘000 2014
Over 1 Over 3 Over 6 Over 1 Over 2 Over 3 Over 5
Upto 1 month month month years years years years Over 10
Type Currency Mode month upto 3 month upto 6 month upto year 1 upto year 2 upto year 3 upto year 5 upto year 10 years Total
Fixed deposit account PKR Mudaraba` 1,361,876 641,650 1,095,138 1,897,039 64,143 68,045 64,760 - - 5,192,651
Savings account PKR Mudaraba 1,364,796 247,362 - - 2,418,240 2,418,240 2,901,887 1,478,019 1,478,019 12,306,563
Savings account USD Mudaraba 25,015 4,533 - - 44,318 44,318 53,183 27,087 27,087 225,541
Mudaraba funds from HO PKR Mudaraba 2,000,000 - - - - - - - - 2,000,000
Interbank borrowing PKR Musharka 500,000 - - - - - - - - 500,000
IERS borrowing from SBP PKR Musharka - - 306,529 - - - - - - 306,529
5,251,687 893,545 1,401,667 1,897,039 2,526,701 2,530,603 3,019,830 1,505,106 1,505,106 20,531,284
Rs in ‘000 2014
Over 1 Over 3 Over 6 Over 1 Over 2 Over 3 Over 5
Upto 1 month month month years years years years Over 10
Type Currency Mode month upto 3 month upto 6 month upto year 1 upto year 2 upto year 3 upto year 5 upto year 10 years Total
Fixed deposit account PKR Mudaraba 1,775,415 620,321 863,754 2,127,766 153,731 64,665 80,606 - - 5,686,258
Savings account PKR Mudaraba 936,656 169,763 - - 1,659,625 1,659,626 1,991,548 1,014,353 1,014,353 8,445,924
Savings account USD Mudaraba 26,779 4,854 - - 47,457 47,458 56,948 29,006 29,005 241,507
Mudaraba funds from HO PKR Mudaraba 1,875,000 - - - - - - - - 1,875,000
Interbank borrowing PKR Musharka - - - - - - - - - -
IERS borrowing from SBP PKR Musharka - - - - - - - - - -
4,613,850 794,938 863,754 2,127,766 1,860,813 1,771,749 2,129,102 1,043,359 1,043,358 16,248,689
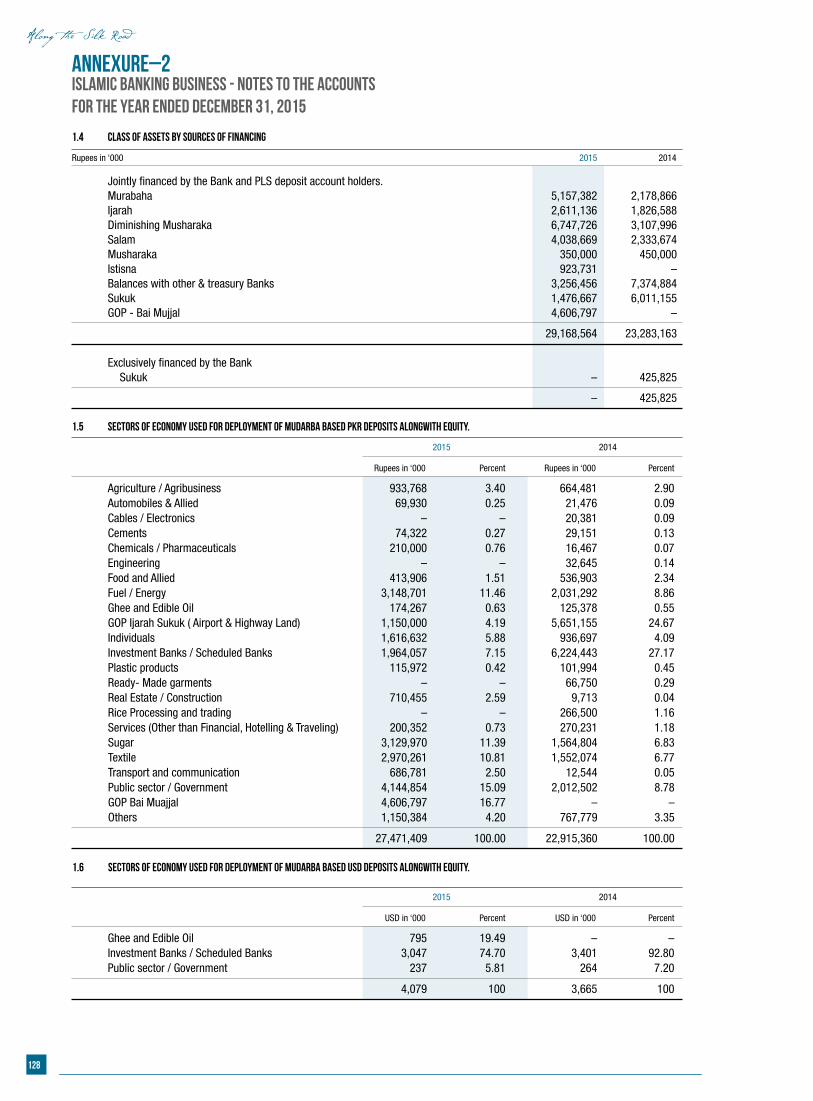
128
Annexure–2Islamic Banking Business - Notes to the accounts For the year ended December 31, 2015
1.4 Class of assets by sources of financing
Rupees in ‘000 2015 2014
Jointly financed by the Bank and PLS deposit account holders. Murabaha 5,157,382 2,178,866 Ijarah 2,611,136 1,826,588 Diminishing Musharaka 6,747,726 3,107,996 Salam 4,038,669 2,333,674 Musharaka 350,000 450,000 Istisna 923,731 – Balances with other & treasury Banks 3,256,456 7,374,884 Sukuk 1,476,667 6,011,155 GOP - Bai Mujjal 4,606,797 –
29,168,564 23,283,163 Exclusively financed by the Bank Sukuk – 425,825
– 425,825 1.5 Sectors of Economy used for deployment of Mudarba Based PKR Deposits alongwith Equity.
2015 2014
Rupees in ‘000 Percent Rupees in ‘000 Percent
Agriculture / Agribusiness 933,768 3.40 664,481 2.90 Automobiles & Allied 69,930 0.25 21,476 0.09 Cables / Electronics – – 20,381 0.09 Cements 74,322 0.27 29,151 0.13 Chemicals / Pharmaceuticals 210,000 0.76 16,467 0.07 Engineering – – 32,645 0.14 Food and Allied 413,906 1.51 536,903 2.34 Fuel / Energy 3,148,701 11.46 2,031,292 8.86 Ghee and Edible Oil 174,267 0.63 125,378 0.55 GOP Ijarah Sukuk ( Airport & Highway Land) 1,150,000 4.19 5,651,155 24.67 Individuals 1,616,632 5.88 936,697 4.09 Investment Banks / Scheduled Banks 1,964,057 7.15 6,224,443 27.17 Plastic products 115,972 0.42 101,994 0.45 Ready- Made garments – – 66,750 0.29 Real Estate / Construction 710,455 2.59 9,713 0.04 Rice Processing and trading – – 266,500 1.16 Services (Other than Financial, Hotelling & Traveling) 200,352 0.73 270,231 1.18 Sugar 3,129,970 11.39 1,564,804 6.83 Textile 2,970,261 10.81 1,552,074 6.77 Transport and communication 686,781 2.50 12,544 0.05 Public sector / Government 4,144,854 15.09 2,012,502 8.78 GOP Bai Muajjal 4,606,797 16.77 – – Others 1,150,384 4.20 767,779 3.35
27,471,409 100.00 22,915,360 100.00 1.6 Sectors of Economy used for deployment of Mudarba Based USD Deposits alongwith Equity.
2015 2014
USD in ‘000 Percent USD in ‘000 Percent
Ghee and Edible Oil 795 19.49 – – Investment Banks / Scheduled Banks 3,047 74.70 3,401 92.80 Public sector / Government 237 5.81 264 7.20
4,079 100 3,665 100
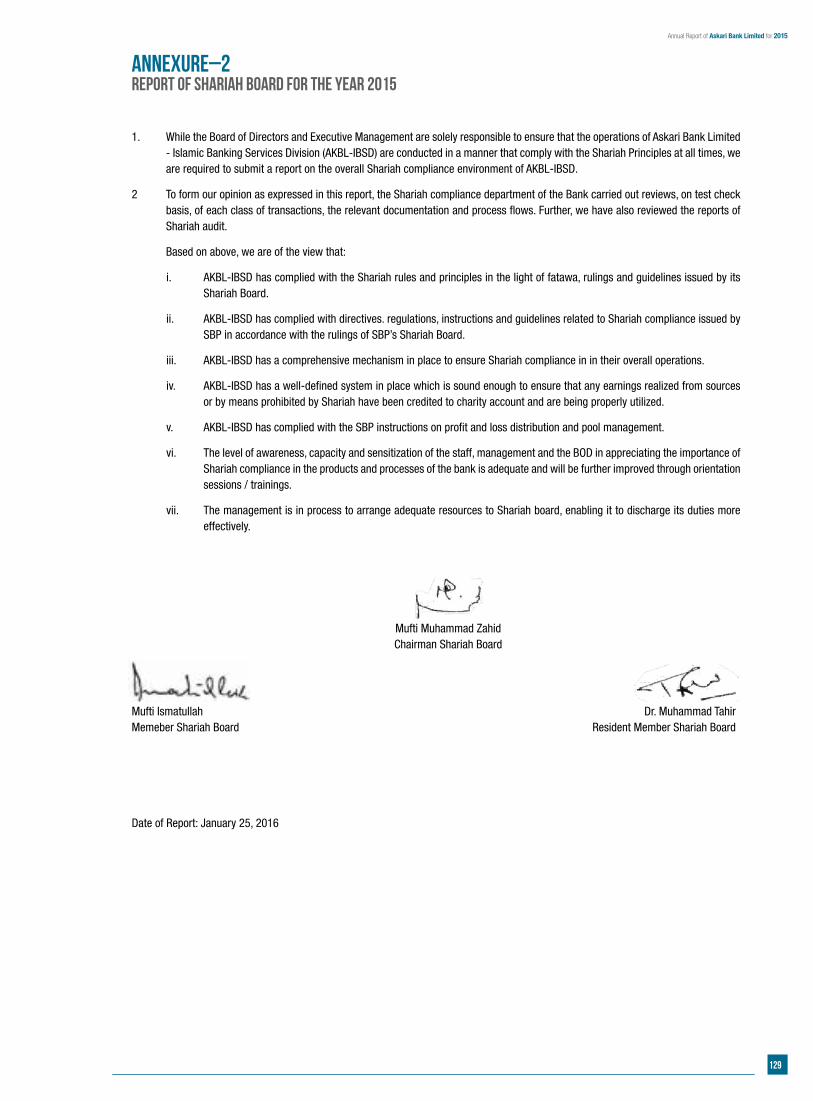
129
Annual Report of Askari Bank Limited for 2015
1. While the Board of Directors and Executive Management are solely responsible to ensure that the operations of Askari Bank Limited - Islamic Banking Services Division (AKBL-IBSD) are conducted in a manner that comply with the Shariah Principles at all times, we are required to submit a report on the overall Shariah compliance environment of AKBL-IBSD.
2 To form our opinion as expressed in this report, the Shariah compliance department of the Bank carried out reviews, on test check basis, of each class of transactions, the relevant documentation and process flows. Further, we have also reviewed the reports of Shariah audit.
Based on above, we are of the view that:
i. AKBL-IBSD has complied with the Shariah rules and principles in the light of fatawa, rulings and guidelines issued by its Shariah Board.
ii. AKBL-IBSD has complied with directives. regulations, instructions and guidelines related to Shariah compliance issued by SBP in accordance with the rulings of SBP’s Shariah Board.
iii. AKBL-IBSD has a comprehensive mechanism in place to ensure Shariah compliance in in their overall operations.
iv. AKBL-IBSD has a well-defined system in place which is sound enough to ensure that any earnings realized from sources or by means prohibited by Shariah have been credited to charity account and are being properly utilized.
v. AKBL-IBSD has complied with the SBP instructions on profit and loss distribution and pool management.
vi. The level of awareness, capacity and sensitization of the staff, management and the BOD in appreciating the importance of Shariah compliance in the products and processes of the bank is adequate and will be further improved through orientation sessions / trainings.
vii. The management is in process to arrange adequate resources to Shariah board, enabling it to discharge its duties more effectively.
Mufti Muhammad Zahid Chairman Shariah Board
Mufti Ismatullah Dr. Muhammad TahirMemeber Shariah Board Resident Member Shariah Board
Date of Report: January 25, 2016
Annexure–2REPORT OF SHARIAH BOARD FOR THE YEAR 2015

130

131
Annual Report of Askari Bank Limited for 2015
consolidated Financial Statements of
Askari Bank LimitedFor the year ended December 31, 2015

132
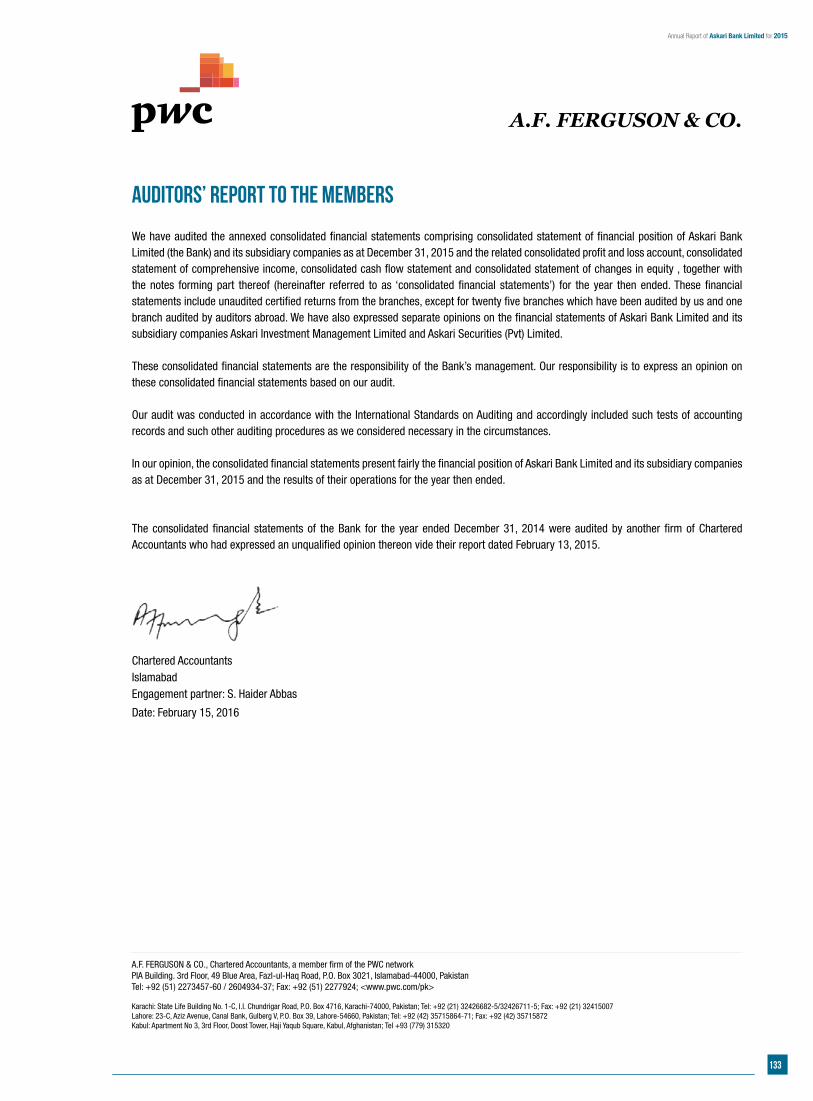
133
Annual Report of Askari Bank Limited for 2015
Auditors’ Report to the Members
We have audited the annexed consolidated financial statements comprising consolidated statement of financial position of Askari Bank Limited (the Bank) and its subsidiary companies as at December 31, 2015 and the related consolidated profit and loss account, consolidated statement of comprehensive income, consolidated cash flow statement and consolidated statement of changes in equity , together with the notes forming part thereof (hereinafter referred to as ‘consolidated financial statements’) for the year then ended. These financial statements include unaudited certified returns from the branches, except for twenty five branches which have been audited by us and one branch audited by auditors abroad. We have also expressed separate opinions on the financial statements of Askari Bank Limited and its subsidiary companies Askari Investment Management Limited and Askari Securities (Pvt) Limited.
These consolidated financial statements are the responsibility of the Bank’s management. Our responsibility is to express an opinion on these consolidated financial statements based on our audit.
Our audit was conducted in accordance with the International Standards on Auditing and accordingly included such tests of accounting records and such other auditing procedures as we considered necessary in the circumstances.
In our opinion, the consolidated financial statements present fairly the financial position of Askari Bank Limited and its subsidiary companies as at December 31, 2015 and the results of their operations for the year then ended.
The consolidated financial statements of the Bank for the year ended December 31, 2014 were audited by another firm of Chartered Accountants who had expressed an unqualified opinion thereon vide their report dated February 13, 2015.
Chartered AccountantsIslamabadEngagement partner: S. Haider Abbas
Date: February 15, 2016
A.F. FERGUSON & CO.
A.F. FERGUSON & CO., Chartered Accountants, a member firm of the PWC networkPIA Building. 3rd Floor, 49 Blue Area, Fazl-ul-Haq Road, P.O. Box 3021, Islamabad-44000, PakistanTel: +92 (51) 2273457-60 / 2604934-37; Fax: +92 (51) 2277924; <www.pwc.com/pk>
Karachi: State Life Building No. 1-C, I.I. Chundrigar Road, P.O. Box 4716, Karachi-74000, Pakistan; Tel: +92 (21) 32426682-5/32426711-5; Fax: +92 (21) 32415007Lahore: 23-C, Aziz Avenue, Canal Bank, Gulberg V, P.O. Box 39, Lahore-54660, Pakistan; Tel: +92 (42) 35715864-71; Fax: +92 (42) 35715872Kabul: Apartment No 3, 3rd Floor, Doost Tower, Haji Yaqub Square, Kabul, Afghanistan; Tel +93 (779) 315320
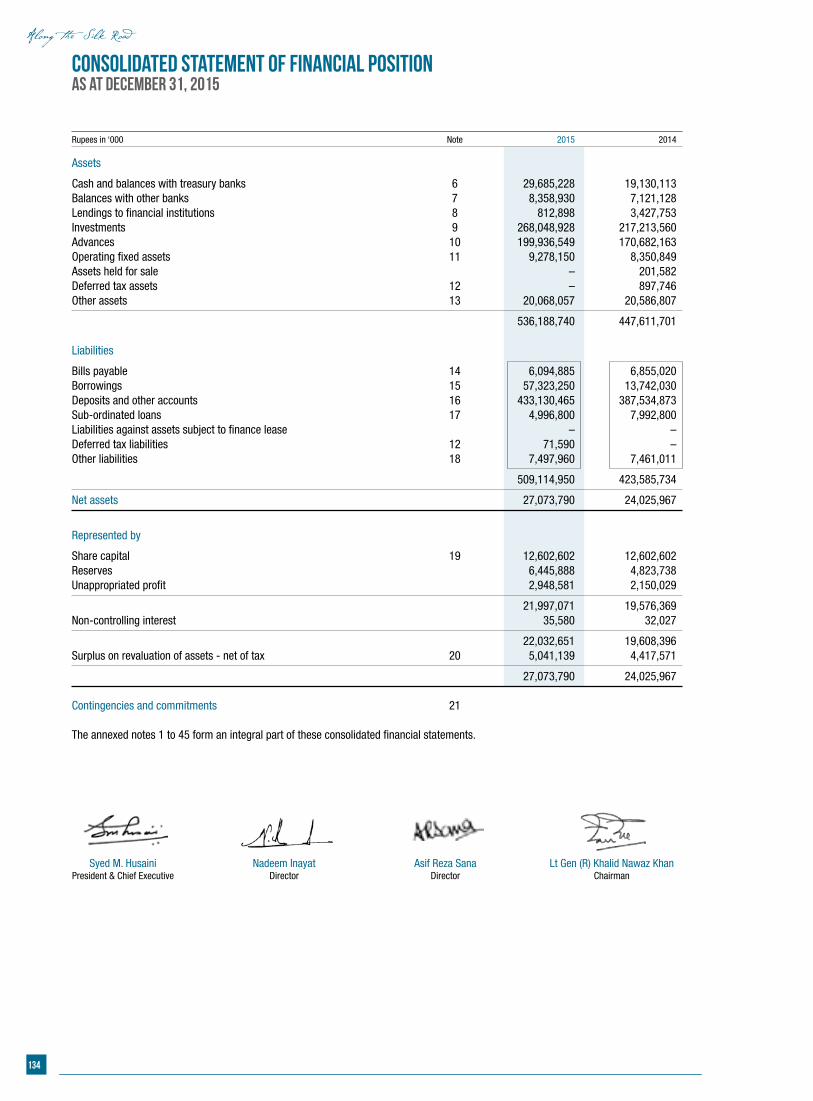
134
consolidated Statement of Financial PositionAs at December 31, 2015
Rupees in ‘000 Note 2015 2014
Assets
Cash and balances with treasury banks 6 29,685,228 19,130,113 Balances with other banks 7 8,358,930 7,121,128 Lendings to financial institutions 8 812,898 3,427,753 Investments 9 268,048,928 217,213,560 Advances 10 199,936,549 170,682,163 Operating fixed assets 11 9,278,150 8,350,849 Assets held for sale – 201,582 Deferred tax assets 12 – 897,746 Other assets 13 20,068,057 20,586,807
536,188,740 447,611,701 Liabilities
Bills payable 14 6,094,885 6,855,020 Borrowings 15 57,323,250 13,742,030 Deposits and other accounts 16 433,130,465 387,534,873 Sub-ordinated loans 17 4,996,800 7,992,800 Liabilities against assets subject to finance lease – – Deferred tax liabilities 12 71,590 –Other liabilities 18 7,497,960 7,461,011
509,114,950 423,585,734
Net assets 27,073,790 24,025,967
Represented by
Share capital 19 12,602,602 12,602,602 Reserves 6,445,888 4,823,738 Unappropriated profit 2,948,581 2,150,029
21,997,071 19,576,369 Non-controlling interest 35,580 32,027
22,032,651 19,608,396 Surplus on revaluation of assets - net of tax 20 5,041,139 4,417,571
27,073,790 24,025,967 Contingencies and commitments 21 The annexed notes 1 to 45 form an integral part of these consolidated financial statements.
Nadeem InayatDirector
Syed M. HusainiPresident & Chief Executive
Asif Reza SanaDirector
Lt Gen (R) Khalid Nawaz KhanChairman
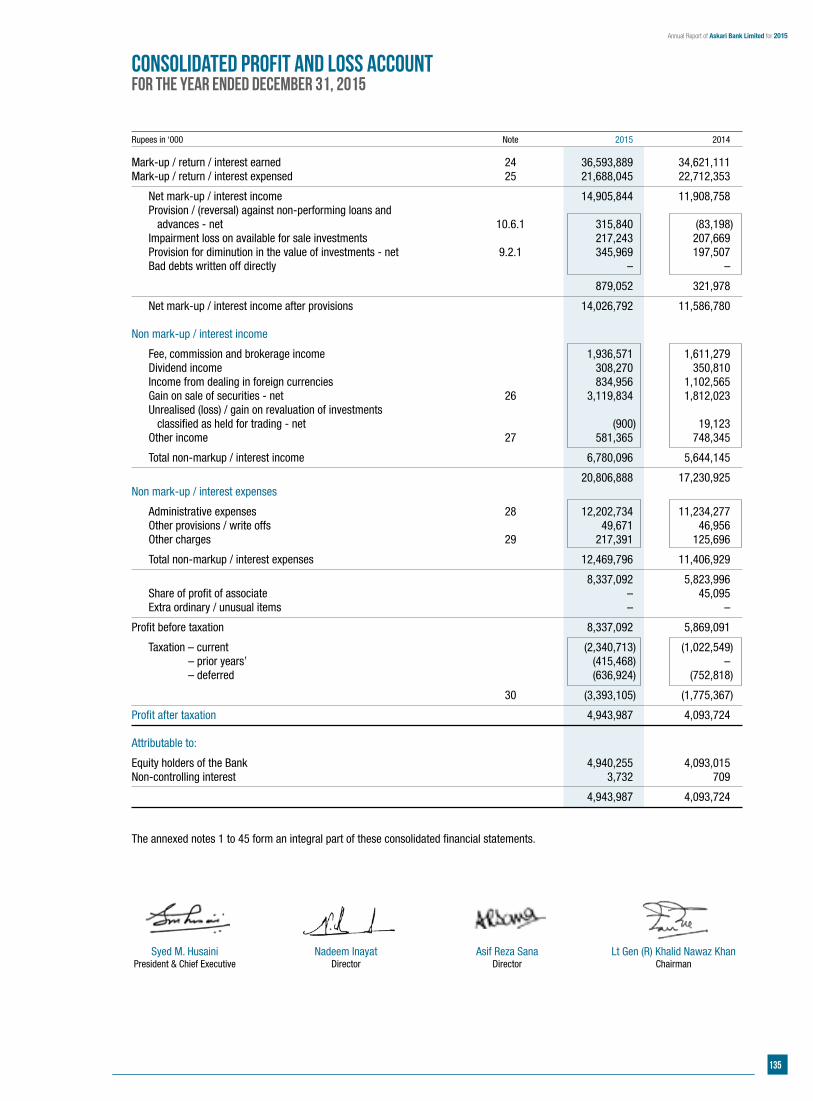
135
Annual Report of Askari Bank Limited for 2015
Nadeem InayatDirector
Syed M. HusainiPresident & Chief Executive
Asif Reza SanaDirector
Lt Gen (R) Khalid Nawaz KhanChairman
consolidated Profit and Loss AccountFor the year ended December 31, 2015
Rupees in ‘000 Note 2015 2014
Mark-up / return / interest earned 24 36,593,889 34,621,111 Mark-up / return / interest expensed 25 21,688,045 22,712,353
Net mark-up / interest income 14,905,844 11,908,758 Provision / (reversal) against non-performing loans and advances - net 10.6.1 315,840 (83,198) Impairment loss on available for sale investments 217,243 207,669 Provision for diminution in the value of investments - net 9.2.1 345,969 197,507 Bad debts written off directly – –
879,052 321,978
Net mark-up / interest income after provisions 14,026,792 11,586,780 Non mark-up / interest income
Fee, commission and brokerage income 1,936,571 1,611,279 Dividend income 308,270 350,810 Income from dealing in foreign currencies 834,956 1,102,565 Gain on sale of securities - net 26 3,119,834 1,812,023 Unrealised (loss) / gain on revaluation of investments classified as held for trading - net (900) 19,123 Other income 27 581,365 748,345
Total non-markup / interest income 6,780,096 5,644,145
20,806,888 17,230,925 Non mark-up / interest expenses
Administrative expenses 28 12,202,734 11,234,277 Other provisions / write offs 49,671 46,956 Other charges 29 217,391 125,696
Total non-markup / interest expenses 12,469,796 11,406,929
8,337,092 5,823,996 Share of profit of associate – 45,095 Extra ordinary / unusual items – –
Profit before taxation 8,337,092 5,869,091
Taxation – current (2,340,713) (1,022,549) Taxation – prior years’ (415,468) – Taxation – deferred (636,924) (752,818)
30 (3,393,105) (1,775,367)
Profit after taxation 4,943,987 4,093,724
Attributable to:
Equity holders of the Bank 4,940,255 4,093,015 Non-controlling interest 3,732 709
4,943,987 4,093,724 The annexed notes 1 to 45 form an integral part of these consolidated financial statements.
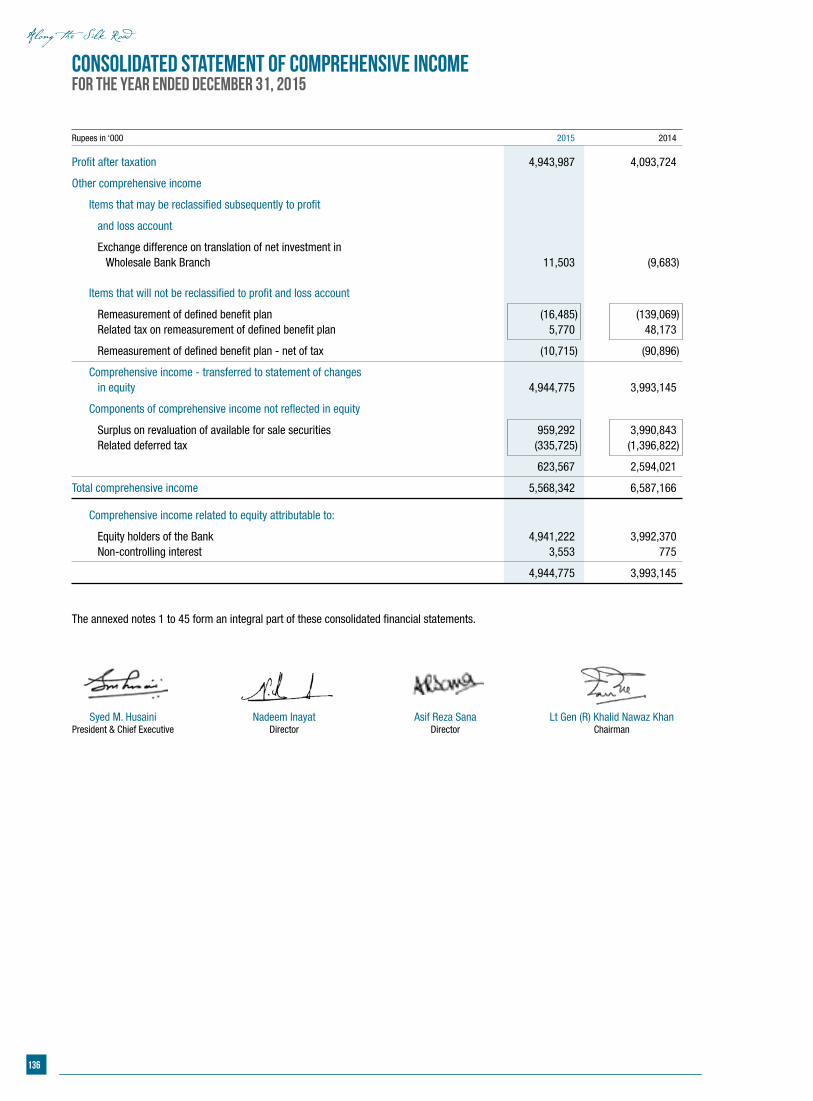
136
Nadeem InayatDirector
Syed M. HusainiPresident & Chief Executive
Asif Reza SanaDirector
Lt Gen (R) Khalid Nawaz KhanChairman
consolidated Statement of Comprehensive IncomeFor the year ended December 31, 2015
Rupees in ‘000 2015 2014
Profit after taxation 4,943,987 4,093,724
Other comprehensive income
Items that may be reclassified subsequently to profit
and loss account
Exchange difference on translation of net investment in Wholesale Bank Branch 11,503 (9,683) Items that will not be reclassified to profit and loss account
Remeasurement of defined benefit plan (16,485) (139,069) Related tax on remeasurement of defined benefit plan 5,770 48,173
Remeasurement of defined benefit plan - net of tax (10,715) (90,896)
Comprehensive income - transferred to statement of changes in equity 4,944,775 3,993,145
Components of comprehensive income not reflected in equity
Surplus on revaluation of available for sale securities 959,292 3,990,843 Related deferred tax (335,725) (1,396,822)
623,567 2,594,021
Total comprehensive income 5,568,342 6,587,166
Comprehensive income related to equity attributable to:
Equity holders of the Bank 4,941,222 3,992,370 Non-controlling interest 3,553 775
4,944,775 3,993,145
The annexed notes 1 to 45 form an integral part of these consolidated financial statements.
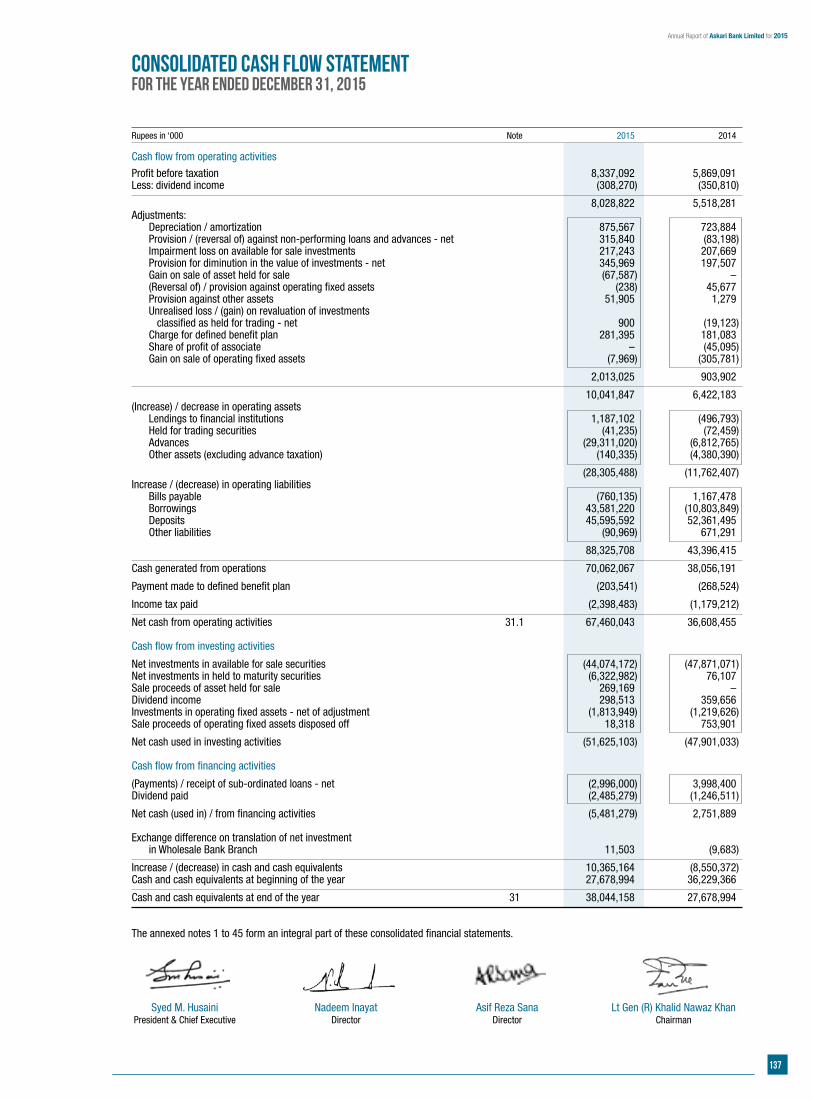
137
Annual Report of Askari Bank Limited for 2015
Nadeem InayatDirector
Syed M. HusainiPresident & Chief Executive
Asif Reza SanaDirector
Lt Gen (R) Khalid Nawaz KhanChairman
Rupees in ‘000 Note 2015 2014
Cash flow from operating activities
Profit before taxation 8,337,092 5,869,091 Less: dividend income (308,270) (350,810)
8,028,822 5,518,281 Adjustments: Depreciation / amortization 875,567 723,884 Provision / (reversal of) against non-performing loans and advances - net 315,840 (83,198) Impairment loss on available for sale investments 217,243 207,669 Provision for diminution in the value of investments - net 345,969 197,507 Gain on sale of asset held for sale (67,587) – (Reversal of) / provision against operating fixed assets (238) 45,677 Provision against other assets 51,905 1,279 Unrealised loss / (gain) on revaluation of investments classified as held for trading - net 900 (19,123) Charge for defined benefit plan 281,395 181,083 Share of profit of associate – (45,095) Gain on sale of operating fixed assets (7,969) (305,781)
2,013,025 903,902
10,041,847 6,422,183 (Increase) / decrease in operating assets Lendings to financial institutions 1,187,102 (496,793) Held for trading securities (41,235) (72,459) Advances (29,311,020) (6,812,765) Other assets (excluding advance taxation) (140,335) (4,380,390)
(28,305,488) (11,762,407)Increase / (decrease) in operating liabilities Bills payable (760,135) 1,167,478 Borrowings 43,581,220 (10,803,849) Deposits 45,595,592 52,361,495 Other liabilities (90,969) 671,291
88,325,708 43,396,415
Cash generated from operations 70,062,067 38,056,191
Payment made to defined benefit plan (203,541) (268,524)
Income tax paid (2,398,483) (1,179,212)
Net cash from operating activities 31.1 67,460,043 36,608,455 Cash flow from investing activities
Net investments in available for sale securities (44,074,172) (47,871,071)Net investments in held to maturity securities (6,322,982) 76,107 Sale proceeds of asset held for sale 269,169 –Dividend income 298,513 359,656 Investments in operating fixed assets - net of adjustment (1,813,949) (1,219,626)Sale proceeds of operating fixed assets disposed off 18,318 753,901
Net cash used in investing activities (51,625,103) (47,901,033) Cash flow from financing activities
(Payments) / receipt of sub-ordinated loans - net (2,996,000) 3,998,400 Dividend paid (2,485,279) (1,246,511)
Net cash (used in) / from financing activities (5,481,279) 2,751,889 Exchange difference on translation of net investment in Wholesale Bank Branch 11,503 (9,683)
Increase / (decrease) in cash and cash equivalents 10,365,164 (8,550,372)Cash and cash equivalents at beginning of the year 27,678,994 36,229,366
Cash and cash equivalents at end of the year 31 38,044,158 27,678,994 The annexed notes 1 to 45 form an integral part of these consolidated financial statements.
consolidated Cash Flow StatementFor the year ended December 31, 2015
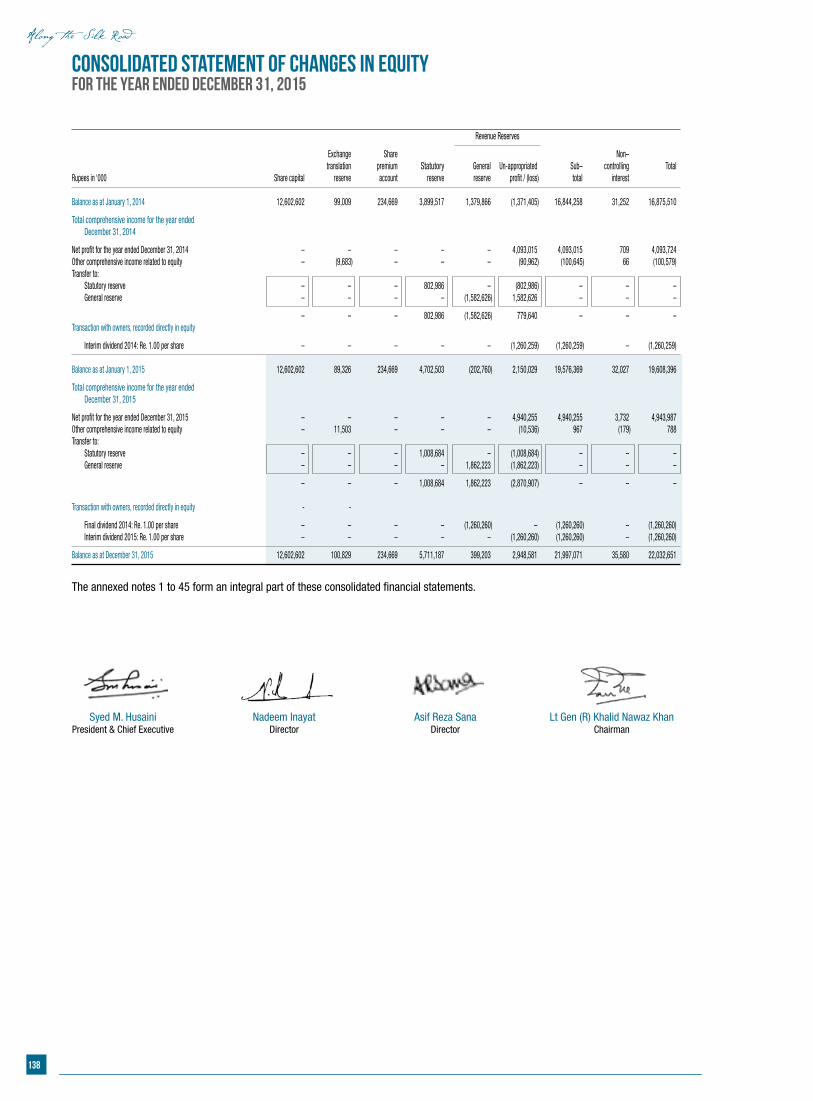
138
Nadeem InayatDirector
Syed M. HusainiPresident & Chief Executive
Asif Reza SanaDirector
Lt Gen (R) Khalid Nawaz KhanChairman
consolidated Statement of Changes in EquityFor the year ended December 31, 2015
Revenue Reserves
Exchange Share Non– translation premium Statutory General Un-appropriated Sub– controlling TotalRupees in ‘000 Share capital reserve account reserve reserve profit / (loss) total interest Balance as at January 1, 2014 12,602,602 99,009 234,669 3,899,517 1,379,866 (1,371,405) 16,844,258 31,252 16,875,510
Total comprehensive income for the year ended December 31, 2014
Net profit for the year ended December 31, 2014 – – – – – 4,093,015 4,093,015 709 4,093,724 Other comprehensive income related to equity – (9,683) – – – (90,962) (100,645) 66 (100,579)Transfer to: Statutory reserve – – – 802,986 – (802,986) – – – General reserve – – – – (1,582,626) 1,582,626 – – –
– – – 802,986 (1,582,626) 779,640 – – – Transaction with owners, recorded directly in equity
Interim dividend 2014: Re. 1.00 per share – – – – – (1,260,259) (1,260,259) – (1,260,259) Balance as at January 1, 2015 12,602,602 89,326 234,669 4,702,503 (202,760) 2,150,029 19,576,369 32,027 19,608,396
Total comprehensive income for the year ended December 31, 2015
Net profit for the year ended December 31, 2015 – – – – – 4,940,255 4,940,255 3,732 4,943,987 Other comprehensive income related to equity – 11,503 – – – (10,536) 967 (179) 788 Transfer to: Statutory reserve – – – 1,008,684 – (1,008,684) – – – General reserve – – – – 1,862,223 (1,862,223) – – –
– – – 1,008,684 1,862,223 (2,870,907) – – – Transaction with owners, recorded directly in equity - -
Final dividend 2014: Re. 1.00 per share – – – – (1,260,260) – (1,260,260) – (1,260,260) Interim dividend 2015: Re. 1.00 per share – – – – – (1,260,260) (1,260,260) – (1,260,260)
Balance as at December 31, 2015 12,602,602 100,829 234,669 5,711,187 399,203 2,948,581 21,997,071 35,580 22,032,651
The annexed notes 1 to 45 form an integral part of these consolidated financial statements.
Syed M. Husaini Qaiser Javed Asif Reza Sana Lt Gen (R) Khalid Nawaz Khan President & Chief Executive Director Director Chairman
139
Annual Report of Askari Bank Limited for 2015
1. STATUS AND NATURE OF BUSINESS
The Group consists of Askari Bank Limited, the holding company, Askari Investment Management Limited, a wholly owned subsidiary company and Askari Securities Limited, a partly owned subsidiary company.
1.1 Askari Bank Limited (the Bank) was incorporated in Pakistan on October 9, 1991 as a Public Limited Company and is listed on the Pakistan Stock Exchange (formerly Karachi, Lahore and Islamabad Stock Exchanges). The registered office of the Bank is situated at AWT Plaza, The Mall, Rawalpindi. The Bank is a scheduled commercial bank and is principally engaged in the business of banking as defined in the Banking Companies Ordinance, 1962. The Fauji Consortium: comprising of Fauji Foundation (FF), Fauji Fertilizer Company Limited (FFCL) and Fauji Fertilizer Bin Qasim Limited (FFBL) collectively owned 71.91 percent shares of the Bank as on December 31, 2015. The ultimate parent of the Bank is Fauji Foundation. The Bank has 424 branches (2014: 321 branches); 423 in Pakistan and Azad Jammu and Kashmir, including 75 (2014: 53) Islamic Banking branches, 32 (2014: 31) sub-branches and a Wholesale Bank Branch in the Kingdom of Bahrain.
Askari Investment Management Limited (AIML) was incorporated in Pakistan on May 30, 2005 as a public limited company. AIML is a Non Banking Finance Company (NBFC), under license by the Securities and Exchange Commission of Pakistan (SECP) to undertake asset management and investment advisory services under the Non-Banking Finance Companies and Notified Entities Regulations, 2007 (NBFC & NE Regulations). The license was obtained on September 21, 2005. AIML is a wholly owned subsidiary of the Bank with its registered office in Karachi. AIML obtained its certificate of commencement of business on September 22, 2005.
Askari Securities Limited (ASL) was incorporated in Pakistan on October 1, 1999 under the Companies Ordinance, 1984 as a public limited company. The Bank holds 74% Ordinary Shares of ASL. The principal activity includes share brokerage, investment advisory and consultancy services. The registered office of ASL is situated in Islamabad.
The financial statements of AIML and ASL have been consolidated based on their audited financial statements for the year ended December 31, 2015.
2. BASIS OF PRESENTATION
2.1 These consolidated financial statements have been presented in accordance with the requirements of format prescribed by the State Bank of Pakistan’s BSD Circular No. 4 dated February 17, 2006.
2.2 In accordance with the directives of the Federal Government regarding shifting of the banking system to Islamic modes, the SBP has issued various circulars from time to time. One permissible form of trade related mode of financing comprises of purchase of goods by the Group from its customers and resale to them at appropriate mark-up in price on a deferred payment basis. The purchases and sales arising under these arrangements are not reflected in these consolidated financial statements as such but are restricted to the amount of facilities actually utilized and the appropriate portion of mark-up thereon.
2.3 The financial results of the Islamic banking branches have been consolidated in these consolidated financial statements for reporting purposes, after eliminating material inter-branch transactions / balances. Key figures of the Islamic banking branches are disclosed in Annexure-2 to unconsolidated financial statements.
2.4 Items included in the consolidated financial statements are measured using the currency of the primary economic environment in which the Group operates. The consolidated financial statements are presented in Pak. Rupee, which is the Group’s functional and presentation currency. Figures have been rounded off to the nearest thousand of rupees unless otherwise stated.
3. STATEMENT OF COMPLIANCE
These consolidated financial statements have been prepared in accordance with the approved accounting standards as applicable in Pakistan, the requirements of the Companies Ordinance, 1984 and the Banking Companies Ordinance, 1962. Approved accounting standards comprise of such International Financial Reporting Standards (IFRS) issued by the International Accounting Standard Board (IASB) and Islamic Financial Accounting Standards (IFAS) issued by the Institute of Chartered Accountants of Pakistan (ICAP) as are notified under the Companies Ordinance, 1984, provisions of and directives issued under the Companies Ordinance, 1984 and the Banking Companies Ordinance, 1962 and directives issued by the SBP. In case requirements differ, the provisions of and directives issued under the Companies Ordinance, 1984 and the Banking Companies Ordinance, 1962 and the directives issued by the SBP shall prevail.
International Accounting Standard 39, “Financial Instruments: Recognition and Measurement”, International Accounting Standard 40, “Investment Property” and International Financial Reporting Standard 7,”Financial Instruments: Disclosure” are not applicable to banking companies in Pakistan. Accordingly, the requirements of these Standards have not been considered in the preparation of these consolidated financial statements. Accordingly, investments have been classified and valued in accordance with the requirements prescribed by the SBP through various circulars.
The Securities and Exchange Commission of Pakistan vide SRO 56(1)/2016 dated January 28, 2016 has relaxed the requirement of consolidation under IFRS 10, “Consolidated Financial Statements” for companies having investment in mutual funds established under trust structure.
Notes to the consolidated Financial StatementsFor the year ended December 31, 2015
140
Notes to the consolidated Financial StatementsFor the year ended December 31, 2015
3.1 Standards, interpretations and amendments to approved accounting standards that are not yet effective
a) The following amendments and interpretations to published accounting standards were effective during the year and have been adopted by the Group:
Effective date (annual periods beginning on or after)
IFRS 3 Business Combinations (Amendments) July 1, 2014 IFRS 8 Operating Segments (Amendments) July 1, 2014 IAS 1 Presentation of Financial Statements (Amendments) July 1, 2014 IAS 16 Property, Plant and Equipment (Amendments) July 1, 2014 IAS 19 Employee Benefits (Amendments) July 1, 2014 IAS 24 Related Party Disclosures (Amendments) July 1, 2014 IAS 38 Intangible Assets (Amendments) July 1, 2014
b) Following standard has been issued by the International Accounting Standards Board (IASB), which is yet to be notified by
the Securities and Exchange Commission of Pakistan (SECP) for the purpose of its applicability in Pakistan:
Effective date (annual periods beginning on or after)
IFRS 1 First-Time Adoption of International Financial Reporting Standards July 1, 2009
c) Following standards and amendments were notified by SECP for the purpose of their applicability in Pakistan from annual periods beginning on or after January 1, 2015:
IFRS 10 Consolidated Financial Statements IFRS 11 Joint Arrangements IFRS 12 Disclosure of Interests in Other Entities IFRS 13 Fair Value Measurement IAS 27 Separate Financial Statements IAS 28 Investments in Associates and Joint Ventures IFRS 10 Consolidated Financial Statements (Amendments) IFRS 12 Disclosure of Interests in Other Entities (Amendments) IFRS 13 Fair Value Measurement (Amendments) IAS 27 Separate Financial Statements (Amendments)
d) Following standards and amendments to published accounting standards will be effective in future periods and have not
been early adopted by the Group. Effective date (annual periods beginning on or after)
IFRS 5 Non-current Assets Held for Sale and Discontinued January 1, 2016 Operations (Amendments) IFRS 7 Financial Instruments: Disclosures (Amendments) January 1, 2016 IFRS 9 Financial Instruments January 1, 2018 IFRS 10 Consolidated Financial Statements (Amendments) January 1, 2016 IFRS 11 Joint Arrangements (Amendments) January 1, 2016 IFRS 12 Disclosure of interests in Other Entities ( Amendments) January 1, 2016 IFRS 14 Regulatory Deferral Accounts January 1, 2016 IFRS 15 Revenue from Contracts with Customers January 1, 2017
141
Annual Report of Askari Bank Limited for 2015
Effective date (annual periods beginning on or after)
IAS 1 Presentation of Financial Statements (Amendments) January 1, 2016 IAS 16 Property, Plant and Equipment (Amendments) January 1, 2016 IAS 19 Employee Benefits (Amendments) January 1, 2016 IAS 27 Separate Financial Statements (Amendments) January 1, 2016 IAS 28 Investments in Associates and Joint Ventures (Amendments) January 1, 2016 IAS 34 Interim Financial Reporting (Amendments) January 1, 2016 IAS 38 Intangible Assets (Amendments) January 1, 2016 The management anticipates that adoption of above standards and amendments in future periods will have no material
impact on the Group’s financial statements other than in presentation/disclosure. 4. BASIS OF MEASUREMENT
These consolidated financial statements have been prepared under the historical cost convention as modified for certain investments which are carried at fair value, freehold and leasehold land which are shown at revalued amounts and staff retirement gratuity and compensated absences which are carried at present value of defined benefit obligations net of fair value of plan assets.
Use of critical accounting estimates and judgments
The preparation of consolidated financial statements in conformity with approved accounting standards as applicable in Pakistan requires the use of certain accounting estimates. It also requires management to exercise its judgment in the process of applying the Group’s accounting policies. The Group uses estimates and assumptions concerning the future. The resulting accounting estimate will, by definition, seldom equal the related actual results. Estimates and judgments are continually evaluated and are based on historical experience and other factors, including expectations of future events that are believed to be reasonable under the circumstances. The areas involving a higher degree of judgment or complexity, or areas where assumptions and estimates are significant to the financial statements are as follows:
i) classification of investments (note 5.5) ii) provision against investments (note 5.5), advances (note 5.6), operating fixed assets (note 5.7) and other assets (note 5.8) iii) valuation and impairment of available for sale securities (note 5.5) iv) useful life of property and equipment, intangible assets and revaluation of land (note 5.7) v) taxation (note 5.10) vi) staff retirement benefits (note 5.11)
5. SUMMARY OF SIGNIFICANT ACCOUNTING POLICIES
The accounting policies set out below have been applied consistently to all periods presented in these financial statements.
5.1 Assets held for sale
Non-current assets and associated liabilities are classified as held for sale when their carrying amount will be recovered principally through a sale transaction rather than continuing use and a sale is highly probable. Assets designated as held for sale are held at the lower of carrying amount at designation and fair value less costs to sell.
5.2 Basis of consolidation
Subsidiaries
The consolidated financial statements include the financial statements of the Bank and its subsidiary companies, AIML with 100% holding (2014: 100%) and ASL with 74% holding (2014: 74%) collectively referred to as “the Group”.
Subsidiaries are those enterprises in which the holding company directly or indirectly controls, beneficially owns or holds more than 50% of the voting securities or otherwise has the power to elect and appoint more than 50% of its directors. The financial statements of the subsidiaries are included in the consolidated financial statements from the date control commences until the date that control ceases.
The assets and liabilities of subsidiary companies have been consolidated on a line by line basis and the carrying value of investment held by the holding company is eliminated against holding company’s share in paid up capital of the subsidiaries.
142
Notes to the consolidated Financial StatementsFor the year ended December 31, 2015
Material intra-group balances and transactions have been eliminated.
Non-controlling interests are that part of net results of the operations and of net assets of the subsidiary attributable to interests which are not owned by the Bank. Non-controlling interests are presented as separate item in the consolidated financial statements.
Associate
Associate is the entity in which the Group has significant influence, but not control over the financial and operating policies. Significant influence exists when the Group holds between 20 to 50 percent of the voting power of another entity. The consolidated financial statements include the Group’s share of the results of the associate. Investment in associate is accounted for using equity method of accounting and was initially recognized at cost.
5.3 Cash and cash equivalents
Cash and cash equivalents comprise of cash and balances with treasury banks, balances with other banks and call money lendings.
5.4 Sale and repurchase agreements
Securities sold under repurchase agreement (repo) are retained in the consolidated financial statements as investments and a liability for consideration received is included in borrowings. Conversely, consideration for securities purchased under resale agreement (reverse repo) are included in lendings to financial institutions. The difference between sale and repurchase / purchase and resale price is recognised as mark-up / return expensed and earned on a time proportion basis as the case may be. Repo and reverse repo balances are reflected under borrowings from and lendings to financial institutions respectively.
5.5 Investments
Investments are classified as follows:
Held for trading
These represent securities acquired with the intention to trade by taking advantage of short-term market / interest rate movements. These are marked to market and surplus / deficit arising on revaluation of ‘held for trading’ investments is taken to profit and loss account in accordance with the requirements prescribed by the SBP through various circulars.
Available for sale
These represent securities which do not fall under ‘held for trading’ or ‘held to maturity’ categories. In accordance with the requirements of the SBP’s BSD Circular No. 20 dated August 04, 2000 and BPRD circular 06 dated June 26, 2014, available for sale securities for which ready quotations are available on Reuters Page (PKRV) or Stock Exchanges are valued at market value and the resulting surplus / deficit is taken through “Statement of Comprehensive Income” and is shown below the shareholders’ equity in the consolidated statement of financial position. Where the decline in prices of available for sale equity securities is significant and prolonged, it is considered impaired and included in profit and loss account. Impairment loss on available for sale debt securities is determined in accordance with the requirements of Prudential Regulations issued by the SBP.
Unquoted equity securities are valued at the lower of cost and break-up value. Break-up value of equity securities is calculated with reference to the net assets of the investee as per the latest audited financial statements. If the break-up value is less than cost the difference is included in profit and loss account. Unquoted debt securities are valued using the market value of secondary market where available.
Investments in other unquoted securities are valued at cost less impairment losses, determined in accordance with the requirements of Prudential Regulations issued by the SBP.
Held to maturity
These represent securities acquired with the intention and ability to hold them upto maturity. These are carried at amortized cost less impairment, determined in accordance with the requirements of Prudential Regulations issued by the SBP.
All purchases and sale of investment that require delivery within the time frame established by regulations or market convention are recognized at the trade date, which is the date the Group commits to purchase or sell the investments.
5.6 Advances
Advances are stated net of provisions for non-performing advances. Provision for advances is determined in accordance with the requirements of the Prudential Regulations issued by the SBP from time to time. In addition, a general provision is maintained for advances other than consumer and small entities advances as per details given in note 10.6.3.
The provisions against non-performing advances are charged to the consolidated profit and loss account. Advances are written off when there is no realistic prospect of recovery.
Consequent to the adoption of IFAS - 2, ijarahs booked under IFAS - 2 are stated at cost less accumulated depreciation and impairment if any, and are shown under advances.

143
Annual Report of Askari Bank Limited for 2015
The SBP has notified for adoption of Ijarahs under (IFAS-2 “Islamic Financial Accounting Standard 2 Ijarah” which is applicable. Consequent to the adoption of IFAS-2, such ijarahs booked on or after January 1, 2009 are stated at cost less accumulated depreciation and impairment if any, and are shown under advances.
Depreciation on Ijarah assets is charged to the consolidated profit and loss account by applying the straight line method whereby the depreciable value of Ijarah assets is written off over the Ijarah period. The Group charges depreciation from the date of delivery of respective assets to Mustajir upto the date of maturity / termination of Ijarah agreement.
Leases where the Group transfers substantially all the risks and rewards incidental to ownership of an asset to the lessee are classified as finance leases. A receivable is recognised at an amount equal to the present value of the lease payments including any guaranteed residual value. Finance lease receivables are included in advances to the customers.
Murabaha transactions are reflected as receivable at the invoiced amount. Actual sale and purchase are not reflected as the goods are purchased by the customer as agent of the Group and all documents relating to purchase are in customers’ name.
In Salam, the seller undertakes to supply specific goods to the Group at a future date in consideration of a price fully paid in advance at the time the contract of sale is made.
In Musharaka a relationship is established under a contract by the mutual consent of the Group and the cutomer for sharing of profits and losses arising from a joint enterprise or venture.
Diminishing Musharaka (DM) is a form of co-ownership in which Group and the customer share the ownership of a tangible asset in an agreed proportion and customer undertakes to buy in periodic installments the proportionate share of the Group until the title to such tangible asset is completely transferred to the customer.
In Istisna, a contract of sale is made whereby the Group places an order, to manufacture, assemble or construct, specific commodity to be delivered at a future date.
5.7 Capital work-in-progress, operating fixed assets and depreciation
Capital work-in-progress
Capital work-in-progress is stated at cost less impairment losses, if any.
Tangible assets
Fixed assets are stated at cost less impairment losses and accumulated depreciation except for freehold / leasehold land. Land is carried at revalued amounts which is not depreciated.
Land is revalued by professionally qualified valuers with sufficient regularity to ensure that the net carrying amount does not differ materially from their fair value. Surplus / (deficit) arising on revaluation of fixed assets is credited / (debited) to the surplus on revaluation of assets account and is shown below the shareholders’ equity in the consolidated statement of financial position. Except to the extent actually realised on disposal of land which are revalued, the surplus on revaluation of land shall not be applied to set-off or reduce any deficit or loss, whether past, current or future, or in any manner applied, adjusted or treated so as to add to the income, profit or surplus of the Group or utilized directly or indirectly by way of dividend or bonus.
Intangible assets
Intangible assets are carried at cost less accumulated amortization and impairment losses, if any.
Trading Right Entitlement Certificates (TREC) has indefinite useful life and accordingly is not amortized however tested for impairment only. Impairment loss is recognized in profit and loss account.
Depreciation / amortization
Depreciation / amortization is computed over the estimated useful lives of the related assets at the rates set out in note 11.2 and 11.3 respectively on monthly basis. The cost of assets is depreciated / amortized on the diminishing balance method, except for vehicles, carpets, renovations, other assets and intangibles which are depreciated / amortized on a straight line basis. Depreciation / amortization is charged for the full month of purchase / acquisition / availability for use of an asset while no depreciation / amortization is charged in the month of disposal of an asset. Maintenance and normal repairs are charged to the consolidated profit and loss account as and when incurred. Major renewals and improvements are capitalized. Gains and losses on disposal of operating fixed assets are taken to the consolidated profit and loss account.
In making estimates of the depreciation / amortization, the management uses useful life and residual value which reflects the pattern in which economic benefits are expected to be consumed by the Group. The useful life and the residual value are reviewed at each financial year end and any change in these estimates in future years might effect the carrying amounts of the respective item of operating fixed assets with the corresponding effect on depreciation / amortization charge.
144
Notes to the consolidated Financial StatementsFor the year ended December 31, 2015
Assets subject to finance lease
Assets held under finance lease are accounted for by recording the assets and related liabilities at the amounts determined on the basis of lower of fair value of the assets and the present value of minimum lease payments. Finance charge is allocated to the accounting periods in a manner so as to provide a constant periodic rate of charge on the outstanding liability. Depreciation is charged on leased assets on the basis similar to that of the owned assets.
5.8 Impairment
The carrying amount of the Group’s assets are reviewed at the reporting date to determine whether there is any indication of impairment. If such indications exist, the asset’s recoverable amount is estimated in order to determine the extent of the impairment loss, if any. Impairment loss is recognised as expense in the consolidated profit and loss account. An impairment loss is reversed only to the extent that the asset’s carrying amount does not exceed the carrying amount that would have been determined, net of depreciation or amortization, if no impairment loss had been recognised.
5.9 Deposits
Deposits are recorded at the fair value of proceeds received. Markup accrued on deposits is recognised separetey as part of other liabilities and is charged to profit and loss account on a time proportion basis.
The Group generates deposits in two modes i.e. “Qard” and “Modaraba” under Islamic Banking Operations. Deposits taken on Qard basis are classified as ‘Current Accounts’ and deposits generated on Modaraba basis are classified as ‘Saving Accounts’ and ‘Fixed Deposit Accounts’.
5.10 Taxation
Income tax on the cosolidated profit or loss for the year comprises current and deferred tax. Income tax is recognised in the consolidated profit and loss account, except to the extent that it relates to items recognised directly in other comprehensive income or below equity, in which case it is recognised in other comprehensive income or below equity.
Current
Provision for current tax is the expected tax payable on the taxable profit for the year using tax rates applicable at the date of consolidated statement of financial position and any adjustment to tax payable for previous years.
Deferred
Deferred tax is provided for by using the balance sheet liability method, providing for temporary differences between the carrying amounts of assets and liabilities for financial reporting purposes and the amount used for taxation purposes. The amount of deferred tax provided is based on the expected manner of realization or settlement of the carrying amount of assets and liabilities using tax rates enacted or substantively enacted at the date of consolidated statement of financial position. A deferred tax asset is recognised only to the extent that it is probable that the future taxable profit will be available and credits can be utilized. Deferred tax assets are reduced to the extent it is no longer probable that the related tax benefit will be realised.
Deferred tax, on revaluation of investments, if any, is recognised as an adjustment to surplus / (deficit) arising on such revaluation.
5.11 Staff retirement benefits
Defined benefit plan
The Bank and ASL operate an approved funded gratuity scheme for all its regular employees. Contributions are made in accordance with the actuarial recommendation. The actuarial valuation is carried out periodically using “Projected Unit Credit Method”.
Defined contribution plan
The Bank operates a recognised provident fund scheme for all its regular employees for which equal monthly contributions are made both by the Bank and by the employees at the rate of 8.33% of the basic salary of the employee.
AIML operates a funded staff provident fund scheme as a defined contribution plan for all eligible employees. Equal monthly contributions are made by AIML and the staff at the rate of 6% of the salary.
ASL operates funded provident fund scheme for all its regular employees for which equal monthly contributions are made by ASL and the employees at the rate of 10% of basic salary of the employee.
Compensated absences
The Bank and ASL provide compensated absences to all its regular employees. Liability for unfunded scheme is recognized on the basis of actuarial valuation using the “Projected Unit Credit Method”. Provision for the year is charged to the consolidated profit and loss account. The amount recognised in the consolidated statement of financial position represents the present value of defined benefit obligations.
145
Annual Report of Askari Bank Limited for 2015
AIML was providing compensated absences to all its regular employees. As per the Board resolution dated 26 November 2012, the compensated absences will not be encashable after 31 December 2012. All employees will have to avail leaves within a period of two years from the date of entitlement of leaves.
5.12 Revenue recognition
Mark-up / interest on advances and return on investments is recognised on accrual basis except on classified advances and investments which is recognized on receipt basis. Mark-up / interest on rescheduled / restructured advances and investments is recognised as permitted by the regulations of the SBP or overseas regulatory authority of the country where branch operates, except where in the opinion of the management it would not be prudent to do so.
Fees, commission and brokerage income is recognized at the time of performance of service.
Dividend income is recognized when Group’s right to receive the income is established.
Gains and losses on sale of investments are included in income currently.
Financing method is used in accounting for income from lease financing. Under this method, the unearned lease income (excess of the sum of the total lease rentals and estimated residual value over the cost of leased assets) is deferred and taken to income over the term of the lease period so as to produce a constant periodic rate of return on the outstanding net investment in lease. Repossessed vehicles on account of loan default are recorded in memorandum account.
Unrealised lease income is suspended on classified leases, in accordance with the requirements of the Prudential Regulations issued by the SBP. Gains / losses on termination of lease contracts, documentation charges, front-end fees and other lease income are recognised as income on receipt basis.
Profit on Murabaha sale transaction not due for the payment is deferred by recording a credit to the “Deferred Murabaha Income” account.
Profits on Musharaka and Diminishing Musharaka financings are recognized on accrual basis. Profit required to be suspended in compliance with the Prudential Regulations issued by SBP is recorded on receipt basis.
Revenue on Salam finance is recognized at the time of sale of al-muslam fihi (salam goods).
The rentals received / receivable on Ijarahs under IFAS-2 are recorded as income / revenue.
The Group recognizes revenue on Istisna finance at the time of sale of Al-Masnoo (Istisna Goods).
5.13 Foreign currencies
Foreign currency transactions
Foreign currency transactions are translated into Pak. Rupee at the exchange rates prevailing on the date of transaction. Monetary assets and liabilities in foreign currencies are translated to Pak. Rupee at the exchange rates prevailing at the reporting date. Outstanding foreign bills purchased are valued at the rates applicable to the remaining maturities. Exchange gains and losses are included in consolidated profit and loss account currently.
Foreign operation
The assets and liabilities of Wholesale Bank Branch are translated to Pak. Rupee at exchange rates prevailing at the date of consolidated statement of financial position. The results of foreign operations are translated at the average rate of exchange for the year.
Translation gains and losses
Translation gains and losses arising on revaluation of net investment in foreign operations are taken to equity under “Exchange Translation Reserve” through other comprehensive income and on disposal are recognised in consolidated profit and loss account.
Commitments
Commitments for outstanding forward foreign exchange contracts are valued at the rates applicable to the remaining maturities.
5.14 Provisions
Provisions are recognised when there are present, legal or constructive obligations as a result of past events, it is probable that an out flow of resources embodying economic benefits will be required to settle the obligation and a reliable estimate of the amounts can be made. Provision for guarantee claims and other off balance sheet obligations is recognized when intimated and reasonable certainty exists to settle the obligations. Expected recoveries are recognized by debiting customer accounts. Charge to consolidated profit and loss account is stated net off expected recoveries.
146
5.15 Off-setting
Financial assets and financial liabilities are only set-off and the net amount is reported in the consolidated financial statements when there is a legally enforceable right to set-off the recognised amount and the Group intends either to settle on a net basis, or to realise the assets and to settle the liabilities simultaneously.
5.16 Financial assets and liabilities
Financial assets and financial liabilities are recognised at the time when the Group becomes a party to the contractual provision of the instrument. Financial assets are de-recognised when the contractual right to future cash flows from the asset expires or is transferred along with the risk and reward of the asset. Financial liabilities are de-recognised when obligation specific in the contract is discharged, cancelled or expired. Any gain or loss on de-recognition of the financial asset and liability is recognised in the profit and loss account of the current period. The particular recognition and subsequent measurement methods adopted for significant financial assets and financial liabilities are disclosed in the individual policy statements associated with them.
5.17 Derivative financial instruments
Derivative financial instruments are initially recognized at fair value on the date on which the derivative contract is entered into and are subsequently re–measured at fair value using appropriate valuation techniques. All derivative financial instruments are carried as assets when fair value is positive and liabilities when fair value is negative. Any change in the fair value of derivative financial instruments is taken to the profit and loss account.
5.18 Appropriations subsequent to date of consolidated statement of financial position
Appropriations subsequent to year end are recognized during the year in which those appropriations are made.
5.19 Segment reporting
A segment is a distinguishable component of the Group that is engaged in providing products or services (business segment) or in providing product or services within a particular economic environment (geographical segment), which is subject to risks and rewards that are different from those of other segments. The Group’s primary format of reporting is based on business segments.
5.19.1 Business segment
Corporate finance
Corporate financing includes corporate and investment banking activities such as mergers and acquisition, underwriting, privatization, securitisation, IPO’s related activities and secondary private placements.
Trading and Sales
Trading and sales includes the Group’s treasury and money market activities.
Retail Banking
Retail banking segment provides services to small borrowers and include loans, deposits and other transactions with retail customers and credit card business.
Commercial Banking
Commercial banking segment provides services related to project finance, export finance, trade finance, leasing, lending, guarantees, bills of exchange and deposits from corporate customers.
Payment and settlement
Payment and settlement includes income from payments and collections, funds transfer, clearing and settlement.
Agency services
Agency services include income from rent of lockers provided to customers.
Retails brokerage
Retail brokerage provides share brokerage, share trading and corporate advisory services.
Asset management
Asset management segment represents wealth management, cash management and fund management services.
5.19.2 Geographical segments
The Group operates in two geographic regions; Pakistan and the Middle East.
Notes to the consolidated Financial StatementsFor the year ended December 31, 2015
147
Annual Report of Askari Bank Limited for 2015
Rupees in ‘000 Note 2015 2014
6. CASH AND BALANCES WITH TREASURY BANKS
In Hand:
Local currency 6,336,493 4,967,914 Foreign currencies 1,423,204 1,276,862
7,759,697 6,244,776 National Prize Bonds 4,344 11,498
With the State Bank of Pakistan in:
Local currency current accounts 6.1 12,622,867 4,509,714 Foreign currency current account 6.1 2,271,811 2,024,792 Foreign currency deposit account 6.2 5,660,221 5,264,327
20,554,899 11,798,833 With National Bank of Pakistan in:
Local currency current accounts 1,366,288 1,075,006
29,685,228 19,130,113 6.1 These represent current accounts maintained with the SBP to comply with the statutory cash reserve requirements. 6.2 This represents special cash reserve maintained with the SBP and carries mark-up at the rate of 0.00% (2014: 0.00%) per annum.
Rupees in ‘000 Note 2015 2014
7. BALANCES WITH OTHER BANKS
In Pakistan
On current accounts 193,887 189,385 On deposit accounts 7.1 2,235,530 5,117,061
2,429,417 5,306,446 Outside Pakistan
On current accounts 1,277,860 708,874 On deposit accounts 7.2 4,651,653 1,105,808
5,929,513 1,814,682
8,358,930 7,121,128 7.1 These represent placements with local banks, carrying interest rates ranging from 0.25% to 6.15% (2014: 0.05% to 9.25% ) per
annum. 7.2 These represent placements with international correspondent banks, carrying interest rates upto 0.36% (2014: upto 0.16%) per
annum.
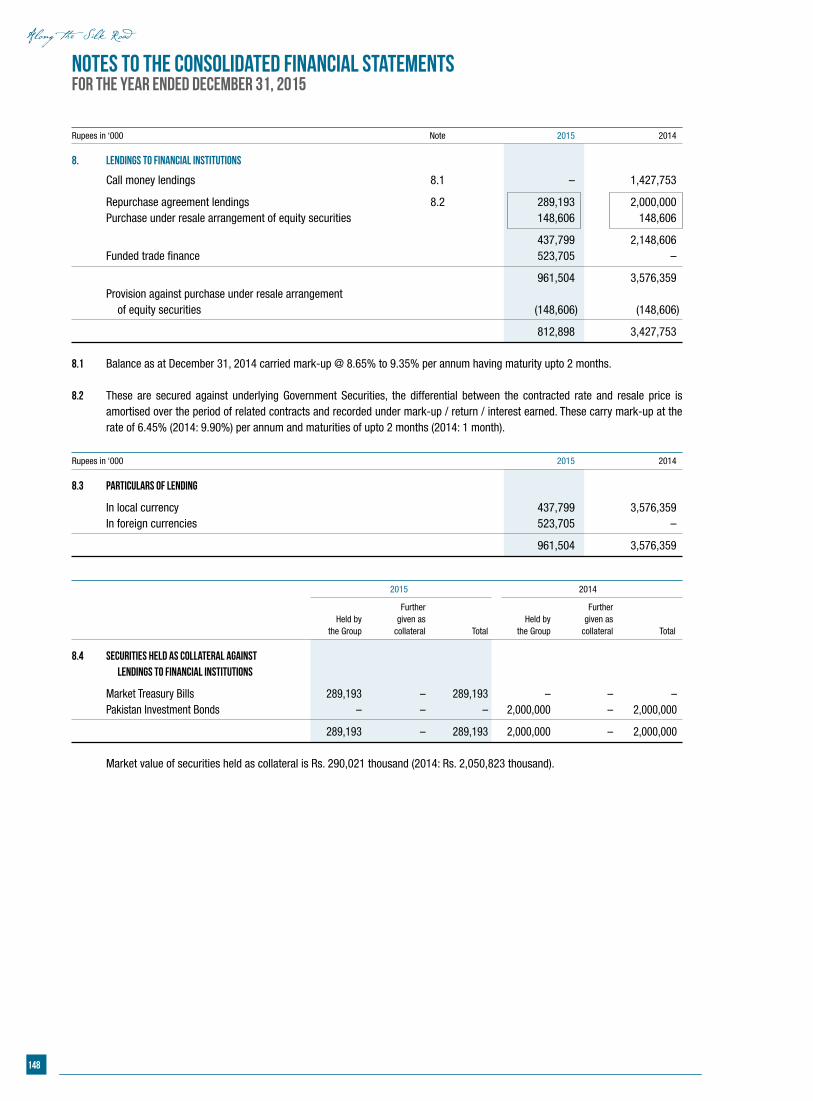
148
Notes to the consolidated Financial StatementsFor the year ended December 31, 2015
Rupees in ‘000 Note 2015 2014
8. LENDINGS TO FINANCIAL INSTITUTIONS
Call money lendings 8.1 – 1,427,753
Repurchase agreement lendings 8.2 289,193 2,000,000 Purchase under resale arrangement of equity securities 148,606 148,606
437,799 2,148,606 Funded trade finance 523,705 –
961,504 3,576,359 Provision against purchase under resale arrangement of equity securities (148,606) (148,606)
812,898 3,427,753
8.1 Balance as at December 31, 2014 carried mark-up @ 8.65% to 9.35% per annum having maturity upto 2 months. 8.2 These are secured against underlying Government Securities, the differential between the contracted rate and resale price is
amortised over the period of related contracts and recorded under mark-up / return / interest earned. These carry mark-up at the rate of 6.45% (2014: 9.90%) per annum and maturities of upto 2 months (2014: 1 month).
Rupees in ‘000 2015 2014
8.3 Particulars of lending
In local currency 437,799 3,576,359 In foreign currencies 523,705 –
961,504 3,576,359 2015 2014
Further Further Held by given as Held by given as the Group collateral Total the Group collateral Total
8.4 Securities held as collateral against lendings to financial institutions
Market Treasury Bills 289,193 – 289,193 – – – Pakistan Investment Bonds – – – 2,000,000 – 2,000,000
289,193 – 289,193 2,000,000 – 2,000,000 Market value of securities held as collateral is Rs. 290,021 thousand (2014: Rs. 2,050,823 thousand).
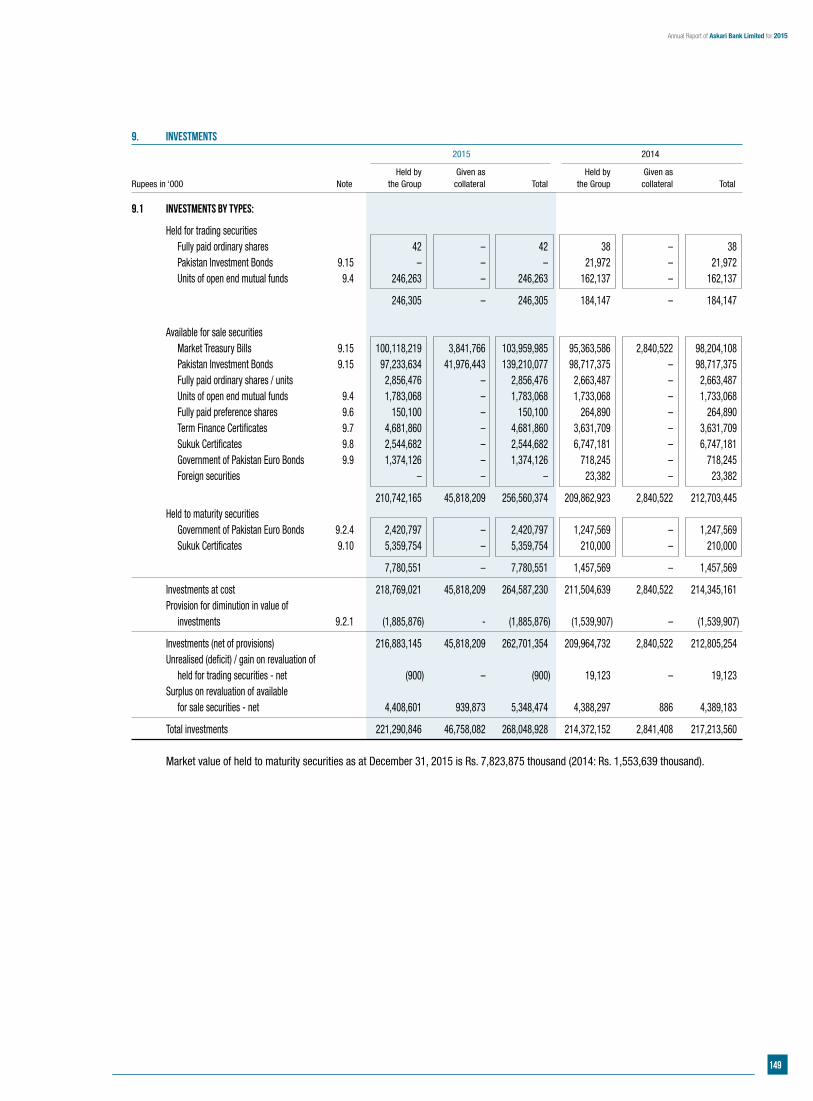
149
Annual Report of Askari Bank Limited for 2015
9. INVESTMENTS
2015 2014
Held by Given as Held by Given asRupees in ‘000 Note the Group collateral Total the Group collateral Total
9.1 Investments by types:
Held for trading securities Fully paid ordinary shares 42 – 42 38 – 38 Pakistan Investment Bonds 9.15 – – – 21,972 – 21,972 Units of open end mutual funds 9.4 246,263 – 246,263 162,137 – 162,137
246,305 – 246,305 184,147 – 184,147 Available for sale securities Market Treasury Bills 9.15 100,118,219 3,841,766 103,959,985 95,363,586 2,840,522 98,204,108 Pakistan Investment Bonds 9.15 97,233,634 41,976,443 139,210,077 98,717,375 – 98,717,375 Fully paid ordinary shares / units 2,856,476 – 2,856,476 2,663,487 – 2,663,487 Units of open end mutual funds 9.4 1,783,068 – 1,783,068 1,733,068 – 1,733,068 Fully paid preference shares 9.6 150,100 – 150,100 264,890 – 264,890 Term Finance Certificates 9.7 4,681,860 – 4,681,860 3,631,709 – 3,631,709 Sukuk Certificates 9.8 2,544,682 – 2,544,682 6,747,181 – 6,747,181 Government of Pakistan Euro Bonds 9.9 1,374,126 – 1,374,126 718,245 – 718,245 Foreign securities – – – 23,382 – 23,382
210,742,165 45,818,209 256,560,374 209,862,923 2,840,522 212,703,445 Held to maturity securities Government of Pakistan Euro Bonds 9.2.4 2,420,797 – 2,420,797 1,247,569 – 1,247,569 Sukuk Certificates 9.10 5,359,754 – 5,359,754 210,000 – 210,000
7,780,551 – 7,780,551 1,457,569 – 1,457,569
Investments at cost 218,769,021 45,818,209 264,587,230 211,504,639 2,840,522 214,345,161 Provision for diminution in value of investments 9.2.1 (1,885,876) - (1,885,876) (1,539,907) – (1,539,907)
Investments (net of provisions) 216,883,145 45,818,209 262,701,354 209,964,732 2,840,522 212,805,254 Unrealised (deficit) / gain on revaluation of held for trading securities - net (900) – (900) 19,123 – 19,123 Surplus on revaluation of available for sale securities - net 4,408,601 939,873 5,348,474 4,388,297 886 4,389,183
Total investments 221,290,846 46,758,082 268,048,928 214,372,152 2,841,408 217,213,560 Market value of held to maturity securities as at December 31, 2015 is Rs. 7,823,875 thousand (2014: Rs. 1,553,639 thousand).
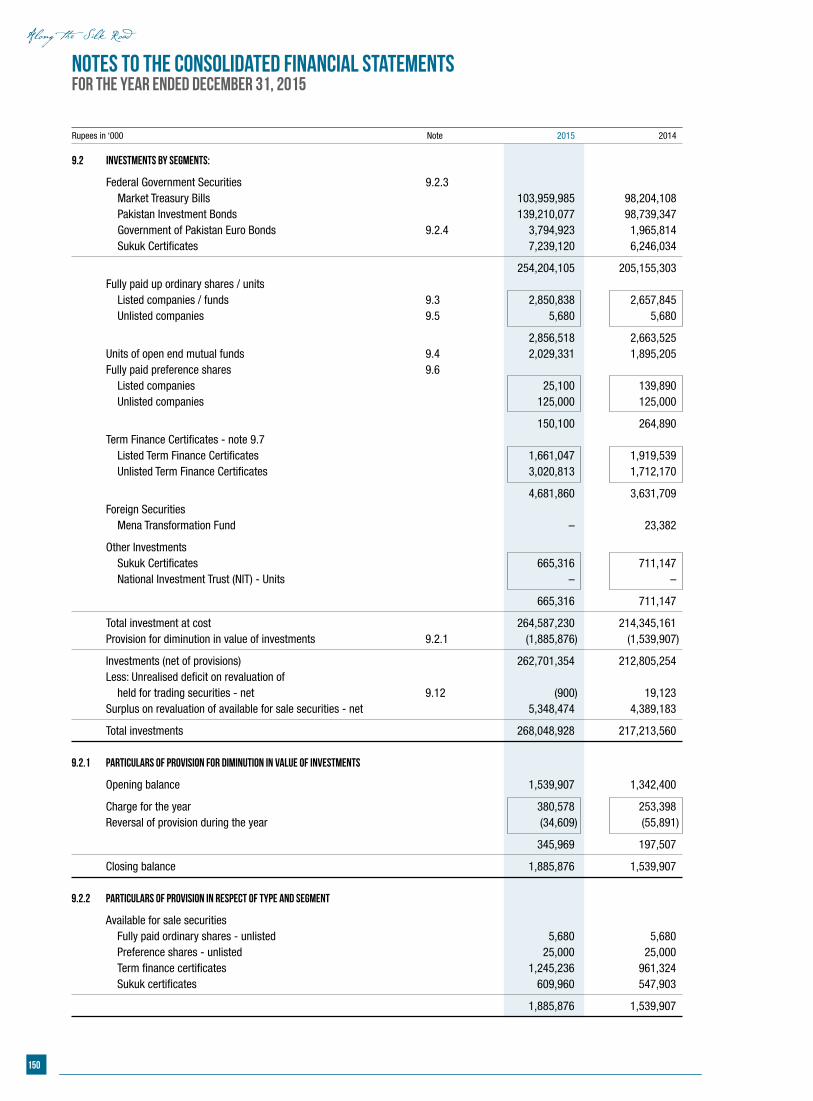
150
Notes to the consolidated Financial StatementsFor the year ended December 31, 2015
Rupees in ‘000 Note 2015 2014
9.2 Investments by segments:
Federal Government Securities 9.2.3 Market Treasury Bills 103,959,985 98,204,108 Pakistan Investment Bonds 139,210,077 98,739,347 Government of Pakistan Euro Bonds 9.2.4 3,794,923 1,965,814 Sukuk Certificates 7,239,120 6,246,034
254,204,105 205,155,303 Fully paid up ordinary shares / units Listed companies / funds 9.3 2,850,838 2,657,845 Unlisted companies 9.5 5,680 5,680
2,856,518 2,663,525 Units of open end mutual funds 9.4 2,029,331 1,895,205 Fully paid preference shares 9.6 Listed companies 25,100 139,890 Unlisted companies 125,000 125,000
150,100 264,890 Term Finance Certificates - note 9.7 Listed Term Finance Certificates 1,661,047 1,919,539 Unlisted Term Finance Certificates 3,020,813 1,712,170
4,681,860 3,631,709 Foreign Securities Mena Transformation Fund – 23,382
Other Investments Sukuk Certificates 665,316 711,147 National Investment Trust (NIT) - Units – –
665,316 711,147
Total investment at cost 264,587,230 214,345,161 Provision for diminution in value of investments 9.2.1 (1,885,876) (1,539,907)
Investments (net of provisions) 262,701,354 212,805,254 Less: Unrealised deficit on revaluation of held for trading securities - net 9.12 (900) 19,123 Surplus on revaluation of available for sale securities - net 5,348,474 4,389,183
Total investments 268,048,928 217,213,560 9.2.1 Particulars of provision for diminution in value of investments
Opening balance 1,539,907 1,342,400
Charge for the year 380,578 253,398 Reversal of provision during the year (34,609) (55,891)
345,969 197,507
Closing balance 1,885,876 1,539,907 9.2.2 Particulars of provision in respect of type and segment
Available for sale securities Fully paid ordinary shares - unlisted 5,680 5,680 Preference shares - unlisted 25,000 25,000 Term finance certificates 1,245,236 961,324 Sukuk certificates 609,960 547,903
1,885,876 1,539,907
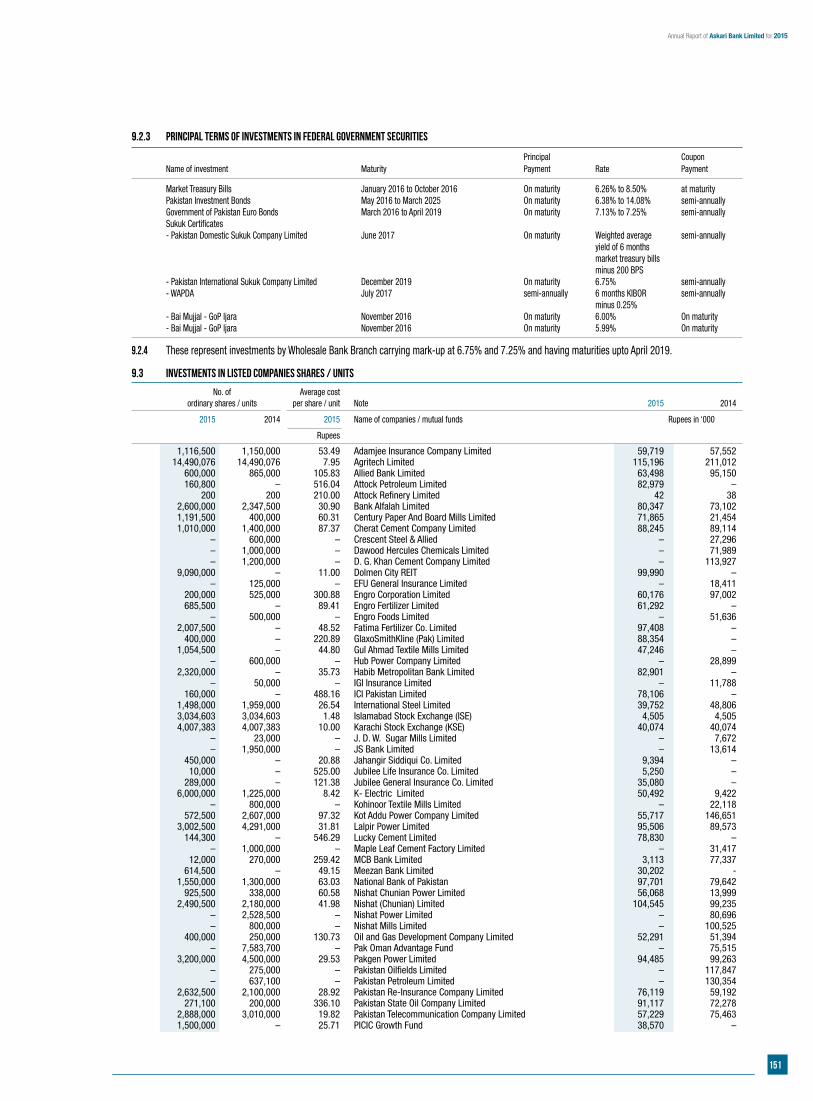
151
Annual Report of Askari Bank Limited for 2015
9.2.3 Principal terms of investments in Federal Government Securities
Principal Coupon Name of investment Maturity Payment Rate Payment
Market Treasury Bills January 2016 to October 2016 On maturity 6.26% to 8.50% at maturity Pakistan Investment Bonds May 2016 to March 2025 On maturity 6.38% to 14.08% semi-annually Government of Pakistan Euro Bonds March 2016 to April 2019 On maturity 7.13% to 7.25% semi-annually Sukuk Certificates - Pakistan Domestic Sukuk Company Limited June 2017 On maturity Weighted average semi-annually yield of 6 months market treasury bills minus 200 BPS - Pakistan International Sukuk Company Limited December 2019 On maturity 6.75% semi-annually - WAPDA July 2017 semi-annually 6 months KIBOR semi-annually minus 0.25% - Bai Mujjal - GoP Ijara November 2016 On maturity 6.00% On maturity - Bai Mujjal - GoP Ijara November 2016 On maturity 5.99% On maturity 9.2.4 These represent investments by Wholesale Bank Branch carrying mark-up at 6.75% and 7.25% and having maturities upto April 2019.
9.3 Investments in listed companies shares / units
No. of Average cost ordinary shares / units per share / unit Note 2015 2014
2015 2014 2015 Name of companies / mutual funds Rupees in ‘000
Rupees
1,116,500 1,150,000 53.49 Adamjee Insurance Company Limited 59,719 57,552 14,490,076 14,490,076 7.95 Agritech Limited 115,196 211,012 600,000 865,000 105.83 Allied Bank Limited 63,498 95,150 160,800 – 516.04 Attock Petroleum Limited 82,979 – 200 200 210.00 Attock Refinery Limited 42 38 2,600,000 2,347,500 30.90 Bank Alfalah Limited 80,347 73,102 1,191,500 400,000 60.31 Century Paper And Board Mills Limited 71,865 21,454 1,010,000 1,400,000 87.37 Cherat Cement Company Limited 88,245 89,114 – 600,000 – Crescent Steel & Allied – 27,296 – 1,000,000 – Dawood Hercules Chemicals Limited – 71,989 – 1,200,000 – D. G. Khan Cement Company Limited – 113,927 9,090,000 – 11.00 Dolmen City REIT 99,990 – – 125,000 – EFU General Insurance Limited – 18,411 200,000 525,000 300.88 Engro Corporation Limited 60,176 97,002 685,500 – 89.41 Engro Fertilizer Limited 61,292 – – 500,000 – Engro Foods Limited – 51,636 2,007,500 – 48.52 Fatima Fertilizer Co. Limited 97,408 – 400,000 – 220.89 GlaxoSmithKline (Pak) Limited 88,354 – 1,054,500 – 44.80 Gul Ahmad Textile Mills Limited 47,246 – – 600,000 – Hub Power Company Limited – 28,899 2,320,000 – 35.73 Habib Metropolitan Bank Limited 82,901 – – 50,000 – IGI Insurance Limited – 11,788 160,000 – 488.16 ICI Pakistan Limited 78,106 – 1,498,000 1,959,000 26.54 International Steel Limited 39,752 48,806 3,034,603 3,034,603 1.48 Islamabad Stock Exchange (ISE) 4,505 4,505 4,007,383 4,007,383 10.00 Karachi Stock Exchange (KSE) 40,074 40,074 – 23,000 – J. D. W. Sugar Mills Limited – 7,672 – 1,950,000 – JS Bank Limited – 13,614 450,000 – 20.88 Jahangir Siddiqui Co. Limited 9,394 – 10,000 – 525.00 Jubilee Life Insurance Co. Limited 5,250 – 289,000 – 121.38 Jubilee General Insurance Co. Limited 35,080 – 6,000,000 1,225,000 8.42 K- Electric Limited 50,492 9,422 – 800,000 – Kohinoor Textile Mills Limited – 22,118 572,500 2,607,000 97.32 Kot Addu Power Company Limited 55,717 146,651 3,002,500 4,291,000 31.81 Lalpir Power Limited 95,506 89,573 144,300 – 546.29 Lucky Cement Limited 78,830 – – 1,000,000 – Maple Leaf Cement Factory Limited – 31,417 12,000 270,000 259.42 MCB Bank Limited 3,113 77,337 614,500 – 49.15 Meezan Bank Limited 30,202 - 1,550,000 1,300,000 63.03 National Bank of Pakistan 97,701 79,642 925,500 338,000 60.58 Nishat Chunian Power Limited 56,068 13,999 2,490,500 2,180,000 41.98 Nishat (Chunian) Limited 104,545 99,235 – 2,528,500 – Nishat Power Limited – 80,696 – 800,000 – Nishat Mills Limited – 100,525 400,000 250,000 130.73 Oil and Gas Development Company Limited 52,291 51,394 – 7,583,700 – Pak Oman Advantage Fund – 75,515 3,200,000 4,500,000 29.53 Pakgen Power Limited 94,485 99,263 – 275,000 – Pakistan Oilfields Limited – 117,847 – 637,100 – Pakistan Petroleum Limited – 130,354 2,632,500 2,100,000 28.92 Pakistan Re-Insurance Company Limited 76,119 59,192 271,100 200,000 336.10 Pakistan State Oil Company Limited 91,117 72,278 2,888,000 3,010,000 19.82 Pakistan Telecommunication Company Limited 57,229 75,463 1,500,000 – 25.71 PICIC Growth Fund 38,570 –
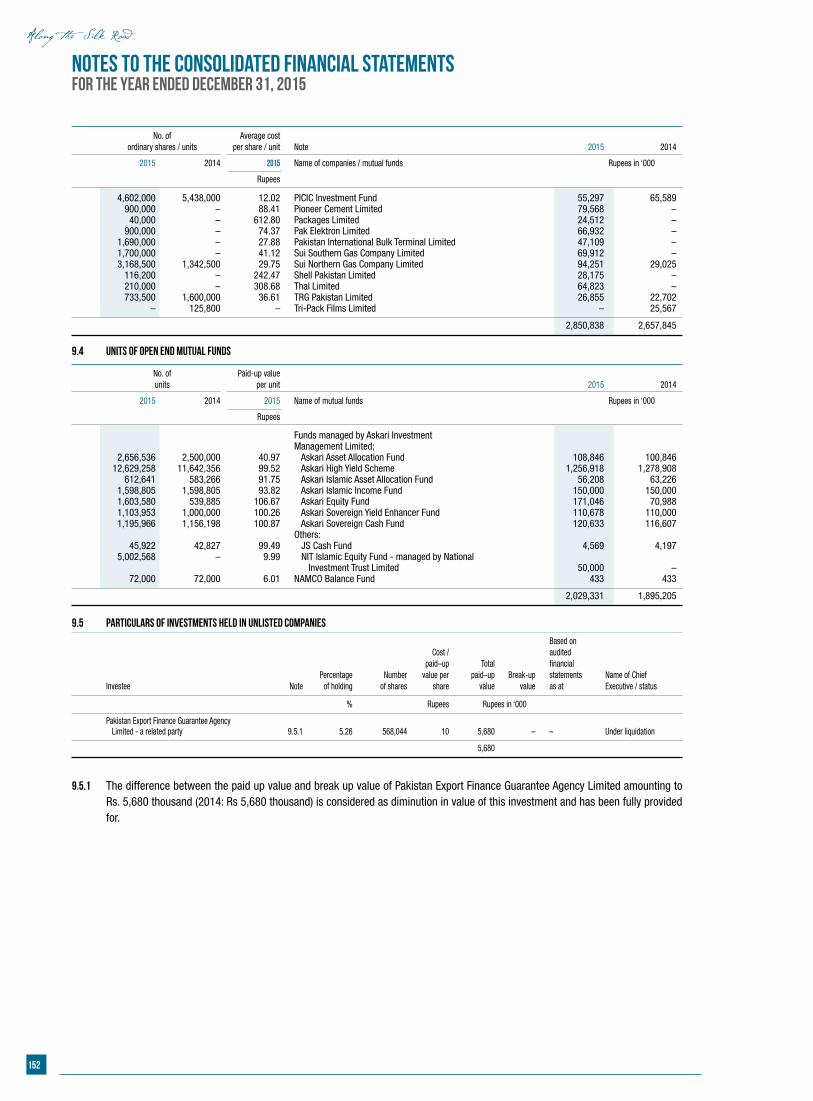
152
Notes to the consolidated Financial StatementsFor the year ended December 31, 2015
No. of Average cost ordinary shares / units per share / unit Note 2015 2014
2015 2014 2015 Name of companies / mutual funds Rupees in ‘000
Rupees
4,602,000 5,438,000 12.02 PICIC Investment Fund 55,297 65,589 900,000 – 88.41 Pioneer Cement Limited 79,568 – 40,000 – 612.80 Packages Limited 24,512 – 900,000 – 74.37 Pak Elektron Limited 66,932 – 1,690,000 – 27.88 Pakistan International Bulk Terminal Limited 47,109 – 1,700,000 – 41.12 Sui Southern Gas Company Limited 69,912 – 3,168,500 1,342,500 29.75 Sui Northern Gas Company Limited 94,251 29,025 116,200 – 242.47 Shell Pakistan Limited 28,175 – 210,000 – 308.68 Thal Limited 64,823 – 733,500 1,600,000 36.61 TRG Pakistan Limited 26,855 22,702 – 125,800 – Tri-Pack Films Limited – 25,567
2,850,838 2,657,845
9.4 Units of open end mutual funds
Funds managed by Askari Investment Management Limited; 2,656,536 2,500,000 40.97 Askari Asset Allocation Fund 108,846 100,846 12,629,258 11,642,356 99.52 Askari High Yield Scheme 1,256,918 1,278,908 612,641 583,266 91.75 Askari Islamic Asset Allocation Fund 56,208 63,226 1,598,805 1,598,805 93.82 Askari Islamic Income Fund 150,000 150,000 1,603,580 539,885 106.67 Askari Equity Fund 171,046 70,988 1,103,953 1,000,000 100.26 Askari Sovereign Yield Enhancer Fund 110,678 110,000 1,195,966 1,156,198 100.87 Askari Sovereign Cash Fund 120,633 116,607 Others: 45,922 42,827 99.49 JS Cash Fund 4,569 4,197 5,002,568 – 9.99 NIT Islamic Equity Fund - managed by National Investment Trust Limited 50,000 – 72,000 72,000 6.01 NAMCO Balance Fund 433 433
2,029,331 1,895,205
No. of Paid-up value units per unit 2015 2014
2015 2014 2015 Name of mutual funds Rupees in ‘000
Rupees
9.5 Particulars of investments held in unlisted companies
Based on Cost / audited paid–up Total financial Percentage Number value per paid–up Break-up statements Name of Chief Investee Note of holding of shares share value value as at Executive / status
% Rupees Rupees in ‘000
Pakistan Export Finance Guarantee Agency Limited - a related party 9.5.1 5.26 568,044 10 5,680 – – Under liquidation
5,680
9.5.1 The difference between the paid up value and break up value of Pakistan Export Finance Guarantee Agency Limited amounting to Rs. 5,680 thousand (2014: Rs 5,680 thousand) is considered as diminution in value of this investment and has been fully provided for.
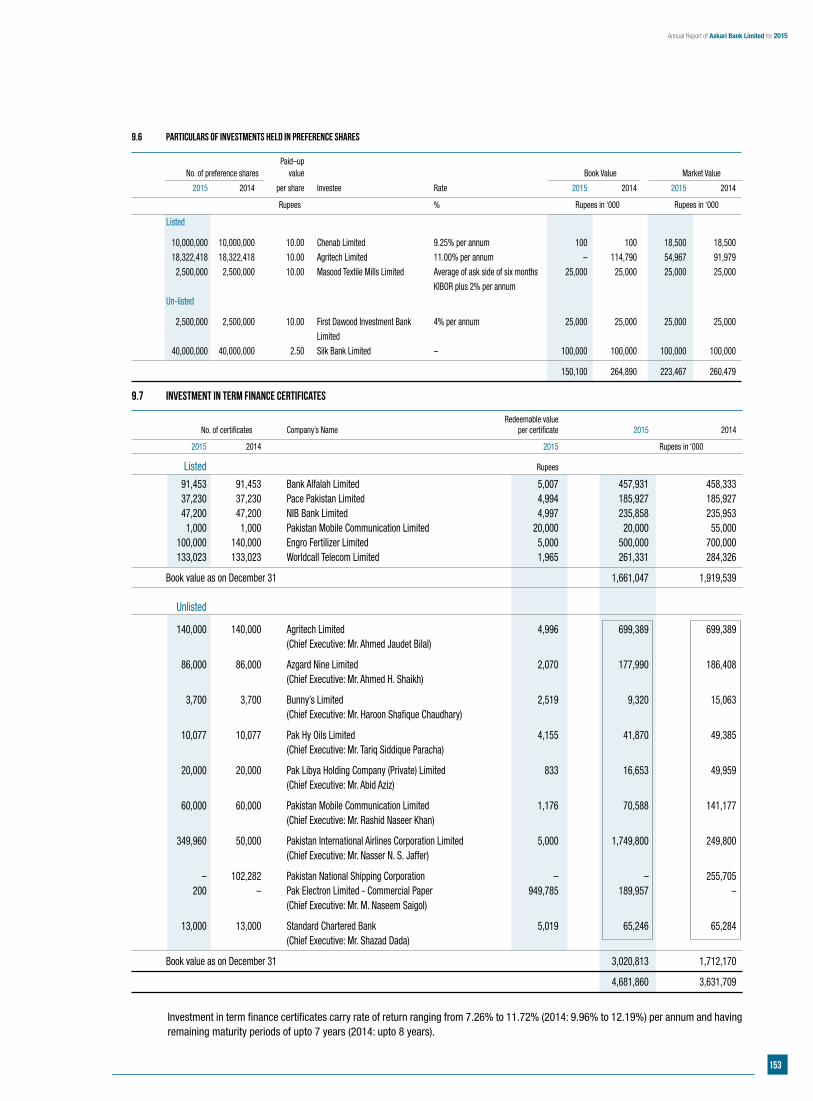
153
Annual Report of Askari Bank Limited for 2015
9.6 Particulars of investments held in preference shares
Paid–up No. of preference shares value Book Value Market Value
2015 2014 per share Investee Rate 2015 2014 2015 2014
Rupees % Rupees in ‘000 Rupees in ‘000
Listed
10,000,000 10,000,000 10.00 Chenab Limited 9.25% per annum 100 100 18,500 18,500 18,322,418 18,322,418 10.00 Agritech Limited 11.00% per annum – 114,790 54,967 91,979 2,500,000 2,500,000 10.00 Masood Textile Mills Limited Average of ask side of six months 25,000 25,000 25,000 25,000 KIBOR plus 2% per annum Un-listed
2,500,000 2,500,000 10.00 First Dawood Investment Bank 4% per annum 25,000 25,000 25,000 25,000 Limited 40,000,000 40,000,000 2.50 Silk Bank Limited – 100,000 100,000 100,000 100,000
150,100 264,890 223,467 260,479
9.7 Investment in Term Finance Certificates
Redeemable value No. of certificates Company’s Name per certificate 2015 2014
2015 2014 2015 Rupees in ‘000
Listed Rupees
91,453 91,453 Bank Alfalah Limited 5,007 457,931 458,333 37,230 37,230 Pace Pakistan Limited 4,994 185,927 185,927 47,200 47,200 NIB Bank Limited 4,997 235,858 235,953 1,000 1,000 Pakistan Mobile Communication Limited 20,000 20,000 55,000 100,000 140,000 Engro Fertilizer Limited 5,000 500,000 700,000 133,023 133,023 Worldcall Telecom Limited 1,965 261,331 284,326
Book value as on December 31 1,661,047 1,919,539 Unlisted
140,000 140,000 Agritech Limited 4,996 699,389 699,389 (Chief Executive: Mr. Ahmed Jaudet Bilal)
86,000 86,000 Azgard Nine Limited 2,070 177,990 186,408 (Chief Executive: Mr. Ahmed H. Shaikh)
3,700 3,700 Bunny’s Limited 2,519 9,320 15,063 (Chief Executive: Mr. Haroon Shafique Chaudhary)
10,077 10,077 Pak Hy Oils Limited 4,155 41,870 49,385 (Chief Executive: Mr. Tariq Siddique Paracha)
20,000 20,000 Pak Libya Holding Company (Private) Limited 833 16,653 49,959 (Chief Executive: Mr. Abid Aziz)
60,000 60,000 Pakistan Mobile Communication Limited 1,176 70,588 141,177 (Chief Executive: Mr. Rashid Naseer Khan)
349,960 50,000 Pakistan International Airlines Corporation Limited 5,000 1,749,800 249,800 (Chief Executive: Mr. Nasser N. S. Jaffer)
– 102,282 Pakistan National Shipping Corporation – – 255,705 200 – Pak Electron Limited - Commercial Paper 949,785 189,957 – (Chief Executive: Mr. M. Naseem Saigol)
13,000 13,000 Standard Chartered Bank 5,019 65,246 65,284 (Chief Executive: Mr. Shazad Dada)
Book value as on December 31 3,020,813 1,712,170
4,681,860 3,631,709
Investment in term finance certificates carry rate of return ranging from 7.26% to 11.72% (2014: 9.96% to 12.19%) per annum and having
remaining maturity periods of upto 7 years (2014: upto 8 years).
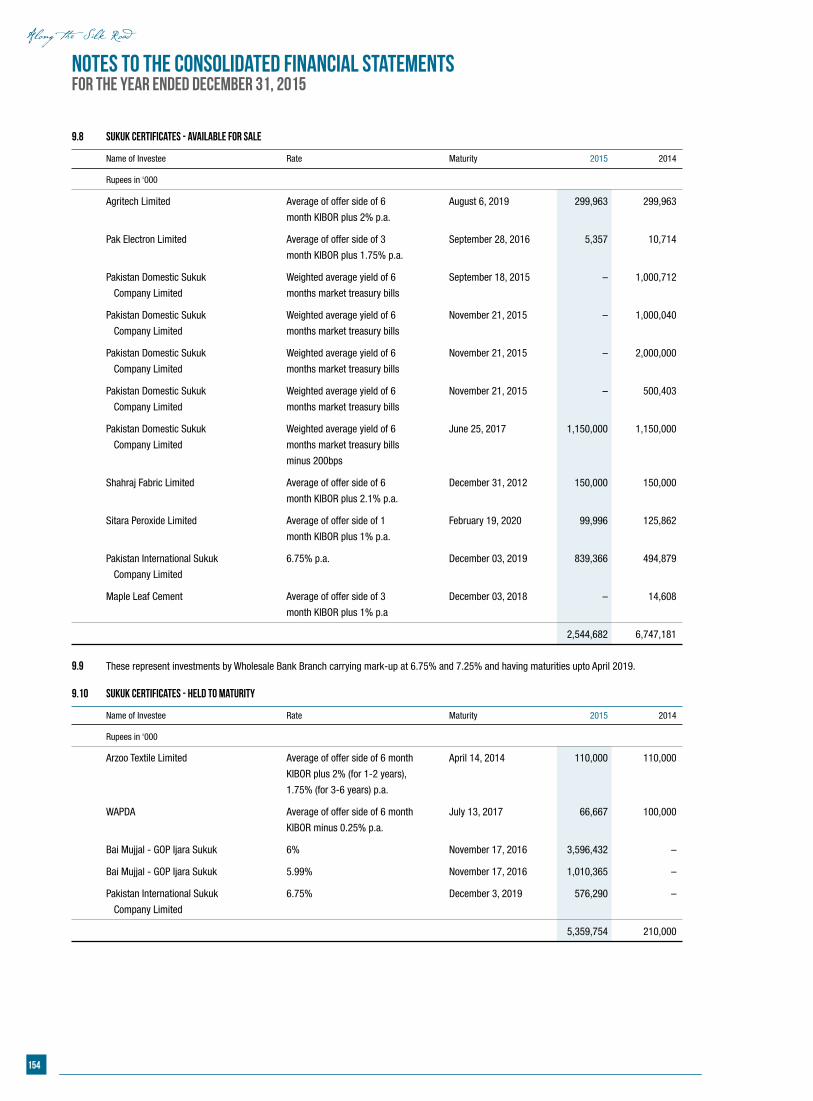
154
9.8 Sukuk Certificates - Available for sale
Name of Investee Rate Maturity 2015 2014
Rupees in ‘000
Agritech Limited Average of offer side of 6 August 6, 2019 299,963 299,963
month KIBOR plus 2% p.a.
Pak Electron Limited Average of offer side of 3 September 28, 2016 5,357 10,714
month KIBOR plus 1.75% p.a.
Pakistan Domestic Sukuk Weighted average yield of 6 September 18, 2015 – 1,000,712
Company Limited months market treasury bills
Pakistan Domestic Sukuk Weighted average yield of 6 November 21, 2015 – 1,000,040
Company Limited months market treasury bills
Pakistan Domestic Sukuk Weighted average yield of 6 November 21, 2015 – 2,000,000
Company Limited months market treasury bills
Pakistan Domestic Sukuk Weighted average yield of 6 November 21, 2015 – 500,403
Company Limited months market treasury bills
Pakistan Domestic Sukuk Weighted average yield of 6 June 25, 2017 1,150,000 1,150,000
Company Limited months market treasury bills
minus 200bps
Shahraj Fabric Limited Average of offer side of 6 December 31, 2012 150,000 150,000
month KIBOR plus 2.1% p.a.
Sitara Peroxide Limited Average of offer side of 1 February 19, 2020 99,996 125,862
month KIBOR plus 1% p.a.
Pakistan International Sukuk 6.75% p.a. December 03, 2019 839,366 494,879
Company Limited
Maple Leaf Cement Average of offer side of 3 December 03, 2018 – 14,608
month KIBOR plus 1% p.a
2,544,682 6,747,181
9.9 These represent investments by Wholesale Bank Branch carrying mark-up at 6.75% and 7.25% and having maturities upto April 2019.
Arzoo Textile Limited Average of offer side of 6 month April 14, 2014 110,000 110,000
KIBOR plus 2% (for 1-2 years),
1.75% (for 3-6 years) p.a.
WAPDA Average of offer side of 6 month July 13, 2017 66,667 100,000
KIBOR minus 0.25% p.a.
Bai Mujjal - GOP Ijara Sukuk 6% November 17, 2016 3,596,432 –
Bai Mujjal - GOP Ijara Sukuk 5.99% November 17, 2016 1,010,365 –
Pakistan International Sukuk 6.75% December 3, 2019 576,290 –
Company Limited
5,359,754 210,000
9.10 Sukuk Certificates - Held to maturity
Name of Investee Rate Maturity 2015 2014
Rupees in ‘000
Notes to the consolidated Financial StatementsFor the year ended December 31, 2015
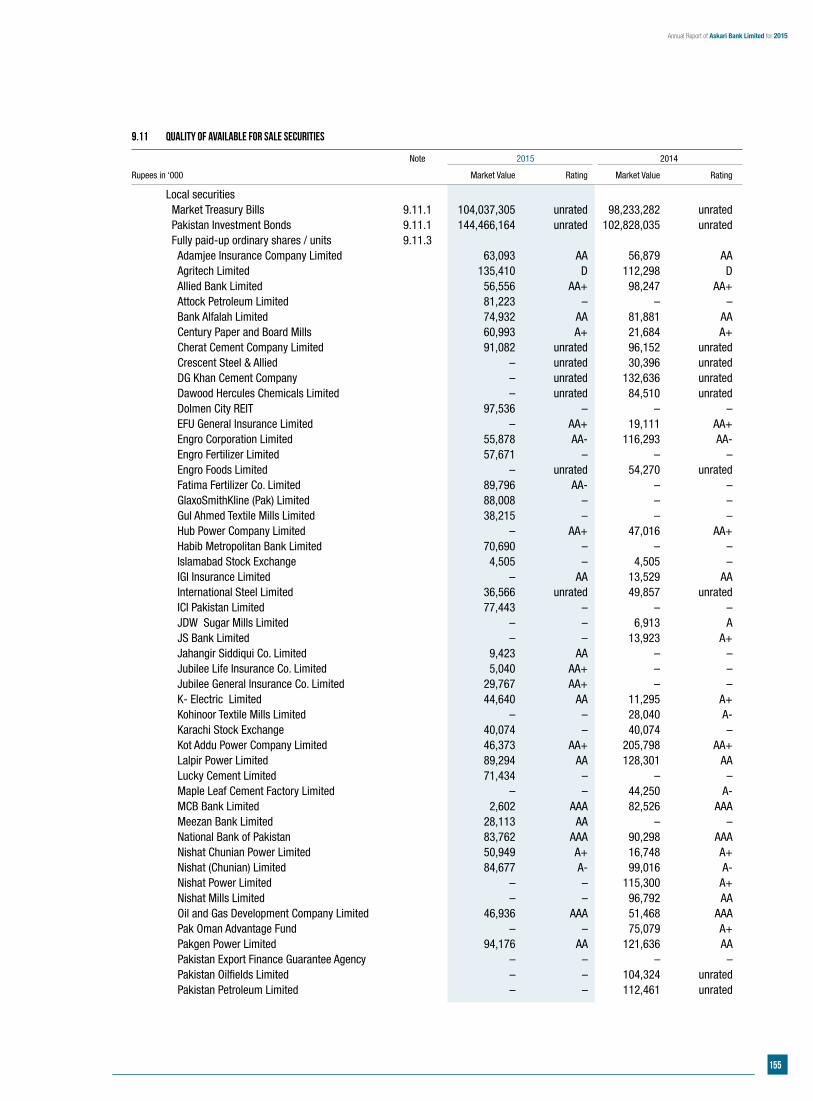
155
Annual Report of Askari Bank Limited for 2015
9.11 Quality of available for sale securities
Note 2015 2014
Rupees in ‘000 Market Value Rating Market Value Rating
Local securities Market Treasury Bills 9.11.1 104,037,305 unrated 98,233,282 unrated Pakistan Investment Bonds 9.11.1 144,466,164 unrated 102,828,035 unrated Fully paid-up ordinary shares / units 9.11.3 Adamjee Insurance Company Limited 63,093 AA 56,879 AA Agritech Limited 135,410 D 112,298 D Allied Bank Limited 56,556 AA+ 98,247 AA+ Attock Petroleum Limited 81,223 – – – Bank Alfalah Limited 74,932 AA 81,881 AA Century Paper and Board Mills 60,993 A+ 21,684 A+ Cherat Cement Company Limited 91,082 unrated 96,152 unrated Crescent Steel & Allied – unrated 30,396 unrated DG Khan Cement Company – unrated 132,636 unrated Dawood Hercules Chemicals Limited – unrated 84,510 unrated Dolmen City REIT 97,536 – – – EFU General Insurance Limited – AA+ 19,111 AA+ Engro Corporation Limited 55,878 AA- 116,293 AA- Engro Fertilizer Limited 57,671 – – – Engro Foods Limited – unrated 54,270 unrated Fatima Fertilizer Co. Limited 89,796 AA- – – GlaxoSmithKline (Pak) Limited 88,008 – – – Gul Ahmed Textile Mills Limited 38,215 – – – Hub Power Company Limited – AA+ 47,016 AA+ Habib Metropolitan Bank Limited 70,690 – – – Islamabad Stock Exchange 4,505 – 4,505 – IGI Insurance Limited – AA 13,529 AA International Steel Limited 36,566 unrated 49,857 unrated ICI Pakistan Limited 77,443 – – – JDW Sugar Mills Limited – – 6,913 A JS Bank Limited – – 13,923 A+ Jahangir Siddiqui Co. Limited 9,423 AA – – Jubilee Life Insurance Co. Limited 5,040 AA+ – – Jubilee General Insurance Co. Limited 29,767 AA+ – – K- Electric Limited 44,640 AA 11,295 A+ Kohinoor Textile Mills Limited – – 28,040 A- Karachi Stock Exchange 40,074 – 40,074 – Kot Addu Power Company Limited 46,373 AA+ 205,798 AA+ Lalpir Power Limited 89,294 AA 128,301 AA Lucky Cement Limited 71,434 – – – Maple Leaf Cement Factory Limited – – 44,250 A- MCB Bank Limited 2,602 AAA 82,526 AAA Meezan Bank Limited 28,113 AA – – National Bank of Pakistan 83,762 AAA 90,298 AAA Nishat Chunian Power Limited 50,949 A+ 16,748 A+ Nishat (Chunian) Limited 84,677 A- 99,016 A- Nishat Power Limited – – 115,300 A+ Nishat Mills Limited – – 96,792 AA Oil and Gas Development Company Limited 46,936 AAA 51,468 AAA Pak Oman Advantage Fund – – 75,079 A+ Pakgen Power Limited 94,176 AA 121,636 AA Pakistan Export Finance Guarantee Agency – – – – Pakistan Oilfields Limited – – 104,324 unrated Pakistan Petroleum Limited – – 112,461 unrated
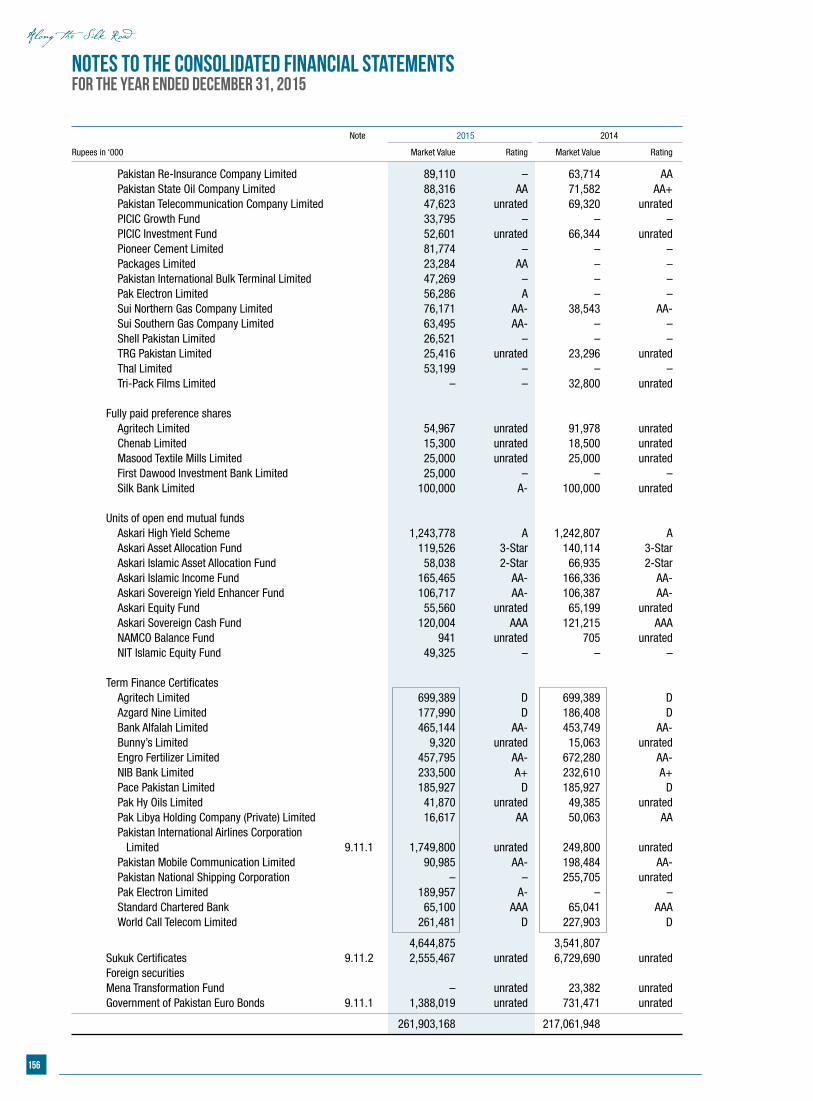
156
Notes to the consolidated Financial StatementsFor the year ended December 31, 2015
Note 2015 2014
Rupees in ‘000 Market Value Rating Market Value Rating
Pakistan Re-Insurance Company Limited 89,110 – 63,714 AA Pakistan State Oil Company Limited 88,316 AA 71,582 AA+ Pakistan Telecommunication Company Limited 47,623 unrated 69,320 unrated PICIC Growth Fund 33,795 – – – PICIC Investment Fund 52,601 unrated 66,344 unrated Pioneer Cement Limited 81,774 – – – Packages Limited 23,284 AA – – Pakistan International Bulk Terminal Limited 47,269 – – – Pak Electron Limited 56,286 A – – Sui Northern Gas Company Limited 76,171 AA- 38,543 AA- Sui Southern Gas Company Limited 63,495 AA- – – Shell Pakistan Limited 26,521 – – – TRG Pakistan Limited 25,416 unrated 23,296 unrated Thal Limited 53,199 – – – Tri-Pack Films Limited – – 32,800 unrated Fully paid preference shares Agritech Limited 54,967 unrated 91,978 unrated Chenab Limited 15,300 unrated 18,500 unrated Masood Textile Mills Limited 25,000 unrated 25,000 unrated First Dawood Investment Bank Limited 25,000 – – – Silk Bank Limited 100,000 A- 100,000 unrated Units of open end mutual funds Askari High Yield Scheme 1,243,778 A 1,242,807 A Askari Asset Allocation Fund 119,526 3-Star 140,114 3-Star Askari Islamic Asset Allocation Fund 58,038 2-Star 66,935 2-Star Askari Islamic Income Fund 165,465 AA- 166,336 AA- Askari Sovereign Yield Enhancer Fund 106,717 AA- 106,387 AA- Askari Equity Fund 55,560 unrated 65,199 unrated Askari Sovereign Cash Fund 120,004 AAA 121,215 AAA NAMCO Balance Fund 941 unrated 705 unrated NIT Islamic Equity Fund 49,325 – – –
Term Finance Certificates Agritech Limited 699,389 D 699,389 D Azgard Nine Limited 177,990 D 186,408 D Bank Alfalah Limited 465,144 AA- 453,749 AA- Bunny’s Limited 9,320 unrated 15,063 unrated Engro Fertilizer Limited 457,795 AA- 672,280 AA- NIB Bank Limited 233,500 A+ 232,610 A+ Pace Pakistan Limited 185,927 D 185,927 D Pak Hy Oils Limited 41,870 unrated 49,385 unrated Pak Libya Holding Company (Private) Limited 16,617 AA 50,063 AA Pakistan International Airlines Corporation Limited 9.11.1 1,749,800 unrated 249,800 unrated Pakistan Mobile Communication Limited 90,985 AA- 198,484 AA- Pakistan National Shipping Corporation – – 255,705 unrated Pak Electron Limited 189,957 A- – – Standard Chartered Bank 65,100 AAA 65,041 AAA World Call Telecom Limited 261,481 D 227,903 D
4,644,875 3,541,807 Sukuk Certificates 9.11.2 2,555,467 unrated 6,729,690 unrated Foreign securities Mena Transformation Fund – unrated 23,382 unrated Government of Pakistan Euro Bonds 9.11.1 1,388,019 unrated 731,471 unrated
261,903,168 217,061,948
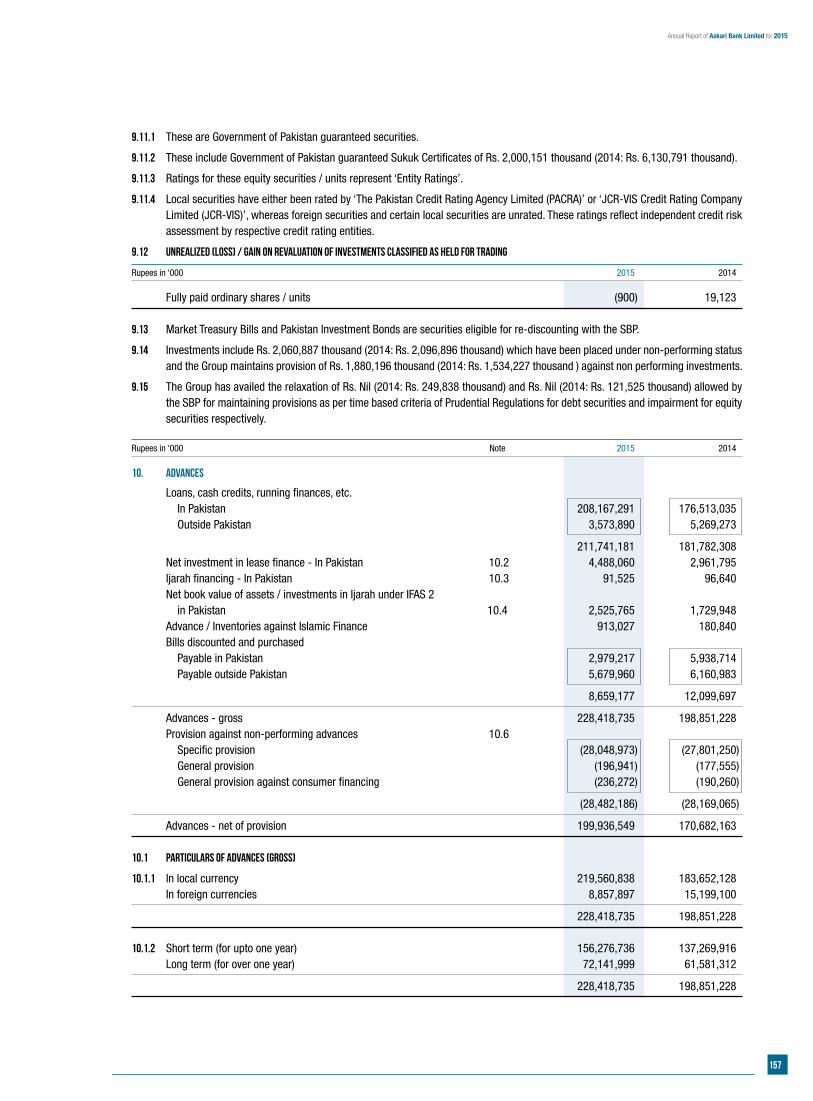
157
Annual Report of Askari Bank Limited for 2015
9.11.1 These are Government of Pakistan guaranteed securities.
9.11.2 These include Government of Pakistan guaranteed Sukuk Certificates of Rs. 2,000,151 thousand (2014: Rs. 6,130,791 thousand).
9.11.3 Ratings for these equity securities / units represent ‘Entity Ratings’.
9.11.4 Local securities have either been rated by ‘The Pakistan Credit Rating Agency Limited (PACRA)’ or ‘JCR-VIS Credit Rating Company Limited (JCR-VIS)’, whereas foreign securities and certain local securities are unrated. These ratings reflect independent credit risk assessment by respective credit rating entities.
9.12 Unrealized (loss) / gain on revaluation of investments classified as held for trading
Rupees in ‘000 2015 2014
Fully paid ordinary shares / units (900) 19,123 9.13 Market Treasury Bills and Pakistan Investment Bonds are securities eligible for re-discounting with the SBP.
9.14 Investments include Rs. 2,060,887 thousand (2014: Rs. 2,096,896 thousand) which have been placed under non-performing status and the Group maintains provision of Rs. 1,880,196 thousand (2014: Rs. 1,534,227 thousand ) against non performing investments.
9.15 The Group has availed the relaxation of Rs. Nil (2014: Rs. 249,838 thousand) and Rs. Nil (2014: Rs. 121,525 thousand) allowed by the SBP for maintaining provisions as per time based criteria of Prudential Regulations for debt securities and impairment for equity securities respectively.
Rupees in ‘000 Note 2015 2014
10. ADVANCES
Loans, cash credits, running finances, etc. In Pakistan 208,167,291 176,513,035 Outside Pakistan 3,573,890 5,269,273
211,741,181 181,782,308 Net investment in lease finance - In Pakistan 10.2 4,488,060 2,961,795 Ijarah financing - In Pakistan 10.3 91,525 96,640 Net book value of assets / investments in Ijarah under IFAS 2 in Pakistan 10.4 2,525,765 1,729,948 Advance / Inventories against Islamic Finance 913,027 180,840 Bills discounted and purchased Payable in Pakistan 2,979,217 5,938,714 Payable outside Pakistan 5,679,960 6,160,983
8,659,177 12,099,697
Advances - gross 228,418,735 198,851,228 Provision against non-performing advances 10.6 Specific provision (28,048,973) (27,801,250) General provision (196,941) (177,555) General provision against consumer financing (236,272) (190,260)
(28,482,186) (28,169,065)
Advances - net of provision 199,936,549 170,682,163 10.1 Particulars of advances (Gross)
10.1.1 In local currency 219,560,838 183,652,128 In foreign currencies 8,857,897 15,199,100
228,418,735 198,851,228 10.1.2 Short term (for upto one year) 156,276,736 137,269,916 Long term (for over one year) 72,141,999 61,581,312
228,418,735 198,851,228
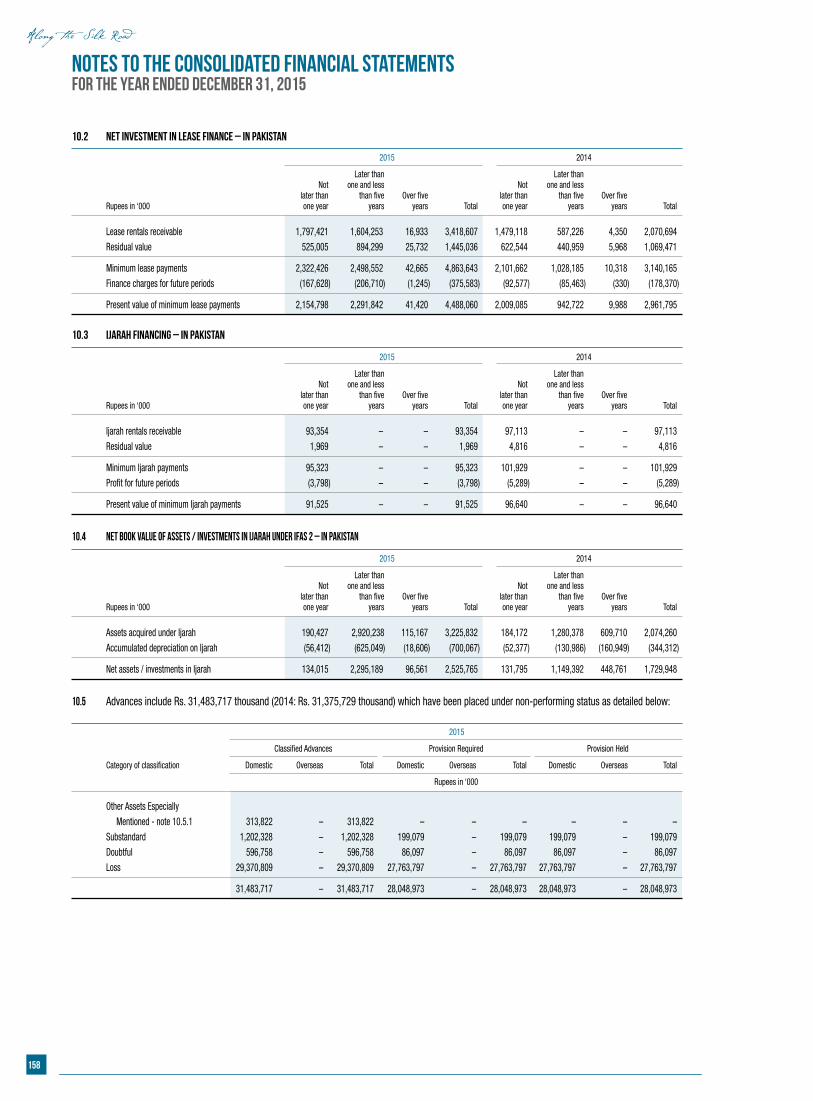
158
Notes to the consolidated Financial StatementsFor the year ended December 31, 2015
10.2 Net investment in lease finance – In Pakistan
2015 2014
Later than Later than Not one and less Not one and less later than than five Over five later than than five Over five Rupees in ‘000 one year years years Total one year years years Total
Lease rentals receivable 1,797,421 1,604,253 16,933 3,418,607 1,479,118 587,226 4,350 2,070,694
Residual value 525,005 894,299 25,732 1,445,036 622,544 440,959 5,968 1,069,471
Minimum lease payments 2,322,426 2,498,552 42,665 4,863,643 2,101,662 1,028,185 10,318 3,140,165
Finance charges for future periods (167,628) (206,710) (1,245) (375,583) (92,577) (85,463) (330) (178,370)
Present value of minimum lease payments 2,154,798 2,291,842 41,420 4,488,060 2,009,085 942,722 9,988 2,961,795
10.3 Ijarah financing – In Pakistan
2015 2014
Later than Later than Not one and less Not one and less later than than five Over five later than than five Over five Rupees in ‘000 one year years years Total one year years years Total
Ijarah rentals receivable 93,354 – – 93,354 97,113 – – 97,113
Residual value 1,969 – – 1,969 4,816 – – 4,816
Minimum Ijarah payments 95,323 – – 95,323 101,929 – – 101,929
Profit for future periods (3,798) – – (3,798) (5,289) – – (5,289)
Present value of minimum Ijarah payments 91,525 – – 91,525 96,640 – – 96,640
10.4 Net book value of assets / investments in Ijarah under IFAS 2 – In Pakistan
2015 2014
Later than Later than Not one and less Not one and less later than than five Over five later than than five Over five Rupees in ‘000 one year years years Total one year years years Total
Assets acquired under Ijarah 190,427 2,920,238 115,167 3,225,832 184,172 1,280,378 609,710 2,074,260
Accumulated depreciation on Ijarah (56,412) (625,049) (18,606) (700,067) (52,377) (130,986) (160,949) (344,312)
Net assets / investments in Ijarah 134,015 2,295,189 96,561 2,525,765 131,795 1,149,392 448,761 1,729,948
10.5 Advances include Rs. 31,483,717 thousand (2014: Rs. 31,375,729 thousand) which have been placed under non-performing status as detailed below:
2015
Classified Advances Provision Required Provision Held
Category of classification Domestic Overseas Total Domestic Overseas Total Domestic Overseas Total
Rupees in ‘000
Other Assets Especially
Mentioned - note 10.5.1 313,822 – 313,822 – – – – – –
Substandard 1,202,328 – 1,202,328 199,079 – 199,079 199,079 – 199,079
Doubtful 596,758 – 596,758 86,097 – 86,097 86,097 – 86,097
Loss 29,370,809 – 29,370,809 27,763,797 – 27,763,797 27,763,797 – 27,763,797
31,483,717 – 31,483,717 28,048,973 – 28,048,973 28,048,973 – 28,048,973
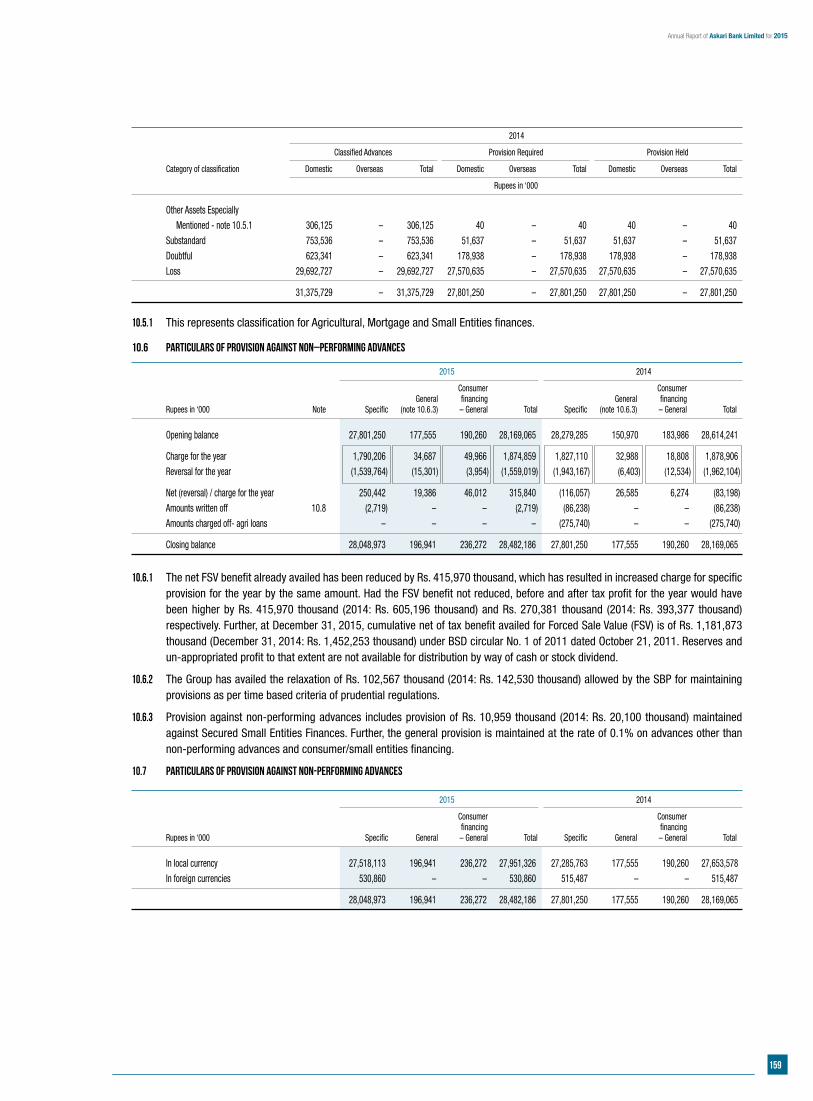
159
Annual Report of Askari Bank Limited for 2015
2014
Classified Advances Provision Required Provision Held
Category of classification Domestic Overseas Total Domestic Overseas Total Domestic Overseas Total
Rupees in ‘000
Other Assets Especially
Mentioned - note 10.5.1 306,125 – 306,125 40 – 40 40 – 40
Substandard 753,536 – 753,536 51,637 – 51,637 51,637 – 51,637
Doubtful 623,341 – 623,341 178,938 – 178,938 178,938 – 178,938
Loss 29,692,727 – 29,692,727 27,570,635 – 27,570,635 27,570,635 – 27,570,635
31,375,729 – 31,375,729 27,801,250 – 27,801,250 27,801,250 – 27,801,250
10.5.1 This represents classification for Agricultural, Mortgage and Small Entities finances.
10.6 Particulars of provision against non–performing advances
2015 2014
Consumer Consumer General financing General financing Rupees in ‘000 Note Specific (note 10.6.3) – General Total Specific (note 10.6.3) – General Total
Opening balance 27,801,250 177,555 190,260 28,169,065 28,279,285 150,970 183,986 28,614,241
Charge for the year 1,790,206 34,687 49,966 1,874,859 1,827,110 32,988 18,808 1,878,906
Reversal for the year (1,539,764) (15,301) (3,954) (1,559,019) (1,943,167) (6,403) (12,534) (1,962,104)
Net (reversal) / charge for the year 250,442 19,386 46,012 315,840 (116,057) 26,585 6,274 (83,198)
Amounts written off 10.8 (2,719) – – (2,719) (86,238) – – (86,238)
Amounts charged off- agri loans – – – – (275,740) – – (275,740)
Closing balance 28,048,973 196,941 236,272 28,482,186 27,801,250 177,555 190,260 28,169,065
10.6.1 The net FSV benefit already availed has been reduced by Rs. 415,970 thousand, which has resulted in increased charge for specific provision for the year by the same amount. Had the FSV benefit not reduced, before and after tax profit for the year would have been higher by Rs. 415,970 thousand (2014: Rs. 605,196 thousand) and Rs. 270,381 thousand (2014: Rs. 393,377 thousand) respectively. Further, at December 31, 2015, cumulative net of tax benefit availed for Forced Sale Value (FSV) is of Rs. 1,181,873 thousand (December 31, 2014: Rs. 1,452,253 thousand) under BSD circular No. 1 of 2011 dated October 21, 2011. Reserves and un-appropriated profit to that extent are not available for distribution by way of cash or stock dividend.
10.6.2 The Group has availed the relaxation of Rs. 102,567 thousand (2014: Rs. 142,530 thousand) allowed by the SBP for maintaining provisions as per time based criteria of prudential regulations.
10.6.3 Provision against non-performing advances includes provision of Rs. 10,959 thousand (2014: Rs. 20,100 thousand) maintained against Secured Small Entities Finances. Further, the general provision is maintained at the rate of 0.1% on advances other than non-performing advances and consumer/small entities financing.
10.7 Particulars of provision against non-performing advances
2015 2014
Consumer Consumer financing financing Rupees in ‘000 Specific General – General Total Specific General – General Total
In local currency 27,518,113 196,941 236,272 27,951,326 27,285,763 177,555 190,260 27,653,578
In foreign currencies 530,860 – – 530,860 515,487 – – 515,487
28,048,973 196,941 236,272 28,482,186 27,801,250 177,555 190,260 28,169,065
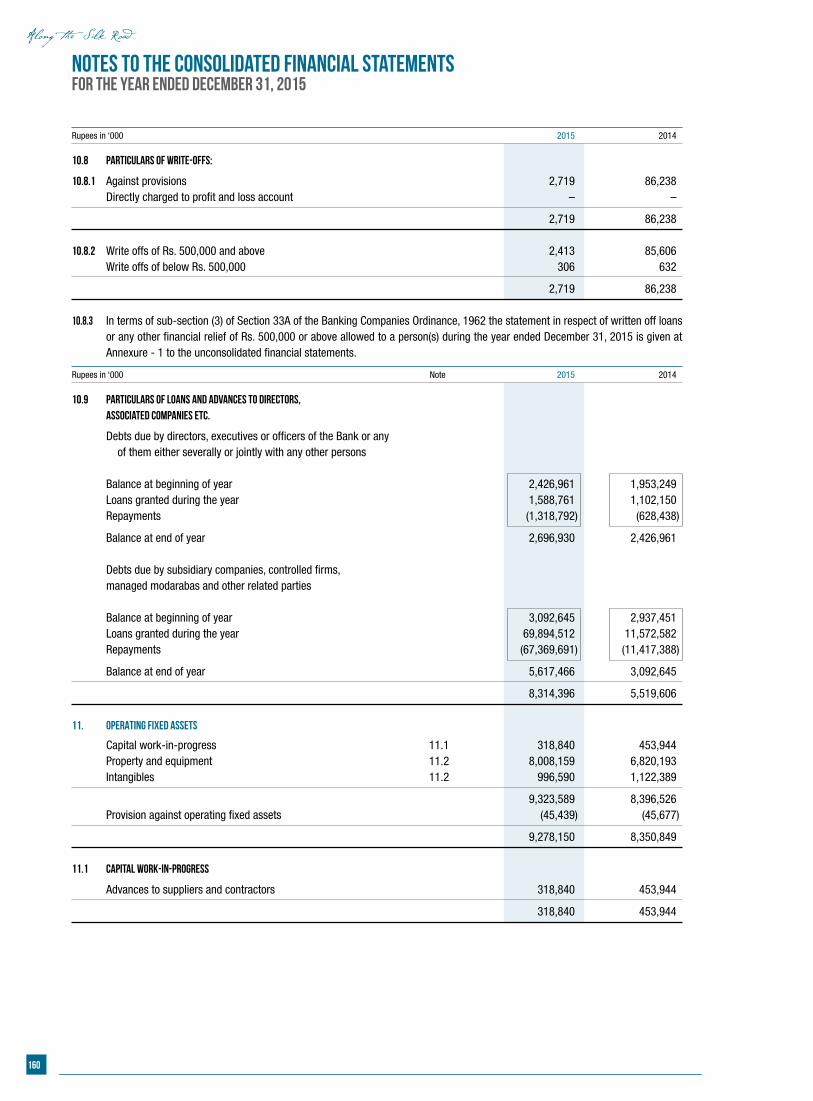
160
Rupees in ‘000 2015 2014
10.8 Particulars of write-offs:
10.8.1 Against provisions 2,719 86,238 Directly charged to profit and loss account – –
2,719 86,238
10.8.2 Write offs of Rs. 500,000 and above 2,413 85,606 Write offs of below Rs. 500,000 306 632
2,719 86,238 10.8.3 In terms of sub-section (3) of Section 33A of the Banking Companies Ordinance, 1962 the statement in respect of written off loans
or any other financial relief of Rs. 500,000 or above allowed to a person(s) during the year ended December 31, 2015 is given at Annexure - 1 to the unconsolidated financial statements.
Rupees in ‘000 Note 2015 2014
10.9 Particulars of loans and advances to directors, associated companies etc.
Debts due by directors, executives or officers of the Bank or any of them either severally or jointly with any other persons Balance at beginning of year 2,426,961 1,953,249 Loans granted during the year 1,588,761 1,102,150 Repayments (1,318,792) (628,438)
Balance at end of year 2,696,930 2,426,961 Debts due by subsidiary companies, controlled firms, managed modarabas and other related parties Balance at beginning of year 3,092,645 2,937,451 Loans granted during the year 69,894,512 11,572,582 Repayments (67,369,691) (11,417,388)
Balance at end of year 5,617,466 3,092,645
8,314,396 5,519,606 11. OPERATING FIXED ASSETS
Capital work-in-progress 11.1 318,840 453,944 Property and equipment 11.2 8,008,159 6,820,193 Intangibles 11.2 996,590 1,122,389
9,323,589 8,396,526 Provision against operating fixed assets (45,439) (45,677)
9,278,150 8,350,849 11.1 Capital work-in-progress
Advances to suppliers and contractors 318,840 453,944
318,840 453,944
Notes to the consolidated Financial StatementsFor the year ended December 31, 2015
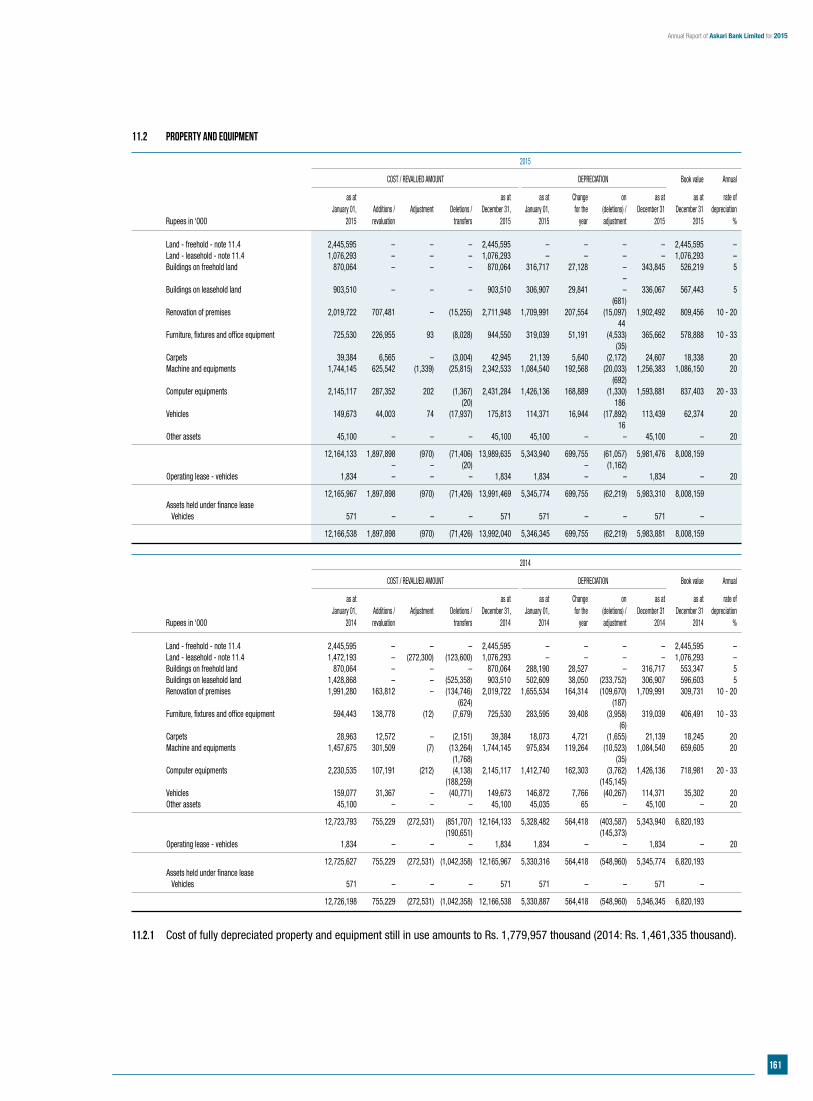
161
Annual Report of Askari Bank Limited for 2015
11.2 Property and equipment
2015
COST / REVALUED AMOUNT DEPRECIATION Book value Annual
as at as at as at Change on as at as at rate of January 01, Additions / Adjustment Deletions / December 31, January 01, for the (deletions) / December 31 December 31 depreciation Rupees in ‘000 2015 revaluation transfers 2015 2015 year adjustment 2015 2015 %
Land - freehold - note 11.4 2,445,595 – – – 2,445,595 – – – – 2,445,595 – Land - leasehold - note 11.4 1,076,293 – – – 1,076,293 – – – – 1,076,293 – Buildings on freehold land 870,064 – – – 870,064 316,717 27,128 – 343,845 526,219 5 – Buildings on leasehold land 903,510 – – – 903,510 306,907 29,841 – 336,067 567,443 5 (681) Renovation of premises 2,019,722 707,481 – (15,255) 2,711,948 1,709,991 207,554 (15,097) 1,902,492 809,456 10 - 20 44 Furniture, fixtures and office equipment 725,530 226,955 93 (8,028) 944,550 319,039 51,191 (4,533) 365,662 578,888 10 - 33 (35) Carpets 39,384 6,565 – (3,004) 42,945 21,139 5,640 (2,172) 24,607 18,338 20 Machine and equipments 1,744,145 625,542 (1,339) (25,815) 2,342,533 1,084,540 192,568 (20,033) 1,256,383 1,086,150 20 (692) Computer equipments 2,145,117 287,352 202 (1,367) 2,431,284 1,426,136 168,889 (1,330) 1,593,881 837,403 20 - 33 (20) 186 Vehicles 149,673 44,003 74 (17,937) 175,813 114,371 16,944 (17,892) 113,439 62,374 20 16 Other assets 45,100 – – – 45,100 45,100 – – 45,100 – 20
12,164,133 1,897,898 (970) (71,406) 13,989,635 5,343,940 699,755 (61,057) 5,981,476 8,008,159 – – (20) – (1,162) Operating lease - vehicles 1,834 – – – 1,834 1,834 – – 1,834 – 20
12,165,967 1,897,898 (970) (71,426) 13,991,469 5,345,774 699,755 (62,219) 5,983,310 8,008,159 Assets held under finance lease Vehicles 571 – – – 571 571 – – 571 –
12,166,538 1,897,898 (970) (71,426) 13,992,040 5,346,345 699,755 (62,219) 5,983,881 8,008,159
2014
COST / REVALUED AMOUNT DEPRECIATION Book value Annual
as at as at as at Change on as at as at rate of January 01, Additions / Adjustment Deletions / December 31, January 01, for the (deletions) / December 31 December 31 depreciation Rupees in ‘000 2014 revaluation transfers 2014 2014 year adjustment 2014 2014 %
Land - freehold - note 11.4 2,445,595 – – – 2,445,595 – – – – 2,445,595 – Land - leasehold - note 11.4 1,472,193 – (272,300) (123,600) 1,076,293 – – – – 1,076,293 – Buildings on freehold land 870,064 – – – 870,064 288,190 28,527 – 316,717 553,347 5 Buildings on leasehold land 1,428,868 – – (525,358) 903,510 502,609 38,050 (233,752) 306,907 596,603 5 Renovation of premises 1,991,280 163,812 – (134,746) 2,019,722 1,655,534 164,314 (109,670) 1,709,991 309,731 10 - 20 (624) (187) Furniture, fixtures and office equipment 594,443 138,778 (12) (7,679) 725,530 283,595 39,408 (3,958) 319,039 406,491 10 - 33 (6) Carpets 28,963 12,572 – (2,151) 39,384 18,073 4,721 (1,655) 21,139 18,245 20 Machine and equipments 1,457,675 301,509 (7) (13,264) 1,744,145 975,834 119,264 (10,523) 1,084,540 659,605 20 (1,768) (35) Computer equipments 2,230,535 107,191 (212) (4,138) 2,145,117 1,412,740 162,303 (3,762) 1,426,136 718,981 20 - 33 (188,259) (145,145) Vehicles 159,077 31,367 – (40,771) 149,673 146,872 7,766 (40,267) 114,371 35,302 20 Other assets 45,100 – – – 45,100 45,035 65 – 45,100 – 20
12,723,793 755,229 (272,531) (851,707) 12,164,133 5,328,482 564,418 (403,587) 5,343,940 6,820,193 (190,651) (145,373) Operating lease - vehicles 1,834 – – – 1,834 1,834 – – 1,834 – 20
12,725,627 755,229 (272,531) (1,042,358) 12,165,967 5,330,316 564,418 (548,960) 5,345,774 6,820,193 Assets held under finance lease Vehicles 571 – – – 571 571 – – 571 –
12,726,198 755,229 (272,531) (1,042,358) 12,166,538 5,330,887 564,418 (548,960) 5,346,345 6,820,193
11.2.1 Cost of fully depreciated property and equipment still in use amounts to Rs. 1,779,957 thousand (2014: Rs. 1,461,335 thousand).
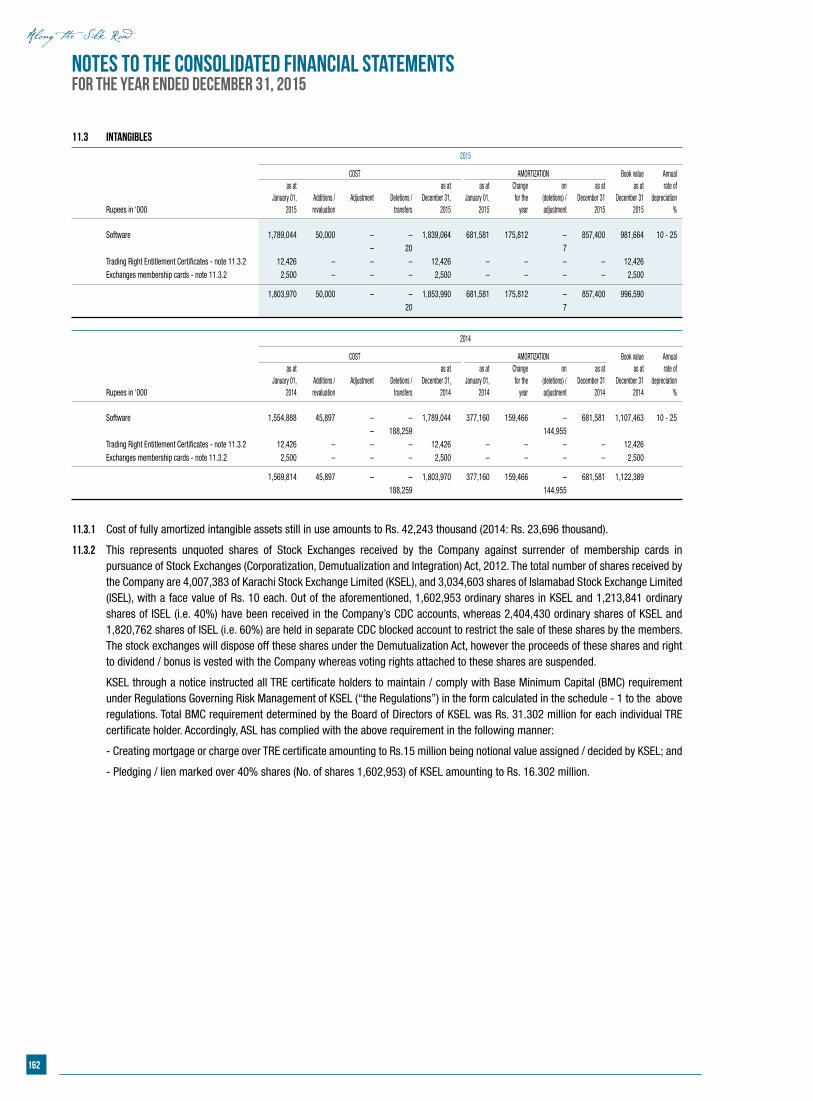
162
11.3 Intangibles
2015
COST AMORTIZATION Book value Annual as at as at as at Change on as at as at rate of January 01, Additions / Adjustment Deletions / December 31, January 01, for the (deletions) / December 31 December 31 depreciation Rupees in ‘000 2015 revaluation transfers 2015 2015 year adjustment 2015 2015 %
Software 1,789,044 50,000 – – 1,839,064 681,581 175,812 – 857,400 981,664 10 - 25 – 20 7 Trading Right Entitlement Certificates - note 11.3.2 12,426 – – – 12,426 – – – – 12,426 Exchanges membership cards - note 11.3.2 2,500 – – – 2,500 – – – – 2,500
1,803,970 50,000 – – 1,853,990 681,581 175,812 – 857,400 996,590 20 7
2014
COST AMORTIZATION Book value Annual as at as at as at Change on as at as at rate of January 01, Additions / Adjustment Deletions / December 31, January 01, for the (deletions) / December 31 December 31 depreciation Rupees in ‘000 2014 revaluation transfers 2014 2014 year adjustment 2014 2014 %
Software 1,554,888 45,897 – – 1,789,044 377,160 159,466 – 681,581 1,107,463 10 - 25 – 188,259 144,955 Trading Right Entitlement Certificates - note 11.3.2 12,426 – – – 12,426 – – – – 12,426 Exchanges membership cards - note 11.3.2 2,500 – – – 2,500 – – – – 2,500
1,569,814 45,897 – – 1,803,970 377,160 159,466 – 681,581 1,122,389 188,259 144,955
Notes to the consolidated Financial StatementsFor the year ended December 31, 2015
11.3.1 Cost of fully amortized intangible assets still in use amounts to Rs. 42,243 thousand (2014: Rs. 23,696 thousand).
11.3.2 This represents unquoted shares of Stock Exchanges received by the Company against surrender of membership cards in pursuance of Stock Exchanges (Corporatization, Demutualization and Integration) Act, 2012. The total number of shares received by the Company are 4,007,383 of Karachi Stock Exchange Limited (KSEL), and 3,034,603 shares of Islamabad Stock Exchange Limited (ISEL), with a face value of Rs. 10 each. Out of the aforementioned, 1,602,953 ordinary shares in KSEL and 1,213,841 ordinary shares of ISEL (i.e. 40%) have been received in the Company’s CDC accounts, whereas 2,404,430 ordinary shares of KSEL and 1,820,762 shares of ISEL (i.e. 60%) are held in separate CDC blocked account to restrict the sale of these shares by the members. The stock exchanges will dispose off these shares under the Demutualization Act, however the proceeds of these shares and right to dividend / bonus is vested with the Company whereas voting rights attached to these shares are suspended.
KSEL through a notice instructed all TRE certificate holders to maintain / comply with Base Minimum Capital (BMC) requirement under Regulations Governing Risk Management of KSEL (“the Regulations”) in the form calculated in the schedule - 1 to the above regulations. Total BMC requirement determined by the Board of Directors of KSEL was Rs. 31.302 million for each individual TRE certificate holder. Accordingly, ASL has complied with the above requirement in the following manner:
- Creating mortgage or charge over TRE certificate amounting to Rs.15 million being notional value assigned / decided by KSEL; and
- Pledging / lien marked over 40% shares (No. of shares 1,602,953) of KSEL amounting to Rs. 16.302 million.
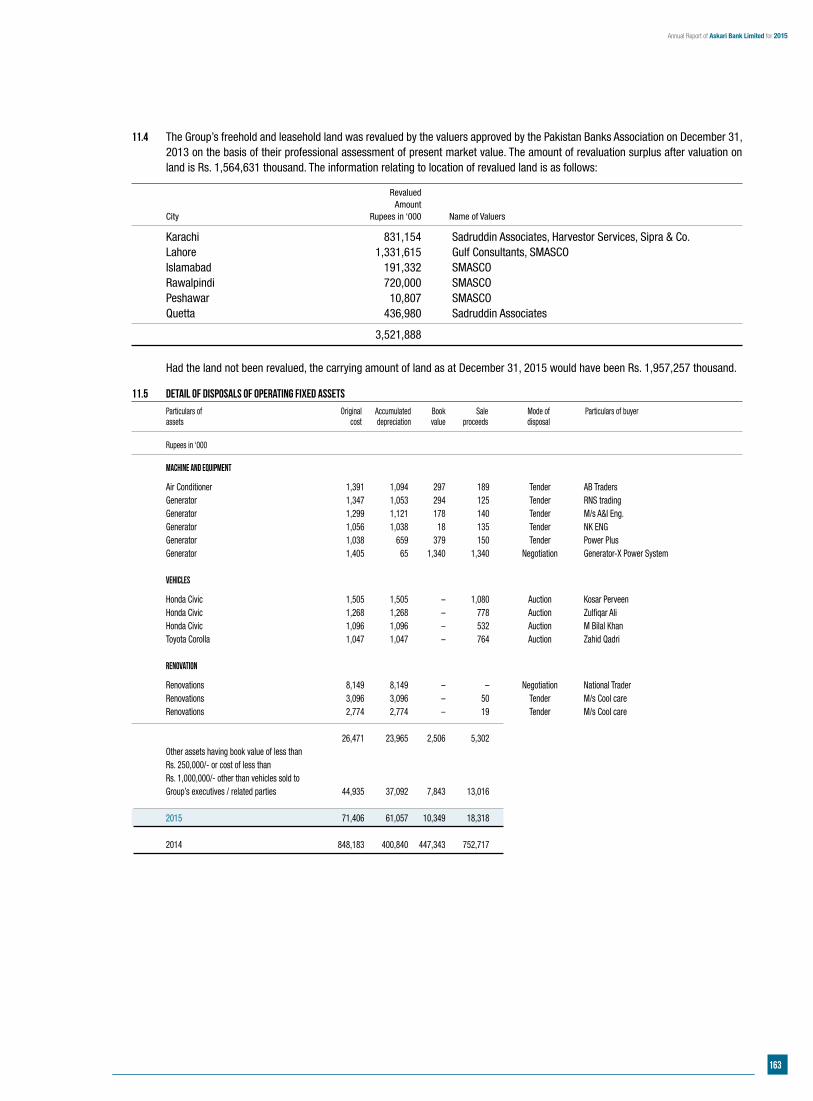
163
Annual Report of Askari Bank Limited for 2015
11.4 The Group’s freehold and leasehold land was revalued by the valuers approved by the Pakistan Banks Association on December 31, 2013 on the basis of their professional assessment of present market value. The amount of revaluation surplus after valuation on land is Rs. 1,564,631 thousand. The information relating to location of revalued land is as follows:
Revalued Amount City Rupees in ‘000 Name of Valuers
Karachi 831,154 Sadruddin Associates, Harvestor Services, Sipra & Co. Lahore 1,331,615 Gulf Consultants, SMASCO Islamabad 191,332 SMASCO Rawalpindi 720,000 SMASCO Peshawar 10,807 SMASCO Quetta 436,980 Sadruddin Associates
3,521,888
Had the land not been revalued, the carrying amount of land as at December 31, 2015 would have been Rs. 1,957,257 thousand.
11.5 Detail of disposals of operating fixed assets
Particulars of Original Accumulated Book Sale Mode of Particulars of buyer assets cost depreciation value proceeds disposal
Rupees in ‘000
Machine and Equipment
Air Conditioner 1,391 1,094 297 189 Tender AB Traders Generator 1,347 1,053 294 125 Tender RNS trading Generator 1,299 1,121 178 140 Tender M/s A&I Eng. Generator 1,056 1,038 18 135 Tender NK ENG Generator 1,038 659 379 150 Tender Power Plus Generator 1,405 65 1,340 1,340 Negotiation Generator-X Power System Vehicles
Honda Civic 1,505 1,505 – 1,080 Auction Kosar Perveen Honda Civic 1,268 1,268 – 778 Auction Zulfiqar Ali Honda Civic 1,096 1,096 – 532 Auction M Bilal Khan Toyota Corolla 1,047 1,047 – 764 Auction Zahid Qadri Renovation
Renovations 8,149 8,149 – – Negotiation National Trader Renovations 3,096 3,096 – 50 Tender M/s Cool care Renovations 2,774 2,774 – 19 Tender M/s Cool care 26,471 23,965 2,506 5,302 Other assets having book value of less than Rs. 250,000/- or cost of less than Rs. 1,000,000/- other than vehicles sold to Group’s executives / related parties 44,935 37,092 7,843 13,016 2015 71,406 61,057 10,349 18,318 2014 848,183 400,840 447,343 752,717
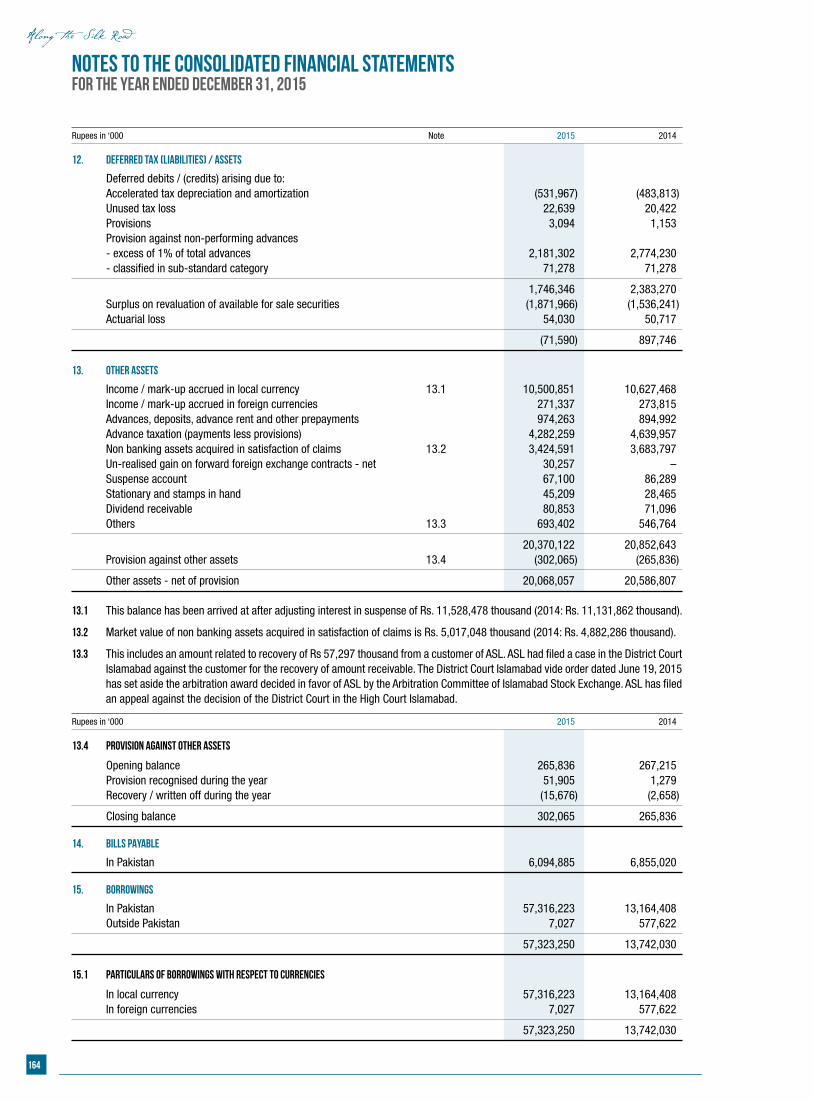
164
Notes to the consolidated Financial StatementsFor the year ended December 31, 2015
Rupees in ‘000 Note 2015 2014
12. DEFERRED TAX (LIABILITIES) / ASSETS
Deferred debits / (credits) arising due to: Accelerated tax depreciation and amortization (531,967) (483,813) Unused tax loss 22,639 20,422 Provisions 3,094 1,153 Provision against non-performing advances - excess of 1% of total advances 2,181,302 2,774,230 - classified in sub-standard category 71,278 71,278
1,746,346 2,383,270 Surplus on revaluation of available for sale securities (1,871,966) (1,536,241) Actuarial loss 54,030 50,717
(71,590) 897,746 13. OTHER ASSETS
Income / mark-up accrued in local currency 13.1 10,500,851 10,627,468 Income / mark-up accrued in foreign currencies 271,337 273,815 Advances, deposits, advance rent and other prepayments 974,263 894,992 Advance taxation (payments less provisions) 4,282,259 4,639,957 Non banking assets acquired in satisfaction of claims 13.2 3,424,591 3,683,797 Un-realised gain on forward foreign exchange contracts - net 30,257 – Suspense account 67,100 86,289 Stationary and stamps in hand 45,209 28,465 Dividend receivable 80,853 71,096 Others 13.3 693,402 546,764
20,370,122 20,852,643 Provision against other assets 13.4 (302,065) (265,836)
Other assets - net of provision 20,068,057 20,586,807 13.1 This balance has been arrived at after adjusting interest in suspense of Rs. 11,528,478 thousand (2014: Rs. 11,131,862 thousand).
13.2 Market value of non banking assets acquired in satisfaction of claims is Rs. 5,017,048 thousand (2014: Rs. 4,882,286 thousand).
13.3 This includes an amount related to recovery of Rs 57,297 thousand from a customer of ASL. ASL had filed a case in the District Court Islamabad against the customer for the recovery of amount receivable. The District Court Islamabad vide order dated June 19, 2015 has set aside the arbitration award decided in favor of ASL by the Arbitration Committee of Islamabad Stock Exchange. ASL has filed an appeal against the decision of the District Court in the High Court Islamabad.
Rupees in ‘000 2015 2014
13.4 Provision against other assets
Opening balance 265,836 267,215 Provision recognised during the year 51,905 1,279 Recovery / written off during the year (15,676) (2,658)
Closing balance 302,065 265,836
14. BILLS PAYABLE
In Pakistan 6,094,885 6,855,020
15. BORROWINGS
In Pakistan 57,316,223 13,164,408 Outside Pakistan 7,027 577,622
57,323,250 13,742,030 15.1 Particulars of borrowings with respect to currencies
In local currency 57,316,223 13,164,408 In foreign currencies 7,027 577,622
57,323,250 13,742,030

165
Annual Report of Askari Bank Limited for 2015
Rupees in ‘000 Note 2015 2014
15.2 Details of borrowings - secured / unsecured
In Pakistan - local currency Secured Borrowings from the State Bank of Pakistan: Export refinance scheme 15.2.1 9,314,529 7,432,761 Long term financing of export oriented projects 15.2.2 7,386 41,892 Long term financing facility 15.2.3 1,005,047 479,199
10,326,962 7,953,852 Repo borrowings State Bank of Pakistan 15.2.4 42,646,764 894,753 Financial institutions 15.2.5 3,842,399 1,938,070
46,489,163 2,832,823 Unsecured Call borrowings 15.2.6 500,000 1,998,235 Overdrawn balance with other banks 98 379,498
500,098 2,377,733
57,316,223 13,164,408 Outside Pakistan - foreign currencies Overdrawn nostro accounts - unsecured 7,027 577,622
57,323,250 13,742,030 15.2.1 This facility is secured against demand promissory note executed in favour of the SBP. The effective mark-up rate is 2.5% to 4.5%
(2014: 7.5%) per annum payable on a quarterly basis.
15.2.2 This facility is secured against demand promissory note executed in favour of the SBP. The effective mark-up rate is 5% (2014: 5% to 8.2%) per annum payable on a quarterly basis.
15.2.3 This facility is secured against demand promissory note executed in favour of the SBP. The effective mark-up rate is 3.0% to 6.0% (2014: 6.0% to 7.5%) per annum payable on a quarterly basis.
15.2.4 These are secured against pledge of Government Securities and carry markup of 6.16% (2014: 9.50%) per annum and have maturities upto 1 month (2014: 1 month).
15.2.5 These are secured against pledge of Government Securities and carry markup of 6.0% to 6.35% (2014: 9.40%) per annum and have maturities upto 1 month (2014: 1 month).
15.2.6 These carry mark-up rate of 6.05% (2014: 9.40%) per annum and have maturity upto 1 month (2014:1 month).
Rupees in ‘000 2015 2014
16. DEPOSITS AND OTHER ACCOUNTS
Customers Fixed deposits 87,271,214 91,328,822 Savings deposits 230,855,326 203,230,490 Current accounts - remunerative 735,829 566,193 Current accounts - non-remunerative 105,530,938 88,516,497 Special exporters’ account 59,733 17,008 Margin accounts 2,724,193 2,452,708 Others 824,850 526,374 Financial institutions Remunerative deposits 4,959,028 603,878 Non-remunerative deposits 169,354 292,903
433,130,465 387,534,873 16.1 Particulars of deposits
In local currency 395,198,228 351,754,303 In foreign currencies 37,932,237 35,780,570
433,130,465 387,534,873
Deposits include Rs. 12,293,194 thousand (2014: Rs. 12,880,485 thousand) due to related parties.
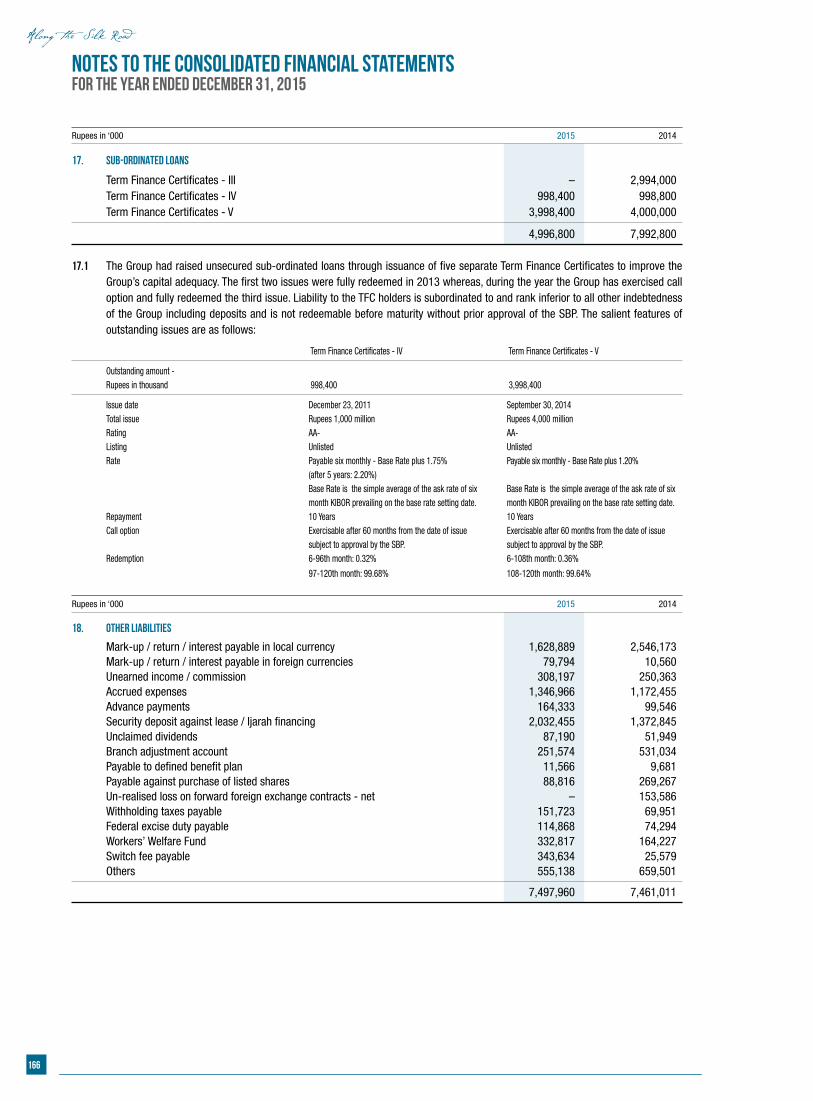
166
Notes to the consolidated Financial StatementsFor the year ended December 31, 2015
Rupees in ‘000 2015 2014
17. SUB-ORDINATED LOANS
Term Finance Certificates - III – 2,994,000 Term Finance Certificates - IV 998,400 998,800 Term Finance Certificates - V 3,998,400 4,000,000
4,996,800 7,992,800 17.1 The Group had raised unsecured sub-ordinated loans through issuance of five separate Term Finance Certificates to improve the
Group’s capital adequacy. The first two issues were fully redeemed in 2013 whereas, during the year the Group has exercised call option and fully redeemed the third issue. Liability to the TFC holders is subordinated to and rank inferior to all other indebtedness of the Group including deposits and is not redeemable before maturity without prior approval of the SBP. The salient features of outstanding issues are as follows:
Term Finance Certificates - IV Term Finance Certificates - V
Outstanding amount - Rupees in thousand 998,400 3,998,400
Issue date December 23, 2011 September 30, 2014 Total issue Rupees 1,000 million Rupees 4,000 million Rating AA- AA- Listing Unlisted Unlisted Rate Payable six monthly - Base Rate plus 1.75% Payable six monthly - Base Rate plus 1.20% (after 5 years: 2.20%) Base Rate is the simple average of the ask rate of six Base Rate is the simple average of the ask rate of six month KIBOR prevailing on the base rate setting date. month KIBOR prevailing on the base rate setting date. Repayment 10 Years 10 Years Call option Exercisable after 60 months from the date of issue Exercisable after 60 months from the date of issue subject to approval by the SBP. subject to approval by the SBP. Redemption 6-96th month: 0.32% 6-108th month: 0.36%
97-120th month: 99.68% 108-120th month: 99.64%
Rupees in ‘000 2015 2014
18. OTHER LIABILITIES
Mark-up / return / interest payable in local currency 1,628,889 2,546,173 Mark-up / return / interest payable in foreign currencies 79,794 10,560 Unearned income / commission 308,197 250,363 Accrued expenses 1,346,966 1,172,455 Advance payments 164,333 99,546 Security deposit against lease / Ijarah financing 2,032,455 1,372,845 Unclaimed dividends 87,190 51,949 Branch adjustment account 251,574 531,034 Payable to defined benefit plan 11,566 9,681 Payable against purchase of listed shares 88,816 269,267 Un-realised loss on forward foreign exchange contracts - net – 153,586 Withholding taxes payable 151,723 69,951 Federal excise duty payable 114,868 74,294 Workers’ Welfare Fund 332,817 164,227 Switch fee payable 343,634 25,579 Others 555,138 659,501
7,497,960 7,461,011
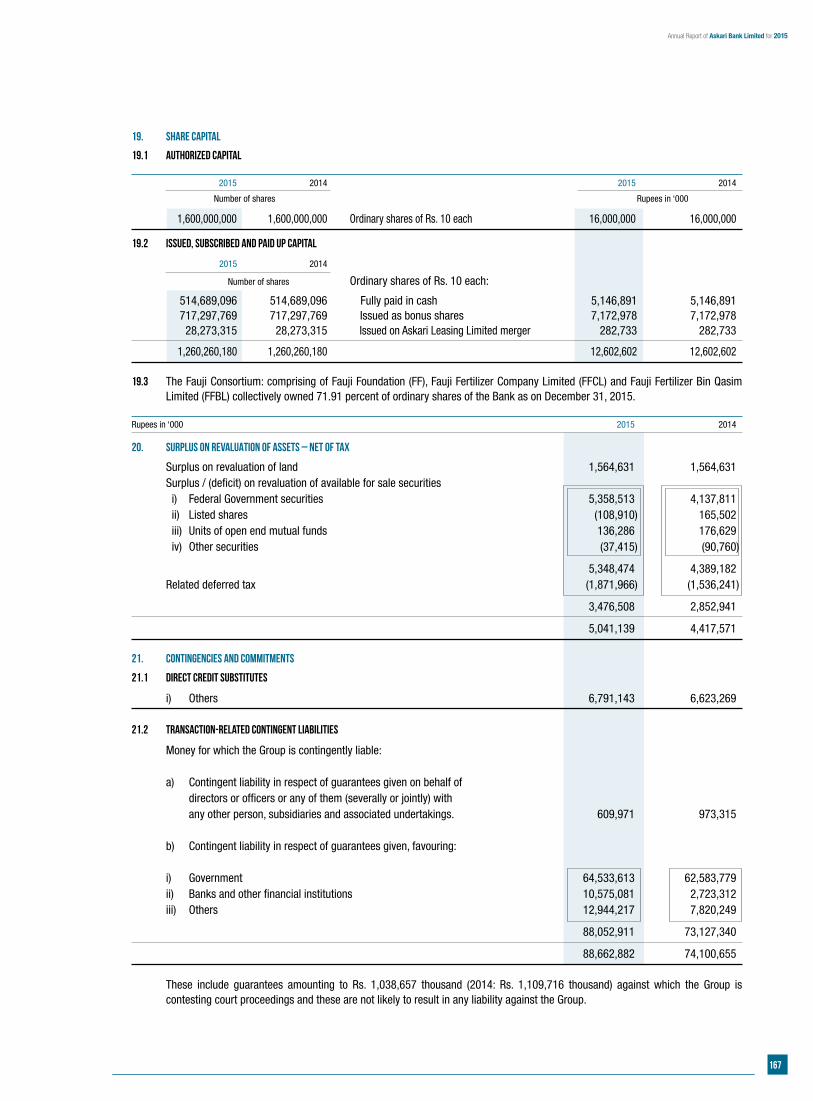
167
Annual Report of Askari Bank Limited for 2015
19. share capital
19.1 Authorized capital
2015 2014 2015 2014
Number of shares Rupees in ‘000
1,600,000,000 1,600,000,000 Ordinary shares of Rs. 10 each 16,000,000 16,000,000
19.2 Issued, subscribed and paid up capital
2015 2014
Number of shares Ordinary shares of Rs. 10 each:
514,689,096 514,689,096 Fully paid in cash 5,146,891 5,146,891 717,297,769 717,297,769 Issued as bonus shares 7,172,978 7,172,978 28,273,315 28,273,315 Issued on Askari Leasing Limited merger 282,733 282,733
1,260,260,180 1,260,260,180 12,602,602 12,602,602
19.3 The Fauji Consortium: comprising of Fauji Foundation (FF), Fauji Fertilizer Company Limited (FFCL) and Fauji Fertilizer Bin Qasim Limited (FFBL) collectively owned 71.91 percent of ordinary shares of the Bank as on December 31, 2015.
Rupees in ‘000 2015 2014
20. SURPLUS ON REVALUATION OF ASSETS – NET OF TAX
Surplus on revaluation of land 1,564,631 1,564,631 Surplus / (deficit) on revaluation of available for sale securities i) Federal Government securities 5,358,513 4,137,811 ii) Listed shares (108,910) 165,502 iii) Units of open end mutual funds 136,286 176,629 iv) Other securities (37,415) (90,760)
5,348,474 4,389,182 Related deferred tax (1,871,966) (1,536,241)
3,476,508 2,852,941
5,041,139 4,417,571
21. CONTINGENCIES AND COMMITMENTS
21.1 Direct credit substitutes
i) Others 6,791,143 6,623,269 21.2 Transaction-related contingent liabilities
Money for which the Group is contingently liable: a) Contingent liability in respect of guarantees given on behalf of directors or officers or any of them (severally or jointly) with any other person, subsidiaries and associated undertakings. 609,971 973,315 b) Contingent liability in respect of guarantees given, favouring: i) Government 64,533,613 62,583,779 ii) Banks and other financial institutions 10,575,081 2,723,312 iii) Others 12,944,217 7,820,249
88,052,911 73,127,340
88,662,882 74,100,655 These include guarantees amounting to Rs. 1,038,657 thousand (2014: Rs. 1,109,716 thousand) against which the Group is
contesting court proceedings and these are not likely to result in any liability against the Group.
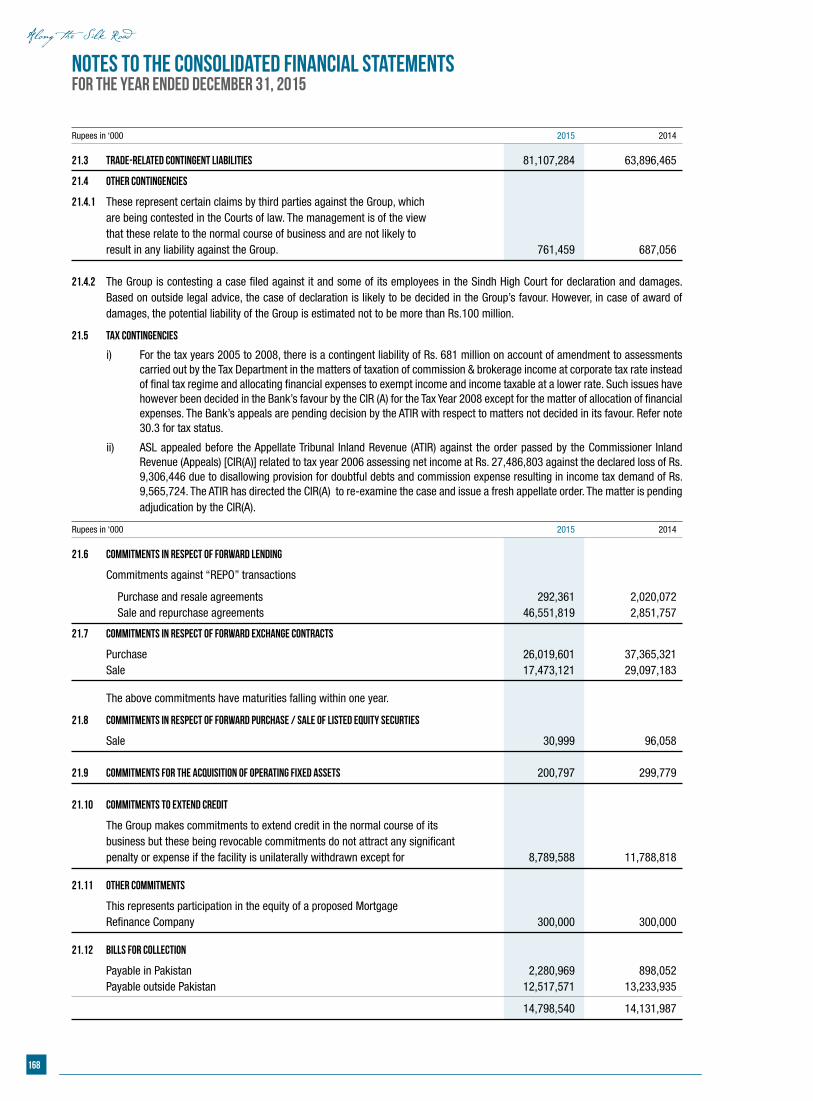
168
Notes to the consolidated Financial StatementsFor the year ended December 31, 2015
Rupees in ‘000 2015 2014
21.3 Trade-related contingent liabilities 81,107,284 63,896,465
21.4 Other contingencies
21.4.1 These represent certain claims by third parties against the Group, which are being contested in the Courts of law. The management is of the view that these relate to the normal course of business and are not likely to result in any liability against the Group. 761,459 687,056 21.4.2 The Group is contesting a case filed against it and some of its employees in the Sindh High Court for declaration and damages.
Based on outside legal advice, the case of declaration is likely to be decided in the Group’s favour. However, in case of award of damages, the potential liability of the Group is estimated not to be more than Rs.100 million.
21.5 Tax Contingencies
i) For the tax years 2005 to 2008, there is a contingent liability of Rs. 681 million on account of amendment to assessments carried out by the Tax Department in the matters of taxation of commission & brokerage income at corporate tax rate instead of final tax regime and allocating financial expenses to exempt income and income taxable at a lower rate. Such issues have however been decided in the Bank’s favour by the CIR (A) for the Tax Year 2008 except for the matter of allocation of financial expenses. The Bank’s appeals are pending decision by the ATIR with respect to matters not decided in its favour. Refer note 30.3 for tax status.
ii) ASL appealed before the Appellate Tribunal Inland Revenue (ATIR) against the order passed by the Commissioner Inland Revenue (Appeals) [CIR(A)] related to tax year 2006 assessing net income at Rs. 27,486,803 against the declared loss of Rs. 9,306,446 due to disallowing provision for doubtful debts and commission expense resulting in income tax demand of Rs. 9,565,724. The ATIR has directed the CIR(A) to re-examine the case and issue a fresh appellate order. The matter is pending adjudication by the CIR(A).
Rupees in ‘000 2015 2014
21.6 Commitments in respect of forward lending
Commitments against “REPO” transactions
Purchase and resale agreements 292,361 2,020,072 Sale and repurchase agreements 46,551,819 2,851,757
21.7 Commitments in respect of forward exchange contracts
Purchase 26,019,601 37,365,321 Sale 17,473,121 29,097,183
The above commitments have maturities falling within one year.
21.8 Commitments in respect of forward purchase / sale of listed equity securties
Sale 30,999 96,058
21.9 Commitments for the acquisition of operating fixed assets 200,797 299,779
21.10 Commitments to extend credit
The Group makes commitments to extend credit in the normal course of its business but these being revocable commitments do not attract any significant penalty or expense if the facility is unilaterally withdrawn except for 8,789,588 11,788,818
21.11 Other commitments
This represents participation in the equity of a proposed Mortgage Refinance Company 300,000 300,000
21.12 Bills for collection
Payable in Pakistan 2,280,969 898,052 Payable outside Pakistan 12,517,571 13,233,935
14,798,540 14,131,987
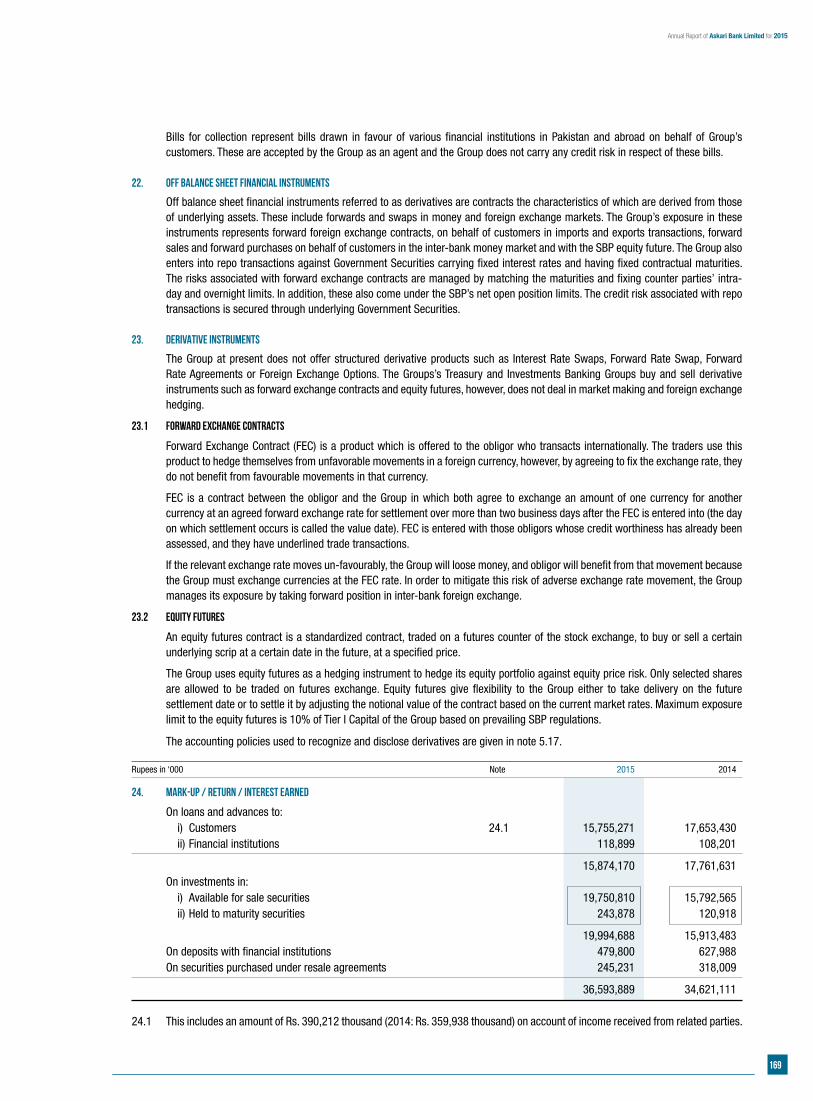
169
Annual Report of Askari Bank Limited for 2015
Bills for collection represent bills drawn in favour of various financial institutions in Pakistan and abroad on behalf of Group’s customers. These are accepted by the Group as an agent and the Group does not carry any credit risk in respect of these bills.
22. OFF BALANCE SHEET FINANCIAL INSTRUMENTS
Off balance sheet financial instruments referred to as derivatives are contracts the characteristics of which are derived from those of underlying assets. These include forwards and swaps in money and foreign exchange markets. The Group’s exposure in these instruments represents forward foreign exchange contracts, on behalf of customers in imports and exports transactions, forward sales and forward purchases on behalf of customers in the inter-bank money market and with the SBP equity future. The Group also enters into repo transactions against Government Securities carrying fixed interest rates and having fixed contractual maturities. The risks associated with forward exchange contracts are managed by matching the maturities and fixing counter parties’ intra-day and overnight limits. In addition, these also come under the SBP’s net open position limits. The credit risk associated with repo transactions is secured through underlying Government Securities.
23. DERIVATIVE INSTRUMENTS
The Group at present does not offer structured derivative products such as Interest Rate Swaps, Forward Rate Swap, Forward Rate Agreements or Foreign Exchange Options. The Groups’s Treasury and Investments Banking Groups buy and sell derivative instruments such as forward exchange contracts and equity futures, however, does not deal in market making and foreign exchange hedging.
23.1 Forward exchange contracts
Forward Exchange Contract (FEC) is a product which is offered to the obligor who transacts internationally. The traders use this product to hedge themselves from unfavorable movements in a foreign currency, however, by agreeing to fix the exchange rate, they do not benefit from favourable movements in that currency.
FEC is a contract between the obligor and the Group in which both agree to exchange an amount of one currency for another currency at an agreed forward exchange rate for settlement over more than two business days after the FEC is entered into (the day on which settlement occurs is called the value date). FEC is entered with those obligors whose credit worthiness has already been assessed, and they have underlined trade transactions.
If the relevant exchange rate moves un-favourably, the Group will loose money, and obligor will benefit from that movement because the Group must exchange currencies at the FEC rate. In order to mitigate this risk of adverse exchange rate movement, the Group manages its exposure by taking forward position in inter-bank foreign exchange.
23.2 Equity futures
An equity futures contract is a standardized contract, traded on a futures counter of the stock exchange, to buy or sell a certain underlying scrip at a certain date in the future, at a specified price.
The Group uses equity futures as a hedging instrument to hedge its equity portfolio against equity price risk. Only selected shares are allowed to be traded on futures exchange. Equity futures give flexibility to the Group either to take delivery on the future settlement date or to settle it by adjusting the notional value of the contract based on the current market rates. Maximum exposure limit to the equity futures is 10% of Tier I Capital of the Group based on prevailing SBP regulations.
The accounting policies used to recognize and disclose derivatives are given in note 5.17.
Rupees in ‘000 Note 2015 2014
24. MARK-UP / RETURN / INTEREST EARNED
On loans and advances to: i) Customers 24.1 15,755,271 17,653,430 ii) Financial institutions 118,899 108,201
15,874,170 17,761,631 On investments in: i) Available for sale securities 19,750,810 15,792,565 ii) Held to maturity securities 243,878 120,918
19,994,688 15,913,483 On deposits with financial institutions 479,800 627,988 On securities purchased under resale agreements 245,231 318,009
36,593,889 34,621,111 24.1 This includes an amount of Rs. 390,212 thousand (2014: Rs. 359,938 thousand) on account of income received from related parties.
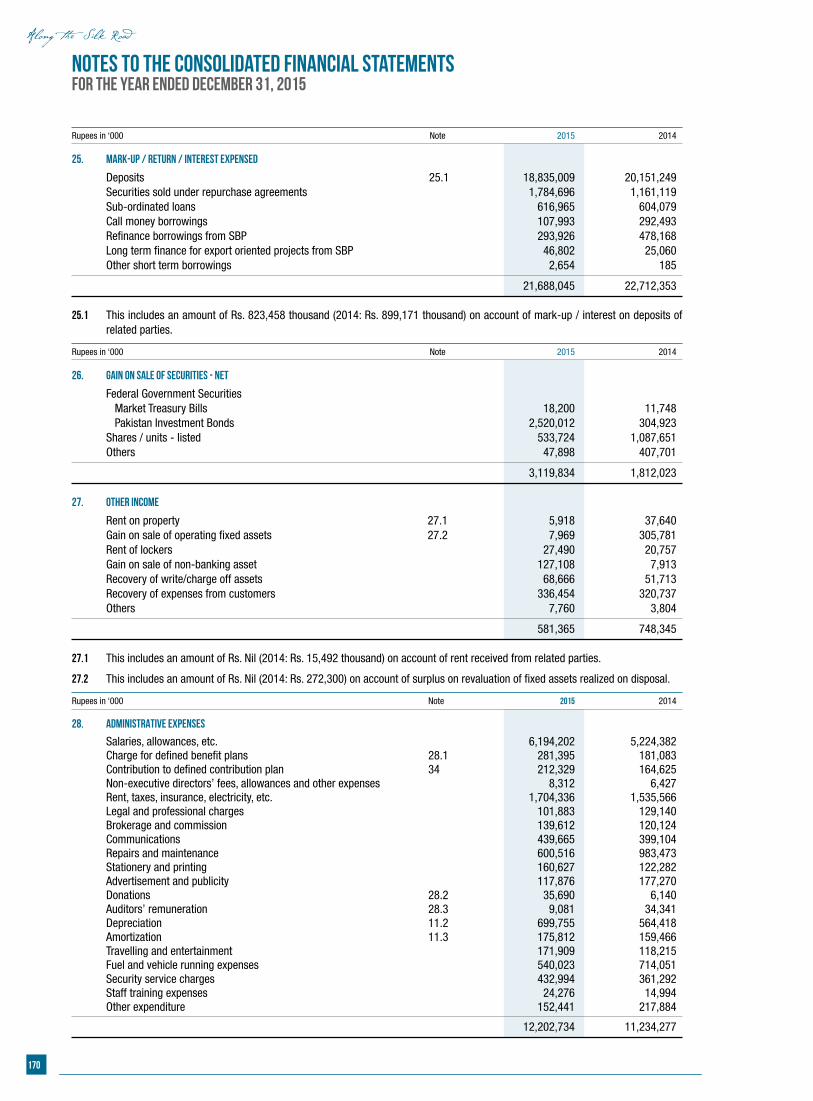
170
Notes to the consolidated Financial StatementsFor the year ended December 31, 2015
Rupees in ‘000 Note 2015 2014
25. MARK-UP / RETURN / INTEREST EXPENSED
Deposits 25.1 18,835,009 20,151,249 Securities sold under repurchase agreements 1,784,696 1,161,119 Sub-ordinated loans 616,965 604,079 Call money borrowings 107,993 292,493 Refinance borrowings from SBP 293,926 478,168 Long term finance for export oriented projects from SBP 46,802 25,060 Other short term borrowings 2,654 185
21,688,045 22,712,353 25.1 This includes an amount of Rs. 823,458 thousand (2014: Rs. 899,171 thousand) on account of mark-up / interest on deposits of
related parties.
Rupees in ‘000 Note 2015 2014
26. GAIN ON SALE OF SECURITIES - NET
Federal Government Securities Market Treasury Bills 18,200 11,748 Pakistan Investment Bonds 2,520,012 304,923 Shares / units - listed 533,724 1,087,651 Others 47,898 407,701
3,119,834 1,812,023 27. OTHER INCOME
Rent on property 27.1 5,918 37,640 Gain on sale of operating fixed assets 27.2 7,969 305,781 Rent of lockers 27,490 20,757 Gain on sale of non-banking asset 127,108 7,913 Recovery of write/charge off assets 68,666 51,713 Recovery of expenses from customers 336,454 320,737 Others 7,760 3,804
581,365 748,345 27.1 This includes an amount of Rs. Nil (2014: Rs. 15,492 thousand) on account of rent received from related parties.
27.2 This includes an amount of Rs. Nil (2014: Rs. 272,300) on account of surplus on revaluation of fixed assets realized on disposal.
Rupees in ‘000 Note 2015 2014
28. ADMINISTRATIVE EXPENSES Salaries, allowances, etc. 6,194,202 5,224,382 Charge for defined benefit plans 28.1 281,395 181,083 Contribution to defined contribution plan 34 212,329 164,625 Non-executive directors’ fees, allowances and other expenses 8,312 6,427 Rent, taxes, insurance, electricity, etc. 1,704,336 1,535,566 Legal and professional charges 101,883 129,140 Brokerage and commission 139,612 120,124 Communications 439,665 399,104 Repairs and maintenance 600,516 983,473 Stationery and printing 160,627 122,282 Advertisement and publicity 117,876 177,270 Donations 28.2 35,690 6,140 Auditors’ remuneration 28.3 9,081 34,341 Depreciation 11.2 699,755 564,418 Amortization 11.3 175,812 159,466 Travelling and entertainment 171,909 118,215 Fuel and vehicle running expenses 540,023 714,051 Security service charges 432,994 361,292 Staff training expenses 24,276 14,994 Other expenditure 152,441 217,884
12,202,734 11,234,277
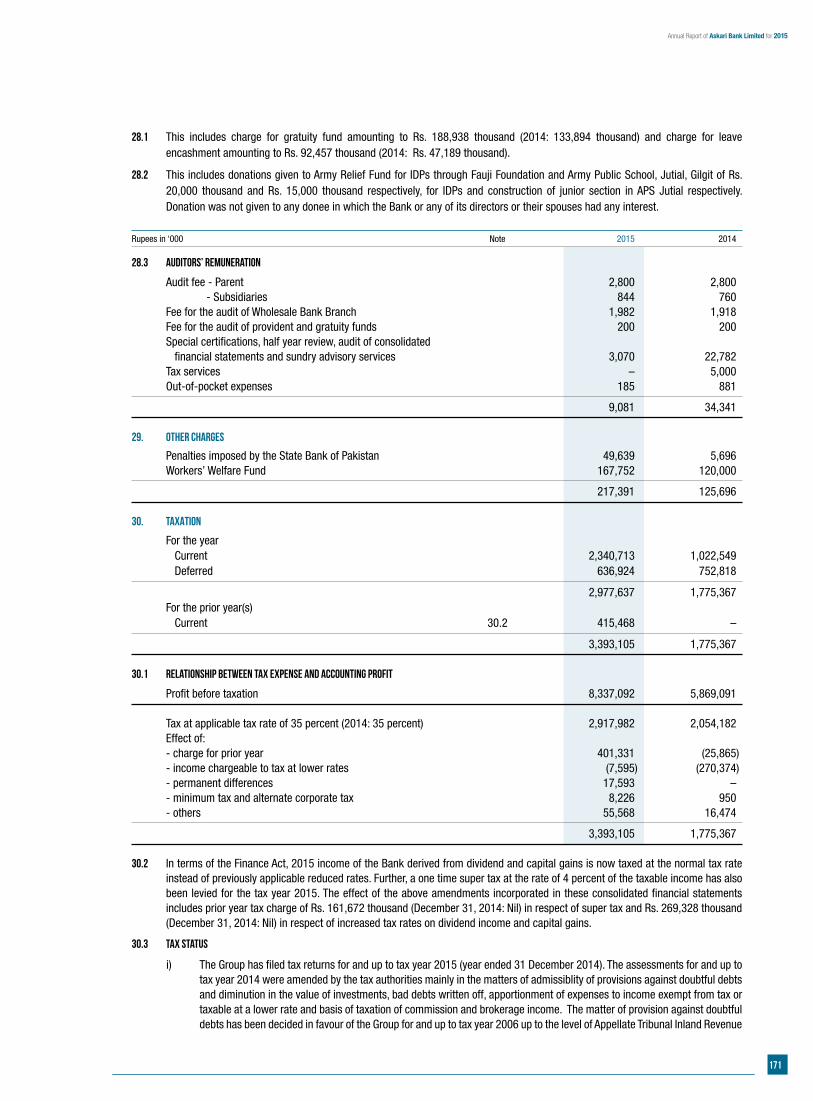
171
Annual Report of Askari Bank Limited for 2015
28.1 This includes charge for gratuity fund amounting to Rs. 188,938 thousand (2014: 133,894 thousand) and charge for leave encashment amounting to Rs. 92,457 thousand (2014: Rs. 47,189 thousand).
28.2 This includes donations given to Army Relief Fund for IDPs through Fauji Foundation and Army Public School, Jutial, Gilgit of Rs. 20,000 thousand and Rs. 15,000 thousand respectively, for IDPs and construction of junior section in APS Jutial respectively. Donation was not given to any donee in which the Bank or any of its directors or their spouses had any interest.
Rupees in ‘000 Note 2015 2014
28.3 Auditors’ remuneration
Audit fee - Parent 2,800 2,800 - Subsidiaries 844 760 Fee for the audit of Wholesale Bank Branch 1,982 1,918 Fee for the audit of provident and gratuity funds 200 200 Special certifications, half year review, audit of consolidated financial statements and sundry advisory services 3,070 22,782 Tax services – 5,000 Out-of-pocket expenses 185 881
9,081 34,341 29. OTHER CHARGES
Penalties imposed by the State Bank of Pakistan 49,639 5,696 Workers’ Welfare Fund 167,752 120,000
217,391 125,696 30. TAXATION
For the year Current 2,340,713 1,022,549 Deferred 636,924 752,818
2,977,637 1,775,367 For the prior year(s) Current 30.2 415,468 –
3,393,105 1,775,367 30.1 Relationship between tax expense and accounting profit
Profit before taxation 8,337,092 5,869,091 Tax at applicable tax rate of 35 percent (2014: 35 percent) 2,917,982 2,054,182 Effect of: - charge for prior year 401,331 (25,865) - income chargeable to tax at lower rates (7,595) (270,374) - permanent differences 17,593 – - minimum tax and alternate corporate tax 8,226 950 - others 55,568 16,474
3,393,105 1,775,367 30.2 In terms of the Finance Act, 2015 income of the Bank derived from dividend and capital gains is now taxed at the normal tax rate
instead of previously applicable reduced rates. Further, a one time super tax at the rate of 4 percent of the taxable income has also been levied for the tax year 2015. The effect of the above amendments incorporated in these consolidated financial statements includes prior year tax charge of Rs. 161,672 thousand (December 31, 2014: Nil) in respect of super tax and Rs. 269,328 thousand (December 31, 2014: Nil) in respect of increased tax rates on dividend income and capital gains.
30.3 Tax status
i) The Group has filed tax returns for and up to tax year 2015 (year ended 31 December 2014). The assessments for and up to tax year 2014 were amended by the tax authorities mainly in the matters of admissiblity of provisions against doubtful debts and diminution in the value of investments, bad debts written off, apportionment of expenses to income exempt from tax or taxable at a lower rate and basis of taxation of commission and brokerage income. The matter of provision against doubtful debts has been decided in favour of the Group for and up to tax year 2006 up to the level of Appellate Tribunal Inland Revenue
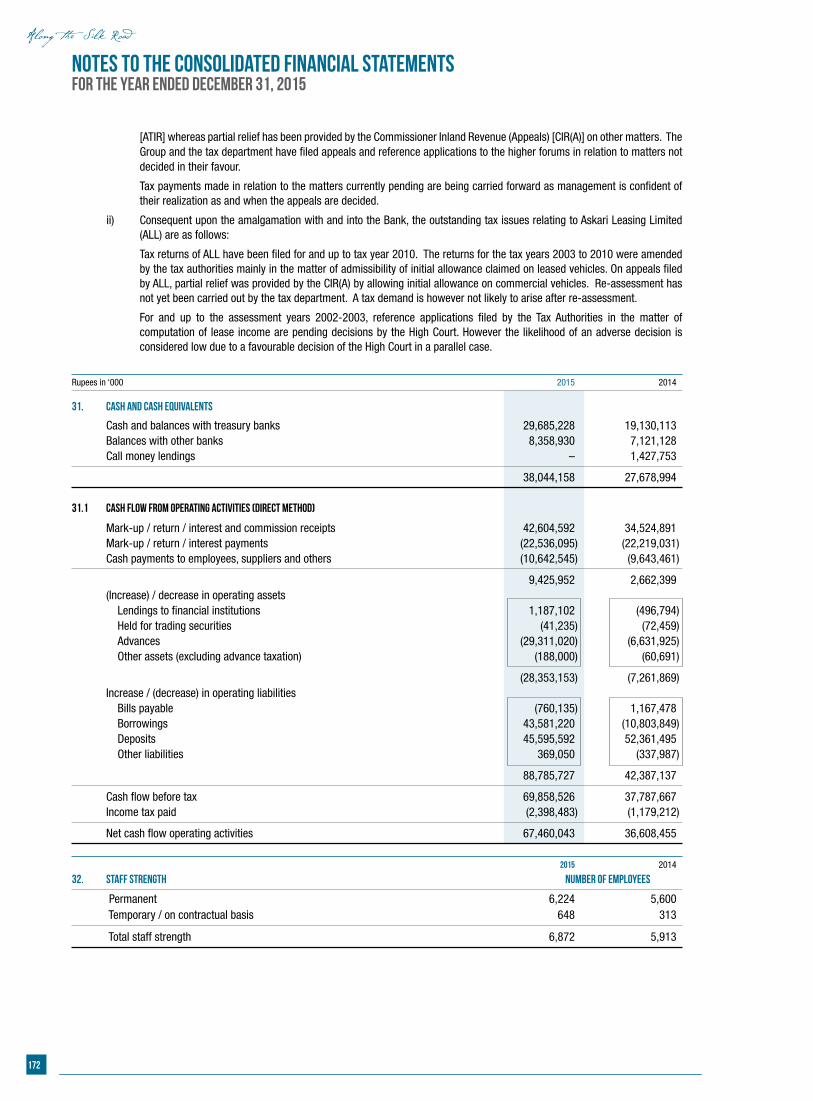
172
Notes to the consolidated Financial StatementsFor the year ended December 31, 2015
[ATIR] whereas partial relief has been provided by the Commissioner Inland Revenue (Appeals) [CIR(A)] on other matters. The Group and the tax department have filed appeals and reference applications to the higher forums in relation to matters not decided in their favour.
Tax payments made in relation to the matters currently pending are being carried forward as management is confident of their realization as and when the appeals are decided.
ii) Consequent upon the amalgamation with and into the Bank, the outstanding tax issues relating to Askari Leasing Limited (ALL) are as follows:
Tax returns of ALL have been filed for and up to tax year 2010. The returns for the tax years 2003 to 2010 were amended by the tax authorities mainly in the matter of admissibility of initial allowance claimed on leased vehicles. On appeals filed by ALL, partial relief was provided by the CIR(A) by allowing initial allowance on commercial vehicles. Re-assessment has not yet been carried out by the tax department. A tax demand is however not likely to arise after re-assessment.
For and up to the assessment years 2002-2003, reference applications filed by the Tax Authorities in the matter of computation of lease income are pending decisions by the High Court. However the likelihood of an adverse decision is considered low due to a favourable decision of the High Court in a parallel case.
Rupees in ‘000 2015 2014
31. CASH AND CASH EQUIVALENTS
Cash and balances with treasury banks 29,685,228 19,130,113 Balances with other banks 8,358,930 7,121,128 Call money lendings – 1,427,753
38,044,158 27,678,994 31.1 Cash flow from operating activities (Direct method)
Mark-up / return / interest and commission receipts 42,604,592 34,524,891 Mark-up / return / interest payments (22,536,095) (22,219,031) Cash payments to employees, suppliers and others (10,642,545) (9,643,461)
9,425,952 2,662,399 (Increase) / decrease in operating assets Lendings to financial institutions 1,187,102 (496,794) Held for trading securities (41,235) (72,459) Advances (29,311,020) (6,631,925) Other assets (excluding advance taxation) (188,000) (60,691)
(28,353,153) (7,261,869) Increase / (decrease) in operating liabilities Bills payable (760,135) 1,167,478 Borrowings 43,581,220 (10,803,849) Deposits 45,595,592 52,361,495 Other liabilities 369,050 (337,987)
88,785,727 42,387,137
Cash flow before tax 69,858,526 37,787,667 Income tax paid (2,398,483) (1,179,212)
Net cash flow operating activities 67,460,043 36,608,455
2015 2014
32. STAFF STRENGTH Number of employees
Permanent 6,224 5,600 Temporary / on contractual basis 648 313
Total staff strength 6,872 5,913
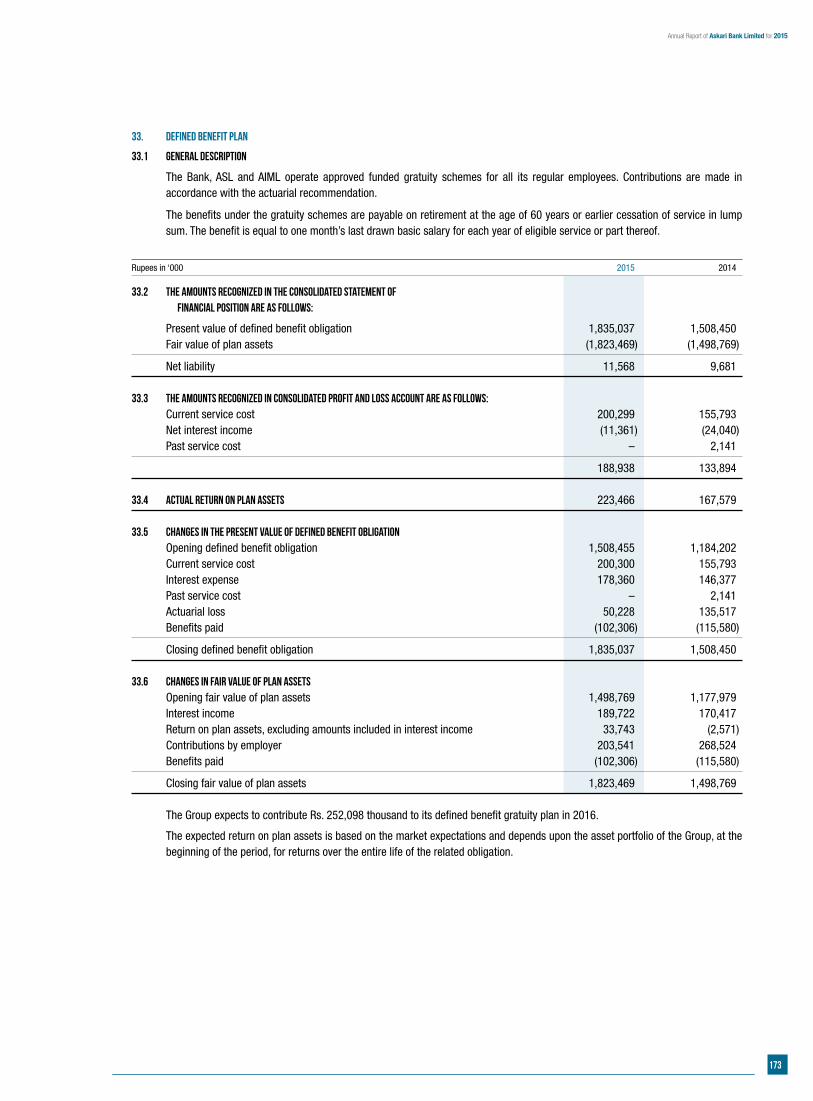
173
Annual Report of Askari Bank Limited for 2015
33. DEFINED BENEFIT PLAN
33.1 General description
The Bank, ASL and AIML operate approved funded gratuity schemes for all its regular employees. Contributions are made in accordance with the actuarial recommendation.
The benefits under the gratuity schemes are payable on retirement at the age of 60 years or earlier cessation of service in lump sum. The benefit is equal to one month’s last drawn basic salary for each year of eligible service or part thereof.
Rupees in ‘000 2015 2014
33.2 The amounts recognized in the consolidated statement of financial position are as follows:
Present value of defined benefit obligation 1,835,037 1,508,450 Fair value of plan assets (1,823,469) (1,498,769)
Net liability 11,568 9,681 33.3 The amounts recognized in consolidated profit and loss account are as follows: Current service cost 200,299 155,793 Net interest income (11,361) (24,040) Past service cost – 2,141
188,938 133,894 33.4 Actual return on plan assets 223,466 167,579 33.5 Changes in the present value of defined benefit obligation Opening defined benefit obligation 1,508,455 1,184,202 Current service cost 200,300 155,793 Interest expense 178,360 146,377 Past service cost – 2,141 Actuarial loss 50,228 135,517 Benefits paid (102,306) (115,580)
Closing defined benefit obligation 1,835,037 1,508,450 33.6 Changes in fair value of plan assets Opening fair value of plan assets 1,498,769 1,177,979 Interest income 189,722 170,417 Return on plan assets, excluding amounts included in interest income 33,743 (2,571) Contributions by employer 203,541 268,524 Benefits paid (102,306) (115,580)
Closing fair value of plan assets 1,823,469 1,498,769 The Group expects to contribute Rs. 252,098 thousand to its defined benefit gratuity plan in 2016.
The expected return on plan assets is based on the market expectations and depends upon the asset portfolio of the Group, at the beginning of the period, for returns over the entire life of the related obligation.
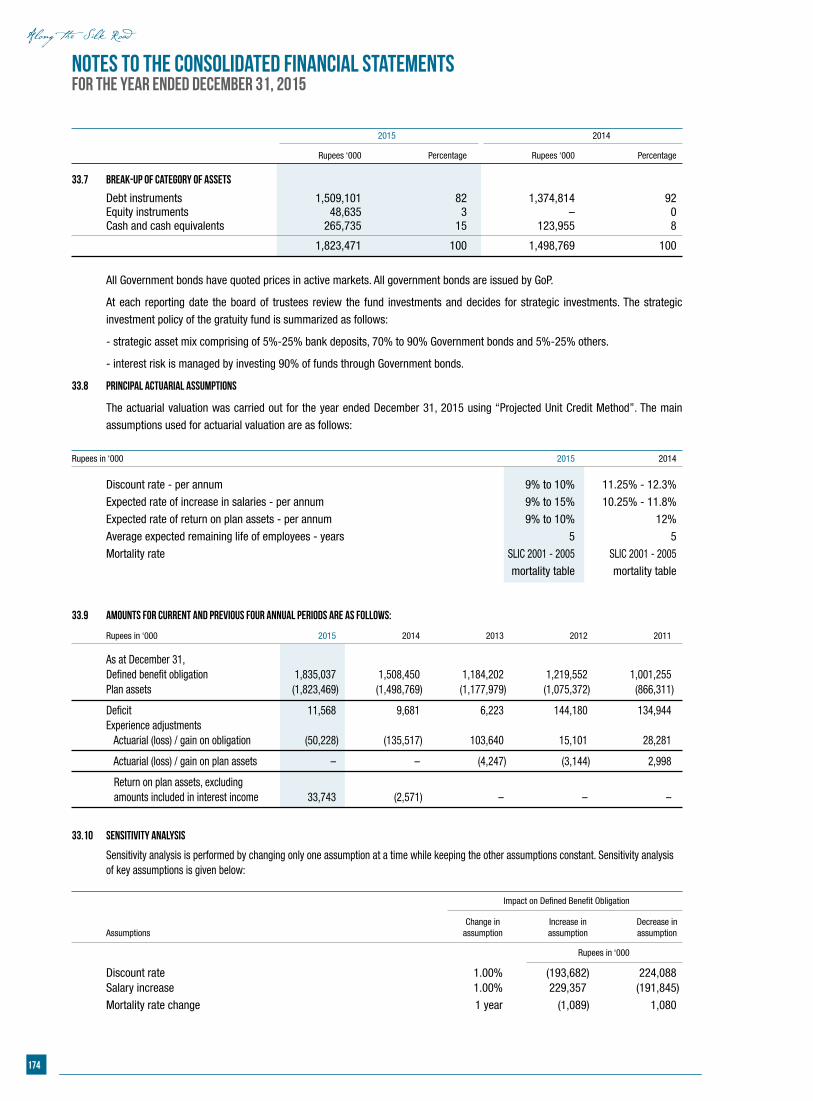
174
Notes to the consolidated Financial StatementsFor the year ended December 31, 2015
2015 2014
Rupees ‘000 Percentage Rupees ‘000 Percentage
33.7 Break-up of category of assets
Debt instruments 1,509,101 82 1,374,814 92 Equity instruments 48,635 3 – 0 Cash and cash equivalents 265,735 15 123,955 8
1,823,471 100 1,498,769 100
All Government bonds have quoted prices in active markets. All government bonds are issued by GoP.
At each reporting date the board of trustees review the fund investments and decides for strategic investments. The strategic
investment policy of the gratuity fund is summarized as follows:
- strategic asset mix comprising of 5%-25% bank deposits, 70% to 90% Government bonds and 5%-25% others.
- interest risk is managed by investing 90% of funds through Government bonds.
33.8 Principal actuarial assumptions
The actuarial valuation was carried out for the year ended December 31, 2015 using “Projected Unit Credit Method”. The main
assumptions used for actuarial valuation are as follows:
Rupees in ‘000 2015 2014
Discount rate - per annum 9% to 10% 11.25% - 12.3%
Expected rate of increase in salaries - per annum 9% to 15% 10.25% - 11.8%
Expected rate of return on plan assets - per annum 9% to 10% 12%
Average expected remaining life of employees - years 5 5
Mortality rate SLIC 2001 - 2005 SLIC 2001 - 2005
mortality table mortality table
33.9 Amounts for current and previous four annual periods are as follows:
Rupees in ‘000 2015 2014 2013 2012 2011
As at December 31, Defined benefit obligation 1,835,037 1,508,450 1,184,202 1,219,552 1,001,255 Plan assets (1,823,469) (1,498,769) (1,177,979) (1,075,372) (866,311)
Deficit 11,568 9,681 6,223 144,180 134,944 Experience adjustments Actuarial (loss) / gain on obligation (50,228) (135,517) 103,640 15,101 28,281
Actuarial (loss) / gain on plan assets – – (4,247) (3,144) 2,998
Return on plan assets, excluding amounts included in interest income 33,743 (2,571) – – –
33.10 Sensitivity analysis
Sensitivity analysis is performed by changing only one assumption at a time while keeping the other assumptions constant. Sensitivity analysis of key assumptions is given below:
Impact on Defined Benefit Obligation
Change in Increase in Decrease in Assumptions assumption assumption assumption
Rupees in ‘000
Discount rate 1.00% (193,682) 224,088 Salary increase 1.00% 229,357 (191,845)
Mortality rate change 1 year (1,089) 1,080
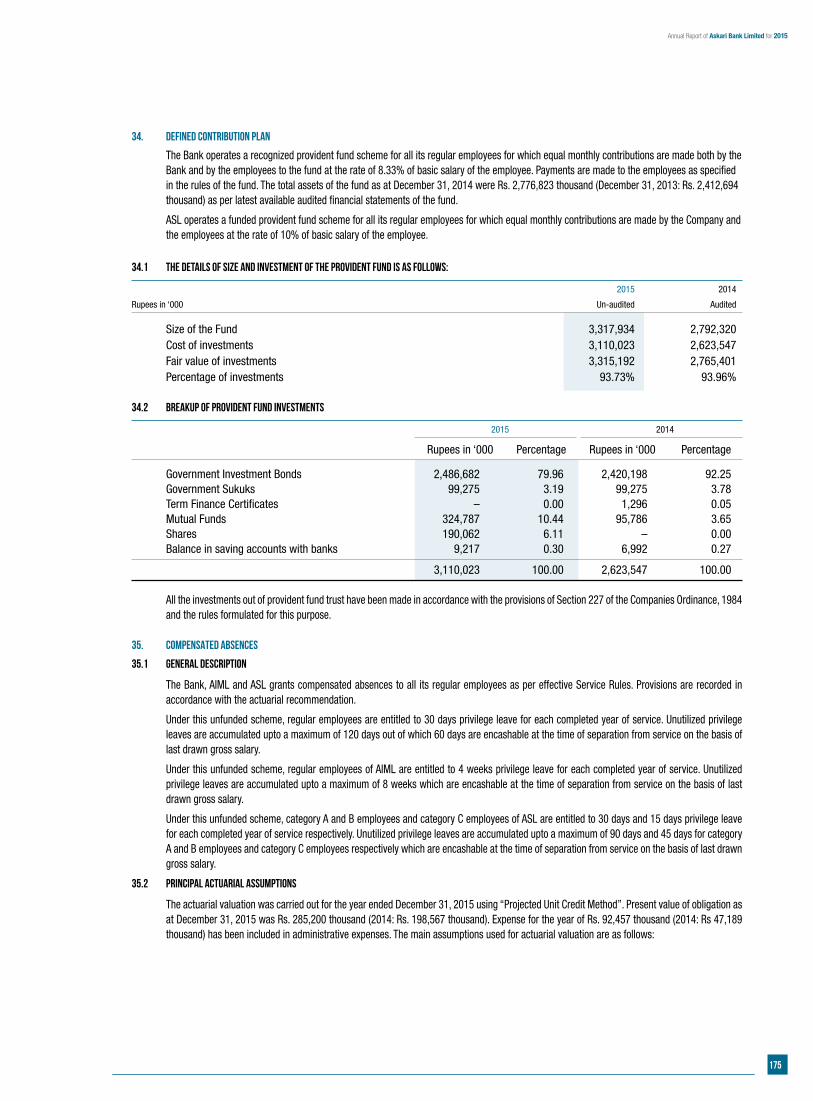
175
Annual Report of Askari Bank Limited for 2015
34. DEFINED CONTRIBUTION PLAN
The Bank operates a recognized provident fund scheme for all its regular employees for which equal monthly contributions are made both by the Bank and by the employees to the fund at the rate of 8.33% of basic salary of the employee. Payments are made to the employees as specified in the rules of the fund. The total assets of the fund as at December 31, 2014 were Rs. 2,776,823 thousand (December 31, 2013: Rs. 2,412,694 thousand) as per latest available audited financial statements of the fund.
ASL operates a funded provident fund scheme for all its regular employees for which equal monthly contributions are made by the Company and the employees at the rate of 10% of basic salary of the employee.
34.1 The details of size and investment of the provident fund is as follows:
2015 2014
Rupees in ‘000 Un-audited Audited
Size of the Fund 3,317,934 2,792,320 Cost of investments 3,110,023 2,623,547 Fair value of investments 3,315,192 2,765,401 Percentage of investments 93.73% 93.96% 34.2 Breakup of provident fund investments
2015 2014
Rupees in ‘000 Percentage Rupees in ‘000 Percentage
Government Investment Bonds 2,486,682 79.96 2,420,198 92.25 Government Sukuks 99,275 3.19 99,275 3.78 Term Finance Certificates – 0.00 1,296 0.05 Mutual Funds 324,787 10.44 95,786 3.65 Shares 190,062 6.11 – 0.00 Balance in saving accounts with banks 9,217 0.30 6,992 0.27
3,110,023 100.00 2,623,547 100.00 All the investments out of provident fund trust have been made in accordance with the provisions of Section 227 of the Companies Ordinance, 1984
and the rules formulated for this purpose. 35. COMPENSATED ABSENCES
35.1 General description
The Bank, AIML and ASL grants compensated absences to all its regular employees as per effective Service Rules. Provisions are recorded in accordance with the actuarial recommendation.
Under this unfunded scheme, regular employees are entitled to 30 days privilege leave for each completed year of service. Unutilized privilege leaves are accumulated upto a maximum of 120 days out of which 60 days are encashable at the time of separation from service on the basis of last drawn gross salary.
Under this unfunded scheme, regular employees of AIML are entitled to 4 weeks privilege leave for each completed year of service. Unutilized privilege leaves are accumulated upto a maximum of 8 weeks which are encashable at the time of separation from service on the basis of last drawn gross salary.
Under this unfunded scheme, category A and B employees and category C employees of ASL are entitled to 30 days and 15 days privilege leave for each completed year of service respectively. Unutilized privilege leaves are accumulated upto a maximum of 90 days and 45 days for category A and B employees and category C employees respectively which are encashable at the time of separation from service on the basis of last drawn gross salary.
35.2 Principal actuarial assumptions
The actuarial valuation was carried out for the year ended December 31, 2015 using “Projected Unit Credit Method”. Present value of obligation as at December 31, 2015 was Rs. 285,200 thousand (2014: Rs. 198,567 thousand). Expense for the year of Rs. 92,457 thousand (2014: Rs 47,189 thousand) has been included in administrative expenses. The main assumptions used for actuarial valuation are as follows:

176
Notes to the consolidated Financial StatementsFor the year ended December 31, 2015
Rupees in ‘000 2015 2014
Discount rate - per annum 9.25% - 10% 11.25% - 12.3% Expected rate of increase in salaries - per annum 9% - 15% 10.25% - 11.8% Leave accumulation factor - days 5 - 11 5 - 11
36. COMPENSATION OF DIRECTORS AND EXECUTIVES
President & Chief Executive Directors Executives
Rupees in ‘000 2015 2014 2015 2014 2015 2014
Fees – – 8,522 6,374 – – Managerial remuneration 38,700 20,280 – – 1,292,636 1,140,376 Allowances 4,125 2,408 – – 215,568 165,274 Charge for defined benefit plan 3,000 1,680 – – 76,093 65,828 Contribution to defined contribution plan 2,999 1,219 – – 78,693 62,606 Rent and house maintenance 10,800 6,240 – – 441,570 358,503 Utilities 2,970 2,028 – – 103,991 87,536 Medical 2,700 1,872 – – 94,787 78,364 Adhoc relief / bonus 9,000 8,400 – – 207,667 131,462
74,294 44,127 8,522 6,374 2,511,005 2,089,949
Number of persons 1 1 10 10 722 685 Executives mean all executive employees, other than the President & Chief Executive, whose annual basic salary exceeds rupees
five hundred thousand. President & Chief Executive and certain other executives are provided with the Bank maintained vehicles.
Further, senior executives are entitled to certain additional benefits in accordance with the Group’s policy. 37. FAIR VALUE OF FINANCIAL INSTRUMENTS
The fair value of quoted investments is based on quoted market prices and rates quoted at Reuters Pages (PKRV) with the exception of unlisted securities.
Fair value of remaining financial assets and liabilities except fixed term loans, staff loans, non-performing advances and fixed term deposits is not significantly different from the carrying amounts since assets and liabilities are either short term in nature or are frequently repriced in the case of customer loans and deposits.
Fair value of fixed term loans, staff loans, and fixed term deposits cannot be calculated with sufficient reliability due to absence of current and active market for such assets / liabilities and reliable data regarding market rates for similar instruments. The provision for non-performing advances is calculated in accordance with the Group’s accounting policy as stated in note 5.6. The effective rates and maturity profile are stated in note 42.2.5 and 42.3.1 respectively.
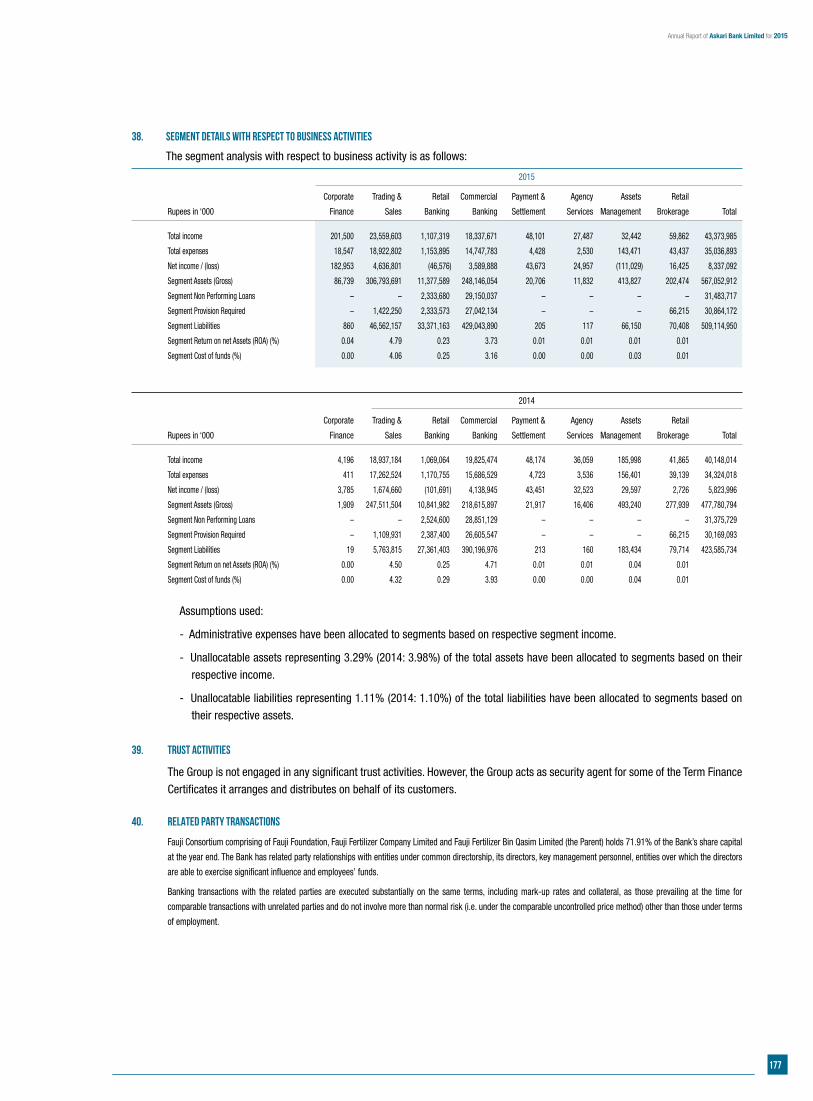
177
Annual Report of Askari Bank Limited for 2015
38. SEGMENT DETAILS WITH RESPECT TO BUSINESS ACTIVITIES
The segment analysis with respect to business activity is as follows:
2015
Corporate Trading & Retail Commercial Payment & Agency Assets Retail
Rupees in ‘000 Finance Sales Banking Banking Settlement Services Management Brokerage Total
Total income 201,500 23,559,603 1,107,319 18,337,671 48,101 27,487 32,442 59,862 43,373,985
Total expenses 18,547 18,922,802 1,153,895 14,747,783 4,428 2,530 143,471 43,437 35,036,893
Net income / (loss) 182,953 4,636,801 (46,576) 3,589,888 43,673 24,957 (111,029) 16,425 8,337,092
Segment Assets (Gross) 86,739 306,793,691 11,377,589 248,146,054 20,706 11,832 413,827 202,474 567,052,912
Segment Non Performing Loans – – 2,333,680 29,150,037 – – – – 31,483,717
Segment Provision Required – 1,422,250 2,333,573 27,042,134 – – – 66,215 30,864,172
Segment Liabilities 860 46,562,157 33,371,163 429,043,890 205 117 66,150 70,408 509,114,950
Segment Return on net Assets (ROA) (%) 0.04 4.79 0.23 3.73 0.01 0.01 0.01 0.01
Segment Cost of funds (%) 0.00 4.06 0.25 3.16 0.00 0.00 0.03 0.01
2014
Corporate Trading & Retail Commercial Payment & Agency Assets Retail
Rupees in ‘000 Finance Sales Banking Banking Settlement Services Management Brokerage Total
Total income 4,196 18,937,184 1,069,064 19,825,474 48,174 36,059 185,998 41,865 40,148,014
Total expenses 411 17,262,524 1,170,755 15,686,529 4,723 3,536 156,401 39,139 34,324,018
Net income / (loss) 3,785 1,674,660 (101,691) 4,138,945 43,451 32,523 29,597 2,726 5,823,996
Segment Assets (Gross) 1,909 247,511,504 10,841,982 218,615,897 21,917 16,406 493,240 277,939 477,780,794
Segment Non Performing Loans – – 2,524,600 28,851,129 – – – – 31,375,729
Segment Provision Required – 1,109,931 2,387,400 26,605,547 – – – 66,215 30,169,093
Segment Liabilities 19 5,763,815 27,361,403 390,196,976 213 160 183,434 79,714 423,585,734
Segment Return on net Assets (ROA) (%) 0.00 4.50 0.25 4.71 0.01 0.01 0.04 0.01
Segment Cost of funds (%) 0.00 4.32 0.29 3.93 0.00 0.00 0.04 0.01
Assumptions used:
- Administrative expenses have been allocated to segments based on respective segment income.
- Unallocatable assets representing 3.29% (2014: 3.98%) of the total assets have been allocated to segments based on their
respective income.
- Unallocatable liabilities representing 1.11% (2014: 1.10%) of the total liabilities have been allocated to segments based on
their respective assets.
39. TRUST ACTIVITIES
The Group is not engaged in any significant trust activities. However, the Group acts as security agent for some of the Term Finance
Certificates it arranges and distributes on behalf of its customers.
40. RELATED PARTY TRANSACTIONS
Fauji Consortium comprising of Fauji Foundation, Fauji Fertilizer Company Limited and Fauji Fertilizer Bin Qasim Limited (the Parent) holds 71.91% of the Bank’s share capital
at the year end. The Bank has related party relationships with entities under common directorship, its directors, key management personnel, entities over which the directors
are able to exercise significant influence and employees’ funds.
Banking transactions with the related parties are executed substantially on the same terms, including mark-up rates and collateral, as those prevailing at the time for
comparable transactions with unrelated parties and do not involve more than normal risk (i.e. under the comparable uncontrolled price method) other than those under terms
of employment.
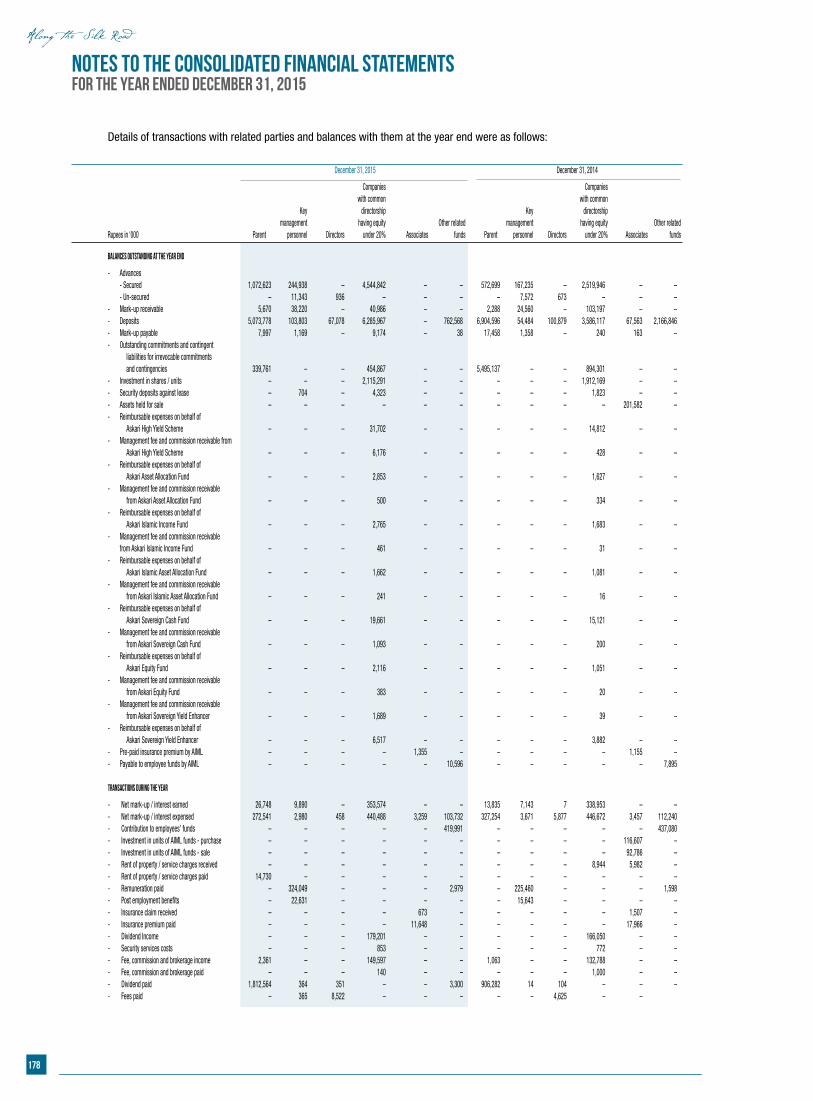
178
Notes to the consolidated Financial StatementsFor the year ended December 31, 2015
Details of transactions with related parties and balances with them at the year end were as follows:
December 31, 2015 December 31, 2014
Companies Companies with common with common Key directorship Key directorship management having equity Other related management having equity Other related Rupees in ‘000 Parent personnel Directors under 20% Associates funds Parent personnel Directors under 20% Associates funds
Balances outstanding at the year end
- Advances - Secured 1,072,623 244,938 – 4,544,842 – – 572,699 167,235 – 2,519,946 – –
- Un-secured – 11,343 936 – – – – 7,572 673 – – – - Mark-up receivable 5,670 38,220 – 40,986 – – 2,288 24,560 – 103,197 – – - Deposits 5,073,778 103,803 67,078 6,285,967 – 762,568 6,904,596 54,484 100,879 3,586,117 67,563 2,166,846 - Mark-up payable 7,997 1,169 – 9,174 – 38 17,458 1,358 – 240 163 – - Outstanding commitments and contingent liabilities for irrevocable commitments and contingencies 339,761 – – 454,867 – – 5,495,137 – – 894,301 – – - Investment in shares / units – – – 2,115,291 – – – – – 1,912,169 – – - Security deposits against lease – 704 – 4,323 – – – – – 1,823 – – - Assets held for sale – – – – – – – – – – 201,582 – - Reimbursable expenses on behalf of Askari High Yield Scheme – – – 31,702 – – – – – 14,812 – – - Management fee and commission receivable from Askari High Yield Scheme – – – 6,176 – – – – – 428 – – - Reimbursable expenses on behalf of Askari Asset Allocation Fund – – – 2,853 – – – – – 1,627 – – - Management fee and commission receivable from Askari Asset Allocation Fund – – – 500 – – – – – 334 – – - Reimbursable expenses on behalf of Askari Islamic Income Fund – – – 2,765 – – – – – 1,683 – – - Management fee and commission receivable from Askari Islamic Income Fund – – – 461 – – – – – 31 – – - Reimbursable expenses on behalf of Askari Islamic Asset Allocation Fund – – – 1,662 – – – – – 1,081 – – - Management fee and commission receivable from Askari Islamic Asset Allocation Fund – – – 241 – – – – – 16 – – - Reimbursable expenses on behalf of Askari Sovereign Cash Fund – – – 19,661 – – – – – 15,121 – – - Management fee and commission receivable from Askari Sovereign Cash Fund – – – 1,093 – – – – – 200 – – - Reimbursable expenses on behalf of Askari Equity Fund – – – 2,116 – – – – – 1,051 – – - Management fee and commission receivable from Askari Equity Fund – – – 383 – – – – – 20 – – - Management fee and commission receivable from Askari Sovereign Yield Enhancer – – – 1,689 – – – – – 39 – – - Reimbursable expenses on behalf of Askari Sovereign Yield Enhancer – – – 6,517 – – – – – 3,882 – – - Pre-paid insurance premium by AIML – – – – 1,355 – – – – – 1,155 – - Payable to employee funds by AIML – – – – – 10,596 – – – – – 7,895 Transactions during the year
- Net mark-up / interest earned 26,748 9,890 – 353,574 – – 13,835 7,143 7 338,953 – – - Net mark-up / interest expensed 272,541 2,980 458 440,488 3,259 103,732 327,254 3,671 5,877 446,672 3,457 112,240 - Contribution to employees’ funds – – – – – 419,991 – – – – – 437,080 - Investment in units of AIML funds - purchase – – – – – – – – – – 116,607 – - Investment in units of AIML funds - sale – – – – – – – – – – 92,786 – - Rent of property / service charges received – – – – – – – – – 8,944 5,982 – - Rent of property / service charges paid 14,730 – – – – – – – – – – – - Remuneration paid – 324,049 – – – 2,979 – 225,460 – – – 1,598 - Post employment benefits – 22,631 – – – – – 15,643 – – – – - Insurance claim received – – – – 673 – – – – – 1,507 – - Insurance premium paid – – – – 11,648 – – – – – 17,966 – - Dividend Income – – – 179,201 – – – – – 166,050 – – - Security services costs – – – 853 – – – – – 772 – – - Fee, commission and brokerage income 2,361 – – 149,597 – – 1,063 – – 132,788 – – - Fee, commission and brokerage paid – – – 140 – – – – – 1,000 – – - Dividend paid 1,812,564 364 351 – – 3,300 906,282 14 104 – – – - Fees paid – 365 8,522 – – – – – 4,625 – –
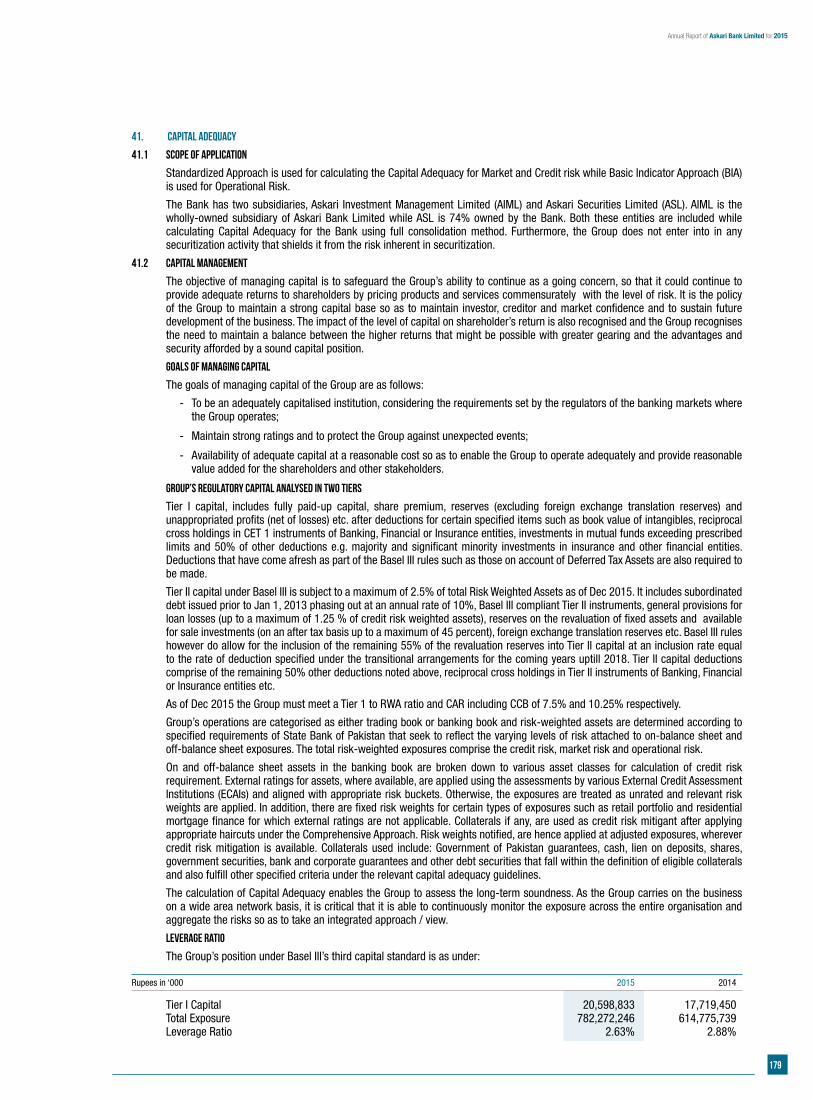
179
Annual Report of Askari Bank Limited for 2015
41. CAPITAL ADEQUACY
41.1 Scope of Application
Standardized Approach is used for calculating the Capital Adequacy for Market and Credit risk while Basic Indicator Approach (BIA) is used for Operational Risk.
The Bank has two subsidiaries, Askari Investment Management Limited (AIML) and Askari Securities Limited (ASL). AIML is the wholly-owned subsidiary of Askari Bank Limited while ASL is 74% owned by the Bank. Both these entities are included while calculating Capital Adequacy for the Bank using full consolidation method. Furthermore, the Group does not enter into in any securitization activity that shields it from the risk inherent in securitization.
41.2 Capital Management
The objective of managing capital is to safeguard the Group’s ability to continue as a going concern, so that it could continue to provide adequate returns to shareholders by pricing products and services commensurately with the level of risk. It is the policy of the Group to maintain a strong capital base so as to maintain investor, creditor and market confidence and to sustain future development of the business. The impact of the level of capital on shareholder’s return is also recognised and the Group recognises the need to maintain a balance between the higher returns that might be possible with greater gearing and the advantages and security afforded by a sound capital position.
Goals of managing capital
The goals of managing capital of the Group are as follows:
- To be an adequately capitalised institution, considering the requirements set by the regulators of the banking markets where the Group operates;
- Maintain strong ratings and to protect the Group against unexpected events;
- Availability of adequate capital at a reasonable cost so as to enable the Group to operate adequately and provide reasonable value added for the shareholders and other stakeholders.
Group’s regulatory capital analysed in two tiers
Tier I capital, includes fully paid-up capital, share premium, reserves (excluding foreign exchange translation reserves) and unappropriated profits (net of losses) etc. after deductions for certain specified items such as book value of intangibles, reciprocal cross holdings in CET 1 instruments of Banking, Financial or Insurance entities, investments in mutual funds exceeding prescribed limits and 50% of other deductions e.g. majority and significant minority investments in insurance and other financial entities. Deductions that have come afresh as part of the Basel III rules such as those on account of Deferred Tax Assets are also required to be made.
Tier II capital under Basel III is subject to a maximum of 2.5% of total Risk Weighted Assets as of Dec 2015. It includes subordinated debt issued prior to Jan 1, 2013 phasing out at an annual rate of 10%, Basel III compliant Tier II instruments, general provisions for loan losses (up to a maximum of 1.25 % of credit risk weighted assets), reserves on the revaluation of fixed assets and available for sale investments (on an after tax basis up to a maximum of 45 percent), foreign exchange translation reserves etc. Basel III rules however do allow for the inclusion of the remaining 55% of the revaluation reserves into Tier II capital at an inclusion rate equal to the rate of deduction specified under the transitional arrangements for the coming years uptill 2018. Tier II capital deductions comprise of the remaining 50% other deductions noted above, reciprocal cross holdings in Tier II instruments of Banking, Financial or Insurance entities etc.
As of Dec 2015 the Group must meet a Tier 1 to RWA ratio and CAR including CCB of 7.5% and 10.25% respectively.
Group’s operations are categorised as either trading book or banking book and risk-weighted assets are determined according to specified requirements of State Bank of Pakistan that seek to reflect the varying levels of risk attached to on-balance sheet and off-balance sheet exposures. The total risk-weighted exposures comprise the credit risk, market risk and operational risk.
On and off-balance sheet assets in the banking book are broken down to various asset classes for calculation of credit risk requirement. External ratings for assets, where available, are applied using the assessments by various External Credit Assessment Institutions (ECAIs) and aligned with appropriate risk buckets. Otherwise, the exposures are treated as unrated and relevant risk weights are applied. In addition, there are fixed risk weights for certain types of exposures such as retail portfolio and residential mortgage finance for which external ratings are not applicable. Collaterals if any, are used as credit risk mitigant after applying appropriate haircuts under the Comprehensive Approach. Risk weights notified, are hence applied at adjusted exposures, wherever credit risk mitigation is available. Collaterals used include: Government of Pakistan guarantees, cash, lien on deposits, shares, government securities, bank and corporate guarantees and other debt securities that fall within the definition of eligible collaterals and also fulfill other specified criteria under the relevant capital adequacy guidelines.
The calculation of Capital Adequacy enables the Group to assess the long-term soundness. As the Group carries on the business on a wide area network basis, it is critical that it is able to continuously monitor the exposure across the entire organisation and aggregate the risks so as to take an integrated approach / view.
Leverage Ratio
The Group’s position under Basel III’s third capital standard is as under:
Rupees in ‘000 2015 2014
Tier I Capital 20,598,833 17,719,450 Total Exposure 782,272,246 614,775,739 Leverage Ratio 2.63% 2.88%
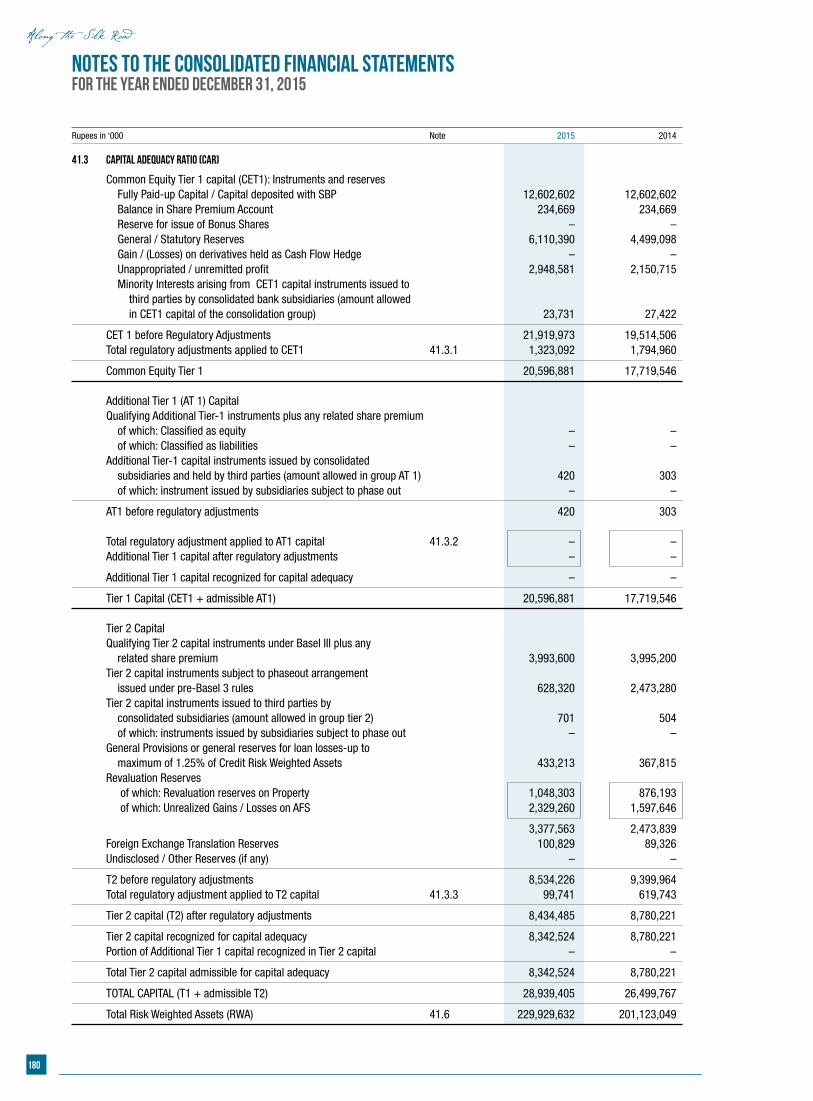
180
Notes to the consolidated Financial StatementsFor the year ended December 31, 2015
Rupees in ‘000 Note 2015 2014
41.3 Capital Adequacy Ratio (CAR)
Common Equity Tier 1 capital (CET1): Instruments and reserves Fully Paid-up Capital / Capital deposited with SBP 12,602,602 12,602,602 Balance in Share Premium Account 234,669 234,669 Reserve for issue of Bonus Shares – – General / Statutory Reserves 6,110,390 4,499,098 Gain / (Losses) on derivatives held as Cash Flow Hedge – – Unappropriated / unremitted profit 2,948,581 2,150,715 Minority Interests arising from CET1 capital instruments issued to third parties by consolidated bank subsidiaries (amount allowed in CET1 capital of the consolidation group) 23,731 27,422
CET 1 before Regulatory Adjustments 21,919,973 19,514,506 Total regulatory adjustments applied to CET1 41.3.1 1,323,092 1,794,960
Common Equity Tier 1 20,596,881 17,719,546 Additional Tier 1 (AT 1) Capital Qualifying Additional Tier-1 instruments plus any related share premium of which: Classified as equity – – of which: Classified as liabilities – – Additional Tier-1 capital instruments issued by consolidated subsidiaries and held by third parties (amount allowed in group AT 1) 420 303 of which: instrument issued by subsidiaries subject to phase out – –
AT1 before regulatory adjustments 420 303 Total regulatory adjustment applied to AT1 capital 41.3.2 – – Additional Tier 1 capital after regulatory adjustments – –
Additional Tier 1 capital recognized for capital adequacy – –
Tier 1 Capital (CET1 + admissible AT1) 20,596,881 17,719,546 Tier 2 Capital Qualifying Tier 2 capital instruments under Basel III plus any related share premium 3,993,600 3,995,200 Tier 2 capital instruments subject to phaseout arrangement issued under pre-Basel 3 rules 628,320 2,473,280 Tier 2 capital instruments issued to third parties by consolidated subsidiaries (amount allowed in group tier 2) 701 504 of which: instruments issued by subsidiaries subject to phase out – – General Provisions or general reserves for loan losses-up to maximum of 1.25% of Credit Risk Weighted Assets 433,213 367,815 Revaluation Reserves of which: Revaluation reserves on Property 1,048,303 876,193 of which: Unrealized Gains / Losses on AFS 2,329,260 1,597,646
3,377,563 2,473,839 Foreign Exchange Translation Reserves 100,829 89,326 Undisclosed / Other Reserves (if any) – –
T2 before regulatory adjustments 8,534,226 9,399,964 Total regulatory adjustment applied to T2 capital 41.3.3 99,741 619,743
Tier 2 capital (T2) after regulatory adjustments 8,434,485 8,780,221
Tier 2 capital recognized for capital adequacy 8,342,524 8,780,221 Portion of Additional Tier 1 capital recognized in Tier 2 capital – –
Total Tier 2 capital admissible for capital adequacy 8,342,524 8,780,221
TOTAL CAPITAL (T1 + admissible T2) 28,939,405 26,499,767
Total Risk Weighted Assets (RWA) 41.6 229,929,632 201,123,049
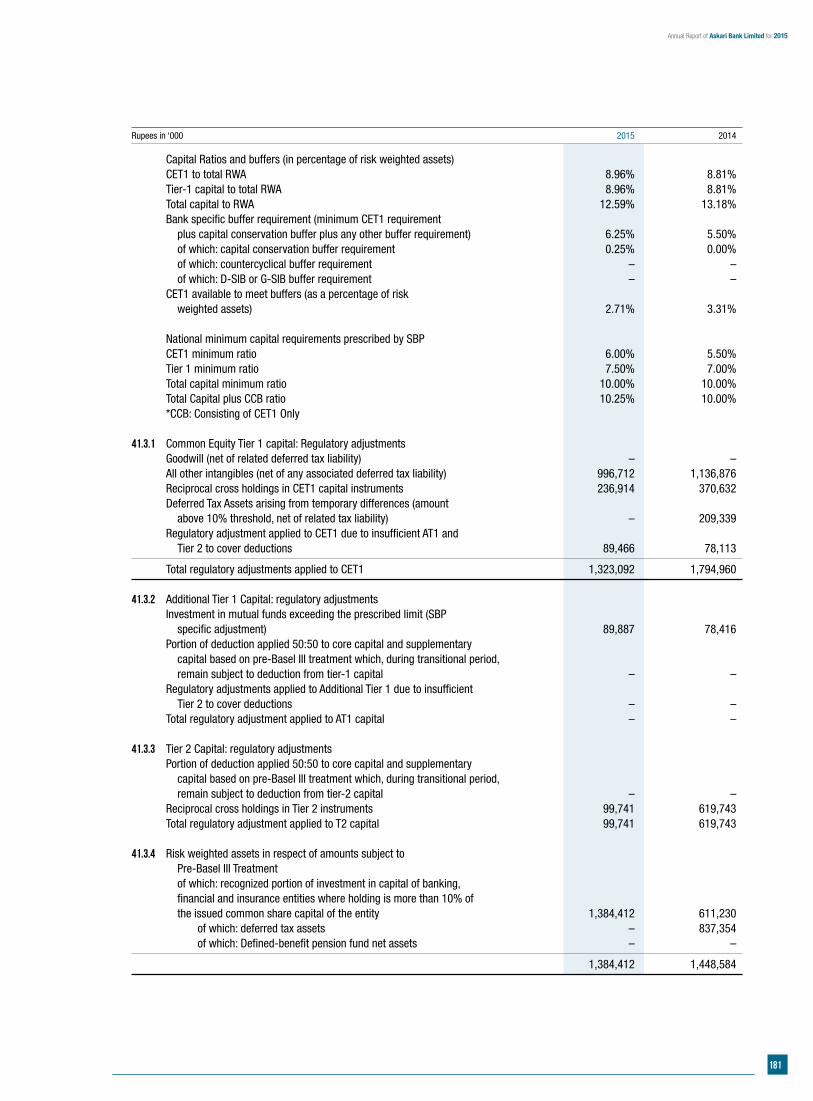
181
Annual Report of Askari Bank Limited for 2015
Rupees in ‘000 2015 2014
Capital Ratios and buffers (in percentage of risk weighted assets) CET1 to total RWA 8.96% 8.81% Tier-1 capital to total RWA 8.96% 8.81% Total capital to RWA 12.59% 13.18% Bank specific buffer requirement (minimum CET1 requirement plus capital conservation buffer plus any other buffer requirement) 6.25% 5.50% of which: capital conservation buffer requirement 0.25% 0.00% of which: countercyclical buffer requirement – – of which: D-SIB or G-SIB buffer requirement – – CET1 available to meet buffers (as a percentage of risk weighted assets) 2.71% 3.31% National minimum capital requirements prescribed by SBP CET1 minimum ratio 6.00% 5.50% Tier 1 minimum ratio 7.50% 7.00% Total capital minimum ratio 10.00% 10.00% Total Capital plus CCB ratio 10.25% 10.00% *CCB: Consisting of CET1 Only
41.3.1 Common Equity Tier 1 capital: Regulatory adjustments Goodwill (net of related deferred tax liability) – – All other intangibles (net of any associated deferred tax liability) 996,712 1,136,876 Reciprocal cross holdings in CET1 capital instruments 236,914 370,632 Deferred Tax Assets arising from temporary differences (amount above 10% threshold, net of related tax liability) – 209,339 Regulatory adjustment applied to CET1 due to insufficient AT1 and Tier 2 to cover deductions 89,466 78,113
Total regulatory adjustments applied to CET1 1,323,092 1,794,960 41.3.2 Additional Tier 1 Capital: regulatory adjustments Investment in mutual funds exceeding the prescribed limit (SBP specific adjustment) 89,887 78,416 Portion of deduction applied 50:50 to core capital and supplementary capital based on pre-Basel III treatment which, during transitional period, remain subject to deduction from tier-1 capital – – Regulatory adjustments applied to Additional Tier 1 due to insufficient Tier 2 to cover deductions – – Total regulatory adjustment applied to AT1 capital – – 41.3.3 Tier 2 Capital: regulatory adjustments Portion of deduction applied 50:50 to core capital and supplementary capital based on pre-Basel III treatment which, during transitional period, remain subject to deduction from tier-2 capital – – Reciprocal cross holdings in Tier 2 instruments 99,741 619,743 Total regulatory adjustment applied to T2 capital 99,741 619,743 41.3.4 Risk weighted assets in respect of amounts subject to Pre-Basel III Treatment of which: recognized portion of investment in capital of banking, financial and insurance entities where holding is more than 10% of the issued common share capital of the entity 1,384,412 611,230 of which: deferred tax assets – 837,354 of which: Defined-benefit pension fund net assets – –
1,384,412 1,448,584
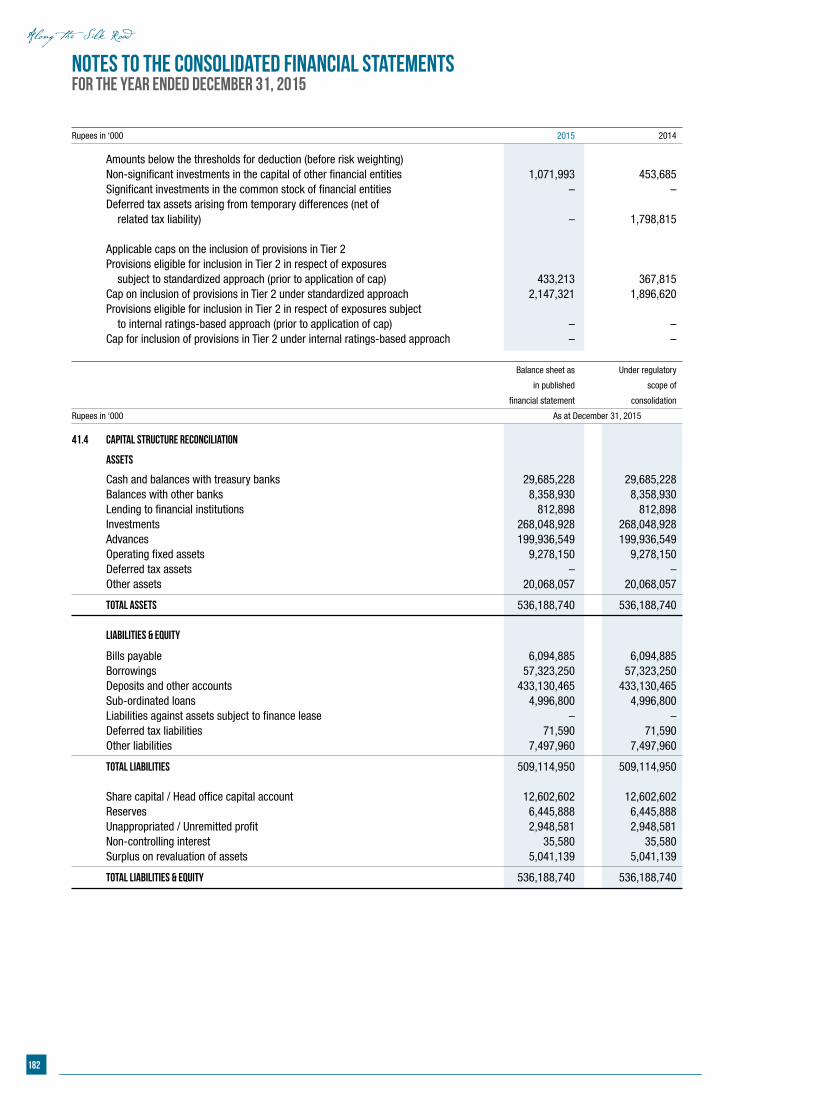
182
Notes to the consolidated Financial StatementsFor the year ended December 31, 2015
Rupees in ‘000 2015 2014
Amounts below the thresholds for deduction (before risk weighting) Non-significant investments in the capital of other financial entities 1,071,993 453,685 Significant investments in the common stock of financial entities – – Deferred tax assets arising from temporary differences (net of related tax liability) – 1,798,815 Applicable caps on the inclusion of provisions in Tier 2 Provisions eligible for inclusion in Tier 2 in respect of exposures subject to standardized approach (prior to application of cap) 433,213 367,815 Cap on inclusion of provisions in Tier 2 under standardized approach 2,147,321 1,896,620 Provisions eligible for inclusion in Tier 2 in respect of exposures subject to internal ratings-based approach (prior to application of cap) – – Cap for inclusion of provisions in Tier 2 under internal ratings-based approach – –
Balance sheet as Under regulatory
in published scope of
financial statement consolidation
Rupees in ‘000 As at December 31, 2015
41.4 Capital Structure Reconciliation
Assets
Cash and balances with treasury banks 29,685,228 29,685,228 Balances with other banks 8,358,930 8,358,930 Lending to financial institutions 812,898 812,898 Investments 268,048,928 268,048,928 Advances 199,936,549 199,936,549 Operating fixed assets 9,278,150 9,278,150 Deferred tax assets – – Other assets 20,068,057 20,068,057
Total assets 536,188,740 536,188,740 Liabilities & Equity
Bills payable 6,094,885 6,094,885 Borrowings 57,323,250 57,323,250 Deposits and other accounts 433,130,465 433,130,465 Sub-ordinated loans 4,996,800 4,996,800 Liabilities against assets subject to finance lease – – Deferred tax liabilities 71,590 71,590 Other liabilities 7,497,960 7,497,960
Total liabilities 509,114,950 509,114,950 Share capital / Head office capital account 12,602,602 12,602,602 Reserves 6,445,888 6,445,888 Unappropriated / Unremitted profit 2,948,581 2,948,581 Non-controlling interest 35,580 35,580 Surplus on revaluation of assets 5,041,139 5,041,139
Total liabilities & equity 536,188,740 536,188,740
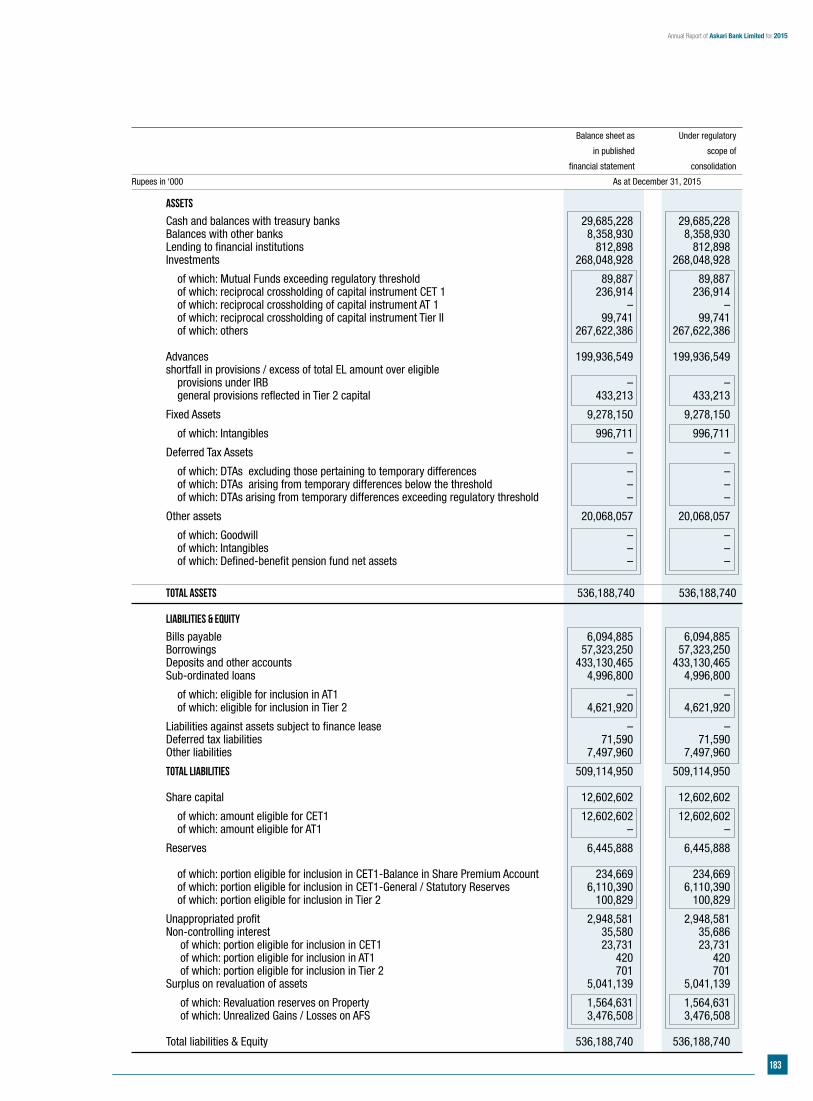
183
Annual Report of Askari Bank Limited for 2015
Balance sheet as Under regulatory
in published scope of
financial statement consolidation
Rupees in ‘000 As at December 31, 2015
Assets
Cash and balances with treasury banks 29,685,228 29,685,228 Balances with other banks 8,358,930 8,358,930 Lending to financial institutions 812,898 812,898 Investments 268,048,928 268,048,928
of which: Mutual Funds exceeding regulatory threshold 89,887 89,887 of which: reciprocal crossholding of capital instrument CET 1 236,914 236,914 of which: reciprocal crossholding of capital instrument AT 1 – – of which: reciprocal crossholding of capital instrument Tier II 99,741 99,741 of which: others 267,622,386 267,622,386 Advances 199,936,549 199,936,549 shortfall in provisions / excess of total EL amount over eligible provisions under IRB – –
general provisions reflected in Tier 2 capital 433,213 433,213
Fixed Assets 9,278,150 9,278,150
of which: Intangibles 996,711 996,711
Deferred Tax Assets – –
of which: DTAs excluding those pertaining to temporary differences – – of which: DTAs arising from temporary differences below the threshold – –
of which: DTAs arising from temporary differences exceeding regulatory threshold – –
Other assets 20,068,057 20,068,057
of which: Goodwill – – of which: Intangibles – – of which: Defined-benefit pension fund net assets – –
Total assets 536,188,740 536,188,740
Liabilities & Equity
Bills payable 6,094,885 6,094,885 Borrowings 57,323,250 57,323,250 Deposits and other accounts 433,130,465 433,130,465 Sub-ordinated loans 4,996,800 4,996,800
of which: eligible for inclusion in AT1 – – of which: eligible for inclusion in Tier 2 4,621,920 4,621,920
Liabilities against assets subject to finance lease – – Deferred tax liabilities 71,590 71,590 Other liabilities 7,497,960 7,497,960
Total liabilities 509,114,950 509,114,950
Share capital 12,602,602 12,602,602
of which: amount eligible for CET1 12,602,602 12,602,602 of which: amount eligible for AT1 – –
Reserves 6,445,888 6,445,888 of which: portion eligible for inclusion in CET1-Balance in Share Premium Account 234,669 234,669 of which: portion eligible for inclusion in CET1-General / Statutory Reserves 6,110,390 6,110,390 of which: portion eligible for inclusion in Tier 2 100,829 100,829
Unappropriated profit 2,948,581 2,948,581 Non-controlling interest 35,580 35,686 of which: portion eligible for inclusion in CET1 23,731 23,731 of which: portion eligible for inclusion in AT1 420 420 of which: portion eligible for inclusion in Tier 2 701 701 Surplus on revaluation of assets 5,041,139 5,041,139
of which: Revaluation reserves on Property 1,564,631 1,564,631 of which: Unrealized Gains / Losses on AFS 3,476,508 3,476,508 Total liabilities & Equity 536,188,740 536,188,740
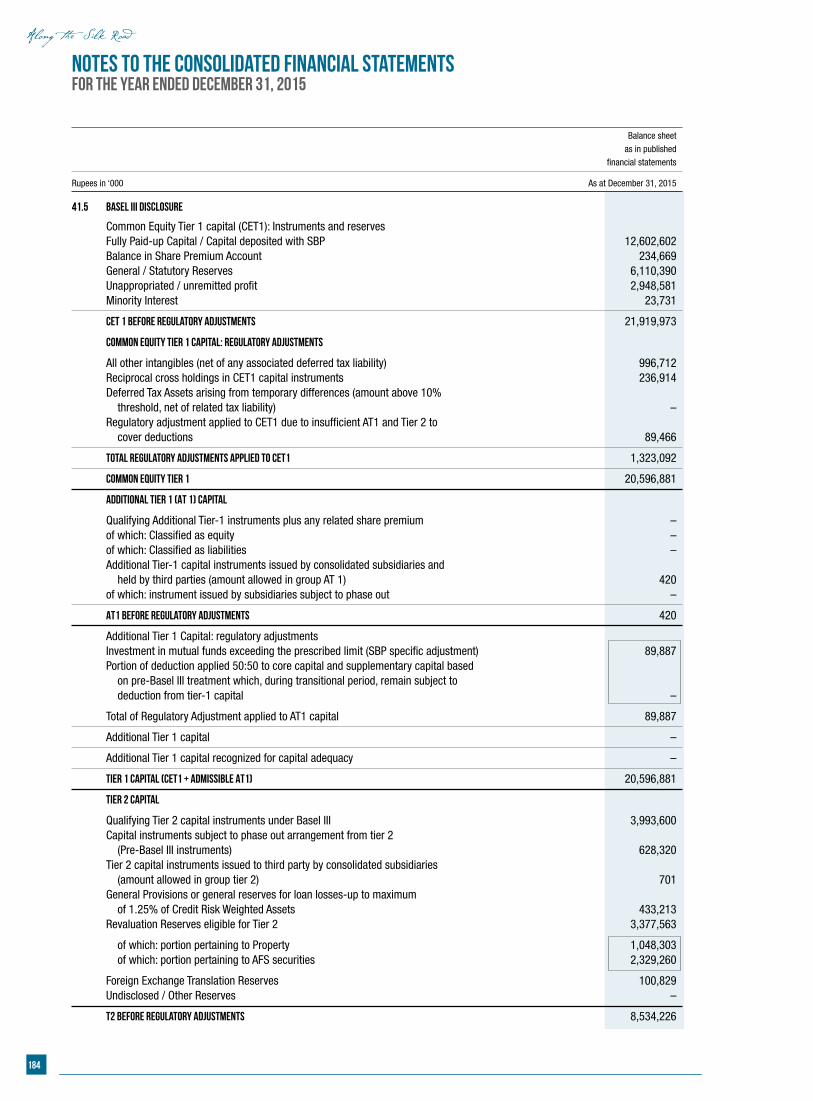
184
Notes to the consolidated Financial StatementsFor the year ended December 31, 2015
Balance sheet as in published financial statements
Rupees in ‘000 As at December 31, 2015
41.5 Basel III Disclosure
Common Equity Tier 1 capital (CET1): Instruments and reserves Fully Paid-up Capital / Capital deposited with SBP 12,602,602 Balance in Share Premium Account 234,669 General / Statutory Reserves 6,110,390 Unappropriated / unremitted profit 2,948,581 Minority Interest 23,731
CET 1 before Regulatory Adjustments 21,919,973
Common Equity Tier 1 capital: Regulatory adjustments
All other intangibles (net of any associated deferred tax liability) 996,712 Reciprocal cross holdings in CET1 capital instruments 236,914 Deferred Tax Assets arising from temporary differences (amount above 10% threshold, net of related tax liability) – Regulatory adjustment applied to CET1 due to insufficient AT1 and Tier 2 to cover deductions 89,466
Total regulatory adjustments applied to CET1 1,323,092
Common Equity Tier 1 20,596,881
Additional Tier 1 (AT 1) Capital
Qualifying Additional Tier-1 instruments plus any related share premium – of which: Classified as equity – of which: Classified as liabilities – Additional Tier-1 capital instruments issued by consolidated subsidiaries and held by third parties (amount allowed in group AT 1) 420 of which: instrument issued by subsidiaries subject to phase out –
AT1 before regulatory adjustments 420
Additional Tier 1 Capital: regulatory adjustments Investment in mutual funds exceeding the prescribed limit (SBP specific adjustment) 89,887 Portion of deduction applied 50:50 to core capital and supplementary capital based on pre-Basel III treatment which, during transitional period, remain subject to deduction from tier-1 capital –
Total of Regulatory Adjustment applied to AT1 capital 89,887
Additional Tier 1 capital –
Additional Tier 1 capital recognized for capital adequacy –
Tier 1 Capital (CET1 + admissible AT1) 20,596,881
Tier 2 Capital
Qualifying Tier 2 capital instruments under Basel III 3,993,600 Capital instruments subject to phase out arrangement from tier 2 (Pre-Basel III instruments) 628,320 Tier 2 capital instruments issued to third party by consolidated subsidiaries (amount allowed in group tier 2) 701 General Provisions or general reserves for loan losses-up to maximum of 1.25% of Credit Risk Weighted Assets 433,213 Revaluation Reserves eligible for Tier 2 3,377,563
of which: portion pertaining to Property 1,048,303 of which: portion pertaining to AFS securities 2,329,260
Foreign Exchange Translation Reserves 100,829 Undisclosed / Other Reserves –
T2 before regulatory adjustments 8,534,226
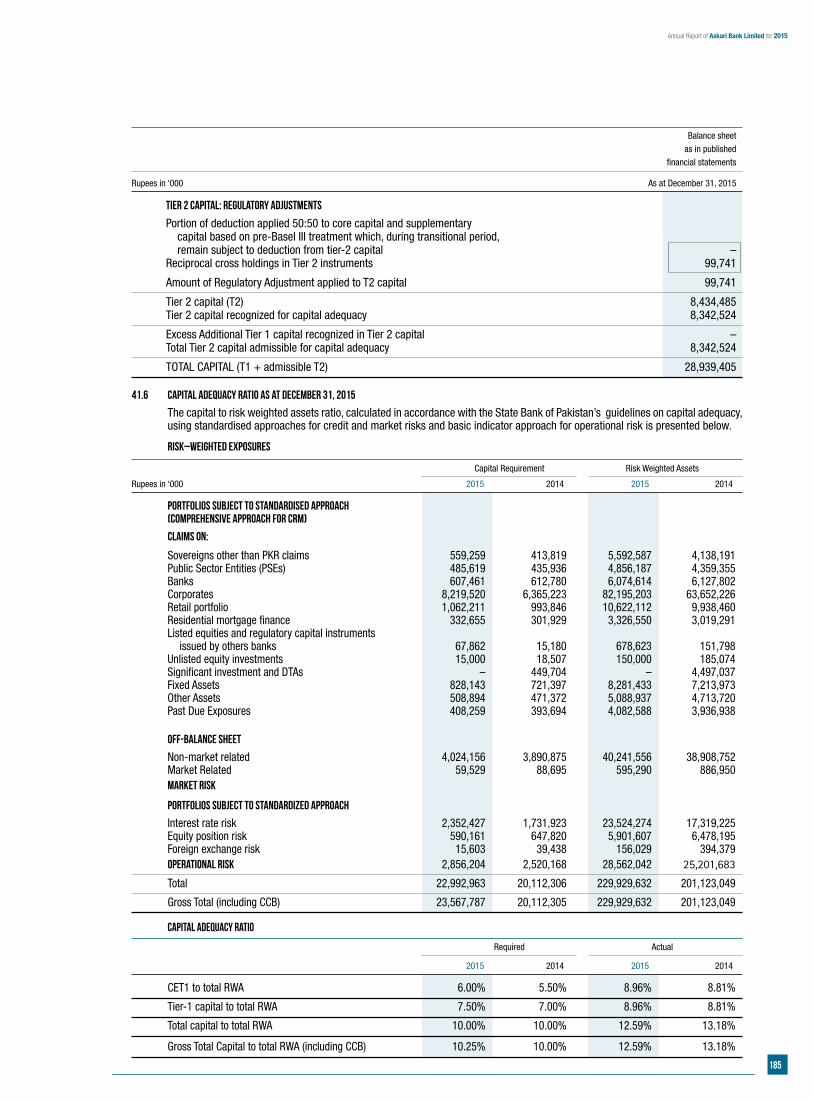
185
Annual Report of Askari Bank Limited for 2015
Balance sheet as in published financial statements
Rupees in ‘000 As at December 31, 2015
Tier 2 Capital: regulatory adjustments Portion of deduction applied 50:50 to core capital and supplementary capital based on pre-Basel III treatment which, during transitional period, remain subject to deduction from tier-2 capital – Reciprocal cross holdings in Tier 2 instruments 99,741
Amount of Regulatory Adjustment applied to T2 capital 99,741
Tier 2 capital (T2) 8,434,485 Tier 2 capital recognized for capital adequacy 8,342,524
Excess Additional Tier 1 capital recognized in Tier 2 capital – Total Tier 2 capital admissible for capital adequacy 8,342,524
TOTAL CAPITAL (T1 + admissible T2) 28,939,405
41.6 Capital adequacy ratio as at December 31, 2015
The capital to risk weighted assets ratio, calculated in accordance with the State Bank of Pakistan’s guidelines on capital adequacy, using standardised approaches for credit and market risks and basic indicator approach for operational risk is presented below.
Risk–weighted exposures
Capital Requirement Risk Weighted Assets
Rupees in ‘000 2015 2014 2015 2014
Portfolios subject to standardised approach (comprehensive approach for CRM)
Claims on:
Sovereigns other than PKR claims 559,259 413,819 5,592,587 4,138,191 Public Sector Entities (PSEs) 485,619 435,936 4,856,187 4,359,355 Banks 607,461 612,780 6,074,614 6,127,802 Corporates 8,219,520 6,365,223 82,195,203 63,652,226 Retail portfolio 1,062,211 993,846 10,622,112 9,938,460 Residential mortgage finance 332,655 301,929 3,326,550 3,019,291 Listed equities and regulatory capital instruments issued by others banks 67,862 15,180 678,623 151,798 Unlisted equity investments 15,000 18,507 150,000 185,074 Significant investment and DTAs – 449,704 – 4,497,037 Fixed Assets 828,143 721,397 8,281,433 7,213,973 Other Assets 508,894 471,372 5,088,937 4,713,720 Past Due Exposures 408,259 393,694 4,082,588 3,936,938 Off-Balance Sheet Non-market related 4,024,156 3,890,875 40,241,556 38,908,752 Market Related 59,529 88,695 595,290 886,950 Market risk
Portfolios subject to standardized approach Interest rate risk 2,352,427 1,731,923 23,524,274 17,319,225 Equity position risk 590,161 647,820 5,901,607 6,478,195 Foreign exchange risk 15,603 39,438 156,029 394,379 Operational risk 2,856,204 2,520,168 28,562,042 25,201,683
Total 22,992,963 20,112,306 229,929,632 201,123,049
Gross Total (including CCB) 23,567,787 20,112,305 229,929,632 201,123,049
Capital adequacy ratio
Required Actual
2015 2014 2015 2014
CET1 to total RWA 6.00% 5.50% 8.96% 8.81%
Tier-1 capital to total RWA 7.50% 7.00% 8.96% 8.81%
Total capital to total RWA 10.00% 10.00% 12.59% 13.18%
Gross Total Capital to total RWA (including CCB) 10.25% 10.00% 12.59% 13.18%
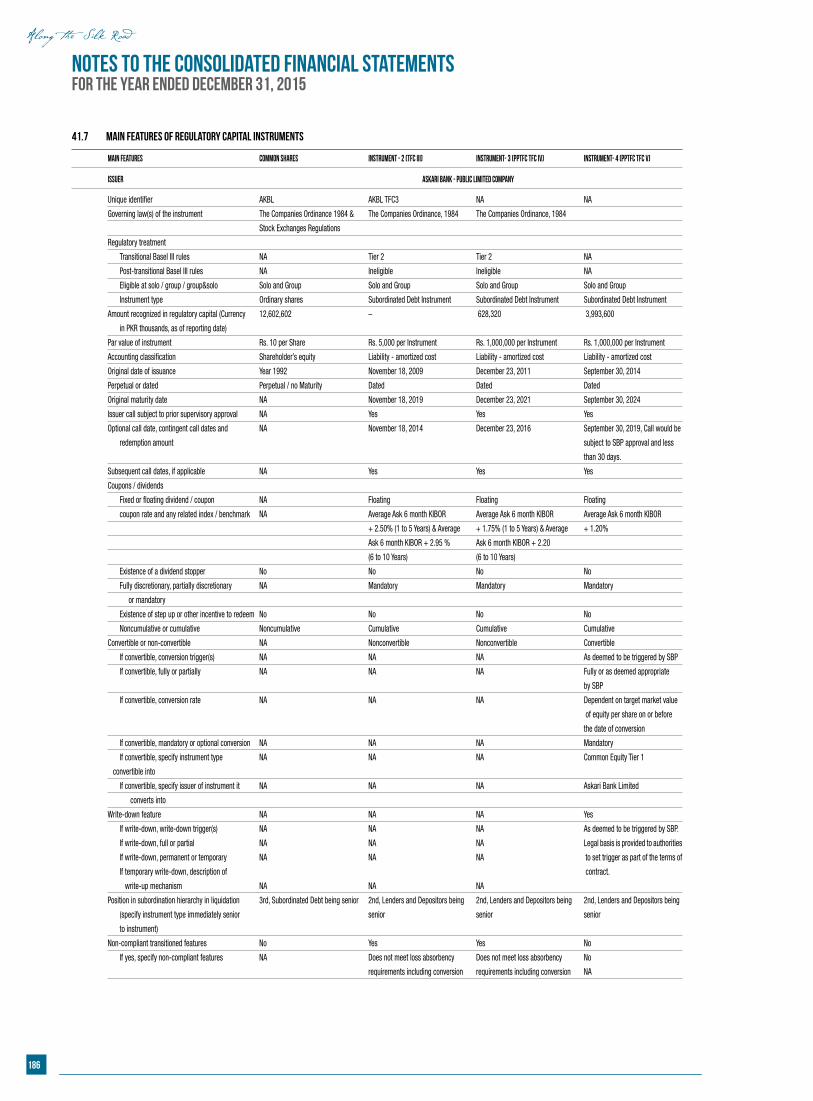
186
Notes to the consolidated Financial StatementsFor the year ended December 31, 2015
41.7 Main features of regulatory capital instruments
Main Features Common Shares Instrument - 2 (TFC III) Instrument- 3 (PPTFC TFC IV) Instrument- 4 (PPTFC TFC V)
Issuer Askari Bank - Public Limited Company
Unique identifier AKBL AKBL TFC3 NA NA
Governing law(s) of the instrument The Companies Ordinance 1984 & The Companies Ordinance, 1984 The Companies Ordinance, 1984
Stock Exchanges Regulations
Regulatory treatment
Transitional Basel III rules NA Tier 2 Tier 2 NA
Post-transitional Basel III rules NA Ineligible Ineligible NA
Eligible at solo / group / group&solo Solo and Group Solo and Group Solo and Group Solo and Group
Instrument type Ordinary shares Subordinated Debt Instrument Subordinated Debt Instrument Subordinated Debt Instrument
Amount recognized in regulatory capital (Currency 12,602,602 – 628,320 3,993,600
in PKR thousands, as of reporting date)
Par value of instrument Rs. 10 per Share Rs. 5,000 per Instrument Rs. 1,000,000 per Instrument Rs. 1,000,000 per Instrument
Accounting classification Shareholder’s equity Liability - amortized cost Liability - amortized cost Liability - amortized cost
Original date of issuance Year 1992 November 18, 2009 December 23, 2011 September 30, 2014
Perpetual or dated Perpetual / no Maturity Dated Dated Dated
Original maturity date NA November 18, 2019 December 23, 2021 September 30, 2024
Issuer call subject to prior supervisory approval NA Yes Yes Yes
Optional call date, contingent call dates and NA November 18, 2014 December 23, 2016 September 30, 2019, Call would be
redemption amount subject to SBP approval and less
than 30 days.
Subsequent call dates, if applicable NA Yes Yes Yes
Coupons / dividends
Fixed or floating dividend / coupon NA Floating Floating Floating
coupon rate and any related index / benchmark NA Average Ask 6 month KIBOR Average Ask 6 month KIBOR Average Ask 6 month KIBOR
+ 2.50% (1 to 5 Years) & Average + 1.75% (1 to 5 Years) & Average + 1.20%
Ask 6 month KIBOR + 2.95 % Ask 6 month KIBOR + 2.20
(6 to 10 Years) (6 to 10 Years)
Existence of a dividend stopper No No No No
Fully discretionary, partially discretionary NA Mandatory Mandatory Mandatory
or mandatory
Existence of step up or other incentive to redeem No No No No
Noncumulative or cumulative Noncumulative Cumulative Cumulative Cumulative
Convertible or non-convertible NA Nonconvertible Nonconvertible Convertible
If convertible, conversion trigger(s) NA NA NA As deemed to be triggered by SBP
If convertible, fully or partially NA NA NA Fully or as deemed appropriate
by SBP
If convertible, conversion rate NA NA NA Dependent on target market value
of equity per share on or before
the date of conversion
If convertible, mandatory or optional conversion NA NA NA Mandatory
If convertible, specify instrument type NA NA NA Common Equity Tier 1
convertible into
If convertible, specify issuer of instrument it NA NA NA Askari Bank Limited
converts into
Write-down feature NA NA NA Yes
If write-down, write-down trigger(s) NA NA NA As deemed to be triggered by SBP.
If write-down, full or partial NA NA NA Legal basis is provided to authorities
If write-down, permanent or temporary NA NA NA to set trigger as part of the terms of
If temporary write-down, description of contract.
write-up mechanism NA NA NA
Position in subordination hierarchy in liquidation 3rd, Subordinated Debt being senior 2nd, Lenders and Depositors being 2nd, Lenders and Depositors being 2nd, Lenders and Depositors being
(specify instrument type immediately senior senior senior senior
to instrument)
Non-compliant transitioned features No Yes Yes No
If yes, specify non-compliant features NA Does not meet loss absorbency Does not meet loss absorbency No
requirements including conversion requirements including conversion NA

187
Annual Report of Askari Bank Limited for 2015
42. RISK MANAGEMENT
The Group believes that effective risk management is of primary importance to achieve desired level of return while maintaining acceptable level of risk exposure. Robust risk management processes and framework are in place to achieve overall Group’s objectives through a well thought out strategy, which enable the Group to effectively manage, Credit, Market, Operational and Liquidity risk in a proactive manner.
The Group’s approach is to ensure that risk management is deeply and firmly embedded in the culture of the Group. All employees are therefore considered responsible for identification, measurement, monitoring and controlling risks within the scope of their assigned responsibilities. As a result of changing risk environment, the Group continuously monitors and conducts holistic assessment of complex transactions on an integrated basis.
The Group has a Board Risk Management Committee (BRMC) in place and is updated regularly by the Bank’s Risk Management Division. BRMC is responsible to review the extent of design and adequacy of risk management framework. BRMC oversees that risks are managed within the level of tolerance and risk appetite of the Group.
42.1 Credit Risk:
Credit risk arises from the potential that an obligor is either unwilling to perform on an obligation or its ability is impaired resulting in economic loss to the Group. The Group takes necessary measures to control such risk by monitoring credit exposures, limiting transactions with specific counter parties with increased likelihood of default and continually assessing the creditworthiness of counter parties.
The Group has built and maintains a sound loan portfolio in terms of a well defined Credit Policy and Credit Risk Policy approved by the Board of Directors. Its credit evaluation system comprises of well-designed credit appraisal, sanctioning and review procedures for the purpose of emphasizing prudence in its lending activities and ensuring quality of asset portfolio. Advances portfolio constitutes around 40% of the total asset base and is also the largest source of credit risk for the Group. Moreover, more than 70% of Group’s capital requirement pertains to credit risk. The Group’s advances portfolio is well diversified across various business segments, industries and geographical locations.
Risk mitigants have been put in place at all stages of credit risk cycle i.e. identification, measurement, monitoring, controlling and reporting for effective risk management. Accordingly, portfolio monitoring function is in place at the Group with dedicated resources to ensure that risk is not only minimized but is optimized in risk / return perspective.
Credit Risk Review is conducted at obligor as well as at portfolio level to ensure adherence to regulatory as well as the Group’s policies and procedures. The review process ensures that a sound and proactive risk management culture is maintained across the Group. Scope of Pre-Assessment Risik Review has been enhanced, covering the entire Corporate, Commercial and SME portfolios alongwith consumer and Agri Finance with in discretionary powers of HOCC. Audit and inspection division is reviewing the advances portfolio on a post approval basis.
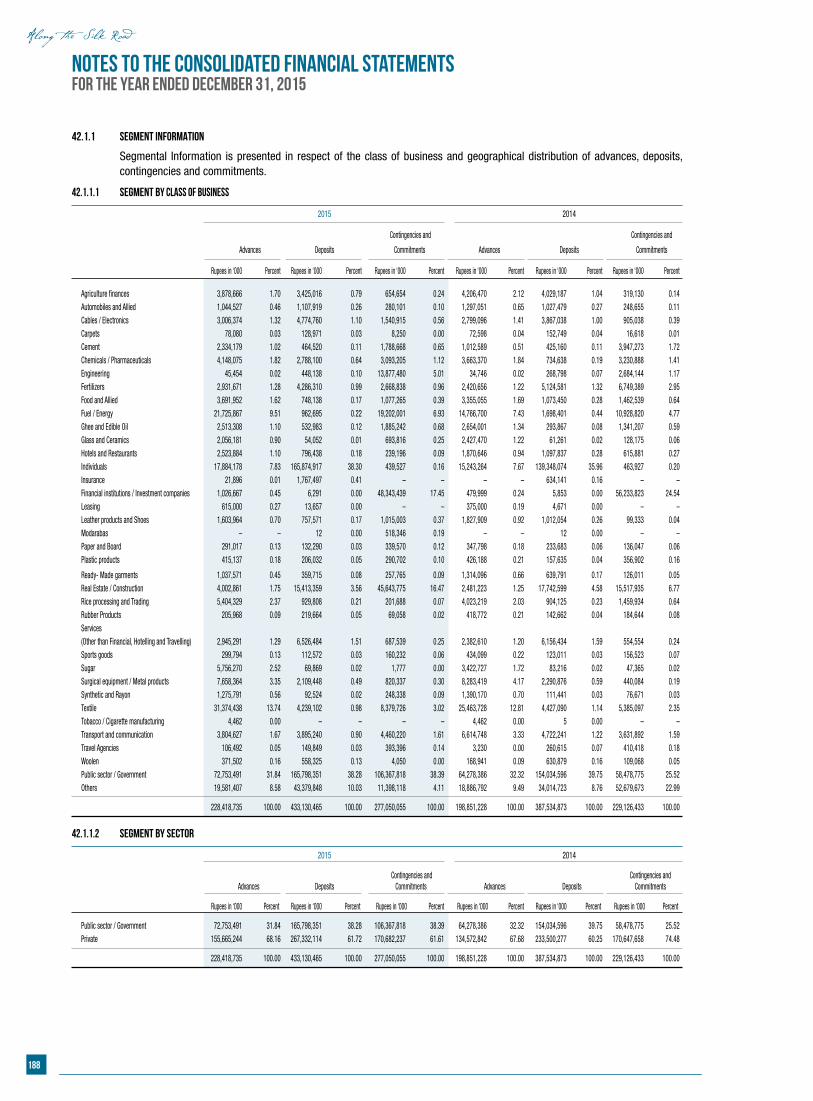
188
Notes to the consolidated Financial StatementsFor the year ended December 31, 2015
42.1.1 SEGMENT INFORMATION
Segmental Information is presented in respect of the class of business and geographical distribution of advances, deposits, contingencies and commitments.
42.1.1.1 Segment by class of business
2015 2014
Contingencies and Contingencies and
Advances Deposits Commitments Advances Deposits Commitments
Rupees in ‘000 Percent Rupees in ‘000 Percent Rupees in ‘000 Percent Rupees in ‘000 Percent Rupees in ‘000 Percent Rupees in ‘000 Percent
Agriculture finances 3,878,666 1.70 3,425,016 0.79 654,654 0.24 4,206,470 2.12 4,029,187 1.04 319,130 0.14 Automobiles and Allied 1,044,527 0.46 1,107,919 0.26 280,101 0.10 1,297,051 0.65 1,027,479 0.27 248,655 0.11 Cables / Electronics 3,006,374 1.32 4,774,760 1.10 1,540,915 0.56 2,799,096 1.41 3,867,038 1.00 905,038 0.39 Carpets 78,080 0.03 128,971 0.03 8,250 0.00 72,598 0.04 152,749 0.04 16,618 0.01 Cement 2,334,179 1.02 464,520 0.11 1,788,668 0.65 1,012,589 0.51 425,160 0.11 3,947,273 1.72 Chemicals / Pharmaceuticals 4,148,075 1.82 2,788,100 0.64 3,093,205 1.12 3,663,370 1.84 734,638 0.19 3,230,888 1.41 Engineering 45,454 0.02 448,138 0.10 13,877,480 5.01 34,746 0.02 268,798 0.07 2,684,144 1.17 Fertilizers 2,931,671 1.28 4,286,310 0.99 2,668,838 0.96 2,420,656 1.22 5,124,581 1.32 6,749,389 2.95 Food and Allied 3,691,952 1.62 748,138 0.17 1,077,265 0.39 3,355,055 1.69 1,073,450 0.28 1,462,539 0.64 Fuel / Energy 21,725,867 9.51 962,695 0.22 19,202,001 6.93 14,766,700 7.43 1,698,401 0.44 10,928,820 4.77 Ghee and Edible Oil 2,513,308 1.10 532,983 0.12 1,885,242 0.68 2,654,001 1.34 293,867 0.08 1,341,207 0.59 Glass and Ceramics 2,056,181 0.90 54,052 0.01 693,816 0.25 2,427,470 1.22 61,261 0.02 128,175 0.06 Hotels and Restaurants 2,523,884 1.10 796,438 0.18 239,196 0.09 1,870,646 0.94 1,097,837 0.28 615,881 0.27 Individuals 17,884,178 7.83 165,874,917 38.30 439,527 0.16 15,243,264 7.67 139,348,074 35.96 463,927 0.20 Insurance 21,896 0.01 1,767,497 0.41 – – – – 634,141 0.16 – – Financial institutions / Investment companies 1,026,667 0.45 6,291 0.00 48,343,439 17.45 479,999 0.24 5,853 0.00 56,233,823 24.54 Leasing 615,000 0.27 13,657 0.00 – – 375,000 0.19 4,671 0.00 – – Leather products and Shoes 1,603,964 0.70 757,571 0.17 1,015,003 0.37 1,827,909 0.92 1,012,054 0.26 99,333 0.04 Modarabas – – 12 0.00 518,346 0.19 – – 12 0.00 – – Paper and Board 291,017 0.13 132,290 0.03 339,570 0.12 347,798 0.18 233,683 0.06 136,047 0.06 Plastic products 415,137 0.18 206,032 0.05 290,702 0.10 426,188 0.21 157,635 0.04 356,902 0.16
Ready- Made garments 1,037,571 0.45 359,715 0.08 257,765 0.09 1,314,096 0.66 639,791 0.17 126,011 0.05 Real Estate / Construction 4,002,861 1.75 15,413,359 3.56 45,643,775 16.47 2,481,223 1.25 17,742,599 4.58 15,517,935 6.77 Rice processing and Trading 5,404,329 2.37 929,808 0.21 201,688 0.07 4,023,219 2.03 904,125 0.23 1,459,934 0.64 Rubber Products 205,968 0.09 219,664 0.05 69,058 0.02 418,772 0.21 142,662 0.04 184,644 0.08 Services (Other than Financial, Hotelling and Travelling) 2,945,291 1.29 6,526,484 1.51 687,539 0.25 2,382,610 1.20 6,156,434 1.59 554,554 0.24 Sports goods 299,794 0.13 112,572 0.03 160,232 0.06 434,099 0.22 123,011 0.03 156,523 0.07 Sugar 5,756,270 2.52 69,869 0.02 1,777 0.00 3,422,727 1.72 83,216 0.02 47,365 0.02 Surgical equipment / Metal products 7,658,364 3.35 2,109,448 0.49 820,337 0.30 8,283,419 4.17 2,290,876 0.59 440,084 0.19 Synthetic and Rayon 1,275,791 0.56 92,524 0.02 248,338 0.09 1,390,170 0.70 111,441 0.03 76,671 0.03 Textile 31,374,438 13.74 4,239,102 0.98 8,379,726 3.02 25,463,728 12.81 4,427,090 1.14 5,385,097 2.35 Tobacco / Cigarette manufacturing 4,462 0.00 – – – – 4,462 0.00 5 0.00 – – Transport and communication 3,804,627 1.67 3,895,240 0.90 4,460,220 1.61 6,614,748 3.33 4,722,241 1.22 3,631,892 1.59 Travel Agencies 106,492 0.05 149,849 0.03 393,396 0.14 3,230 0.00 260,615 0.07 410,418 0.18 Woolen 371,502 0.16 558,325 0.13 4,050 0.00 168,941 0.09 630,879 0.16 109,068 0.05 Public sector / Government 72,753,491 31.84 165,798,351 38.28 106,367,818 38.39 64,278,386 32.32 154,034,596 39.75 58,478,775 25.52 Others 19,581,407 8.58 43,379,848 10.03 11,398,118 4.11 18,886,792 9.49 34,014,723 8.76 52,679,673 22.99
228,418,735 100.00 433,130,465 100.00 277,050,055 100.00 198,851,228 100.00 387,534,873 100.00 229,126,433 100.00
42.1.1.2 Segment by sector
2015 2014
Contingencies and Contingencies and Advances Deposits Commitments Advances Deposits Commitments
Rupees in ‘000 Percent Rupees in ‘000 Percent Rupees in ‘000 Percent Rupees in ‘000 Percent Rupees in ‘000 Percent Rupees in ‘000 Percent
Public sector / Government 72,753,491 31.84 165,798,351 38.28 106,367,818 38.39 64,278,386 32.32 154,034,596 39.75 58,478,775 25.52 Private 155,665,244 68.16 267,332,114 61.72 170,682,237 61.61 134,572,842 67.68 233,500,277 60.25 170,647,658 74.48
228,418,735 100.00 433,130,465 100.00 277,050,055 100.00 198,851,228 100.00 387,534,873 100.00 229,126,433 100.00

189
Annual Report of Askari Bank Limited for 2015
42.1.1.3 Details of non–performing advances and specific provisions by class of business segment
2015 2014
Classified Specific Classified Specific
Rupees in ‘000 Advances Provision Held Advances Provision Held
Agriculture finances 1,462,084 1,034,574 1,281,900 763,923 Automobiles and Allied 419,424 346,368 461,508 346,178 Cables / Electronics 1,100,964 1,095,936 1,103,277 1,095,778 Chemicals / Pharmaceuticals 218,670 209,284 218,357 161,267 Food and Allied 347,277 285,141 351,777 264,838 Fuel / Energy 3,007,063 2,999,853 3,341,152 3,331,299 Glass manufacturing 1,110,342 1,110,342 1,110,342 1,110,342 Individuals 2,863,940 2,625,318 3,113,787 2,781,609 Leather products and Shoes 81,554 34,227 91,172 30,128 Paper industries 88,976 88,136 103,007 101,747 Real estate / Construction 1,295,815 1,151,734 1,713,208 1,336,769 Services (Other than Financial, Hotelling and Travelling) 260,413 183,962 483,513 265,004 Sports goods 261,563 261,563 289,378 263,117 Textile 12,654,132 11,783,120 12,448,380 11,583,518 Transport and Communication 609,935 374,379 303,094 303,094 Others 5,701,565 4,465,036 4,961,877 4,062,639
31,483,717 28,048,973 31,375,729 27,801,250
42.1.1.4 Details of non-performing advances and specific provisions by sector
Private 31,483,717 28,048,973 31,375,729 27,801,250
31,483,717 28,048,973 31,375,729 27,801,250
42.1.1.5 Geographical segment analysis
2015
Profit Contingencies before Total assets Net assets and Rupees in ‘000 Note taxation employed employed Commitments
Pakistan 42.1.1.5.1 7,880,373 526,520,778 26,659,610 277,029,500 Asia Pacific (including South Asia) – – – – Europe – – – –
United States of America and Canada – – – – Middle East 42.1.1.5.1 456,719 9,667,962 414,180 20,555 Others – – – –
8,337,092 536,188,740 27,073,790 277,050,055
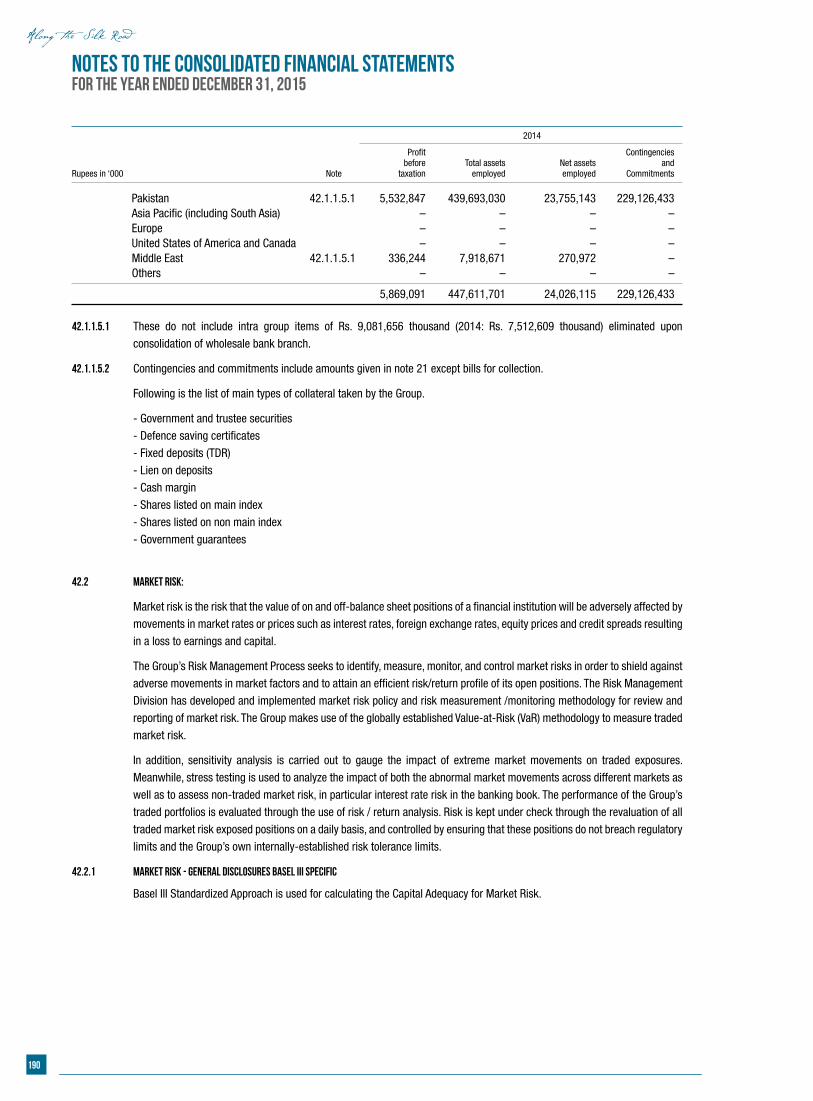
190
Notes to the consolidated Financial StatementsFor the year ended December 31, 2015
2014
Profit Contingencies before Total assets Net assets and Rupees in ‘000 Note taxation employed employed Commitments
Pakistan 42.1.1.5.1 5,532,847 439,693,030 23,755,143 229,126,433 Asia Pacific (including South Asia) – – – – Europe – – – –
United States of America and Canada – – – – Middle East 42.1.1.5.1 336,244 7,918,671 270,972 – Others – – – –
5,869,091 447,611,701 24,026,115 229,126,433
42.1.1.5.1 These do not include intra group items of Rs. 9,081,656 thousand (2014: Rs. 7,512,609 thousand) eliminated upon
consolidation of wholesale bank branch.
42.1.1.5.2 Contingencies and commitments include amounts given in note 21 except bills for collection.
Following is the list of main types of collateral taken by the Group.
- Government and trustee securities
- Defence saving certificates
- Fixed deposits (TDR)
- Lien on deposits
- Cash margin
- Shares listed on main index
- Shares listed on non main index
- Government guarantees
42.2 Market Risk:
Market risk is the risk that the value of on and off-balance sheet positions of a financial institution will be adversely affected by
movements in market rates or prices such as interest rates, foreign exchange rates, equity prices and credit spreads resulting
in a loss to earnings and capital.
The Group’s Risk Management Process seeks to identify, measure, monitor, and control market risks in order to shield against
adverse movements in market factors and to attain an efficient risk/return profile of its open positions. The Risk Management
Division has developed and implemented market risk policy and risk measurement /monitoring methodology for review and
reporting of market risk. The Group makes use of the globally established Value-at-Risk (VaR) methodology to measure traded
market risk.
In addition, sensitivity analysis is carried out to gauge the impact of extreme market movements on traded exposures.
Meanwhile, stress testing is used to analyze the impact of both the abnormal market movements across different markets as
well as to assess non-traded market risk, in particular interest rate risk in the banking book. The performance of the Group’s
traded portfolios is evaluated through the use of risk / return analysis. Risk is kept under check through the revaluation of all
traded market risk exposed positions on a daily basis, and controlled by ensuring that these positions do not breach regulatory
limits and the Group’s own internally-established risk tolerance limits.
42.2.1 Market risk - General disclosures Basel III specific
Basel III Standardized Approach is used for calculating the Capital Adequacy for Market Risk.
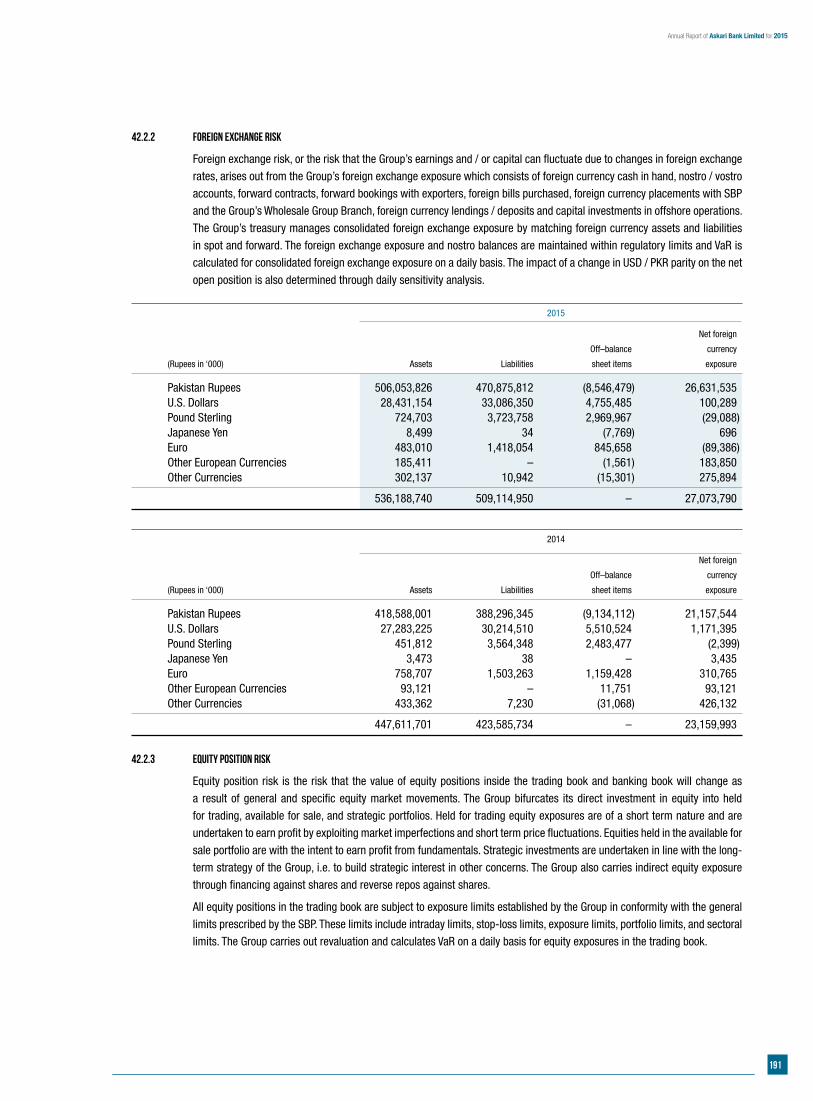
191
Annual Report of Askari Bank Limited for 2015
42.2.2 Foreign Exchange Risk
Foreign exchange risk, or the risk that the Group’s earnings and / or capital can fluctuate due to changes in foreign exchange
rates, arises out from the Group’s foreign exchange exposure which consists of foreign currency cash in hand, nostro / vostro
accounts, forward contracts, forward bookings with exporters, foreign bills purchased, foreign currency placements with SBP
and the Group’s Wholesale Group Branch, foreign currency lendings / deposits and capital investments in offshore operations.
The Group’s treasury manages consolidated foreign exchange exposure by matching foreign currency assets and liabilities
in spot and forward. The foreign exchange exposure and nostro balances are maintained within regulatory limits and VaR is
calculated for consolidated foreign exchange exposure on a daily basis. The impact of a change in USD / PKR parity on the net
open position is also determined through daily sensitivity analysis.
2015
Net foreign
Off–balance currency
(Rupees in ‘000) Assets Liabilities sheet items exposure
Pakistan Rupees 506,053,826 470,875,812 (8,546,479) 26,631,535 U.S. Dollars 28,431,154 33,086,350 4,755,485 100,289 Pound Sterling 724,703 3,723,758 2,969,967 (29,088) Japanese Yen 8,499 34 (7,769) 696 Euro 483,010 1,418,054 845,658 (89,386) Other European Currencies 185,411 – (1,561) 183,850 Other Currencies 302,137 10,942 (15,301) 275,894
536,188,740 509,114,950 – 27,073,790
2014
Net foreign
Off–balance currency
(Rupees in ‘000) Assets Liabilities sheet items exposure
Pakistan Rupees 418,588,001 388,296,345 (9,134,112) 21,157,544 U.S. Dollars 27,283,225 30,214,510 5,510,524 1,171,395 Pound Sterling 451,812 3,564,348 2,483,477 (2,399) Japanese Yen 3,473 38 – 3,435 Euro 758,707 1,503,263 1,159,428 310,765 Other European Currencies 93,121 – 11,751 93,121 Other Currencies 433,362 7,230 (31,068) 426,132
447,611,701 423,585,734 – 23,159,993
42.2.3 Equity position risk
Equity position risk is the risk that the value of equity positions inside the trading book and banking book will change as
a result of general and specific equity market movements. The Group bifurcates its direct investment in equity into held
for trading, available for sale, and strategic portfolios. Held for trading equity exposures are of a short term nature and are
undertaken to earn profit by exploiting market imperfections and short term price fluctuations. Equities held in the available for
sale portfolio are with the intent to earn profit from fundamentals. Strategic investments are undertaken in line with the long-
term strategy of the Group, i.e. to build strategic interest in other concerns. The Group also carries indirect equity exposure
through financing against shares and reverse repos against shares.
All equity positions in the trading book are subject to exposure limits established by the Group in conformity with the general
limits prescribed by the SBP. These limits include intraday limits, stop-loss limits, exposure limits, portfolio limits, and sectoral
limits. The Group carries out revaluation and calculates VaR on a daily basis for equity exposures in the trading book.
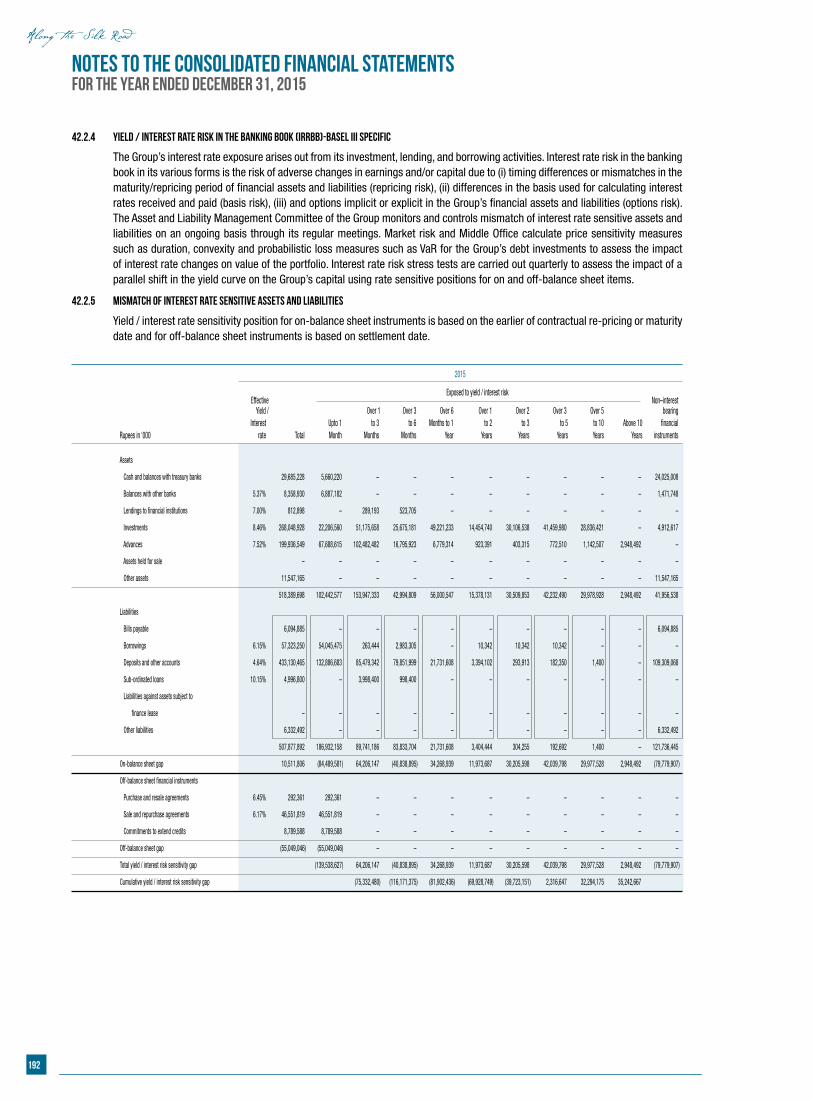
192
Notes to the consolidated Financial StatementsFor the year ended December 31, 2015
42.2.4 Yield / Interest Rate Risk in the Banking Book (IRRBB)-Basel III Specific
The Group’s interest rate exposure arises out from its investment, lending, and borrowing activities. Interest rate risk in the banking book in its various forms is the risk of adverse changes in earnings and/or capital due to (i) timing differences or mismatches in the maturity/repricing period of financial assets and liabilities (repricing risk), (ii) differences in the basis used for calculating interest rates received and paid (basis risk), (iii) and options implicit or explicit in the Group’s financial assets and liabilities (options risk). The Asset and Liability Management Committee of the Group monitors and controls mismatch of interest rate sensitive assets and liabilities on an ongoing basis through its regular meetings. Market risk and Middle Office calculate price sensitivity measures such as duration, convexity and probabilistic loss measures such as VaR for the Group’s debt investments to assess the impact of interest rate changes on value of the portfolio. Interest rate risk stress tests are carried out quarterly to assess the impact of a parallel shift in the yield curve on the Group’s capital using rate sensitive positions for on and off-balance sheet items.
42.2.5 Mismatch of interest rate sensitive assets and liabilities
Yield / interest rate sensitivity position for on-balance sheet instruments is based on the earlier of contractual re-pricing or maturity date and for off-balance sheet instruments is based on settlement date.
2015
Effective
Exposed to yield / interest risk Non–interest
Yield / Over 1 Over 3 Over 6 Over 1 Over 2 Over 3 Over 5 bearing Interest Upto 1 to 3 to 6 Months to 1 to 2 to 3 to 5 to 10 Above 10 financial Rupees in ‘000 rate Total Month Months Months Year Years Years Years Years Years instruments
Assets
Cash and balances with treasury banks 29,685,228 5,660,220 – – – – – – – – 24,025,008
Balances with other banks 5.37% 8,358,930 6,887,182 – – – – – – – – 1,471,748
Lendings to financial institutions 7.00% 812,898 – 289,193 523,705 – – – – – – –
Investments 8.46% 268,048,928 22,206,560 51,175,658 25,675,181 49,221,233 14,454,740 30,106,538 41,459,980 28,836,421 – 4,912,617
Advances 7.52% 199,936,549 67,688,615 102,482,482 16,795,923 6,779,314 923,391 403,315 772,510 1,142,507 2,948,492 –
Assets held for sale – – – – – – – – – – –
Other assets 11,547,165 – – – – – – – – – 11,547,165
518,389,698 102,442,577 153,947,333 42,994,809 56,000,547 15,378,131 30,509,853 42,232,490 29,978,928 2,948,492 41,956,538
Liabilities
Bills payable 6,094,885 – – – – – – – – – 6,094,885
Borrowings 6.15% 57,323,250 54,045,475 263,444 2,983,305 – 10,342 10,342 10,342 – – –
Deposits and other accounts 4.64% 433,130,465 132,886,683 85,479,342 79,851,999 21,731,608 3,394,102 293,913 182,350 1,400 – 109,309,068
Sub-ordinated loans 10.15% 4,996,800 – 3,998,400 998,400 – – – – – – –
Liabilities against assets subject to
finance lease – – – – – – – – – – –
Other liabilities 6,332,492 – – – – – – – – – 6,332,492
507,877,892 186,932,158 89,741,186 83,833,704 21,731,608 3,404,444 304,255 192,692 1,400 – 121,736,445
On-balance sheet gap 10,511,806 (84,489,581) 64,206,147 (40,838,895) 34,268,939 11,973,687 30,205,598 42,039,798 29,977,528 2,948,492 (79,779,907)
Off-balance sheet financial instruments
Purchase and resale agreements 6.45% 292,361 292,361 – – – – – – – – –
Sale and repurchase agreements 6.17% 46,551,819 46,551,819 – – – – – – – – –
Commitments to extend credits 8,789,588 8,789,588 – – – – – – – – –
Off-balance sheet gap (55,049,046) (55,049,046) – – – – – – – – –
Total yield / interest risk sensitivity gap (139,538,627) 64,206,147 (40,838,895) 34,268,939 11,973,687 30,205,598 42,039,798 29,977,528 2,948,492 (79,779,907)
Cumulative yield / interest risk sensitivity gap (75,332,480) (116,171,375) (81,902,436) (69,928,749) (39,723,151) 2,316,647 32,294,175 35,242,667
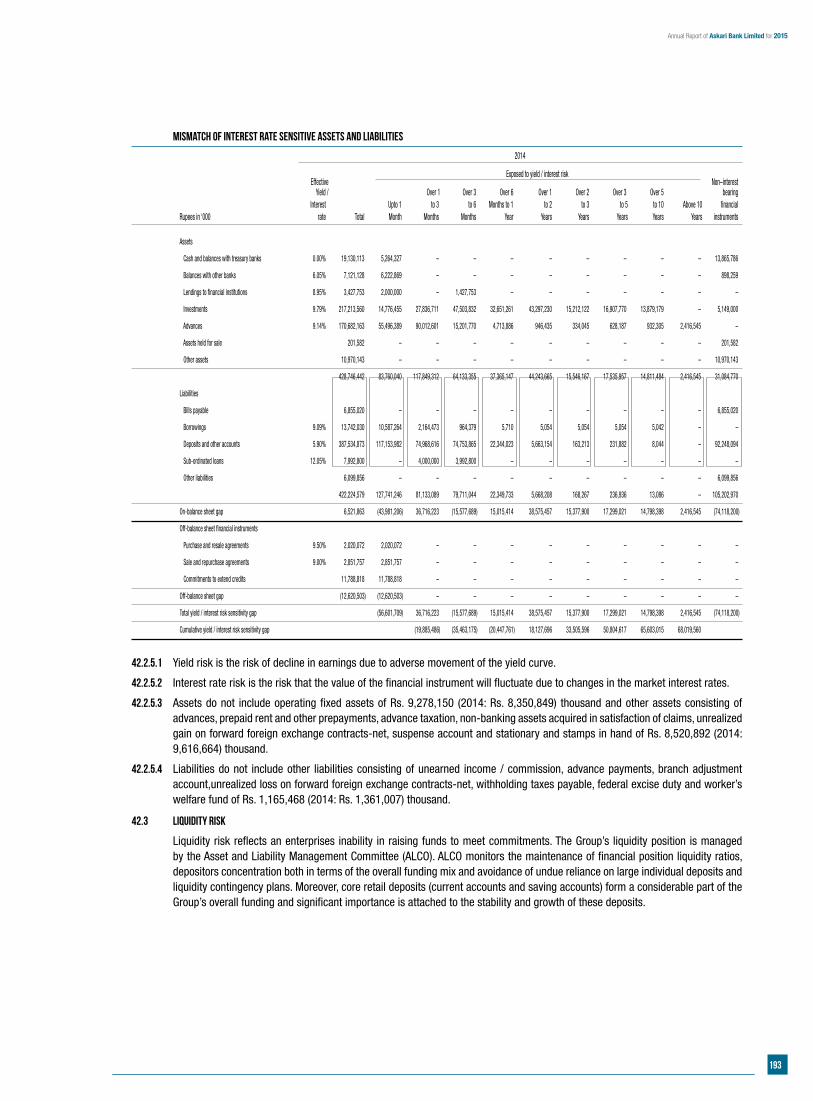
193
Annual Report of Askari Bank Limited for 2015
Mismatch of interest rate sensitive assets and liabilities
2014
Effective
Exposed to yield / interest risk Non–interest
Yield / Over 1 Over 3 Over 6 Over 1 Over 2 Over 3 Over 5 bearing Interest Upto 1 to 3 to 6 Months to 1 to 2 to 3 to 5 to 10 Above 10 financial Rupees in ‘000 rate Total Month Months Months Year Years Years Years Years Years instruments
Assets
Cash and balances with treasury banks 0.00% 19,130,113 5,264,327 – – – – – – – – 13,865,786
Balances with other banks 6.05% 7,121,128 6,222,869 – – – – – – – – 898,259
Lendings to financial institutions 8.95% 3,427,753 2,000,000 – 1,427,753 – – – – – – –
Investments 9.79% 217,213,560 14,776,455 27,836,711 47,503,832 32,651,261 43,297,230 15,212,122 16,907,770 13,879,179 – 5,149,000
Advances 9.14% 170,682,163 55,496,389 90,012,601 15,201,770 4,713,886 946,435 334,045 628,187 932,305 2,416,545 –
Assets held for sale 201,582 – – – – – – – – – 201,582
Other assets 10,970,143 – – – – – – – – – 10,970,143
428,746,442 83,760,040 117,849,312 64,133,355 37,365,147 44,243,665 15,546,167 17,535,957 14,811,484 2,416,545 31,084,770
Liabilities
Bills payable 6,855,020 – – – – – – – – – 6,855,020
Borrowings 9.09% 13,742,030 10,587,264 2,164,473 964,379 5,710 5,054 5,054 5,054 5,042 – –
Deposits and other accounts 5.90% 387,534,873 117,153,982 74,968,616 74,753,865 22,344,023 5,663,154 163,213 231,882 8,044 – 92,248,094
Sub-ordinated loans 12.05% 7,992,800 – 4,000,000 3,992,800 – – – – – – –
Other liabilities 6,099,856 – – – – – – – – – 6,099,856
422,224,579 127,741,246 81,133,089 79,711,044 22,349,733 5,668,208 168,267 236,936 13,086 – 105,202,970
On-balance sheet gap 6,521,863 (43,981,206) 36,716,223 (15,577,689) 15,015,414 38,575,457 15,377,900 17,299,021 14,798,398 2,416,545 (74,118,200)
Off-balance sheet financial instruments
Purchase and resale agreements 9.50% 2,020,072 2,020,072 – – – – – – – – –
Sale and repurchase agreements 9.00% 2,851,757 2,851,757 – – – – – – – – –
Commitments to extend credits 11,788,818 11,788,818 – – – – – – – – –
Off-balance sheet gap (12,620,503) (12,620,503) – – – – – – – – –
Total yield / interest risk sensitivity gap (56,601,709) 36,716,223 (15,577,689) 15,015,414 38,575,457 15,377,900 17,299,021 14,798,398 2,416,545 (74,118,200)
Cumulative yield / interest risk sensitivity gap (19,885,486) (35,463,175) (20,447,761) 18,127,696 33,505,596 50,804,617 65,603,015 68,019,560
42.2.5.1 Yield risk is the risk of decline in earnings due to adverse movement of the yield curve.
42.2.5.2 Interest rate risk is the risk that the value of the financial instrument will fluctuate due to changes in the market interest rates.
42.2.5.3 Assets do not include operating fixed assets of Rs. 9,278,150 (2014: Rs. 8,350,849) thousand and other assets consisting of advances, prepaid rent and other prepayments, advance taxation, non-banking assets acquired in satisfaction of claims, unrealized gain on forward foreign exchange contracts-net, suspense account and stationary and stamps in hand of Rs. 8,520,892 (2014: 9,616,664) thousand.
42.2.5.4 Liabilities do not include other liabilities consisting of unearned income / commission, advance payments, branch adjustment account,unrealized loss on forward foreign exchange contracts-net, withholding taxes payable, federal excise duty and worker’s welfare fund of Rs. 1,165,468 (2014: Rs. 1,361,007) thousand.
42.3 Liquidity Risk
Liquidity risk reflects an enterprises inability in raising funds to meet commitments. The Group’s liquidity position is managed by the Asset and Liability Management Committee (ALCO). ALCO monitors the maintenance of financial position liquidity ratios, depositors concentration both in terms of the overall funding mix and avoidance of undue reliance on large individual deposits and liquidity contingency plans. Moreover, core retail deposits (current accounts and saving accounts) form a considerable part of the Group’s overall funding and significant importance is attached to the stability and growth of these deposits.
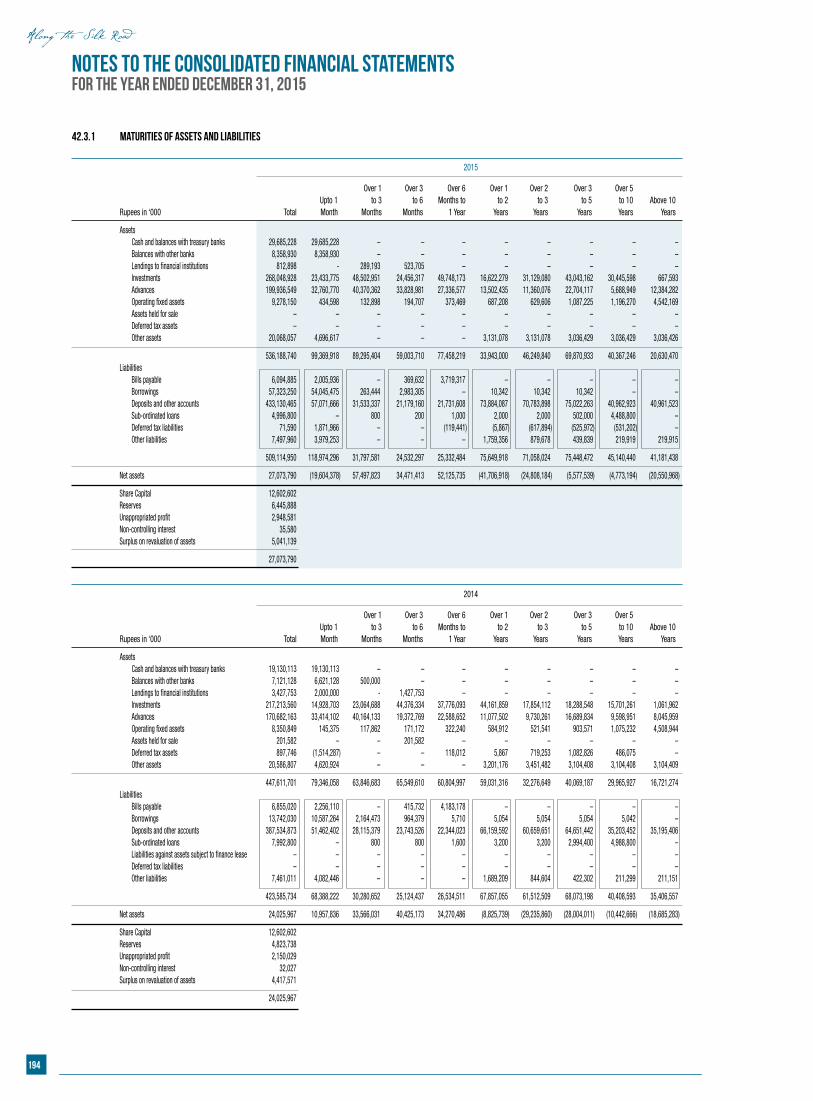
194
Notes to the consolidated Financial StatementsFor the year ended December 31, 2015
42.3.1 Maturities of Assets and Liabilities
2015
Over 1 Over 3 Over 6 Over 1 Over 2 Over 3 Over 5 Upto 1 to 3 to 6 Months to to 2 to 3 to 5 to 10 Above 10 Rupees in ‘000 Total Month Months Months 1 Year Years Years Years Years Years
Assets Cash and balances with treasury banks 29,685,228 29,685,228 – – – – – – – –
Balances with other banks 8,358,930 8,358,930 – – – – – – – – Lendings to financial institutions 812,898 - 289,193 523,705 – – – – – – Investments 268,048,928 23,433,775 48,502,951 24,456,317 49,748,173 16,622,279 31,129,080 43,043,162 30,445,598 667,593 Advances 199,936,549 32,760,770 40,370,362 33,828,981 27,336,577 13,502,435 11,360,076 22,704,117 5,688,949 12,384,282 Operating fixed assets 9,278,150 434,598 132,898 194,707 373,469 687,208 629,606 1,087,225 1,196,270 4,542,169 Assets held for sale – – – – – – – – – – Deferred tax assets – – – – – – – – – – Other assets 20,068,057 4,696,617 – – – 3,131,078 3,131,078 3,036,429 3,036,429 3,036,426
536,188,740 99,369,918 89,295,404 59,003,710 77,458,219 33,943,000 46,249,840 69,870,933 40,367,246 20,630,470 Liabilities Bills payable 6,094,885 2,005,936 – 369,632 3,719,317 – – – – – Borrowings 57,323,250 54,045,475 263,444 2,983,305 – 10,342 10,342 10,342 – – Deposits and other accounts 433,130,465 57,071,666 31,533,337 21,179,160 21,731,608 73,884,087 70,783,898 75,022,263 40,962,923 40,961,523 Sub-ordinated loans 4,996,800 – 800 200 1,000 2,000 2,000 502,000 4,488,800 – Deferred tax liabilities 71,590 1,871,966 – – (119,441) (5,867) (617,894) (525,972) (531,202) – Other liabilities 7,497,960 3,979,253 – – – 1,759,356 879,678 439,839 219,919 219,915
509,114,950 118,974,296 31,797,581 24,532,297 25,332,484 75,649,918 71,058,024 75,448,472 45,140,440 41,181,438
Net assets 27,073,790 (19,604,378) 57,497,823 34,471,413 52,125,735 (41,706,918) (24,808,184) (5,577,539) (4,773,194) (20,550,968)
Share Capital 12,602,602 Reserves 6,445,888 Unappropriated profit 2,948,581 Non-controlling interest 35,580 Surplus on revaluation of assets 5,041,139
27,073,790
2014
Over 1 Over 3 Over 6 Over 1 Over 2 Over 3 Over 5 Upto 1 to 3 to 6 Months to to 2 to 3 to 5 to 10 Above 10 Rupees in ‘000 Total Month Months Months 1 Year Years Years Years Years Years
Assets Cash and balances with treasury banks 19,130,113 19,130,113 – – – – – – – – Balances with other banks 7,121,128 6,621,128 500,000 – – – – – – – Lendings to financial institutions 3,427,753 2,000,000 - 1,427,753 – – – – – – Investments 217,213,560 14,928,703 23,064,688 44,376,334 37,776,093 44,161,859 17,854,112 18,288,548 15,701,261 1,061,962 Advances 170,682,163 33,414,102 40,164,133 19,372,769 22,588,652 11,077,502 9,730,261 16,689,834 9,598,951 8,045,959 Operating fixed assets 8,350,849 145,375 117,862 171,172 322,240 584,912 521,541 903,571 1,075,232 4,508,944 Assets held for sale 201,582 – – 201,582 – – – – – – Deferred tax assets 897,746 (1,514,287) – – 118,012 5,867 719,253 1,082,826 486,075 – Other assets 20,586,807 4,620,924 – – – 3,201,176 3,451,482 3,104,408 3,104,408 3,104,409
447,611,701 79,346,058 63,846,683 65,549,610 60,804,997 59,031,316 32,276,649 40,069,187 29,965,927 16,721,274 Liabilities Bills payable 6,855,020 2,256,110 – 415,732 4,183,178 – – – – – Borrowings 13,742,030 10,587,264 2,164,473 964,379 5,710 5,054 5,054 5,054 5,042 – Deposits and other accounts 387,534,873 51,462,402 28,115,379 23,743,526 22,344,023 66,159,592 60,659,651 64,651,442 35,203,452 35,195,406 Sub-ordinated loans 7,992,800 – 800 800 1,600 3,200 3,200 2,994,400 4,988,800 – Liabilities against assets subject to finance lease – – – – – – – – – – Deferred tax liabilities – – – – – – – – – – Other liabilities 7,461,011 4,082,446 – – – 1,689,209 844,604 422,302 211,299 211,151
423,585,734 68,388,222 30,280,652 25,124,437 26,534,511 67,857,055 61,512,509 68,073,198 40,408,593 35,406,557
Net assets 24,025,967 10,957,836 33,566,031 40,425,173 34,270,486 (8,825,739) (29,235,860) (28,004,011) (10,442,666) (18,685,283)
Share Capital 12,602,602 Reserves 4,823,738 Unappropriated profit 2,150,029 Non-controlling interest 32,027 Surplus on revaluation of assets 4,417,571
24,025,967
195
Annual Report of Askari Bank Limited for 2015
Nadeem InayatDirector
Syed M. HusainiPresident & Chief Executive
Asif Reza SanaDirector
Lt Gen (R) Khalid Nawaz KhanChairman
42.3.1.1 In compliance with the BSD circular letter No. 03 of 2011 dated February 22, 2011, all assets and liabilities with contractual maturities have been reported as per their remaining maturities, and where contractual maturities are not available, such assets and liabilities have been reported as per their expected maturities, determined on the basis of behaviour study of three years’ historic data under volatility methodology. These basis have also been approved by the Asset and Liability Management Committee (ALCO) of the Group.
42.4 OPERATIONAL RISK
Operational risk is the risk of loss resulting from inadequate or failed internal processes, people, systems and external events. The Group strives to manage operational risk within acceptable levels through sound operational risk management practices. Board Risk Management Committee defines the operational risk appetite and tolerance limits.
Operational risk governance structure adopted by Group is embedded within three lines of defense: Strategic, Macro and Micro. Group has recently updated its Operational Risk Management framework to align it with global / local best market practices. Moreover, the Group has also formulated Operational Risk Management Committee (ORMC) which serves as a management level committee to oversee, supervise and direct operational risk framework across the Group. Further, the committee is responsible for strengthening internal control environment through implementation of policies and procedure, enhancement in tools and reporting structures.
To ensure effectiveness, business continuity plan (BCP) and business continuity management (BCM) is adopted throughout the organization in a proactive manner by making use of requisite tools and strategies.
42.4.1 OPERATIONAL RISK DISCLOSURES BASEL III
Basel III Basic Indicator Approach is used for calculating the Capital Adequacy for Operational Risk.
43. RECLASSIFICATION OF COMPARATIVE FIGURES
There have been no significant reclassifications in these consolidated financial statements except amounts of Rs. 117,242 thousand and Rs. 180,840 thousand which were reclassified in 2014 from income from dealing in foreign currencies to administrative expenses and advances, deposits, advance rent and other prepayments to advances respectively.
44. GENERAL
44.1 Non-adjusting events after the balance sheet date
The Board of Directors in its meeting held on February 15, 2016 has proposed the following appropriations, which will be approved in the forthcoming Annual General Meeting. The consolidated financial statements for the year ended December 31, 2015 do not include the effect of the appropriations which will be accounted for in the consolidated financial statements for the year ending December 31, 2016 as follows:
Rupees in ‘000 2015 2014
Transfer from unappropriated profit to:
General reserve 1,187,989 1,862,233
Transfer from general reserve:
Payment of final cash dividend of
Rs. 1.25 per share (2014: Re. 1.00 per share) 1,575,325 1,260,260
44.2 Captions as prescribed by BSD Circular No. 4 dated February 17, 2006 issued by the SBP in respect of which there are no amounts have not been reproduced in these consolidated financial statements except for the consolidated statement of financial position and consolidated profit and loss account.
45. DATE OF AUTHORIZATION
These consolidated financial statements were authorized for issue on February 15, 2016 by the Board of Directors of the Group.
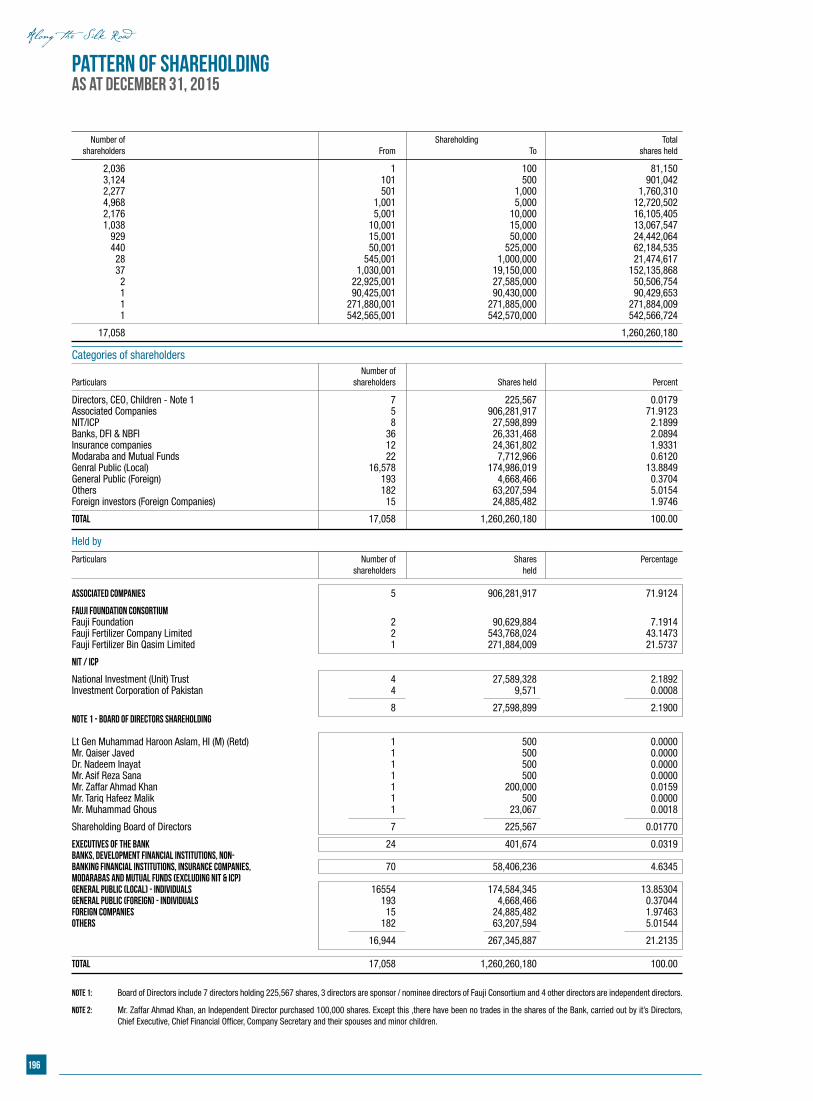
196
Pattern of ShareholdingAs at December 31, 2015
Number of Shareholding Total shareholders From To shares held
2,036 1 100 81,150 3,124 101 500 901,042 2,277 501 1,000 1,760,310 4,968 1,001 5,000 12,720,502 2,176 5,001 10,000 16,105,405 1,038 10,001 15,000 13,067,547 929 15,001 50,000 24,442,064 440 50,001 525,000 62,184,535 28 545,001 1,000,000 21,474,617 37 1,030,001 19,150,000 152,135,868 2 22,925,001 27,585,000 50,506,754 1 90,425,001 90,430,000 90,429,653 1 271,880,001 271,885,000 271,884,009 1 542,565,001 542,570,000 542,566,724
17,058 1,260,260,180
Categories of shareholders Number of Particulars shareholders Shares held Percent
Directors, CEO, Children - Note 1 7 225,567 0.0179 Associated Companies 5 906,281,917 71.9123 NIT/ICP 8 27,598,899 2.1899 Banks, DFI & NBFI 36 26,331,468 2.0894 Insurance companies 12 24,361,802 1.9331 Modaraba and Mutual Funds 22 7,712,966 0.6120 Genral Public (Local) 16,578 174,986,019 13.8849 General Public (Foreign) 193 4,668,466 0.3704 Others 182 63,207,594 5.0154 Foreign investors (Foreign Companies) 15 24,885,482 1.9746
Total 17,058 1,260,260,180 100.00
Held by
Particulars Number of Shares Percentage shareholders held
Associated companies 5 906,281,917 71.9124
Fauji Foundation Consortium Fauji Foundation 2 90,629,884 7.1914 Fauji Fertilizer Company Limited 2 543,768,024 43.1473 Fauji Fertilizer Bin Qasim Limited 1 271,884,009 21.5737
NIT / ICP
National Investment (Unit) Trust 4 27,589,328 2.1892 Investment Corporation of Pakistan 4 9,571 0.0008
8 27,598,899 2.1900 Note 1 - Board of Directors Shareholding Lt Gen Muhammad Haroon Aslam, HI (M) (Retd) 1 500 0.0000Mr. Qaiser Javed 1 500 0.0000Dr. Nadeem Inayat 1 500 0.0000Mr. Asif Reza Sana 1 500 0.0000Mr. Zaffar Ahmad Khan 1 200,000 0.0159Mr. Tariq Hafeez Malik 1 500 0.0000Mr. Muhammad Ghous 1 23,067 0.0018
Shareholding Board of Directors 7 225,567 0.01770
Executives of the Bank 24 401,674 0.0319Banks, Development Financial Institutions, Non- Banking Financial Institutions, Insurance Companies, 70 58,406,236 4.6345Modarabas and Mutual Funds (excluding NIT & ICP) General Public (Local) - Individuals 16554 174,584,345 13.85304General Public (Foreign) - Individuals 193 4,668,466 0.37044Foreign Companies 15 24,885,482 1.97463Others 182 63,207,594 5.01544
16,944 267,345,887 21.2135
Total 17,058 1,260,260,180 100.00
Note 1: Board of Directors include 7 directors holding 225,567 shares, 3 directors are sponsor / nominee directors of Fauji Consortium and 4 other directors are independent directors.
Note 2: Mr. Zaffar Ahmad Khan, an Independent Director purchased 100,000 shares. Except this ,there have been no trades in the shares of the Bank, carried out by it’s Directors, Chief Executive, Chief Financial Officer, Company Secretary and their spouses and minor children.
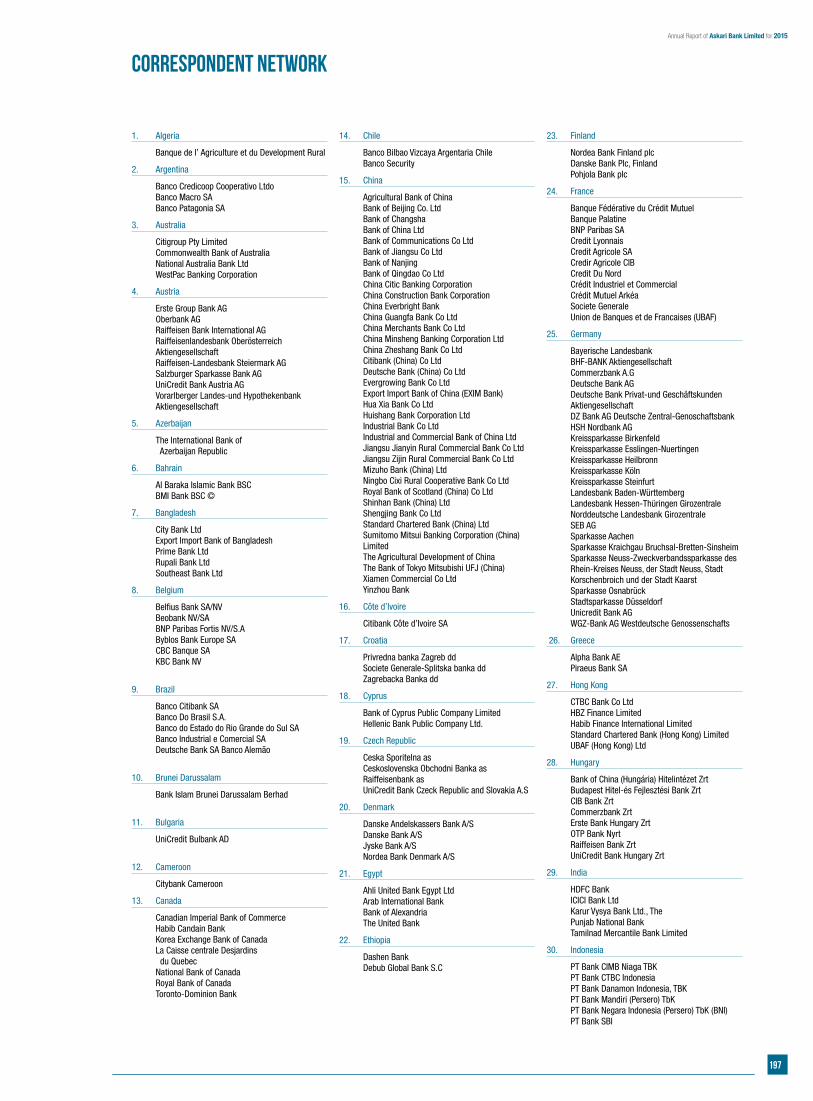
197
Annual Report of Askari Bank Limited for 2015
Correspondent Network
1. Algeria
Banque de l’ Agriculture et du Development Rural
2. Argentina
Banco Credicoop Cooperativo Ltdo Banco Macro SA Banco Patagonia SA
3. Australia
Citigroup Pty Limited Commonwealth Bank of Australia National Australia Bank Ltd WestPac Banking Corporation
4. Austria
Erste Group Bank AG Oberbank AG Raiffeisen Bank International AG Raiffeisenlandesbank Oberösterreich
Aktiengesellschaft Raiffeisen-Landesbank Steiermark AG Salzburger Sparkasse Bank AG UniCredit Bank Austria AG Vorarlberger Landes-und Hypothekenbank
Aktiengesellschaft
5. Azerbaijan
The International Bank of Azerbaijan Republic
6. Bahrain
Al Baraka Islamic Bank BSC BMI Bank BSC ©
7. Bangladesh
City Bank Ltd Export Import Bank of Bangladesh Prime Bank Ltd Rupali Bank Ltd Southeast Bank Ltd
8. Belgium
Belfius Bank SA/NV Beobank NV/SA BNP Paribas Fortis NV/S.A Byblos Bank Europe SA CBC Banque SA KBC Bank NV
9. Brazil
Banco Citibank SA Banco Do Brasil S.A. Banco do Estado do Rio Grande do Sul SA Banco Industrial e Comercial SA Deutsche Bank SA Banco Alemão
10. Brunei Darussalam
Bank Islam Brunei Darussalam Berhad
11. Bulgaria
UniCredit Bulbank AD
12. Cameroon
Citybank Cameroon
13. Canada
Canadian Imperial Bank of Commerce Habib Candain Bank Korea Exchange Bank of Canada La Caisse centrale Desjardins du Quebec National Bank of Canada Royal Bank of Canada Toronto-Dominion Bank
14. Chile
Banco Bilbao Vizcaya Argentaria Chile Banco Security
15. China
Agricultural Bank of China Bank of Beijing Co. Ltd Bank of Changsha Bank of China Ltd Bank of Communications Co Ltd Bank of Jiangsu Co Ltd Bank of Nanjing Bank of Qingdao Co Ltd China Citic Banking Corporation China Construction Bank Corporation China Everbright Bank China Guangfa Bank Co Ltd China Merchants Bank Co Ltd China Minsheng Banking Corporation Ltd China Zheshang Bank Co Ltd Citibank (China) Co Ltd Deutsche Bank (China) Co Ltd Evergrowing Bank Co Ltd Export Import Bank of China (EXIM Bank) Hua Xia Bank Co Ltd Huishang Bank Corporation Ltd Industrial Bank Co Ltd Industrial and Commercial Bank of China Ltd Jiangsu Jianyin Rural Commercial Bank Co Ltd Jiangsu Zijin Rural Commercial Bank Co Ltd Mizuho Bank (China) Ltd Ningbo Cixi Rural Cooperative Bank Co Ltd Royal Bank of Scotland (China) Co Ltd Shinhan Bank (China) Ltd Shengjing Bank Co Ltd Standard Chartered Bank (China) Ltd Sumitomo Mitsui Banking Corporation (China)
Limited The Agricultural Development of China The Bank of Tokyo Mitsubishi UFJ (China) Xiamen Commercial Co Ltd Yinzhou Bank
16. Côte d’Ivoire
Citibank Côte d’Ivoire SA
17. Croatia
Privredna banka Zagreb dd Societe Generale-Splitska banka dd Zagrebacka Banka dd
18. Cyprus
Bank of Cyprus Public Company Limited Hellenic Bank Public Company Ltd.
19. Czech Republic
Ceska Sporitelna as Ceskoslovenska Obchodni Banka as Raiffeisenbank as UniCredit Bank Czeck Republic and Slovakia A.S
20. Denmark
Danske Andelskassers Bank A/S Danske Bank A/S Jyske Bank A/S Nordea Bank Denmark A/S
21. Egypt
Ahli United Bank Egypt Ltd Arab International Bank Bank of Alexandria The United Bank
22. Ethiopia
Dashen Bank Debub Global Bank S.C
23. Finland
Nordea Bank Finland plc Danske Bank Plc, Finland Pohjola Bank plc
24. France
Banque Fédérative du Crédit Mutuel Banque Palatine BNP Paribas SA Credit Lyonnais Credit Agricole SA Credir Agricole CIB Credit Du Nord Crédit Industriel et Commercial Crédit Mutuel Arkéa Societe Generale Union de Banques et de Francaises (UBAF)
25. Germany
Bayerische Landesbank BHF-BANK Aktiengesellschaft Commerzbank A.G Deutsche Bank AG Deutsche Bank Privat-und Geschäftskunden
Aktiengesellschaft DZ Bank AG Deutsche Zentral-Genoschaftsbank HSH Nordbank AG Kreissparkasse Birkenfeld Kreissparkasse Esslingen-Nuertingen Kreissparkasse Heilbronn Kreissparkasse Köln Kreissparkasse Steinfurt Landesbank Baden-Württemberg Landesbank Hessen-Thüringen Girozentrale Norddeutsche Landesbank Girozentrale SEB AG Sparkasse Aachen Sparkasse Kraichgau Bruchsal-Bretten-Sinsheim Sparkasse Neuss-Zweckverbandssparkasse des
Rhein-Kreises Neuss, der Stadt Neuss, Stadt Korschenbroich und der Stadt Kaarst
Sparkasse Osnabrück Stadtsparkasse Düsseldorf Unicredit Bank AG WGZ-Bank AG Westdeutsche Genossenschafts
26. Greece
Alpha Bank AE Piraeus Bank SA
27. Hong Kong
CTBC Bank Co Ltd HBZ Finance Limited Habib Finance International Limited Standard Chartered Bank (Hong Kong) Limited UBAF (Hong Kong) Ltd
28. Hungary
Bank of China (Hungária) Hitelintézet Zrt Budapest Hitel-és Fejlesztési Bank Zrt CIB Bank Zrt Commerzbank Zrt Erste Bank Hungary Zrt OTP Bank Nyrt Raiffeisen Bank Zrt UniCredit Bank Hungary Zrt
29. India
HDFC Bank ICICI Bank Ltd Karur Vysya Bank Ltd., The Punjab National Bank Tamilnad Mercantile Bank Limited
30. Indonesia
PT Bank CIMB Niaga TBK PT Bank CTBC Indonesia PT Bank Danamon Indonesia, TBK PT Bank Mandiri (Persero) TbK PT Bank Negara Indonesia (Persero) TbK (BNI) PT Bank SBI
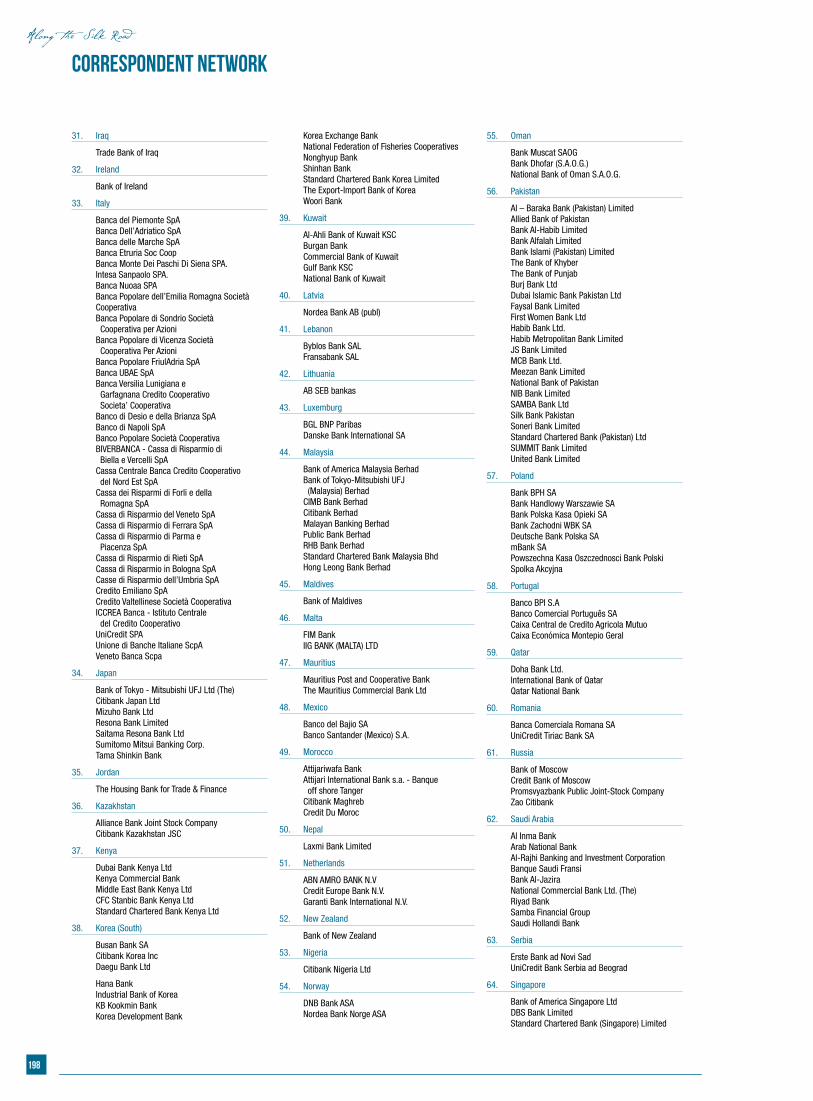
198
31. Iraq
Trade Bank of Iraq
32. Ireland
Bank of Ireland
33. Italy
Banca del Piemonte SpA Banca Dell’Adriatico SpA Banca delle Marche SpA Banca Etruria Soc Coop Banca Monte Dei Paschi Di Siena SPA. Intesa Sanpaolo SPA. Banca Nuoaa SPA Banca Popolare dell’Emilia Romagna Società
Cooperativa Banca Popolare di Sondrio Società Cooperativa per Azioni Banca Popolare di Vicenza Società Cooperativa Per Azioni Banca Popolare FriulAdria SpA Banca UBAE SpA Banca Versilia Lunigiana e Garfagnana Credito Cooperativo Societa’ Cooperativa Banco di Desio e della Brianza SpA Banco di Napoli SpA Banco Popolare Società Cooperativa BIVERBANCA - Cassa di Risparmio di Biella e Vercelli SpA Cassa Centrale Banca Credito Cooperativo del Nord Est SpA Cassa dei Risparmi di Forli e della Romagna SpA Cassa di Risparmio del Veneto SpA Cassa di Risparmio di Ferrara SpA Cassa di Risparmio di Parma e Piacenza SpA Cassa di Risparmio di Rieti SpA Cassa di Risparmio in Bologna SpA Casse di Risparmio dell’Umbria SpA Credito Emiliano SpA Credito Valtellinese Società Cooperativa ICCREA Banca - Istituto Centrale del Credito Cooperativo UniCredit SPA Unione di Banche Italiane ScpA Veneto Banca Scpa
34. Japan
Bank of Tokyo - Mitsubishi UFJ Ltd (The) Citibank Japan Ltd Mizuho Bank Ltd Resona Bank Limited Saitama Resona Bank Ltd Sumitomo Mitsui Banking Corp. Tama Shinkin Bank
35. Jordan
The Housing Bank for Trade & Finance
36. Kazakhstan
Alliance Bank Joint Stock Company Citibank Kazakhstan JSC
37. Kenya
Dubai Bank Kenya Ltd Kenya Commercial Bank Middle East Bank Kenya Ltd CFC Stanbic Bank Kenya Ltd Standard Chartered Bank Kenya Ltd
38. Korea (South)
Busan Bank SA Citibank Korea Inc Daegu Bank Ltd
Hana Bank Industrial Bank of Korea KB Kookmin Bank Korea Development Bank
Korea Exchange Bank National Federation of Fisheries Cooperatives Nonghyup Bank Shinhan Bank Standard Chartered Bank Korea Limited The Export-Import Bank of Korea Woori Bank
39. Kuwait
Al-Ahli Bank of Kuwait KSC Burgan Bank Commercial Bank of Kuwait Gulf Bank KSC National Bank of Kuwait
40. Latvia
Nordea Bank AB (publ)
41. Lebanon
Byblos Bank SAL Fransabank SAL
42. Lithuania
AB SEB bankas
43. Luxemburg
BGL BNP Paribas Danske Bank International SA
44. Malaysia
Bank of America Malaysia Berhad Bank of Tokyo-Mitsubishi UFJ (Malaysia) Berhad CIMB Bank Berhad Citibank Berhad Malayan Banking Berhad Public Bank Berhad RHB Bank Berhad Standard Chartered Bank Malaysia Bhd Hong Leong Bank Berhad
45. Maldives
Bank of Maldives
46. Malta
FIM Bank IIG BANK (MALTA) LTD
47. Mauritius
Mauritius Post and Cooperative Bank The Mauritius Commercial Bank Ltd
48. Mexico
Banco del Bajio SA Banco Santander (Mexico) S.A.
49. Morocco
Attijariwafa Bank Attijari International Bank s.a. - Banque off shore Tanger Citibank Maghreb Credit Du Moroc
50. Nepal
Laxmi Bank Limited
51. Netherlands
ABN AMRO BANK N.V Credit Europe Bank N.V. Garanti Bank International N.V.
52. New Zealand
Bank of New Zealand
53. Nigeria
Citibank Nigeria Ltd
54. Norway
DNB Bank ASA Nordea Bank Norge ASA
55. Oman
Bank Muscat SAOG Bank Dhofar (S.A.O.G.) National Bank of Oman S.A.O.G.
56. Pakistan
Al – Baraka Bank (Pakistan) Limited Allied Bank of Pakistan Bank Al-Habib Limited Bank Alfalah Limited Bank Islami (Pakistan) Limited The Bank of Khyber The Bank of Punjab Burj Bank Ltd Dubai Islamic Bank Pakistan Ltd Faysal Bank Limited First Women Bank Ltd Habib Bank Ltd. Habib Metropolitan Bank Limited JS Bank Limited MCB Bank Ltd. Meezan Bank Limited National Bank of Pakistan NIB Bank Limited SAMBA Bank Ltd Silk Bank Pakistan Soneri Bank Limited Standard Chartered Bank (Pakistan) Ltd SUMMIT Bank Limited United Bank Limited
57. Poland
Bank BPH SA Bank Handlowy Warszawie SA Bank Polska Kasa Opieki SA Bank Zachodni WBK SA Deutsche Bank Polska SA mBank SA Powszechna Kasa Oszczednosci Bank Polski
Spolka Akcyjna
58. Portugal
Banco BPI S.A Banco Comercial Português SA Caixa Central de Credito Agricola Mutuo Caixa Económica Montepio Geral
59. Qatar
Doha Bank Ltd. International Bank of Qatar Qatar National Bank
60. Romania
Banca Comerciala Romana SA UniCredit Tiriac Bank SA
61. Russia
Bank of Moscow Credit Bank of Moscow Promsvyazbank Public Joint-Stock Company Zao Citibank
62. Saudi Arabia
Al Inma Bank Arab National Bank Al-Rajhi Banking and Investment Corporation Banque Saudi Fransi Bank Al-Jazira National Commercial Bank Ltd. (The) Riyad Bank Samba Financial Group Saudi Hollandi Bank
63. Serbia
Erste Bank ad Novi Sad UniCredit Bank Serbia ad Beograd
64. Singapore
Bank of America Singapore Ltd DBS Bank Limited Standard Chartered Bank (Singapore) Limited
Correspondent Network
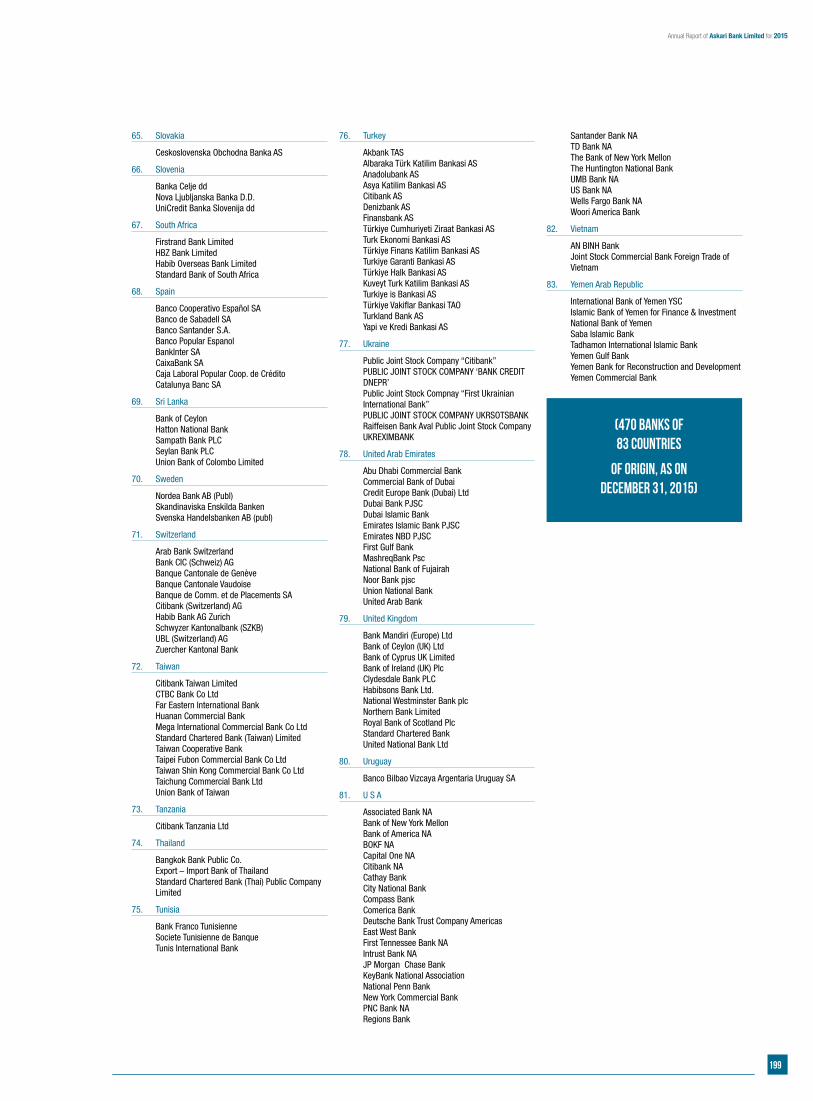
199
Annual Report of Askari Bank Limited for 2015
65. Slovakia
Ceskoslovenska Obchodna Banka AS
66. Slovenia
Banka Celje dd Nova Ljubljanska Banka D.D. UniCredit Banka Slovenija dd
67. South Africa
Firstrand Bank Limited HBZ Bank Limited Habib Overseas Bank Limited Standard Bank of South Africa
68. Spain
Banco Cooperativo Español SA Banco de Sabadell SA Banco Santander S.A. Banco Popular Espanol BankInter SA CaixaBank SA Caja Laboral Popular Coop. de Crédito Catalunya Banc SA
69. Sri Lanka
Bank of Ceylon Hatton National Bank Sampath Bank PLC Seylan Bank PLC Union Bank of Colombo Limited
70. Sweden
Nordea Bank AB (Publ) Skandinaviska Enskilda Banken Svenska Handelsbanken AB (publ)
71. Switzerland
Arab Bank Switzerland Bank CIC (Schweiz) AG Banque Cantonale de Genève Banque Cantonale Vaudoise Banque de Comm. et de Placements SA Citibank (Switzerland) AG Habib Bank AG Zurich Schwyzer Kantonalbank (SZKB) UBL (Switzerland) AG Zuercher Kantonal Bank
72. Taiwan
Citibank Taiwan Limited CTBC Bank Co Ltd Far Eastern International Bank Huanan Commercial Bank Mega International Commercial Bank Co Ltd Standard Chartered Bank (Taiwan) Limited Taiwan Cooperative Bank Taipei Fubon Commercial Bank Co Ltd Taiwan Shin Kong Commercial Bank Co Ltd Taichung Commercial Bank Ltd Union Bank of Taiwan
73. Tanzania
Citibank Tanzania Ltd
74. Thailand
Bangkok Bank Public Co. Export – Import Bank of Thailand Standard Chartered Bank (Thai) Public Company
Limited
75. Tunisia
Bank Franco Tunisienne Societe Tunisienne de Banque Tunis International Bank
76. Turkey
Akbank TAS Albaraka Türk Katilim Bankasi AS Anadolubank AS Asya Katilim Bankasi AS Citibank AS Denizbank AS Finansbank AS Türkiye Cumhuriyeti Ziraat Bankasi AS Turk Ekonomi Bankasi AS Türkiye Finans Katilim Bankasi AS Turkiye Garanti Bankasi AS Türkiye Halk Bankasi AS Kuveyt Turk Katilim Bankasi AS Turkiye is Bankasi AS Türkiye Vakiflar Bankasi TAO Turkland Bank AS Yapi ve Kredi Bankasi AS
77. Ukraine
Public Joint Stock Company “Citibank” PUBLIC JOINT STOCK COMPANY ‘BANK CREDIT
DNEPR’ Public Joint Stock Compnay “First Ukrainian
International Bank” PUBLIC JOINT STOCK COMPANY UKRSOTSBANK Raiffeisen Bank Aval Public Joint Stock Company UKREXIMBANK
78. United Arab Emirates
Abu Dhabi Commercial Bank Commercial Bank of Dubai Credit Europe Bank (Dubai) Ltd Dubai Bank PJSC Dubai Islamic Bank Emirates Islamic Bank PJSC Emirates NBD PJSC First Gulf Bank MashreqBank Psc National Bank of Fujairah Noor Bank pjsc Union National Bank United Arab Bank
79. United Kingdom
Bank Mandiri (Europe) Ltd Bank of Ceylon (UK) Ltd Bank of Cyprus UK Limited Bank of Ireland (UK) Plc Clydesdale Bank PLC Habibsons Bank Ltd. National Westminster Bank plc Northern Bank Limited Royal Bank of Scotland Plc Standard Chartered Bank United National Bank Ltd
80. Uruguay
Banco Bilbao Vizcaya Argentaria Uruguay SA
81. U S A
Associated Bank NA Bank of New York Mellon Bank of America NA BOKF NA Capital One NA Citibank NA Cathay Bank City National Bank Compass Bank Comerica Bank Deutsche Bank Trust Company Americas East West Bank First Tennessee Bank NA Intrust Bank NA JP Morgan Chase Bank KeyBank National Association National Penn Bank New York Commercial Bank PNC Bank NA Regions Bank
Santander Bank NA TD Bank NA The Bank of New York Mellon The Huntington National Bank UMB Bank NA US Bank NA Wells Fargo Bank NA Woori America Bank
82. Vietnam
AN BINH Bank Joint Stock Commercial Bank Foreign Trade of
Vietnam
83. Yemen Arab Republic
International Bank of Yemen YSC Islamic Bank of Yemen for Finance & Investment National Bank of Yemen Saba Islamic Bank Tadhamon International Islamic Bank Yemen Gulf Bank Yemen Bank for Reconstruction and Development Yemen Commercial Bank
(470 Banks of 83 Countries
of Origin, as on December 31, 2015)
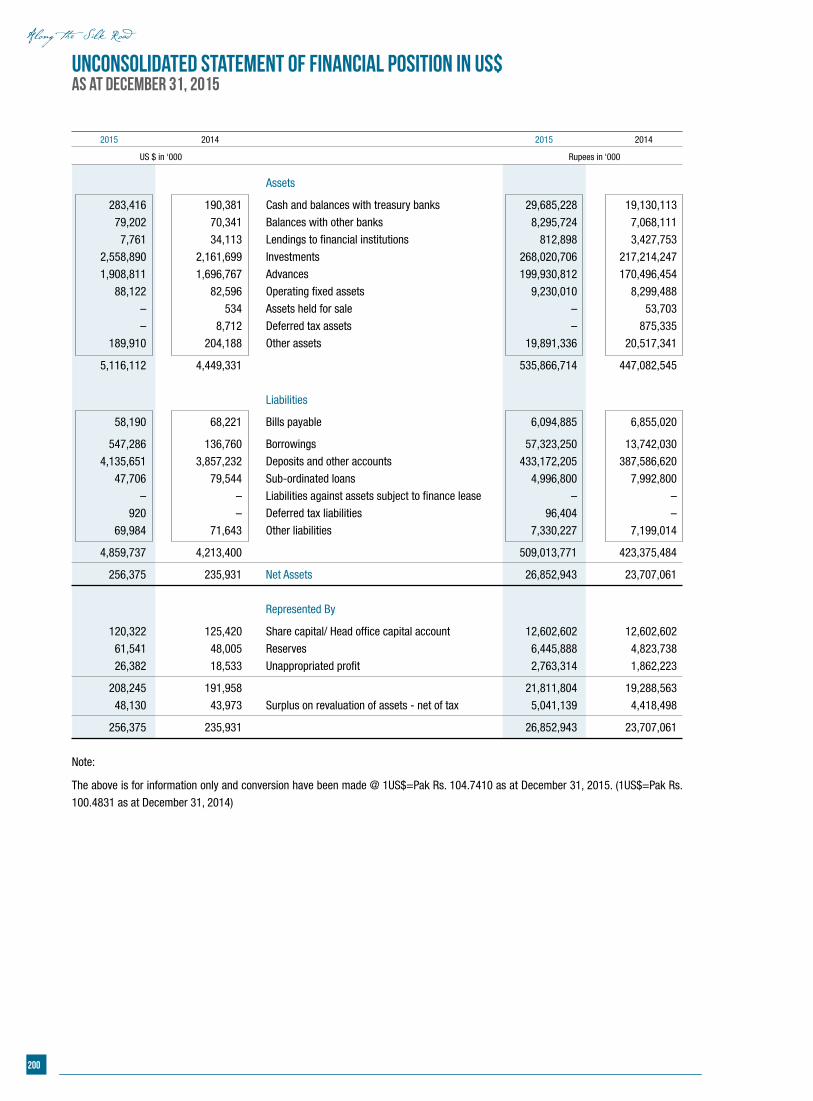
200
2015 2014 2015 2014
US $ in ‘000 Rupees in ‘000
Assets
283,416 190,381 Cash and balances with treasury banks 29,685,228 19,130,113
79,202 70,341 Balances with other banks 8,295,724 7,068,111
7,761 34,113 Lendings to financial institutions 812,898 3,427,753
2,558,890 2,161,699 Investments 268,020,706 217,214,247
1,908,811 1,696,767 Advances 199,930,812 170,496,454
88,122 82,596 Operating fixed assets 9,230,010 8,299,488
– 534 Assets held for sale – 53,703
– 8,712 Deferred tax assets – 875,335
189,910 204,188 Other assets 19,891,336 20,517,341
5,116,112 4,449,331 535,866,714 447,082,545
Liabilities
58,190 68,221 Bills payable 6,094,885 6,855,020
547,286 136,760 Borrowings 57,323,250 13,742,030
4,135,651 3,857,232 Deposits and other accounts 433,172,205 387,586,620
47,706 79,544 Sub-ordinated loans 4,996,800 7,992,800
– – Liabilities against assets subject to finance lease – –
920 – Deferred tax liabilities 96,404 –
69,984 71,643 Other liabilities 7,330,227 7,199,014
4,859,737 4,213,400 509,013,771 423,375,484
256,375 235,931 Net Assets 26,852,943 23,707,061
Represented By
120,322 125,420 Share capital/ Head office capital account 12,602,602 12,602,602
61,541 48,005 Reserves 6,445,888 4,823,738
26,382 18,533 Unappropriated profit 2,763,314 1,862,223
208,245 191,958 21,811,804 19,288,563
48,130 43,973 Surplus on revaluation of assets - net of tax 5,041,139 4,418,498
256,375 235,931 26,852,943 23,707,061
Note:
The above is for information only and conversion have been made @ 1US$=Pak Rs. 104.7410 as at December 31, 2015. (1US$=Pak Rs.
100.4831 as at December 31, 2014)
Unconsolidated Statement of Financial Position in US$ As at December 31, 2015
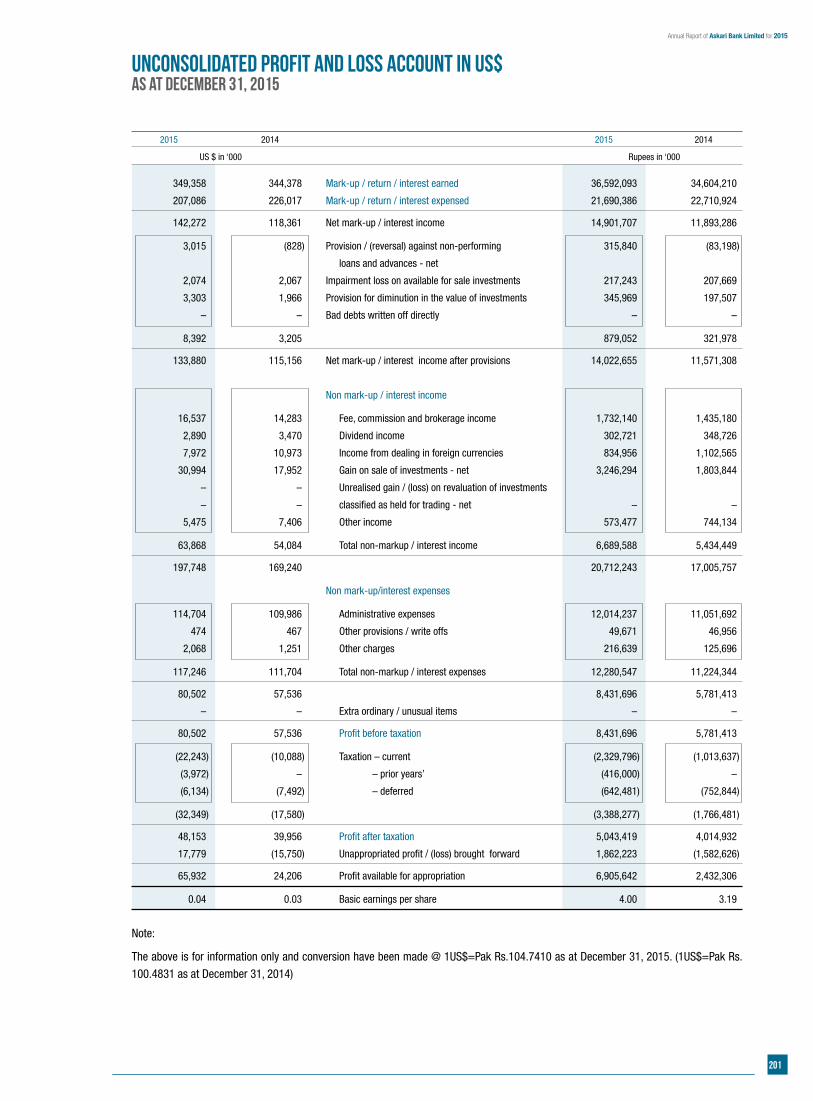
201
Annual Report of Askari Bank Limited for 2015
Unconsolidated Profit and Loss Account in US$ As at December 31, 2015
2015 2014 2015 2014
US $ in ‘000 Rupees in ‘000
349,358 344,378 Mark-up / return / interest earned 36,592,093 34,604,210
207,086 226,017 Mark-up / return / interest expensed 21,690,386 22,710,924
142,272 118,361 Net mark-up / interest income 14,901,707 11,893,286
3,015 (828) Provision / (reversal) against non-performing 315,840 (83,198)
loans and advances - net
2,074 2,067 Impairment loss on available for sale investments 217,243 207,669
3,303 1,966 Provision for diminution in the value of investments 345,969 197,507
– – Bad debts written off directly – –
8,392 3,205 879,052 321,978
133,880 115,156 Net mark-up / interest income after provisions 14,022,655 11,571,308
Non mark-up / interest income
16,537 14,283 Fee, commission and brokerage income 1,732,140 1,435,180
2,890 3,470 Dividend income 302,721 348,726
7,972 10,973 Income from dealing in foreign currencies 834,956 1,102,565
30,994 17,952 Gain on sale of investments - net 3,246,294 1,803,844
– – Unrealised gain / (loss) on revaluation of investments
– – classified as held for trading - net – –
5,475 7,406 Other income 573,477 744,134
63,868 54,084 Total non-markup / interest income 6,689,588 5,434,449
197,748 169,240 20,712,243 17,005,757
Non mark-up/interest expenses
114,704 109,986 Administrative expenses 12,014,237 11,051,692
474 467 Other provisions / write offs 49,671 46,956
2,068 1,251 Other charges 216,639 125,696
117,246 111,704 Total non-markup / interest expenses 12,280,547 11,224,344
80,502 57,536 8,431,696 5,781,413
– – Extra ordinary / unusual items – –
80,502 57,536 Profit before taxation 8,431,696 5,781,413
(22,243) (10,088) Taxation – current (2,329,796) (1,013,637)
(3,972) – – prior years’ (416,000) –
(6,134) (7,492) – deferred (642,481) (752,844)
(32,349) (17,580) (3,388,277) (1,766,481)
48,153 39,956 Profit after taxation 5,043,419 4,014,932
17,779 (15,750) Unappropriated profit / (loss) brought forward 1,862,223 (1,582,626)
65,932 24,206 Profit available for appropriation 6,905,642 2,432,306
0.04 0.03 Basic earnings per share 4.00 3.19
Note:
The above is for information only and conversion have been made @ 1US$=Pak Rs.104.7410 as at December 31, 2015. (1US$=Pak Rs.
100.4831 as at December 31, 2014)
202
Notes
AGMWednesday, March 30, 2016 at 10:00 am
at Pearl Continental Hotel, Rawalpindi

203
Annual Report of Askari Bank Limited for 2015
Notes

204
Notes

205
Annual Report of Askari Bank Limited for 2015
Form of ProxyAskari Bank Limited
I / We of
being member(s) of
Askari Bank Limited (“the Bank”), holding ordinary shares, do hereby
appoint of
or failing
him / her of
, who is also
me / us, and on my / our behalf at the 24th Annual General Meeting of the Bank to be held on Wednesday, March 30, 2016 at 10:00 am at Pearl Continental Hotel,
Rawalpindi and at any adjournment thereof.
As witness my / our hand this day of 2016.
Witnesses No. 1: Witnesses No. 2:
Name: Name:
C.N.I.C. No. / Passport No.: C.N.I.C. No. / Passport No.:
Address: Address:
NOTES:
A. General:
1. A member entitled to attend and vote at the meeting is entitled to appoint a proxy to attend and vote for him/her. No person shall act as a proxy, who is not a member of the Bank except that Government of Pakistan / State Bank of Pakistan / corporate entity may appoint a person who is not a member.
2. The instrument appointing a proxy should be signed by the member or his/her attorney duly authorized in writing. If the member is a corporate entity (other than Government of Pakistan and State Bank of Pakistan), its common seal should be affixed on the instrument.
3. The instrument appointing a proxy, together with Power of Attorney, if any, under which it is signed or a notarially certified copy thereof, should be deposited, with the Company Secretary, Askari Bank Limited, 1st Floor, AWT Plaza, The Mall, P. O. Box No. 1084, Rawalpindi not less than 48 hours before the time of holding the meeting.
4. If a member appoints more than one proxy, and more than one instrument of proxy is deposited by a member, all such instruments of proxy shall be rendered invalid.
B. For CDC Account Holders
1. The proxy form shall be witnessed by two persons whose names, addresses and CNIC numbers shall be mentioned on the form.
2. Copies of the CNIC or passport of the beneficial owners and the proxy shall be furnished with the proxy form.
3. The proxy shall produce his / her original CNIC or original passport at the time of the meeting.
4. In case of Government of Pakistan / State Bank of Pakistan / Corporate entity, the Board of Directors’ resolution / power of attorney with specimen signature shall be submitted along with proxy form to the Bank.
(Member’s signature onRs. 5/– Revenue Stamp

206
The Company Secretary:
ASKARI BANK LIMITEDAWT Plaza, The Mall, P.O. Box No. 1084,
Rawalpindi – Pakistan.
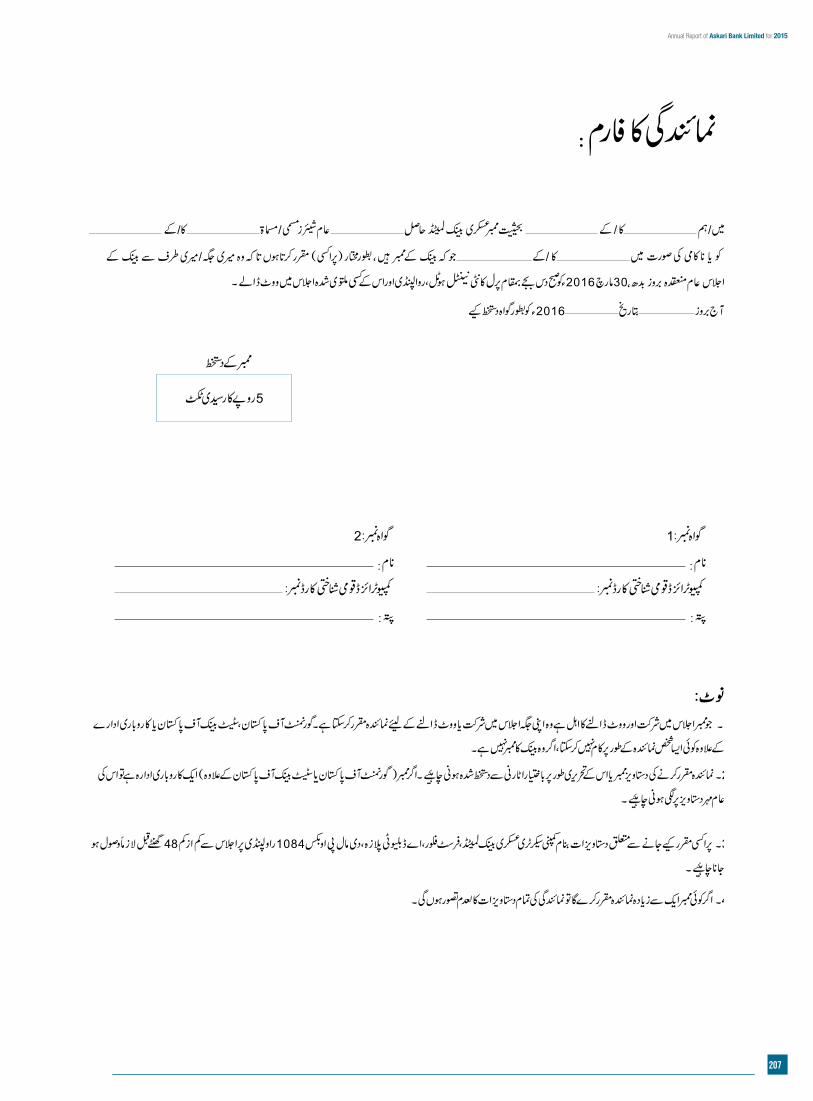
207
Annual Report of Askari Bank Limited for 2015
2

208
The Company Secretary:
ASKARI BANK LIMITEDAWT Plaza, The Mall, P.O. Box No. 1084,
Rawalpindi – Pakistan.
In compliance with the Securities and Exchange Commission of Pakistan’s SRO 924(1)/2015 dated September 9, 2015, investors’ attention is invited to the following infor-mational message:

aKbl.com.pk