Embed Size (px)
Citation preview
Patient ID
Diagnosis Age Donor Type
Conditioning Regimen
GVHD prophylaxis
GVHD onset
Follow-up (m)
GVHD (I-IV)
GVHD site
AAT Dose
Response
JJC001 (004)
CMML 35 PBSC Cy/TBI CSA/MMF D+49 6 III Liver/Gut 90-30 mg/kg
PR (deceased)
BAS002 (005)
CLL 58 PBSC Flu/TBI CSA D+221 6 III Gut 90-30 mg/kg
CR
DM003 (006)
AML 50 PBSC Bu/Cy CSA/MMF D+71 1 III Gut 90-30 mg/kg
CR
WC004 (007)
NHL 59 PBSC Flu/TBI CSA/MMF/Siro D+37 1 IV Gut 90-30 mg/kg
CR (CMV/Perf)
JW005 (008)
ALL 50 MMUCB Flu/Cy/Thi/TBI CSP/MMF D+34 1 IV Liver/Gut 90-30 mg/kg
PR (deceased)
ML006 (009)
AML 58 PBSC Clo/TBI CSA/MMF D+93 2 III Gut 90-30 mg/kg
CR (ARDS/CMV/Perf)
XX007 (010)
T-ALL 35 MMUCB Flu/Cy/TBI CSA/MMF D+70 1 III Liver/Gut 90-60 mg/kg
PR
Alpha 1 Anti-Trypsin (AAT) offers potent therapy for Steroid Resistant Gut GVHD: Interim Results of a Phase I/II Clinical Study
A.Mario Marcondes1,2 Terry Fulong1, Mohamed L. Sorror1,2, Ekapun Karoopongse1, Marina Lesnikova1, Sabina Janciauskiene3,
Charles A Dinarello4 , David Hockenbery1,2 and H. Joachim Deeg1,2
1) Clinical Research Division, Fred Hutchinson Cancer Research Center, 2) Division of Oncology, University of Washington, Seattle, Washington 3) Respiratory Medicine, Hannover Medical School, Hannover, Germany 4) Department of Medicine, University of Colorado Denver, Aurora, Colorado.
Summary and Conclusion
• Continuous administration of AAT as salvage therapy for steroid resistant gut GVHD is feasible without clinically
toxicity.
• Stool showed a decrease in intestinal AAT loss with AAT treatment, as measured by AAT clearance and
endoscopic evaluation suggesting healing of the bowel mucosa.
• AAT administration suppressed serum levels of pro-inflammatory cytokines, and interfered with GVHD
manifestation.
• In summary, Preliminary results are encouraging, and further exploration of AAT therapy in extended phase II
and randomized trials as therapy of steroid refractory acute GVHD or as first line therapy are warranted.
Table 1: Clinical Parameters in AAT-Treated Subjects
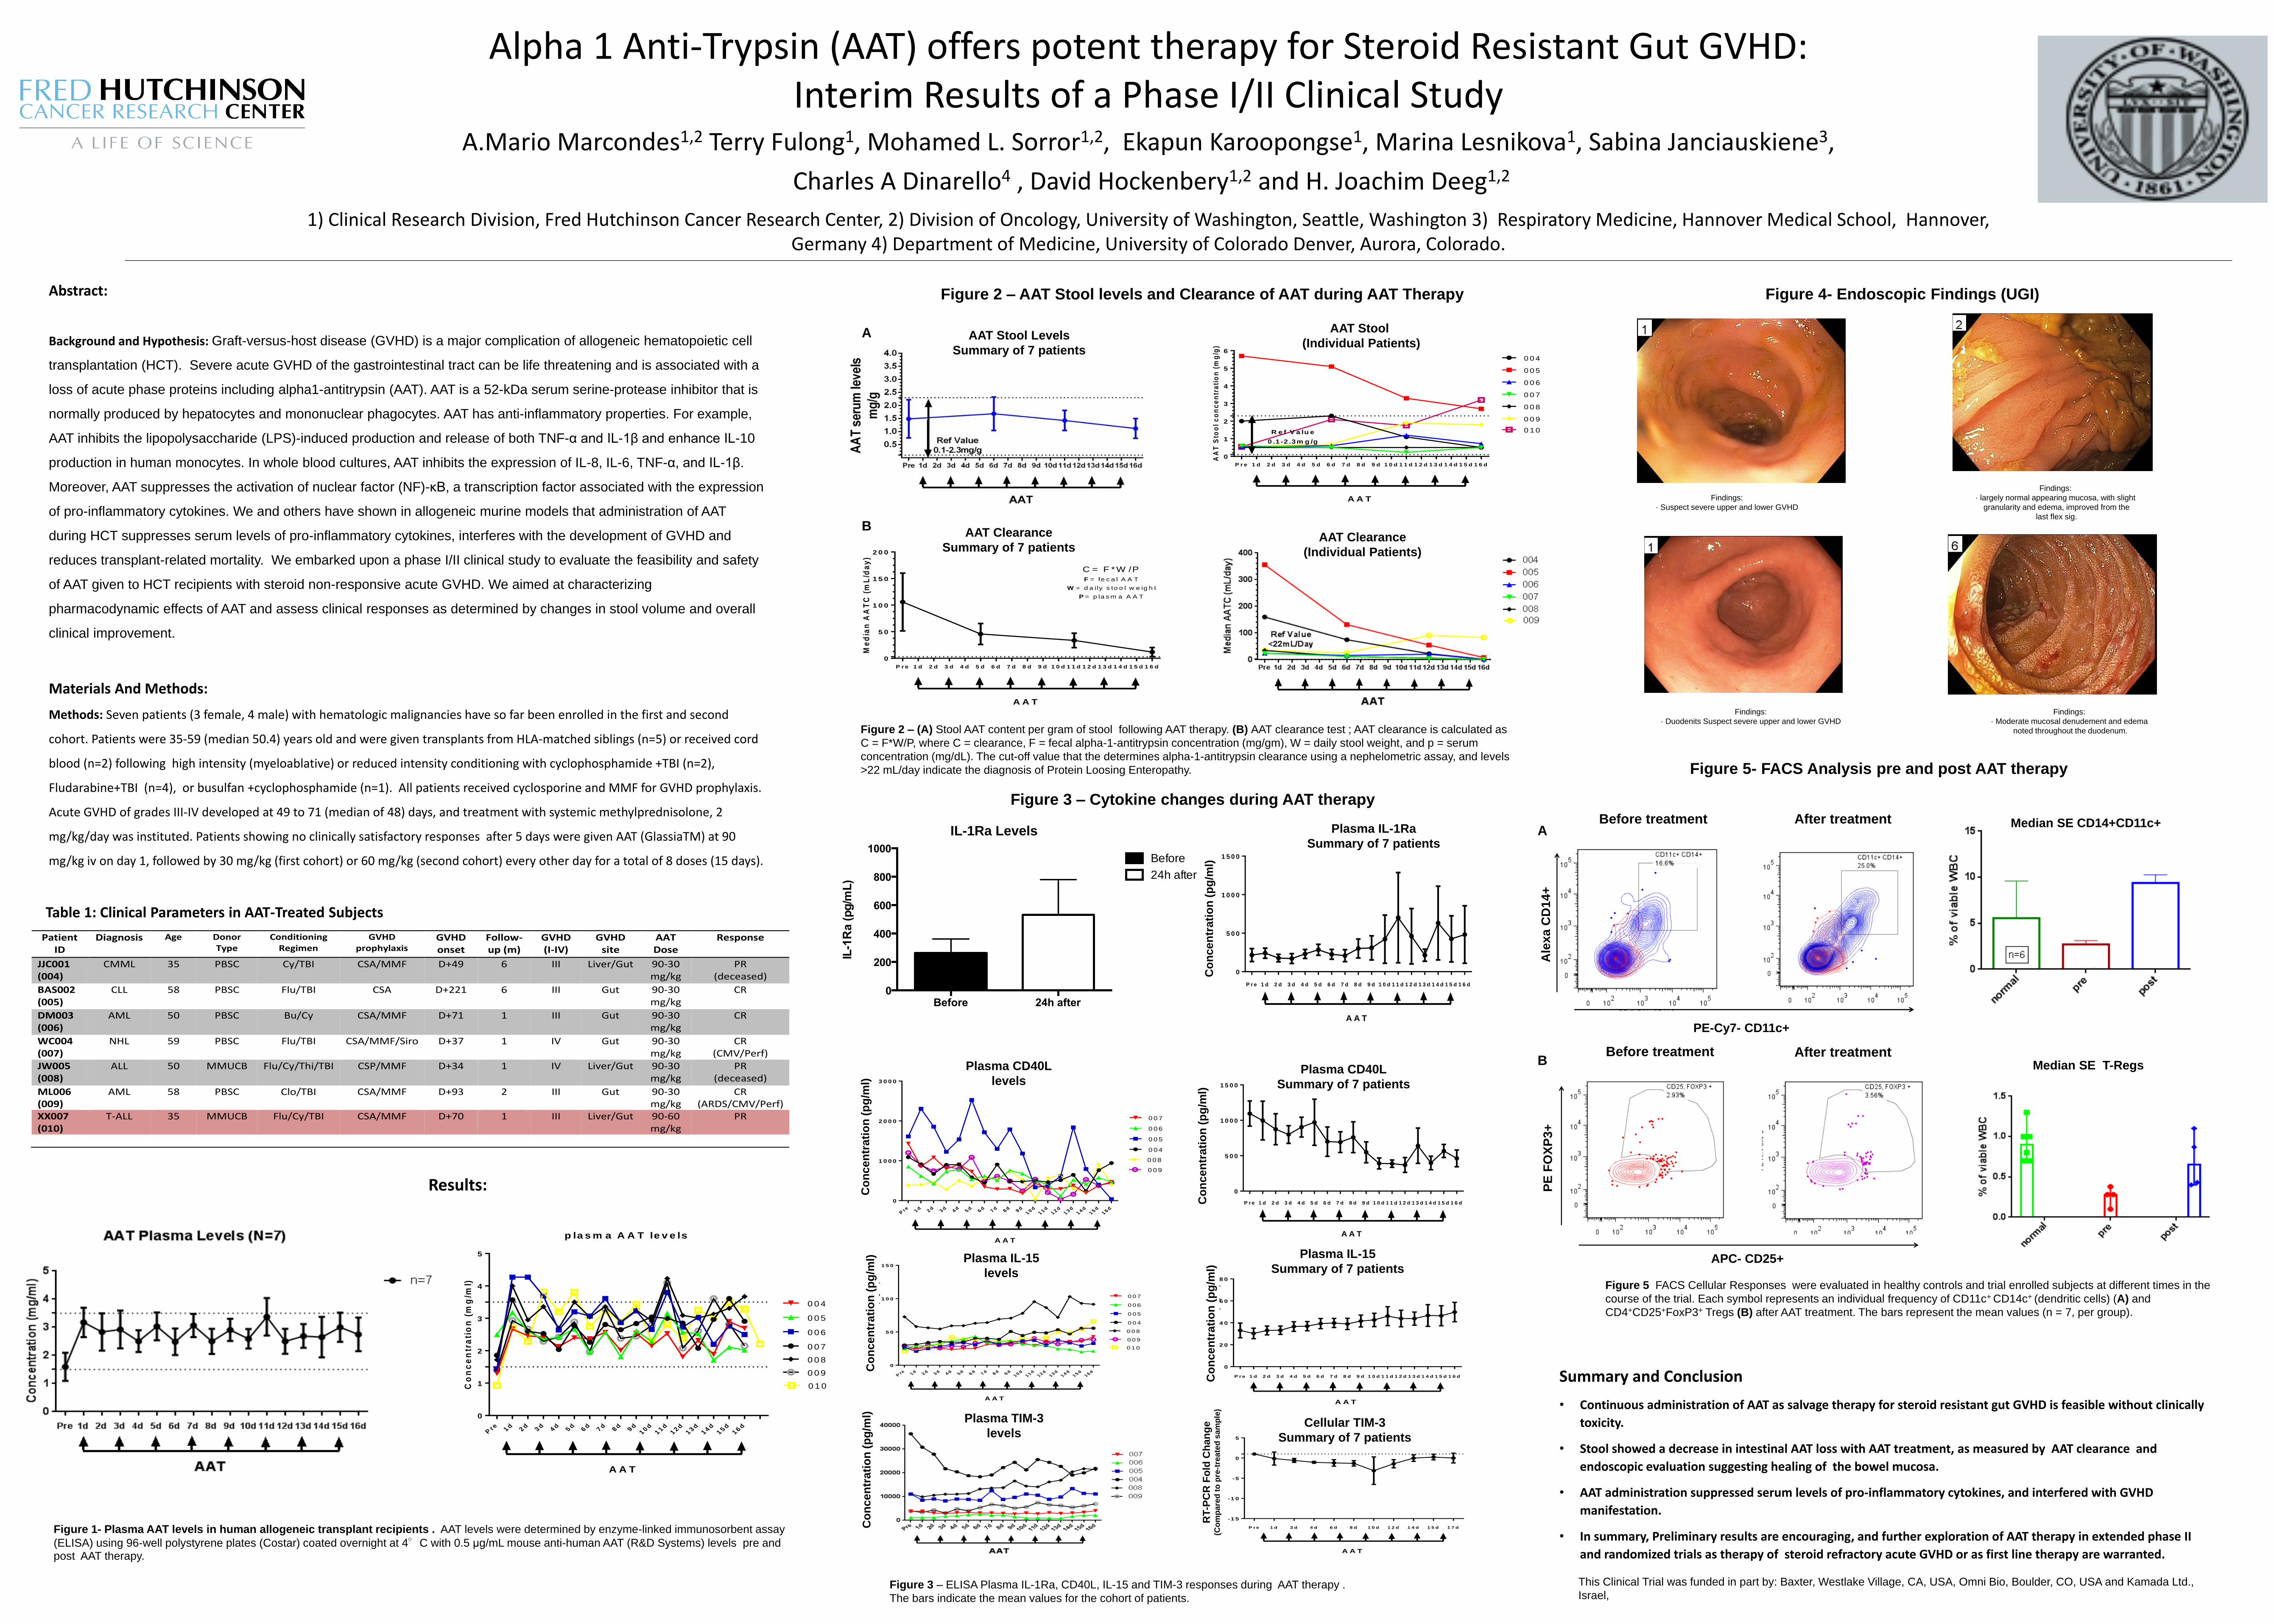
Figure 2 – AAT Stool levels and Clearance of AAT during AAT Therapy
Results:
A
Figure 4- Endoscopic Findings (UGI)
Abstract:
Background and Hypothesis: Graft-versus-host disease (GVHD) is a major complication of allogeneic hematopoietic cell
transplantation (HCT). Severe acute GVHD of the gastrointestinal tract can be life threatening and is associated with a
loss of acute phase proteins including alpha1-antitrypsin (AAT). AAT is a 52-kDa serum serine-protease inhibitor that is
normally produced by hepatocytes and mononuclear phagocytes. AAT has anti-inflammatory properties. For example,
AAT inhibits the lipopolysaccharide (LPS)-induced production and release of both TNF-α and IL-1β and enhance IL-10
production in human monocytes. In whole blood cultures, AAT inhibits the expression of IL-8, IL-6, TNF-α, and IL-1β.
Moreover, AAT suppresses the activation of nuclear factor (NF)-κB, a transcription factor associated with the expression
of pro-inflammatory cytokines. We and others have shown in allogeneic murine models that administration of AAT
during HCT suppresses serum levels of pro-inflammatory cytokines, interferes with the development of GVHD and
reduces transplant-related mortality. We embarked upon a phase I/II clinical study to evaluate the feasibility and safety
of AAT given to HCT recipients with steroid non-responsive acute GVHD. We aimed at characterizing
pharmacodynamic effects of AAT and assess clinical responses as determined by changes in stool volume and overall
clinical improvement.
Materials And Methods:
Methods: Seven patients (3 female, 4 male) with hematologic malignancies have so far been enrolled in the first and second
cohort. Patients were 35-59 (median 50.4) years old and were given transplants from HLA-matched siblings (n=5) or received cord
blood (n=2) following high intensity (myeloablative) or reduced intensity conditioning with cyclophosphamide +TBI (n=2),
Fludarabine+TBI (n=4), or busulfan +cyclophosphamide (n=1). All patients received cyclosporine and MMF for GVHD prophylaxis.
Acute GVHD of grades III-IV developed at 49 to 71 (median of 48) days, and treatment with systemic methylprednisolone, 2
mg/kg/day was instituted. Patients showing no clinically satisfactory responses after 5 days were given AAT (GlassiaTM) at 90
mg/kg iv on day 1, followed by 30 mg/kg (first cohort) or 60 mg/kg (second cohort) every other day for a total of 8 doses (15 days).
Figure 1- Plasma AAT levels in human allogeneic transplant recipients . AAT levels were determined by enzyme-linked immunosorbent assay
(ELISA) using 96-well polystyrene plates (Costar) coated overnight at 4°C with 0.5 μg/mL mouse anti-human AAT (R&D Systems) levels pre and post AAT therapy.
Figure 2 – (A) Stool AAT content per gram of stool following AAT therapy. (B) AAT clearance test ; AAT clearance is calculated as
C = F*W/P, where C = clearance, F = fecal alpha-1-antitrypsin concentration (mg/gm), W = daily stool weight, and p = serum
concentration (mg/dL). The cut-off value that the determines alpha-1-antitrypsin clearance using a nephelometric assay, and levels
>22 mL/day indicate the diagnosis of Protein Loosing Enteropathy.
Figure 3 – ELISA Plasma IL-1Ra, CD40L, IL-15 and TIM-3 responses during AAT therapy .
The bars indicate the mean values for the cohort of patients.
Figure 5- FACS Analysis pre and post AAT therapy
Co
nc
en
tra
tio
n (
mg
/ml)
Pre 1
d2
d3
d4
d5
d6
d7
d8
d9
d1
0d
11
d1
2d
13
d1
4d
15
d1
6d
0
1
2
3
4
5
A A T
p la s m a A A T le v e ls
0 0 7
0 0 6
0 0 5
0 0 4
0 0 8
0 0 9
0 1 0
AA
T S
too
l c
on
ce
ntr
ati
on
(m
g/g
)
P r e 1 d 2 d 3 d 4 d 5 d 6 d 7 d 8 d 9 d 1 0 d 1 1 d 1 2 d 1 3 d 1 4 d 1 5 d 1 6 d
0
1
2
3
4
5
6
A A T
A A T S to o l
0 0 4
0 0 5
R e f V a lu e
0 .1 -2 .3m g /g
0 0 6
0 0 7
0 0 8
0 0 9
0 1 0
Me
dia
n A
AT
C (
mL
/da
y)
P r e 1 d 2 d 3 d 4 d 5 d 6 d 7 d 8 d 9 d 1 0 d 1 1 d 1 2 d 1 3 d 1 4 d 1 5 d 1 6 d
0
5 0
1 0 0
1 5 0
2 0 0
A A T
C le a ra n c e A A T
S u m m a ry o f 7 p a tie n ts
C = F *W /PF = fe c a l A A T
W = d a ily s to o l w e ig h t
P = p la s m a A A T
Findings:
· largely normal appearing mucosa, with slight
granularity and edema, improved from the
last flex sig.
Findings:
· Suspect severe upper and lower GVHD
Findings:
· Moderate mucosal denudement and edema
noted throughout the duodenum.
Findings:
· Duodenits Suspect severe upper and lower GVHD
Absolute Il-1R a levels (n=9)
Before 24h after0
200
400
600
800
1000IL
-1R
a (p
g/m
L)
Before
24h after
Co
nc
en
tra
tio
n (
pg
/ml)
P r e 1 d 2 d 3 d 4 d 5 d 6 d 7 d 8 d 9 d 1 0 d 1 1 d 1 2 d 1 3 d 1 4 d 1 5 d 1 6 d
0
5 0 0
1 0 0 0
1 5 0 0
A A T
p la s m a IL 1 R a le v e ls
n = 6
Pre 1 d 2 d 3 d 4 d 5 d 6 d 7 d 8 d 9 d
1 0 d1 1 d
1 2 d1 3 d
1 4 d1 5 d
1 6 d
0
1 0 0 0
2 0 0 0
3 0 0 0
Co
nc
en
tra
tio
n (
mg
/ml)
A A T
p la s m a C D 4 0 L le v e ls
0 0 4
0 0 5
0 0 6
0 0 7
0 0 8
0 0 9
Co
nc
en
tra
tio
n (
pg
/ml)
P r e 1 d 2 d 3 d 4 d 5 d 6 d 7 d 8 d 9 d 1 0 d 1 1 d 1 2 d 1 3 d 1 4 d 1 5 d 1 6 d
0
5 0 0
1 0 0 0
1 5 0 0
A A T
n = 6
p la s m a C D 4 0 L le v e ls
Co
nc
en
tra
tio
n (
mg
/ml)
P r e 1 d 2 d 3 d 4 d 5 d 6 d 7 d 8 d 9 d 1 0 d 1 1 d 1 2 d 1 3 d 1 4 d 1 5 d 1 6 d
0
2 0
4 0
6 0
8 0
A A T
p la s m a IL -1 5 le v e ls (n = 7 )
n = 7
Co
nc
en
tra
tio
n (
mg
/ml)
Pre 1 d 2 d 3 d 4 d 5 d 6 d 7 d 8 d 9 d
1 0 d1 1 d
1 2 d1 3 d
1 4 d1 5 d
1 6 d
0
5 0
1 0 0
1 5 0
A A T
p la s m a IL -1 5 le v e ls
0 0 4
0 0 5
0 0 6
0 0 7
0 0 8
0 0 9
0 1 0
fold
ch
an
ge
( c
om
pa
red
to
pre
tre
ate
d s
am
ple
)
P r e 1 d 3 d 4 d 6 d 8 d 1 0 d 1 2 d 1 4 d 1 5 d 1 7 d
-1 5
-1 0
-5
0
5
A A T
T IM -3
n = 7
Before treatment After treatment
Before treatment After treatment
This Clinical Trial was funded in part by: Baxter, Westlake Village, CA, USA, Omni Bio, Boulder, CO, USA and Kamada Ltd.,
Israel,
Figure 5 FACS Cellular Responses were evaluated in healthy controls and trial enrolled subjects at different times in the
course of the trial. Each symbol represents an individual frequency of CD11c+ CD14c+ (dendritic cells) (A) and
CD4+CD25+FoxP3+ Tregs (B) after AAT treatment. The bars represent the mean values (n = 7, per group).
IL-1Ra Levels
Figure 3 – Cytokine changes during AAT therapy
A
B AAT Clearance
Summary of 7 patients AAT Clearance
(Individual Patients)
AAT Stool
(Individual Patients) AAT Stool Levels
Summary of 7 patients
Median SE CD14+CD11c+
Median SE T-Regs
Ale
xa
CD
14+
A
lexa
CD
14+
P
E F
OX
P3+
PE-Cy7- CD11c+
APC- CD25+
Co
nc
en
tra
tio
n (
pg
/ml)
C
on
ce
ntr
ati
on
(p
g/m
l)
Co
nc
en
tra
tio
n (
pg
/ml)
C
on
ce
ntr
ati
on
(p
g/m
l)
Co
nc
en
tra
tio
n (
pg
/ml)
Co
nc
en
tra
tio
n (
pg
/ml)
Plasma IL-1Ra
Summary of 7 patients
Plasma CD40L
Summary of 7 patients
Plasma IL-15
Summary of 7 patients
Cellular TIM-3
Summary of 7 patients
Plasma CD40L
levels
Plasma IL-15
levels
Plasma TIM-3
levels
RT
-PC
R F
old
Ch
an
ge
(C
om
pa
red
to
pre
-tre
ate
d s
am
ple
)
A
B