Embed Size (px)
Citation preview

ALPHA EFFECTIVENESS MODELING CURRENT AND FUTURE LIGHT-DUTY VEHICLE & POWERTRAIN TECHNOLOGIES
Daniel Barba, DirectorNational Center for Advanced Technology
Office of Transportation and Air QualityOffice of Air and Radiation
U.S. Environmental Protection Agency
January 20, 2016
2016 SAE Government-Industry Meeting

SAE INTERNATIONAL 2016 GOVERNMENT-INDUSTRY MEETING
1) ALPHA Model Background
2) Engine/Vehicle Benchmarking & ALPHA Model Validation• Component Data• Vehicle Operational Rules
3) Technology Packages – Putting it all Together
4) Looking Forward - Sample Technology Package
Topics
2US ENVIRONMENTAL PROTECTION AGENCY

SAE INTERNATIONAL 2016 GOVERNMENT-INDUSTRY MEETING
• The 2017-2025 Light-Duty Greenhouse Gas rule requires EPA to conduct a Midterm Evaluation (MTE), in coordination with NHTSA and CARB, to assess the appropriateness of the MY 2022-2025 standards
• As part of this assessment, EPA will review the costs and effectiveness of technologies available to automobile manufacturers to meet the emission standards in MY 2022-2025
• To assess the synergistic effects of vehicle technologies, EPA has enhanced its ALPHA model with more detailed and recent vehicle and component level benchmarking data to better simulate operation of current and future vehicles
• ALPHA is EPA’s tool for understanding vehicle behavior, effectiveness of various powertrain technologies and their greenhouse gas emissions
Background
3US ENVIRONMENTAL PROTECTION AGENCY
NOTE: This presentation focuses on the scientific development behind EPA’s vehicle simulation and modeling, which is one tool we plan to use during the MTE.
**Data presented in this briefing are NOT MTE RESULTS.
SAE INTERNATIONAL 2016 GOVERNMENT-INDUSTRY MEETING
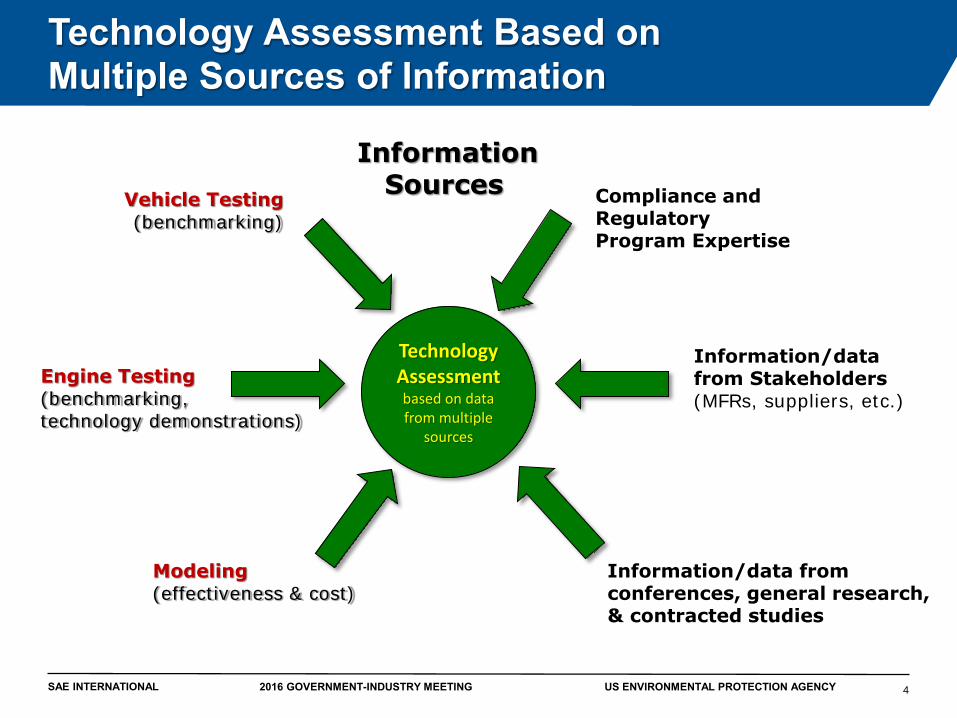
Technology Assessment Based onMultiple Sources of Information
4
Information/data from Stakeholders(MFRs, suppliers, etc.)
Information/data from conferences, general research, & contracted studies
Technology Assessment based on data from multiple
sources
Compliance and Regulatory Program Expertise
Engine Testing(benchmarking, technology demonstrations)
Vehicle Testing(benchmarking)
Modeling(effectiveness & cost)
InformationSources
US ENVIRONMENTAL PROTECTION AGENCY

SAE INTERNATIONAL 2016 GOVERNMENT-INDUSTRY MEETING
• ALPHA is an Advanced Light-Duty Powertrain and Hybrid Analysis tool created by EPA to estimate greenhouse gas (GHG) emissions from current and future light-duty vehicles.
• ALPHA is a physics-based, forward-looking, full vehicle computer simulation capable of analyzing various vehicle types combined with different powertrain technologies.
• ALPHA is not a commercial product (e.g. there are no user manuals, tech support hotlines, graphical user interfaces, or full libraries of components).
Why was ALPHA developed?• EPA’s objective in its rulemaking processes is to achieve the highest level of
transparency and openness possible.• ALPHA is EPA’s engineering tool to explore the impacts of current & emerging
low-GHG technologies.• EPA needed a model for HD Compliance anyway (GEM), so adding a LD
model (ALPHA) could be done cost-effectively.
What is ALPHA?
5US ENVIRONMENTAL PROTECTION AGENCY

SAE INTERNATIONAL 2016 GOVERNMENT-INDUSTRY MEETING
ALPHA’s Role in the Overall Modeling of Potential Compliance Pathways
US ENVIRONMENTAL PROTECTION AGENCY
Focus of this presentation

SAE INTERNATIONAL 2016 GOVERNMENT-INDUSTRY MEETING
ALPHA inputs fall into one of four categories:
1. Test Cycleo Drive cycle speed (e.g., FTP, HWFET, US06)
2. Vehicle Parameterso Weight / inertia, road load, driveline type or vehicle class
3. Component Datao Engine fuel consumption map, torque curveso Transmission gear ratios, spin losses, efficiencies, torque converter specso Accessory loads
4. Vehicle Behavioro Shift strategy, torque converter strategy, driver behavior, idle speed
management, pedal map, other dynamic effects
ALPHA Model Inputs and Data Processing
7US ENVIRONMENTAL PROTECTION AGENCY

SAE INTERNATIONAL 2016 GOVERNMENT-INDUSTRY MEETING
Sample Model Validation: 2013 Chevy Malibu 1LSVehicle and Component Information
8
240
24
0
242242
244
24
4
244
246
246
246
248
24
8
24
8
248
250
25
0
250
25
0
255
255
255
255
255265
265
265
265
265
285
285
285
285
305
305
30530
5
335
335
335
375
375
375
43
0
430
430
50
0
500
500
58
5
585585
70
5
705705
86
0
860860
1065 10651065
1345 1345 13451720 1720 17202235 2235 2235
Speed ( RPM )
Torq
ue (
Nm
)
Chevy Malibu 2.5L BSFC Map
5 kW 10 kW
30 kW
50 kW
70 kW
90 kW
110 kW
130 kW
150 kW
170 kW
1000 1500 2000 2500 3000 3500 4000 4500 5000 5500 60000
50
100
150
200
250
SAE Figure 10. Chevy Malibu 2.5L BSFC map (87 AKI E10 gasoline)
SAE 2015-01-1140
US ENVIRONMENTAL PROTECTION AGENCY
SAE Figure 6. Transmission efficiency data at 93 C and 10 bar line pressure
2.5L I4 GDI, Non-Hybrid22 City / 34 Highway / 26 CombChosen as representative of an average midsize car

SAE INTERNATIONAL 2016 GOVERNMENT-INDUSTRY MEETING
Bridging the Gap Between a Simulation and a Real Vehicle Accounting for All the Fuel Consumed
9
• Vehicle simulation models tend to under-predict fuel consumption (over-predict fuel economy) because they often overlook fuel used to manage a vehicle’s “overhead” functions, including extra fuel required for:
o heavy transient operationo accessory loads (power steering, A/C, electronics, etc.)o torque transitions related to performance and drivability o special controls for emissionso NVH considerations
• One of the primary goals of EPA’s extensive engine and vehicle benchmarking program is to identify appropriate modeling “rules” that can account for these vehicle operating requirements.
SAE 2015-01-1140
US ENVIRONMENTAL PROTECTION AGENCY
Determining Malibu’s Operational Rules1. Dynamic Fuel Effects – acceleration
2. Dynamic Fuel Effects – tip-in
3. Decel-Fuel-Cutoff – transitions during decel.
4. Idle Speed Control
5. Torque Converter Slip
6. Variable Accessory Loads
• We have embedded these rules within ALPHA to account for some of the most significant factors requiring extra use of fuel.

SAE INTERNATIONAL 2016 GOVERNMENT-INDUSTRY MEETING
566 568 570 572 574 576 578 580 5820
1
2
3
4
5
6
x 10-4
Time (S)
Fue
l Rat
e (g
allo
ns/s
ec)
Fuel Rate with and without Acceleration Penalty
Data
Model
Model w/o Accel Penalty
Bridging the Model Validation GapDynamic Fuel Effects – Acceleration and Torque Converter Slip
Sample 1: Transient Fuel Use• Top figure shows the difference between
the fuel rate predicted by a simple model (green) and the measured fuel rate (red).
• The blue shows the model result including an acceleration-based fuel penalty.
• This penalty is most obvious on the US06 or during transient torque converter slip.
Sample 2: Torque Converter Slip• Earlier versions of ALPHA had a simple
“lockup” strategy, which was then updated to account for limited-slip operation
SAE 2015-01-1140
10US ENVIRONMENTAL PROTECTION AGENCY
350 360 370 380 390 400 410 420 430
1800
1900
2000
2100
2200
2300
2400
2500
Time (S)
Spe
ed (
RP
M)
Engine Speed with Torque Converter Slip (EPA US06)
Test
Model
Trans Input
Note: EPA plans to describe ALPHA’s vehicle control rules further in upcoming SAE publications and the draft TAR

SAE INTERNATIONAL 2016 GOVERNMENT-INDUSTRY MEETING
Sample Model ValidationFuel Economy Results
0
5
10
15
20
25
30
35
40
45
50
UD
DS
Bag 1
data
UD
DS
Bag 2
data
UD
DS
data
HW
FE
data
US
06 B
ag 1
data
US
06 b
ag 2
data
US
06 d
ata
Fuel E
conom
y (
MP
G)
Fuel Economy 3625 lbs ETW
Test Avg
Model Avg
Range
0
5
10
15
20
25
30
35
40
45
50
UD
DS
Bag 1
data
UD
DS
Bag 2
data
UD
DS
Tota
l data
HW
FE
data
US
06 B
ag 1
data
US
06 b
ag 2
data
US
06 T
ota
l data
LA
92 B
ag 1
data
LA
92 b
ag 2
data
LA
92 T
ota
l data
Fuel E
conom
y (
MP
G)
Fuel Economy 4000 lbs ETW
Test Avg
Model Avg
Range
Test Average Test MPG
Average ModelMPG Error %
UDDS Phase 1 30.40 30.69 0.95UDDS Phase 2 26.66 26.39 -0.99
HWFET 45.96 45.92 -0.10US06 Phase 1 17.88 17.84 -0.22US06 Phase 2 33.70 33.86 0.49
Test Average Test MPG
Average ModelMPG Error %
UDDS Phase 1 29.87 29.55 -1.10UDDS Phase 2 26.01 25.55 -1.75
HWFET 42.03 41.91 -0.28US06 Phase 1 16.84 16.54 -1.78US06 Phase 2 29.96 30.60 2.15LA92 Phase 1 18.40 17.92 -2.61LA92 Phase 2 26.84 26.57 -1.02
SAE 2015-01-1140
11US ENVIRONMENTAL PROTECTION AGENCY

SAE INTERNATIONAL 2016 GOVERNMENT-INDUSTRY MEETING
Vehicle Component Benchmarking
12
Conventional Vehicle Engine Transmission Primary Reasons for BenchmarkingALPHA
Validation
1 2013 Focus (Euro) 1.6L I4 EcoBoost (Euro) 6MT large volume turbo, VVT, EURO-cal efficiency map partial
2 2013 PSA PSA 1.6L turbo --- efficiency map
3 2015 Volvo S60 T5 2.0L I4 turbo 8AT I4 with 8AT, start-stop yes
4 2016 Honda Civic 1.5L turbo CVT 1.5L turbo, CVT yes
5 2016 Acura ILX 2.4L I4 turbo DCT8 w/TC DCT8 with torque converter yes
6 2013 Escape 1.6L I4 EcoBoost 6AT large volume turbo, VVT, US-cal efficiency map yes
7 2014 RAM 1500 EcoDiesel 3.0L V6 diesel (VM Matori) 8AT (845RE) 8AT yes
8 2015 Ford F-150 2.7L EcoBoost V66AT (same as GM
6L80)
next generation EcoBoost with VVT, integrated exhause
manifold, twin-scroll turbo, start-stop, US-cal efficiency mapyes
9 2013 Malibu Base 2.5L I4 GDI engine 6AT (6T40) shift algorithm, transient fueling yes
10 2013 Chevrolet Malibu Eco 2.4L I4 6AT (6T40) BAS operation, start-stop
11 2013 Jetta hybrid 1.4L I4 P2, DCT7 DCT operation, P2 hybrid operation yes
12 2013 Mercedes E350 ETEC diesel 7AT diesel operation, 7AT yes
13 2013 Altima SV 2.5L I4 Jatco CVT8 CVT operation yes
14 2014 US Mazda 6 SkyActiv 2.5L I4 6MT
15 2014 US Mazda 3 SkyActiv 2.0L I4, 13:1CR 6AT advanced NA engine operation partial
16 2014 Dodge Charger 5-spd 3.6L V6 5AT (NAG1) 5-speed operation yes
17 2014 Dodge Charger 8-spd 3.6L V6 8AT (8HP45) 8AT to compare with 5AT with same engine yes
18 2014 RAM 1500 HFE 3.6L V6 8AT (845RE) 8-speed operation yes
19 2014 Chevy Silverado 1500 2WD 4.3L EcoTec3 V6/V3 6AT (6L80 MYC) cylinder deactivation, limited 6AT benchmarking yes
20 2015 BMW X5 xDrive 35d 3.0L I6 Diesel 8AT (845RE) yes
Turb
o e
ngi
ne
tru
ck/S
UV
Nat
ura
lly
Asp
irat
ed
en
gin
e
car
car
tru
ck/S
UV
US ENVIRONMENTAL PROTECTION AGENCY

SAE INTERNATIONAL 2016 GOVERNMENT-INDUSTRY MEETING
Technology Packaging Matrix“Putting It All Together”
13
3 Engines: Baseline - Camry 2.4L I4 engine from the 2010 Ricardo
analysis for LD GHG Federal Rulemaking (FRM)
2014 NA - Mazda SkyActiv 2.0L I4 13:1 compression-ratio engine
Future TDS – 24 bar down-sized turbo with cooled EGR from the 2010 Ricardo analysis for LD GHG Federal Rulemaking (FRM)
5 Transmissions: 2008 AT5 – parameters from vehicle testing
2013 AT6 – GM6T40, parameters from vehicle testing
2014 AT8 – FCA845RE, parameters from EPA trans stand testing
Future AT8 gen3 – constructed using paper published by ZF
Future damp DCT8 – constructed using DCT7 data provided by a supplier
4 reductions of Mass: Base (0% reduction) 5% reduction 10% reduction 15% reduction
3 reductions of Aerodynamic resistance (Cd): Base (0% reduction) 10% reduction 20% reduction
3 reductions of Rolling Resistance (Crr): Base (0% reduction) 10% reduction 20% reduction
2 modes of 12 volt Start-Stop technology: Base (0% start-stop) 100% start-stop
US ENVIRONMENTAL PROTECTION AGENCY
StdCAR Matrix 1080 Vehicle Packages
SAE INTERNATIONAL 2016 GOVERNMENT-INDUSTRY MEETING
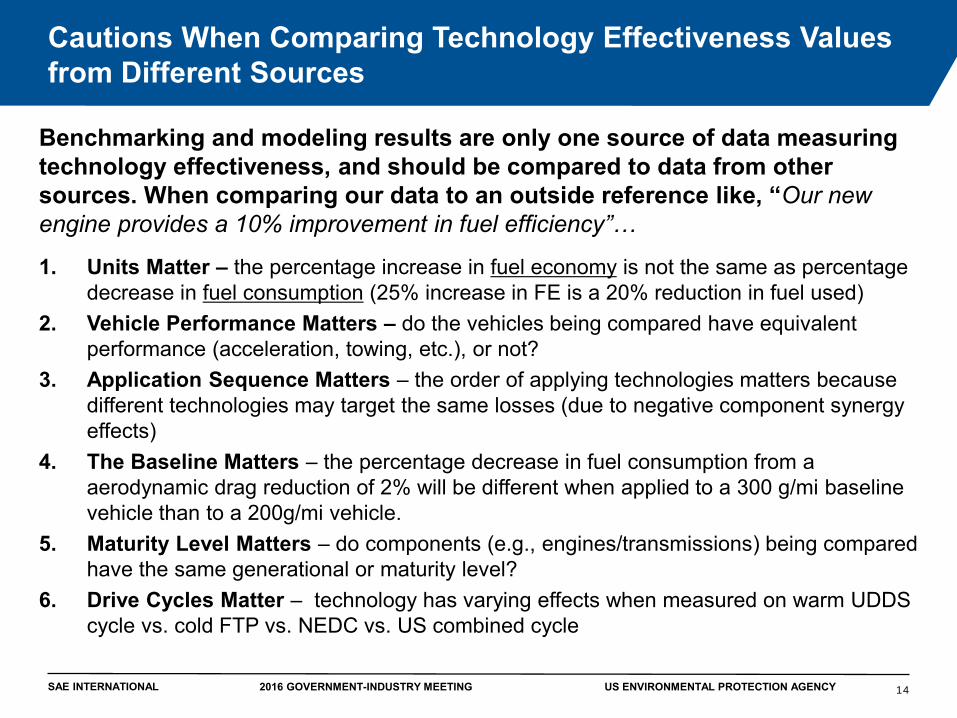
Benchmarking and modeling results are only one source of data measuring technology effectiveness, and should be compared to data from other sources. When comparing our data to an outside reference like, “Our new engine provides a 10% improvement in fuel efficiency”…
1. Units Matter – the percentage increase in fuel economy is not the same as percentage decrease in fuel consumption (25% increase in FE is a 20% reduction in fuel used)
2. Vehicle Performance Matters – do the vehicles being compared have equivalent performance (acceleration, towing, etc.), or not?
3. Application Sequence Matters – the order of applying technologies matters because different technologies may target the same losses (due to negative component synergy effects)
4. The Baseline Matters – the percentage decrease in fuel consumption from a aerodynamic drag reduction of 2% will be different when applied to a 300 g/mi baseline vehicle than to a 200g/mi vehicle.
5. Maturity Level Matters – do components (e.g., engines/transmissions) being compared have the same generational or maturity level?
6. Drive Cycles Matter – technology has varying effects when measured on warm UDDS cycle vs. cold FTP vs. NEDC vs. US combined cycle
Cautions When Comparing Technology Effectiveness Values from Different Sources
14US ENVIRONMENTAL PROTECTION AGENCY

SAE INTERNATIONAL 2016 GOVERNMENT-INDUSTRY MEETING
Problem Statement:• Many fuel consumption reduction technologies
decrease required wheel power, increase available engine power, or deliver power to wheels more efficiently
• If applied blindly, these technologies will reduce fuel consumption while also improving acceleration performance
• How do we “fairly compare” technologies that affect both fuel consumption and acceleration performance?
ALPHA’s Current Approach:• Reduce engine size to attain equivalent acceleration
performance
Technology Effectiveness:Fuel Consumption and Performance
15US ENVIRONMENTAL PROTECTION AGENCY
How do these two technologies
compare?
Comparing “equivalent acceleration”
NAS 2011: “Objective comparisons of the cost-effectiveness of different technologies for reducing FC can be made only when vehicle performance remains equivalent.”

SAE INTERNATIONAL 2016 GOVERNMENT-INDUSTRY MEETING
Technology Packaging MatrixPreliminary results
16US ENVIRONMENTAL PROTECTION AGENCY
Preliminary data for illustrative purposes only to explain the analysis methodology
StdCAR Matrix: 1080 Vehicle Packages
Case study on next slide

SAE INTERNATIONAL 2016 GOVERNMENT-INDUSTRY MEETING
Validated baseline test results with certification results & chassis test data for 2014 Mazda3HIL w/ALPHA allows evaluation with different powertrains and/or road load conditions
What if…We replicate a modeling run in the test cell?
17
Simulate a hypothetical mid-size vehicle with 2.0L SkyActiv-G in the test cell• Simulated chassis drive cycles using an engine dyno w/ Hardware-in-Loop
(HIL) version of ALPHA
CycleTotal
Fuel (g)
IdleFuel (g)
AdjustedFuel (g)
FE(mpg)
g/miCO2
HIL L1FTP (total) 257.9 12.8 245.1 43.0 206.7
HWFE 64.5 137.7
Combined 50.6 175.6
HIL L2FTP (total) 247.6 12.2 235.4 44.3 200.8
HWFE 67.1 132.4
Combined 52.3 170.0
• Applied Adv. ZF 8HP50 8-sp AT and 12V start/stop
• Applied 2 levels of road load reduction
• L1: 10% mass↓, 20% RR↓, 20% aero drag↓ (~2025 FRM analysis)
• L2: 15% mass↓, 30% RR↓, 25% aero drag↓ (sensitivity analysis)
The HIL test results suggest that this hypothetical vehicle has potential to reach these
levels with the existing 2.0L Skyactiv engine.
US ENVIRONMENTAL PROTECTION AGENCY

SAE INTERNATIONAL 2016 GOVERNMENT-INDUSTRY MEETING
Lumped Parameter
Model (LPM)Vehicle Technology
Packages
ALPHA
OMEGA
Efficiency Projections for Future Vehicles
Lab & other data from MY2013-16 veh’s
used to validate ALPHA
Model a future fleet‘scompliance with light-
duty GHG standards
Other information sources
Wrap UpALPHA Process Summary
18US ENVIRONMENTAL PROTECTION AGENCY
• Data is obtained from multiple sources, including benchmarking lab data• Data is used to calibrate and validate ALPHA modeling• ALPHA can look at multiple packages and multiple case studies simultaneously• Combinations of the best available technologies can be used to make efficiency
projections for future vehicles• Going forward, test data and modeling results will be used to update LPM
Focus of this presentation

SAE INTERNATIONAL 2016 GOVERNMENT-INDUSTRY MEETING
Questions?
19US ENVIRONMENTAL PROTECTION AGENCY


![HOMOLOGY MODELING OF ALPHA- SYNUCLEIN (SNCA ... MODELING...Homology modeling [4] is currently the most accurate computational method [3] to generate reliable structural models and](https://img.pdfslide.net/doc/110x75/60fffa7f52e6de6bf34d31e5/homology-modeling-of-alpha-synuclein-snca-modeling-homology-modeling-4.jpg)