Embed Size (px)
Citation preview

7506 N. Broadway Ext. • Oklahoma City, OK 73116 • 800.222.2811 • amered.com
September 2010
Sample Reports A+nyWhere Learning System® Version 3.5

TABLE OF CONTENTS
1
REPORT WIZARD OVERVIEW
Overview of the HTML/CSV Reports .................................................................................. 4 Launching the Report Wizard ............................................................................................. 7 Using the Report Wizard .................................................................................................... 8
USERS MANAGEMENT REPORTS
List of Active Students ...................................................................................................... 10 List of Active Students by Grade ...................................................................................... 11 List of Active Students by School ..................................................................................... 12 List of Active Users ........................................................................................................... 13 List of Active Users by Grade ........................................................................................... 14 List of Active Users by School .......................................................................................... 15 List of Inactive Users ........................................................................................................ 16 Matrix Reports .................................................................................................................. 17 Schoolwide Student Summary Report** ........................................................................... 21 Student Assignment Detail Schoolwide** ......................................................................... 22 Student Class Assignments** ........................................................................................... 24 Student Progress - Selected Students ............................................................................. 25 Student-Class Assignments ............................................................................................. 27 Titles Needed for Prescriptions ........................................................................................ 29 Titles Not Owned** ........................................................................................................... 30 User’s Rights .................................................................................................................... 31
CLASSES MANAGEMENT REPORTS
Assessment Benchmark Performance ............................................................................. 32 Class Assess Benchmark Performance** ........................................................................ 35 Class Roster ..................................................................................................................... 36 Class Roster for Scanning ................................................................................................ 37 List of Active Classes ....................................................................................................... 38 List of Active Classes by School....................................................................................... 39 List of Inactive Classes ..................................................................................................... 40
ASSIGNMENT MANAGEMENT REPORTS
Activity Usage - by Class .................................................................................................. 41 Adaptive Assessment Comparison .................................................................................. 43 Class ALS Skills Mastered** ............................................................................................. 45 Class Assessment Detail** ............................................................................................... 46 Class Assignment Detail** ................................................................................................ 47 Class Assignment Test Detail (by student)** .................................................................... 48 Class Assignment Test Summary** ................................................................................. 50 Class Roster ..................................................................................................................... 52 Class Standard Attainment** ............................................................................................ 53 Classwide Activity Comparison ........................................................................................ 54 Classwide Activity Comparison** ...................................................................................... 56 Classwide Course Assessment** ..................................................................................... 57 Classwide Student Assignment Lists ............................................................................... 58 Course Assessment Detail ............................................................................................... 59 Course Assessment Detail** ............................................................................................ 61
WARNING
It is critical that your workstations and A+LS server be set to the correct date and time. Otherwise your student A+LS™ activities will not reflect the correct date information, throwing off many of your reports.

TABLE OF CONTENTS
2
ASSIGNMENT MANAGEMENT REPORTS (Continued)
LLS Student Progress ...................................................................................................... 62 LLS Student Progress** .................................................................................................... 64 Standard Attainment - by Class ........................................................................................ 65 Standard Attainment - Selected Students ........................................................................ 68 Standard Mastery by Adaptive Assessment ..................................................................... 70 Student ALS Skills Mastered** ......................................................................................... 71 Student Assessment Detail by Date Range** .................................................................. 72 Student Assessment Detail with Score** .......................................................................... 73 Student Assessment Detail** ............................................................................................ 74 Student Assignment Detail Classwide** ........................................................................... 75 Student Assignment Detail** ............................................................................................ 76 Student Assignment List ................................................................................................... 77 Student Progress - by Class ............................................................................................. 78 Student Progress - Selected Students ............................................................................. 81 Student Progress Report by Date Range** ...................................................................... 83 Student Standard Attainment**......................................................................................... 85 Total Usage Time - by Student ......................................................................................... 86
CURRICULUM AUTHORING REPORTS
A+ District Driven Assessments ....................................................................................... 87 All Titles Not Owned** ...................................................................................................... 89 List of Activities ................................................................................................................. 90 List of Subjects ................................................................................................................. 91 Titles Not Owned .............................................................................................................. 92
SKILLS MANAGEMENT REPORTS
Activity Alignment ............................................................................................................. 93 List of Standards ............................................................................................................... 95 Standards-Activity Alignment** ......................................................................................... 96
STANDARDS MANAGEMENT REPORTS
List of ALS Skills ............................................................................................................... 97 List of Strands ................................................................................................................... 98
ADMINISTRATION MANAGEMENT REPORTS
Activity Usage - by Class .................................................................................................. 99 Activity Usage - Selected Students ................................................................................ 102 Assessment Benchmark Performance ........................................................................... 104 Course Assessment Summary ....................................................................................... 107 Course Assessment Summary** .................................................................................... 109 Grade Level Improvement .............................................................................................. 110 List of Curriculum Areas** .............................................................................................. 112 List of Grade Levels** ..................................................................................................... 113 List of Languages** ........................................................................................................ 114 List of Programs** ........................................................................................................... 115 NCLB Report .................................................................................................................. 116 Standard Attainment - by Class ...................................................................................... 117 Standard Attainment - Selected Students ...................................................................... 120 Student Progress - by Class ........................................................................................... 123 Student Progress - Selected Students ........................................................................... 127 Total Usage Time - by Site ............................................................................................. 130 Total Usage Time - by Student ....................................................................................... 132 Total Usage Time by Site** ............................................................................................ 133 Total Usage Time by Student** ...................................................................................... 134

TABLE OF CONTENTS
3
A+, A+nyWhere Learning System, A+dvanced Learning System, A+LS, A+ District Driven Assessment, and Learning Letter Sounds are either trademarks or registered trademarks of The American Education Corporation. Because AEC has provided leading educational software products bearing the A+ logo for over 10 years, AEC was granted registered incontestable rights to the A+ logo for educational software in 1997. Microsoft, Excel, and/or other Microsoft products referenced herein are either trademarks or registered trademarks of Microsoft. The trade names and trademarks used throughout this book are not intended to convey endorsement of or other affiliations with this book. © Copyright 2010 The American Education Corporation. All rights reserved. No part of this book may be reproduced, stored in a retrieval system, or transcribed, in any form or by any means, without the prior written permission of the publisher, The American Education Corporation, Oklahoma City, 73116.

REPORT WIZARD OVERVIEW
4
Overview of the HTML/CSV Reports A+LS™ Version 3.5 includes all of the reports found in Version 3, including the original format reports as well as the HTML/CSV reports. The HTML/CSV reports supersede 35 old style reports with streamlined report generation, greater detail, and the choice of outputting the reports to a browser or spreadsheet/database.
Features of the HTML/CSV Reports There are a wide variety of features and great flexibility to be found:
• Some HTML/CSV reports let you “drill down” as far as three levels of data. In the figure below, for example, when you click on the Level 1 skill hotlink (blue underlined text), Level 2 opens, summarizing student performance. At Level 2, when you click on a student’s name, Level 3 opens, revealing the student’s performance on that particular skill.
• Some HTML/CSV reports have either bar or pie charts (see the figures below). Watch for the View Chart hotlink. Clicking on it automatically opens the appropriate chart.
• The streamlined report generation results in simplified navigation through dialog boxes. For example, the old Classwide Course Assessment report required navigation through a total of eight dialog boxes to get to the printable results screen. The HTML/CSV Course Assessment Detail report only requires navigation through four screens. The new report also provides more information, such as percentage gain as well as a summation of ALS Lesson activity between the Course Assessment test dates.

REPORT WIZARD OVERVIEW
5
• All HTML/CSV reports can be generated as either web (.HTML) or comma delimited (.CSV) files. This allows viewing of and working with the A+LS data in a browser, spreadsheet, or third-party database. For more information, please see the section Viewing, Printing, and Data Exporting below.
Replacing the Old Reports Many of the HTML/CSV reports supersede old reports of the same or similar name. Some of the HTML/CSV reports replace multiple reports or present the data in an improved format. There is not always a direct correlation between the old and HTML/CSV reports. Please keep this in mind as you use the table below. The table below lists the old reports that have been superseded (marked in the A+LS Report Wizard with two asterisks) and their corresponding HTML/CSV replacements.
Old Reports (**) HTML/CSV Reports
Users Management Schoolwide Student Summary Report Student Progress - Selected Students Student Assignment Detail Schoolwide (See Administration Management reports) Student Class Assignments Student-Class Assignments Titles Not Owned Titles Needed for Prescriptions
Classes Management Class Assess Benchmark Performance Assessment Benchmark Performance
Assignment Management Adaptive Assessment Comparison Adaptive Assessment Comparison
Class ALS Skills Mastered Assessment Benchmark Performance (in Classes)
Class Assessment Detail Assessment Benchmark Performance (in Classes)
Class Assignment Detail Student Progress - by Class Class Assignment Test Detail (by student) Student Progress - by Class Class Assignment Test Summary Student Progress - by Class Class Standard Attainment Standard Attainment - by Class Classwide Activity Comparison Classwide Activity Comparison Classwide Course Assessment Activity Usage - by Class Course Assessment Detail Course Assessment Detail LLS™ Student Progress LLS Student Progress Standard Mastery by Adaptive Assessment Standard Mastery by Adaptive Assessment Student ALS Skills Mastered Standard Attainment - Selected Students Student Assessment Detail Standard Attainment - Selected Students Student Assessment Detail by Date Range Standard Attainment - Selected Students Student Assessment Detail with Score Standard Attainment - Selected Students Student Assignment Detail Student Progress - Selected Students Student Assignment Detail Classwide Student Progress - by Class Student Progress Report by Date Range Student Progress - by Class Student Standard Attainment Standard Attainment - Selected Students Total Usage Time by Student Total Usage Time by Student

REPORT WIZARD OVERVIEW
6
Old Reports (**) HTML/CSV Reports
Curriculum Authoring A+® District Driven Assessments™ A+ District Driven Assessment Results All Titles Not Owned Titles Not Owned
Standards Management Standards-Activity Alignment Activity Alignment
Skills Management (No changes) (No changes)
Administration Management
Adaptive Test Comparison Adaptive Assessment Comparison (in Assignments)
Course Assessment Summary Course Assessment Summary List of Curriculum Areas (No replacement) List of Grade Levels (No replacement) List of Languages (No replacement) List of Programs (No replacement) Total Usage Time by Site Total Usage Time - by Site (No corresponding old report) Activity Usage - by Class (No corresponding old report) Activity Usage - Selected Students (No corresponding old report) Grade Level Improvement (No corresponding old report) Standard Attainment - by Class (No corresponding old report) Standard Attainment - Selected Students (No corresponding old report) Student Progress - by Class (No corresponding old report) Student Progress - by Selected Students
As you browse the reports in the A+LS client, you can get more information on the individual reports by selecting “details”. A help page will open that includes report samples, explanations for each column of data, and step-by-step instructions.

REPORT WIZARD OVERVIEW
7
Launching the Report Wizard The A+nyWhere Learning System courseware program contains many reporting features to help educators monitor student and class progress and report results. Reports are accessed using one of the seven windows in the management system, typically through the Report Wizard available on both the menu bar and the tool bar, as shown in the figure below.
Frequently accessed reports are also available via the right click options on management window "tree" objects. In the example below, the teacher right clicked on her class, opening a pop-up menu that included Reports and its options.
Using the right click approach will generate reports specifically for the items selected on the "tree".

REPORT WIZARD OVERVIEW
8
Using the Report Wizard Since the Report Wizard works basically the same for any report from any screen, getting the hang of it once is all you need.
1. Click , the Report Wizard icon, on the right side of the toolbar. The same icon is used to access the Report Wizard on every management screen.
2. Click the pull-down menu to view the list of reports, scrolling down if necessary.
Note that old style reports have two asterisks (**) at the end of their titles. For each report so marked, there is a new report covering the same data that can be generated as .HTML and .CSV files (see the table on pages 5 and 6).
3. Click on the report of your
choice, then click Next.
4. You may be asked to select active users, the school, grade, class, etc. as appropriate to the report, depending on what report you selected.
5. Some reports let you select multiple objects to report.
6. Each time you make a selection, click Next to proceed to the next step.
7. Click the Date buttons to change the date range settings.
8. At this point, the old and new reports diverge:
New Reports - Select either .HTML (web browser format) or .CSV (comma delimited for spreadsheets and databases) and your report will automatically open in the appropriate application. There are no further steps required.
OR Old Reports - Header and Footer Setup can be customized any way you want, but at least including the Report Title, Class Name, Date, and Page Number is recommended. Old reports continue with the following steps.
9. Click Report Title, then click Add Header.
10. If appropriate, click on the name of the object being reported on, such as User Name,
then Add Header.
11. Click Date, then click Add Footer.
12. Put a check mark next to Footer for a page number.
13. You may change the order of the items in the Header List and the Footer List by clicking the appropriate Order button, dragging the items, then clicking Apply, and Close.
14. When ready, click Next to display report data.
15. Click Print Preview to see on screen how it will look on paper. Nothing will be printed
yet.
WARNING
It is critical that your workstations and A+LS server be set to the correct date and time. Otherwise your student A+LS activities will not reflect the correct date information, throwing off many of your reports.
REPORT WIZARD OVERVIEW
9
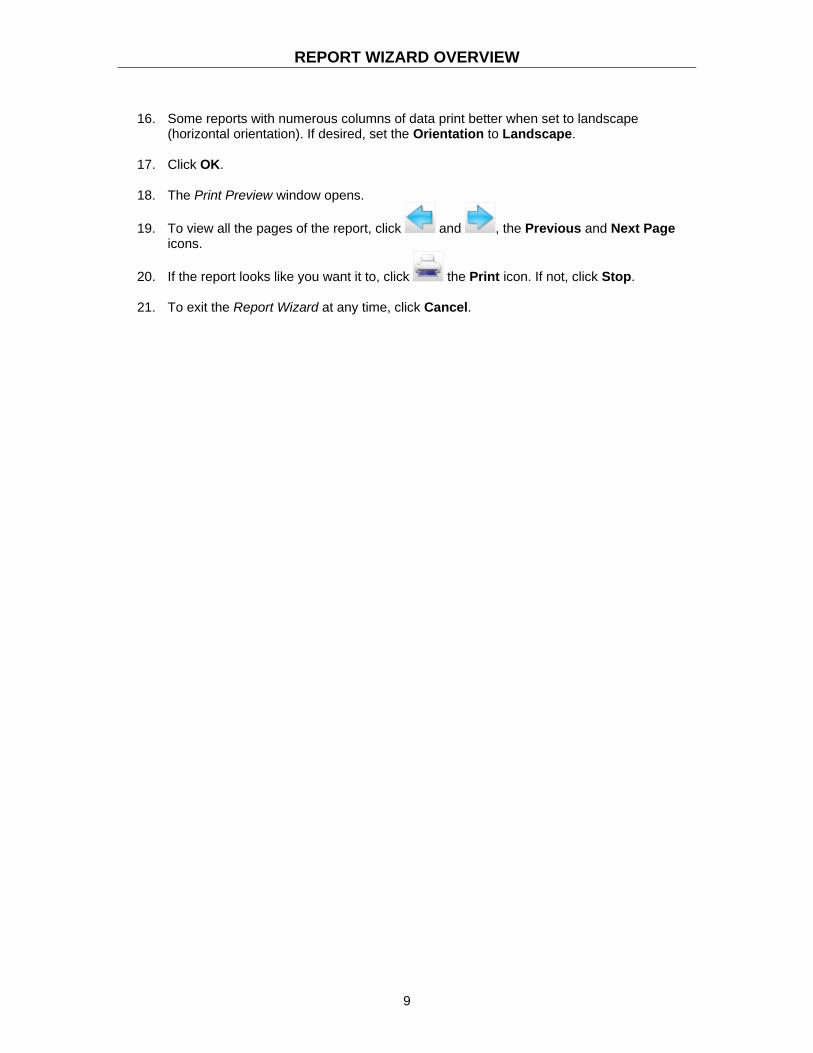
16. Some reports with numerous columns of data print better when set to landscape
(horizontal orientation). If desired, set the Orientation to Landscape.
17. Click OK.
18. The Print Preview window opens.
19. To view all the pages of the report, click and , the Previous and Next Page icons.
20. If the report looks like you want it to, click the Print icon. If not, click Stop.
21. To exit the Report Wizard at any time, click Cancel.
USERS MANAGEMENT REPORTS
10
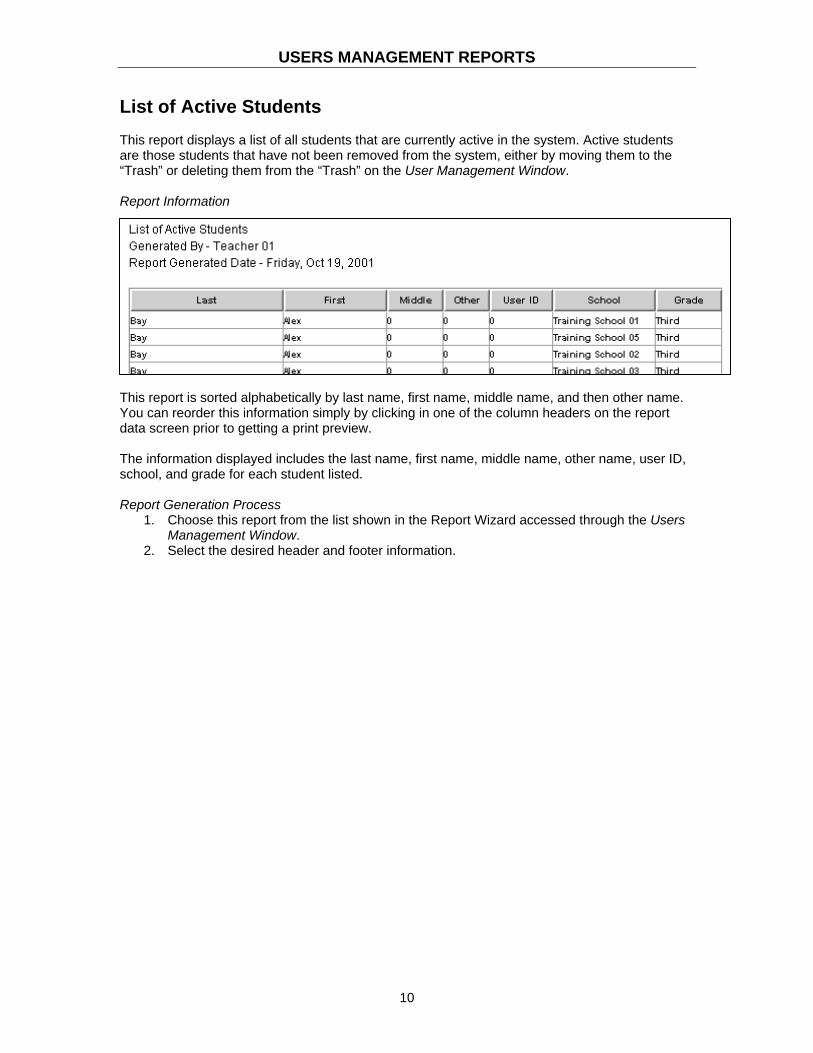
List of Active Students This report displays a list of all students that are currently active in the system. Active students are those students that have not been removed from the system, either by moving them to the “Trash” or deleting them from the “Trash” on the User Management Window. Report Information
This report is sorted alphabetically by last name, first name, middle name, and then other name. You can reorder this information simply by clicking in one of the column headers on the report data screen prior to getting a print preview. The information displayed includes the last name, first name, middle name, other name, user ID, school, and grade for each student listed.
Report Generation Process
1. Choose this report from the list shown in the Report Wizard accessed through the Users Management Window.
2. Select the desired header and footer information.
USERS MANAGEMENT REPORTS
11
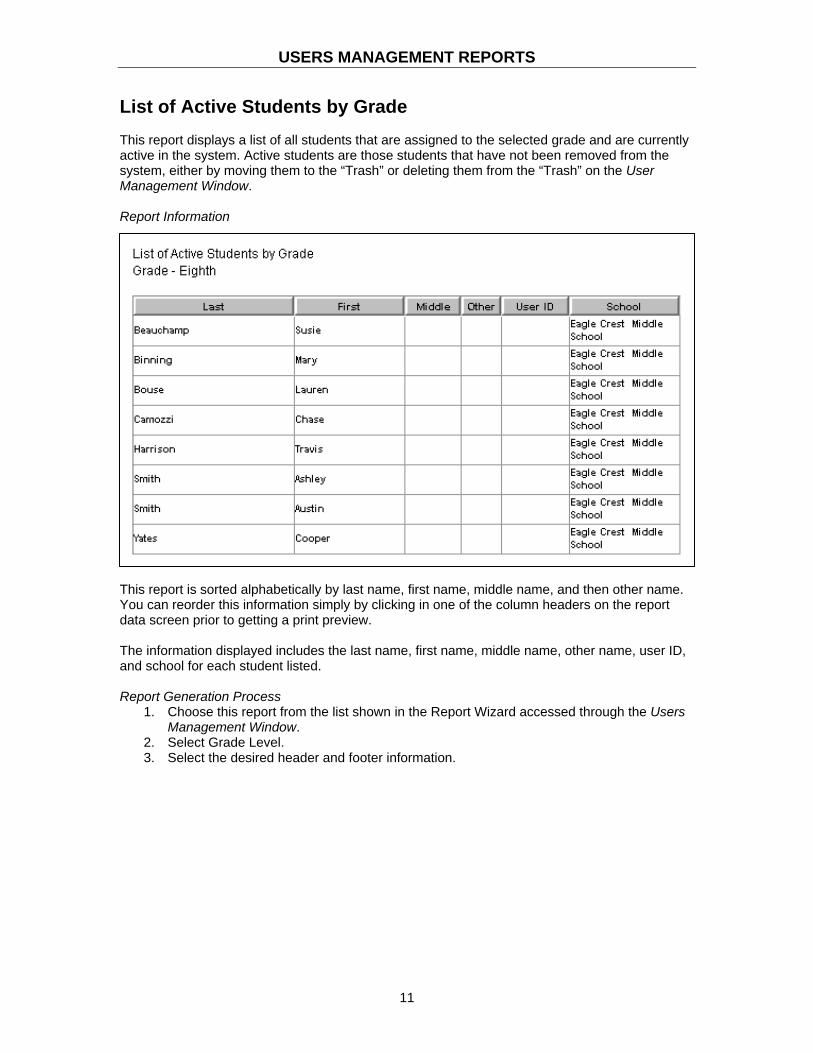
List of Active Students by Grade This report displays a list of all students that are assigned to the selected grade and are currently active in the system. Active students are those students that have not been removed from the system, either by moving them to the “Trash” or deleting them from the “Trash” on the User Management Window. Report Information
This report is sorted alphabetically by last name, first name, middle name, and then other name. You can reorder this information simply by clicking in one of the column headers on the report data screen prior to getting a print preview. The information displayed includes the last name, first name, middle name, other name, user ID, and school for each student listed. Report Generation Process
1. Choose this report from the list shown in the Report Wizard accessed through the Users Management Window.
2. Select Grade Level. 3. Select the desired header and footer information.

USERS MANAGEMENT REPORTS
12
List of Active Students by School This report displays a list of all students that are assigned to the selected school and are currently active in the system. Active students are those students that have not been removed from the system, either by moving them to the “Trash” or deleting them from the “Trash” on the User Management Window. Report Information
This report is sorted alphabetically by last name, first name, middle name, and then other name. You can reorder this information simply by clicking in one of the column headers on the report data screen prior to getting a print preview. The information displayed includes the last name, first name, middle name, other name, user ID, and grade for each student listed. Report Generation Process
1. Select this report from the list shown in the Report Wizard accessed from the Users Management Window.
2. Select the desired school. 3. Select the desired header and footer information.

USERS MANAGEMENT REPORTS
13
List of Active Users This report displays a list of all users that are currently active in the system. Active users are those users that have not been removed from the system, either by moving them to the “Trash” or deleting them from the “Trash” on the User Management Window. Report Information
This report is sorted alphabetically by last name, first name, middle name, and then other name. You can reorder this information simply by clicking in one of the column headers on the report data screen prior to getting a print preview. The information displayed includes the last name, first name, middle name, other name, user ID, user type, school, and grade for each user listed. Report Generation Process
1. Select this report from the list shown in the Report Wizard accessed from the Users Management Window.
2. Select the desired header and footer information.

USERS MANAGEMENT REPORTS
14
List of Active Users by Grade This report displays a list of all users that are assigned to the selected grade and are currently active in the system. Active users are those users that have not been removed from the system, either by moving them to the “Trash” or deleting them from the “Trash” on the User Management Window. Report Information
This report is sorted alphabetically by last name, first name, middle name, and then other name. You can reorder this information simply by clicking in one of the column headers on the report data screen prior to getting a print preview. The information displayed includes the last name, first name, middle name, other name, user ID, user type, and school for each user listed.
Report Generation Process
1. Select this report from the list shown in the Report Wizard accessed from the Users Management Window.
2. Select the desired grade. 3. Select the desired header and footer information.

USERS MANAGEMENT REPORTS
15
List of Active Users by School This report displays a list of all users that are assigned to the selected school and are currently active in the system. Active users are those users that have not been removed from the system, either by moving them to the “Trash” or deleting them from the “Trash” on the User Management Window. Report Information
This report is sorted alphabetically by last name, first name, middle name, and then other name. You can reorder this information simply by clicking in one of the column headers on the report data screen prior to getting a print preview. The information displayed includes the last name, first name, middle name, other name, user ID, user type, and grade for each user listed.
Report Generation Process
1. Select this report from the list shown in the Report Wizard accessed from the Users Management Window.
2. Select the desired school. 3. Select the desired header and footer information.

USERS MANAGEMENT REPORTS
16
List of Inactive Users This report displays a list of all users that have been marked as inactive in the system. Inactive users are those users that have been removed from the system, either by moving them to the “Trash” or deleting them from the “Trash” on the User Management Window. Report Information
This report is sorted alphabetically by last name, first name, middle name, and then other name. You can reorder this information simply by clicking in one of the column headers on the report data screen prior to getting a print preview. The information displayed includes the last name, first name, middle name, other name, user ID, user type, school, and grade for each user listed. Report Generation Process
1. Select this report from the list shown in the Report Wizard accessed from the Users Management Window.
2. Select the desired header and footer information.

USERS MANAGEMENT REPORTS
17
Matrix Reports The Matrix reports offer very flexible reporting options by giving you various parameter choices when you launch the report. The choices that you must make when generating a report are:
Reporting Level = Class, District, School, or User Rows = User (only one choice at this time) Columns = Detail, Enabling Objective, Grade, Objective Set, Printed Test, Standard, or Subject Area Report Type = Average Score, Percentage Mastered, or Percentage Not Mastered
Variation Numbers – Report Contents
The possible report variations based on the parameter combinations are as follows:
1. Class, User, Detail, and Average Score 2. Class, User, Detail, and Percentage Mastered 3. Class, User, Detail, and Percentage Not Mastered 4. Class, User, Enabling Objective, and Average Score 5. Class, User, Enabling Objective, and Percentage Mastered 6. Class, User, Enabling Objective, and Percentage Not Mastered 7. Class, User, Grade, and Average Score 8. Class, User, Grade, and Percentage Mastered 9. Class, User, Grade, and Percentage Not Mastered 10. Class, User, Objective Set, and Average Score 11. Class, User, Objective Set, and Percentage Mastered 12. Class, User, Objective Set, and Percentage Not Mastered 13. Class, User, Printed Test, and Average Score 14. Class, User, Printed Test, and Percentage Mastered 15. Class, User, Printed Test, and Percentage Not Mastered 16. Class, User, Standard, and Average Score 17. Class, User, Standard, and Percentage Mastered 18. Class, User, Standard, and Percentage Not Mastered 19. Class, User, Subject Area, and Average Score 20. Class, User, Subject Area, and Percentage Mastered 21. Class, User, Subject Area, and Percentage Not Mastered 22. District, Class, Detail, and Percentage Mastered 23. District, Class, Detail, and Percentage Not Mastered 24. District, Class, Enabling Objective, and Average Score 25. District, Class, Enabling Objective, and Percentage Mastered 26. District, Class, Enabling Objective, and Percentage Not Mastered 27. District, Class, Grade, and Average Score 28. District, Class, Grade, and Percentage Mastered 29. District, Class, Grade, and Percentage Not Mastered 30. District, Class, Objective Set, and Average Score 31. District, Class, Objective Set, and Percentage Mastered 32. District, Class, Objective Set, and Percentage Not Mastered 33. District, Class, Printed Test, and Average Score 34. District, Class, Printed Test, and Percentage Mastered 35. District, Class, Printed Test, and Percentage Not Mastered 36. District, Class, Standard, and Average Score 37. District, Class, Standard, and Percentage Mastered 38. District, Class, Standard, and Percentage Not Mastered
USERS MANAGEMENT REPORTS
18
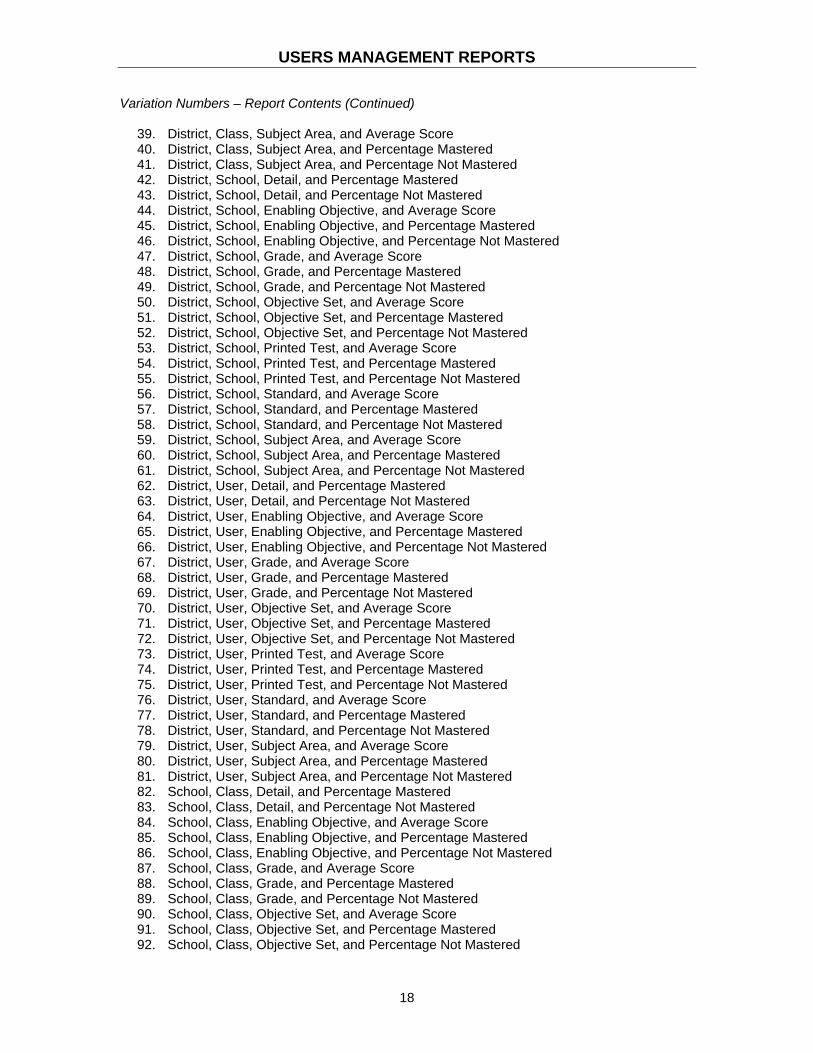
Variation Numbers – Report Contents (Continued) 39. District, Class, Subject Area, and Average Score 40. District, Class, Subject Area, and Percentage Mastered 41. District, Class, Subject Area, and Percentage Not Mastered 42. District, School, Detail, and Percentage Mastered 43. District, School, Detail, and Percentage Not Mastered 44. District, School, Enabling Objective, and Average Score 45. District, School, Enabling Objective, and Percentage Mastered 46. District, School, Enabling Objective, and Percentage Not Mastered 47. District, School, Grade, and Average Score 48. District, School, Grade, and Percentage Mastered 49. District, School, Grade, and Percentage Not Mastered 50. District, School, Objective Set, and Average Score 51. District, School, Objective Set, and Percentage Mastered 52. District, School, Objective Set, and Percentage Not Mastered 53. District, School, Printed Test, and Average Score 54. District, School, Printed Test, and Percentage Mastered 55. District, School, Printed Test, and Percentage Not Mastered 56. District, School, Standard, and Average Score 57. District, School, Standard, and Percentage Mastered 58. District, School, Standard, and Percentage Not Mastered 59. District, School, Subject Area, and Average Score 60. District, School, Subject Area, and Percentage Mastered 61. District, School, Subject Area, and Percentage Not Mastered 62. District, User, Detail, and Percentage Mastered 63. District, User, Detail, and Percentage Not Mastered 64. District, User, Enabling Objective, and Average Score 65. District, User, Enabling Objective, and Percentage Mastered 66. District, User, Enabling Objective, and Percentage Not Mastered 67. District, User, Grade, and Average Score 68. District, User, Grade, and Percentage Mastered 69. District, User, Grade, and Percentage Not Mastered 70. District, User, Objective Set, and Average Score 71. District, User, Objective Set, and Percentage Mastered 72. District, User, Objective Set, and Percentage Not Mastered 73. District, User, Printed Test, and Average Score 74. District, User, Printed Test, and Percentage Mastered 75. District, User, Printed Test, and Percentage Not Mastered 76. District, User, Standard, and Average Score 77. District, User, Standard, and Percentage Mastered 78. District, User, Standard, and Percentage Not Mastered 79. District, User, Subject Area, and Average Score 80. District, User, Subject Area, and Percentage Mastered 81. District, User, Subject Area, and Percentage Not Mastered 82. School, Class, Detail, and Percentage Mastered 83. School, Class, Detail, and Percentage Not Mastered 84. School, Class, Enabling Objective, and Average Score 85. School, Class, Enabling Objective, and Percentage Mastered 86. School, Class, Enabling Objective, and Percentage Not Mastered 87. School, Class, Grade, and Average Score 88. School, Class, Grade, and Percentage Mastered 89. School, Class, Grade, and Percentage Not Mastered 90. School, Class, Objective Set, and Average Score 91. School, Class, Objective Set, and Percentage Mastered 92. School, Class, Objective Set, and Percentage Not Mastered

USERS MANAGEMENT REPORTS
19
Variation Numbers – Report Contents (Continued) 93. School, Class, Printed Test, and Average Score 94. School, Class, Printed Test, and Percentage Mastered 95. School, Class, Printed Test, and Percentage Not Mastered 96. School, Class, Standard, and Average Score 97. School, Class, Standard, and Percentage Mastered 98. School, Class, Standard, and Percentage Not Mastered 99. School, Class, Subject Area, and Average Score 100. School, Class, Subject Area, and Percentage Mastered 101. School, Class, Subject Area, and Percentage Not Mastered 102. School, User, Detail, and Percentage Mastered 103. School, User, Detail, and Percentage Not Mastered 104. School, User, Enabling Objective, and Average Score 105. School, User, Enabling Objective, and Percentage Mastered 106. School, User, Enabling Objective, and Percentage Not Mastered 107. School, User, Grade, and Average Score 108. School, User, Grade, and Percentage Mastered 109. School, User, Grade, and Percentage Not Mastered 110. School, User, Objective Set, and Average Score 111. School, User, Objective Set, and Percentage Mastered 112. School, User, Objective Set, and Percentage Not Mastered 113. School, User, Printed Test, and Average Score 114. School, User, Printed Test, and Percentage Mastered 115. School, User, Printed Test, and Percentage Not Mastered 116. School, User, Standard, and Average Score 117. School, User, Standard, and Percentage Mastered 118. School, User, Standard, and Percentage Not Mastered 119. School, User, Subject Area, and Average Score 120. School, User, Subject Area, and Percentage Mastered 121. School, User, Subject Area, and Percentage Not Mastered 122. User, Class, Detail, and Percentage Mastered 123. User, Class, Detail, and Percentage Not Mastered 124. User, Class, Enabling Objective, and Average Score 125. User, Class, Enabling Objective, and Percentage Mastered 126. User, Class, Enabling Objective, and Percentage Not Mastered 127. User, Class, Grade, and Average Score 128. User, Class, Grade, and Percentage Mastered 129. User, Class, Grade, and Percentage Not Mastered 130. User, Class, Objective Set, and Average Score 131. User, Class, Objective Set, and Percentage Mastered 132. User, Class, Objective Set, and Percentage Not Mastered 133. User, Class, Printed Test, and Average Score 134. User, Class, Printed Test, and Percentage Mastered 135. User, Class, Printed Test, and Percentage Not Mastered 136. User, Class, Standard, and Average Score 137. User, Class, Standard, and Percentage Mastered 138. User, Class, Standard, and Percentage Not Mastered 139. User, Class, Subject Area, and Average Score 140. User, Class, Subject Area, and Percentage Mastered 141. User, Class, Subject Area, and Percentage Not Mastered 142. User, District, Detail, and Percentage Mastered 143. User, District, Detail, and Percentage Not Mastered 144. User, District, Enabling Objective, and Average Score 145. User, District, Enabling Objective, and Percentage Mastered 146. User, District, Enabling Objective, and Percentage Not Mastered

USERS MANAGEMENT REPORTS
20
Variation Numbers – Report Contents (Continued) 147. User, District, Grade, and Average Score 148. User, District, Grade, and Percentage Mastered 149. User, District, Grade, and Percentage Not Mastered 150. User, District, Objective Set, and Average Score 151. User, District, Objective Set, and Percentage Mastered 152. User, District, Objective Set, and Percentage Not Mastered 153. User, District, Printed Test, and Average Score 154. User, District, Printed Test, and Percentage Mastered 155. User, District, Printed Test, and Percentage Not Mastered 156. User, District, Standard, and Average Score 157. User, District, Standard, and Percentage Mastered 158. User, District, Standard, and Percentage Not Mastered 159. User, District, Subject Area, and Average Score 160. User, District, Subject Area, and Percentage Mastered 161. User, District, Subject Area, and Percentage Not Mastered 162. User, School, Detail, and Percentage Mastered 163. User, School, Detail, and Percentage Not Mastered 164. User, School, Enabling Objective, and Average Score 165. User, School, Enabling Objective, and Percentage Mastered 166. User, School, Enabling Objective, and Percentage Not Mastered 167. User, School, Grade, and Average Score 168. User, School, Grade, and Percentage Mastered 169. User, School, Grade, and Percentage Not Mastered 170. User, School, Objective Set, and Average Score 171. User, School, Objective Set, and Percentage Mastered 172. User, School, Objective Set, and Percentage Not Mastered 173. User, School, Printed Test, and Average Score 174. User, School, Printed Test, and Percentage Mastered 175. User, School, Printed Test, and Percentage Not Mastered 176. User, School, Standard, and Average Score 177. User, School, Standard, and Percentage Mastered 178. User, School, Standard, and Percentage Not Mastered 179. User, School, Subject Area, and Average Score 180. User, School, Subject Area, and Percentage Mastered 181. User, School, Subject Area, and Percentage Not Mastered

USERS MANAGEMENT REPORTS
21
Schoolwide Student Summary Report** Schoolwide Student Summary Report reports class-wide grades for selected students in each of the classes to which they belong. Report Information
The information displayed on this report includes:
Last - This is the last name of the users who fit the constraints of the generated report as
stored in the user table. First - This is the first name of the users who fit the constraints of the generated report as
stored in the user table. Class - This is the class from which the scores to determine the student’s grade is calculated. Time (dd:hh:mm) - This is the total time the student spent in study, practice, and mastery
tests. Assignments Used for Grade - This is the number of assignments in the class that were
used in calculating the student’s grade. Total Accessed - This is the number of assignments the student actually worked with
between the selected dates. Grade - This is the calculated grade for the student for the associated class and is
determined by taking the actual score value, dividing by the maximum score possible, and multiply by 100.
Report Generation Process
1. Choose this report from the list shown in the Report Wizard accessed through the Assignment Management Window.
2. Select a school with students to report. 3. Select a grade level to report. 4. Select a date range to constrain data within the report. 5. Multi select students for the report. 6. Format header and footer information.
USERS MANAGEMENT REPORTS
22
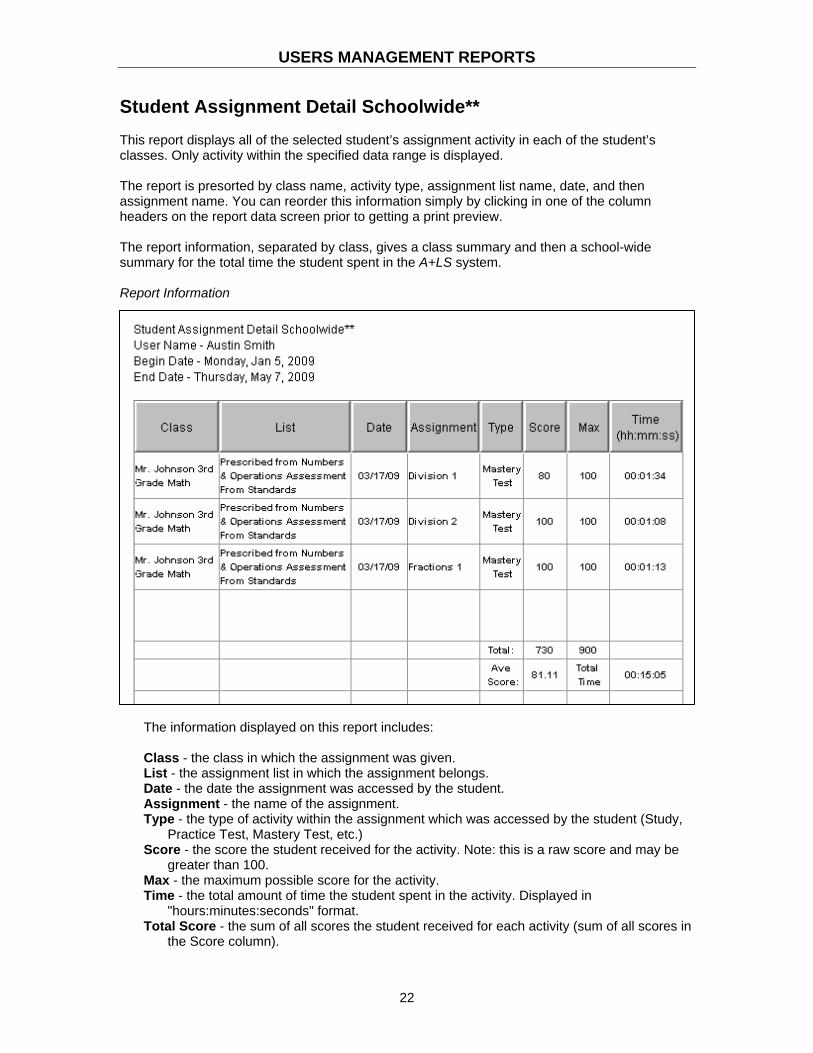
Student Assignment Detail Schoolwide** This report displays all of the selected student’s assignment activity in each of the student’s classes. Only activity within the specified data range is displayed. The report is presorted by class name, activity type, assignment list name, date, and then assignment name. You can reorder this information simply by clicking in one of the column headers on the report data screen prior to getting a print preview. The report information, separated by class, gives a class summary and then a school-wide summary for the total time the student spent in the A+LS system. Report Information
The information displayed on this report includes:
Class - the class in which the assignment was given. List - the assignment list in which the assignment belongs. Date - the date the assignment was accessed by the student. Assignment - the name of the assignment. Type - the type of activity within the assignment which was accessed by the student (Study,
Practice Test, Mastery Test, etc.) Score - the score the student received for the activity. Note: this is a raw score and may be
greater than 100. Max - the maximum possible score for the activity. Time - the total amount of time the student spent in the activity. Displayed in
"hours:minutes:seconds" format. Total Score - the sum of all scores the student received for each activity (sum of all scores in
the Score column).
USERS MANAGEMENT REPORTS
23
Total Max - the sum of all maximum possible scores for each activity accessed by the student (sum of all scores in the Max column).
Avg Score - the average of the scores received by the student for each activity. This number is determined by dividing the Total Score by the Total Max and then multiplying by 100.
Total Time - the total time the student spent in each activity in each class (sum of all times in the Time column for each class).
Schoolwide Total Time - the total time the student spent in all activities in all classes. Report Generation Process
1. Select this report from the list shown in the Report Wizard accessed from the Users Management Window.
2. Select the school in which the student is enrolled. 3. Select the grade in which the student is enrolled. 4. Select the desired date range. 5. Select the desired header and footer information.
USERS MANAGEMENT REPORTS
24
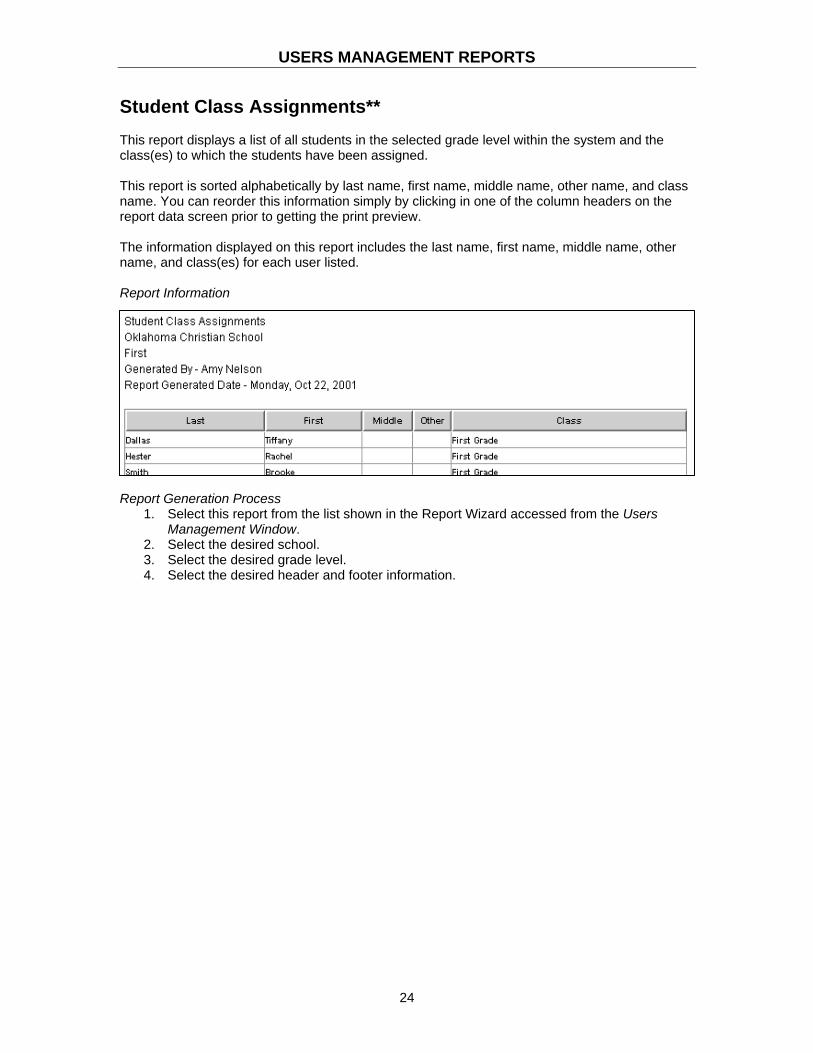
Student Class Assignments** This report displays a list of all students in the selected grade level within the system and the class(es) to which the students have been assigned. This report is sorted alphabetically by last name, first name, middle name, other name, and class name. You can reorder this information simply by clicking in one of the column headers on the report data screen prior to getting the print preview. The information displayed on this report includes the last name, first name, middle name, other name, and class(es) for each user listed. Report Information
Report Generation Process
1. Select this report from the list shown in the Report Wizard accessed from the Users Management Window.
2. Select the desired school. 3. Select the desired grade level. 4. Select the desired header and footer information.

USERS MANAGEMENT REPORTS
25
Student Progress - Selected Students This report displays student(s) progress and includes all activities except Adaptive Assessments (since they aren’t graded). It is a drill-down administrator report that contains two levels. The first screen displays aggregate data on each student’s assignment list(s). The second screen displays aggregate data on each assignment. Before generating the report, you will be asked to select a student(s) by school and grade level, then you’ll select a date range you would like to report on. Report Information - Screen 1
The information displayed on this report includes:
Name - Displays the 'Last Name, First Name' of the student. Note: the first line displays the
Average of Students Reported. Assignment List - Displays the name of the assignment list. # of Lessons - Displays the number of assignments that have usage in the assignment list. Avg High Score % - This column divides the summation of the highest score for each
assignment by the number of assignments. Lessons Mastered - Displays the summation of all the assignments that have been
mastered in the assignment list. % Mastered - Displays the 'Lessons Mastered' column divided by the number of
assignments, multiplied by 100. Avg Tries - Displays the average number of student actions for each assignment in the
assignment list. Only includes activities that the student has worked on. Time - Displays the total time spent on all assignments in the assignment list.
Report Information - Screen 2

USERS MANAGEMENT REPORTS
26
Report Information - Screen 2 (continued) The information displayed on this report includes: Assignment - Displays the name of the assignment. Note: the first line displays the List
Average. Mastered - Displays 'Yes' if the assignment has been mastered and displays 'No' if it's not
mastered. Tries - Displays the number of times the student has accessed the activity for the
assignment. Avg Score % - This column divides the summation of all the usage scores by the number of
usage records for the assignment. High Score % - Displays the student’s highest score for the assignment as a percentage. Study Time - Displays the total time spent in the 'Study' mode for the assignment. Note:
some lessons do not have Study activities, such as LLS assignments. Test Time - Displays the total time spent in assessment activities (Calculation: Total Time -
Study Time - Essay Time). Total Time - Displays the total time spent on all assignments in the assignment list.
Report Generation Process
1. Choose this report from the list shown in the Report Wizard accessed through the Users Management Window.
2. To select the students to be included in the report: Choose the school and grade using the dropboxes. Highlight one or more students in the Available Users column. Click on the Add button to move them to the Selected Users column.
3. If you want to add students from another grade, select the grade, then use the Add button to select additional students.
4. Select the beginning and ending dates by clicking on the appropriate date button, defining the period of time the report is to cover.
5. Choose the file format you'd like the report to be saved as: .HTML - Best viewed and printed using your Web browser. .CSV - Comma delimited data, best for importing data into spreadsheets and
databases. 6. Click on the appropriate button, either .HTML or .CSV. 7. Wait, it may take a few minutes for the report to be generated. Please take no action as
long as the Generating Report message is onscreen. 8. .HTML only: Your Web browser will open and the report will appear. Watch for hotlinks in
the report. On the first screen, click on a student’s name and a more detailed report screen opens.
9. .CSV only: When the File Saved dialog opens, you may want to write down the file name and path. Then your data will open in whatever application normally handles .CSV files (typically Excel®).

USERS MANAGEMENT REPORTS
27
Student-Class Assignments This report lists the classes to which your selected students are assigned. It is a drill-down administrator report with two levels. The first screen displays the student(s) and how many classes they have been assigned to. The second screen displays the class names for the selected student. Before generating this report, you will be asked to select individual students by school and grade level. Report Information - Screen 1
The information displayed on this report includes:
Name - Displays the 'Last Name, First Name' of the student. # of Classes Assigned - Displays the number of classes to which the student is assigned.
Report Information - Screen 2
The information displayed on this report includes:
School - Displays the school name. Class - Displays the class name.
Report Generation Process
1. Choose this report from the list shown in the Report Wizard accessed through the Users Management Window.
2. To select the students to be included in the report: Choose the school and grade using the dropboxes. Highlight one or more students in the Available Users column. Click on the Add button to move them to the Selected Users column.
3. If you want to add students from another grade, select the grade, then use the Add button to select additional students.

USERS MANAGEMENT REPORTS
28
4. Choose the file format you'd like the report to be saved as:
.HTML - Best viewed and printed using your Web browser.
.CSV - Comma delimited data, best for importing data into spreadsheets and databases.
5. Click on the appropriate button, either .HTML or .CSV. 6. Wait, it may take a few minutes for the report to be generated. Please take no action as
long as the Generating Report message is onscreen. 7. .HTML only: Your Web browser will open and the report will appear. Watch for hotlinks in
the report. On the first screen, click on a student’s name and a more detailed report screen opens.
8. .CSV only: When the File Saved dialog opens, you may want to write down the file name and path. Then your data will open in whatever application normally handles .CSV files (typically Excel).
9. In both your browser and Excel, you can view, print, and save your report.
USERS MANAGEMENT REPORTS
29
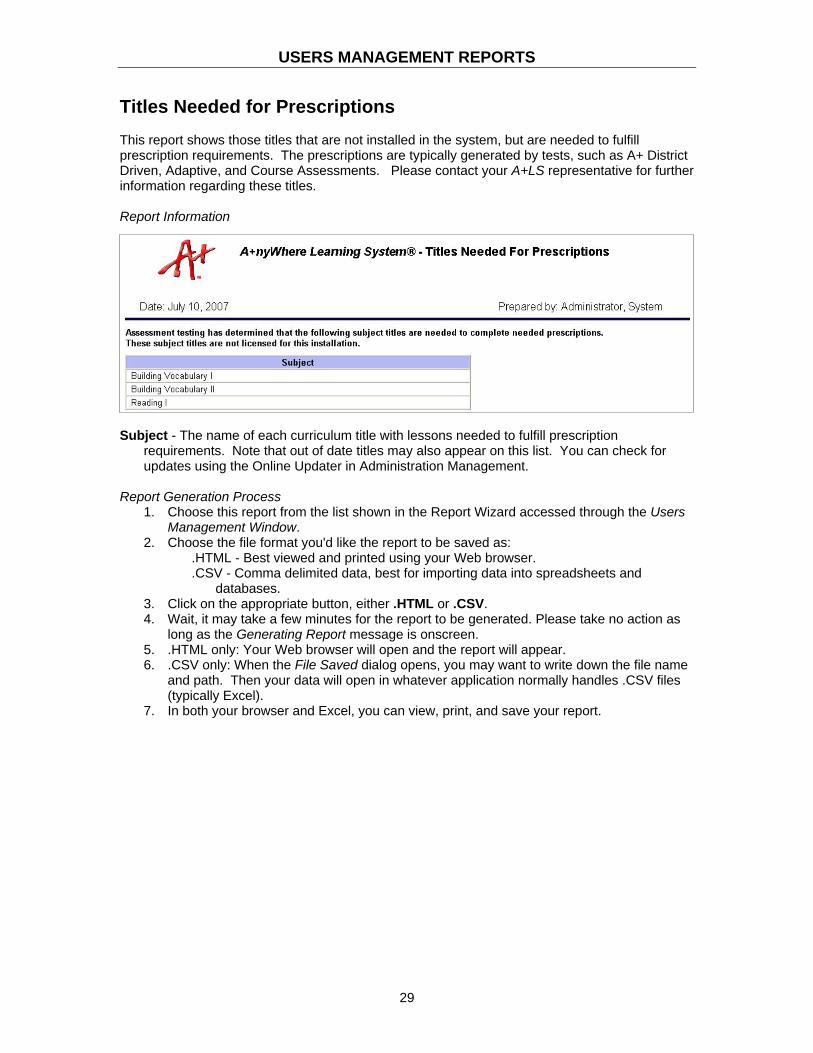
Titles Needed for Prescriptions This report shows those titles that are not installed in the system, but are needed to fulfill prescription requirements. The prescriptions are typically generated by tests, such as A+ District Driven, Adaptive, and Course Assessments. Please contact your A+LS representative for further information regarding these titles. Report Information
Subject - The name of each curriculum title with lessons needed to fulfill prescription
requirements. Note that out of date titles may also appear on this list. You can check for updates using the Online Updater in Administration Management.
Report Generation Process
1. Choose this report from the list shown in the Report Wizard accessed through the Users Management Window.
2. Choose the file format you'd like the report to be saved as: .HTML - Best viewed and printed using your Web browser. .CSV - Comma delimited data, best for importing data into spreadsheets and
databases. 3. Click on the appropriate button, either .HTML or .CSV. 4. Wait, it may take a few minutes for the report to be generated. Please take no action as
long as the Generating Report message is onscreen. 5. .HTML only: Your Web browser will open and the report will appear. 6. .CSV only: When the File Saved dialog opens, you may want to write down the file name
and path. Then your data will open in whatever application normally handles .CSV files (typically Excel).
7. In both your browser and Excel, you can view, print, and save your report.

USERS MANAGEMENT REPORTS
30
Titles Not Owned** This report displays titles that are not installed in the system but are needed to fulfill prescription requirements as identified by assessment testing. Report Information
Report Generation Process
1. Choose this report from the list shown in the Report Wizard accessed from the Users Management Window.
2. Select "for system" or "for school." 3. Select the desired header and footer information.
USERS MANAGEMENT REPORTS
31
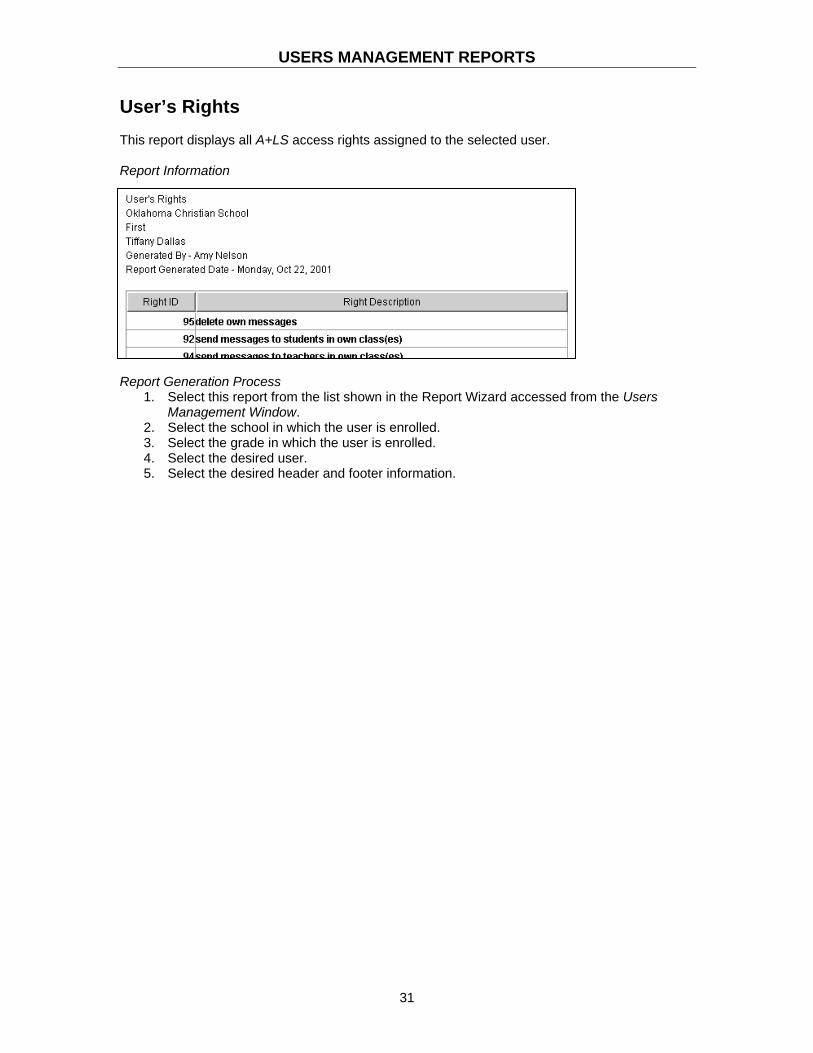
User’s Rights This report displays all A+LS access rights assigned to the selected user. Report Information
Report Generation Process
1. Select this report from the list shown in the Report Wizard accessed from the Users Management Window.
2. Select the school in which the user is enrolled. 3. Select the grade in which the user is enrolled. 4. Select the desired user. 5. Select the desired header and footer information.
CLASSES MANAGEMENT REPORTS
32
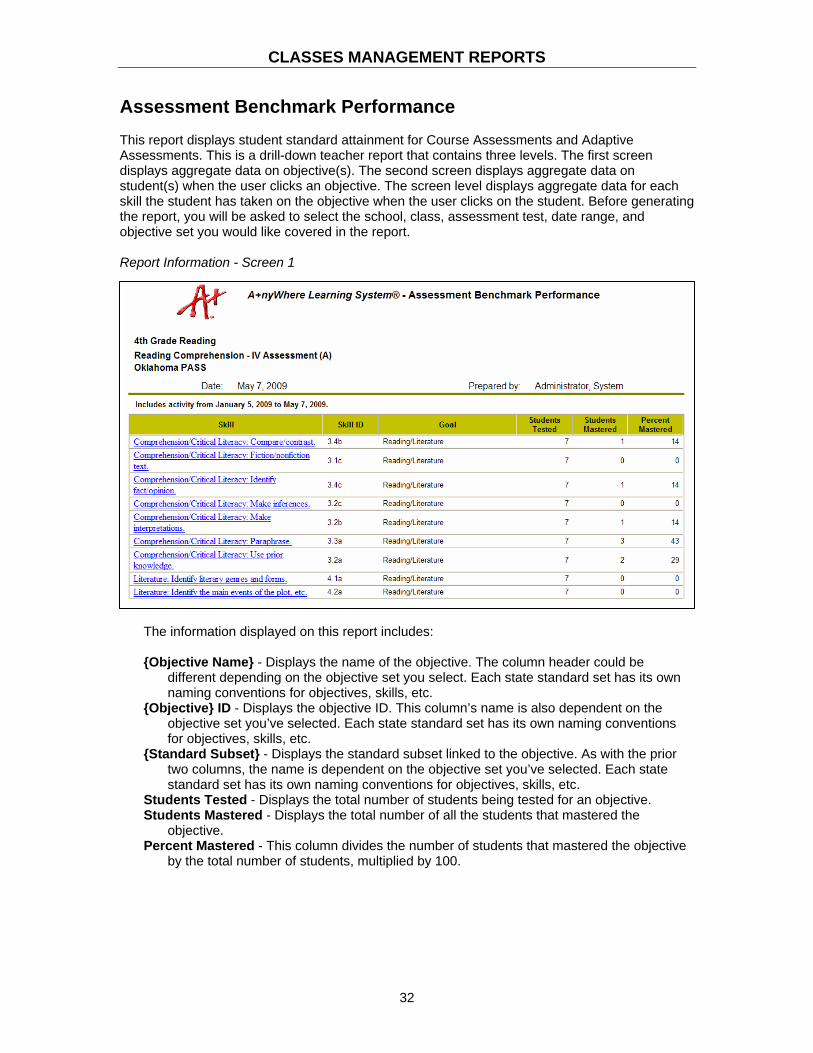
Assessment Benchmark Performance This report displays student standard attainment for Course Assessments and Adaptive Assessments. This is a drill-down teacher report that contains three levels. The first screen displays aggregate data on objective(s). The second screen displays aggregate data on student(s) when the user clicks an objective. The screen level displays aggregate data for each skill the student has taken on the objective when the user clicks on the student. Before generating the report, you will be asked to select the school, class, assessment test, date range, and objective set you would like covered in the report. Report Information - Screen 1
The information displayed on this report includes:
{Objective Name} - Displays the name of the objective. The column header could be
different depending on the objective set you select. Each state standard set has its own naming conventions for objectives, skills, etc.
{Objective} ID - Displays the objective ID. This column’s name is also dependent on the objective set you’ve selected. Each state standard set has its own naming conventions for objectives, skills, etc.
{Standard Subset} - Displays the standard subset linked to the objective. As with the prior two columns, the name is dependent on the objective set you’ve selected. Each state standard set has its own naming conventions for objectives, skills, etc.
Students Tested - Displays the total number of students being tested for an objective. Students Mastered - Displays the total number of all the students that mastered the
objective. Percent Mastered - This column divides the number of students that mastered the objective
by the total number of students, multiplied by 100.

CLASSES MANAGEMENT REPORTS
33
Report Information - Screen 2
The information displayed on this report includes:
Student - Displays the 'Last Name, First Name' of the student. # Questions - Displays the total number of questions the student was asked for the
objective. # Correct - Displays the total number of questions the student got correct for the objective. Mastered - This column displays 'Yes' if the Percent Mastered column exceeds the mastery
percentage setting (the default is 80), otherwise it displays 'No'. The Percent Mastered column gets calculated by dividing the number of skills mastered by the total number of skills, multiplied by 100.
Report Information - Screen 3
The information displayed on this report includes:
ALS Skill - Displays the name of the skill. Date - Displays the date (MM/DD/YYYY) the skill was
completed. # Questions - Displays the total number of questions
the student was asked for the skill. # Correct - Displays the total number of questions the
student got correct for the skill.
This level includes an optional bar chart.

CLASSES MANAGEMENT REPORTS
34
Report Information - Screen 3 (continued)
Mastered - This column displays 'Yes' if the Percent Mastered column is 80 or greater, otherwise it displays 'No'. The Percent Mastered column gets calculated by dividing the number of questions correct by the total number of questions, multiplied by 100.
Report Generation Process
1. Choose this report from the list shown in the Report Wizard accessed through the Classes Management Window.
2. Select the school. 3. Select the class. 4. To select the assessment test:
First select either Course Assessment or Adaptive Assessment. Then use the dropbox to pick the specific assessments.
5. Select the standard set so the report can cross reference the ALS Skills covered by the assessment with your preferred standard.
6. Select the beginning and ending dates by clicking on the appropriate date button, defining the period of time the report is to cover.
7. Choose the file format you'd like the report to be saved as: .HTML - Best viewed and printed using your Web browser. .CSV - Comma delimited data, best for importing data into spreadsheets and
databases. 8. Click on the appropriate button, either .HTML or .CSV. 9. Wait, it may take a few minutes for the report to be generated. Please take no action as
long as the Generating Report message is onscreen. 10. .HTML only: Your Web browser will open and the report will appear. Watch for hotlinks in
the report. On the first screen, click on a skill and a more detailed report screen opens. On the second screen, you can click on a student’s name to see details of his or her performance. You can also use the View Chart link on the second screen.
11. .CSV only: When the File Saved dialog opens, you may want to write down the file name and path. Then your data will open in whatever application normally handles .CSV files.
12. In both your browser and Excel, you can view, print, and save your report.
CLASSES MANAGEMENT REPORTS
35
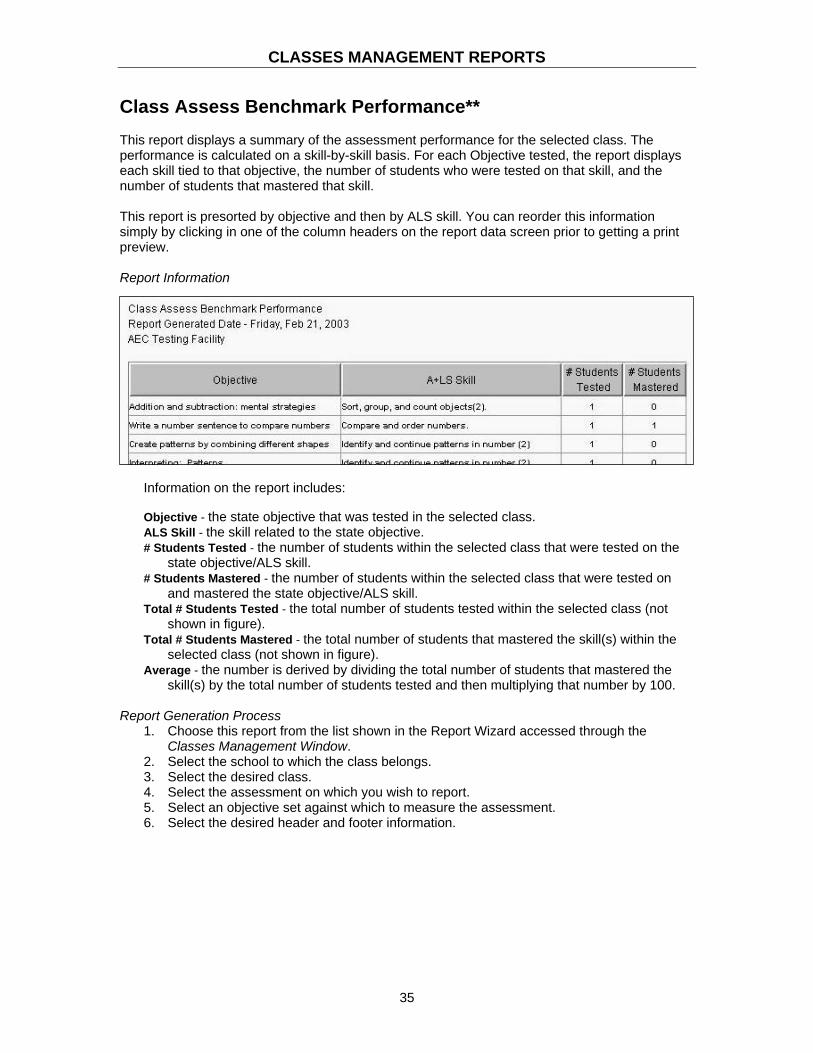
Class Assess Benchmark Performance** This report displays a summary of the assessment performance for the selected class. The performance is calculated on a skill-by-skill basis. For each Objective tested, the report displays each skill tied to that objective, the number of students who were tested on that skill, and the number of students that mastered that skill. This report is presorted by objective and then by ALS skill. You can reorder this information simply by clicking in one of the column headers on the report data screen prior to getting a print preview. Report Information
Information on the report includes: Objective - the state objective that was tested in the selected class. ALS Skill - the skill related to the state objective. # Students Tested - the number of students within the selected class that were tested on the
state objective/ALS skill. # Students Mastered - the number of students within the selected class that were tested on
and mastered the state objective/ALS skill. Total # Students Tested - the total number of students tested within the selected class (not
shown in figure). Total # Students Mastered - the total number of students that mastered the skill(s) within the
selected class (not shown in figure). Average - the number is derived by dividing the total number of students that mastered the
skill(s) by the total number of students tested and then multiplying that number by 100. Report Generation Process
1. Choose this report from the list shown in the Report Wizard accessed through the Classes Management Window.
2. Select the school to which the class belongs. 3. Select the desired class. 4. Select the assessment on which you wish to report. 5. Select an objective set against which to measure the assessment. 6. Select the desired header and footer information.

CLASSES MANAGEMENT REPORTS
36
Class Roster This report displays all active users currently assigned to the selected class. Active users are those users that have not been removed from the class, either by moving them to the Class “Trash” or deleting them from the Class “Trash” on the Classes Management Window. Report Information
This report is presorted alphabetically by last name, first name, middle name, and then other name. You can reorder this information simply by clicking in one of the column headers on the report data screen prior to getting a print preview. Report Generation Process
1. Choose this report from the list shown in the Report Wizard accessed through the Classes Management Window.
2. Select the school to which the class belongs. 3. Select the desired class. 4. Select the desired header and footer information.

CLASSES MANAGEMENT REPORTS
37
Class Roster for Scanning This report displays all active users currently assigned to the selected class along with their class-user key used for scanning tests. Report Information
Information on the report includes the Class User Key. This key uniquely identifies a particular student's records for a particular class, and students are typically asked to transcribe it on their bubble sheets. Report Generation Process
1. Choose this report from the list shown in the Report Wizard accessed through the Classes Management Window.
2. Select a school to report. 3. Select a class with the desired students to report. 4. Format header and footer information.
CLASSES MANAGEMENT REPORTS
38
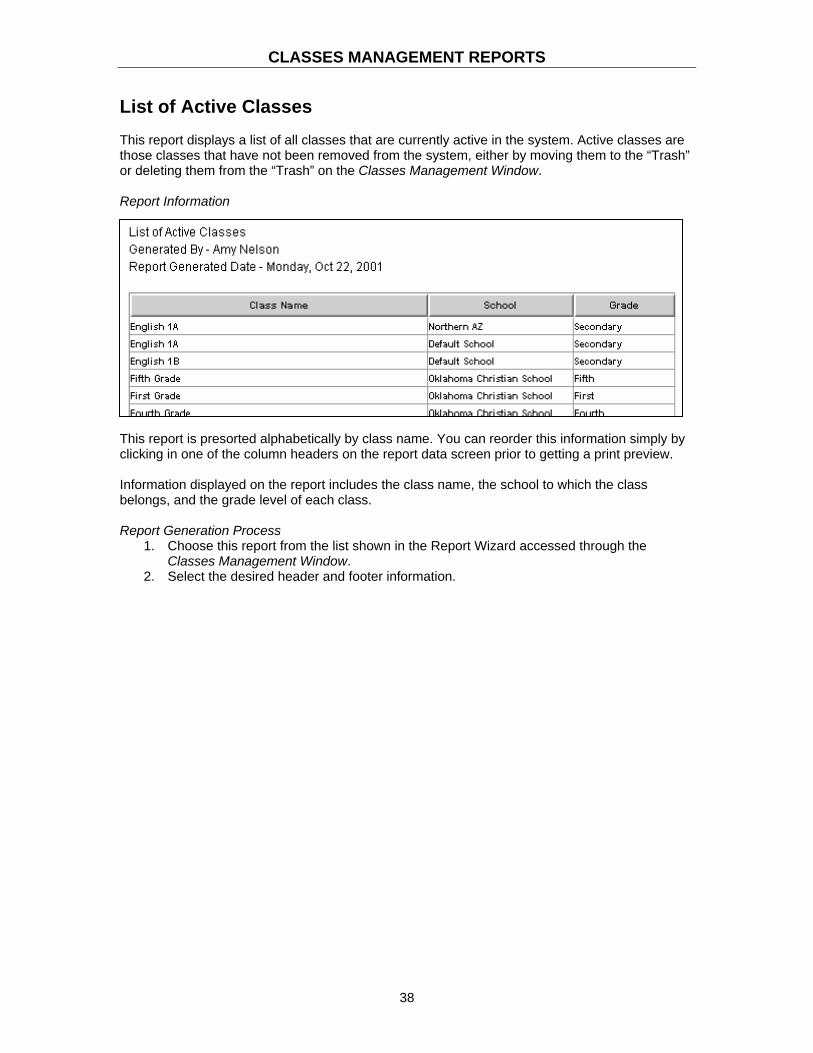
List of Active Classes
This report displays a list of all classes that are currently active in the system. Active classes are those classes that have not been removed from the system, either by moving them to the “Trash” or deleting them from the “Trash” on the Classes Management Window. Report Information
This report is presorted alphabetically by class name. You can reorder this information simply by clicking in one of the column headers on the report data screen prior to getting a print preview. Information displayed on the report includes the class name, the school to which the class belongs, and the grade level of each class. Report Generation Process
1. Choose this report from the list shown in the Report Wizard accessed through the Classes Management Window.
2. Select the desired header and footer information.

CLASSES MANAGEMENT REPORTS
39
List of Active Classes by School
This report displays a list of all classes belonging to the selected school that are currently active in the system. Active classes are those classes that have not been removed from the system, either by moving them to the “Trash” or deleting them from the “Trash” on the Classes Management Window. Report Information
This report is presorted alphabetically by class name. You can reorder this information simply by clicking in one of the column headers on the report data screen prior to getting a print preview. Information displayed on the report includes the class name and the grade level of each class. Report Generation Process
1. Choose this report from the list shown in the Report Wizard accessed through the Classes Management Window.
2. Select the desired school. 3. Select the desired header and footer information.

CLASSES MANAGEMENT REPORTS
40
List of Inactive Classes This report displays a list of all classes currently set as inactive within the system. Inactive classes are those classes that have been removed from the system, either by moving them to the “Trash” or deleting them from the “Trash” on the Classes Management Window. Report Information
This report is presorted alphabetically by class name. You can reorder this information simply by clicking in one of the column headers on the report data screen prior to getting a print preview. Report Generation Process
1. Choose this report from the list shown in the Report Wizard accessed through the Classes Management Window.
2. Select the desired header and footer information.

ASSIGNMENT MANAGEMENT REPORTS
41
Activity Usage - by Class
This single level report displays usage data for a selected activity (only Adaptive Assessments are excluded, since they are not graded). Before generating the report, you will be asked to select a school, a class, the date range, and finally the activity to focus on. Report Information
Information on the report includes: Student - Displays the 'Last Name, First Name' of the student. Note: the first line will display
the Class Average. Mastered - This column uses the highest 'Mastery Test' score for the assignment. If the
activity is marked as mastered in the database a 'Yes' will display, otherwise it displays 'No'.
Avg Tries - Displays the average number of times the student has accessed the selected activity.
Avg Score % - This column divides the summation of all the activity’s scores by the number of usage records for the assignment.
High Score % - Displays the student’s highest score for the selected activity as a percentage.
Study Time - Displays the total time spent in the 'Study' mode for the assignment. Note: some activities do not include Study, such as LLS assignments and Course Assessments.
Test Time - Displays the total time spent in assessments related to the selected activity (Calculation: Total Time - Study Time - Essay Time).
Total Time - Displays the total time spent on the selected activity. Report Generation Process
1. Choose this report from the list shown in the Report Wizard accessed through the Assignment Management Window.
2. Select the school. 3. Select the class. 4. Select the beginning and ending dates by clicking on the appropriate date button,
defining the period of time the report is to cover. 5. To choose the activity, first decide if it is an ALS Lesson pretest and enable the checkbox
if it is, then select the specific test or assessment using the dropbox.
ASSIGNMENT MANAGEMENT REPORTS
42
6. Choose the file format you'd like the report to be saved as: .HTML - Best viewed and printed using your Web browser. .CSV - Comma delimited data, best for importing data into spreadsheets and
databases. 7. Click on the appropriate button, either .HTML or .CSV. 8. Wait, it may take a few minutes for the report to be generated. Please take no action as
long as the Generating Report message is onscreen. 9. .HTML only: Your Web browser will open and the report will appear.
10. .CSV only: When the File Saved dialog opens, you may want to write down the file name and path. Then your data will open in whatever application normally handles .CSV files (typically Excel).
11. In both your browser and Excel, you can view, print, and save your report.
ASSIGNMENT MANAGEMENT REPORTS
43
Adaptive Assessment Comparison
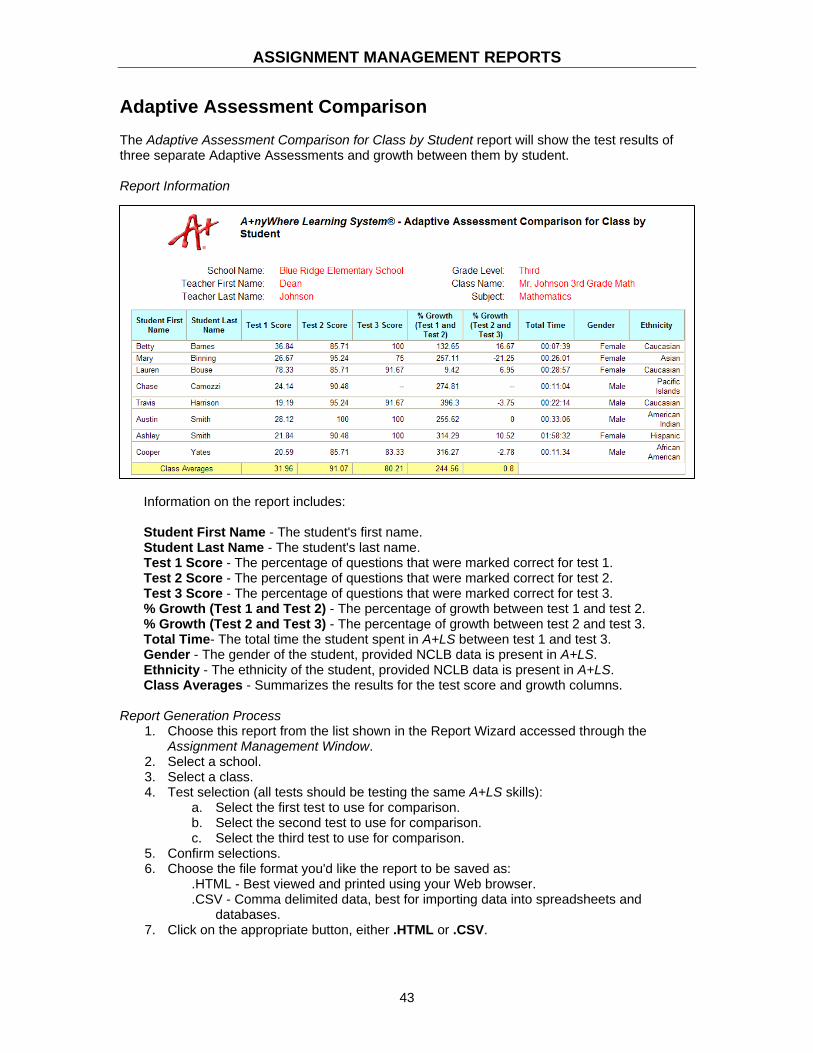
The Adaptive Assessment Comparison for Class by Student report will show the test results of three separate Adaptive Assessments and growth between them by student. Report Information
Information on the report includes:
Student First Name - The student's first name. Student Last Name - The student's last name. Test 1 Score - The percentage of questions that were marked correct for test 1. Test 2 Score - The percentage of questions that were marked correct for test 2. Test 3 Score - The percentage of questions that were marked correct for test 3. % Growth (Test 1 and Test 2) - The percentage of growth between test 1 and test 2. % Growth (Test 2 and Test 3) - The percentage of growth between test 2 and test 3. Total Time- The total time the student spent in A+LS between test 1 and test 3. Gender - The gender of the student, provided NCLB data is present in A+LS. Ethnicity - The ethnicity of the student, provided NCLB data is present in A+LS. Class Averages - Summarizes the results for the test score and growth columns.
Report Generation Process
1. Choose this report from the list shown in the Report Wizard accessed through the Assignment Management Window.
2. Select a school. 3. Select a class. 4. Test selection (all tests should be testing the same A+LS skills):
a. Select the first test to use for comparison. b. Select the second test to use for comparison. c. Select the third test to use for comparison.
5. Confirm selections. 6. Choose the file format you'd like the report to be saved as:
.HTML - Best viewed and printed using your Web browser.
.CSV - Comma delimited data, best for importing data into spreadsheets and databases.
7. Click on the appropriate button, either .HTML or .CSV.

ASSIGNMENT MANAGEMENT REPORTS
44
8. Wait, it may take a few minutes for the report to be generated. Please take no action as long as the Generating Report message is onscreen.
9. .HTML only: Your Web browser will open and the report will appear. 10. .CSV only: When the File Saved dialog opens, you may want to write down the file name
and path. Then your data will open in whatever application normally handles .CSV files. 11. In both your browser and Excel, you can view, print, and save your report.

ASSIGNMENT MANAGEMENT REPORTS
45
Class ALS Skills Mastered**
This report displays the ALS Skills mastered by each student via assessment testing within the selected class. This report is presorted alphabetically by student last name, first name, the strand to which the skill belongs, and then the skill. You can reorder this information simply by clicking in one of the column headers on the report data screen prior to getting a print preview. Report Information
Information displayed on this report includes the student’s name, the strand to which the mastered skill belongs, the skill, and the date the skill was mastered by the student. Report Generation Process
1. Choose this report from the list shown in the Report Wizard accessed through the Assignment Management Window.
2. Select the school to which the class belongs. 3. Select the desired class. 4. Select the desired header and footer information.

ASSIGNMENT MANAGEMENT REPORTS
46
Class Assessment Detail**
This report displays the assessment progress for all students within the selected class. This report is presorted alphabetically by student last name, first name, and then by ALS Skill. You can reorder this information simply by clicking in one of the column headers on the report data screen prior to getting a print preview. Report Information
Information displayed on this report includes:
Last - the last name of the student. First - the first name of the student. ALS Skill - the ALS Skill on which the student was tested. Date - the date the student was tested on the ALS Skill. #? - the number of questions presented to the student to test the ALS Skill. Corrects - the number of questions on the ALS Skill that the student answered correctly. Mastered - whether or not the student mastered the ALS Skill.
Report Generation Process
1. Choose this report from the list shown in the Report Wizard accessed through the Assignment Management Window.
2. Select the school to which the class belongs. 3. Select the desired class. 4. Select the desired header and footer information.
ASSIGNMENT MANAGEMENT REPORTS
47
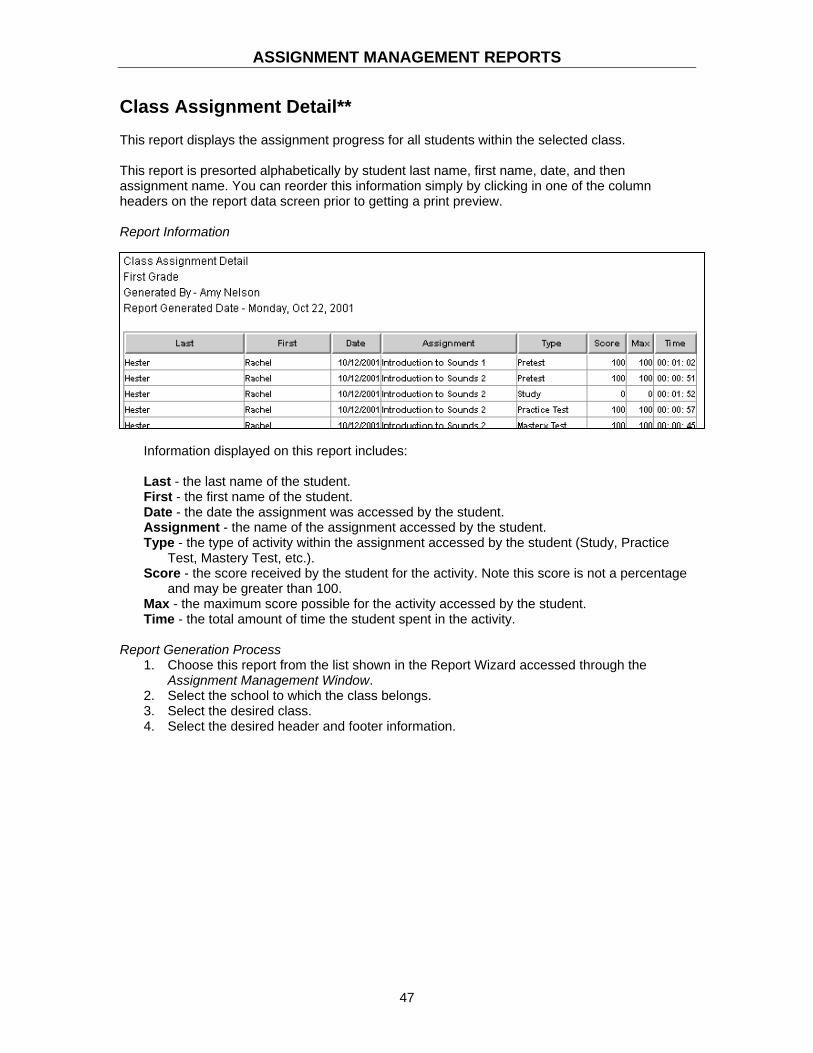
Class Assignment Detail** This report displays the assignment progress for all students within the selected class. This report is presorted alphabetically by student last name, first name, date, and then assignment name. You can reorder this information simply by clicking in one of the column headers on the report data screen prior to getting a print preview. Report Information
Information displayed on this report includes: Last - the last name of the student. First - the first name of the student. Date - the date the assignment was accessed by the student. Assignment - the name of the assignment accessed by the student. Type - the type of activity within the assignment accessed by the student (Study, Practice
Test, Mastery Test, etc.). Score - the score received by the student for the activity. Note this score is not a percentage
and may be greater than 100. Max - the maximum score possible for the activity accessed by the student. Time - the total amount of time the student spent in the activity.
Report Generation Process
1. Choose this report from the list shown in the Report Wizard accessed through the Assignment Management Window.
2. Select the school to which the class belongs. 3. Select the desired class. 4. Select the desired header and footer information.

ASSIGNMENT MANAGEMENT REPORTS
48
Class Assignment Test Detail (by student)** This report displays the pretest, review test, and mastery test progress for each student in the selected class within the specified date range. This report also provides test score summaries for each student. This report is presorted alphabetically by last name, first name, date of each test, and the assignment name. You can reorder this information simply by clicking in one of the column headers on the report data screen prior to getting a print preview. Please note that this report contains so many columns of data that you will need to scroll to the right to view them all in the preview. When printing, we recommend you use landscape mode. Report Information
Information displayed on this report includes: Last - the last name of the student. First - the first name of the student. Date - the date the test for the assignment was last accessed by the student. Assignment - the name of the assignment. Score - the score received by the student for the assignment. Tries - the total number of times the assignment was accessed by the student. Time - the time the student spent in the assignment within the specified date range. Total Score - the total of all scores received by the student, in the class, within the specified
date range. Total Tries - the total number of times the student accessed any assignment within the
specified date range. Total Time - the total amount of time the student spent in assignments within the specified
date range. Average Score - the average of the student’s total scores. Note that this score is computed
using only the student’s highest score for each assignment. If the student takes the mastery test five times, only the highest of the five scores will be used in computing the Average Score.
Average Tries - the average number of times the student accessed his/her assignments. Class Total Tries - the total number of tries all students in the selected class accessed
assignments. Class Total Time - the total amount of time all students in the selected class spent in
assignments. Class Average Score - the average of all scores in the class. This number is derived by
summing all scores in the class and dividing that number by the number of assignments in the class.

ASSIGNMENT MANAGEMENT REPORTS
49
Report Information (continued): Class Average Tries - the average number of assignment tries within the selected class. Class Average Time - the average time the students within the selected class spent in each
assignment. Report Generation Process
1. Choose this report from the list shown in the Report Wizard accessed through the Assignment Management Window.
2. Select the school to which the class belongs. 3. Select the desired class. 4. Select the desired header and footer information.
ASSIGNMENT MANAGEMENT REPORTS
50
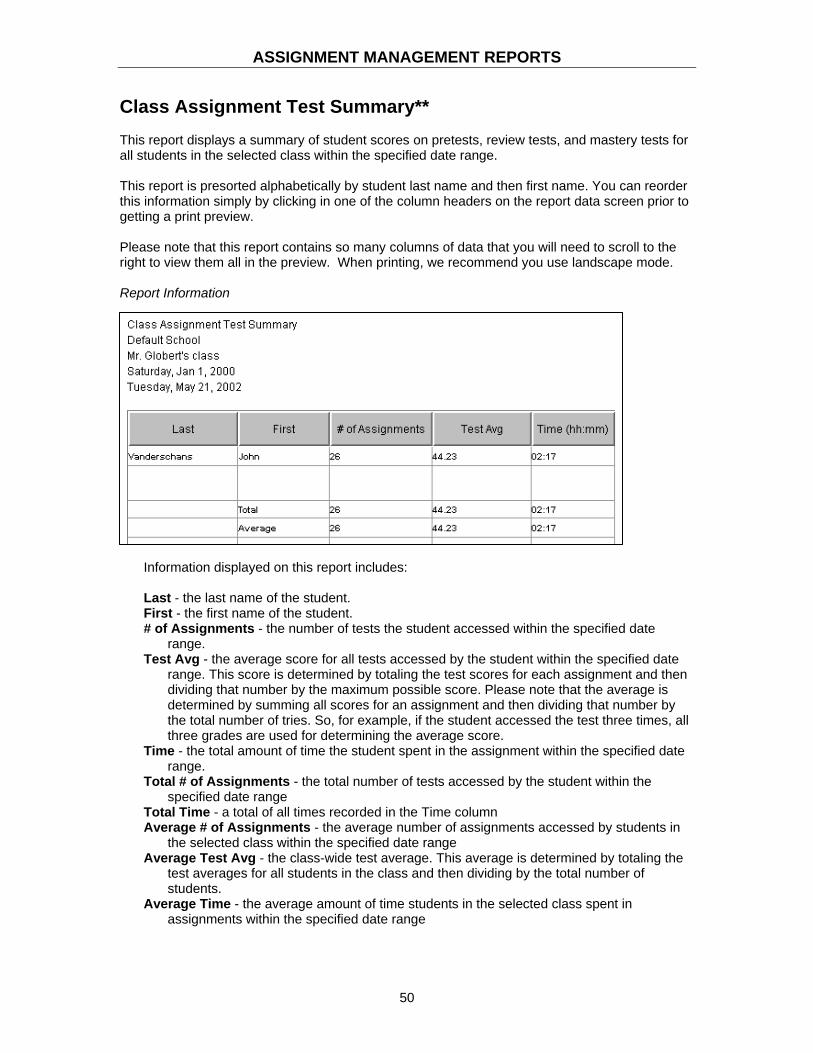
Class Assignment Test Summary** This report displays a summary of student scores on pretests, review tests, and mastery tests for all students in the selected class within the specified date range. This report is presorted alphabetically by student last name and then first name. You can reorder this information simply by clicking in one of the column headers on the report data screen prior to getting a print preview. Please note that this report contains so many columns of data that you will need to scroll to the right to view them all in the preview. When printing, we recommend you use landscape mode. Report Information
Information displayed on this report includes: Last - the last name of the student. First - the first name of the student. # of Assignments - the number of tests the student accessed within the specified date
range. Test Avg - the average score for all tests accessed by the student within the specified date
range. This score is determined by totaling the test scores for each assignment and then dividing that number by the maximum possible score. Please note that the average is determined by summing all scores for an assignment and then dividing that number by the total number of tries. So, for example, if the student accessed the test three times, all three grades are used for determining the average score.
Time - the total amount of time the student spent in the assignment within the specified date range.
Total # of Assignments - the total number of tests accessed by the student within the specified date range
Total Time - a total of all times recorded in the Time column Average # of Assignments - the average number of assignments accessed by students in
the selected class within the specified date range Average Test Avg - the class-wide test average. This average is determined by totaling the
test averages for all students in the class and then dividing by the total number of students.
Average Time - the average amount of time students in the selected class spent in assignments within the specified date range

ASSIGNMENT MANAGEMENT REPORTS
51
Report Generation Process 1. Choose this report from the list shown in the Report Wizard accessed through the
Assignment Management Window. 2. Select the school to which the class belongs. 3. Select the desired class. 4. Select the desired header and footer information.

ASSIGNMENT MANAGEMENT REPORTS
52
Class Roster This report displays all active users currently assigned to the selected class. Active users are those users that have not been removed from the class, either by moving them to the Class “Trash” or deleting them from the Class “Trash” on the Classes Management Window. Report Information
This report is presorted alphabetically by last name, first name, middle name, and then other name. You can reorder this information simply by clicking in one of the column headers on the report data screen prior to getting a print preview. Information in the report includes the last name, first name, middle name, other name, user ID, and user type for each user assigned to the selected class. Report Generation Process
1. Choose this report from the list shown in the Report Wizard accessed through the Assignment Management Window.
2. Select the school to which the class belongs. 3. Select the desired class. 4. Select the desired header and footer information.
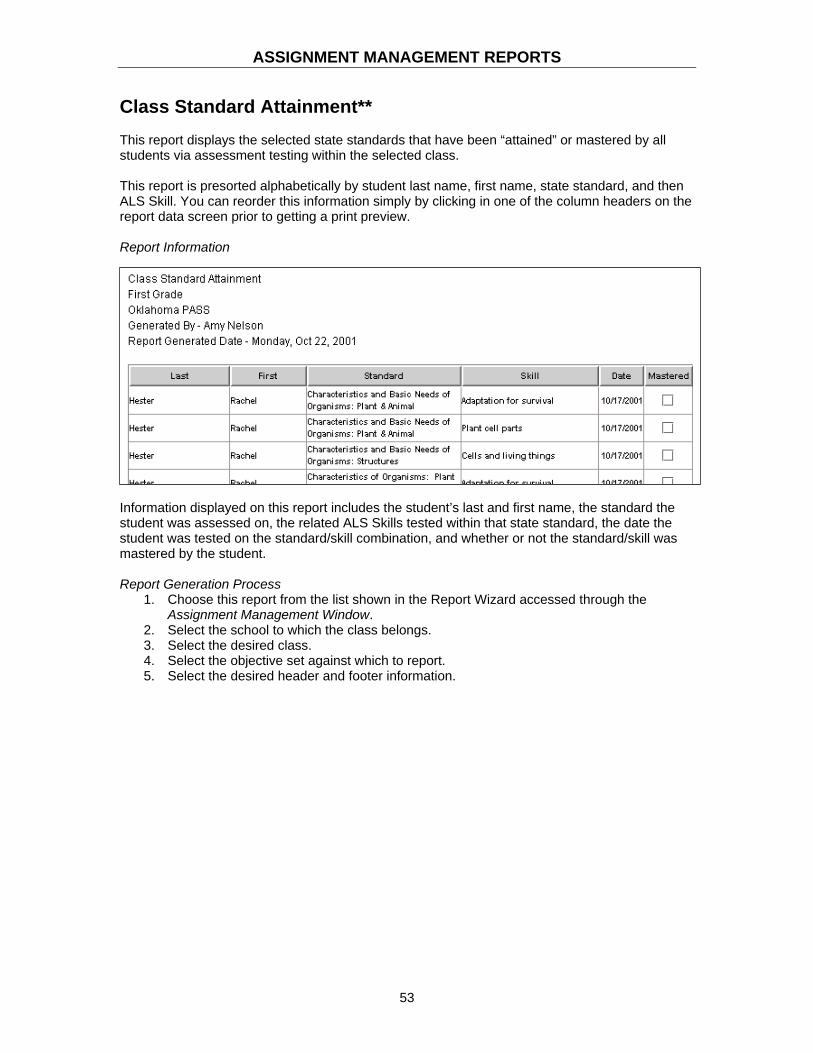
ASSIGNMENT MANAGEMENT REPORTS
53
Class Standard Attainment** This report displays the selected state standards that have been “attained” or mastered by all students via assessment testing within the selected class. This report is presorted alphabetically by student last name, first name, state standard, and then ALS Skill. You can reorder this information simply by clicking in one of the column headers on the report data screen prior to getting a print preview. Report Information
Information displayed on this report includes the student’s last and first name, the standard the student was assessed on, the related ALS Skills tested within that state standard, the date the student was tested on the standard/skill combination, and whether or not the standard/skill was mastered by the student. Report Generation Process
1. Choose this report from the list shown in the Report Wizard accessed through the Assignment Management Window.
2. Select the school to which the class belongs. 3. Select the desired class. 4. Select the objective set against which to report. 5. Select the desired header and footer information.

ASSIGNMENT MANAGEMENT REPORTS
54
Classwide Activity Comparison The Classwide Activity Comparison report compares scores on two separate selected activities (ALS Lessons or Course Assessments) for an entire class. This report is good for comparing scores in pre and post-test scenarios. Report Information
Information on the report includes:
Student - This is the student's name (Last Name, First Name). Act 1 High Score - This is the highest score the student received on the first activity. Act 1 Max Score - This is the maximum possible score for the first activity. Act 1 % Score - This is the score received on the first activity defined as (100 x highest
received) / maximum possible. Act 1 Tries - This indicates the number of times the student attempted the first activity. Act 2 High Score - This is the highest score the student received on the second activity. Act 2 Max Score - This is the maximum possible score for the second activity. Act 2 % Score - This is the score received on the second activity defined as (100 x highest
received) / maximum possible. Act 2 Tries - This indicates the number of times the student attempted the second activity. % Gain - This is the improvement between the two selected activities as a percentage.
Report Generation Process
1. Choose this report from the list shown in the Report Wizard accessed through the Assignment Management Window.
2. Select the school. 3. Select the class. 4. Select the beginning and ending dates by clicking on the appropriate date button,
defining the period of time the report is to cover. 5. To select the activities to compare:
a. First decide the on the type of activity you want to compare by selecting ALS Lesson or Course Assessment.
b. Select the first activity using the left dropbox. c. Select the second activity using the right dropbox.
6. Choose the file format for the report: .HTML - Best viewed and printed using your Web browser. .CSV - Comma delimited data, best for importing data into spreadsheets and
databases.

ASSIGNMENT MANAGEMENT REPORTS
55
7. Click on the appropriate button, either .HTML or .CSV. 8. Wait, it may take a few minutes for the report to be generated. Please take no action as
long as the Generating Report message is onscreen. 9. .HTML only: Your Web browser will open and the report will appear.
10. .CSV only: When the File Saved dialog opens, you may want to write down the file name and path. Then your data will open in whatever application normally handles .CSV files (typically Excel).
11. In both your browser and Excel, you can view, print, and save your report.
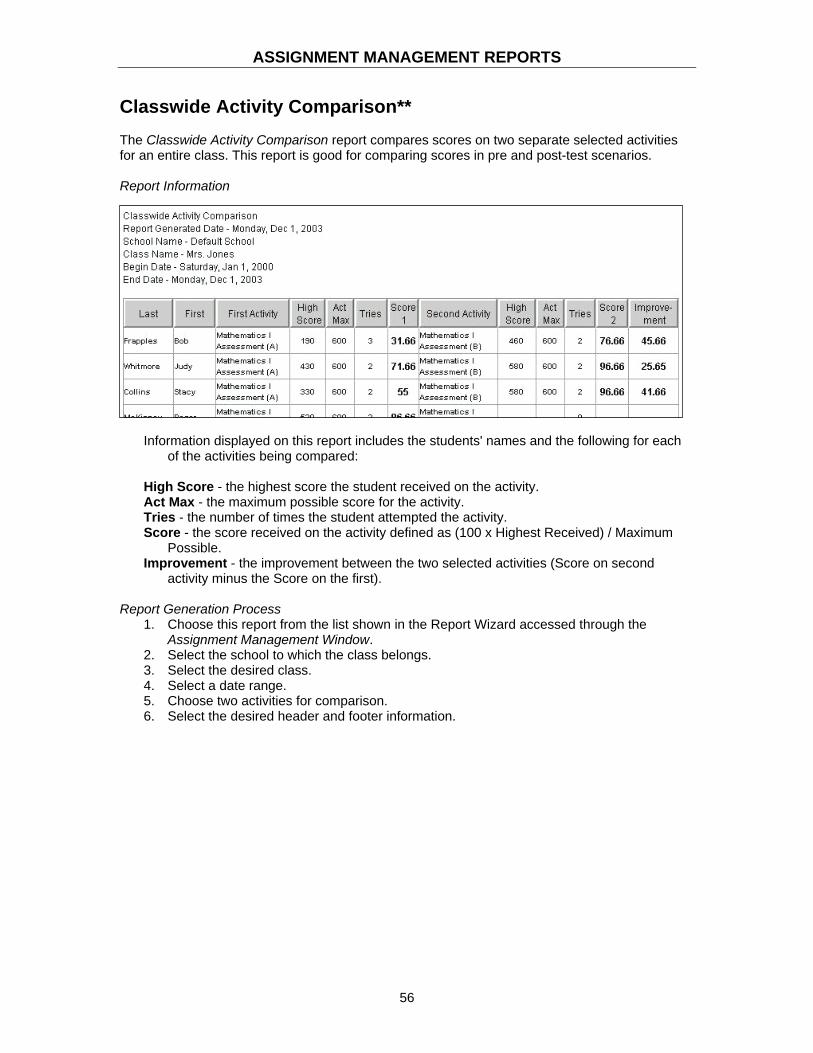
ASSIGNMENT MANAGEMENT REPORTS
56
Classwide Activity Comparison** The Classwide Activity Comparison report compares scores on two separate selected activities for an entire class. This report is good for comparing scores in pre and post-test scenarios. Report Information
Information displayed on this report includes the students' names and the following for each
of the activities being compared: High Score - the highest score the student received on the activity. Act Max - the maximum possible score for the activity. Tries - the number of times the student attempted the activity. Score - the score received on the activity defined as (100 x Highest Received) / Maximum
Possible. Improvement - the improvement between the two selected activities (Score on second
activity minus the Score on the first).
Report Generation Process 1. Choose this report from the list shown in the Report Wizard accessed through the
Assignment Management Window. 2. Select the school to which the class belongs. 3. Select the desired class. 4. Select a date range. 5. Choose two activities for comparison. 6. Select the desired header and footer information.

ASSIGNMENT MANAGEMENT REPORTS
57
Classwide Course Assessment** This report shows scores on a selected course assessment for an entire class. Report Information
Information displayed on this report includes the students' names and the following for the selected course assessment:
Activity - the course assessment being reported. Highest Received - the highest score the student received on the assessment. Maximum Possible - the maximum possible score for the assessment. Tries - the number of times the student took the assessment. Score - the score received on the assessment as a percentage.
Report Generation Process
1. Choose this report from the list shown in the Report Wizard accessed through the Assignment Management Window.
2. Select a class that contains the students to report. 3. Select a date range. 4. Choose a course assessment to report. 5. Format header and footer information.

ASSIGNMENT MANAGEMENT REPORTS
58
Classwide Student Assignment Lists This report lists all the assignments in the class for each assignment list for the selected students. Report Information
Information on the report includes:
Last - the student's last name. First - the student's first name. Asg List - the assignment list to which the assignment belongs. Assignment - the assignment name. Order - the order of the assignment within the assignment list. Mastered - indicates whether the assignment is mastered.
Report Generation Process
1. Choose this report from the list shown in the Report Wizard accessed through the Assignment Management Window.
2. Select a school with students to report. 3. Select a class that contains the student to report. 4. Select a user from within the class. 5. Select an assignment list to report. 6. Format header and footer information.

ASSIGNMENT MANAGEMENT REPORTS
59
Course Assessment Detail Course Assessment Detail is a report that shows pre and post Course Assessment scores for all students in a class, including the percentage gain from pretest to post-test for the selected date range. Summarized for each student is ALS Lesson data from all assignments in the selected class between the Course Assessment pretest and post-test date ranges. Report Information
Information on the report includes:
Name – Displays the ‘Last Name, First Name’ of the student. Test - The name of the Course Assessment. Pretest Score % - The student's score on the pretest, as a percentage. Post-test Score % - The student's score on the post-test, as a percentage. % Gain - The percentage difference between the student's pretest and post-test scores. Lessons Assigned - The number of ALS Lessons the student has activity on in the class
within the Course Assessment pretest and post-test date ranges. This includes all ALS Lessons, not just those related to the Course Assessment.
Avg. Lesson Score % - The average score on ALS Lessons with activity during the Course Assessment pretest and post-test date ranges, including all ALS Lessons (not just those related to the Course Assessment).
Lessons Mastered - The number of ALS Lessons mastered with activity during the Course Assessment pretest and post-test date ranges, including all ALS Lessons (not just those related to the Course Assessment).
Lesson Time (min) - The total number of minutes the student has spent on ALS Lessons during the Course Assessment pretest and post-test date ranges, including all ALS Lessons (not just those related to the Course Assessment).
ASSIGNMENT MANAGEMENT REPORTS
60
Report Generation Process 1. Choose this report from the list shown in the Report Wizard accessed through the
Assignment Management Window. 2. Select the school. 3. Select the class. 4. Select the beginning and ending dates by clicking on the appropriate date button,
defining the period of time the report is to cover. 5. Choose the file format you'd like the report to be saved as:
.HTML - Best viewed and printed using your Web browser.
.CSV - Comma delimited data, best for importing data into spreadsheets and databases.
6. Click on the appropriate button, either .HTML or .CSV. 7. Wait, it may take a few minutes for the report to be generated. Please take no action as
long as the Generating Report message is onscreen. 8. .HTML only: Your Web browser will open and the report will appear. 9. .CSV only: When the File Saved dialog opens, you may want to write down the file name
and path. Then your data will open in whatever application normally handles .CSV files (typically Excel).
10. In both your browser and Excel, you can view, print, and save your report.
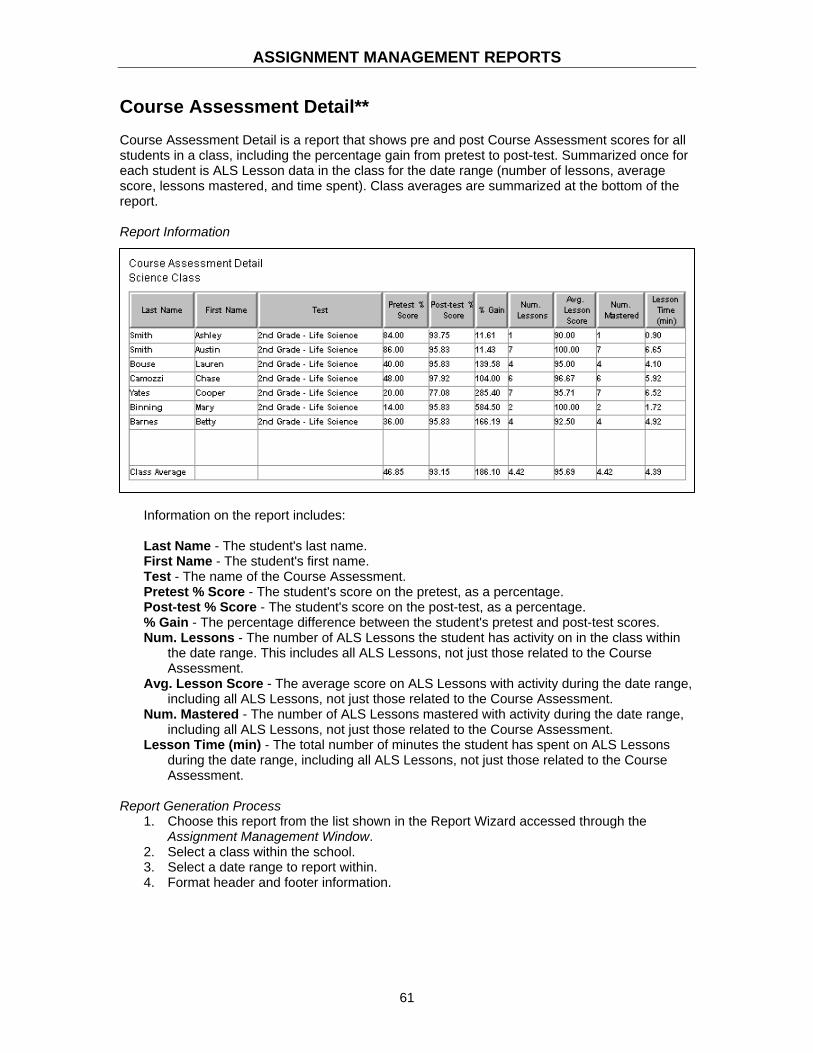
ASSIGNMENT MANAGEMENT REPORTS
61
Course Assessment Detail** Course Assessment Detail is a report that shows pre and post Course Assessment scores for all students in a class, including the percentage gain from pretest to post-test. Summarized once for each student is ALS Lesson data in the class for the date range (number of lessons, average score, lessons mastered, and time spent). Class averages are summarized at the bottom of the report. Report Information
Information on the report includes:
Last Name - The student's last name. First Name - The student's first name. Test - The name of the Course Assessment. Pretest % Score - The student's score on the pretest, as a percentage. Post-test % Score - The student's score on the post-test, as a percentage. % Gain - The percentage difference between the student's pretest and post-test scores. Num. Lessons - The number of ALS Lessons the student has activity on in the class within
the date range. This includes all ALS Lessons, not just those related to the Course Assessment.
Avg. Lesson Score - The average score on ALS Lessons with activity during the date range, including all ALS Lessons, not just those related to the Course Assessment.
Num. Mastered - The number of ALS Lessons mastered with activity during the date range, including all ALS Lessons, not just those related to the Course Assessment.
Lesson Time (min) - The total number of minutes the student has spent on ALS Lessons during the date range, including all ALS Lessons, not just those related to the Course Assessment.
Report Generation Process
1. Choose this report from the list shown in the Report Wizard accessed through the Assignment Management Window.
2. Select a class within the school. 3. Select a date range to report within. 4. Format header and footer information.
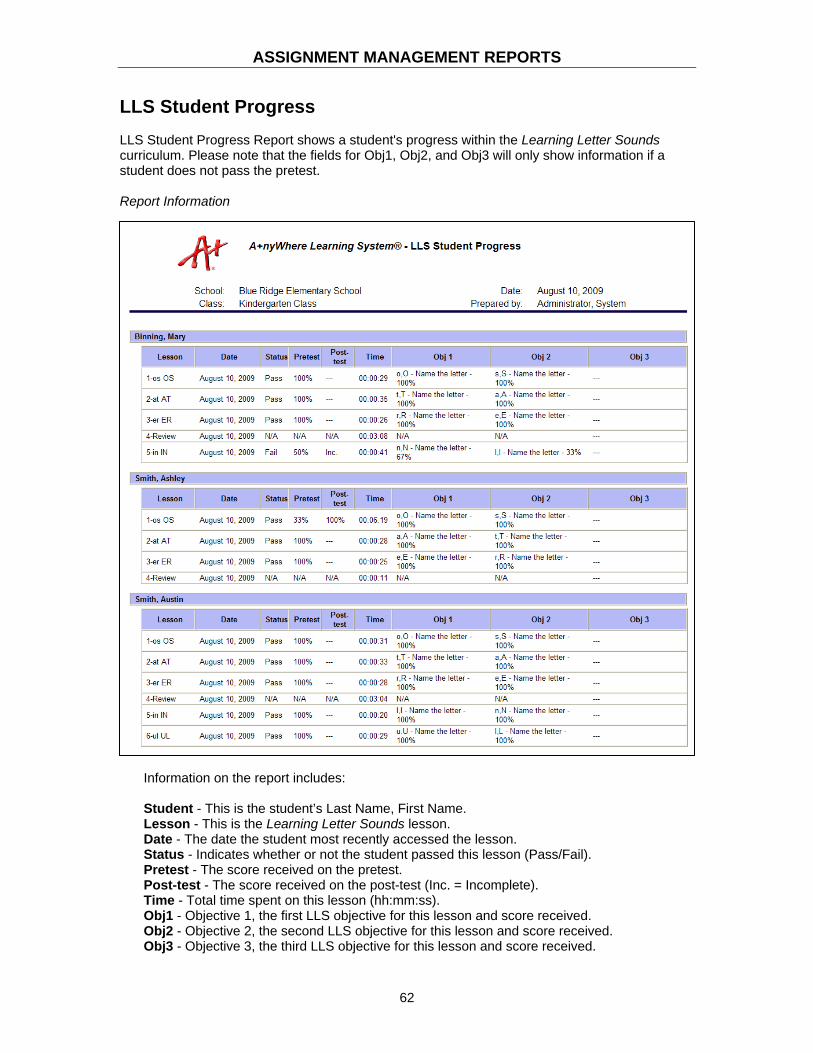
ASSIGNMENT MANAGEMENT REPORTS
62
LLS Student Progress LLS Student Progress Report shows a student's progress within the Learning Letter Sounds curriculum. Please note that the fields for Obj1, Obj2, and Obj3 will only show information if a student does not pass the pretest. Report Information
Information on the report includes:
Student - This is the student’s Last Name, First Name. Lesson - This is the Learning Letter Sounds lesson. Date - The date the student most recently accessed the lesson. Status - Indicates whether or not the student passed this lesson (Pass/Fail). Pretest - The score received on the pretest. Post-test - The score received on the post-test (Inc. = Incomplete). Time - Total time spent on this lesson (hh:mm:ss). Obj1 - Objective 1, the first LLS objective for this lesson and score received. Obj2 - Objective 2, the second LLS objective for this lesson and score received. Obj3 - Objective 3, the third LLS objective for this lesson and score received.

ASSIGNMENT MANAGEMENT REPORTS
63
Report Generation Process
1. Choose this report from the list shown in the Report Wizard accessed through the Assignment Management Window.
2. Select the school. 3. Select the class. 4. Choose the file format you'd like the report to be saved as:
.HTML - Best viewed and printed using your Web browser.
.CSV - Comma delimited data, best for importing data into spreadsheets and databases.
5. Click on the appropriate button, either .HTML or .CSV. 6. Wait, it may take a few minutes for the report to be generated. Please take no action as
long as the Generating Report message is onscreen. 7. .HTML only: Your Web browser will open and the report will appear. 8. .CSV only: When the File Saved dialog opens, you may want to write down the file name
and path. Then your data will open in whatever application normally handles .CSV files (typically Excel).
9. In both your browser and Excel, you can view, print, and save your report.
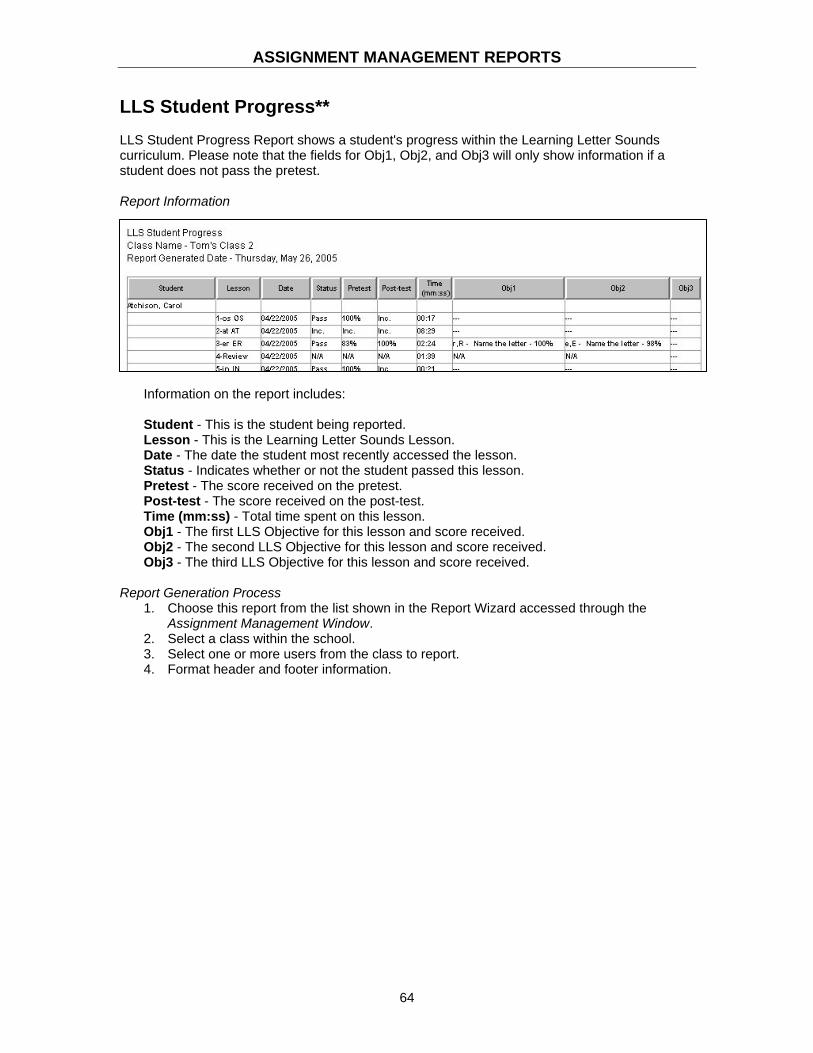
ASSIGNMENT MANAGEMENT REPORTS
64
LLS Student Progress** LLS Student Progress Report shows a student's progress within the Learning Letter Sounds curriculum. Please note that the fields for Obj1, Obj2, and Obj3 will only show information if a student does not pass the pretest. Report Information
Information on the report includes:
Student - This is the student being reported. Lesson - This is the Learning Letter Sounds Lesson. Date - The date the student most recently accessed the lesson. Status - Indicates whether or not the student passed this lesson. Pretest - The score received on the pretest. Post-test - The score received on the post-test. Time (mm:ss) - Total time spent on this lesson. Obj1 - The first LLS Objective for this lesson and score received. Obj2 - The second LLS Objective for this lesson and score received. Obj3 - The third LLS Objective for this lesson and score received.
Report Generation Process
1. Choose this report from the list shown in the Report Wizard accessed through the Assignment Management Window.
2. Select a class within the school. 3. Select one or more users from the class to report. 4. Format header and footer information.

ASSIGNMENT MANAGEMENT REPORTS
65
Standard Attainment - by Class This report displays the level of standard attainment for students in the selected class(es). This is a drill-down teacher report that contains three levels. The first screen displays aggregate data on objective(s). The second screen displays aggregate data on student(s) for a specific objective. The third screen displays aggregate data for each skill the selected student has taken for the objective. Before generating the report, you will be asked to select a school, class, date range, and the objectives you want the report to cover. Report Information - Screen 1
Information on the report includes:
{Objective Name} - Displays the name of the objective. The column header could be
different depending on the objective set you select. Each state standard set has its own naming conventions for objectives, skills, etc.
{Objective} ID - Displays the objective ID. This column’s name is also dependent on the objective set you’ve selected. Each state standard set has its own naming conventions for objectives, skills, etc.
{Standard Subset} - Displays the standard subset linked to the objective. As with the prior two columns, the name is dependent on the objective set you’ve selected. Each state standard set has its own naming conventions for objectives, skills, etc.
Students Tested - Displays the total number of students being tested for an objective. Students Mastered - Displays the total number of all the students that mastered the
objective. Percent Mastered - This column divides the number of students that mastered the objective
by the total number of students, multiplied by 100.

ASSIGNMENT MANAGEMENT REPORTS
66
Report Information - Screen 2
Information on the report includes:
Student - Displays the 'Last Name, First Name' of the
student. # Questions - Displays the total number of questions
the student was asked for the objective. # Correct - Displays the total number of questions the
student got correct for the objective. Mastered - This column displays 'Yes' if the Percent
Mastered column is 80 or greater, otherwise it displays 'No'. The Percent Mastered column gets calculated by dividing the number of skills mastered by the total number of skills, multiplied by 100.
Report Information - Screen 3
Information on the report includes:
ALS Skill - Displays the name of the skill. Date - Displays the date (MM/DD/YYYY) the skill was completed. # Questions - Displays the total number of questions the student was asked for the skill. # Correct - Displays the total number of questions the student got correct for the skill. Mastered - This column displays 'Yes' if the Percent Mastered column is 80 or greater,
otherwise it displays 'No'. The Percent Mastered column gets calculated by dividing the number of questions correct by the total number of questions, multiplied by 100.
This level includes an optional bar chart.

ASSIGNMENT MANAGEMENT REPORTS
67
Report Generation Process 1. Choose this report from the list shown in the Report Wizard accessed through the
Administration Management Window. 2. Choose the school using the dropbox. 3. Choose the class using the dropbox. 4. To select the standards and related skills to be included in the report:
a. Use the dropboxes to select the Standard Set, Curriculum Area, Standard Subset, and Curriculum Level.
b. With the related standards displayed in Available Standards, select the ones you want included in the report.
c. Use the Add button to move the desired standards to the right column, Selected Standards.
d. You can repeat the process to select additional standards. 5. Select the beginning and ending dates by clicking on the appropriate date button,
defining the period of time the report is to cover. 6. Choose the file format you'd like the report to be saved as:
.HTML - Best viewed and printed using your Web browser.
.CSV - Comma delimited data, best for importing data into spreadsheets and databases.
7. Click on the appropriate button, either .HTML or .CSV. 8. Wait, it may take a few minutes for the report to be generated. Please take no action as
long as the Generating Report message is onscreen. 9. .HTML only: Your Web browser will open and the report will appear. Watch for hotlinks in
the report. On the first screen, click on a skill and a more detailed report screen opens. On the second screen, you can click on a student’s name to see details of his or her performance. You can also use the View Chart link on the second screen.
10. .CSV only: When the File Saved dialog opens, you may want to write down the file name and path. Then your data will open in whatever application normally handles .CSV files (typically Excel).
11. In both your browser and Excel, you can view, print, and save your report.
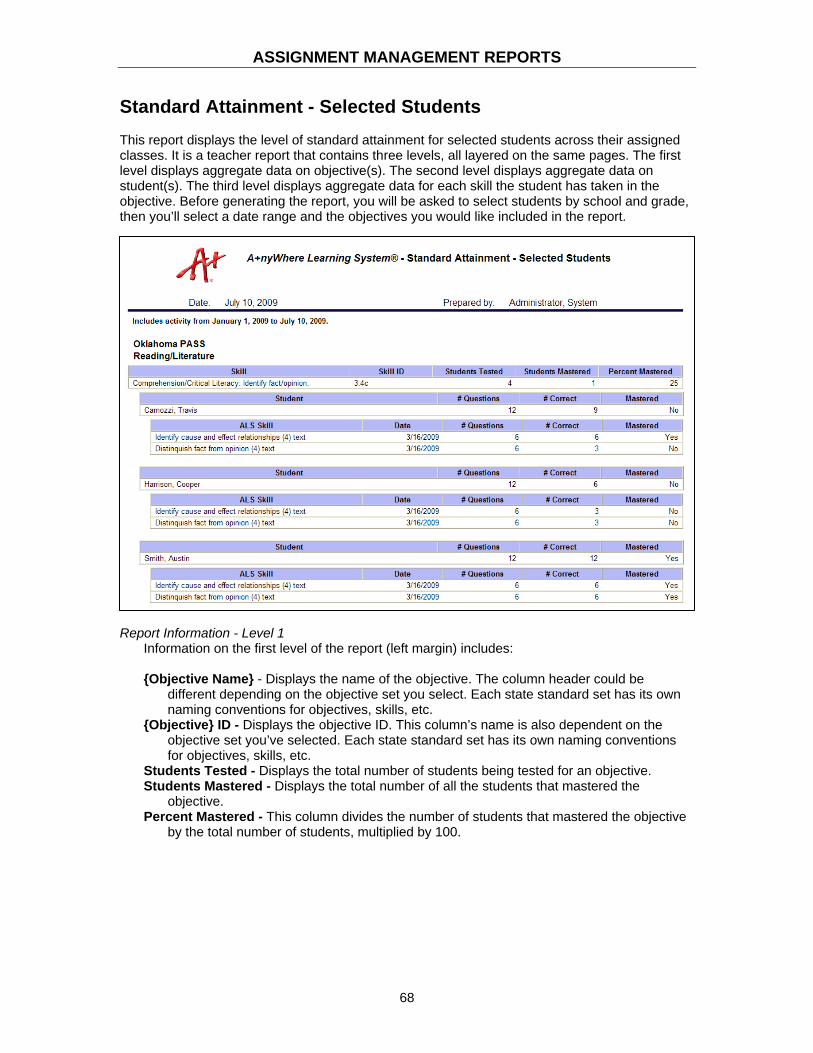
ASSIGNMENT MANAGEMENT REPORTS
68
Standard Attainment - Selected Students This report displays the level of standard attainment for selected students across their assigned classes. It is a teacher report that contains three levels, all layered on the same pages. The first level displays aggregate data on objective(s). The second level displays aggregate data on student(s). The third level displays aggregate data for each skill the student has taken in the objective. Before generating the report, you will be asked to select students by school and grade, then you’ll select a date range and the objectives you would like included in the report.
Report Information - Level 1
Information on the first level of the report (left margin) includes:
{Objective Name} - Displays the name of the objective. The column header could be different depending on the objective set you select. Each state standard set has its own naming conventions for objectives, skills, etc.
{Objective} ID - Displays the objective ID. This column’s name is also dependent on the objective set you’ve selected. Each state standard set has its own naming conventions for objectives, skills, etc.
Students Tested - Displays the total number of students being tested for an objective. Students Mastered - Displays the total number of all the students that mastered the
objective. Percent Mastered - This column divides the number of students that mastered the objective
by the total number of students, multiplied by 100.
ASSIGNMENT MANAGEMENT REPORTS
69
Report Information - Level 2 Information on the second level of the report (first indent) includes:
Student - Displays the 'Last Name, First Name' of the student. # Questions - Displays the total number of questions the student was asked for the
objective. # Correct - Displays the total number of questions the student got correct for the objective. Mastered - This column displays 'Yes' if the Percent Mastered column is 80 or greater,
otherwise it displays 'No'. The Percent Mastered column gets calculated by dividing the number of skills mastered by the total number of skills, multiplied by 100.
Report Information - Level 3
Information on the third level of the report (second indent) includes:
ALS Skill - Displays the name of the skill. Date - Displays the date (MM/DD/YYYY) the skill was completed. # Questions - Displays the total number of questions the student was asked for the skill. # Correct - Displays the total number of questions the student got correct for the skill. Mastered - This column displays 'Yes' if the Percent Mastered column is 80 or greater,
otherwise it displays 'No'. The Percent Mastered column gets calculated by dividing the number of questions correct by the total number of questions, multiplied by 100.
Report Generation Process
1. Choose this report from the list shown in the Report Wizard accessed through the Assignment Management Window.
2. Select the school. 3. Select the class. 4. Select one or more students. 5. To select the standards and related skills to be included in the report:
a. Use the dropboxes to select the Standard Set, Curriculum Area, Standard Subset, and Curriculum Level.
b. With the related standards displayed in Available Standards, select the ones you want included in the report.
c. Use the Add button to move the desired standards to the right column, Selected Standards.
d. You can repeat the process to select additional standards. 6. Select the beginning and ending dates by clicking on the appropriate date button,
defining the period of time the report is to cover. 7. Choose the file format you'd like the report to be saved as:
.HTML - Best viewed and printed using your Web browser.
.CSV - Comma delimited data, best for importing data into spreadsheets and databases.
8. Click on the appropriate button, either .HTML or .CSV. 9. Wait, it may take a few minutes for the report to be generated. Please take no action as
long as the Generating Report message is onscreen. 10. .HTML only: Your Web browser will open and the report will appear. 11. .CSV only: When the File Saved dialog opens, you may want to write down the file name
and path. Then your data will open in whatever application normally handles .CSV files (typically Excel).
12. In both your browser and Excel, you can view, print, and save your report.
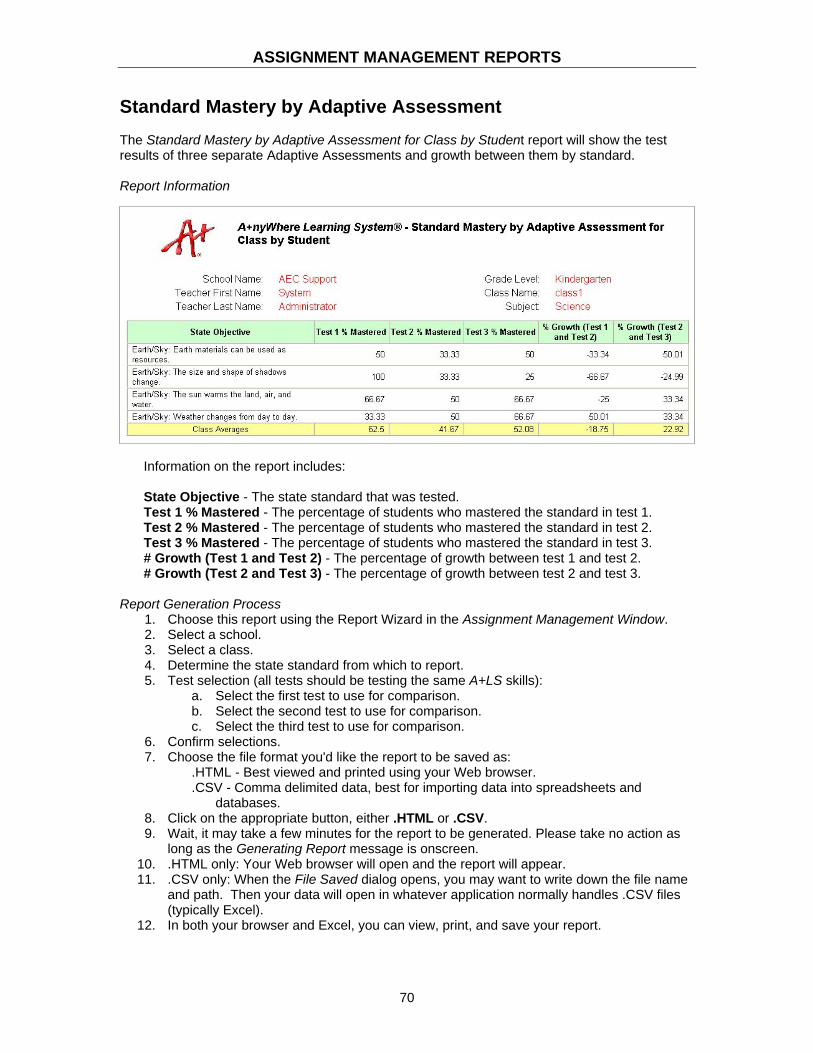
ASSIGNMENT MANAGEMENT REPORTS
70
Standard Mastery by Adaptive Assessment The Standard Mastery by Adaptive Assessment for Class by Student report will show the test results of three separate Adaptive Assessments and growth between them by standard. Report Information
Information on the report includes:
State Objective - The state standard that was tested. Test 1 % Mastered - The percentage of students who mastered the standard in test 1. Test 2 % Mastered - The percentage of students who mastered the standard in test 2. Test 3 % Mastered - The percentage of students who mastered the standard in test 3. # Growth (Test 1 and Test 2) - The percentage of growth between test 1 and test 2. # Growth (Test 2 and Test 3) - The percentage of growth between test 2 and test 3.
Report Generation Process
1. Choose this report using the Report Wizard in the Assignment Management Window. 2. Select a school. 3. Select a class. 4. Determine the state standard from which to report. 5. Test selection (all tests should be testing the same A+LS skills):
a. Select the first test to use for comparison. b. Select the second test to use for comparison. c. Select the third test to use for comparison.
6. Confirm selections. 7. Choose the file format you'd like the report to be saved as:
.HTML - Best viewed and printed using your Web browser.
.CSV - Comma delimited data, best for importing data into spreadsheets and databases.
8. Click on the appropriate button, either .HTML or .CSV. 9. Wait, it may take a few minutes for the report to be generated. Please take no action as
long as the Generating Report message is onscreen. 10. .HTML only: Your Web browser will open and the report will appear. 11. .CSV only: When the File Saved dialog opens, you may want to write down the file name
and path. Then your data will open in whatever application normally handles .CSV files (typically Excel).
12. In both your browser and Excel, you can view, print, and save your report.
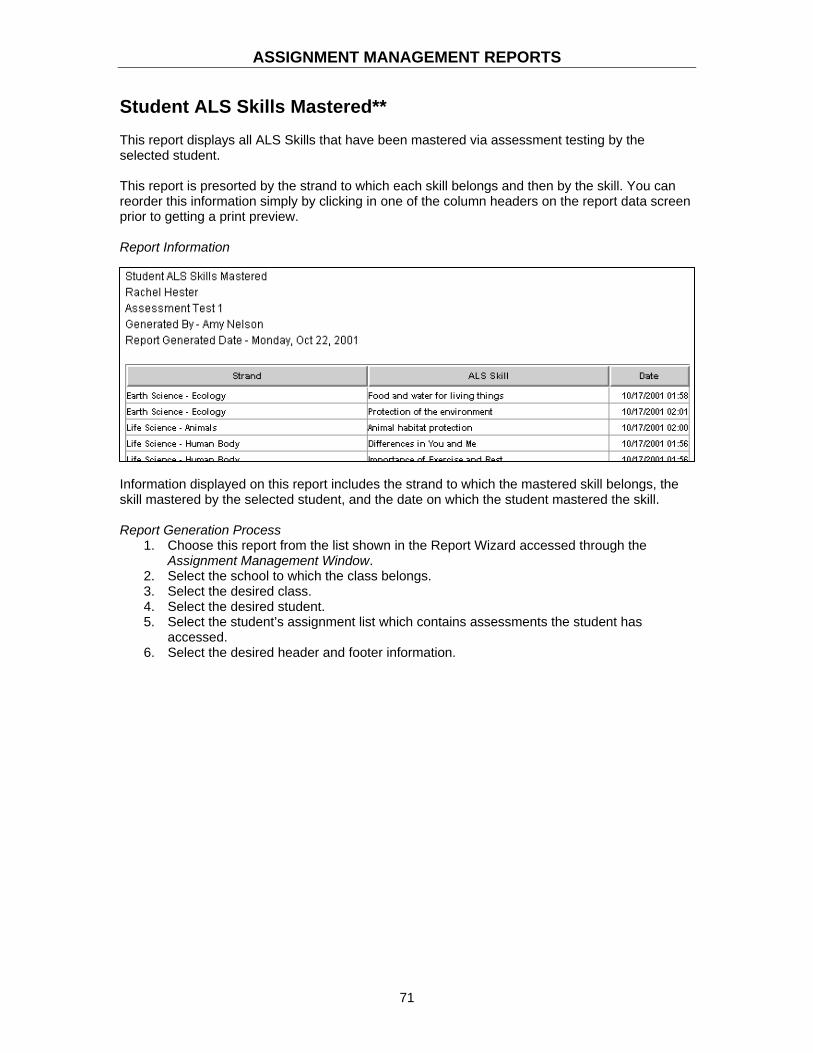
ASSIGNMENT MANAGEMENT REPORTS
71
Student ALS Skills Mastered** This report displays all ALS Skills that have been mastered via assessment testing by the selected student. This report is presorted by the strand to which each skill belongs and then by the skill. You can reorder this information simply by clicking in one of the column headers on the report data screen prior to getting a print preview. Report Information
Information displayed on this report includes the strand to which the mastered skill belongs, the skill mastered by the selected student, and the date on which the student mastered the skill. Report Generation Process
1. Choose this report from the list shown in the Report Wizard accessed through the Assignment Management Window.
2. Select the school to which the class belongs. 3. Select the desired class. 4. Select the desired student. 5. Select the student’s assignment list which contains assessments the student has
accessed. 6. Select the desired header and footer information.
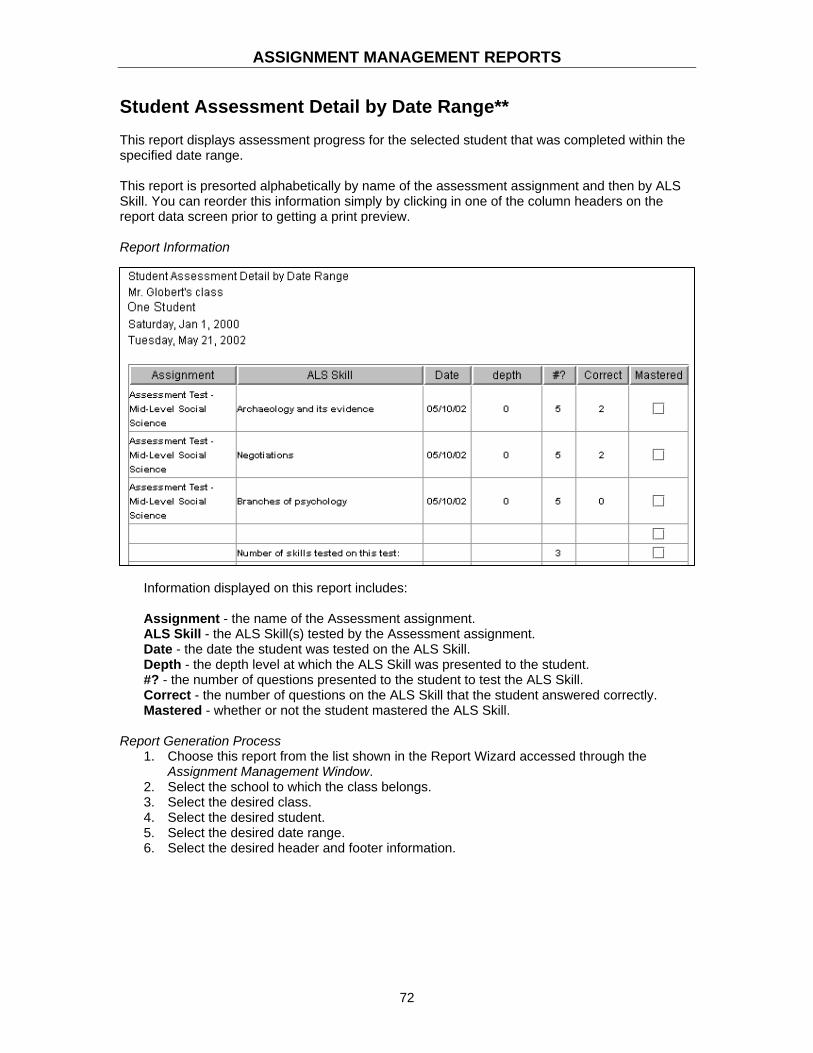
ASSIGNMENT MANAGEMENT REPORTS
72
Student Assessment Detail by Date Range** This report displays assessment progress for the selected student that was completed within the specified date range. This report is presorted alphabetically by name of the assessment assignment and then by ALS Skill. You can reorder this information simply by clicking in one of the column headers on the report data screen prior to getting a print preview. Report Information
Information displayed on this report includes: Assignment - the name of the Assessment assignment. ALS Skill - the ALS Skill(s) tested by the Assessment assignment. Date - the date the student was tested on the ALS Skill. Depth - the depth level at which the ALS Skill was presented to the student. #? - the number of questions presented to the student to test the ALS Skill. Correct - the number of questions on the ALS Skill that the student answered correctly. Mastered - whether or not the student mastered the ALS Skill.
Report Generation Process
1. Choose this report from the list shown in the Report Wizard accessed through the Assignment Management Window.
2. Select the school to which the class belongs. 3. Select the desired class. 4. Select the desired student. 5. Select the desired date range. 6. Select the desired header and footer information.
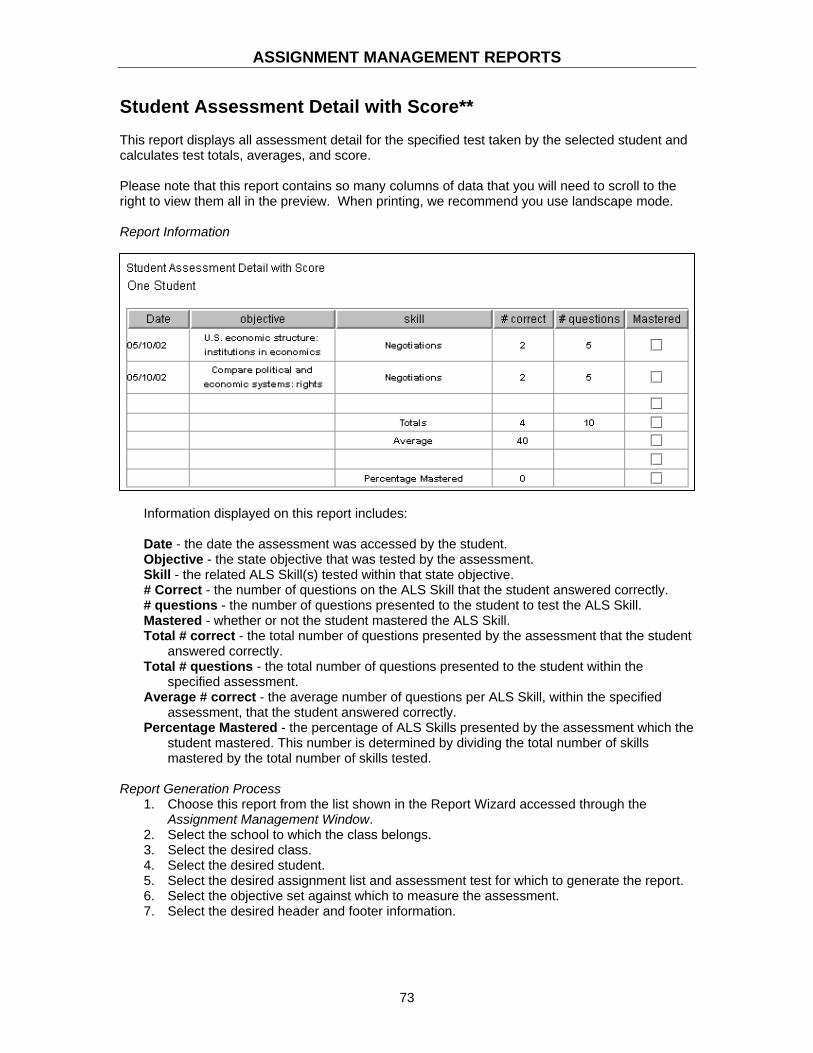
ASSIGNMENT MANAGEMENT REPORTS
73
Student Assessment Detail with Score** This report displays all assessment detail for the specified test taken by the selected student and calculates test totals, averages, and score. Please note that this report contains so many columns of data that you will need to scroll to the right to view them all in the preview. When printing, we recommend you use landscape mode. Report Information
Information displayed on this report includes: Date - the date the assessment was accessed by the student. Objective - the state objective that was tested by the assessment. Skill - the related ALS Skill(s) tested within that state objective. # Correct - the number of questions on the ALS Skill that the student answered correctly. # questions - the number of questions presented to the student to test the ALS Skill. Mastered - whether or not the student mastered the ALS Skill. Total # correct - the total number of questions presented by the assessment that the student
answered correctly. Total # questions - the total number of questions presented to the student within the
specified assessment. Average # correct - the average number of questions per ALS Skill, within the specified
assessment, that the student answered correctly. Percentage Mastered - the percentage of ALS Skills presented by the assessment which the
student mastered. This number is determined by dividing the total number of skills mastered by the total number of skills tested.
Report Generation Process
1. Choose this report from the list shown in the Report Wizard accessed through the Assignment Management Window.
2. Select the school to which the class belongs. 3. Select the desired class. 4. Select the desired student. 5. Select the desired assignment list and assessment test for which to generate the report. 6. Select the objective set against which to measure the assessment. 7. Select the desired header and footer information.

ASSIGNMENT MANAGEMENT REPORTS
74
Student Assessment Detail** This report displays the progress detail for each assessment test accessed by the student within the selected class. This report is presorted alphabetically by assignment and then by date accessed. You can reorder this information simply by clicking in one of the column headers on the report data screen prior to getting a print preview. Report Information
Information displayed on this report includes: ALS Skill - the skill tested by the assessment assignment. Date - the date the student was tested on the ALS Skill. Depth - the depth level at which the ALS Skill was presented to the student. #? - the number of questions presented to the student over the ALS Skill. Correct - the number of questions the student answered correctly. Mastered - whether or not the student mastered the ALS Skill.
The report totals the number of ALS Skills tested by each assessment assignment.
Report Generation Process
1. Choose this report from the list shown in the Report Wizard accessed through the Assignment Management Window.
2. Select the school to which the class belongs. 3. Select the desired class. 4. Select the desired student. 5. Select the desired header and footer information.

ASSIGNMENT MANAGEMENT REPORTS
75
Student Assignment Detail Classwide** This report displays the progress detail for all assignments accessed by the student in the selected class within the specified date range. This report is presorted by assignment list name, date the assignment was accessed, and then by the assignment name. You can reorder this information simply by clicking in one of the column headers on the report data screen prior to getting a print preview. Report Information
Information displayed on this report includes: List - the assignment list on which the assignment belongs. Date - the date the student accessed the assignment. Assignment - the name of the assignment accessed by the student. Type - the type of activity within the assignment accessed by the student (Study, Practice
Test, Mastery Test, etc.). Score - the score received by the student for the activity. Note: this score is not a percentage
and may be greater than 100. Max - the maximum score possible for the activity accessed by the student. Time - the total amount of time the student spent in the activity. Avg Score - the average score the student received on assignments within the specified date
range. This score is determined by totaling all items scored, dividing that number by the total maximum scores possible, and then multiplying the result by 100.
Total Time - the total amount of time the student spent in assignments within the specified date range (this is the sum of all values in the Time column).
Report Generation Process
1. Choose this report from the list shown in the Report Wizard accessed through the Assignment Management Window.
2. Select the school to which the student belongs. 3. Select the class in which the student is enrolled. 4. Select the desired student. 5. Select the desired date range. 6. Select the desired header and footer information.

ASSIGNMENT MANAGEMENT REPORTS
76
Student Assignment Detail** This report displays the progress detail for each assignment on the selected assignment list accessed by the student. This report is presorted by date the assignment was accessed and then by the assignment name. You can reorder this information simply by clicking in one of the column headers on the report data screen prior to getting a print preview. Report Information
Information displayed on this report includes: Date - the date the student accessed the assignment Assignment - the name of the assignment accessed by the student Type - the type of activity within the assignment accessed by the student (Study, Practice
Test, Mastery Test, etc.) Score - the score received by the student for the activity. Note: this score is not a percentage
and may be greater than 100. Max - the maximum score possible for the activity accessed by the student Time - the total amount of time the student spent in the activity
Report Generation Process
1. Choose this report from the list shown in the Report Wizard accessed through the Assignment Management Window.
2. Select the school to which the class belongs. 3. Select the desired class. 4. Select the desired student. 5. Select the desired header and footer information.

ASSIGNMENT MANAGEMENT REPORTS
77
Student Assignment List This report displays the lessons assigned to the student within the selected assignment list. Report Information
This report is presorted by the order in which the assignments appear on the assignment list. You can reorder this information simply by clicking in one of the column headers on the report data screen prior to getting a print preview. Information displayed on this report includes the order in which the assignment appears on the list, the name of the assignment, and whether or not the assignment has been mastered by the student. Report Generation Process
1. Choose this report from the list shown in the Report Wizard accessed through the Assignment Management Window.
2. Select the school to which the class belongs. 3. Select the desired class. 4. Select the desired student. 5. Select the desired assignment list. 6. Select the desired header and footer information.

ASSIGNMENT MANAGEMENT REPORTS
78
Student Progress - by Class This report displays all student progress for a selected class (only Adaptive Assessments are excluded, since they aren’t graded). It is a drill-down teacher report that contains two levels. The first screen displays aggregate data on each student’s assignment list(s) in the selected class. The second screen displays aggregate data on each assignment. Before generating the report, you will be asked to select a school, class, and date range. Report Information - Screen 1
Information on the report includes:
Name - Displays the 'Last Name, First Name' of the student. Note: the first line will display the
Class Average. Assignment List - Displays the name of the assignment list. # of Lessons - Displays the number of assignments in the assignment list that the student
has worked on. Assignments that have never been accessed by the student are not included in this total.
Avg High Score % - Divides the summation of the highest score for each assignment by the number of assignments.
Lessons Mastered - Displays the summation of all the assignments that have been mastered in the assignment list.
% Mastered - Displays the 'Lessons Mastered' column divided by the number of assignments, multiplied by 100.
Avg Tries - Displays the average number of student actions for each assignment in the assignment list. Only includes activities that the student has worked on.
Time - Displays the total time spent on all assignments in the assignment list.

ASSIGNMENT MANAGEMENT REPORTS
79
Report Information - Screen 2
Information on the report includes:
Assignment - Displays the name of the assignment.
Note: the first line will display the List Average. Mastered - Displays 'Yes' if the assignment has been
mastered and displays 'No' if it's not mastered. Tries - Displays the number of times the student
accessed the assignment. Avg Score % - This column divides the summation of
all the usage scores by the number of usage records for the assignment. High Score % - Displays the student’s highest score for the assignment as a percentage. Study Time - Displays the total time spent in the 'Study' mode for the assignment. Note:
some lessons do not have Study activities, such as LLS assignments. Test Time - Displays the total time spent in assessment activities (Calculation: Total Time -
Study Time - Essay Time). Total Time- Displays the total time spent on all assignments in the assignment list.
Report Generation Process
1. Choose this report from the list shown in the Report Wizard accessed through the Assignment Management Window.
2. Select the school. 3. Select the class. 4. Select the beginning and ending dates by clicking on the appropriate date button,
defining the period of time the report is to cover. 5. Choose the file format for the report:
.HTML - Best viewed and printed using your Web browser.
.CSV - Comma delimited data, best for importing data into spreadsheets and databases.
6. Click on the appropriate button, either .HTML or .CSV. 7. Wait, it may take a few minutes for the report to be generated. Please take no action as
long as the Generating Report message is onscreen. 8. .HTML only: Your Web browser will open and the report will appear. Watch for hotlinks in
the report. On the first screen, click on a student’s name and a more detailed report screen opens. On the second screen, you can display a pie chart.
This level includes an optional pie chart.
ASSIGNMENT MANAGEMENT REPORTS
80
9. .CSV only: When the File Saved dialog opens, you may want to write down the file name and path. Then your data will open in whatever application normally handles .CSV files (typically Excel).
10. In both your browser and Excel, you can view, print, and save your report.
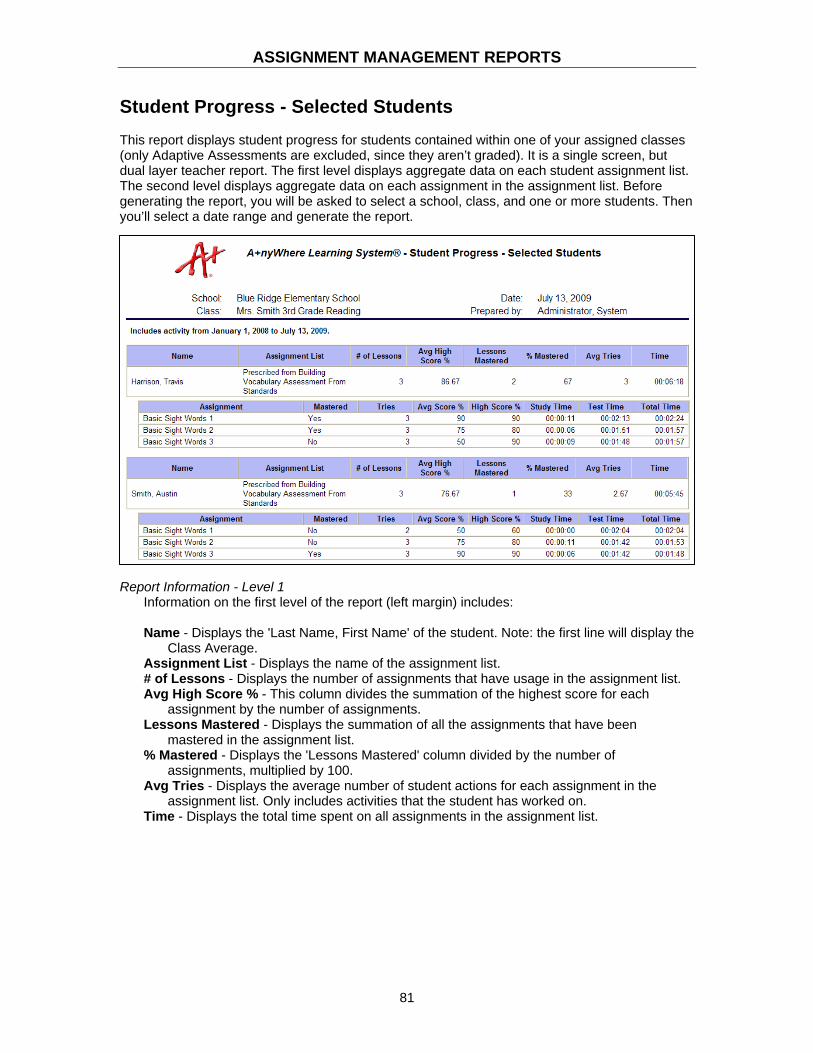
ASSIGNMENT MANAGEMENT REPORTS
81
Student Progress - Selected Students
This report displays student progress for students contained within one of your assigned classes (only Adaptive Assessments are excluded, since they aren’t graded). It is a single screen, but dual layer teacher report. The first level displays aggregate data on each student assignment list. The second level displays aggregate data on each assignment in the assignment list. Before generating the report, you will be asked to select a school, class, and one or more students. Then you’ll select a date range and generate the report.
Report Information - Level 1
Information on the first level of the report (left margin) includes: Name - Displays the 'Last Name, First Name' of the student. Note: the first line will display the
Class Average. Assignment List - Displays the name of the assignment list. # of Lessons - Displays the number of assignments that have usage in the assignment list. Avg High Score % - This column divides the summation of the highest score for each
assignment by the number of assignments. Lessons Mastered - Displays the summation of all the assignments that have been
mastered in the assignment list. % Mastered - Displays the 'Lessons Mastered' column divided by the number of
assignments, multiplied by 100. Avg Tries - Displays the average number of student actions for each assignment in the
assignment list. Only includes activities that the student has worked on. Time - Displays the total time spent on all assignments in the assignment list.

ASSIGNMENT MANAGEMENT REPORTS
82
Report Information - Level 2 Information on the second level of the report (indented) includes: Assignment - Displays the name of the assignment. Mastered - Displays 'Yes' if the assignment has been mastered and displays 'No' if it's not
mastered. Tries - Displays the number of times the student accessed the assignment. Avg Score % - This column divides the summation of all of the student’s scores (as a
percentage) by the number of usage records for the assignment. High Score % - Displays the student’s highest score for the assignment as a percentage. Study Time - Displays the total time spent in the 'Study' mode for the assignment. Note:
some lessons do not have Study activities, such as LLS assignments. Test Time - Displays the total time spent in assessment activities (Calculation: Total Time -
Study Time - Essay Time). Total Time- Displays the total time spent on all assignments in the assignment list.
Report Generation Process
1. Choose this report from the list shown in the Report Wizard accessed through the Assignment Management Window.
2. Select the school. 3. Select the class. 4. Select one or more students to include in the report. 5. Select the beginning and ending dates by clicking on the appropriate date button,
defining the period of time the report is to cover. 6. Choose the file format for the report:
.HTML - Best viewed and printed using your Web browser.
.CSV - Comma delimited data, best for importing data into spreadsheets and databases.
7. Click on the appropriate button, either .HTML or .CSV. 8. Wait, it may take a few minutes for the report to be generated. Please take no action as
long as the Generating Report message is onscreen. 9. .HTML only: Your Web browser will open and the report will appear.
10. .CSV only: When the File Saved dialog opens, you may want to write down the file name and path. Then your data will open in whatever application normally handles .CSV files (typically Excel).
11. In both your browser and Excel, you can view, print, and save your report.

ASSIGNMENT MANAGEMENT REPORTS
83
Student Progress Report by Date Range** This report displays all student scores of mastery tests, teacher assigned scores, and “other work” in the selected class within the specified date range. This report does not include any assignments “marked as done” or set as inactive. Report Information
Information displayed on this report includes: Assignment List - the name of the assignment list on which the assignment belongs. Date - the date the assignment was accessed by the student. Program - if an “other computer” assignment, the name of the program used for the
assignment. Lesson - the name of the assignment. Score - the score the student received for the assignment. Time – the total time spent working with the assignment. Tries - the number of times the student accessed the assignment. Number Lessons - the total number of lessons on the report. Average Score - the average score the student received on the assignments. This number is
calculated by dividing the total scores by the total number of assignments. Total Time - the total amount of time the student spent in all assignments listed. Average Time per Lesson - the average amount of time the student spent in each
assignment.

ASSIGNMENT MANAGEMENT REPORTS
84
Report Generation Process 1. Choose this report from the list shown in the Report Wizard accessed through the
Assignment Management Window. 2. Select the school to which the student belongs. 3. Select the class in which the student is enrolled. 4. Select the desired student. 5. Select the desired date range. 6. If desired, select multiple users. 7. Select the desired header and footer information.

ASSIGNMENT MANAGEMENT REPORTS
85
Student Standard Attainment**
This report displays the selected state standards that have been “attained”, or mastered, by the selected student via assessment testing within the selected class. This report is presorted alphabetically by the state standard and then the ALS Skill. You can reorder this information simply by clicking in one of the column headers on the report data screen prior to getting a print preview. Report Information
Information displayed on this report includes the state standard the student mastered, the related ALS Skills tested within that state standard, the date the student was tested on the standard/skill combination, and whether or not that standard/skill was mastered by the student. Report Generation Process
1. Choose this report from the list shown in the Report Wizard accessed through the Assignment Management Window.
2. Select the school to which the student belongs. 3. Select the class in which the student is enrolled. 4. Select the desired student. 5. Select the objective set against which to measure standard attainment. 6. Select the desired header and footer information.

ASSIGNMENT MANAGEMENT REPORTS
86
Total Usage Time - by Student This single layer report displays the total time spent on activities within a class for each student. Before generating the report, you will be asked to select the school, class, and date range you would like covered in the report. Report Information
Information displayed on this report includes: Student - Displays the 'Last Name, First Name' of the student. Lesson Time - Displays the summation of all usage time for the student (only Adaptive
Assessments are not included in the total). Assessment Time - Displays the summation of all Adaptive Assessment usage time for the
student. Total Time - Displays the summation of all usage time for the student.
Report Generation Process
1. Choose this report from the list shown in the Report Wizard accessed through the Assignment Management Window.
2. Select the school. 3. Select the class. 4. Select the beginning and ending dates by clicking on the appropriate date button,
defining the period of time the report is to cover. 5. Choose the file format you'd like the report to be saved as:
.HTML - Best viewed and printed using your Web browser.
.CSV - Comma delimited data, best for importing data into spreadsheets and databases.
6. Click on the appropriate button, either .HTML or .CSV. 7. Wait, it may take a few minutes for the report to be generated. Please take no action as
long as the Generating Report message is onscreen. 8. .HTML only: Your Web browser will open and the report will appear. 9. .CSV only: When the File Saved dialog opens, you may want to write down the file name
and path. Then your data will open in whatever application normally handles .CSV files (typically Excel).
10. In both your browser and Excel, you can view, print, and save your report.

CURRICULUM AUTHORING REPORTS
87
A+ District Driven Assessments A+ District Driven Assessment activities are unique in that they can be assigned to multiple classes, even grades, and can supersede any other A+LS assignment. They are typically used to reveal where students are with relationship to state standards and state mandated tests. The A+ District Driven Assessments report lists each student's results (both number correct and percent correct) for every standard covered by the assessment.
Report Information - Level 1
Information on the first level of the report (left margin) includes: School Name - Name of the selected school.
Report Information - Level 2
Information on the second level of the report (first indent) includes: Grade - Grade level. Standards Mastered - This column is calculated by taking the number of standards whose
'Students Mastered' column is 80% or higher, divided by the total number of standards tested, multiplied by 100.
Report Information - Level 3
Information on the third level of the report (second indent) includes: Standard Subset - The Standard Subset selected at the time the test was created. Curriculum Area - The Curriculum Area selected at the time the test was created. Curriculum Level - The Curriculum Level selected at the time the test was created. Standard ID - The identification number for the standard. This code is assigned by the state
or governing body responsible for the standard. Standard Name - The standards selected at the time the test was created.

CURRICULUM AUTHORING REPORTS
88
Report Information - Level 3 (continued) Student Mastered - Percent of the students that have mastered the standard. Only students
who have taken the test are included in the calculation. Report Information - Level 4
Information on the fourth level of the report (third indent) includes: Full Name - The student’s full name. Only students who have taken the test are included. # Correct - Indicates the number correct and the total number of questions asked, those
specifically linked with the standard listed in Level 3. Percent Correct - Percentage based on the # Correct information. Considered Mastered - A green checkmark appears if the student mastered this standard.
A red X appears if the student was unsuccessful. Report Generation Process
1. Choose this report from the list shown in the Report Wizard accessed through the Curriculum Authoring Window.
2. Set Select Your A+ District Driven Assessment to the test you want the report to cover. 3. Choose the file format you'd like the report to be saved as:
.HTML - Best viewed using your Web browser.
.CSV - Comma delimited data, best for importing data into spreadsheets and databases.
4. Click on the appropriate button, either .HTML or .CSV. 5. Wait, it may take a few minutes for the report to be generated. Please take no action as
long as the Saving Data message is onscreen. 6. When the "File saved" dialog opens, write down the file name and path. 7. If you selected the .HTML option, your Web browser will open and the report will appear,
ready to be printed. 8. If you selected the .CSV option, the Report Wizard will open whatever application is set
to handle .CSV files (typically Excel). 9. In both your browser and Excel, you can view, print, and save your report.

CURRICULUM AUTHORING REPORTS
89
All Titles Not Owned** This report lists curriculum titles that are available from the American Education Corporation, but are not yet installed on your system. Report Information
Report Generation Process
1. Choose this report from the list shown in the Report Wizard accessed through the Curriculum Authoring Window.
2. Format header and footer information.
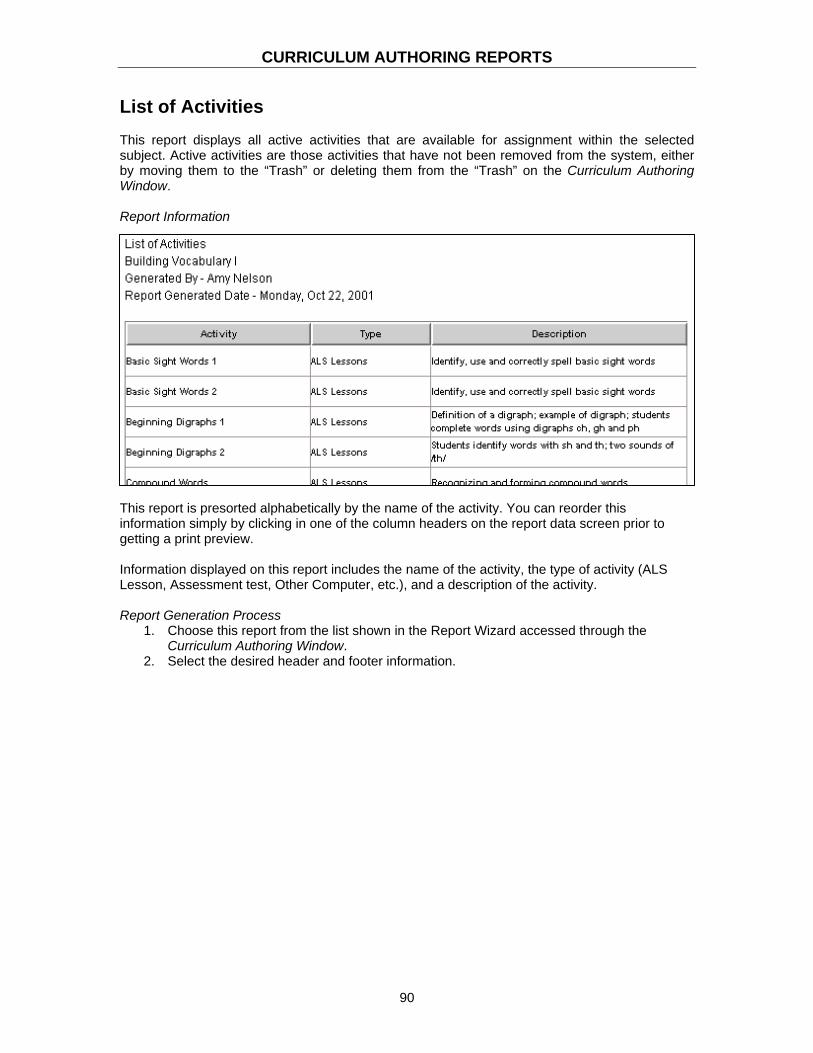
CURRICULUM AUTHORING REPORTS
90
List of Activities
This report displays all active activities that are available for assignment within the selected subject. Active activities are those activities that have not been removed from the system, either by moving them to the “Trash” or deleting them from the “Trash” on the Curriculum Authoring Window. Report Information
This report is presorted alphabetically by the name of the activity. You can reorder this information simply by clicking in one of the column headers on the report data screen prior to getting a print preview. Information displayed on this report includes the name of the activity, the type of activity (ALS Lesson, Assessment test, Other Computer, etc.), and a description of the activity. Report Generation Process
1. Choose this report from the list shown in the Report Wizard accessed through the Curriculum Authoring Window.
2. Select the desired header and footer information.

CURRICULUM AUTHORING REPORTS
91
List of Subjects
This report displays all active subjects within the A+LS system. Active subjects are those subjects that have not been removed from the system, either by moving them to the “Trash” or deleting them from the “Trash” on the Curriculum Authoring Window. Report Information
This report is presorted alphabetically by the name of the subject. You can reorder this information simply by clicking in one of the column headers on the report data screen prior to getting a print preview. Information displayed on this report includes the name of the subject and a description of the subject. Report Generation Process
1. Choose this report from the list shown in the Report Wizard accessed through the Curriculum Authoring Window.
2. Select the desired header and footer information.
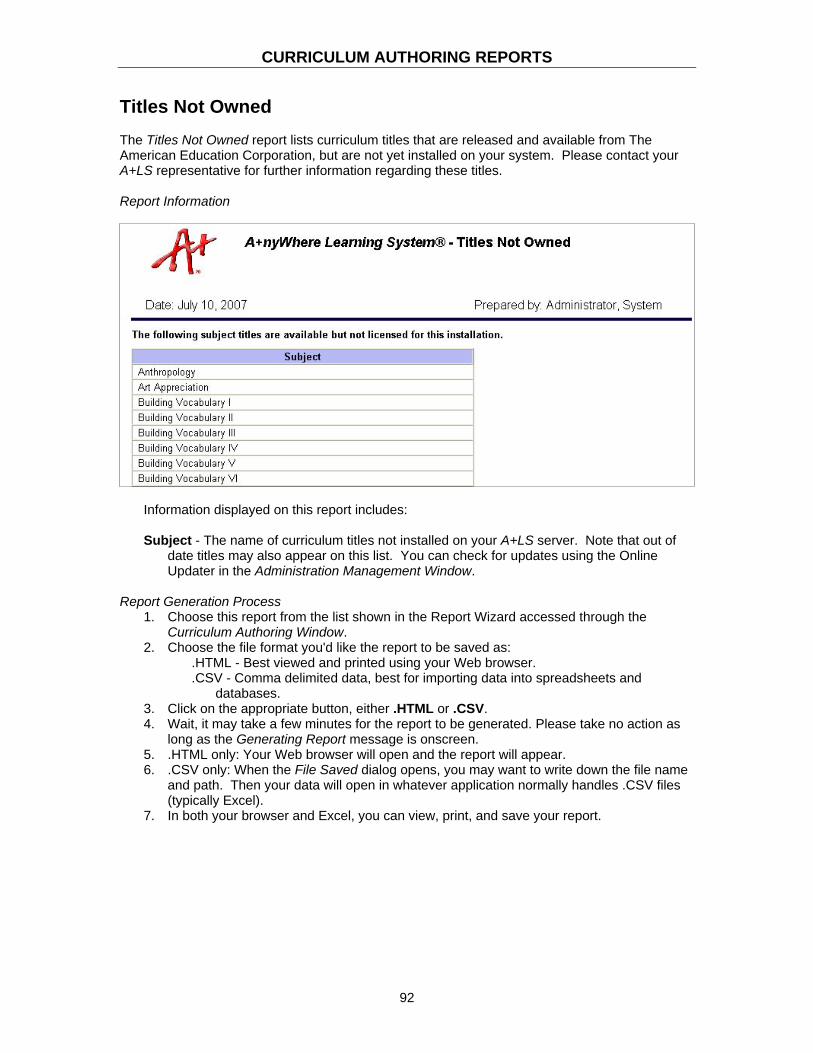
CURRICULUM AUTHORING REPORTS
92
Titles Not Owned
The Titles Not Owned report lists curriculum titles that are released and available from The American Education Corporation, but are not yet installed on your system. Please contact your A+LS representative for further information regarding these titles. Report Information
Information displayed on this report includes: Subject - The name of curriculum titles not installed on your A+LS server. Note that out of
date titles may also appear on this list. You can check for updates using the Online Updater in the Administration Management Window.
Report Generation Process
1. Choose this report from the list shown in the Report Wizard accessed through the Curriculum Authoring Window.
2. Choose the file format you'd like the report to be saved as: .HTML - Best viewed and printed using your Web browser. .CSV - Comma delimited data, best for importing data into spreadsheets and
databases. 3. Click on the appropriate button, either .HTML or .CSV. 4. Wait, it may take a few minutes for the report to be generated. Please take no action as
long as the Generating Report message is onscreen. 5. .HTML only: Your Web browser will open and the report will appear. 6. .CSV only: When the File Saved dialog opens, you may want to write down the file name
and path. Then your data will open in whatever application normally handles .CSV files (typically Excel).
7. In both your browser and Excel, you can view, print, and save your report.

STANDARDS MANAGEMENT REPORTS
93
Activity Alignment
This report lists all of the ALS Skills related to a selected standard set and curriculum area. WARNING: This report may take several minutes to generate, since it lists every A+LS activity that is aligned to the selected standard. Report Information
Information displayed on this report includes: Level - Displays the grade level. {Objective Name} - Displays the name of the objective. This column header’s name will vary
depending on the objective set you select. Each state standard set has its own naming conventions for objectives, skills, etc.
Activities Aligned - Lists the ALS Lesson activities that are aligned to the objective by {title of subject module} - {name of ALS Lesson activity}.
Report Generation Process
1. Choose this report from the list shown in the Report Wizard accessed through the Standards Management Window.
2. Select the standard set. 3. Select the curriculum area. 4. Choose the file format you'd like the report to be saved as:
.HTML - Best viewed and printed using your Web browser.
.CSV - Comma delimited data, best for importing data into spreadsheets and databases.
5. Click on the appropriate button, either .HTML or .CSV. 6. Wait, it may take a few minutes for the report to be generated. Please take no action as
long as the Generating Report message is onscreen. 7. .HTML only: Your Web browser will open and the report will appear.

STANDARDS MANAGEMENT REPORTS
94
8. .CSV only: When the File Saved dialog opens, you may want to write down the file name and path. Then your data will open in whatever application normally handles .CSV files (typically Excel).
9. In both your browser and Excel, you can view, print, and save your report.
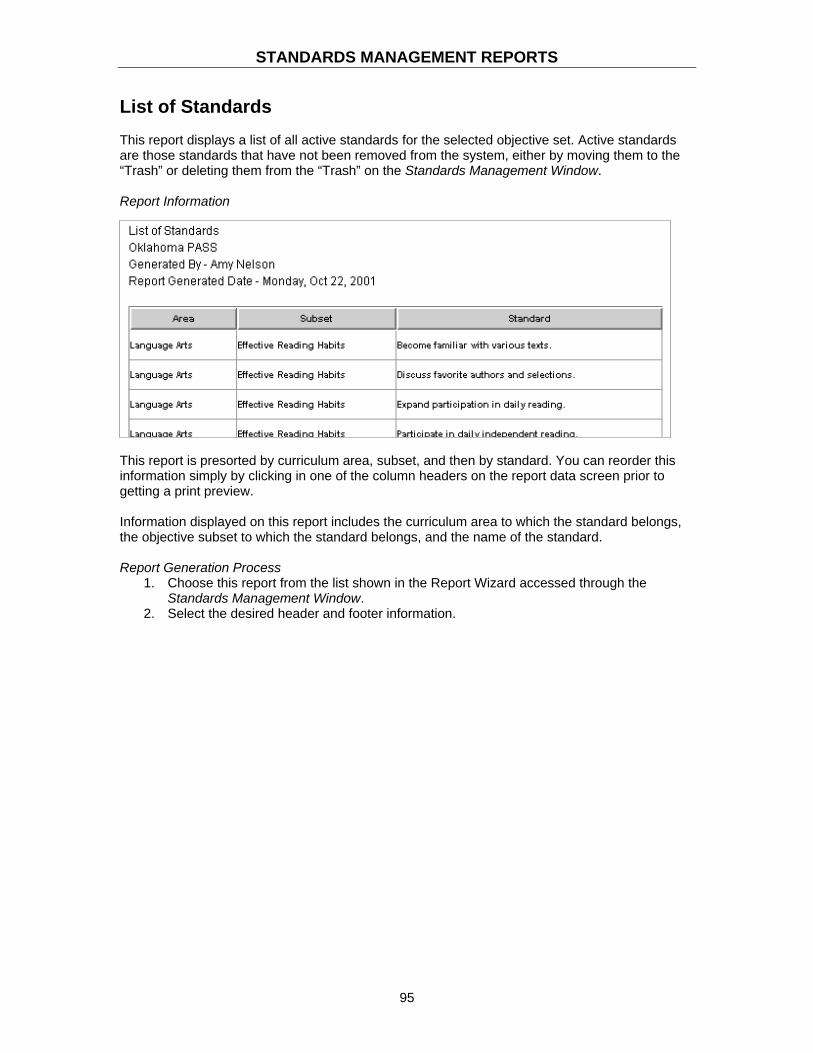
STANDARDS MANAGEMENT REPORTS
95
List of Standards
This report displays a list of all active standards for the selected objective set. Active standards are those standards that have not been removed from the system, either by moving them to the “Trash” or deleting them from the “Trash” on the Standards Management Window. Report Information
This report is presorted by curriculum area, subset, and then by standard. You can reorder this information simply by clicking in one of the column headers on the report data screen prior to getting a print preview. Information displayed on this report includes the curriculum area to which the standard belongs, the objective subset to which the standard belongs, and the name of the standard. Report Generation Process
1. Choose this report from the list shown in the Report Wizard accessed through the Standards Management Window.
2. Select the desired header and footer information.

STANDARDS MANAGEMENT REPORTS
96
Standards-Activity Alignment** This report displays the alignment of user-selected state standards to activities in the system. Report Information
Information displayed on this report includes: Standard Subset - the standard subset to which the activity belongs. Level - the curriculum level to which the standard relates. ID - the ID given to the standard, usually by the state. Standard - the actual standard being reported. Subject - the A+LS subject that contains the activity. Activity - the activity, usually an ALS Lesson that relates to the standard.
Report Generation Process
1. Choose this report from the list shown in the Report Wizard accessed through the Standards Management Window.
2. Select a Standard to report. 3. Choose a Curriculum Area. 4. Format header and footer information.

SKILLS MANAGEMENT REPORTS
97
List of ALS Skills
This report displays a list of all active ALS Skills and their order within their associated strand. Active skills are those skills that have not been removed from the system, either by moving them to the “Trash” or deleting them from the “Trash” on the Skills Management Window. Report Information
This report is presorted by strand order, grade, and then by skill. You can reorder this information simply by clicking in one of the column headers on the report data screen prior to getting a print preview. Information displayed on this report includes the grade level to which the ALS Skill has been associated, the name of the ALS Skill, and the order in which it belongs in its associated strand. Report Generation Process
1. Choose this report from the list shown in the Report Wizard accessed through the Skills Management Window.
2. Select the desired Curriculum Area. 3. Select the desired Strand. 4. Select the desired header and footer information.

SKILLS MANAGEMENT REPORTS
98
List of Strands
This report displays a list of active strands associated with the selected curriculum area. Active strands are those strands that have not been removed from the system, either by moving them to the “Trash” or deleting them from the “Trash” on the Skills Management Window. Information displayed on this report includes only the name of the strand. Report Information
Report Generation Process
1. Choose this report from the list shown in the Report Wizard accessed through the Skills Management Window.
2. Select the desired Curriculum Area. 3. Select the desired header and footer information.

ADMINISTRATION MANAGEMENT REPORTS
99
Activity Usage - by Class
The report displays class and student usage on an activity (only Adaptive Assessments are excluded, since they are not graded). This is a drill-down administrator report that contains two levels. The first screen displays aggregate data on each Class. The second screen displays aggregate data on each student. Before generating the report, you will be asked to select classes, the activity to focus on, and a date range for the report.
Report Information - Screen 1
Information displayed on this report includes: Class - Displays the name of the class. Note: the first line
displays the Average of Classes Selected. Avg Tries - Displays the average number of times
students have accessed the selected activity. Avg Score % - This column divides the summation of all
the activity’s scores by the number of usage records for the assignment.
High Score % - Displays the student’s highest score for the selected activity as a percentage.
Study Time - Displays the total time spent in the 'Study' mode for the class. Note: some assignments do not have Study activities, such as LLS assignments and Course Assessments.
Test Time - Displays the total time spent in assessment activities (Calculation: Total Time – Study Time – Essay Time).
Total Time - Displays the total time spent on the assignment for the class.
This level includes an optional bar chart.
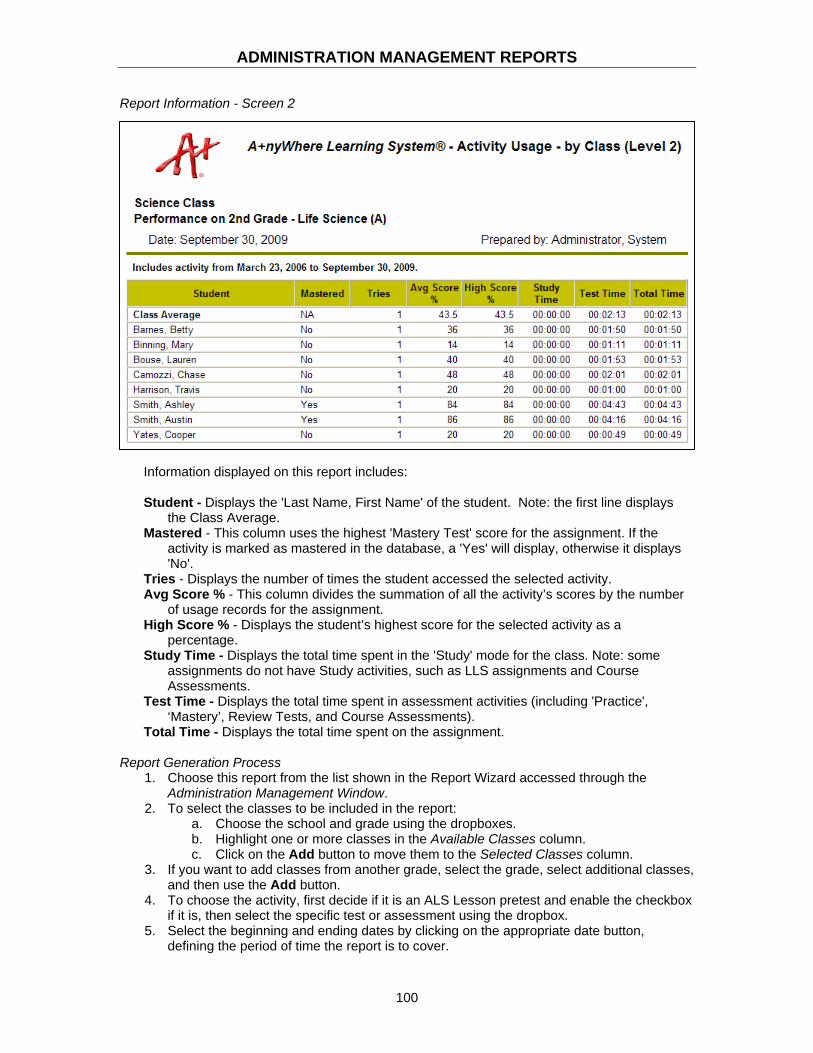
ADMINISTRATION MANAGEMENT REPORTS
100
Report Information - Screen 2
Information displayed on this report includes:
Student - Displays the 'Last Name, First Name' of the student. Note: the first line displays
the Class Average. Mastered - This column uses the highest 'Mastery Test' score for the assignment. If the
activity is marked as mastered in the database, a 'Yes' will display, otherwise it displays 'No'.
Tries - Displays the number of times the student accessed the selected activity. Avg Score % - This column divides the summation of all the activity’s scores by the number
of usage records for the assignment. High Score % - Displays the student’s highest score for the selected activity as a
percentage. Study Time - Displays the total time spent in the 'Study' mode for the class. Note: some
assignments do not have Study activities, such as LLS assignments and Course Assessments.
Test Time - Displays the total time spent in assessment activities (including 'Practice', ‘Mastery’, Review Tests, and Course Assessments).
Total Time - Displays the total time spent on the assignment.
Report Generation Process 1. Choose this report from the list shown in the Report Wizard accessed through the
Administration Management Window. 2. To select the classes to be included in the report:
a. Choose the school and grade using the dropboxes. b. Highlight one or more classes in the Available Classes column. c. Click on the Add button to move them to the Selected Classes column.
3. If you want to add classes from another grade, select the grade, select additional classes, and then use the Add button.
4. To choose the activity, first decide if it is an ALS Lesson pretest and enable the checkbox if it is, then select the specific test or assessment using the dropbox.
5. Select the beginning and ending dates by clicking on the appropriate date button, defining the period of time the report is to cover.

ADMINISTRATION MANAGEMENT REPORTS
101
6. Choose the file format you'd like the report to be saved as: .HTML - Best viewed and printed using your Web browser. .CSV - Comma delimited data, best for importing data into spreadsheets and
databases. 7. Click on the appropriate button, either .HTML or .CSV. 8. Wait, it may take a few minutes for the report to be generated. Please take no action as
long as the Generating Report message is onscreen. 9. .HTML only: Your Web browser will open and the report will appear. Watch for hotlinks in
the report. On the first browser screen, click on a student’s name and a more detailed report screen opens. On the first browser screen, you can select View Chart.
10. .CSV only: When the File Saved dialog opens, you may want to write down the file name and path. Then your data will open in whatever application normally handles .CSV files (typically Excel).
11. In both your browser and Excel, you can view, print, and save your report.

ADMINISTRATION MANAGEMENT REPORTS
102
Activity Usage - Selected Students
This report displays usage data on activities (only Adaptive Assessments are excluded, since they are not graded). Before generating the report, you will be asked to select a student(s), and select a date range.
Report Information
Information displayed on this report includes: Student - Displays the 'Last Name, First Name' of the student. Note: the first line in each
section is Average of Selected Students. Mastered - This column uses the highest 'Mastery Test' score for the assignment. If the score
is greater than or equal to 80, it displays 'Yes', otherwise it displays 'No'. Avg Tries - Displays the average number of times students have accessed the selected
activity. Avg Score % - This column divides the summation of all the activity’s scores by the number
of usage records for the assignment. High Score % - Displays the student’s highest score for the selected activity as a
percentage. Study Time - Displays the total time spent in the 'Study' mode for the assignment. Note:
some lessons do not have Study activities, such as LLS assignments. Test Time - Displays the total time spent in assessment activities (Calculation: Total Time –
Study Time – Essay Time). Total Time - Displays the total time spent on the assignment.
Report Generation Process
1. Choose this report from the list shown in the Report Wizard accessed through the Administration Management Window.
2. To select the students to be included in the report: a. Choose the school and grade using the dropboxes. b. Highlight one or more students in the Available Users column. c. Click on the Add button to move them to the Selected Users column.
3. If you want to add students from another grade, select the grade then use the Add button to select additional students.

ADMINISTRATION MANAGEMENT REPORTS
103
4. Select the beginning and ending dates by clicking on the appropriate date button, defining the period of time the report is to cover.
5. Choose the file format you'd like the report to be saved as: .HTML - Best viewed and printed using your Web browser. .CSV - Comma delimited data, best for importing data into spreadsheets and
databases. 6. Click on the appropriate button, either .HTML or .CSV. 7. Wait, it may take a few minutes for the report to be generated. Please take no action as
long as the Generating Report message is onscreen. 8. .HTML only: Your Web browser will open and the report will appear. 9. .CSV only: When the File Saved dialog opens, you may want to write down the file name
and path. Then your data will open in whatever application normally handles .CSV files (typically Excel).
10. In both your browser and Excel, you can view, print, and save your report.
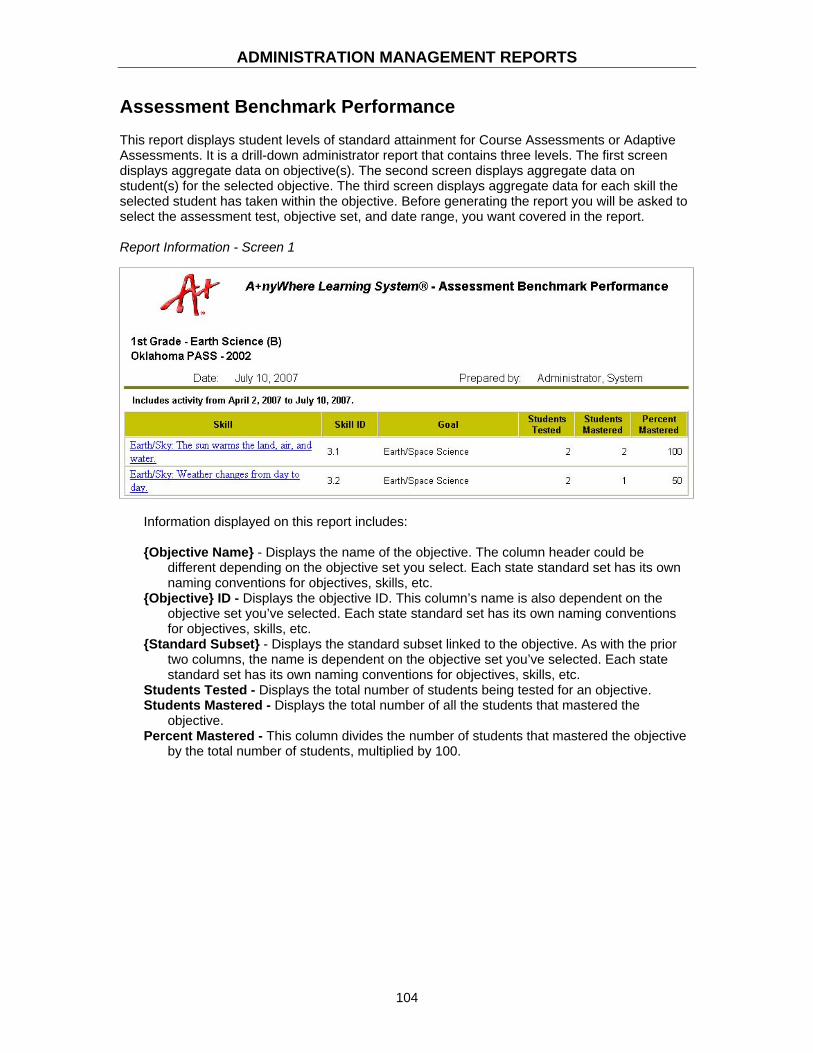
ADMINISTRATION MANAGEMENT REPORTS
104
Assessment Benchmark Performance
This report displays student levels of standard attainment for Course Assessments or Adaptive Assessments. It is a drill-down administrator report that contains three levels. The first screen displays aggregate data on objective(s). The second screen displays aggregate data on student(s) for the selected objective. The third screen displays aggregate data for each skill the selected student has taken within the objective. Before generating the report you will be asked to select the assessment test, objective set, and date range, you want covered in the report. Report Information - Screen 1
Information displayed on this report includes: {Objective Name} - Displays the name of the objective. The column header could be
different depending on the objective set you select. Each state standard set has its own naming conventions for objectives, skills, etc.
{Objective} ID - Displays the objective ID. This column’s name is also dependent on the objective set you’ve selected. Each state standard set has its own naming conventions for objectives, skills, etc.
{Standard Subset} - Displays the standard subset linked to the objective. As with the prior two columns, the name is dependent on the objective set you’ve selected. Each state standard set has its own naming conventions for objectives, skills, etc.
Students Tested - Displays the total number of students being tested for an objective. Students Mastered - Displays the total number of all the students that mastered the
objective. Percent Mastered - This column divides the number of students that mastered the objective
by the total number of students, multiplied by 100.

ADMINISTRATION MANAGEMENT REPORTS
105
Report Information - Screen 2
Information displayed on this report includes:
Student - Displays the 'Last Name, First Name' of the
student. # Questions - Displays the total number of questions
the student was asked for the objective. # Correct - Displays the total number of questions the
student got correct for the objective. Mastered - This column displays 'Yes' if the Percent Mastered column is 80 or greater,
otherwise it displays 'No'. The Percent Mastered column gets calculated by dividing the number of skills mastered by the total number of skills, multiplied by 100.
Report Information - Screen 3
Information displayed on this report includes: ALS Skill - Displays the name of the skill. Date - Displays the date (MM/DD/YYYY) the skill was completed. # Questions - Displays the total number of questions the student was asked for the skill. # Correct - Displays the total number of questions the student got correct for the skill. Mastered - This column displays 'Yes' if the Percent Mastered column is 80 or greater,
otherwise it displays 'No'. The Percent Mastered column gets calculated by dividing the number of questions correct by the total number of questions, multiplied by 100.
This level includes an optional bar chart.
ADMINISTRATION MANAGEMENT REPORTS
106
Report Generation Process 1. Choose this report from the list shown in the Report Wizard accessed through the
Administration Management Window. 2. To select the assessment test:
a. First select either Course Assessment or Adaptive Assessment. b. Then use the dropbox to pick the specific assessment.
3. Select the standard set so the report can cross reference the ALS Skills covered by the assessment with your preferred standard.
4. Select the beginning and ending dates by clicking on the appropriate date button, defining the period of time the report is to cover.
5. Choose the file format you'd like the report to be saved as: .HTML - Best viewed and printed using your Web browser. .CSV - Comma delimited data, best for importing data into spreadsheets and
databases. 6. Click on the appropriate button, either .HTML or .CSV. 7. Wait, it may take a few minutes for the report to be generated. Please take no action as
long as the Generating Report message is onscreen. 8. .HTML only: Your Web browser will open and the report will appear. Watch for hotlinks in
the report. On the first screen, click on a skill and a more detailed report screen opens. On the second screen, you can click on a student’s name to see details of his or her performance. You can also use the View Chart link on the second screen.
9. .CSV only: When the File Saved dialog opens, you may want to write down the file name and path. Then your data will open in whatever application normally handles .CSV files (typically Excel).
10. In both your browser and Excel, you can view, print, and save your report.
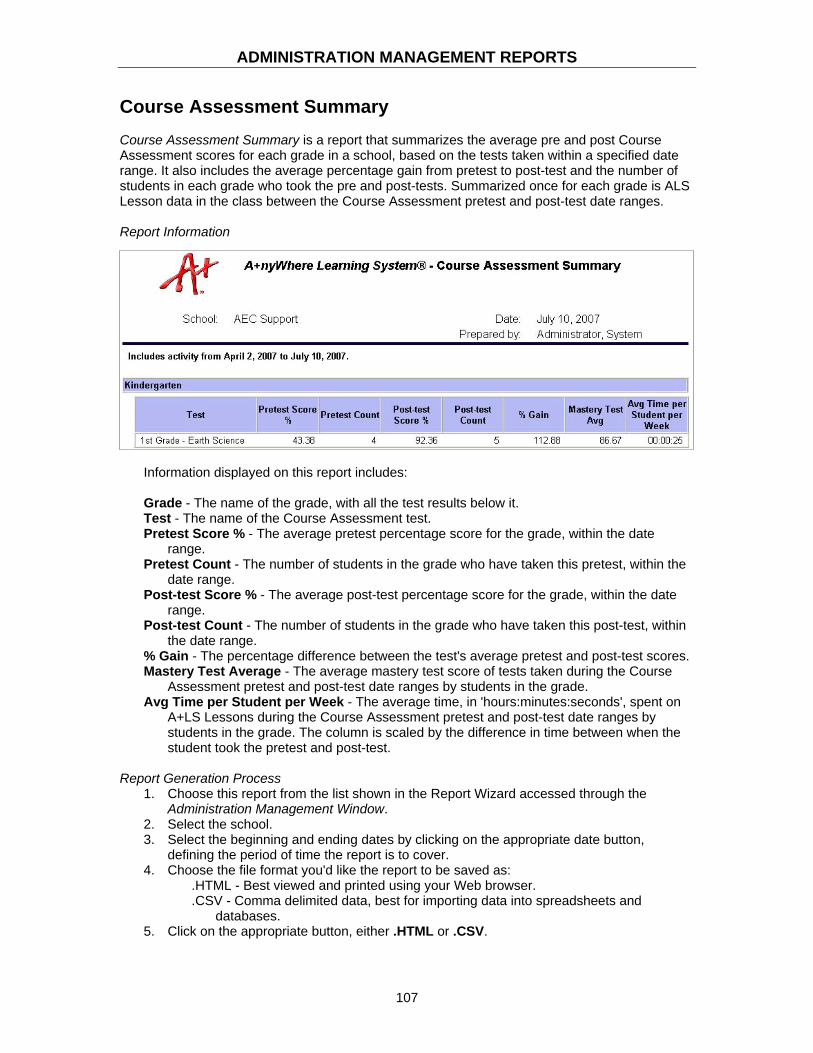
ADMINISTRATION MANAGEMENT REPORTS
107
Course Assessment Summary
Course Assessment Summary is a report that summarizes the average pre and post Course Assessment scores for each grade in a school, based on the tests taken within a specified date range. It also includes the average percentage gain from pretest to post-test and the number of students in each grade who took the pre and post-tests. Summarized once for each grade is ALS Lesson data in the class between the Course Assessment pretest and post-test date ranges. Report Information
Information displayed on this report includes: Grade - The name of the grade, with all the test results below it. Test - The name of the Course Assessment test. Pretest Score % - The average pretest percentage score for the grade, within the date
range. Pretest Count - The number of students in the grade who have taken this pretest, within the
date range. Post-test Score % - The average post-test percentage score for the grade, within the date
range. Post-test Count - The number of students in the grade who have taken this post-test, within
the date range. % Gain - The percentage difference between the test's average pretest and post-test scores. Mastery Test Average - The average mastery test score of tests taken during the Course
Assessment pretest and post-test date ranges by students in the grade. Avg Time per Student per Week - The average time, in 'hours:minutes:seconds', spent on
A+LS Lessons during the Course Assessment pretest and post-test date ranges by students in the grade. The column is scaled by the difference in time between when the student took the pretest and post-test.
Report Generation Process
1. Choose this report from the list shown in the Report Wizard accessed through the Administration Management Window.
2. Select the school. 3. Select the beginning and ending dates by clicking on the appropriate date button,
defining the period of time the report is to cover. 4. Choose the file format you'd like the report to be saved as:
.HTML - Best viewed and printed using your Web browser.
.CSV - Comma delimited data, best for importing data into spreadsheets and databases.
5. Click on the appropriate button, either .HTML or .CSV.

ADMINISTRATION MANAGEMENT REPORTS
108
6. Wait, it may take a few minutes for the report to be generated. Please take no action as long as the Generating Report message is onscreen.
7. .HTML only: Your Web browser will open and the report will appear. 8. .CSV only: When the File Saved dialog opens, you may want to write down the file name
and path. Then your data will open in whatever application normally handles .CSV files (typically Excel).
9. In both your browser and Excel, you can view, print, and save your report.

ADMINISTRATION MANAGEMENT REPORTS
109
Course Assessment Summary** Course Assessment Summary is a report that summarizes the average pre and post Course Assessment scores for each grade in a school of tests taken within a specified date range. It also includes the average percentage gain from pretest to post-test and the number of students in each grade who took the pre and post-tests during the date range. Summarized once for each grade is ALS Lesson data in the class for the date range. Schoolwide averages and totals are summarized at the bottom of the report. Report Information
Information displayed on this report includes: Grade - The name of the grade being summarized on this row. Test - The name of the Course Assessment test. Pretest % Score - The average pretest percentage score for the grade within the date range. Pretest Count - The number of students in the grade who have taken this pretest within the
date range. Post-test % Score - The average post-test percentage score for the grade within the date
range. Post-test Count - The number of students in the grade who have taken this post-test within
the date range. % Gain - The percentage difference between the grade's average pretest and post-test
scores. Mastery Test Average - The average mastery test score of tests taken turing the date range
by students in the grade. Avg. Time per Week per Student - The average time, in hours, spent on A+LS Lessons
during the date range by students in the grade. Report Generation Process
1. Choose this report from the list shown in the Report Wizard accessed through the Administration Management Window.
2. Select a school. 3. Select a date range to report within. 4. Format header and footer information.

ADMINISTRATION MANAGEMENT REPORTS
110
Grade Level Improvement
This is an administrative report with one level. This report will show Course Assessment pretest and post-test scores and certain measures of student use of the intervening prescriptions. The Course Assessment scores will be reported as grade level attainment (and tenths thereof). Report Information
Information displayed on this report includes: Name – Displays the ‘Last Name, First Name’ of the student. Test - The name of a set of A+LS Course Assessment tests, including both a pretest and a
post-test for a subject area and grade level. For example, a line labeled "Mathematics VI Assessment" will include both "Mathematics VI Assessment (A)," the pretest, and "Mathematics VI Assessment (B)," the post-test.
Pretest Skill Level - Calculated by dividing the number of skills mastered by the number of skills included on the pretest. The resulting percentage, rounded to the nearest tenth, will be added to the grade level of the test. If all skills are mastered (the denominator and numerator are the same), the pretest level will be shown as the next highest level, at the ".0" level.
ADMINISTRATION MANAGEMENT REPORTS
111
For example, if there are 21 skills tested on "Mathematics VI Assessment (A)" and the student demonstrates mastery of 7 of those skills, the Pretest Level will be reported as 6.3. The "6" is the grade level of the test, the "3" is 7 ÷ 21, rounded. If the student mastered all of the skills, the pretest level will be reported as "7.0".
Post-test Skill Level - Same as the Pretest Skill Level, but calculated on post-test results. Gain - Post-test Skill Level minus the Pretest Skill Level. This can never be greater than 1. # of Lessons - in normal usage, A+LS Course Assessments will prescribe lessons to teach
skills that are not mastered on the pretest. Included lessons are defined as those lessons assigned to the student that are associated in the A+LS database with skills tested on the pretest. Lessons can also be prescribed directly by the teacher or by other (non-Course) assessment tests; these will not be reported unless they are associated with a skill that was included on the pretest. This field shows the number of included lessons.
Avg Lesson Score % - The average score achieved on the Mastery test on included lessons between the dates of the pretest and the post-test. The average will be calculated by dividing the sum of all the highest scores on included lessons by the number of lessons.
Lessons Mastered – The Lessons Mastered will be calculated by taking the sum of all lessons that have achieved the mastery requirement on included lessons between the dates of the pretest and post-test.
Study Time - The aggregate amount of time the student has spent in the Study portion of included lessons between the date of the pretest and the date of the post-test, in whole minutes.
Practice Time - The aggregate amount of time the student has spent in the Practice portion of included lessons between the date of the pretest and the date of the post-test, in whole minutes.
Mastery Time - The aggregate amount of time the student has spent in the Mastery portion of included lessons between the date of the pretest and the date of the post-test, in whole minutes.
Essay Time - The aggregate amount of time the student has spent in the Essay portion of included lessons between the date of the pretest and the date of the post-test, in whole minutes.
Report Generation Process
1. Choose this report from the list shown in the Report Wizard accessed through the Administration Management Window.
2. To select the students to be included in the report: a. Choose the school and grade using the dropboxes. b. Highlight one or more students in the Available Users column. c. Click on the Add button to move them to the Selected Users column.
3. If you want to add students from another grade, select the grade then use the Add button to select additional students.
4. Choose the file format you'd like the report to be saved as: .HTML - Best viewed and printed using your Web browser. .CSV - Comma delimited data, best for importing data into spreadsheets and
databases. 5. Click on the appropriate button, either .HTML or .CSV. 6. Wait, it may take a few minutes for the report to be generated. Please take no action as
long as the Generating Report message is onscreen. 7. .HTML only: Your Web browser will open and the report will appear. 8. .CSV only: When the File Saved dialog opens, you may want to write down the file name
and path. Then your data will open in whatever application normally handles .CSV files (typically Excel).
9. In both your browser and Excel, you can view, print, and save your report.

ADMINISTRATION MANAGEMENT REPORTS
112
List of Curriculum Areas**
This report displays a list of all active curriculum areas in the system. The report is sorted alphabetically by curriculum area. You can reorder this information simply by clicking in one of the column headers on the report data screen prior to getting a print preview. Information displayed on this report includes the name of the curriculum area and a description of the curriculum area. Report Information
Report Generation Process
1. Choose this report from the list shown in the Report Wizard accessed through the Administration Management Window.
2. Select the desired header and footer information.

ADMINISTRATION MANAGEMENT REPORTS
113
List of Grade Levels**
This report displays a list of all active grade levels in the system. The report is sorted alphabetically by grade level. Report Information
Report Generation Process
1. Choose this report from the list shown in the Report Wizard accessed through the Administration Management Window.
2. Select the desired header and footer information.

ADMINISTRATION MANAGEMENT REPORTS
114
List of Languages**
This report displays a list of all active languages in the system. The report is sorted alphabetically by language. Report Information
Report Generation Process
1. Choose this report from the list shown in the Report Wizard accessed through the Administration Management Window.
2. Select the desired header and footer information.

ADMINISTRATION MANAGEMENT REPORTS
115
List of Programs**
This report displays a list of all third-party programs that have been added to the system. The report is sorted alphabetically by program name. You can reorder this information simply by clicking in one of the column headers on the report data screen prior to getting a print preview. Information displayed on this report includes the name of the program and the path to the program. Report Information
Report Generation Process
1. Choose this report from the list shown in the Report Wizard accessed through the Administration Management Window.
2. Select the desired header and footer information.

ADMINISTRATION MANAGEMENT REPORTS
116
NCLB Report The NCLB standards report shows aggregate and disaggregate data for standard attainment. The report shows the number of students in the selected groups and the percentage that passed the ALS Skills assessments for particular standards. Report Information - Group by Group:
Information displayed on this report includes: NCLB Group/Standard - the standard/group permutation for all groups chosen, followed by
the standards tested. # of Students - the number of students in the group who were tested on the listed standard. Skills Available - the number of ALS Skills in the listed standard. Skills Tested - the number of ALS Skills within the standard on which students in the group
were tested. Skills Mastered - the number of skills that were mastered by students in the group. %Tested - calculated as Skills Tested / Skills Available x 100.
% Mastered of Tested - calculated as Skill Mastered / Skills Tested x 100. % Mastered of Available - calculated as Skills Mastered / Skills Available x 100.
Report Generation Process 1. Choose this report from the list shown in the Report Wizard accessed through the A+LS
Administration Management Window. 2. General Report Information: A. Determine the style of report B. Select a date range over which the report will pull data C. Choose which set of skills the report will use D. Specify a location to save report files 3. District Information: A. Select the District to report B. Choose one or more schools within the selected district C. Choose one or more grade levels to report 4. Standard Criteria: A. Choose a standard set B. Choose a curriculum area C. Select one or more curriculum levels from which to pull skills used in the report 5. NCLB Categories: A. Select NCLB categories for aggregating student data B. Optional: Filter your categories to pull user data from specific groups within the
selected categories 6. Confirm Selections

ADMINISTRATION MANAGEMENT REPORTS
117
Standard Attainment - by Class This report displays the level of standard attainment for students in the selected class(es). It is an administrator report that contains three levels, all layered on the same pages. The first level displays aggregate data on objective(s). The second level displays aggregate data on student(s). The third level displays aggregate data for each skill the student has taken in the objective. Before generating the report, you will be asked to select the school, grade, objectives, and date range you want the report to cover. Report Information - Screen 1
Information displayed on this report includes: {Objective Name} - Displays the name of the objective. The column header could be
different depending on the objective set you select. Each state standard set has its own naming conventions for objectives, skills, etc.
{Objective} ID - Displays the objective ID. This column’s name is also dependent on the objective set you’ve selected. Each state standard set has its own naming conventions for objectives, skills, etc.
{Standard Subset} - Displays the standard subset linked to the objective. As with the prior two columns, the name is dependent on the objective set you’ve selected. Each state standard set has its own naming conventions for objectives, skills, etc.
Students Tested - Displays the total number of students being tested for an objective. Students Mastered - Displays the total number of all the students that mastered the
objective. Percent Mastered - This column divides the number of students that mastered the objective
by the total number of students, multiplied by 100.
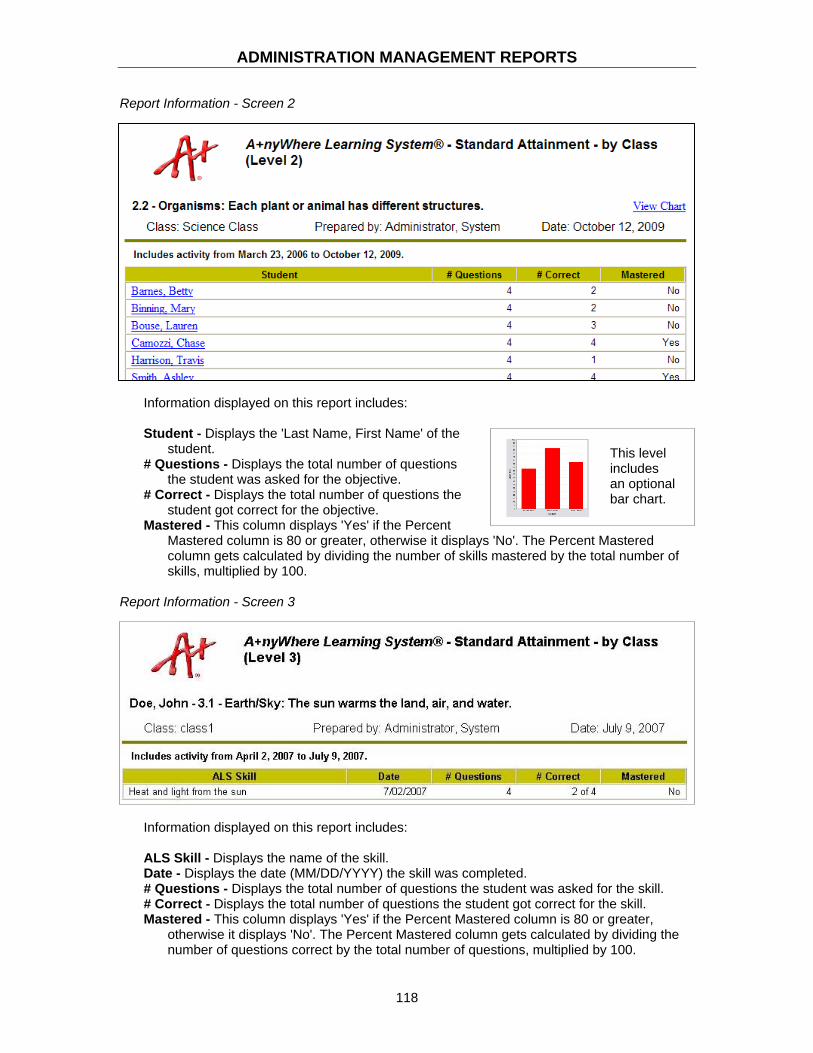
ADMINISTRATION MANAGEMENT REPORTS
118
Report Information - Screen 2
Information displayed on this report includes: Student - Displays the 'Last Name, First Name' of the
student. # Questions - Displays the total number of questions
the student was asked for the objective. # Correct - Displays the total number of questions the
student got correct for the objective. Mastered - This column displays 'Yes' if the Percent
Mastered column is 80 or greater, otherwise it displays 'No'. The Percent Mastered column gets calculated by dividing the number of skills mastered by the total number of skills, multiplied by 100.
Report Information - Screen 3
Information displayed on this report includes: ALS Skill - Displays the name of the skill. Date - Displays the date (MM/DD/YYYY) the skill was completed. # Questions - Displays the total number of questions the student was asked for the skill. # Correct - Displays the total number of questions the student got correct for the skill. Mastered - This column displays 'Yes' if the Percent Mastered column is 80 or greater,
otherwise it displays 'No'. The Percent Mastered column gets calculated by dividing the number of questions correct by the total number of questions, multiplied by 100.
This level includes an optional bar chart.
ADMINISTRATION MANAGEMENT REPORTS
119
Report Generation Process 1. Choose this report from the list shown in the Report Wizard accessed through the
Administration Management Window. 2. To select the classes to be included in the report:
a. Choose the school and grade using the dropboxes. b. Highlight one or more classes in the Available Classes column. c. Click on the Add button to move them to the Selected Classes column.
3. If you want to add classes from another grade, select the grade, select additional classes, and then use the Add button.
4. To select the standards and related skills to be included in the report: a. Use the dropboxes to select the Standard Set, Curriculum Area, Standard
Subset, and Curriculum Level. b. With the related standards displayed in Available Standards, select the ones you
want included in the report. c. Use the Add button to move the desired standards to the right column, Selected
Standards. 5. You can repeat the process to select additional standards. 6. Select the beginning and ending dates by clicking on the appropriate date button,
defining the period of time the report is to cover. 7. Choose the file format you'd like the report to be saved as:
.HTML - Best viewed and printed using your Web browser.
.CSV - Comma delimited data, best for importing data into spreadsheets and databases.
8. Click on the appropriate button, either .HTML or .CSV. 9. Wait, it may take a few minutes for the report to be generated. Please take no action as
long as the Generating Report message is onscreen. 10. .HTML only: Your Web browser will open and the report will appear. Watch for hotlinks in
the report. On the first screen, click on a skill and a more detailed report screen opens. On the second screen, you can click on a student’s name to see details of his or her performance. You can also use the View Chart link on the second screen.
11. .CSV only: When the File Saved dialog opens, you may want to write down the file name and path. Then your data will open in whatever application normally handles .CSV files (typically Excel).
12. In both your browser and Excel, you can view, print, and save your report.

ADMINISTRATION MANAGEMENT REPORTS
120
Standard Attainment - Selected Students This report displays the level of standard attainment for selected students across their assigned classes. This is a drill-down administrator report that contains three levels. The first screen displays aggregate data on objective(s). The second screen displays aggregate data on student(s) for a specific objective. The third screen displays aggregate data for each skill the selected student has taken for the objective. Before generating the report, you will be asked to select the school, grade, objectives, and date range you want the report to cover. Report Information - Screen 1
Information displayed on this report includes: {Objective Name} - Displays the name of the objective. The column header could be
different depending on the objective set you select. Each state standard set has its own naming conventions for objectives, skills, etc.
{Objective} ID - Displays the objective ID. This column’s name is also dependent on the objective set you’ve selected. Each state standard set has its own naming conventions for objectives, skills, etc.
{Standard Subset} - Displays the standard subset linked to the objective. As with the prior two columns, the name is dependent on the objective set you’ve selected. Each state standard set has its own naming conventions for objectives, skills, etc.
Students Tested - Displays the total number of students being tested for an objective. Students Mastered - Displays the total number of all the students that mastered the
objective. Percent Mastered - This column divides the number of students that mastered the objective
by the total number of students, multiplied by 100.
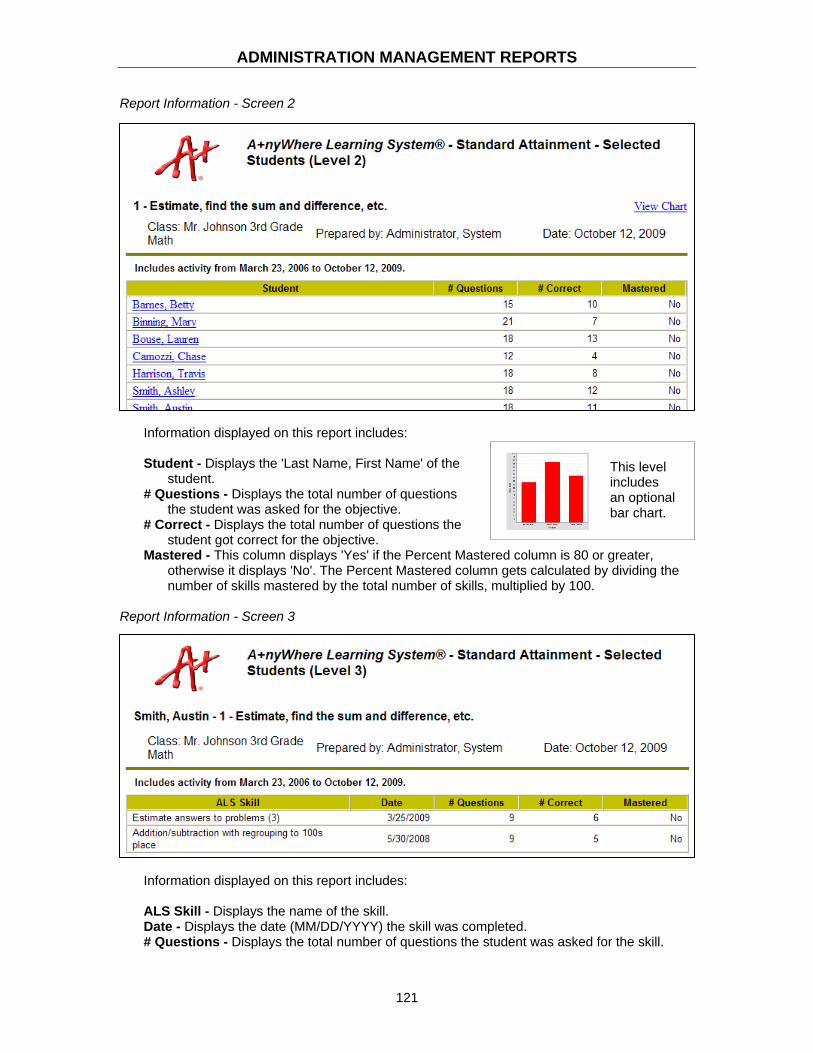
ADMINISTRATION MANAGEMENT REPORTS
121
Report Information - Screen 2
Information displayed on this report includes: Student - Displays the 'Last Name, First Name' of the
student. # Questions - Displays the total number of questions
the student was asked for the objective. # Correct - Displays the total number of questions the
student got correct for the objective. Mastered - This column displays 'Yes' if the Percent Mastered column is 80 or greater,
otherwise it displays 'No'. The Percent Mastered column gets calculated by dividing the number of skills mastered by the total number of skills, multiplied by 100.
Report Information - Screen 3
Information displayed on this report includes: ALS Skill - Displays the name of the skill. Date - Displays the date (MM/DD/YYYY) the skill was completed. # Questions - Displays the total number of questions the student was asked for the skill.
This level includes an optional bar chart.

ADMINISTRATION MANAGEMENT REPORTS
122
# Correct - Displays the total number of questions the student got correct for the skill. Mastered - This column displays 'Yes' if the Percent Mastered column is 80 or greater,
otherwise it displays 'No'. The Percent Mastered column gets calculated by dividing the number of questions correct by the total number of questions, multiplied by 100.
Report Generation Process
1. Choose this report from the list shown in the Report Wizard accessed through the Administration Management Window.
2. To select the students to be included in the report: a. Choose the school and grade using the dropboxes. b. Highlight one or more students in the Available Users column. c. Click on the Add button to move them to the Selected Users column.
3. If you want to add students from another grade, select the grade then use the Add button to select additional students.
4. To select the standards and related skills to be included in the report: a. Use the dropboxes to select the Standard Set, Curriculum Area, Standard
Subset, and Curriculum Level. b. With the related standards displayed in Available Standards, select the ones you
want included in the report. c. Use the Add button to move the desired standards to the right column, Selected
Standards. d. You can repeat the process to select additional standards.
5. Select the beginning and ending dates by clicking on the appropriate date button, defining the period of time the report is to cover.
6. Choose the file format you'd like the report to be saved as: .HTML - Best viewed and printed using your Web browser. .CSV - Comma delimited data, best for importing data into spreadsheets and
databases. 7. Click on the appropriate button, either .HTML or .CSV. 8. Wait, it may take a few minutes for the report to be generated. Please take no action as
long as the Generating Report message is onscreen. 9. .HTML only: Your Web browser will open and the report will appear. Watch for hotlinks in
the report. On the first screen, click on a skill and a more detailed report screen opens. On the second screen, you can click on a student’s name to see details of his or her performance. You can also use the View Chart link on the second screen.
10. .CSV only: When the File Saved dialog opens, you may want to write down the file name and path. Then your data will open in whatever application normally handles .CSV files (typically Excel).
11. In both your browser and Excel, you can view, print, and save your report.

ADMINISTRATION MANAGEMENT REPORTS
123
Student Progress - by Class This report displays student(s) progress and includes all activities except Adaptive Assessments (since they aren’t graded). It is a drill-down administrator report that contains three levels. The first screen displays aggregate data on each Class. The second screen displays aggregate data on each student/assignment list combination. The third screen displays aggregate data on each assignment. Before generating the report, you will be asked to select a Class by school and grade level. Then you’ll select a date range you would like to report on. Report Information - Screen 1
Information displayed on this report includes: Class - Displays the name of the class. Note: the first line displays the Average - All Classes
Reported. Students Reported - Displays the total number of students in the class being reported. # of Lessons - Displays the total number of lessons for all the students in the Class. Avg High Score % - This column divides the summation of the highest score for each
student by the number of students. Lessons Mastered - Displays the summation of all the student assignments that have been
mastered in the class. % Mastered - Displays the 'Lessons Mastered' column divided by the number of student
assignments, multiplied by 100. Lessons Mastered per Student - Displays the 'Lessons Mastered' column divided by the
number of students. Time - Displays the total time spent for all student assignments in the class.
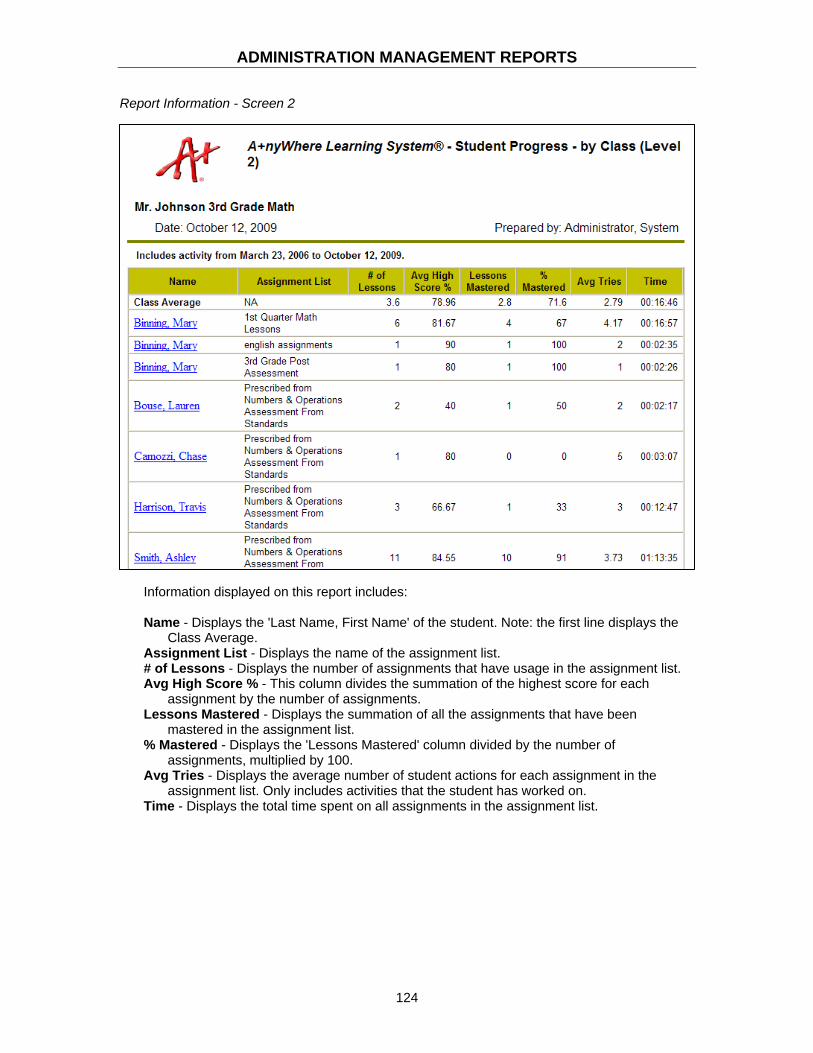
ADMINISTRATION MANAGEMENT REPORTS
124
Report Information - Screen 2
Information displayed on this report includes:
Name - Displays the 'Last Name, First Name' of the student. Note: the first line displays the
Class Average. Assignment List - Displays the name of the assignment list. # of Lessons - Displays the number of assignments that have usage in the assignment list. Avg High Score % - This column divides the summation of the highest score for each
assignment by the number of assignments. Lessons Mastered - Displays the summation of all the assignments that have been
mastered in the assignment list. % Mastered - Displays the 'Lessons Mastered' column divided by the number of
assignments, multiplied by 100. Avg Tries - Displays the average number of student actions for each assignment in the
assignment list. Only includes activities that the student has worked on. Time - Displays the total time spent on all assignments in the assignment list.

ADMINISTRATION MANAGEMENT REPORTS
125
Report Information - Screen 3
Information displayed on this report includes: Assignment - Displays the name of the assignment. Note: the first line displays the List
Average. Mastered - Displays 'Yes' if the assignment has been mastered and displays 'No' if it's not
mastered. Tries - Displays the number of total tries for the assignment. Avg Score % - This column divides the summation of all the usage scores by the number of
usage records for the assignment. High Score % - Displays the student’s highest score for the assignment as a percentage. Study Time - Displays the total time spent in the 'Study' mode for the assignment. Note:
some lessons do not have Study activities, such as LLS assignments. Test Time - Displays the total time spent in assessment activities (Calculation: Total Time -
Study Time - Essay Time). Total Time - Displays the total time spent on all assignments in the assignment list.
Report Generation Process
1. Choose this report from the list shown in the Report Wizard accessed through the Administration Management Window.
2. To select the classes to be included in the report: a. Choose the school and grade using the dropboxes. b. Highlight one or more classes in the Available Classes column. c. Click on the Add button to move them to the Selected Classes column. d. If you want to add classes from another grade, select the grade, select additional
classes, and then use the Add button. 3. Select the beginning and ending dates by clicking on the appropriate date button,
defining the period of time the report is to cover.

ADMINISTRATION MANAGEMENT REPORTS
126
4. Choose the file format for the report:
.HTML - Best viewed and printed using your Web browser.
.CSV - Comma delimited data, best for importing data into spreadsheets and databases.
5. Click on the appropriate button, either .HTML or .CSV. 6. Wait, it may take a few minutes for the report to be generated. Please take no action as
long as the Generating Report message is onscreen. 7. .HTML only: Your Web browser will open and the report will appear. Watch for hotlinks in
the report. On the first and second screens, click on a student’s name and a more detailed report screen opens.
8. .CSV only: When the File Saved dialog opens, you may want to write down the file name and path. Then your data will open in whatever application normally handles .CSV files (typically Excel).
9. In both your browser and Excel, you can view, print, and save your report.

ADMINISTRATION MANAGEMENT REPORTS
127
Student Progress - Selected Students This report displays student(s) progress and includes all activities except Adaptive Assessments (since they aren’t graded). It is a drill-down administrator report that contains two levels. The first screen displays aggregate data on each student’s assignment list(s). The second screen displays aggregate data on each assignment. Before generating the report, you will be asked to select a student(s) by school and grade level, then you’ll select a date range you would like to report on. Report Information - Screen 1
Information displayed on this report includes: Name - Displays the 'Last Name, First Name' of the student. Note: the first line displays the
Average of Students Reported. Assignment List - Displays the name of the assignment list. # of Lessons - Displays the number of assignments that have usage in the assignment list. Avg High Score % - This column divides the summation of the highest score for each
assignment by the number of assignments. Lessons Mastered - Displays the summation of all the assignments that have been
mastered in the assignment list. % Mastered - Displays the 'Lessons Mastered' column divided by the number of
assignments, multiplied by 100. Avg Tries - Displays the average number of student actions for each assignment in the
assignment list. Only includes activities that the student has worked on. Time - Displays the total time spent on all assignments in the assignment list.

ADMINISTRATION MANAGEMENT REPORTS
128
Report Information - Screen 2
Information displayed on this report includes: Assignment - Displays the name of the assignment. Note: the first line displays the List
Average. Mastered - Displays 'Yes' if the assignment has been mastered and displays 'No' if it's not
mastered. Tries - Displays the number of times the student has accessed the activity for the
assignment. Avg Score % - This column divides the summation of all the usage scores by the number of
usage records for the assignment. High Score % - Displays the student’s highest score for the assignment as a percentage. Study Time - Displays the total time spent in the 'Study' mode for the assignment. Note:
some lessons do not have Study activities, such as LLS assignments. Test Time - Displays the total time spent in assessment activities (Calculation: Total Time –
Study Time – Essay Time). Total Time - Displays the total time spent on all assignments in the assignment list.
Report Generation Process
1. Choose this report from the list shown in the Report Wizard accessed through the Administration Management Window.
2. To select the students to be included in the report: a. Choose the school and grade using the dropboxes. b. Highlight one or more students in the Available Users column. c. Click on the Add button to move them to the Selected Users column.
3. If you want to add students from another grade, select the grade then use the Add button to select additional students.
4. Select the beginning and ending dates by clicking on the appropriate date button, defining the period of time the report is to cover.
5. Choose the file format you'd like the report to be saved as: .HTML - Best viewed and printed using your Web browser. .CSV - Comma delimited data, best for importing data into spreadsheets and
databases.

ADMINISTRATION MANAGEMENT REPORTS
129
6. Click on the appropriate button, either .HTML or .CSV. 7. Wait, it may take a few minutes for the report to be generated. Please take no action as
long as the Generating Report message is onscreen. 8. .HTML only: Your Web browser will open and the report will appear. Watch for hotlinks in
the report. On the first screen, click on a student’s name and a more detailed report screen opens.
9. .CSV only: When the File Saved dialog opens, you may want to write down the file name and path. Then your data will open in whatever application normally handles .CSV files (typically Excel).
10. In both your browser and Excel, you can view, print, and save your report.

ADMINISTRATION MANAGEMENT REPORTS
130
Total Usage Time - by Site This report displays the total time spent on activities during the selected date range. It is a drill-down administrator report that contains two levels. The first screen displays aggregate data by site/school. The second level displays aggregate data for the classes in the selected school. You will be asked to select a date range for the report. Report Information - Screen 1
Information displayed on this report includes: School - Displays the name of the school. Note: the first line will display the System-wide
Totals. Lesson Time - Displays the summation of all usage time within the school (only Adaptive
Assessments are not included in the total). Assessment Time - Displays the summation of all Adaptive Assessment usage time within
the School. Total Time - Displays the summation of all usage time within the school.
Report Information - Screen 2
Information displayed on this report includes: Class - Displays the name of the class. Note: the first line will display the Totals for School.

ADMINISTRATION MANAGEMENT REPORTS
131
Report Information - Screen 2 (continued) Lesson Time - Displays the summation of all usage time within the class (only Adaptive
Assessments are not included in the total). Assessment Time - Displays the summation of all Adaptive Assessment usage time within
the Class. Total Time - Displays the summation of all usage time within the class.
Report Generation Process
1. Choose this report from the list shown in the Report Wizard accessed through the Administration Management Window.
2. Select the beginning and ending dates by clicking on the appropriate date button, defining the period of time the report is to cover.
3. Choose the file format you'd like the report to be saved as: .HTML - Best viewed and printed using your Web browser. .CSV - Comma delimited data, best for importing data into spreadsheets and
databases. 4. Click on the appropriate button, either .HTML or .CSV. 5. Wait, it may take a few minutes for the report to be generated. Please take no action as
long as the Generating Report message is onscreen. 6. .HTML only: Your Web browser will open and the report will appear. Watch for hotlinks in
the report. 7. .CSV only: When the File Saved dialog opens, you may want to write down the file name
and path. Then your data will open in whatever application normally handles .CSV files (typically Excel).
8. In both your browser and Excel, you can view, print, and save your report.

ADMINISTRATION MANAGEMENT REPORTS
132
Total Usage Time - by Student
This single layer report displays the total time spent on activities within a class for each student. Before generating the report, you will be asked to select the school, class, and date range you would like covered in the report. Report Information
Information displayed on this report includes: Student - Displays the 'Last Name, First Name' of the student. Lesson Time - Displays the summation of all usage time for the student (only Adaptive
Assessments are not included in the total). Assessment Time - Displays the summation of all Adaptive Assessment usage time for the
student. Total Time - Displays the summation of all usage time for the student.
Report Generation Process
1. Choose this report from the list shown in the Report Wizard accessed through the Administration Management Window.
2. Select the school. 3. Select the class. 4. Select the beginning and ending dates by clicking on the appropriate date button,
defining the period of time the report is to cover. 5. Choose the file format for the report:
.HTML - Best viewed and printed using your Web browser.
.CSV - Comma delimited data, best for importing data into spreadsheets and databases.
6. Click on the appropriate button, either .HTML or .CSV. 7. Wait, it may take a few minutes for the report to be generated. Please take no action as
long as the Generating Report message is onscreen. 8. .HTML only: Your Web browser will open and the report will appear. 9. .CSV only: When the File Saved dialog opens, you may want to write down the file name
and path. Then your data will open in whatever application normally handles .CSV files (typically Excel).
10. In both your browser and Excel, you can view, print, and save your report.

ADMINISTRATION MANAGEMENT REPORTS
133
Total Usage Time by Site** Total Usage Time by Site reports the total time spent in ALS Lessons, the total time spent in assessments, and the total time spent in the system between the specified dates. Report Information
Information displayed on this report includes: Site - This is the school name. ALS Lesson Time (min.) - This is the sum of all usage time between the specified dates. Assess Time (min.) - This is the sum of all Assess time between the specified dates. Total Time (hh:mm) - This is the sum of ALS Lesson Time and Assess Time for each site. Total ALS Lesson Time - Sum of all ALS Lesson Time for all sites. Total Assess Time - Total Assess Time for all sites. Total Total Time - Sum of Total ALS Lesson Time and Total Assess Time. Total time for all sites - This is the sum of Total Time for all sites.
Report Generation Process
1. Choose this report from the list shown in the Report Wizard accessed through the Administration Management Window.
2. Select a date range to constrain the report. 3. Format header and footer information.

ADMINISTRATION MANAGEMENT REPORTS
134
Total Usage Time by Student** Total Usage Time by Student displays the total amount of time each student in the system spent in the A+LS program within the specified date range. Report Information
Information displayed on this report includes: Site - This is the school name. Last Name - Last name of student. First Name - First name of student. ALS Lesson Time (min.)- This is the sum of all usage time between the specified dates. Assess Time (min.) - This is the sum of all Assess time between the specified dates. Total Time (hh:mm) - This is the sum of ALS Lesson Time and Assess Time for each site.
Report Generation Process
1. Choose this report from the list shown in the Report Wizard accessed through the Administration Management Window.
2. Select a date range to constrain the report. 3. Format header and footer information.