Embed Size (px)
Citation preview
AltaLink, L.P. Management’s Discussion and Analysis
August 5, 2016

Table of Contents Management’s Discussion and Analysis 1
Executive Summary 1
Our Ownership Structure 2
Our Business and Strategies 3
Transmission Tariffs 6
Major Capital Projects 12
Non-GAAP Financial Measures 13
Financial Position and Cash Flows 14
Liquidity and Capital Resources 16
Results of Operations 18
Risk Management 21
Transactions with Related Parties 23
Legal Proceedings and Contingencies 23
Off Balance Sheet Arrangements 24
Critical Accounting Estimates 24
Accounting Changes 24
Forward Looking Information 25
Page | 1
MANAGEMENT’S DISCUSSION AND ANALYSIS THREE AND SIX MONTHS ENDED JUNE 30, 2016 AND 2015
Management’s Discussion and Analysis
This Management’s Discussion and Analysis (MD&A) reflects events known to us as of August 5, 2016. This MD&A is intended to provide you with an understanding of our business, our strategy, our performance, our expectations for the future, and how we manage risk and financial resources. The Board of Directors approved this MD&A on July 27, 2016, based on the recommendation of our Audit Committee, which reviewed this MD&A in accordance with its terms of reference.
You should read this MD&A in conjunction with our legal advisory on Forward Looking Information, which we have included at the end of this MD&A, as well as our unaudited condensed interim financial statements for the three and six months ended June 30, 2016 and 2015 (Second Quarter Financial Statements), and our audited financial statements for the years ended December 31, 2015 and 2014 (the Financial Statements) and the notes thereto.
The financial information in this MD&A is presented in Canadian dollars, which is our functional currency.
Unless otherwise noted, references in this MD&A to “we”, “us”, “our”, “AltaLink” or “the Partnership” mean AltaLink, L.P. and references to a “quarter” and “year” refer to the three-month period ended June 30, 2016 and the twelve-month period ended December 31, 2015, respectively. References to “AESO” mean Alberta Electric System Operator; “AFUDC” mean Allowance for Funds Used During Construction; “AUC” mean Alberta Utilities Commission; “BHE” mean Berkshire Hathaway Energy Company; “BHEA” mean BHE AltaLink Ltd.”; “CEA” mean Canadian Electricity Association; “CWIP” mean Construction Work-In-Progress; “GTA” mean General Tariff Application”; “GCOC” mean Generic Cost of Capital; “DACDA” mean Direct Assigned Capital Deferral Account filing; and “IFRS” mean International Financial Reporting Standards.
Additional information relating to our business including our Annual Information Form for the year ended December 31, 2015 is available on SEDAR at www.sedar.com.
Executive Summary
Quarter Highlights
During the three months ended June 30, 2016:
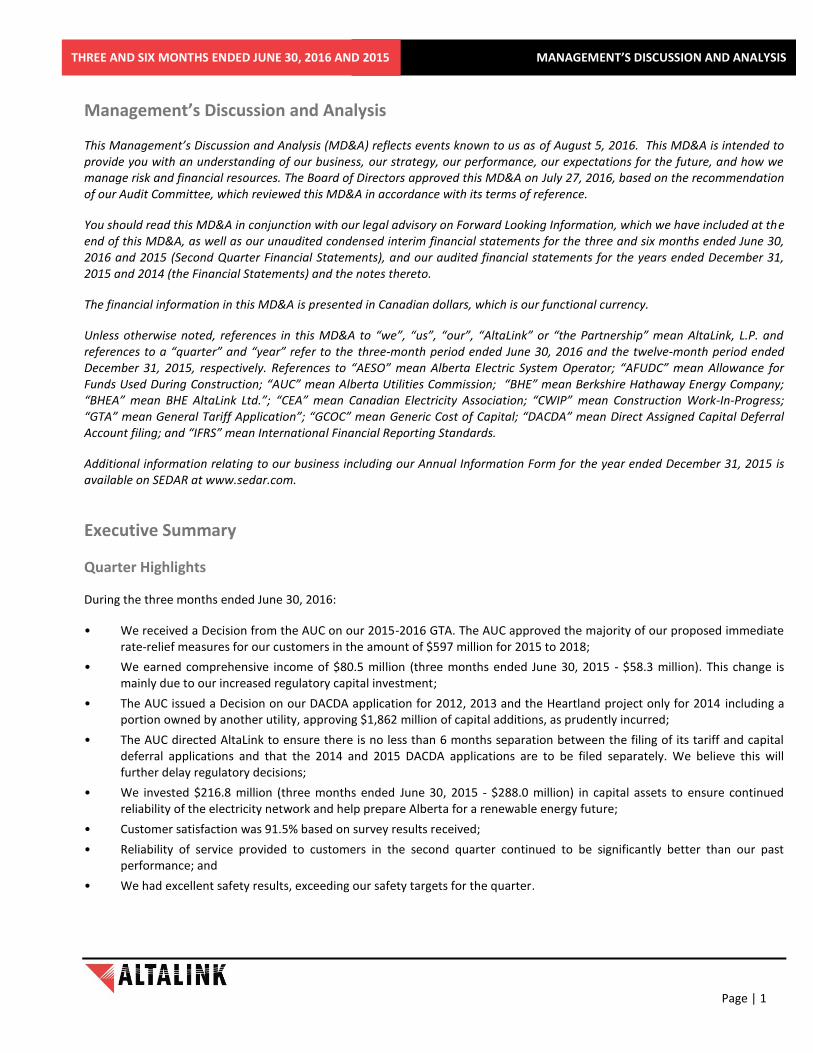
• We received a Decision from the AUC on our 2015-2016 GTA. The AUC approved the majority of our proposed immediate rate-relief measures for our customers in the amount of $597 million for 2015 to 2018;
• We earned comprehensive income of $80.5 million (three months ended June 30, 2015 - $58.3 million). This change is mainly due to our increased regulatory capital investment;
• The AUC issued a Decision on our DACDA application for 2012, 2013 and the Heartland project only for 2014 including a portion owned by another utility, approving $1,862 million of capital additions, as prudently incurred;
• The AUC directed AltaLink to ensure there is no less than 6 months separation between the filing of its tariff and capital deferral applications and that the 2014 and 2015 DACDA applications are to be filed separately. We believe this will further delay regulatory decisions;
• We invested $216.8 million (three months ended June 30, 2015 - $288.0 million) in capital assets to ensure continued reliability of the electricity network and help prepare Alberta for a renewable energy future;
• Customer satisfaction was 91.5% based on survey results received;
• Reliability of service provided to customers in the second quarter continued to be significantly better than our past performance; and
• We had excellent safety results, exceeding our safety targets for the quarter.
Page | 2
MANAGEMENT’S DISCUSSION AND ANALYSIS THREE AND SIX MONTHS ENDED JUNE 30, 2016 AND 2015
Strategic Highlights
• Our existing transmission grid is ready to deliver reliable and affordable energy to Albertans without significant investment in new transmission lines or substations.
• Our engineers are researching ways to get more out of our existing grid to maximize value for our customers.
• A reliable, efficient transmission system ensures that all generators compete, enabling access to low cost generation including renewables for all customers.
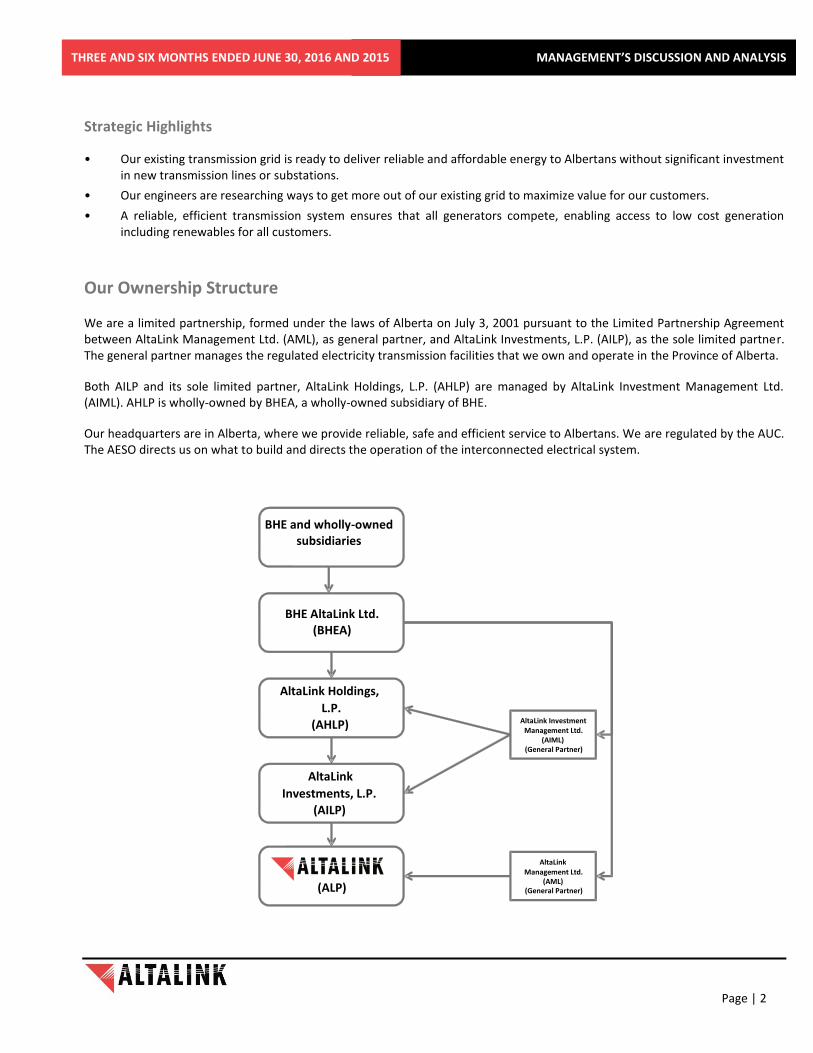
Our Ownership Structure
We are a limited partnership, formed under the laws of Alberta on July 3, 2001 pursuant to the Limited Partnership Agreement between AltaLink Management Ltd. (AML), as general partner, and AltaLink Investments, L.P. (AILP), as the sole limited partner. The general partner manages the regulated electricity transmission facilities that we own and operate in the Province of Alberta.
Both AILP and its sole limited partner, AltaLink Holdings, L.P. (AHLP) are managed by AltaLink Investment Management Ltd. (AIML). AHLP is wholly-owned by BHEA, a wholly-owned subsidiary of BHE.
Our headquarters are in Alberta, where we provide reliable, safe and efficient service to Albertans. We are regulated by the AUC. The AESO directs us on what to build and directs the operation of the interconnected electrical system.
AltaLink Holdings,
L.P.
(AHLP)
AltaLink
Investments, L.P.
(AILP)
(ALP)
AltaLink Investment Management Ltd.
(AIML) (General Partner)
AltaLink Management Ltd.
(AML) (General Partner)
BHE AltaLink Ltd. (BHEA)
BHE and wholly-owned subsidiaries
Page | 3
MANAGEMENT’S DISCUSSION AND ANALYSIS THREE AND SIX MONTHS ENDED JUNE 30, 2016 AND 2015
Our Business and Strategies
We own and operate regulated electricity transmission facilities in the Province of Alberta. Through our transmission facilities, we deliver electricity safely, reliably and efficiently to approximately 85% of Alberta’s population to meet continuously changing customer needs under all operating conditions. We connect generation plants to major load centres, cities and large industrial plants throughout our 226,000 square kilometre service area, which covers a diverse geographic area, including most major urban centres in central and southern Alberta. Our transmission facilities comprise approximately half of the total kilometres in the Alberta Interconnected Electric System, including interconnections with British Columbia’s transmission system that link Alberta with the North American western interconnected system.
For more details regarding our business and strategies, please refer to “Our Business and Strategies” section of our MD&A for the year ended December 31, 2015.
Our Vision and Core Principles
Our vision and strategy is to be the best transmission company in serving customers, while delivering long-term, sustainable solutions. Our core principles are customer service, employee commitment, environmental respect, regulatory integrity, operational excellence, and financial strength.
We use certain measures to determine whether we are meeting our goals and the needs of our customers. During the three and six months ended June 30, 2016, our performance continued to compare favourably to other transmission facility owners in Canada for reliability, safety and cost-effectiveness.
Customer Service
We are focused on delivering reliability and exceptional service to our customers.
Customer performance To measure our performance on customer service, we survey our customers to garner feedback and perceptions on service attributes that are unique to each customer segment. We use the survey results and feedback to establish specific initiatives aimed at improving our customers’ experience. Customer satisfaction was 91.5% in the second quarter of 2016.
External engagement We focus our landowner, government, Aboriginal and media engagement practices on providing our stakeholders with timely, transparent and easy to understand information about our transmission projects and business. Our processes are designed to gather stakeholder input to help us identify and select routes for our new projects with low overall impacts on land use and landowners. We continue this engagement through the lifecycle of our facilities. We survey landowners after consultation and during construction of significant projects, as well as those who already host our facilities, to address any issues and build long-term relationships.
Employee Commitment
We equip employees with the resources and support they need to be successful. We encourage teamwork and provide a safe, rewarding work environment. We make no compromise when it comes to safety, and we align our short-term and long-term incentive pay with the needs of our customers.
Our leadership team’s experience and expertise, combined with our employees’ knowledge and commitment to “keeping the lights on” through operational excellence, are key to our ability to deliver customer requirements successfully.
Employee engagement We strive continuously to attract, retain and develop a high quality workforce to enable us to not only sustain our business, but to remain at the forefront of innovation and continuous improvement. We employ approximately 850 skilled and dedicated people to maintain and operate our facilities and to deliver on the major transmission projects planned in Alberta.
Page | 4
MANAGEMENT’S DISCUSSION AND ANALYSIS THREE AND SIX MONTHS ENDED JUNE 30, 2016 AND 2015
Using an independent third party we conduct employee engagement surveys with our employees every two years. We initiated an employee engagement survey in the third quarter of 2015 with 95% of employees responding and an employee engagement score of 83%. Our employee engagement scores rank AltaLink in the top quartile of Canadian companies.
Safety The health and safety of our employees and contractors is a core value. We have established a leadership team to provide guidance and oversight with respect to safety. Our safety management initiatives encompass all aspects of our safety systems and focus our entire organization on safety accountabilities, responsibilities and culture. We strive to continuously improve our safety performance through focused training and our ongoing commitment to our safety culture and safety management processes.
Our safety performance is continuously improving and we consistently attain superior industry safety metrics. Our employee Injury Frequency Rate for 2015 was 0.12, our best result ever. Our employee Injury Frequency Rate continues to be better than our peers in the CEA.
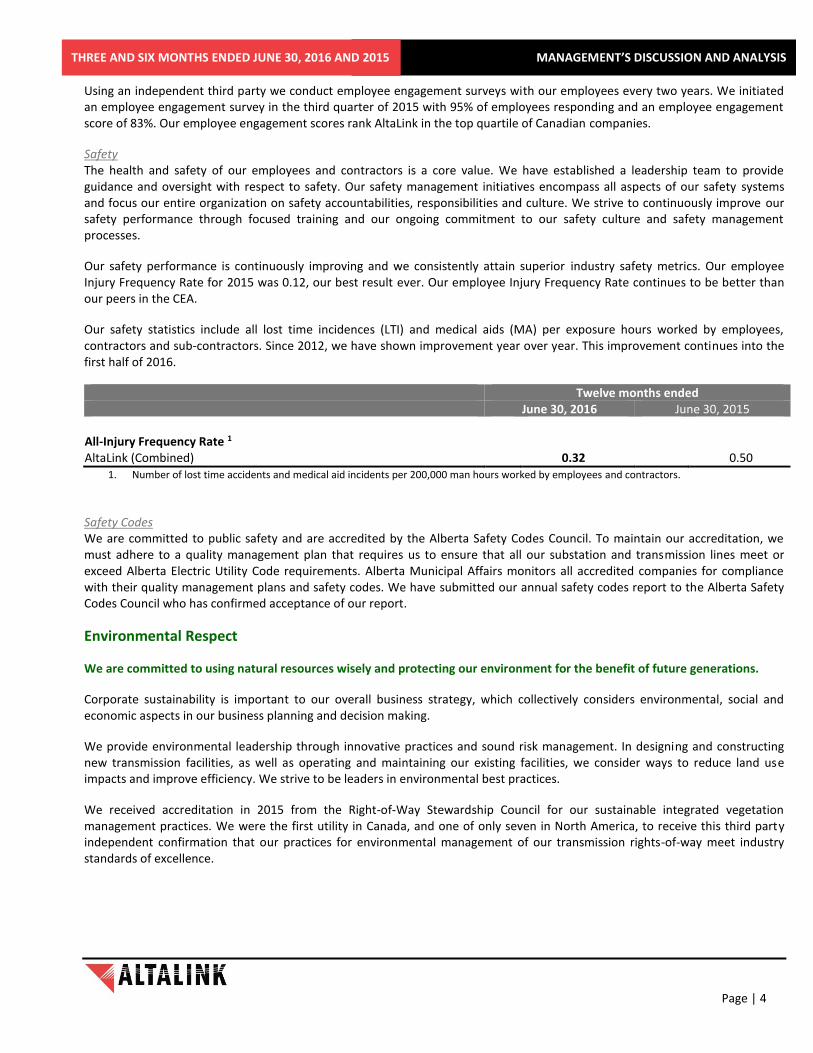
Our safety statistics include all lost time incidences (LTI) and medical aids (MA) per exposure hours worked by employees, contractors and sub-contractors. Since 2012, we have shown improvement year over year. This improvement continues into the first half of 2016.
Twelve months ended June 30, 2016 June 30, 2015 All-Injury Frequency Rate 1 AltaLink (Combined) 0.32 0.50
1. Number of lost time accidents and medical aid incidents per 200,000 man hours worked by employees and contractors.
Safety Codes We are committed to public safety and are accredited by the Alberta Safety Codes Council. To maintain our accreditation, we must adhere to a quality management plan that requires us to ensure that all our substation and transmission lines meet or exceed Alberta Electric Utility Code requirements. Alberta Municipal Affairs monitors all accredited companies for compliance with their quality management plans and safety codes. We have submitted our annual safety codes report to the Alberta Safety Codes Council who has confirmed acceptance of our report.
Environmental Respect
We are committed to using natural resources wisely and protecting our environment for the benefit of future generations.
Corporate sustainability is important to our overall business strategy, which collectively considers environmental, social and economic aspects in our business planning and decision making.
We provide environmental leadership through innovative practices and sound risk management. In designing and constructing new transmission facilities, as well as operating and maintaining our existing facilities, we consider ways to reduce land use impacts and improve efficiency. We strive to be leaders in environmental best practices.
We received accreditation in 2015 from the Right-of-Way Stewardship Council for our sustainable integrated vegetation management practices. We were the first utility in Canada, and one of only seven in North America, to receive this third party independent confirmation that our practices for environmental management of our transmission rights-of-way meet industry standards of excellence.

Page | 5
MANAGEMENT’S DISCUSSION AND ANALYSIS THREE AND SIX MONTHS ENDED JUNE 30, 2016 AND 2015
Regulatory Integrity
We adhere to a policy of strict regulatory compliance and pursue frequent, open communication with stakeholders regarding our business performance.
As a transmission facility owner, we are regulated by the Alberta Utilities Commission, pursuant to the Electric Utilities Act (Alberta), the Public Utilities Act (Alberta), the Alberta Utilities Commission Act (Alberta) and the Hydro and Electric Energy Act (Alberta). Through various regulatory decisions, these statutes and their respective regulations impact our tariffs, rates, construction, operations and financing.
We receive all of our regulated transmission tariffs, including settlements of deferral and reserve accounts, from the Alberta Electric System Operator. We and other transmission facility owners are permitted to charge a tariff for the use of our transmission facilities. Such tariffs are regulated by the AUC under the provisions of the Electric Utilities Act in respect of rates and terms and conditions of service.
Operational Excellence
Together with our employees, we pride ourselves on excellence in every aspect of our work. Our high standards for operations and system maintenance enable us to meet and exceed our customers’ expectations, perform our work safely, and preserve our assets.
We focus on keeping the lights on for Albertans and are committed to reinforcing Alberta’s transmission infrastructure to ensure that the province’s electricity grid can enable future prosperity. Our continuous improvement culture and focus on operational excellence encompasses our project execution programs, maintenance processes, centralized work planning, and scheduling.
We continuously implement business improvements across our organization to deliver reliable and safe transmission service to our customers.
Operations and Asset Management We design and implement operational, maintenance and capital investment practices to fulfill our commitment to the safe, reliable and cost effective operation of our transmission business. Our program-based maintenance activities cover the broad functional spectrum of the transmission business, including safety, lines, substations, telecommunications, meters, vehicles, buildings, tools, control centre and information technology. We utilize life extension and long-range asset replacement programs to ensure timely and effective replacement of assets which have reached the end of their useful life.
Capital Projects
We energized $251.7 million of capital projects in the first half of 2016.
Reliability A strong, efficient, and reliable transmission system ensures Albertans have access to multiple generation resources from across the province, instead of a limited number of local generation sources. A reliable transmission system also ensures that all generators compete, enabling access to low cost generation including renewables for customers.
We operate our transmission system so as to minimize disruption of service to our customers. Nevertheless, severe weather and other unplanned events cause service disruptions to which we respond as quickly as possible. We have a long-term trend of improving reliability through proactive operating practices and capital investment. Our reliability statistics are consistently better than those of our peers, as reported by the CEA.
In the first six months of the year our reliability performance was significantly better than our historical performance.
Page | 6
MANAGEMENT’S DISCUSSION AND ANALYSIS THREE AND SIX MONTHS ENDED JUNE 30, 2016 AND 2015
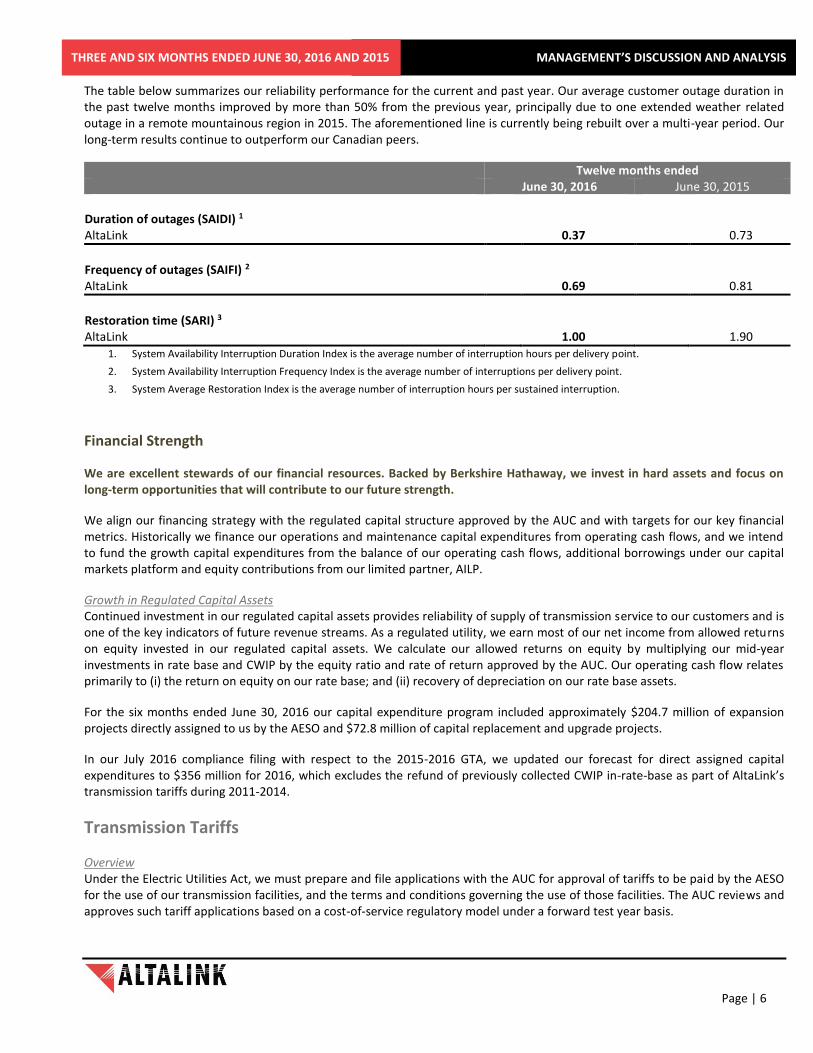
The table below summarizes our reliability performance for the current and past year. Our average customer outage duration in the past twelve months improved by more than 50% from the previous year, principally due to one extended weather related outage in a remote mountainous region in 2015. The aforementioned line is currently being rebuilt over a multi-year period. Our long-term results continue to outperform our Canadian peers.
Twelve months ended June 30, 2016 June 30, 2015 Duration of outages (SAIDI) 1 AltaLink 0.37 0.73
Frequency of outages (SAIFI) 2 AltaLink 0.69 0.81
Restoration time (SARI) 3 AltaLink 1.00 1.90
1. System Availability Interruption Duration Index is the average number of interruption hours per delivery point.
2. System Availability Interruption Frequency Index is the average number of interruptions per delivery point.
3. System Average Restoration Index is the average number of interruption hours per sustained interruption.
Financial Strength
We are excellent stewards of our financial resources. Backed by Berkshire Hathaway, we invest in hard assets and focus on long-term opportunities that will contribute to our future strength.
We align our financing strategy with the regulated capital structure approved by the AUC and with targets for our key financial metrics. Historically we finance our operations and maintenance capital expenditures from operating cash flows, and we intend to fund the growth capital expenditures from the balance of our operating cash flows, additional borrowings under our capital markets platform and equity contributions from our limited partner, AILP.
Growth in Regulated Capital Assets Continued investment in our regulated capital assets provides reliability of supply of transmission service to our customers and is one of the key indicators of future revenue streams. As a regulated utility, we earn most of our net income from allowed returns on equity invested in our regulated capital assets. We calculate our allowed returns on equity by multiplying our mid-year investments in rate base and CWIP by the equity ratio and rate of return approved by the AUC. Our operating cash flow relates primarily to (i) the return on equity on our rate base; and (ii) recovery of depreciation on our rate base assets.
For the six months ended June 30, 2016 our capital expenditure program included approximately $204.7 million of expansion projects directly assigned to us by the AESO and $72.8 million of capital replacement and upgrade projects.
In our July 2016 compliance filing with respect to the 2015-2016 GTA, we updated our forecast for direct assigned capital expenditures to $356 million for 2016, which excludes the refund of previously collected CWIP in-rate-base as part of AltaLink’s transmission tariffs during 2011-2014.
Transmission Tariffs
Overview Under the Electric Utilities Act, we must prepare and file applications with the AUC for approval of tariffs to be paid by the AESO for the use of our transmission facilities, and the terms and conditions governing the use of those facilities. The AUC reviews and approves such tariff applications based on a cost-of-service regulatory model under a forward test year basis.
Page | 7
MANAGEMENT’S DISCUSSION AND ANALYSIS THREE AND SIX MONTHS ENDED JUNE 30, 2016 AND 2015
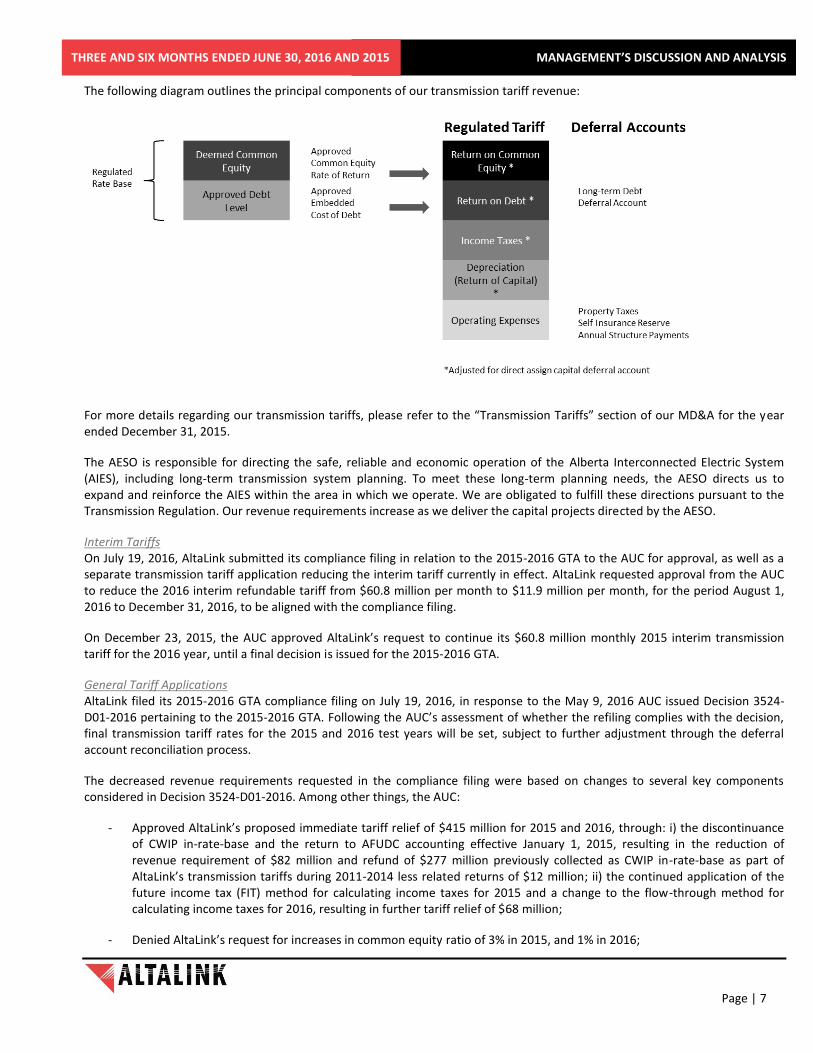
The following diagram outlines the principal components of our transmission tariff revenue:
For more details regarding our transmission tariffs, please refer to the “Transmission Tariffs” section of our MD&A for the year ended December 31, 2015.
The AESO is responsible for directing the safe, reliable and economic operation of the Alberta Interconnected Electric System (AIES), including long-term transmission system planning. To meet these long-term planning needs, the AESO directs us to expand and reinforce the AIES within the area in which we operate. We are obligated to fulfill these directions pursuant to the Transmission Regulation. Our revenue requirements increase as we deliver the capital projects directed by the AESO.
Interim Tariffs On July 19, 2016, AltaLink submitted its compliance filing in relation to the 2015-2016 GTA to the AUC for approval, as well as a separate transmission tariff application reducing the interim tariff currently in effect. AltaLink requested approval from the AUC to reduce the 2016 interim refundable tariff from $60.8 million per month to $11.9 million per month, for the period August 1, 2016 to December 31, 2016, to be aligned with the compliance filing.
On December 23, 2015, the AUC approved AltaLink’s request to continue its $60.8 million monthly 2015 interim transmission tariff for the 2016 year, until a final decision is issued for the 2015-2016 GTA.
General Tariff Applications AltaLink filed its 2015-2016 GTA compliance filing on July 19, 2016, in response to the May 9, 2016 AUC issued Decision 3524-D01-2016 pertaining to the 2015-2016 GTA. Following the AUC’s assessment of whether the refiling complies with the decision, final transmission tariff rates for the 2015 and 2016 test years will be set, subject to further adjustment through the deferral account reconciliation process.
The decreased revenue requirements requested in the compliance filing were based on changes to several key components considered in Decision 3524-D01-2016. Among other things, the AUC:
- Approved AltaLink’s proposed immediate tariff relief of $415 million for 2015 and 2016, through: i) the discontinuance of CWIP in-rate-base and the return to AFUDC accounting effective January 1, 2015, resulting in the reduction of revenue requirement of $82 million and refund of $277 million previously collected as CWIP in-rate-base as part of AltaLink’s transmission tariffs during 2011-2014 less related returns of $12 million; ii) the continued application of the future income tax (FIT) method for calculating income taxes for 2015 and a change to the flow-through method for calculating income taxes for 2016, resulting in further tariff relief of $68 million;
- Denied AltaLink’s request for increases in common equity ratio of 3% in 2015, and 1% in 2016;
Page | 8
MANAGEMENT’S DISCUSSION AND ANALYSIS THREE AND SIX MONTHS ENDED JUNE 30, 2016 AND 2015
- Deferred to the GCOC proceeding AltaLink’s request for changes to its capital structure, including an additional 2% increase in the common equity ratio in 2016 as a result of its non-taxable status;
- Approved AltaLink’s depreciation rates as filed, but reduced most of AltaLink’s salvage rates to 2014 levels, which resulted in a reduction of revenue of about $87 million over two years; and
- Authorized AltaLink to enter into subordinated debt financing if AltaLink considers it to be beneficial.
The 2015-2016 GTA proceeding was also concerned with determining the aggregate forecast of direct assign project capital additions to be approved in each test year. In Decision 3524-D01-2016, the AUC approved the capital forecasts substantially as filed (with minor variations), but directed AltaLink to use as part of its refiling the actual amount of capital additions for direct assign projects brought into service in 2015, and AltaLink’s revised capital additions forecast for 2016, which were approximately $2.9 billion and $0.7 billion respectively.
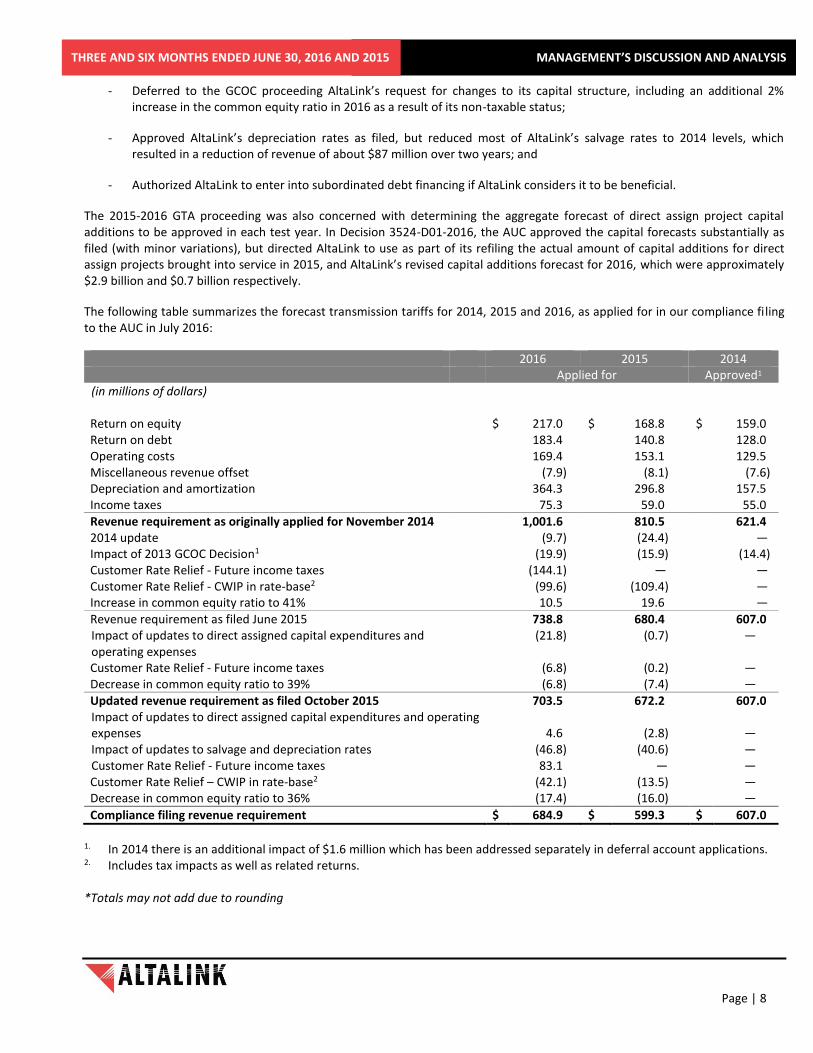
The following table summarizes the forecast transmission tariffs for 2014, 2015 and 2016, as applied for in our compliance filing to the AUC in July 2016:
2016 2015 2014 Applied for Approved1 (in millions of dollars) Return on equity $ 217.0 $ 168.8 $ 159.0 Return on debt 183.4 140.8 128.0 Operating costs 169.4 153.1 129.5 Miscellaneous revenue offset (7.9) (8.1) (7.6) Depreciation and amortization 364.3 296.8 157.5 Income taxes 75.3 59.0 55.0
Revenue requirement as originally applied for November 2014 1,001.6 810.5 621.4 2014 update (9.7) (24.4) — Impact of 2013 GCOC Decision1 (19.9) (15.9) (14.4) Customer Rate Relief - Future income taxes (144.1) — — Customer Rate Relief - CWIP in rate-base2 (99.6) (109.4) — Increase in common equity ratio to 41% 10.5 19.6 —
Revenue requirement as filed June 2015 738.8 680.4 607.0 Impact of updates to direct assigned capital expenditures and operating expenses
(21.8) (0.7) —
Customer Rate Relief - Future income taxes (6.8) (0.2) — Decrease in common equity ratio to 39% (6.8) (7.4) —
Updated revenue requirement as filed October 2015 703.5 672.2 607.0 Impact of updates to direct assigned capital expenditures and operating expenses
4.6
(2.8)
—
Impact of updates to salvage and depreciation rates (46.8) (40.6) — Customer Rate Relief - Future income taxes 83.1 — — Customer Rate Relief – CWIP in rate-base2 (42.1) (13.5) — Decrease in common equity ratio to 36% (17.4) (16.0) —
Compliance filing revenue requirement $ 684.9 $ 599.3 $ 607.0
1. In 2014 there is an additional impact of $1.6 million which has been addressed separately in deferral account applications. 2. Includes tax impacts as well as related returns.
*Totals may not add due to rounding

Page | 9
MANAGEMENT’S DISCUSSION AND ANALYSIS THREE AND SIX MONTHS ENDED JUNE 30, 2016 AND 2015
AltaLink updated and refiled its 2017-2018 GTA on August 4, 2016, to reflect the findings and conclusions of the AUC presented in the 2015-2016 GTA decision (3524-D01-2016) issued on May 9, 2016. We had previously filed the 2017-2018 GTA on February 16, 2016. However, on March 15, 2016, the AUC suspended the 2017-2018 GTA proceeding until a final decision on the 2015-2016 GTA is issued.
The table below summarizes the forecast transmission tariffs for 2017 and 2018:
2018 2017 Applied for (in millions of dollars) Return on equity $ 242.2 $ 231.8 Return on debt 206.6 195.4 Operating costs 180.1 175.7 Miscellaneous revenue offset (12.2) (9.1) Depreciation and amortization 372.8 350.3 Income taxes — —
Revenue requirement $ 989.5 $ 944.1 Refund of previously collected future income taxes — (90.9)
Transmission Tariff as originally applied for February 2016 989.5 853.2
Impacts of the 2015-2016 GTA decision: Change in common equity ratio and medium term notes
(20.9)
(16.9)
Remove refund of future income tax liability balance (7.1) 86.03 Update to 2015-2016 direct assigned capital 6.5 7.3 Update to salvage and depreciation rates (44.2) (42.5) Return to AFUDC accounting for 2012-2014 direct assigned capital 5.7 3.0 Update to 2017-2018 forecasts (17.5) (4.7) Settlement of self-insurance reserve balance — 0.6
Transmission Tariff as filed August 4, 2016 912.1 886.0
3 $ 90.9 million net of related impact to returns. * Totals may not add due to rounding
In the 2017-2018 GTA we propose lower depreciation rates for certain assets, which would further reduce transmission rates for customers by approximately $182 million over the 2017-2018 period. The total tariff relief for AltaLink’s customers approved in the 2015-2016 GTA and proposed in the 2017-2018 GTA amounts to approximately $597 million over the 2015-2018 period, as shown in the table below:
2018 2017 2016 2015 (in millions of dollars) Discontinuation of CWIP in rate-base $ 5 $ 7 $ 13 $ 69 Refund of previously collected CWIP in rate-base impact, net of related returns
— — 142 123
Discontinuation future income tax method and change to flow through in 2016
86 84 68 —
Increase in deemed common equity ratio — — — —
Total transmission tariff relief 91 91 223 192
Cumulative relief $ 597 $ 506 $ 415 $ 192
Page | 10
MANAGEMENT’S DISCUSSION AND ANALYSIS THREE AND SIX MONTHS ENDED JUNE 30, 2016 AND 2015
CWIP in Rate Base Relief In its Decision (3524-D01-2016) issued on May 9, 2016 regarding the 2015-2016 GTA, the AUC approved AltaLink’s tariff relief of approximately $415 million for 2015 and 2016, through the discontinuance of CWIP in-rate-base and a return to AFUDC accounting effective Jan 1, 2015, including the refund of $277 million previously collected as CWIP in-rate-base as part of AltaLink’s transmission tariffs during 2011-2014.
The AUC originally approved CWIP in rate base relief for AltaLink in Decision 2011-453, which set our 2011 and 2012 transmission tariffs. CWIP in rate base is an alternative approach, sometimes used in other regulatory jurisdictions, which allows AFUDC to be collected in current period tariff revenue. Subsequently, in Decision 2013-407, the AUC approved the continuance of CWIP in rate base relief for our 2013 and 2014 transmission tariffs. The additional cash flow derived from CWIP in rate base relief enabled us to maintain our “A” level credit ratings during our large construction program. Maintaining our credit ratings enabled us to access the capital markets to finance our construction program and to do so at a cost that was favourable to ratepayers.
Income Taxes and Future Income Tax Relief In the AUC’s Decision 3524-D01-2016 issued on May 9, 2016, AltaLink’s request to apply the future income tax (FIT) method for calculating income taxes for 2015 and the flow-through method for calculating income taxes for 2016 was approved, resulting in tariff relief of about $68 million dollars for 2016. The AUC did not approve AltaLink’s proposal to refund FIT already collected in revenue during 2015 and prior years. To date, we have deducted future income taxes collected from our regulatory rate base in calculating our tariff requirement. We will continue to do this with the balance accumulated to date, however, the balance will not grow as a result of transition to the flow-through method.
2016 Generic Cost of Capital Proceeding During May and June 2016, an oral hearing related to the 2016 GCOC proceeding took place and a decision is expected later this year. In January and May 2016, we filed expert and company rebuttal evidence in relation to the April 30, 2015 AUC initiated GCOC proceeding to set the deemed capital structures and generic returns for 2016 and 2017. In March 2016, intervenors filed their expert evidence proposing a range of 7% to 7.5% return on equity, on a recommended equity component of 35% for AltaLink. AltaLink’s external rate of return expert evidence proposes 9% to 10.5% return on equity, on a recommended equity component of 40%, compared to the placeholder return on equity of 8.3% on a 36% equity component. The fair return and equity thickness recommended reflect the concerns noted by rating agencies and other members of the financial community regarding the increased business risks of utilities in Alberta.
Deferral Account Reconciliation Application On June 6, 2016, the AUC issued Decision 3585-D03-2016 in relation to the 2012-2013 Deferral Accounts Reconciliation Application. Through its Decision, the AUC has approved $1,862 million of the total $1,977 million of capital projects included in the application. Project costs of $109 million were deferred to a future hearing. The remaining non-material differences relate to small disallowances which we expect to recover from third party vendors.
AltaLink is directed to refile its 2012-2013 deferral accounts reconciliation application to reflect the findings, conclusions and directions arising from this decision on or before August 15, 2016.
EPCM Rates In its issued decision on June 6, 2016, the AUC approved the EPCM rates applied for as part of AltaLink’s 2012-2013 DACDA filing as prudent.
In its November 2013 decision pertaining to AltaLink’s 2013-2014 GTA (Decision 2013-407), the AUC directed us to re-forecast the capital project expenditures for 2013 and 2014 EPCM services to reflect a two times labour multiplier and other approved mark-ups. We requested approval of the capital project expenditures, including the new competitively bid EPCM rates, in our 2012-2013 direct assigned capital deferral account (“DACDA”) filing, in relation to which additional evidence supporting the new EPCM rates was filed in 2015.
2013 Generic Cost of Capital The Alberta utilities have discontinued the Leave to Appeal, which was originally filed on April 21, 2015, relating to the 2013 GCOC Decision.

Page | 11
MANAGEMENT’S DISCUSSION AND ANALYSIS THREE AND SIX MONTHS ENDED JUNE 30, 2016 AND 2015
On March 23, 2015, the AUC issued Decision 2191-D01-2015 regarding cost of capital matters applicable to all electricity and natural gas utilities under its jurisdiction, including us (“Alberta utilities”). In its decision, the AUC set a deemed capital structure for each utility and prescribed a generic rate of return on common equity to be applied against the common equity component of the deemed capital structures of all Alberta utilities under the AUC’s jurisdiction. The AUC decreased the generic rate of return on common equity applicable to all utilities from 8.75% to 8.30%, and decreased our deemed common equity from 37% to 36%, retroactively to January 1, 2013. The GCOC Decision reduced the revenue that we had previously recognized for 2013 and 2014 by approximately $11 million and $16 million, respectively. We did not expect these reductions for 2013 and 2014 as the AUC had previously approved higher ratios as placeholders for these periods.
Placeholder Approved Approved Approved
Deemed capital structure and generic returns 2016 2015 2014 2013
Deemed capital structure
Common equity ratio 36.00% 36.00% 36.00% 36.00%
Debt ratio 64.00% 64.00% 64.00% 64.00%
Generic returns
Return on equity 8.30% 8.30% 8.30% 8.30%
Utility Asset Disposition Appeals On April 21, 2016, a decision from the Supreme Court of Canada (SCC) denied the leave application filed jointly by AltaLink, Epcor and Enmax, appealing the September 18, 2015 Alberta Court of Appeal’s decision related to the November 2013 AUC Utility Asset Disposition (UAD) decision.
In November 2013, the AUC issued its UAD Decision in which it concluded, amongst other things, that in the case of the extraordinary retirement of an asset before it is fully depreciated, under or over recovery of capital investment is for the account of the utility and its shareholders.
Southwest Project Audit On January 20, 2016, the AUC released its final decision on our July 30, 2012 application for approval of, among other matters, the reconciliation of certain deferral accounts for the years 2010 and 2011 (2010-2011 DACDA), including the Southwest Transmission Development project (SW Project). The decision found AltaLink acted prudently on all accounts and all amounts were approved as requested.
Other AUC Decisions In the 2015-16 GTA proceeding, AltaLink submitted that it has concerns about regulatory lags that exist with respect to DACDA applications, GTAs and GCOC applications and that it opposed any process that would result in delays in filing applications. AltaLink made clear that it intends to file a combined DACDA application for the years 2014 and 2015 in either June or July 2016. In the 2012-2013 DACDA decision, the AUC directed AltaLink to ensure there is no less than 6 months separation between the filing of its GTA and its DACDA applications and that AltaLink may not file its next DACDA application until at least 6 months have elapsed from the time AltaLink files its changes or updates to the 2017-18 GTA. The AUC also directed AltaLink to file its 2014 and 2015 DACDA applications separately and in full accordance with additional time restrictions set out above. We believe these directions will further delay regulatory decisions making it more likely that AltaLink will have to manage expenditures without knowing our approved tariff revenue, delay the prudency assessment of capital expenditures, and may delay our recovery of balances owed to us.
On March 30, 2015, the AUC issued Decision 3532-D01-2015, approving our application exempting us from the requirement to obtain the AUC’s approval prior to issuing Medium-Term Notes in 2015 and 2016 for an aggregate principal amount of up to $2.0 billion.
Other AUC Initiatives On March 21, 2016, a number of interested parties including AltaLink, filed written submissions in relation to a generic income tax proceeding initiated by the AUC on July 30, 2015. The AUC conducted a stakeholder consultation meeting in May 2016 and is expected to advise on next steps.
Page | 12
MANAGEMENT’S DISCUSSION AND ANALYSIS THREE AND SIX MONTHS ENDED JUNE 30, 2016 AND 2015
The generic proceeding addresses issues concerning income tax methodologies used in revenue requirement calculations for regulated utilities in Alberta. AltaLink recommended the continuation of the deemed income tax approach to determine regulatory income taxes and the use of the flow-through method absent any special circumstances. The scope of the proceeding includes income tax methods or treatments, income tax deferral accounts, implications for those utilities which are using performance-based regulation and other matters raised by the parties participating in the proceeding.
Potential Impact of Regulatory Decisions on Credit Ratings On February 19, 2016, S&P raised the ratings on both AltaLink, L.P. and AltaLink Investments, L.P. to ‘A’ solely as a consequence of an upgrade to AltaLink’s parent company, Berkshire Hathaway Energy Company and the application of S&P’s group rating methodology. S&P noted that the stand-alone credit profiles of AltaLink, L.P. and AltaLink Investments, L.P. are unchanged at ‘a-‘ and ‘bbb+’ respectively and confirmed the business risk profiles of AltaLink, L.P. and AltaLink Investments, L.P. are unchanged at ‘excellent’.
In a rating report dated November 6, 2015, DBRS Limited (DBRS) viewed the quality of the regulatory regime in Alberta as still being above average in North America as a result of the high level of cost certainty and downside protection under normal operating conditions. These benefits mitigate negative effects from lower deemed return on equity and equity thickness ratios approved in the GCOC Decision in March 2015 and the dismissal of Alberta’s utilities’ appeal of the UAD Decision to the Alberta Court of Appeal in September 2015.
In a utility sector briefing dated April 21, 2015, S&P indicated that the regulatory framework in Alberta was on a negative trend from the current level of “Strong”. On April 23, 2015, S&P issued a generic report which elaborated on how their assessment of utility regulatory advantage is one of the most important factors in their credit analysis of regulated utilities. If its assessment of regulatory advantage is ultimately downgraded, S&P indicated that the credit ratings of utilities regulated by the AUC could be downgraded unless their credit metrics exceeded minimum levels set forth in their ratings methodology.
Major Capital Projects
Transmission Planning and Development
For details on transmission planning and development in Alberta, please refer to the “Overview of the Electricity Industry in Alberta”, “Transmission Planning and Development”, “Our Transmission Facilities” and “Major Capital Projects” sections of our MD&A for the year ended December 31, 2015.
In November 2015 the AESO finalized and made available the 2015 Long-Term Transmission Plan (LTP). The AESO mandate is defined in the Electric Utilities Act and its regulations, and requires the AESO to assess both current and future needs of Alberta’s interconnected electrical system. The 2015 LTP is based on the AESO’s forecast of load and generation as documented in the 2014 Long Term Outlook (LTO). The AESO 2015 LTP recognizes the province’s economic outlook has changed significantly since then. Current economic conditions have resulted in slower provincial growth. In May 2016 the AESO finalized and made available the 2016 Long-Term Outlook (LTO). The 2016 LTO assumes Alberta’s economy and corresponding load growth will recover within the next few years and takes into account the Alberta government’s 2015 Climate Leadership Plan (CLP), which is in the process of being refined prior to becoming law.

Page | 13
MANAGEMENT’S DISCUSSION AND ANALYSIS THREE AND SIX MONTHS ENDED JUNE 30, 2016 AND 2015
Overview
The following table is an overview of the main projects currently in progress:
Project/ Description
Need Application
Facility Application
Status
Southern Alberta Transmission Reinforcement Large scale project to construct transmission lines and substations across southern Alberta to interconnect up to 2,700 MW of proposed wind generation projects.
Stage I AUC approved in 2009
All applications approved.
All projects complete.
Stage II AUC approved in 2009
Three applications approved.
Four projects pending direction from the AESO to proceed.
Ware Junction energized in 2013.
Blackie energized Q2 2016.
Medicine Hat scheduled for Q4 2016 energization.
Edmonton Region Transmission System Upgrade Debottleneck 240kV system for load growth and decommissioning of coal-fired generation.
AUC approved in 2009
All applications approved. Completion scheduled for Q4 2016.
Red Deer Region Transmission Development Reinforcement and enhancements of the transmission system in the central Alberta region.
AUC approved in 2012
All applications for construction approved.
Completion scheduled for 2017.
South and West of Edmonton Area Transmission Development Reinforcement to the 240 kV and 138 kV system for the South and West of Edmonton Area to alleviate reliability constraints.
AUC approved in 2014
One of two applications is approved.
Completion scheduled for Q4 2017.
Non-GAAP Financial Measures
We use certain financial metrics that are not defined under accounting principles generally accepted in Canada, i.e. IFRS.
These non-GAAP financial measures do not have any standardized meaning and therefore are unlikely to be comparable to similar measures presented by other companies.
For more details regarding our non-GAAP financial measures, please refer to the “Non-GAAP Financial Measures” section of our MD&A for the year ended December 31, 2015.
Page | 14
MANAGEMENT’S DISCUSSION AND ANALYSIS THREE AND SIX MONTHS ENDED JUNE 30, 2016 AND 2015
Financial Position and Cash Flows
Financial Position
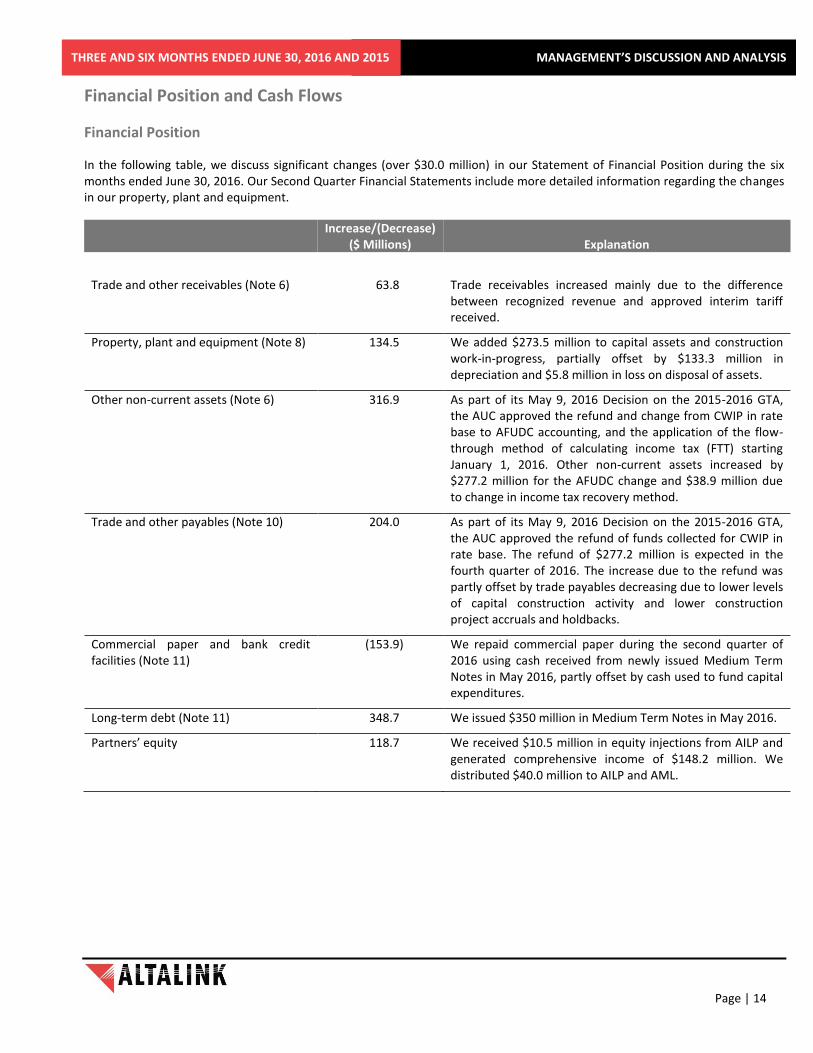
In the following table, we discuss significant changes (over $30.0 million) in our Statement of Financial Position during the six months ended June 30, 2016. Our Second Quarter Financial Statements include more detailed information regarding the changes in our property, plant and equipment.
Increase/(Decrease) ($ Millions)
Explanation
Trade and other receivables (Note 6) 63.8 Trade receivables increased mainly due to the difference between recognized revenue and approved interim tariff received.
Property, plant and equipment (Note 8) 134.5 We added $273.5 million to capital assets and construction work-in-progress, partially offset by $133.3 million in depreciation and $5.8 million in loss on disposal of assets.
Other non-current assets (Note 6) 316.9 As part of its May 9, 2016 Decision on the 2015-2016 GTA, the AUC approved the refund and change from CWIP in rate base to AFUDC accounting, and the application of the flow-through method of calculating income tax (FTT) starting January 1, 2016. Other non-current assets increased by $277.2 million for the AFUDC change and $38.9 million due to change in income tax recovery method.
Trade and other payables (Note 10) 204.0 As part of its May 9, 2016 Decision on the 2015-2016 GTA, the AUC approved the refund of funds collected for CWIP in rate base. The refund of $277.2 million is expected in the fourth quarter of 2016. The increase due to the refund was partly offset by trade payables decreasing due to lower levels of capital construction activity and lower construction project accruals and holdbacks.
Commercial paper and bank credit facilities (Note 11)
(153.9) We repaid commercial paper during the second quarter of 2016 using cash received from newly issued Medium Term Notes in May 2016, partly offset by cash used to fund capital expenditures.
Long-term debt (Note 11) 348.7 We issued $350 million in Medium Term Notes in May 2016.
Partners’ equity 118.7 We received $10.5 million in equity injections from AILP and generated comprehensive income of $148.2 million. We distributed $40.0 million to AILP and AML.
Page | 15
MANAGEMENT’S DISCUSSION AND ANALYSIS THREE AND SIX MONTHS ENDED JUNE 30, 2016 AND 2015
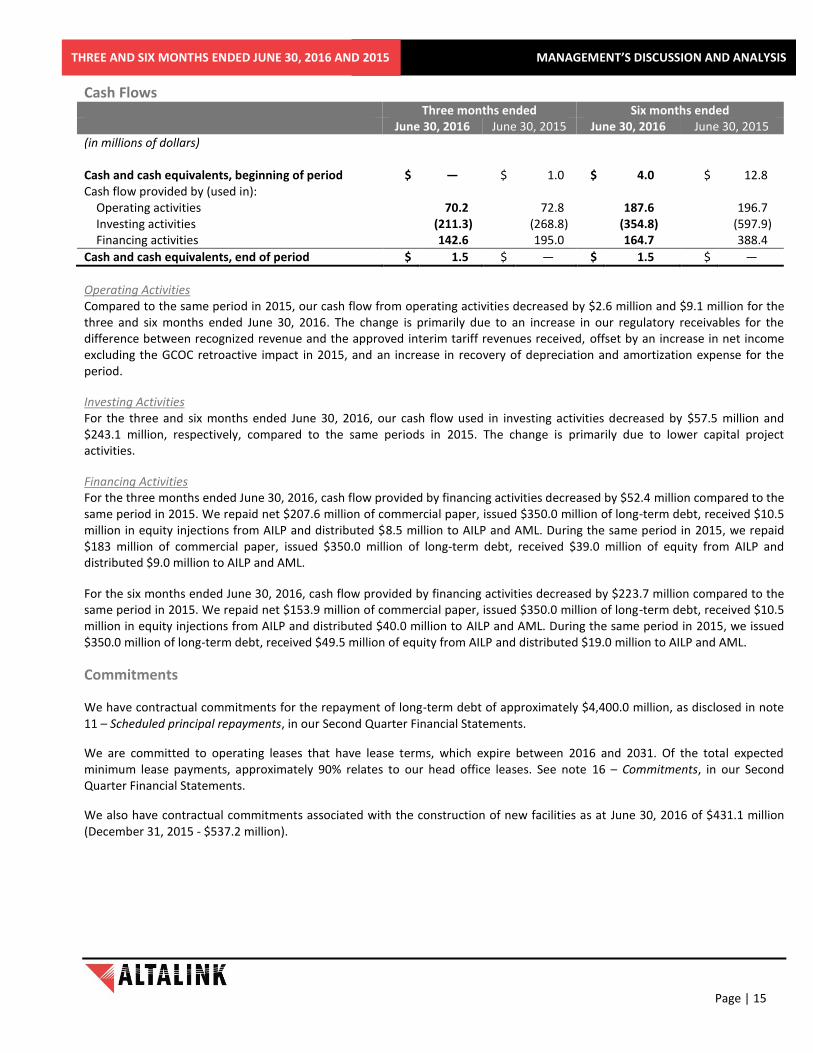
Cash Flows Three months ended Six months ended June 30, 2016 June 30, 2015 June 30, 2016 June 30, 2015 (in millions of dollars) Cash and cash equivalents, beginning of period $ — $ 1.0 $ 4.0 $ 12.8 Cash flow provided by (used in): Operating activities 70.2 72.8 187.6 196.7 Investing activities (211.3) (268.8) (354.8) (597.9) Financing activities 142.6 195.0 164.7 388.4
Cash and cash equivalents, end of period $ 1.5 $ — $ 1.5 $ —
Operating Activities Compared to the same period in 2015, our cash flow from operating activities decreased by $2.6 million and $9.1 million for the three and six months ended June 30, 2016. The change is primarily due to an increase in our regulatory receivables for the difference between recognized revenue and the approved interim tariff revenues received, offset by an increase in net income excluding the GCOC retroactive impact in 2015, and an increase in recovery of depreciation and amortization expense for the period.
Investing Activities For the three and six months ended June 30, 2016, our cash flow used in investing activities decreased by $57.5 million and $243.1 million, respectively, compared to the same periods in 2015. The change is primarily due to lower capital project activities.
Financing Activities For the three months ended June 30, 2016, cash flow provided by financing activities decreased by $52.4 million compared to the same period in 2015. We repaid net $207.6 million of commercial paper, issued $350.0 million of long-term debt, received $10.5 million in equity injections from AILP and distributed $8.5 million to AILP and AML. During the same period in 2015, we repaid $183 million of commercial paper, issued $350.0 million of long-term debt, received $39.0 million of equity from AILP and distributed $9.0 million to AILP and AML.
For the six months ended June 30, 2016, cash flow provided by financing activities decreased by $223.7 million compared to the same period in 2015. We repaid net $153.9 million of commercial paper, issued $350.0 million of long-term debt, received $10.5 million in equity injections from AILP and distributed $40.0 million to AILP and AML. During the same period in 2015, we issued $350.0 million of long-term debt, received $49.5 million of equity from AILP and distributed $19.0 million to AILP and AML.
Commitments
We have contractual commitments for the repayment of long-term debt of approximately $4,400.0 million, as disclosed in note 11 – Scheduled principal repayments, in our Second Quarter Financial Statements.
We are committed to operating leases that have lease terms, which expire between 2016 and 2031. Of the total expected minimum lease payments, approximately 90% relates to our head office leases. See note 16 – Commitments, in our Second Quarter Financial Statements.
We also have contractual commitments associated with the construction of new facilities as at June 30, 2016 of $431.1 million (December 31, 2015 - $537.2 million).
Page | 16
MANAGEMENT’S DISCUSSION AND ANALYSIS THREE AND SIX MONTHS ENDED JUNE 30, 2016 AND 2015
Liquidity and Capital Resources
Liquidity
We generally issue commercial paper to finance our day-to-day cash requirements. The commercial paper program, together with our two lines of credit and anticipated long-term debt issuance, provides us with sufficient liquidity to finance our planned operations and capital projects.
The aggregate of our bank credit facilities at June 30, 2016 was $825.0 million (December 31, 2015 - $825.0 million). The $750.0 million commercial paper backstop facility provides support to our commercial paper program, under which $295.3 million (December 31, 2015 – $449.1 million) was outstanding as at June 30, 2016. All bank credit facilities may be used for general corporate purposes. As at June 30, 2016, we had approximately $520.9 million of liquidity remaining under those facilities. We consider our liquidity arrangements to be adequate to accommodate our expected capital expenditures and working capital requirements over the next few years.
The total issuance under the $2,000.0 million Short Form Base Shelf Prospectus as at June 30, 2016 was $700.0 million. The Short Form Base Shelf Prospectus expires in July 2017.
We plan to finance our projected capital investments, working capital requirements and any maturities of long-term debt through a prudent combination of cash flow from operating activities, new long-term debt, and equity contributions from AILP.
We use short-term interest-bearing instruments issued by highly rated counterparties to invest temporary cash balances and amounts we receive from customers in advance of construction and operating and maintenance charges. We remit to the individual customers all investment income related to deposits received from those customers for construction projects and retain investment income we earn on deposits received from customers for future operating and maintenance costs.
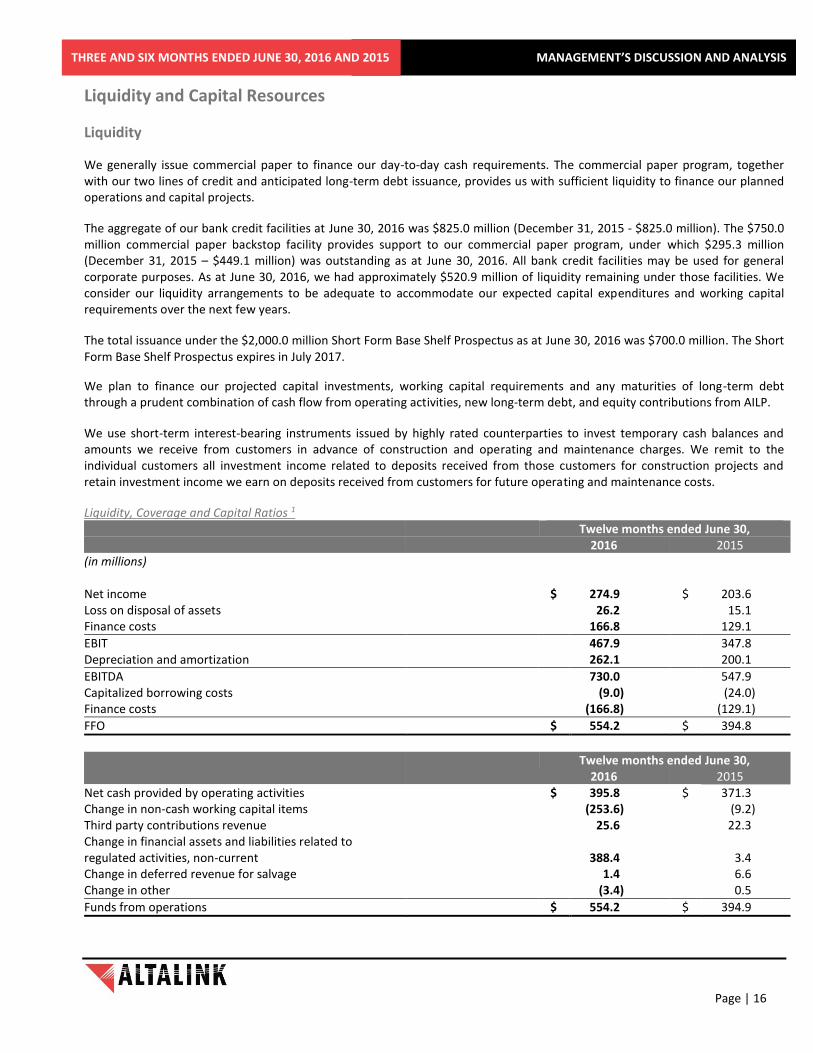
Liquidity, Coverage and Capital Ratios 1 Twelve months ended June 30, 2016 2015 (in millions) Net income $ 274.9 $ 203.6 Loss on disposal of assets 26.2 15.1 Finance costs 166.8 129.1
EBIT 467.9 347.8 Depreciation and amortization 262.1 200.1
EBITDA 730.0 547.9 Capitalized borrowing costs (9.0) (24.0) Finance costs (166.8) (129.1)
FFO $ 554.2 $ 394.8
Twelve months ended June 30, 2016 2015 Net cash provided by operating activities $ 395.8 $ 371.3 Change in non-cash working capital items (253.6) (9.2) Third party contributions revenue 25.6 22.3 Change in financial assets and liabilities related to regulated activities, non-current 388.4 3.4 Change in deferred revenue for salvage 1.4 6.6 Change in other (3.4) 0.5
Funds from operations $ 554.2 $ 394.9
Page | 17
MANAGEMENT’S DISCUSSION AND ANALYSIS THREE AND SIX MONTHS ENDED JUNE 30, 2016 AND 2015
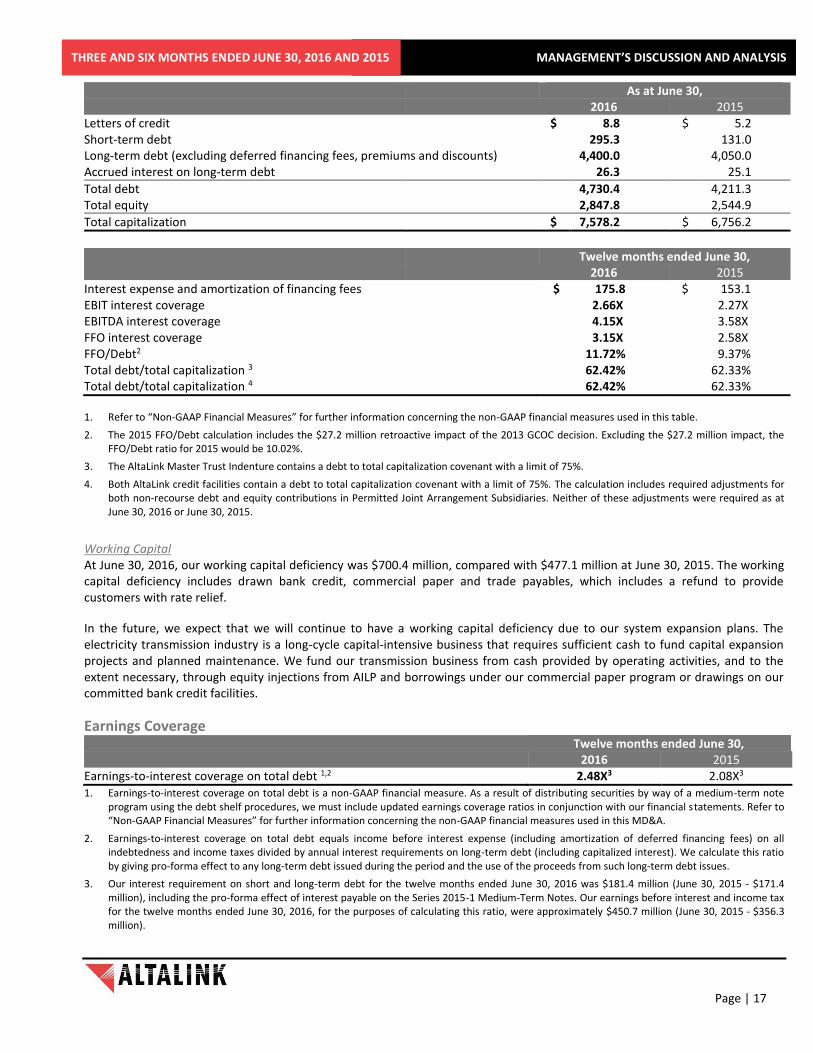
As at June 30, 2016 2015 Letters of credit $ 8.8 $ 5.2 Short-term debt 295.3 131.0 Long-term debt (excluding deferred financing fees, premiums and discounts) 4,400.0 4,050.0 Accrued interest on long-term debt 26.3 25.1
Total debt 4,730.4 4,211.3 Total equity 2,847.8 2,544.9
Total capitalization $ 7,578.2 $ 6,756.2
Twelve months ended June 30, 2016 2015 Interest expense and amortization of financing fees $ 175.8 $ 144.6
$ 153.1 $ 144.6
EBIT interest coverage 2.66X 2.27X EBITDA interest coverage 4.15X 3.58X FFO interest coverage 3.15X 2.58X FFO/Debt2 11.72% 9.37% Total debt/total capitalization 3 62.42% 62.33% Total debt/total capitalization 4 62.42% 62.33% 1. Refer to “Non-GAAP Financial Measures” for further information concerning the non-GAAP financial measures used in this table.
2. The 2015 FFO/Debt calculation includes the $27.2 million retroactive impact of the 2013 GCOC decision. Excluding the $27.2 million impact, the FFO/Debt ratio for 2015 would be 10.02%.
3. The AltaLink Master Trust Indenture contains a debt to total capitalization covenant with a limit of 75%.
4. Both AltaLink credit facilities contain a debt to total capitalization covenant with a limit of 75%. The calculation includes required adjustments for both non-recourse debt and equity contributions in Permitted Joint Arrangement Subsidiaries. Neither of these adjustments were required as at June 30, 2016 or June 30, 2015.
Working Capital At June 30, 2016, our working capital deficiency was $700.4 million, compared with $477.1 million at June 30, 2015. The working capital deficiency includes drawn bank credit, commercial paper and trade payables, which includes a refund to provide customers with rate relief.
In the future, we expect that we will continue to have a working capital deficiency due to our system expansion plans. The electricity transmission industry is a long-cycle capital-intensive business that requires sufficient cash to fund capital expansion projects and planned maintenance. We fund our transmission business from cash provided by operating activities, and to the extent necessary, through equity injections from AILP and borrowings under our commercial paper program or drawings on our committed bank credit facilities.
Earnings Coverage Twelve months ended June 30, 2016 2015 Earnings-to-interest coverage on total debt 1,2 2.48X3 2.08X3 1. Earnings-to-interest coverage on total debt is a non-GAAP financial measure. As a result of distributing securities by way of a medium-term note
program using the debt shelf procedures, we must include updated earnings coverage ratios in conjunction with our financial statements. Refer to “Non-GAAP Financial Measures” for further information concerning the non-GAAP financial measures used in this MD&A.
2. Earnings-to-interest coverage on total debt equals income before interest expense (including amortization of deferred financing fees) on all indebtedness and income taxes divided by annual interest requirements on long-term debt (including capitalized interest). We calculate this ratio by giving pro-forma effect to any long-term debt issued during the period and the use of the proceeds from such long-term debt issues.
3. Our interest requirement on short and long-term debt for the twelve months ended June 30, 2016 was $181.4 million (June 30, 2015 - $171.4 million), including the pro-forma effect of interest payable on the Series 2015-1 Medium-Term Notes. Our earnings before interest and income tax for the twelve months ended June 30, 2016, for the purposes of calculating this ratio, were approximately $450.7 million (June 30, 2015 - $356.3 million).
Page | 18
MANAGEMENT’S DISCUSSION AND ANALYSIS THREE AND SIX MONTHS ENDED JUNE 30, 2016 AND 2015
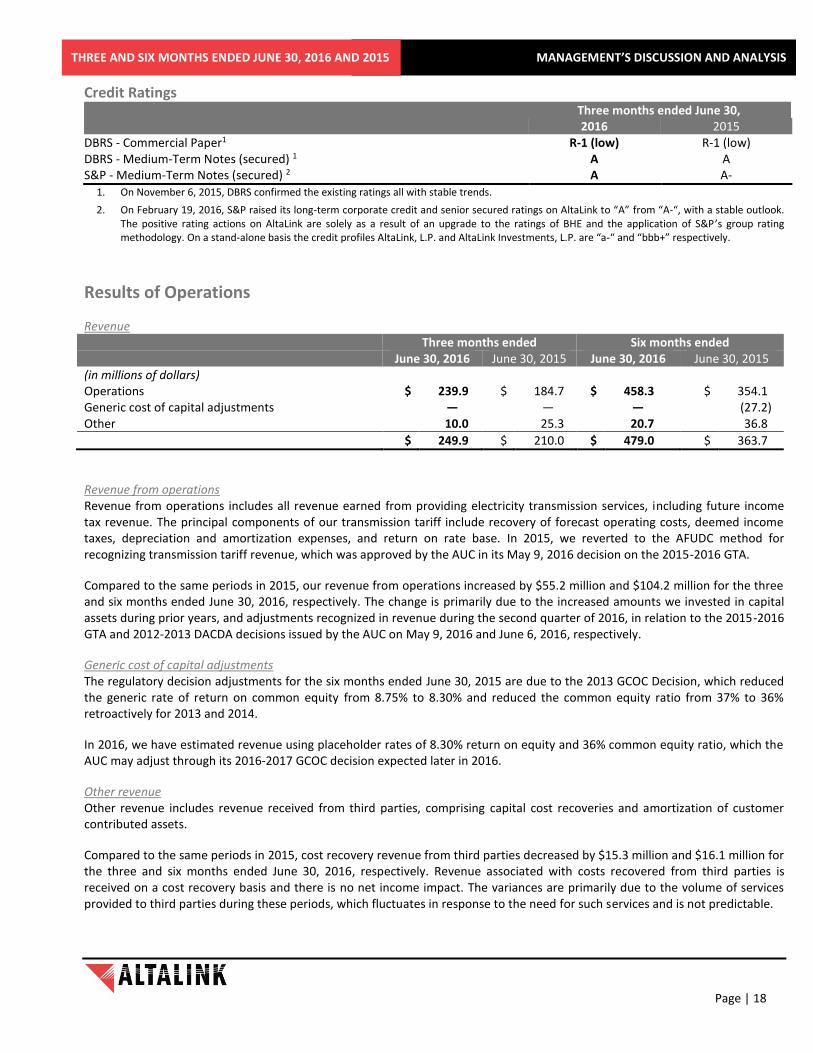
Credit Ratings Three months ended June 30, 2016 2015 DBRS - Commercial Paper1 R-1 (low) R-1 (low) DBRS - Medium-Term Notes (secured) 1 A A S&P - Medium-Term Notes (secured) 2 A A-
1. On November 6, 2015, DBRS confirmed the existing ratings all with stable trends.
2. On February 19, 2016, S&P raised its long-term corporate credit and senior secured ratings on AltaLink to “A” from “A-“, with a stable outlook. The positive rating actions on AltaLink are solely as a result of an upgrade to the ratings of BHE and the application of S&P’s group rating methodology. On a stand-alone basis the credit profiles AltaLink, L.P. and AltaLink Investments, L.P. are “a-“ and “bbb+” respectively.
Results of Operations
Revenue Three months ended Six months ended
June 30, 2016 June 30, 2015 June 30, 2016 June 30, 2015 (in millions of dollars) Operations $ 239.9 $ 184.7 $ 458.3 $ 354.1 Generic cost of capital adjustments — — — (27.2) Other 10.0 25.3 20.7 36.8
$ 249.9 $ 210.0 $ 479.0 $ 363.7
Revenue from operations Revenue from operations includes all revenue earned from providing electricity transmission services, including future income tax revenue. The principal components of our transmission tariff include recovery of forecast operating costs, deemed income taxes, depreciation and amortization expenses, and return on rate base. In 2015, we reverted to the AFUDC method for recognizing transmission tariff revenue, which was approved by the AUC in its May 9, 2016 decision on the 2015-2016 GTA.
Compared to the same periods in 2015, our revenue from operations increased by $55.2 million and $104.2 million for the three and six months ended June 30, 2016, respectively. The change is primarily due to the increased amounts we invested in capital assets during prior years, and adjustments recognized in revenue during the second quarter of 2016, in relation to the 2015-2016 GTA and 2012-2013 DACDA decisions issued by the AUC on May 9, 2016 and June 6, 2016, respectively.
Generic cost of capital adjustments The regulatory decision adjustments for the six months ended June 30, 2015 are due to the 2013 GCOC Decision, which reduced the generic rate of return on common equity from 8.75% to 8.30% and reduced the common equity ratio from 37% to 36% retroactively for 2013 and 2014.
In 2016, we have estimated revenue using placeholder rates of 8.30% return on equity and 36% common equity ratio, which the AUC may adjust through its 2016-2017 GCOC decision expected later in 2016.
Other revenue Other revenue includes revenue received from third parties, comprising capital cost recoveries and amortization of customer contributed assets.
Compared to the same periods in 2015, cost recovery revenue from third parties decreased by $15.3 million and $16.1 million for the three and six months ended June 30, 2016, respectively. Revenue associated with costs recovered from third parties is received on a cost recovery basis and there is no net income impact. The variances are primarily due to the volume of services provided to third parties during these periods, which fluctuates in response to the need for such services and is not predictable.
Page | 19
MANAGEMENT’S DISCUSSION AND ANALYSIS THREE AND SIX MONTHS ENDED JUNE 30, 2016 AND 2015
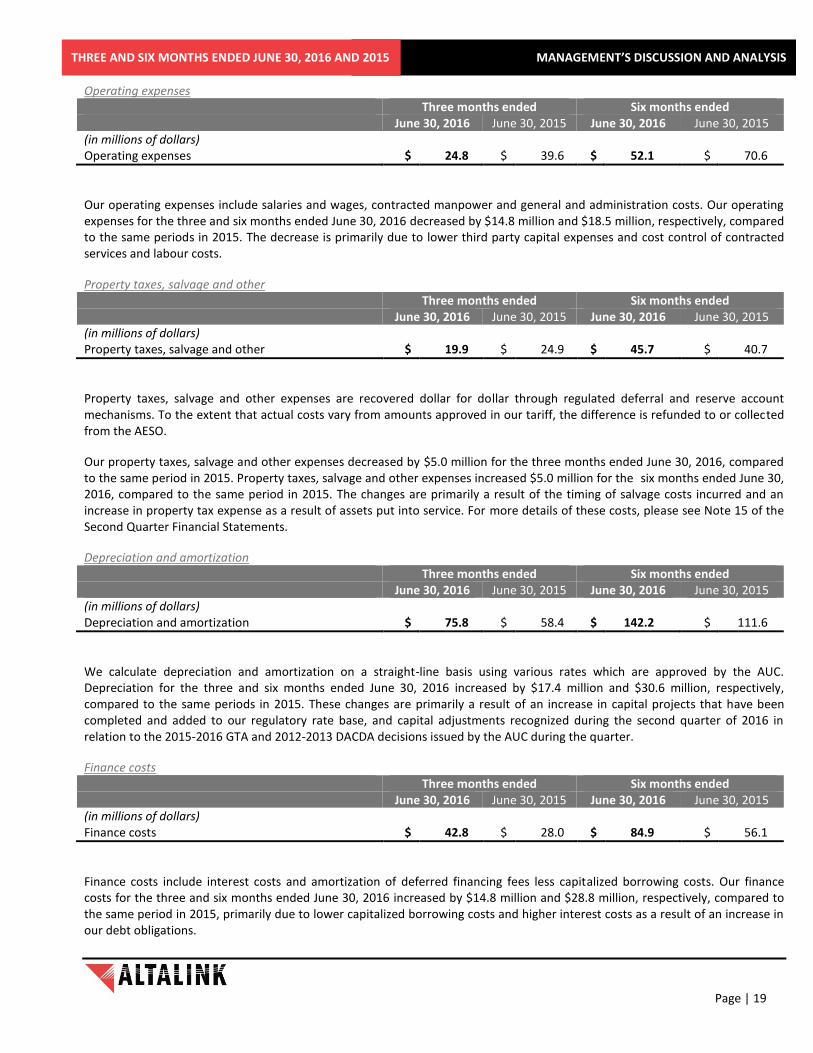
Operating expenses Three months ended Six months ended
June 30, 2016 June 30, 2015 June 30, 2016 June 30, 2015 (in millions of dollars) Operating expenses $ 24.8 $ 39.6 $ 52.1 $ 70.6
Our operating expenses include salaries and wages, contracted manpower and general and administration costs. Our operating expenses for the three and six months ended June 30, 2016 decreased by $14.8 million and $18.5 million, respectively, compared to the same periods in 2015. The decrease is primarily due to lower third party capital expenses and cost control of contracted services and labour costs.
Property taxes, salvage and other Three months ended Six months ended
June 30, 2016 June 30, 2015 June 30, 2016 June 30, 2015 (in millions of dollars) Property taxes, salvage and other $ 19.9 $ 24.9 $ 45.7 $ 40.7
Property taxes, salvage and other expenses are recovered dollar for dollar through regulated deferral and reserve account mechanisms. To the extent that actual costs vary from amounts approved in our tariff, the difference is refunded to or collected from the AESO.
Our property taxes, salvage and other expenses decreased by $5.0 million for the three months ended June 30, 2016, compared to the same period in 2015. Property taxes, salvage and other expenses increased $5.0 million for the six months ended June 30, 2016, compared to the same period in 2015. The changes are primarily a result of the timing of salvage costs incurred and an increase in property tax expense as a result of assets put into service. For more details of these costs, please see Note 15 of the Second Quarter Financial Statements.
Depreciation and amortization Three months ended Six months ended
June 30, 2016 June 30, 2015 June 30, 2016 June 30, 2015 (in millions of dollars) Depreciation and amortization $ 75.8 $ 58.4 $ 142.2 $ 111.6
We calculate depreciation and amortization on a straight-line basis using various rates which are approved by the AUC. Depreciation for the three and six months ended June 30, 2016 increased by $17.4 million and $30.6 million, respectively, compared to the same periods in 2015. These changes are primarily a result of an increase in capital projects that have been completed and added to our regulatory rate base, and capital adjustments recognized during the second quarter of 2016 in relation to the 2015-2016 GTA and 2012-2013 DACDA decisions issued by the AUC during the quarter.
Finance costs Three months ended Six months ended
June 30, 2016 June 30, 2015 June 30, 2016 June 30, 2015 (in millions of dollars) Finance costs $ 42.8 $ 28.0 $ 84.9 $ 56.1
Finance costs include interest costs and amortization of deferred financing fees less capitalized borrowing costs. Our finance costs for the three and six months ended June 30, 2016 increased by $14.8 million and $28.8 million, respectively, compared to the same period in 2015, primarily due to lower capitalized borrowing costs and higher interest costs as a result of an increase in our debt obligations.
Page | 20
MANAGEMENT’S DISCUSSION AND ANALYSIS THREE AND SIX MONTHS ENDED JUNE 30, 2016 AND 2015
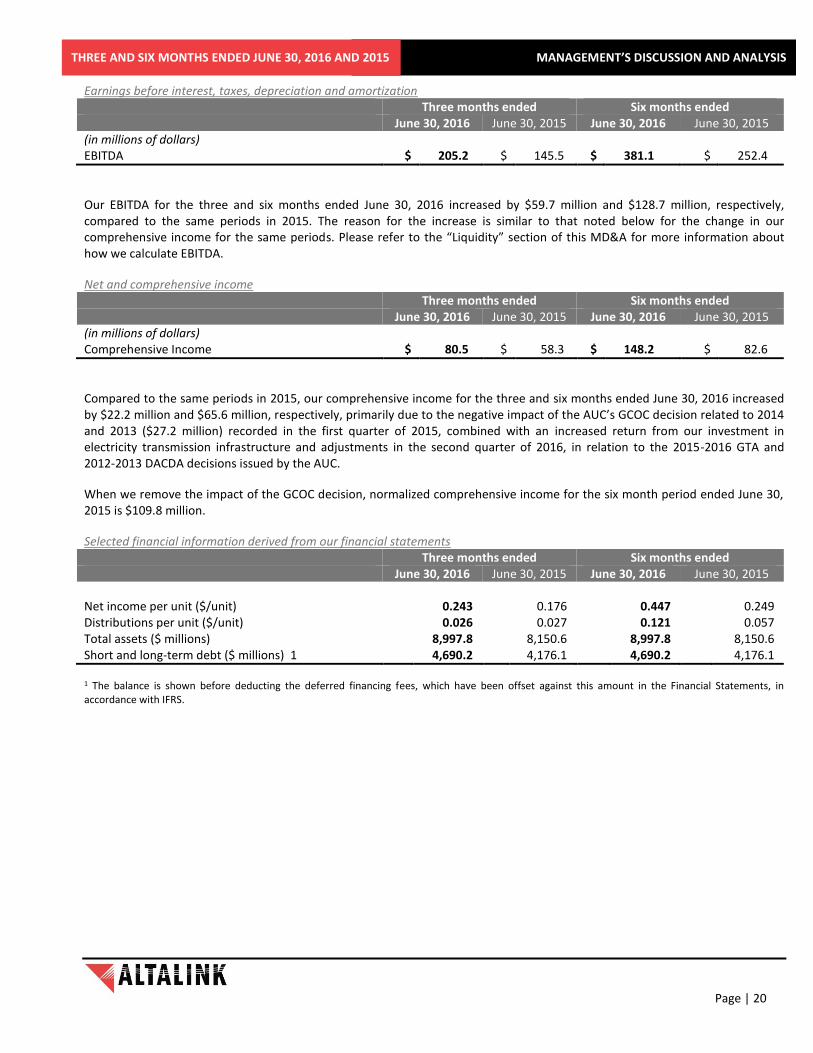
Earnings before interest, taxes, depreciation and amortization Three months ended Six months ended
June 30, 2016 June 30, 2015 June 30, 2016 June 30, 2015 (in millions of dollars) EBITDA $ 205.2 $ 145.5 $ 381.1 $ 252.4
Our EBITDA for the three and six months ended June 30, 2016 increased by $59.7 million and $128.7 million, respectively, compared to the same periods in 2015. The reason for the increase is similar to that noted below for the change in our comprehensive income for the same periods. Please refer to the “Liquidity” section of this MD&A for more information about how we calculate EBITDA.
Net and comprehensive income Three months ended Six months ended
June 30, 2016 June 30, 2015 June 30, 2016 June 30, 2015 (in millions of dollars) Comprehensive Income $ 80.5 $ 58.3 $ 148.2 $ 82.6
Compared to the same periods in 2015, our comprehensive income for the three and six months ended June 30, 2016 increased by $22.2 million and $65.6 million, respectively, primarily due to the negative impact of the AUC’s GCOC decision related to 2014 and 2013 ($27.2 million) recorded in the first quarter of 2015, combined with an increased return from our investment in electricity transmission infrastructure and adjustments in the second quarter of 2016, in relation to the 2015-2016 GTA and 2012-2013 DACDA decisions issued by the AUC.
When we remove the impact of the GCOC decision, normalized comprehensive income for the six month period ended June 30, 2015 is $109.8 million.
Selected financial information derived from our financial statements Three months ended Six months ended June 30, 2016 June 30, 2015 June 30, 2016 June 30, 2015 Net income per unit ($/unit) 0.243 0.176 0.447 0.249 Distributions per unit ($/unit) 0.026 0.027 0.121 0.057 Total assets ($ millions) 8,997.8 8,150.6 8,997.8 8,150.6 Short and long-term debt ($ millions) 1 4,690.2 4,176.1 4,690.2 4,176.1 1 The balance is shown before deducting the deferred financing fees, which have been offset against this amount in the Financial Statements, in accordance with IFRS.

Page | 21
MANAGEMENT’S DISCUSSION AND ANALYSIS THREE AND SIX MONTHS ENDED JUNE 30, 2016 AND 2015
Summary of Quarterly Financial Information Units Net income Revenue Net income outstanding per unit Quarter ended ($ millions) ($ millions) (millions) ($/unit) June 30, 2016 249.9 80.5 331.9 0.243 March 31, 2016 229.0 67.7 331.9 0.204 December 31, 2015 241.4 65.2 331.9 0.196 September 30, 2015 224.0 61.5 331.9 0.185 June 30, 2015 210.0 58.3 331.9 0.176 March 31, 2015 153.7 24.3 331.9 0.073 December 31, 2014 219.0 66.8 331.9 0.201 September 30, 2014 183.6 54.2 331.9 0.163 June 30, 2014 168.5 49.0 331.9 0.148 March 31, 2014 157.4 46.2 331.9 0.139 December 31, 2013 181.9 62.7 331.9 0.189 September 30, 2013 125.5 38.4 331.9 0.116
Risk Management
Our transmission business is subject to risks and uncertainties, including those described below. Our goal is to manage these risks to reasonably protect us from unacceptable outcomes including undesirable financial results. The reader should carefully consider these risk factors and uncertainties in addition to the other information contained in this MD&A, the corresponding financial statements, our Annual Information Form, press releases, material change reports and our other continuous disclosure documents. For more details regarding our risk factors, please refer to the “Risk Management” section of our MD&A for the year ended December 31, 2015.
Risk Controls and Other Mitigating Measures
We have instituted controls and other mitigating measures to manage the risks we face. Under our risk management program, we conduct annual risk evaluations to identify and assess our most significant risks and the strategies through which we manage them.
Insurance and Statutory Liability Protection
Our current insurance policies provide coverage for a variety of losses and expenses that could impact our business. This insurance coverage includes general liability, physical loss of or damage to property and boiler and machinery (including substations), property, terrorism, directors’ and officers’ liability, fiduciary liability, employment practices liability, crime, non-owned aircraft liability, and vehicle liability. We believe the extent of this coverage is prudent in the context of our transmission business and utility industry practice, and we anticipate that this coverage will be maintained.
Consistent with certain past AUC decisions, we do not carry insurance for loss of, or damage to, transmission lines, towers, poles, or physical damage to certain owned vehicles. It is not always possible or economically feasible to insure against all risks on our assets or for other exposure to liabilities, and we may decide not to carry insurance against certain risks as a result of high premiums or for other reasons. In accordance with past prudent industry practice and certain past AUC directives, we self insure against certain risks for which commercial insurance is not maintained. In the event of an uninsured loss greater than $100,000, we would apply to the AUC to recover the loss through increased funding to our self-insurance reserve or through an increased tariff. In Decision 2013-47 (UAD), the AUC has determined that in the case of an extraordinary retirement of a regulated asset, any under or over recovery of capital investment is for the account of the utility and its shareholders.

Page | 22
MANAGEMENT’S DISCUSSION AND ANALYSIS THREE AND SIX MONTHS ENDED JUNE 30, 2016 AND 2015
The Liability Protection Regulation limits our liability in the course of carrying out our duties, responsibilities and functions under the Electric Utilities Act to direct loss or damage arising from our negligence, wilful misconduct or breach of contract. Direct loss or damage is defined in the regulation to exclude loss of profits, loss of revenue, loss of production, loss of earnings, loss of contract or other indirect, special or consequential loss or damage.
Risk Factors and Uncertainties
Despite our initiatives in managing risks, there can be no assurance that one or more of them will not adversely affect our business. Our results of operations, financial position and performance and, accordingly, the value of our outstanding securities, could be adversely affected if we are unable to adequately control or mitigate the effects of such risks on our business.
The following are the more significant items that have an impact on our financial position and results of operations which have not materially changed during the three and six months ended June 30, 2016, compared to those disclosed in our MD&A for the year ended December 31, 2015.
Regulated operations
Project execution
Regulatory financial risk
Reliability
Government policies regarding the electricity industry
Capital resources
Labour relations
Environment, health and safety
Electric and magnetic fields
Annual impairment tests
Competition
Credit ratings
Cyber security
Labour Relations Approximately 60% of our employees are members of one of two labour unions, the United Utility Workers Association (UUWA), who have about 460 AltaLink members, or the International Brotherhood of Electrical Workers (IBEW), who have about 30 AltaLink members. These two unions have entered into collective bargaining agreements with our general partner. The provisions of these collective agreements affect the flexibility and efficiency of our business. We have a collective bargaining agreement with the IBEW, which is effective from January 1, 2014 to December 31, 2016.
We are currently operating under the last negotiated bargaining agreement with the UUWA, which expired December 31, 2015. We began bargaining with the UUWA in October, 2015, more recently through mediation. The two parties were able to reach agreements on most non-monetary items, but we have yet to reach agreement on a general wage increase.
We consider our relationships with these labour unions to be satisfactory; however, there can be no assurance that current relations will not change in negotiations or mediation, or that the collective bargaining agreements will not be renewed on acceptable terms. The current negotiations with the UUWA have resulted in a more strained relationship. Therefore, we are facing an increased risk of service interruptions arising from a potential labour dispute with the UUWA or increased labour costs. The inability to recover any significant difference between forecast and actual labour costs or the impacts of a labour disruption, could adversely affect our financial condition and results of our operations.

Page | 23
MANAGEMENT’S DISCUSSION AND ANALYSIS THREE AND SIX MONTHS ENDED JUNE 30, 2016 AND 2015
Transactions with Related Parties
In the normal course of business, we enter into various transactions with related parties. We record these transactions at exchange values based on normal commercial rates. AML employs all staff who provide administrative and operational services to our business on a cost reimbursement basis. We have indemnified AML for all associated expenses and liabilities.
Please refer to note 13 – Related party transactions in the Second Quarter Financial Statements for more details.
Legal Proceedings and Contingencies
From time to time we are subject to legal proceedings, assessments, claims and regulatory matters in the ordinary course of business.
In 2009, we were served with an action alleging that we and the Plaintiff had concluded a binding agreement for the sale to the Plaintiff of certain lands.
In 2014, we and another utility were served with a number of actions in relation to a grass fire that occurred in 2012. The Plaintiffs allege that damage was caused to cultivated and grazing land, fences and housing by a failure of transmission equipment and that there was soil erosion, loss of use of grazing land, and impacts to crop yield as a result of the fire. They claim that the fire was a result of negligence by us and another utility in operating, maintaining and repairing the transmission equipment.
In 2013 a road construction company damaged another utility’s transmission line, which was connected into AltaLink’s transmission facilities, causing loss of power. Two refinery owners filed statements of claim for damages against the construction company, who in turn filed third party claims against us and another utility.
The AUC approved a project to upgrade another utility’s transmission line that is located on land owned by a First Nation, which had refused to allow us to access its land. In December 2014, the First Nation filed a Statement of Claim against a number of parties, including us. The claim alleges trespass by us, and seeks damages. In March of 2016, the members of the council for the First Nation discontinued the action against all defendants and removed access restrictions; however, one individual certificate of possession holder did not discontinue their action.
We have a number of cost recovery applications that are currently, or will be, before the AUC, as part of the normal regulatory process for reviewing cost recovery applications before making a final decision on the prudence of such costs.
We have found instances of equipment, engineering or construction deficiencies following acceptance and energization of some assets, prior to expiration of warranty periods. We have claims processes in place to seek recovery for such deficiencies. Arbitration or litigation is expected to occur with respect to an ongoing matter currently in the claims process.
We have been advised that an AltaLink contractor has been sued by a subcontractor who seeks additional compensation in respect of work done by the subcontractor on an AltaLink Project. We are not named as a defendant in the action and have not been added as a third party to the action at this time; however, the contractor has advised us that it intends to add AltaLink as a third party to the legal proceedings.
We intend to defend ourselves vigorously against these claims. At this time, in the opinion of management, the occurrence of a future event confirming a contingent loss is not determinable.
Page | 24
MANAGEMENT’S DISCUSSION AND ANALYSIS THREE AND SIX MONTHS ENDED JUNE 30, 2016 AND 2015
Off Balance Sheet Arrangements
Disclosure is required of all off-balance sheet arrangements such as transactions, agreements or contractual arrangements with unconsolidated entities, structured finance entities, special purpose entities or variable interest entities that are reasonably likely to materially affect liquidity or the availability of, or requirements for, capital resources. We currently have no such off-balance sheet arrangements. Please refer to note 16 – Commitments in the Second Quarter Financial Statements for details of capital and lease commitments.
Critical Accounting Estimates
The preparation of our financial statements requires us to make estimates and assumptions that affect amounts reported in the financial statements and accompanying notes. As the AUC has not yet issued a final decision on AltaLink’s 2015-2016 GTA compliance filing, we estimated our revenue from operations based on our interpretation of the AUC’s Decision issued May 9, 2016, as incorporated into the compliance filing of the 2015-2016 GTA by AltaLink on July 19, 2016, as well as judgements based on historical experience with the Alberta regulatory process. The more significant estimates that have an impact on our financial condition and the results of our operations are disclosed in note 2 in our Second Quarter Financial Statements.
Accounting Changes
Please see note 4 in our Second Quarter Financial Statements for more details regarding our assessment of the impact on our financial statements of adopting the following new or revised standards.
New standards effective after 2016
IFRS 15 – Revenue from contracts with customers was issued by the IASB in May 2014 to provide a single revenue model to use in the recognition of revenue from contracts with customers. In July 2015 the IASB approved a one-year deferral of the effective date of IFRS 15 to January 1, 2018. In June 2016 the IASB issued Clarification to IFRS 15 Revenue from Contracts with Customers. We are evaluating the impact of this standard on our financial statements.
In July 2014, the IASB issued IFRS 9 – Financial instruments, which is effective for financial periods beginning on or after January 1, 2018. We are evaluating the impact of this standard on our financial statements.
In January 2016, the IASB issued IFRS 16 – Leases, which is effective for financial periods beginning on or after January 1, 2019, with earlier application permitted if IFRS 15 is also applied at the same time. The Partnership is evaluating the impact of this standard on its financial statements.
In January 2016, the IASB issued amendments to IAS 7 – Statement of cash flows that are effective for financial periods beginning on or after January 1, 2017. These are relatively minor amendments and the Partnership is evaluating the impact of these amendments on its financial statements.
Update on the rate-regulated project
At the IASB meetings in July 2015, the Board considered that a key to developing a standard for the recognition of rate-regulated activities is to understand that there are three inter-connected relationships involved, i.e. between:
The rate-regulated entity and its customers.
The rate-regulated entity and the regulators.
The rate-regulator and the entity’s customers.
The Board agreed that the development of another Discussion Paper would be the most effective way to progress this project. IASB staff plan to develop the paper including possible accounting models to recognize rate-regulated activities in IFRS financial statements.
Page | 25
MANAGEMENT’S DISCUSSION AND ANALYSIS THREE AND SIX MONTHS ENDED JUNE 30, 2016 AND 2015
Forward Looking Information
This MD&A contains certain statements or disclosures that may constitute forward-looking information under applicable securities laws. All statements and disclosures, other than those of historical fact, which address activities, events, outcomes, results or developments that AltaLink anticipates or expects may or will occur in the future (in whole or in part) should be considered forward-looking information. In some cases, forward-looking information can be identified by terms such as ”anticipate”, ”believe”, “contemplate”, “continue”, “could”, “enable”, “expect”, “forecast”, “future”, “intends”, “may”, “plan”, “potential”, “will” or other comparable terminology. Forward-looking information presented in such statements or disclosures may, without limitation, relate to: applications to the AUC for approval of, among other things, AltaLink’s revenue requirements (including deferral and reserve accounts and prudency of all amounts added to rate base; capital structure and return-on-equity; financing plans; treatment of costs for applicable test periods including income taxes, operating expenses, depreciation, capital costs for direct assigned projects and maintenance programs, financing costs related to long-term debt and short-term borrowing, and projected growth in AltaLink’s rate base and assets under construction); transmission system expansion forecasts; the anticipated direct assignment of transmission development projects to AltaLink from the AESO pursuant to approved Need Applications or competitive bidding processes; the timing and development of transmission projects and the anticipated capital costs of such projects; business strategy, plans and objectives of management for future operations; forecast business results; the achievement of certain operational and performance measures and the resulting effect on compensation of executive officers; and the anticipated financial performance or condition of AltaLink.
Various factors or assumptions are typically applied in drawing conclusions or making the forecasts or projections set out in forward-looking information. These factors and assumptions include, but are not limited to:
no changes in the legislative and operating framework for Alberta’s electricity market that are adverse to AltaLink;
decisions from the AUC concerning outstanding tariff and other applications that are consistent with past regulatory practices and decisions and are obtained in a timely manner;
approved rates-of-return and deemed capital structures for AltaLink’s transmission business that are sufficient to foster a stable investment climate;
a stable competitive environment;
AltaLink obtaining sufficient capital on acceptable terms to finance its transmission system expansion and to pay maturing debt; and
no significant event occurring outside the ordinary course of business such as a natural disaster or other calamity.
These assumptions and factors are based on information currently available to AltaLink including information obtained by AltaLink from third-party industry analysts. In some occurrences, material assumptions and factors are presented or discussed elsewhere in this MD&A and in the AIF in connection with the statements or disclosures containing the forward-looking information. AltaLink cautions readers that the foregoing list of material factors and assumptions is not exhaustive.
The forward-looking information in statements or disclosures in this MD&A is based (in whole or in part) upon factors which may cause actual results, performance or achievements of AltaLink to differ materially from those contemplated (whether expressly or by implication) in the forward-looking information. These factors are based on information currently available to AltaLink including information obtained by AltaLink from third-party industry analysts. Actual results may differ materially from those predicted by such forward-looking statements. While AltaLink does not know what impact any of these differences may have, its business, results of operations, financial condition and its credit stability may be materially adversely affected. Factors that could cause actual results or outcomes to differ materially from the results expressed or implied by forward-looking statements include, among other things:
Page | 26
MANAGEMENT’S DISCUSSION AND ANALYSIS THREE AND SIX MONTHS ENDED JUNE 30, 2016 AND 2015
the risks associated with being subject to extensive regulation including risks associated with AUC action or inaction;
the risk that transmission projects are not directly assigned to AltaLink by the AESO or that AltaLink is not designated for filing a Facility Application;
the risk that AltaLink is not able to arrange sufficient, cost-effective financing to repay maturing debt and to fund capital expenditures and other obligations;
the risk that system expansion plans are delayed;
the risks that the actual costs of completing a transmission project significantly exceed estimated costs, or that the AUC determines actual costs of completing a project were not prudently incurred;
the risks to AltaLink’s facilities posed by severe weather, other natural disasters or catastrophic events and the limitations on AltaLink’s insurance coverage for losses resulting from these events;
the potential for service disruptions and increased costs if AltaLink fails to maintain and improve its aging asset base or experiences a cyber security attack;
the risks associated with forecasting AltaLink’s revenue requirements and the possibility that AltaLink could incur operational, maintenance or administrative costs above those included in AltaLink’s approved revenue requirement; and
the risk that transmission system expansion that is directed to AltaLink by the AESO becomes stranded and AltaLink’s recovery of the related costs is impaired.
AltaLink cautions readers that the above list of risk factors is not exhaustive. Other factors, which could cause actual results, performance or achievements of AltaLink to differ materially from those contemplated (whether expressly or by implication) in the forward-looking statements or other forward-looking information, are disclosed in the section entitled “RISK MANAGEMENT” in this MD&A, including the subsection entitled “RISK FACTORS AND UNCERTAINTIES”. Risk factors that could lead to such differences include, without limitation, legislative and regulatory developments that could affect costs or revenues, the speed and degree of competition entering the market, global capital markets conditions and activity, timing and extent of changes in prevailing interest rates, currency exchange rates, inflation levels and general economic conditions in geographic areas where AltaLink operates, results of financing efforts, changes in counterparty risk, and the impact of accounting standards issued by standard setters.
All forward-looking information is given as of August 5, 2016. AltaLink is not obligated to update or revise any forward-looking statements, whether as a result of new information, future events or otherwise, except as required by applicable laws. Because of these risks, uncertainties and assumptions, readers should not place undue reliance on these forward-looking statements. Any forward-looking information contained herein is expressly qualified by this statement.

Page | 27
MANAGEMENT’S DISCUSSION AND ANALYSIS THREE AND SIX MONTHS ENDED JUNE 30, 2016 AND 2015