Embed Size (px)
Citation preview

Life Cycle Cost & Emissions Model
Alternative Bus Technologies
Final Report
December 5, 2006
Submitted to:
Nicholas Institute for Environmental Policy Solutions Duke University Box 90328 Durham, NC 27708
Submitted by:
M.J. Bradley & Associates 1000 Elm Street, 2nd Floor Manchester, NH 03101


Life Cycle Cost & Emissions Model Alternative Bus Technologies
M.J. Bradley & Associates Final Report – December 2006 i
Table of Contents
ABSTRACT........................................................................................................................ 1 1. DESCRIPTION OF LIFE CYCLE COST & EMISSIONS MODEL ........................ 1
1.1 STRUCTURE OF THE MODEL................................................................................................................. 2 1.2 DATA INPUTS....................................................................................................................................... 2
1.2.1 Depot Baseline Data (Worksheet I1) .......................................................................................... 3 1.2.2 Annual Bus Costs (Worksheet I2) ............................................................................................... 3 1.2.3 Purchase & Overhaul Costs (Worksheet I3)................................................................................ 4 1.2.4 Depot Infrastructure Costs (Worksheet I4)................................................................................. 4
1.3 MODEL OUTPUTS................................................................................................................................. 6 1.3.1 Annual Costs (Worksheet O1)..................................................................................................... 6 1.3.2 Capital Costs (Worksheet O2) .................................................................................................... 7 1.3.3 Overhaul Costs Per Bus (Worksheet O3).................................................................................... 8 1.3.4 Total Life Cycle Costs (Worksheet O4)....................................................................................... 8 1.3.5 Life Cycle Emissions (Worksheet O5).......................................................................................... 8 1.3.6 Cost Emissions Summary (Worksheet O6)................................................................................. 10 1.3.7 CO2 Price (Worksheet O7) ........................................................................................................ 10 1.3.8 Articulated Vehicle Cost Comparison (Worksheet O8).............................................................. 11 1.3.8 Articulated Vehicle Emissions Comparison (Worksheet O9)..................................................... 11 1.3.6 Graphical Presentation of Output Data..................................................................................... 11 1.3.7 Interim Calculation Worksheets................................................................................................. 12
2. SOURCES OF DEFAULT ASSUMPTIONS ............................................................. 13 2.1 DEPOT BASELINE DATA(I1)............................................................................................................... 13
2.1.1 Fuel Costs ............................................................................................................................. 13 2.1.2 Annual Inflation.................................................................................................................... 15
2.2 ANNUAL BUS COSTS(I2).................................................................................................................... 15 2.2.1 Operator Costs ..................................................................................................................... 16 2.2.2 Annual Bus Maintenance Costs ............................................................................................ 16 2.2.3 Brake Reline Intervals and Costs.......................................................................................... 18 2.2.4 Annual DPF Cleaning .......................................................................................................... 18 2.2.5 Hybrid Battery Conditioning ................................................................................................ 19
2.3 PURCHASE & OVERHAUL COSTS ....................................................................................................... 19 2.4 DEPOT INFRASTRUCTURE COSTS ........................................................................................................ 22 2.5 DEVELOPMENT OF FUEL ECONOMY CURVES...................................................................................... 23 2.6 DEVELOPMENT OF EMISSIONS CURVES .............................................................................................. 28
REFERENCES ................................................................................................................. 35 APPENDIX A – Example of Life Cycle Cost & Emissions Model Run


Life Cycle Cost & Emissions Model Alternative Bus Technologies
M.J. Bradley & Associates Final Report - November 2006 E1
ABSTRACT This report documents the development of a Life Cycle Cost and Emissions Model to be used to evaluate the total cost of ownership and total exhaust emissions over the useful lives of transit buses with different types of propulsion systems.
Section 1 describes the structure of the model and details the calculations used in the model.
The model is designed such that a user can input virtually all of the cost and other assumptions required for the calculations, based on local or case-specific data. If such data is not available, the model includes default assumptions intended to represent “typical” US transit operations. The model is also designed to adjust bus fuel economy and exhaust emissions rates based on the bus’ duty cycle. Average in-service speed is used as the dependent variable to represent duty cycle.
Section 2 discusses the sources of the default assumptions, including the curves used to adjust fuel economy and emissions rates based on average speed.
Appendix A contains an example of the input and output sheets of the model using the default assumptions.


Life Cycle Cost & Emissions Model Alternative Bus Technologies
M.J. Bradley & Associates Final Report - December 2006 1
1. Description of Life Cycle Cost & Emissions Model
The life cycle cost and emissions model was developed to evaluate the total cost of ownership and total exhaust emissions over the useful lives of transit buses with different types of propulsion systems. Elements of total cost included in the model are:
bus purchase,
purchase/installation of required fueling infrastructure,
purchase/installation of required depot modifications and special tools,
annual operator labor,
annual bus maintenance and fuel costs,
annual maintenance and operating cost of required fueling infrastructure, depot modifications, and special tools, and
periodic bus overhaul costs.
The analysis does not include full overhead for management functions such as road supervision, procurement, etc.
Exhaust emissions presented in the model include:
Carbon Dioxide (CO2)
Greenhouse Gases (GHG)
Particulate Matter (PM)
Oxides of Nitrogen (NOx)
Non-Methane Hydrocarbons (NMHC)
Carbon Monoxide (CO)
The model was designed to be dynamic, such that major assumptions about all of the above cost elements can be changed as new information becomes available, or to conduct “what if” and sensitivity analyses. The model includes default assumptions for many cost elements, but also allows the user to input their own values for every major assumption, if location-specific information is available.
The model was set up to evaluate the differential costs and emissions of the following baseline bus and retrofit options:
Baseline Diesel (typical 1998-2001 diesel engine operated on either standard #2 or #1 diesel fuel or a “baseline” biodiesel fuel blend),
Biodiesel (baseline diesel operated on a second biodiesel fuel blend with higher biodiesel content),
DPF Retrofit (baseline diesel retrofit with a diesel particulate filter),
and the following propulsion technology options for new buses:

Life Cycle Cost & Emissions Model Alternative Bus Technologies
M.J. Bradley & Associates Final Report - December 2006 2
CNG (natural gas engine compliant with 2007 or 2010 EPA emission standards and compressed natural gas fuel system),
Clean Diesel (Diesel engine compliant with 2007 EPA emission standards)
Parallel Hybrid (parallel diesel hybrid-electric propulsion system including a diesel engine compliant with 2007 EPA emission standards)
Series Hybrid (series diesel hybrid-electric propulsion system including a diesel engine compliant with 2007 EPA emission standards)
The model also allows the user to specify up to four different diesel fuels for use in the buses with diesel engines: standard #2 highway diesel, standard #1 highway diesel, and two different blends of biodiesel fuel. The model allows the user to specify that any of these fuels will be used in the Baseline buses, DPF Retrofit buses and in new Clean Diesel, Parallel Hybrid and Series Hybrid buses to determine the combined effect of a fuel and technology change.
Some bus propulsion technologies require significant investments in new fueling infrastructure, depot modifications, and special tools. In the model the cost of these depot investments is amortized over the entire useful life of the investment, which in many cases is longer than the useful life of the buses.
One major feature of the model is that it adjusts the assumed fuel economy (MPG) and exhaust emissions rates (g/mi) for each technology option based on the user-input assumption about the bus’ duty cycle. The metric used for duty cycle is average speed (MPH) in service. As discussed below, the model uses a series of curves which were developed based on in-use and emissions testing data to make these adjustments.
The model is designed to analyze each retrofit and new bus technology option as applied to a 35-foot transit bus or a 40-foot transit bus, as specified by the user. The model will also compare costs and emissions for a fleet of these bus types to a fleet of higher-capacity 60-foot articulated buses, assuming that fewer of the larger buses will be required to provide the same seating capacity in service.
1.1 Structure of the Model The Life Cycle Cost Model is a spread sheet-based model developed using Microsoft Excel™. The model consists of a single Excel™ work book with twenty six worksheets. There are four data input worksheets (worksheets I1 – I4), nine output worksheets for the results of the calculations (worksheets O1 – O9), and eight output graphs which graphically summarize the results (worksheets G1-G8). When running the model all of these worksheets should be printed to document the results. The model also includes three interim calculation worksheets (worksheets C1 – C3) that are not meant to be printed, a worksheet with a brief description of the model, and a worksheet with instructions for using the model.
1.2 Data Inputs Four data input worksheets are used to input all of the major assumptions about capital and operating costs of the bus technologies analyzed by the model. These worksheets are described below.

Life Cycle Cost & Emissions Model Alternative Bus Technologies
M.J. Bradley & Associates Final Report - December 2006 3
1.2.1 Depot Baseline Data (Worksheet I1) This worksheet is used to input basic assumptions about the buses being analyzed, including: number of buses, average annual mileage per bus (mi), bus type (40-foot transit bus or 35-foot transit bus), and duty cycle (average speed), as well as the labor rate of bus operators and mechanics.
It is also used to input assumptions about current fuel costs for standard #2 and #1 diesel fuel, two different biodiesel fuel blends as specified by the user, and natural gas, as well as the net atmospheric CO2 emissions generated by biodiesel fuel on a percent biofuel basis1.
Finally, the worksheet is used to input financial assumptions used by the model, including: bus useful life (yrs), discount rate (%) for net present value calculations, and projected annual inflation assumptions for diesel fuel and natural gas separately, and for labor/materials.
As is the case with all of the input sheets, the default assumptions programmed into the model are shown at the bottom of the worksheet. These assumptions are used to make calculations when no data is otherwise entered by the user. Note that certain assumptions (such as in-service speed, number of buses, and annual mileage) must be input by the user as they are highly location-specific and there are no default assumptions that can be made for these parameters that would apply to a large percentage of transit bus operations.
1.2.2 Annual Bus Costs (Worksheet I2) This worksheet is used to input assumptions about the annual maintenance costs for each of the bus technologies analyzed. For each assumption locations to input both a high and a low value are provided to allow for calculation of a range of costs.
The user must select from a pull-down menu the type of fuel that will be used for each vehicle type. Either standard #2 diesel, #1 diesel, or one of the biodiesel blends (as specified in sheet I1) can be chosen for use in Baseline Buses. Either standard #2 diesel, #1 diesel or either of two biodiesel blends can be chosen for use in DPF Retrofit or new Clean Diesel and Hybrid bus types. Note that Biodiesel and CNG buses do not have a fuel selection pull down menu. The model assumes that retrofit Biodiesel buses always use the second biodiesel fuel blend specified (with higher biodiesel content) and that CNG buses always use natural gas fuel.
Other than fuel type, the only value that requires an input by the user is the annual base maintenance cost ($/mi) for the Baseline Buses. All other values can either be entered by the user or the model will use the default assumptions. The cost of front and rear brake relines are removed from these basic maintenance costs and calculated separately, based on assumptions about average mileage interval between relines, and average material cost and labor hours for the reline. This was done to highlight expected differences in brake lining life for the various technologies, based on differences in bus weight and the use of regenerative braking by hybrid buses.
1 For more information on how this value is used in emissions calculations see section 1.3.5.

Life Cycle Cost & Emissions Model Alternative Bus Technologies
M.J. Bradley & Associates Final Report - December 2006 4
Two other maintenance activities specific to one or more, but not all, of the analyzed technologies are also calculated separately based on additional assumptions. These are annual cleaning for diesel particulate filters (required with hybrid and clean diesel and DPF retrofit technologies) and hybrid traction battery conditioning (required for series hybrid buses with lead-acid batteries).
A location is provided to input a separate operator wage rate for each bus type in the event that operator wages differ for different bus technologies based on local policy. Operator wage expenditures are calculated based on the number of hours the vehicle is expected to be in-service (annual mileage divided by average speed) and therefore any daily hours for which operators are paid when they are not driving buses (lunch time, bus warm-time etc.) must be included by the user in the “non-driving paid hours” line.
1.2.3 Purchase & Overhaul Costs (Worksheet I3) This worksheet is used to input assumptions about the purchase and periodic overhaul costs for each of the bus technologies analyzed. For each assumption locations are provided to input both a high and a low value to allow for calculation of a range of costs.
Periodic overhaul costs are broken down into five categories: engine overhaul, transmission overhaul, CNG fuel system overhaul, hybrid system overhaul, and hybrid system battery replacement. For each, assumptions about the interval between required overhauls (mi) and the cost of an overhaul are required. The model assumes that these overhauls are periodic, and do not occur every year. Based on the annual mileage driven by each bus (Worksheet I1) and the overhaul interval, the model will put the full cost of overhaul for each system into the correct years throughout the bus’ useful life. The model also allows the user to specify (Worksheet I1) the number of years prior to bus retirement in which no overhauls will be completed (to ensure that the model does not assume a significant financial investment will be made in a bus just prior to retirement).
The user does not have to input any values on this page, as default assumptions have been provided for all parameters.
1.2.4 Depot Infrastructure Costs (Worksheet I4) This worksheet is used to input assumptions about the cost of purchase/installation for the fuel station, depot modifications, and special tools required for each of the bus technologies analyzed. For each assumption locations for both a high and a low value are provided to allow for calculation of a range of costs. For each item the user must also specify the useful life of the investment. This sheet also includes depot infrastructure maintenance assumptions, which are presented as a percentage of total depot costs spent annually for maintenance. Fuel station maintenance is not included here, as there are inputs for varying fuel station O&M in units of $/gallon or $/therm, as appropriate, on worksheet I1.
The model assumes that CNG buses will require installation of a CNG fuel station, while all other bus types will require installation of a diesel fuel station. In order for all technologies to be compared directly, users should input fueling station costs even for pre-existing stations, or alternatively enter $0 for all fuel station costs to disregard their effect on the total fleet costs (if a cell is left blank the model will use the default assumption, not “zero” for that parameter). The model also assumes that the use of CNG

Life Cycle Cost & Emissions Model Alternative Bus Technologies
M.J. Bradley & Associates Final Report - December 2006 5
buses in a depot will require modification of the depot heating and ventilation and electrical systems, and installation of a depot methane detection system and an overhead crane. It assumes that the use of hybrid buses will require expansion/modification of depot battery storage rooms to accommodate periodic maintenance and overhaul of hybrid bus battery packs, as well as installation of an overhead crane. The model assumes that no depot modifications or special tools are required for the other bus types2.
This worksheet also contains three cells in which the user can specify parameters for CNG fueling operations, including the desired maximum fill time per bus3 (minutes), daily total time available for fueling (hours) and whether CNG buses will be parked indoors or outdoors. Fill time and total fueling time are used to calculate the default cost of the CNG fueling station, while indoor vs. outdoor parking is used to determine the default cost of depot infrastructure modifications.
The default cost of a CNG station is assumed to include a fixed cost, and a variable cost based on the fuel flow rate capacity of the station (standard cubic feet per minute , SCFM) per equation 1:
CNG Fuel Station Cost = $200,000 + $800 x SCFM (equation 1)
In order to determine the required flow rate, first the total number of fueling nozzles required is calculated based on the number of buses (# bus), the desired amount of time required to refuel one bus (t fill), and the number of hours available daily for vehicle refueling (avail hrs). The following equation is used:
# Nozzles = )min(60.
)min(#
hrhrsavail
daytbus fill
×
× (equation 2)
This result is then rounded up to the nearest whole number to determine the number of nozzles required for the fueling station. Finally, total flow is calculated based on vehicle fuel economy, annual mileage, fill time and the energy content of natural gas.
=SCFM ×××
×
)min(312
126
dayt
DEGmiles
yrday
DEGscf
yrmiles
fill
# Nozzles (equation 3)
2 Diesel particulate filters (installed on hybrid, DPF retrofit and clean diesel buses) require annual cleaning using a special machine. If a depot were to do this cleaning in-house the cost of this machine would be included in infrastructure costs as a “special tool”. However, this model assumes that this cleaning will be outsourced to a third party, and all costs related to the cleaning machine are captured in the annual per-bus DPF cleaning charge (Worksheet I2). 3 This value should never be less than 5 minutes since faster fills are impractical.

Life Cycle Cost & Emissions Model Alternative Bus Technologies
M.J. Bradley & Associates Final Report - December 2006 6
Note that values should be chosen (and if necessary modified) strategically to minimize station cost within the constraints of bus operations. For example, for a small fleet (5 buses) and a fast fill time (5 minutes), the estimated station cost is over $1 million. However, by instead allowing 15 minutes per bus fill, this number is reduced by more than 50%. Likewise, a large fleet with a small number of daily fueling hours4 will yield a very high fueling station cost, which can be reduced by expanding the available hours for fueling each day. Obviously there are trade-offs between capital cost for the fuel station and on-going labor costs for fueling. These must be weighed for a specific situation.
Default infrastructure modification costs are also calculated for CNG vehicles based on whether the user indicates indoor or outdoor parking, via the following equations
For Indoor Parking:
Infrastructure Costs = $100,000 + $4,000/bus (equation 4)
For Outdoor Parking
Infrastructure Costs = $100,000 + $2,500/bus (equation 5)
The default cost of a diesel fuel station is calculated in a similar manner, using the following equation:
Diesel Fuel Station Cost = $20,000 + $1,000/bus (equation 6)
The user is required to enter the expected useful life (years) for each infrastructure investment on this page. The model amortizes the cost of these investments over their entire useful life, even if it is longer than the life of the buses.
1.3 Model Outputs Nine data output worksheets (O1 – O9) are used to show the results of calculations made by the model for each of the bus technologies analyzed. On each work sheet, for each cost category, low, average, and high results are shown, based on the relevant low and high assumptions entered on the input worksheets. Each output worksheet is described below.
1.3.1 Annual Costs (Worksheet O1) This worksheet shows the first year annual per-bus operator labor, maintenance, and fuel costs calculated by the model for each bus type, as well as the annual per-depot costs for maintenance of depot systems and special tools. The formulas used for calculating each category of cost are shown below: 4 For larger fleets which require more than one fueling nozzle, fill time becomes irrelevant as it is assumed that all of the vehicles must be fueled daily. In this case, available daily fueling hours becomes the driving variable, and the fuel station cost will not be significantly affected by changing the fill time per bus.

Life Cycle Cost & Emissions Model Alternative Bus Technologies
M.J. Bradley & Associates Final Report - December 2006 7
Per Bus Costs:
Operator Wages: ((mileage [mi/yr] ÷ avg speed [mi/hr]) + (312 [wk days/yr] x non-driving paid hours [hr/day])) x Operator Labor Rate [$/hr]
Annual maintenance: Maint Cost [$/mi] x mileage [mi/yr]
Annual brake relines: (mileage [mi/yr] ÷ interval [mi]) x (matl cost [$] + labor [hr] x mechanic labor rate [$/hr])
Annual DPF cleaning: cleaning cost [$/yr] x 1
Annual hybrid battery conditioning: (1 ÷ interval [yr]) x (labor [hr] x mechanic labor rate [$/hr])
Annual fuel commodity: fuel cost [$/gal] x mileage [mi/yr] ÷ FE [mi/gal]
Annual fuel commodity/compression (CNG): mileage [mi/yr] ÷ FE [mi/DEG] x cost [$/therm] x 1.32 [therm/DEG]
Depot Costs:
Depot Systems maintenance: Purchase Cost [$] x O&M annual %
Special tools maintenance: Purchase Cost [$] x O&M annual %
This sheet displays the estimated costs for the base year only, and therefore does not account for annual inflation rates.
1.3.2 Capital Costs (Worksheet O2) This worksheet shows the total capital costs required for bus purchase, fuel station installation, depot modifications, and purchase of special tools calculated by the model for each bus type. For each category these total costs for the depot are then amortized over the useful life of the investment in that category, to give an equivalent annual cost for that category. The cost of bus purchase is calculated for the entire fleet:
Bus Purchase: Vehicle Cost [$] x [# Buses]
Otherwise, no equations are necessary as the values are simply taken from the Capital Costs Input Sheet (I3).
Annualization of costs for each category is done using the loan payment function (PMT) in Excel™. This function uses the following arguments to calculate the level annual payments on a “loan” (the capital cost) over the term on the loan (useful life):
PV = present value of loan = capital cost [$]
FV = loan value at end of term = zero
INT = interest rate on loan = annual discount rate (%)
PER= period of loan = useful life [yr]

Life Cycle Cost & Emissions Model Alternative Bus Technologies
M.J. Bradley & Associates Final Report - December 2006 8
1.3.3 Overhaul Costs Per Bus (Worksheet O3) This worksheet shows the periodic total per-bus overhaul costs calculated by the model for each bus type. These costs are shown in the years in which they will be required, based on the entered assumptions about overhaul interval and annual bus mileage accumulation for least expensive (longest interval, smallest cost) and most expensive (shortest interval, greatest cost) overhaul schedules. This sheet accounts for annual inflation, so the values shown in years 2 – end of life will be larger than the costs entered on sheet I3.
For each overhaul category (engine, transmission, bus, CNG fuel system, hybrid system, hybrid battery replacement) costs are entered into the correct year separately in the Overhaul Calculations worksheet; only the total overhaul costs for each year for all six overhaul categories are shown in Worksheet O3.
This worksheet also calculates the net present value (NPV) of all periodic overhaul costs over the useful life of the bus, using the Excel™ NPV function. The discount rate used for this calculation is the discount rate entered on Worksheet I1.
1.3.4 Total Life Cycle Costs (Worksheet O4) This worksheet shows the net present value of total life cycle costs calculated by the model for each bus type over the defined useful life of the buses. These costs are shown separately for the entire depot fleet for the following categories of costs: Operator wages, annualized capital costs; bus overhaul costs, bus maintenance costs, bus fuel costs, and depot costs.
For all NPV calculations the appropriate annual cost is taken from Worksheets O1 – O3 and entered into the NPV function once for every year in the defined bus useful life (ie. if bus useful life = 15 years, the NPV is calculated for a stream of 15 annual payments). The annual values account for inflation, so each payment is a slight percentage higher than the previous, depending on what value is input for inflation rate. For per-bus annual costs this is then multiplied by the number of buses to get total fleet costs. These fleet costs for all categories are totaled. The total fleet costs are then divided by the number of buses to give average life cycle costs per bus. Life cycle costs per bus are then divided by the total mileage accumulation per bus (annual mileage x bus useful life) to give average total life-cycle costs per mile driven.
Note that the analysis applies fuel infrastructure and depot modification costs required at the bus depot to the number of buses specified by the user. The default assumptions for these costs include both fixed costs (per location) and variable costs (per bus). When analyzing a case that includes only a portion of the buses assigned to a depot (ie. 10 buses out of 50 housed at one location) the default assumptions may slightly overstate the per-bus cost of diesel fueling infrastructure because the fixed cost component will be spread over fewer buses than would be optimal.
1.3.5 Life Cycle Emissions (Worksheet O5) This sheet displays average gram/mile emission rates and lifecycle total tons of emissions for relevant air pollutants, as well as vehicle fuel economy and lifetime gallons (or diesel-

Life Cycle Cost & Emissions Model Alternative Bus Technologies
M.J. Bradley & Associates Final Report - December 2006 9
equivalent gallons) of fuel consumed. Fuel economy calculations are based on the user- input average in-use speed and predetermined speed vs. fuel economy curves.
Emissions values are calculated based on assumed emissions rates, fuel properties and engine characteristics. Gram per brake horsepower-hour (g/bhp-hr) emission rates are determined for each vehicle based on the current certification limits for each technology. From these, grams per mile (g/mi) emission rates are calculated via the following equations:
NOx, PM, NMHC, CH4 and CO:
Emissions [g/mi] = )(
)(
)(544,2
)(000,132)(
galmiFE
hrhphrbhp
hrhpBtu
galBtu
hrbhpgEmissions engine −
−
×
−
×−
η
(equation 7)
CO2 (diesel):
CO2 Emissions [g/mi] = )(
159.45312
44%87.9.6 2
galmiFElb
ggC
gCOCgalDiesellb
××××
(equation 8)
CO2 (CNG):
CO2 Emissions [g/mi] =
)(
159.453000,132105012
44%70.048.0 2
galmiFElb
gDEG
BtuBtu
scfgC
gCOC
scfCNGlb
××××××
(equation 9)
CO2-Equivalent GHG:
GHG Emissions [g/mi] = CO2 [g/mi] + CH4 [g/mi] x 23
(equation 10)
The factor of twenty three used to convert CH4 emissions into CO2-equivalent green house gas emissions in equation 10 is a standard multiplier published by the United Nations sponsored Intergovernmental Panel on Climate Change (IPCC)5, and is 5 See: Intergovernmental Panel on Climate Change, Third Assessment Report, 2001. The IPCC was established in 1988 by the World Meteorological Organization and the United Nations Environmental Programme.

Life Cycle Cost & Emissions Model Alternative Bus Technologies
M.J. Bradley & Associates Final Report - December 2006 10
representative of the greater warming potential of CH4 compared to CO2. Based on emissions test results, the model assumes that the only technology that produces any CH4 emissions is CNG-fueled buses.
For CO2 and GHG emissions, results are also shown in units of metric tons in accordance with standard international practice. For all technology options specified by the user as operating on biodiesel fuel the model also calculates life time ‘fuel cycle’ CO2 emissions in units of metric tons. Biodiesel fuel cycle emissions of CO2 are lower than tail pipe emissions because they are net of assumed carbon “sinks” from growing the agricultural crops used to create the biofuel component of the fuel. Reductions in fuel cycle CO2 emissions compared to tailpipe emissions are dependant on the percentage of biofuel in the biodiesel blend (from 1% to 100% biofuel). The user can specify this percentage on worksheet I1. The default assumption in the model is that fuel cycle CO2 emissions from 100% biodiesel (B100) will be 0% of tailpipe CO2 emissions (a 100% reduction) because all of the carbon in the fuel which ultimately goes out the tailpipe is assumed to be derived from renewable sources. This assumption ignores the energy and resultant carbon emissions required to grow the agricultural crops and to process the crops into fuel. However, it is consistent with the treatment of diesel fuel and natural gas in the model. Both of these fuels also require energy for extraction and processing, resulting in net CO2 emissions beyond those from the vehicle tailpipe. None of these “well to tank” CO2 emissions are included in the model for either diesel or natural gas, so the “field to tank” CO2 emissions from biodiesel production are also not included. For technologies specified by the user to use biodiesel fuel, fuel cycle emissions are calculated per equation 11.
Fuel Cycle tons = total metric tons x (1- % Biofuel x % CO2 Reduction for B100)
(equation 11)
For technology types that run on other fuels (standard diesel, natural gas), the model assumes that the fuel cycle CO2 and GHG emissions are the same as tailpipe emissions.
The model allows the user to change the default assumption as to % CO2 reduction for B100 if they wish to do so.
1.3.6 CO2 Price (Worksheet O6) This worksheet includes four tables which use the cost and emissions data shown on worksheets O4 and O5 to calculate the relative cost ($/ton reduction) of reducing CO2 emissions with each of the retrofit and new bus technology options analyzed by the model. For these calculations, annual CO2 emissions from each bus type are “discounted” in the same way that costs are discounted by the model to calculate net present values.
To calculate available reductions, each table compares the other technology options to a different baseline, representing different potential “starting points” for any fleet: Baseline Diesel, DPF Retrofit, Biodiesel, and Clean Diesel.

Life Cycle Cost & Emissions Model Alternative Bus Technologies
M.J. Bradley & Associates Final Report - December 2006 11
1.3.7 Cost Emissions Summary (Worksheet O7) This worksheet provides a brief tabular summary of some of the most important cost and CO2 emissions results presented on worksheets O4, O5 and O6.
1.3.8 Articulated Vehicle Cost Comparison (Worksheet O8) This sheet compares the total lifecycle cost of operating a fleet of 60-foot articulated buses to the cost of operating 35- or 40-foot buses (as specified by the user). Because articulated buses have higher capacity than smaller buses the model requires the user to specify how many 35- or 40-foot buses will be replaced by a single articulated bus (with the implicit assumption that this number will usually be greater than one).
This worksheet displays all of the same categories of cost as sheet O4, but only for the number of articulated buses required given the specified replacement rate. For example, if the user inputs “12” for the number of 40-foot buses in worksheet I1, and indicates in worksheet O8 that one articulated bus will replace 1.5 40-foot buses, then the costs displayed in worksheet O8 will be for a fleet of eight articulated buses (12 ÷ 1.5).
In all cases the model assumes that capital and operating costs per bus and per mile are greater for articulated buses than for 35- or 40-foot buses. However, depending on the user-specified replacement rate total life-cycle fleet costs could be less because fewer buses are required, and they operate for fewer total life-time miles.
Note that since this tool is theoretical the number of assumed articulated vehicles is not rounded to a whole number. Therefore, if the 40-foot bus fleet size is specified as 11 vehicles and each articulated vehicle replaces 2 standard vehicles the calculations will be made for 5.5 articulated buses.
1.3.8 Articulated Vehicle Emissions Comparison (Worksheet O9) This worksheet displays the same data as worksheet O5 but displays the per vehicle emissions for articulated buses. In all cases calculated emissions rates (g/mi and lifetime tons) will be higher for articulated buses because each bus is assumed to travel the same distance and have the same duty cycle, but articulated buses are assumed to use more fuel per mile than 35- and 40-foot buses.
A second table on this worksheet displays the difference in life time fleet emissions for a fleet of articulated buses compared to a fleet of 35- or 40-foot buses. The number of articulated buses in the fleet is consistent with the cost calculations in worksheet O8, and is based on the user-specified articulated bus replacement rate. The percentage difference in lifetime fleet emissions is the same for each pollutant, and is based on the difference in total life time fuel used by the articulated versus 35- or 40-foot bus fleets. As with costs, total life time fleet emissions could be more or less for the articulated buses than for 35- or 40-foot buses depending on the user-specified replacement rate.
1.3.9 Graphical Presentation of Output Data The model also includes eight worksheets which present the results of the model calculations graphically. Worksheet G1 shows the average total costs per mile driven ($/mi) for each technology over the bus’ useful life, including all capital purchase and

Life Cycle Cost & Emissions Model Alternative Bus Technologies
M.J. Bradley & Associates Final Report - December 2006 12
overhaul costs, all annual operator labor, maintenance and fuel costs, and the portion of depot costs attributable to each bus.
Worksheet G2 shows the total lifecycle cost per bus for each technology, broken down into six categories: operator wages, capital costs (for purchase of the bus and a proportion of required fuel station, special tools and depot modifications), bus overhaul costs, maintenance costs, fuel costs, and depot maintenance costs..
Worksheets G3-G5 display fuel economy and emissions data. Emissions are presented in units of average gram per mile (g/mi). Emissions results were presented in the following three charts due to the need to use varying axes in order to meaningfully display results; Worksheet G3 contains CO2, GHG and Fuel Economy results, G4 contains PM, NMHC and CO results, and G5 contains NOx results.
Worksheet G6 displays the assumed annual fuel costs each year ($/gallon) used by the model for its calculations, based on the default or user-input annual inflation rates (worksheet I1). Fuels shown include #2 Diesel, #1 Diesel, the baseline Biodiesel blend that is input by the user, 100% Biodiesel (B100) for reference, and CNG. The four diesel-based fuels are all assumed to inflate at the same annual rate, while the user may input a different inflation rate for natural gas.
Worksheet G7 displays the difference in costs between an articulated fleet and standard fleet, broken down into five categories in the same fashion as worksheet G2. As noted at the top off the worksheet, these numbers reflect the difference in the number of buses assumed by the model to be in each fleet.
Worksheet G8 graphically displays the data shown on worksheet O6 – the cost ($/ton) of reducing CO2 with each technology option analyzed by the model. As in worksheet O6, $/ton values are shown for each technology option compared to four different “baseline” technologies.
1.3.10 Interim Calculation Worksheets Worksheets C1, C2 and C3 contain calculations and programming that are necessary for the file to function properly and therefore should not be modified.

Life Cycle Cost & Emissions Model Alternative Bus Technologies
M.J. Bradley & Associates Final Report - December 2006 13
2. Sources of Default Assumptions
For many important inputs used in the Life Cycle Cost and Emissions Model the model includes “default” assumptions intended to represent average or typical results for US transit agencies. If a user does not have local or case-specific data to use as an input, the model will use these default assumptions for all calculations. This section details the sources of these default data assumptions. Many were drawn from published industry data. All data sources used are listed in the References section.
2.1 Depot Baseline Data(I1) The depot baseline data sheet contains default assumptions for fuel costs and annual inflation rates.
2.1.1 Fuel Costs The costs of diesel fuel and natural gas vary significantly over time, and have become more volatile in recent years. At any point in time the relative cost of diesel fuel and natural gas can also vary based on local and/or geopolitical factors. However, in the long run price changes for diesel and natural gas tend to move together – when diesel fuel prices rise, natural gas prices tend to rise in a similar fashion.
Biodiesel fuel has historically been more expensive per gallon than standard commercial diesel fuel, but there are typically wide differences from region to region. Recently, per-gallon prices for low-level biodiesel blends (B5 – B20) have in some regions been the same as, or lower than, prices for standard diesel fuel.
In order to determine default assumptions for fuel costs, data was gathered from the U.S. Department of Energy’s Clean Cities Alternative Fuel Price Report for June 2006 (1), as well as from several large US transit agencies (2).
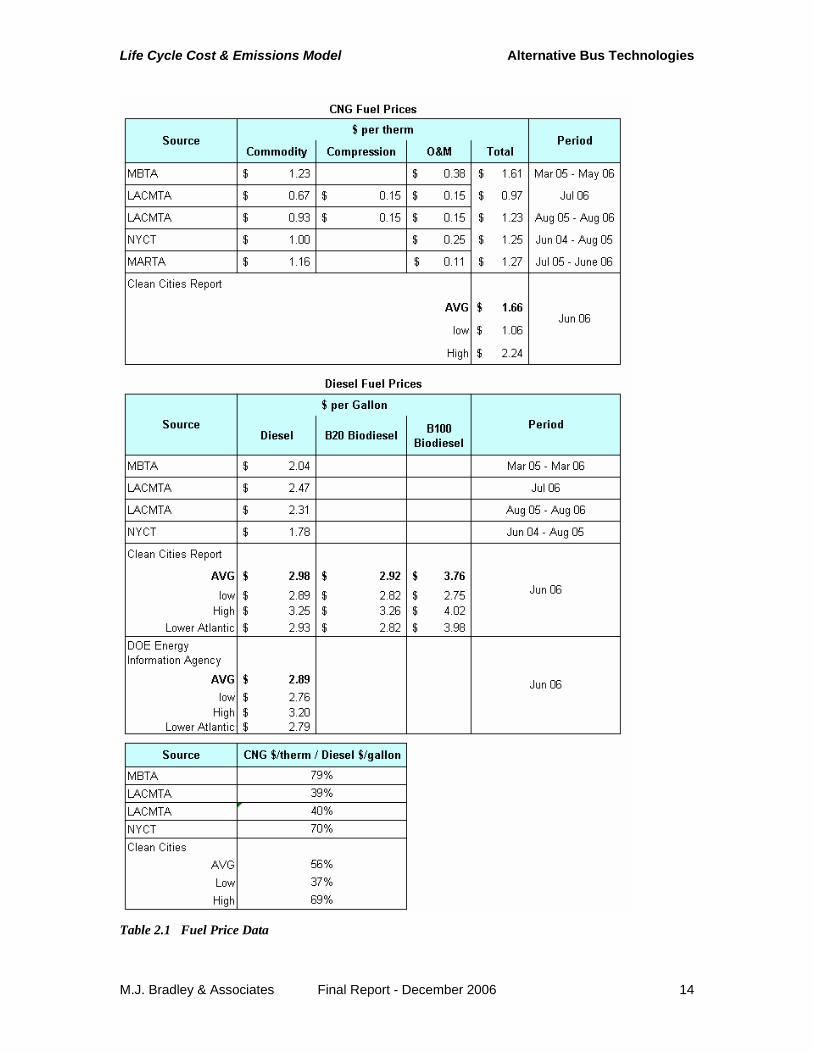
This data is shown in Tables 2.1. As shown, both natural gas and diesel fuel prices vary widely over time and by region. For natural gas, the per-therm6 price is composed of the cost of the natural gas commodity, the cost of compressing the gas onto a vehicle, and the cost of maintaining the fuel station. This last factor, annual O&M costs for the fuel station, can be large. As shown in Table 2.1, annual fuel station O&M accounts for 20% or more of delivered CNG fuel costs at the Massachusetts Bay Transportation Authority in Boston and at MTA New York City Transit in New York City. At other transit agencies it accounts for 8-11% of total delivered fuel costs. Also note that the clean cities data is an average price from a survey of public commercial fuel stations. As such, both the cost of compression and the cost of fuel station O&M is included in the price.
6 A therm of natural gas contains 100,000 btu of energy, while a gallon of #2 diesel fuel typically contains 132,000 btu. Therefore there are 1.32 therms of natural gas in a “diesel equivalent gallon”, with equivalence based on energy content.
Life Cycle Cost & Emissions Model Alternative Bus Technologies
M.J. Bradley & Associates Final Report - December 2006 14
Table 2.1 Fuel Price Data

Life Cycle Cost & Emissions Model Alternative Bus Technologies
M.J. Bradley & Associates Final Report - December 2006 15
The model does not include a default assumption for the price of diesel fuel. Each user must input their current fuel costs ($/gallon) for #2 diesel. The model adds $0.02 per gallon to the user-input price for diesel fuel station O&M, consistent with the author’s experience at New York City Transit. The default assumption used by the model for the price of #1 diesel fuel is 5% greater than the price input by the user for #2 diesel7. However, the user can overide this default assumption by entering a specific price for both #2 and #1 diesel (but must always enter a #2 diesel price).
Because many transit agencies considering alternative fuel buses may have better data on current diesel fuel prices than on current natural gas prices, the model does include a default assumption for the price of natural gas, which is based on the diesel price input by the user. The default assumption in the model is that the total cost per therm for natural gas will be 56% of the user-input per gallon cost of diesel8. This default total per-therm cost for natural gas is composed of 14% for O&M, 6% for compression, and 80% for the natural gas commodity. As shown in Table 2.1, these assumptions match the current average Clean Cities data, and are well within the range of data from various transit agencies.
For biodiesel fuel, the default assumption in the model is that 100% biodiesel will cost 26% more per gallon than the price input by the user for #2 diesel. This assumption is in line with the current difference between national average prices for diesel fuel and biodiesel fuel from the Clean Cities Alternative Fuel Report. The model uses this price and the user-input price of #2 diesel to calculate the default price for each grade of biodiesel, based on percentage biodiesel content (from B1 to B100). The user must input the biodiesel percentage. The user may also overide the default biodiesel price by entering a specific per gallon price for each grade of biodiesel they specify.
2.1.2 Annual Inflation The default assumptions used for annual inflation are 3% for labor and materials 3% for diesel fuel, and 3% for natural gas. These are long-term US averages, but may not be appropriate for a specific future time period. The model user can input alternative assumptions, including separate values to indicate that diesel fuel and natural gas prices will inflate faster or slower than labor and materials costs, and faster or slower than each other.
2.2 Annual Bus Costs(I2) The annual bus costs data sheet contains assumptions for bus operator labor costs, base annual bus maintenance costs ($/mi), brake reline intervals and costs, annual cleaning for diesel particulate filters, and hybrid bus battery conditioning.
7 #1 diesel fuel, sometimes referred to as “Jet A” or “kero” is a lighter grade of fuel with slightly lower energy content than #2 diesel (approximately 128,000 btu/gal compared to 132,000 btu/gal). Considered a “premium” grade of fuel, #1 diesel has historically been more expensive that #2 diesel. 8 Given this assumption, a diesel equivalent gallon of CNG will be 74% of the cost of a gallon of #2 diesel fuel. A diesel equivalent gallon contains 1.32 therms of natural gas with 132,000 btu energy content.

Life Cycle Cost & Emissions Model Alternative Bus Technologies
M.J. Bradley & Associates Final Report - December 2006 16
2.2.1 Operator Costs The model includes a line for the user to input a different operator labor rate for each bus type in case this is required by local policy. If these cells are left blank, the model will use as a default for all bus types the operator labor rate input on sheet I1.
The model calculates operator labor costs based on the annual hours that each bus will be in service (annual miles divided by average speed) but adds in a factor for time each day in which operators are paid but not driving (ie. lunch hour, report time, etc). The user can specify the amount of time for each bus type. If these cells are left blank, the model will use as a default for all bus types one half hour per day (times 312 days per year)
2.2.2 Annual Bus Maintenance Costs Given that labor rates, maintenance practices, and bus duty cycles vary greatly from agency to agency, it is impractical to provide a default assumption for $ per mile maintenance costs that will be applicable across a wide range of transit agencies. Therefore, the model requires the user to input their current costs ($/mile) to maintain their “baseline” diesel buses. The default assumptions as to maintenance costs for all other technology options are calculated as a percentage of this user-supplied baseline value. The default percentages are shown in Table 2.2, and are explained below.
The major maintenance cost related to the use of a DPF is the need for annual cleaning. Since this cost is captured separately in the model, the default base maintenance costs for DPF Retrofit are assumed to be the same as for Baseline Diesel.
While there is some anecdotal evidence that higher percentage blends of biodiesel fuel may negatively effect fuel injectors and fuel pump seals on some diesel engines, the general consensus is that biodiesel can be used in most engines with little to no impact on
maintenance costs. Therefore, the default base maintenance costs for Biodiesel are assumed to be the same as for Baseline Diesel. Biodiesel tends to flush out accumulated deposits within the fuel system, and when switching to biodiesel fuel from standard fuel it is advisable to schedule more frequent fuel filter changes for the first few months of biodiesel operation. As these fuel filter changes represent a relatively small cost and are not an on-going maintenance requirement they are not captured in the default maintenance cost assumptions.
In the model Clean Diesel buses are assumed to use diesel engines compliant with 2007 EPA emissions standards. In order to meet these standards, these buses will have to employ cooled exhaust gas recirculation (EGR) and higher turbo-charging rates in the diesel engine and incorporate an active DPF system. It is not clear exactly how these
Technology Option
Maintenance Costs ($/mi) Compared to
Baseline Diesel
DPF retrofit +0%
Biodiesel +0%
CNG +10%
Clean Diesel +4%
Parallel Hybrid +4%
Series Hybrid +4%
Table 2.2 Maintenance Cost Default Assumptions

Life Cycle Cost & Emissions Model Alternative Bus Technologies
M.J. Bradley & Associates Final Report - December 2006 17
changes will effect maintenance costs, but the general consensus is that costs will increase compared to current (ie. Baseline) diesel engines. The model uses a conservative default assumption that base maintenance costs for Clean Diesel buses will increase by 4% compared to Baseline diesel buses.
Historically most, but not all, transit agencies have reported higher per-mile maintenance costs for CNG buses than for diesel buses. A 1999 study by the General Accounting Office (3) reported that six of seven operators of CNG buses contacted by GAO reported higher maintenance costs for CNG as opposed to diesel buses. A typical response was that engine and fuel related maintenance costs were 16% higher for CNG buses. A 2000 analysis by the National Renewable Energy Laboratory (NREL) of the experience of Dallas Area Rapid Transit with LNG buses showed that maintenance costs for engine and fuel systems were 10-33% higher than for diesel buses (4). Given that 17% of maintenance costs for diesel buses were for engine and fuel system problems this would imply an over-all increase in maintenance costs of 2-6%.
A recent analysis of the Massachusetts Bay Transportation Authority’s experience with new CNG and DPF-equipped diesel buses showed that maintenance costs attributable to the natural gas engine and fuel system on the CNG buses were $0.07/mile more than engine and fuel system related maintenance costs for the diesel buses (5). This was a 20% increase in total maintenance costs.
While the historical results are mixed there is good theoretical reason to believe that CNG engine and fuel system maintenance costs will be higher than maintenance costs for the same systems on diesel buses. Unlike diesels, CNG engines require a spark ignition system which must be maintained regularly. The fuel systems on CNG buses are also much more complicated than the fuel systems on diesel buses, requiring more frequent leak inspections and maintenance.
The model uses a conservative default assumption that the base maintenance costs for CNG buses will be 10% higher than for baseline diesel buses (and 6% higher than for clean diesel buses).
There is little real world data available on the relative annual maintenance costs of hybrid buses compared to diesel and natural gas buses, but early results are promising. An NREL analysis of the first six months of operation for 60-ft hybrid buses at King County Metro in Seattle in 2005 showed equivalent per-mile maintenance costs for the hybrid buses and diesel control buses at the same depot (6). A similar NREL analysis of the first six months of operation of new 40-foot hybrid and CNG buses at MTA New York City Transit showed total maintenance costs for the hybrids 8% lower than for the CNG buses, though propulsion system maintenance costs were lower for the CNG buses (7).
The model uses a conservative default assumption that the base maintenance costs for both Series Hybrid and Parallel Hybrid buses will be 4% higher than for Baseline Diesel buses (and equivalent to Clean Diesel buses). Note that the cost of hybrid battery replacements are captured under overhaul costs.
For articulated buses, the model assumes that per-mile maintenance costs will be 50% greater than per-mile maintenance costs for 40-foot buses of the same technology.

Life Cycle Cost & Emissions Model Alternative Bus Technologies
M.J. Bradley & Associates Final Report - December 2006 18
2.2.3 Brake Reline Intervals and Costs The model calculates the cost of brake relines separately from base $/mile maintenance costs because hybrid buses have been shown to significantly extend brake reline intervals due to regenerative braking. In addition, CNG buses are typically up to 15% heavier than diesel buses due to the greater weight of the natural gas fuel system, which reduces reline intervals since the braking system needs to do more work to stop the bus.
Table 2.3 contains the default values for front and rear reline interval, front and rear reline material cost, and front and rear reline labor hours for Baseline diesel buses. These assumptions are based on an informal poll of maintenance staff at six transit agencies conducted by the author in 2004 (8).
For all other technology options the brake reline material costs and labor hours are assumed to be the same as for Baseline Diesel buses, as are the reline intervals for DPF Retrofit,
Biodiesel, and Clean Diesel. These technology options do not affect brake life.
For CNG buses brake reline intervals are assumed to be 15% shorter (worse) than for baseline diesels due to the greater bus weight.
Given that significant numbers of hybrid buses have not been in service for more than a few years, hard data on brake life does not yet exist. However, anecdotal evidence from several maintenance managers with hybrid experience indicates that brake lining life on hybrids may be more than double brake lining life on conventional buses. This is consistent with in-use fuel economy results for hybrids. A 20% reduction in fuel use for a hybrid bus implies that the braking system is recapturing about half the energy normally dissipated in braking, and that therefore the braking system is only doing about half the work that it would on a conventional bus9, which implies that the bus should only require relines half as often. The model uses a conservative default assumption of a 75% increase in reline interval for both Series and Parallel Hybrid buses.
2.2.4 Annual DPF Cleaning Diesel particulate filters must be removed periodically to have accumulated ash removed. This ash accumulates as engine lubricating oil is burned in the cylinder since inorganic 9 On a typical transit bus approximately 20% of the energy supplied by the engine is used to operate accessory loads, and 80% is supplied to the bus wheels. Of the energy supplied to the bus wheels, approximately one half (40% of the total) is dissipated as friction between the tires and the road, and half (40% of total) is dissipated in the brake system. Assuming that all of the fuel savings from a hybrid bus comes from energy recovered through regenerative braking, a 20% savings implies that the brake system in only dissipating half the energy that it would on a standard bus.
Unit Value Front Interval mi 35,000 Rear Interval mi 30,000 Front Matl Cost $ $400 Rear Matl Cost $ $400 Front Labor hr 5 Rear labor hr 8
Table 2.3 Default Brake Maintenance Assumptions, Baseline Diesel Buses

Life Cycle Cost & Emissions Model Alternative Bus Technologies
M.J. Bradley & Associates Final Report - December 2006 19
components of the oil can not oxidize out of the filter along with collected carbon. The actual cleaning interval will depend on duty cycle and how much oil the engine burns. However, most filter manufacturers recommend a base cleaning interval of once per year. This annual interval is the default assumption used in the model.
Based on the author’s experience at New York City Transit, the default assumption as to the cost of this annual cleaning is $300 to $400 per bus. This includes two hours for removal/replacement of the DPF and a third-party cleaning fee of $200 - $300 per DPF.
The model applies this annual DPF cleaning cost to DPF Retrofit, Clean Diesel, and both Series Hybrid and Parallel Hybrid technology options.
2.2.5 Hybrid Battery Conditioning The model assumes that Series Hybrid buses will be equipped with lead-acid batteries10. In order to maximize battery life in a hybrid system, lead acid batteries require periodic “conditioning” using a special battery charger. The largest supplier of hybrid systems that use lead acid batteries recommends annual conditioning, and this is the default assumption as to conditioning interval. The actual conditioning procedure can take up to ten hours, but proceeds automatically. The default assumption as to labor-hours required for conditioning is 2 hours/bus.
The only current manufacturer of Parallel Hybrid systems for buses delivers them with nickel-metal hydride batteries, which do not require regular conditioning.
2.3 Purchase & Overhaul Costs In order to determine default assumptions for vehicle purchase costs, data was gathered from the American Public Transportation Association 2006 Transit Vehicle Database (9). Table 2.4 summarizes this data on the weighted average purchase price for 35-foot and 40-foot buses purchased for delivery in 2005 and 2006.
Table 2.4 Weighted Average Bus Prices from 2006 APTA Transit Vehicle Database
10 The hybrid system manufacturer with the largest current market share, BAE Systems, sells a series hybrid system which uses lead-acid batteries. Other manufacturers of both series and parallel hybrid systems use different battery technologies.

Life Cycle Cost & Emissions Model Alternative Bus Technologies
M.J. Bradley & Associates Final Report - December 2006 20
The default assumption in the model is that a 35-foot diesel bus will cost $277,000 while a 40-foot diesel bus will cost $327,000, and a 60-foot diesel articulated bus will cost $480,000, consistent with the APTA data for 2006. The default cost of a DPF Retrofit bus is assumed to be $5,000 more than a Baseline bus, which is the cost of a DPF. The default cost of a Clean Diesel bus is assumed to be $8,000 more than a Baseline bus, which is the cost of a DPF and changes to the diesel engine to comply with EPA 2007 emission standards.
Because many transit agencies considering alternative fuel buses may have better data on diesel bus prices than on natural gas or hybrid bus prices, the default assumption in the model is that 35- and 40-foot CNG buses will cost 15% more than standard diesel buses and that 35- and 40-foot hybrid buses will cost 50% more. The default assumption in the model is that 60-foot articulated CNG buses will cost 25% more than standard diesel articulated buses and that hybrid articulated buses will cost 35% more. These relative prices are reflected in the 2006 APTA vehicle data, but are based on fewer buses than the average 35- and 40-foot bus prices. For default values these percentage cost increases will be applied to whatever diesel bus price is used by the model, even if a user inputs their own diesel bus price assumption.
Please note that pricing for natural gas buses relative to diesel buses has historically fluctuated, but has not shown a consistent downward trend over time. Over the last several years, since their introduction, hybrid buses prices have shown a downward trend, based on increased volume of orders and increased competition in the market. The higher differential cost for CNG articulated buses compared to smaller CNG buses is likely due to a much smaller production volume since few of these vehicles have ever been produced. The lower relative cost for hybrid articulated buses compared to smaller articulated buses is based on the fact that the hybrid system components for an articulated bus are very similar to those for the smaller buses, so the same incremental cost is applied to a larger base cost, for a smaller percentage increase.
Table 2.5 contains the default values for cost and interval for engine, transmission, hybrid system, and natural gas fuel system overhauls and hybrid battery replacement. These assumptions on engine and transmission overhauls are based on an informal poll of maintenance staff at six transit agencies conducted by the author in 2004 (8). The assumptions for hybrid system and CNG fuel system overhauls and hybrid battery replacement are based on discussion with system manufacturers and review of manufacturer literature.
The increased default cost of engine overhaul for DPF Retrofit and Clean Diesel buses is due to the assumed need to replace the DPF during the overhaul. The reduced cost of engine overhaul for both the Parallel and Series Hybrid buses is due to the fact that both of these bus types can use smaller and less expensive medium-duty diesel engines that would normally be installed in a pick-up truck, as opposed to the heavy-heavy duty diesel engines typically installed in transit buses.
The CNG fuel system overhaul primarily consists of replacement of on-bus methane detectors.

Life Cycle Cost & Emissions Model Alternative Bus Technologies
M.J. Bradley & Associates Final Report - December 2006 21
Engine Overhaul Transmission Overhaul Technology Interval (mi) Cost Interval (mi) Cost Baseline Diesel 250,000 $17,500 100,000 $7,900DPF Retrofit 250,000 $21,500 100,000 $7,900Biodiesel 250,000 $17,500 100,000 $7,900CNG 250,000 $22,500 100,000 $7,900Clean Diesel 250,000 $21,500 100,000 $7,900Parallel Hybrid 275,000 $12,500Series Hybrid 275,000 $12,500
CNG Fuel System Interval (mi) Cost
CNG 150,000 $3,000
Hybrid System Overhaul Hybrid Battery Replacement Interval (mi) Cost Interval (yr) Cost
Series Hybrid 200,000 $7,000 3 $9,500Parallel Hybrid 200,000 $12,000 6 $30,000
Table 2.5 Default Overhaul Assumptions
Given that large numbers of hybrid buses have not been in service long enough to reach expected system overhaul intervals, the default assumptions about hybrid bus overhauls shown in Table 2.5 have a significant amount of uncertainty. For a Series Hybrid bus the primary activity during hybrid system overhaul will be replacement of traction motor and generator bearings. As relatively simple electric machines they should be able to go for at least twice as long as a standard automatic transmission before an overhaul is required, and bearing replacement is relatively inexpensive. For a Parallel Hybrid bus, the traction motor and generator are combined in a much more mechanically complicated machine that is more like an automated transmission. While the default assumption is that this device will also have twice the overhaul interval of a standard automatic transmission, it is assumed that the overhaul cost will be 50% greater than the cost of overhauling an automatic transmission (consistent with the increase in purchase costs for hybrid buses).
The significant difference between Series Hybrid and Parallel Hybrid for the interval and cost for hybrid battery replacement is based on the assumed use of different battery technologies. The nickel-metal hydride batteries used in commercially available parallel hybrid buses have a longer life but also cost significantly more than the lead-acid batteries used in many series hybrid buses.

Life Cycle Cost & Emissions Model Alternative Bus Technologies
M.J. Bradley & Associates Final Report - December 2006 22
For articulated buses, the model assumes that the NPV of total overhaul costs will be 50% greater than for 40-foot buses of the same technology.
2.4 Depot Infrastructure Costs The use of natural gas buses requires the installation of a compressed natural gas fuel station and also requires that the bus maintenance/storage facility be constructed such that an unplanned release of natural gas from a bus can be handled safely by the building systems. Facility design for compressed natural gas operations generally requires installation of a building methane detection system and additional building ventilation for gas purging, as required. It also requires that all potential ignition sources (including standard electrical fixtures and conduit) not be located within 18-24 inches of ceiling level, and that the building roof structural design not allow for dead pockets at ceiling level where released gas could collect without being purged by the building’s ventilation system. Many existing facilities built for diesel vehicles require modifications to both HVAC and electrical systems when CNG buses are introduced.
The default assumptions in the model for the cost of CNG fuel station installation and facility methane detection, HVAC requirements, and electrical modifications for CNG buses is taken from the Transit Costs 1.0 model developed for the U.S. Department of Energy by TIAX, LLC (10). This model assumes that CNG fuel stations have a fixed cost of $200,000 and a variable cost of $800 per standard cubic foot per minute (SCFM) station capacity. The required SCFM capacity of the station is based on the number of buses, the amount of fuel each bus will use every day, the maximum allowable fill time per bus, and the total available fueling hours per day at the bus depot. The formula used to calculate required SCFM is shown above in section 1.2.4.
This model also assumes that CNG facility requirements have a fixed cost of $100,000 plus a variable cost of $2,500 per bus if buses will be stored out doors and $4,000 per bus if they will be stored in doors.
These default assumptions do not include any costs for extending natural gas lines to the location of the CNG fuel station. Depending on current installed capacity of the local natural gas utility these costs can be significant, but are unique to each facility location.
All other technology options analyzed by the model use diesel fuel. They require the installation of a diesel fuel storage system with dispenser(s) and do not require any other special building systems11.
As with CNG fuel stations, the model assumes a fixed and a variable cost for installation of a diesel fuel station. Based on the author’s experience at New York City Transit the cost of diesel fuel stations are generally approximately one tenth the cost of CNG fuel stations which can handle the same number of buses. The default assumptions for the cost of a diesel fuel station are set at $20,000 fixed cost and $1,000 per bus.
11 While building codes have specific requirements for facilities that will house diesel fueled vehicles, most bus facilities are, or would be, designed for the use of diesel fuel absent the introduction of natural gas vehicles. The cost of diesel fuel design is therefore assumed to be included in the base facility costs and the cost of CNG-specific systems included in the model is for the incremental cost of designing for CNG operations.
Life Cycle Cost & Emissions Model Alternative Bus Technologies
M.J. Bradley & Associates Final Report - December 2006 23
Because hybrid systems incorporate a significant number of batteries, the model also assumes that the bus depot will require modifications/expansion of its existing battery room to accommodate hybrid buses. The default assumption for the cost of these modifications is $20,000.
As discussed above in section 2.2.5, hybrid buses delivered with lead-acid batteries require periodic battery conditioning. Based on discussion with the system manufacturer, the default assumption as to the installed cost of the required equipment is $70,000 per unit. One unit should be able to handle up to 200 buses assigned to a single location.
The model also assumes that both CNG and hybrid buses will require the installation of an overhead crane at the maintenance facility, since both bus types usually incorporate more roof-mounted equipment than standard diesel buses. The default assumption for the cost of this crane is $25,000.
2.5 Development of Fuel Economy Curves The model calculates in-service fuel economy based on a logarithmic equation with average bus speed (duty cycle) as the dependent variable. The user must supply this average speed assumption.
The user must also specify whether the buses will be 35-foot or 40-ft buses. The model uses a different fuel economy equation for each technology option for each of these bus lengths.
The curves used by the model were ‘fit’ to data on bus fuel economy vs in-service speed (miles per gallon, MPG vs miles per hour, MPH) from four different sources:
In-use data on actual fuel economy vs average in-use speed for diesel and CNG buses at 149 bus transit agencies for 2004, which is contained in the National Transit Data Base (11). Only data for mode type “MB” (transit bus), and for which maximum vehicles is service was greater than 20, were used.
In-use data on average fuel economy vs average in-use speed of diesel, CNG, and Hybrid buses from seven different transit agencies, collected separately from the NTD database. Some of this data is from published reports and some was collected through personal communication by the author (12).
Fuel economy testing of five different diesel, CNG, and hybrid buses conducted at the Pennsylvania Transportation Research Institute, Bus Testing and Research Center. This data was collected on a test track using three different test cycles with different average speeds (13).
Published emissions test results from diesel, CNG, and hybrid buses. This data was collected with buses mounted on a chassis dynamometer, using seven different test cycles with different average speeds. A total of sixty data points were included (14).
The NTD data includes 30-ft, 35-ft, 40-ft, and 60-ft buses – which can not be separated based on the way the data was reported. Virtually all other data (emissions testing, PTRI fuel economy testing, in-use data) was from 40-ft buses - except one in-use data point

Life Cycle Cost & Emissions Model Alternative Bus Technologies
M.J. Bradley & Associates Final Report - December 2006 24
from the Robertson buses used by the Duke University transit system, which are 35-ft buses.
Significant variability is seen in the fuel economy data from all of the above sources, but it verifies the assumed shape of the fuel economy curves as a logarithmic function of average speed. This data also shows that CNG buses get worse fuel economy than diesel buses on the same duty cycle, and that hybrid buses get better fuel economy.
Figures 2.1- 2.4 show the fuel economy curves used in the model for Baseline Diesel, CNG, Series Hybrid, and Parallel Hybrid buses (both 35-ft and 40-ft buses) plotted against all of the in-use and emissions test data that was collected. Figure 2.5 shows all of the curves used in the model plotted on the same chart.
In fitting the curves for 40-ft buses, greater weight was given to in-use data points that were confirmed to be from 40-ft buses, as opposed to the NTD data (mixed bus sizes) and emissions test data. The curve for 35-ft diesel buses was fit to go through the data point for Robertson Buses (confirmed 35-ft) and the 35-ft CNG and Hybrid curves were fit to maintain the same relationship between diesel, CNG, and hybrid as the 40-ft curves.
The fuel economy curves used by the model for DPF Retrofit and Clean Diesel are based on the Baseline Diesel curve, but at all speeds fuel economy is reduced by a constant percentage. Retrofit with a DPF is assumed to reduce fuel economy by 1% compared to Baseline Diesel bus fuel economy. This is consistent with testing conducted under the EPA Technology Verification program for passive DPF devices.
Clean Diesel buses are assumed to use diesel engines compliant with 2007 EPA emissions standards. In order to meet these standards, these buses will have to employ cooled exhaust gas recirculation (EGR) in the diesel engine and incorporate an active DPF system. Both technologies are known to reduce fuel economy compared to Baseline diesels (no EGR or DPF). The model assumes that Clean Diesel buses will have 4% worse fuel economy than Baseline buses, consistent with EPA guidance on the use of active DPF systems.
The base fuel curves are based on the use of #2 diesel fuel, so for any bus type specified by the user to operate on #1 diesel or biodiesel the baseline fuel economy is further reduced by a fixed percentage due to lower per-gallon energy content of biodiesel and #1 diesel compared to #2 diesel fuel.
One hundred percent biodiesel fuel has approximately 9% less energy per gallon than standard diesel. The model adjusts the actual fuel economy reduction based on the percentage biodiesel mix input by the user.
If #1 diesel is chosen by the user as the specified fuel for any technology option the fuel economy at each speed is reduced by 3% based on the typical per-gallon energy content of #1 diesel compared to #2 diesel.
For articulated buses, the model assumes that fuel economy (MPG) will be 30% lower than for 40-foot buses of the same technology at every average speed, and 45% lower than for 35-ft buses. This assumption is based on the experience of New York City Transit, which operates over 600 articulated buses and over 3,000 40-ft buses (15).

Life Cycle Cost & Emissions Model Alternative Bus Technologies
M.J. Bradley & Associates Final Report - December 2006 25
Fuel Economy vs SpeedFuel Economy Curves for 40-ft Bus vs In-Use and Chassis Dyno Test Data
0.0
1.0
2.0
3.0
4.0
5.0
6.0
0 5 10 15 20 25 30
MPH
MPG
DIESEL CURVE - 40' Bus CNG CURVE - 40' BusBaseline Diesel (Emissions Test Average) Current CNG (Emissions Test Average)
Emissions Testing Diesel Emissions Testing CNGIn-Use Data Diesel In-Use Data CNGNTD DIESEL > 100 Buses NTD CNG > 100 Buses
ALTOONA 40' DIESEL - 3 Buses ALTOONA 40' CNG 1 BusSEPTA DYNO Testing
ROBERTSONBUSES
These curves better match in-use data (mostly 40' buses), butdo not match Robertson buses
Figure 2.1 Fuel Economy versus Speed for 40-ft Diesel and CNG Buses

Life Cycle Cost & Emissions Model Alternative Bus Technologies
M.J. Bradley & Associates Final Report - December 2006 26
Fuel Economy vs SpeedFuel Economy Curves for 40-ft Bus vs In-Use and Chassis Dyno Test Data
0.0
1.0
2.0
3.0
4.0
5.0
6.0
7.0
8.0
0 5 10 15 20 25 30
MPH
MPG
S-HYBRID CURVE - 40' Bus P-HYBRID CURVE - 40' Bus
Emissions Testing Series Hybrid Emissions Testing Parrallel Hybrid
In-Use Data Series Hybrid In-Use Data Parrallel Hybrid
DIESEL CURVE - 40' Bus In-Use Data Diesel
SEPTA DYNO Testing
These curves give greater weight to in-use data than toemissions test data.
Figure 2.2 Fuel Economy versus Speed for 40-ft Diesel and Hybrid Buses
Fuel Economy vs SpeedFu el Economy Curves for 35-ft Bus vs In-Use and Chassis Dyno Test Data
0.0
1.0
2.0
3.0
4.0
5.0
6.0
0 5 10 15 20 25 30MPH
MPG
DIESEL CURVE - 35' Bus CNG CURVE - 35' Bus
Baseline Diesel (Emissions Test Average) Current CNG (Emissions Test Average)Emissions Testing Diesel Emissions Testing CNG
In-Use Data Diesel In-Use Data CNGALTOONA 40' DIESEL - 3 Buses ALTOONA 40' CNG 1 Bus
NTD DIESEL > 100 Buses NTD CNG > 100 BusesSEPTA DYNO Testing
ROBERTSONBUSES
These curves match averages from emissions testingon 40' buses (no AC), and also match Robertson data (35' bus)
Figure 2.3 Fuel Economy versus Speed for 35-ft Diesel and CNG Buses

Life Cycle Cost & Emissions Model Alternative Bus Technologies
M.J. Bradley & Associates Final Report - December 2006 27
Fuel Economy vs SpeedFuel Economy Curves for 35-ft Bus vs In-Use and Chassis Dyno Test Data
0.0
1.0
2.0
3.0
4.0
5.0
6.0
7.0
8.0
0 5 10 15 20 25 30
MPH
MPG
S-HYBRID CURVE - 35' Bus P-HYBRID CURVE - 35' Bus
In-Use Data Series Hybrid In-Use Data Parrallel Hybrid
Emissions Testing Series Hybrid Emissions Testing Parrallel Hybrid
DIESEL CURVE - 35' Bus In-Use Data 40-ft Diesel
SEPTA DYNO Testing
Figure 2.4 Fuel Economy versus Speed for 35-ft Diesel and Hybrid Buses
Fuel Economy vs SpeedFuel Economy Curves for 35-ft and 40-ft Buses
0.0
1.0
2.0
3.0
4.0
5.0
6.0
7.0
8.0
0 5 10 15 20 25 30
MPH
MPG
DIESEL CURVE - 40' Bus DIESEL CURVE - 35' Bus
CNG CURVE - 40' Bus CNG CURVE - 35' Bus
S-HYBRID CURVE - 40' Bus S-HYBRID CURVE - 35' Bus
P-HYBRID CURVE - 40' Bus P-HYBRID CURVE - 35' Bus
Figure 2.5 Fuel Economy Curves used in the Model

Life Cycle Cost & Emissions Model Alternative Bus Technologies
M.J. Bradley & Associates Final Report - December 2006 28
2.6 Development of Emissions Curves The equations used to calculate gram per mile (g/mi) emissions rates in the model are shown in section 1.3.5 (equations 7 and 8). For NOx, PM, CO, and NMHC equation 7 is based on EPA certification testing which indicates that specific engines emit at a constant rate per unit of work done by the engine (grams of emissions per brake horsepower-hour, g/bhp-hr) which is also proportional to grams of emissions per gallon of fuel burned in the engine. In this equation the link to duty cycle is through fuel economy – the slower the speed of the duty cycle the more fuel is burned per mile and the higher the emissions are per mile. For CO2 emissions (equation 8) the link to fuel economy is even more direct – burning a given volume of diesel fuel or natural gas creates a fixed mass of CO2, based on the carbon content of the fuel. Therefore, determining per-mile CO2 emissions based on fuel economy is straight forward.
Technically, the EPA certification values for NOx, PM, CO, and NMHC are only valid for the specific test cycle used for the certification testing. Different duty cycles can affect g/bhp-hr emissions rates. However, the EPA certification test cycle is intended to represent “average” US driving, and g/mi emissions rates as calculated by equation 7 do match emissions test results fairly well.
Figures 2.6 – 2.12 show the g/mi emissions curves used by the model for 40-ft buses, plotted against published emissions test results from 40-ft diesel and CNG buses. This emissions test data was collected with buses mounted on chassis dynamometers, using seven different test cycles with different average speeds. A total of sixty data points are included (14).
As with the fuel economy data discussed above, there is significant variability in the emissions test data. This data was collected from a number of different test programs conducted on buses from different transit agencies and using equipment from different test labs. Some of the variability may be due to variability in emissions from buses of the same technology and some may be due to variability in the test equipment and procedures.
Despite the variability in the data, it does support the shape and relative positions of the emissions curves for diesel and CNG buses. In fitting these curves to the emissions test data, the actual EPA certification value (g/bhp-hr) for each pollutant for each technology option was used as a starting point, but in many cases were adjusted to better fit the curve to the test data. In particular, NOx emissions rates for both diesel and CNG were adjusted upward slightly and PM emissions rates for CNG and DPF-equipped diesel were adjusted downward so that the curves would better fit the test data.

Life Cycle Cost & Emissions Model Alternative Bus Technologies
M.J. Bradley & Associates Final Report - December 2006 29
PM Emissions vs SpeedEmissions Curves vs Chassis Dyno Test Data
0.00
0.05
0.10
0.15
0.20
0.25
0.30
0.35
0.40
0.45
0.50
5 10 15 20 25 30
MPH
PM (g
/mi)
Baseline DieselClean Diesel (2007)Current CNGBaseline Diesel (4 g/bhp-hr NOx)Baseline Diesel + DPFCurrent Diesel (2.5 g/bhp-hr NOx) + DPFCurrent CNG (1.8 g/bhp-hr NOx)Baseline Diesel (Emissions Test Average)Baseline Diesel + DPF (Emissions Test Average)Current CNG (Emissions Test Average)
Figure 2.6 PM Emissions Curves versus Emissions Test Data
PM Emissions vs SpeedEmissions Curves vs Chassis Dyno Test Data
0.00
0.01
0.01
0.02
0.02
0.03
0.03
0.04
0.04
0.05
0.05
5 10 15 20 25 30
MPH
PM (g
/mi)
Clean Diesel (2007)
Current CNG
Baseline Diesel + DPF
Current Diesel (2.5 g/bhp-hr NOx) + DPF
Current CNG (1.8 g/bhp-hr NOx)
Baseline Diesel + DPF (Emissions Test Average)
Current CNG (Emissions Test Average)
Figure 2.7 PM Emissions Curves versus Emissions Test Data (zoomed scale)

Life Cycle Cost & Emissions Model Alternative Bus Technologies
M.J. Bradley & Associates Final Report - December 2006 30
NOx Emissions vs SpeedEmissions Curves vs Chassis Dyno Test Data
0
10
20
30
40
50
60
5 8 11 14 17 20 23 26MPH
NO
x (g
/mi)
Baseline DieselCurrent DieselCurrent CNGBaseline Diesel (4 g/bhp-hr NOx)Baseline Diesel + DPFCurrent Diesel (2.5 g/bhp-hr NOx) + DPFCurrent CNG (1.8 g/bhp-hr NOx)Baseline Diesel (Emissions Test Average)Baseline Diesel + DPF (Emissions Test Average)Current CNG (Emissions Test Average)
Figure 2.8 NOx Emissions Curves versus Emissions Test Data
NMHC Emissions vs SpeedProposed Emissions Curves vs Chassis Dyno Test Data
0
1
2
3
5 10 15 20 25 30MPH
NM
HC
(g/m
i)
Baseline DieselClean Diesel (2007)Current CNGBaseline Diesel (4 g/bhp-hr NOx)Baseline Diesel + DPFCurrent Diesel (2.5 g/bhp-hr NOx) + DPFCurrent CNG (1.8 g/bhp-hr NOx)Baseline Diesel (Emissions Test Average)Baseline Diesel + DPF (Emissions Test Average)Current CNG (Emissions Test Average)
Figure 2.9 NMHC Emissions Curves versus Emissions Test Data

Life Cycle Cost & Emissions Model Alternative Bus Technologies
M.J. Bradley & Associates Final Report - December 2006 31
CO Emissions vs SpeedProposed Emissions Curves vs Chassis Dyno Test Data
0
5
10
15
20
25
30
35
40
5 10 15 20 25 30MPH
CO
(g/m
i)Baseline DieselClean Diesel (2007)Current CNGBaseline Diesel (4 g/bhp-hr NOx)Baseline Diesel + DPFCurrent Diesel (2.5 g/bhp-hr NOx) + DPFCurrent CNG (1.8 g/bhp-hr NOx)Baseline Diesel (Emissions Test Average)Baseline Diesel + DPF (Emissions Test Average)Current CNG (Emissions Test Average)
Figure 2.10 CO Emissions Curves versus Emissions Test Data
CH4 Emissions vs SpeedProposed Emissions Curves vs Chassis Dyno Test Data
0
5
10
15
20
25
30
35
40
45
50
5 10 15 20 25 30
MPH
CH
4 (g
/mi)
Baseline DieselClean Diesel (2007)Current CNGCurrent CNG (1.8 g/bhp-hr NOx)Current CNG (Emissions Test Average)
Figure 2.11 CH4 Emissions Curves versus Emissions Test Data

Life Cycle Cost & Emissions Model Alternative Bus Technologies
M.J. Bradley & Associates Final Report - December 2006 32
CO2 Emissions vs SpeedEmissions Curves vs Chassis Dyno Test Data
0
1,000
2,000
3,000
4,000
5,000
6,000
5 10 15 20 25 30MPH
CO
2 (g
/mi)
Baseline Diesel
Clean Diesel (2007)
Current CNG
Series/Parallel Hybrid
Baseline Diesel (4 g/bhp-hr NOx)
Baseline Diesel + DPF
Current Diesel (2.5 g/bhp-hr NOx) + DPF
Current CNG (1.8 g/bhp-hr NOx)
Current Series Hybrid (2.5 g/bhp-hr NOx + DPF)
Baseline Diesel (Emissions Test Average)
Baseline Diesel + DPF (Emissions Test Average)
Current CNG (Emissions Test Average)
Figure 2.12 CO2 Emissions Curves versus Emissions Test Data Note that for PM, NMHC, and CO the curves are very similar for DPF Retrofit, Clean Diesel and both Series and Parallel Hybrid, and that they show much lower emissions levels than Baseline diesel. For all of these technology options the low emissions levels for these pollutants are based on the use of a DPF, and any differences in PM emissions between the technologies is based on differences in fuel economy (higher MPG will result in lower g/mi emissions).
Figure 2.13 shows NOx emissions curves for a variety of current and future technology options. Differences in NOx emissions between the technologies are based both on differences in fuel economy and on significant differences in g/bhp-hr emissions rates from the technologies. For the curves shown in Figure 2.13, Baseline Diesel is assumed to have a NOx emissions rate of 4.0 g/bhp-hr, while Current Diesel has a NOx emissions rate of 2.5 g/bhp-hr and current CNG has a NOx emissions rate of 1.8 g/bhp-hr. Both in Figure 2.13 and in the model Clean Diesel, CNG, Series Hybrid, and Parallel Hybrid are all assumed to have a NOx emissions rate of 1.1 g/bhp-hr, compliant with new EPA emission standards that will take effect in 2007. Some CNG engine manufacturers have indicated that they expect to meet 2010 EPA NOx standards of 0.2 g/bhp-hr with 2007 engines – so the model also includes a curve for 2010-compliant CNG (NOx only).

Life Cycle Cost & Emissions Model Alternative Bus Technologies
M.J. Bradley & Associates Final Report - December 2006 33
NOx Emissions vs SpeedNOx Emissions Curves
0
10
20
30
40
50
60
5 8 11 14 17 20 23 26
MPH
NO
x (g
/mi)
Baseline Diesel Current Diesel
Clean Diesel (2007) Biodiesel
Series/Parallel Hybrid Current CNG
Future CNG (2007)
Figure 2.13 NOx Emissions Curves Used in the Model
For any bus type operated on biodiesel fuel the model uses the same curves as for that bus type operated on #2 diesel fuel, but at all speeds the g/mi emissions rates are adjusted by a constant factor based on the percentage of Biodiesel in the fuel blend (input by the user). The factors used for this adjustment are shown in Figure 2.14. As shown, NOx emissions will increase slightly with increasing biodiesel percentage compared to Baseline Diesel emissions, while all other pollutants will fall. The biodiesel adjustment factors used by the model and shown in Figure 2.14 are based on an EPA biodiesel emissions calculator (16).

Life Cycle Cost & Emissions Model Alternative Bus Technologies
M.J. Bradley & Associates Final Report - December 2006 34
Emissions Reductions Achieved as a Function of Biodiesel Blend(equations represent 2nd order polynomial best-fit line)
y = -1E-04x2 + 0.0792xR2 = 0.9798
y = 0.004x2 - 1.0813xR2 = 0.9996
y = 0.0008x2 - 0.4539xR2 = 0.9993
y = 0.0011x2 - 0.5165xR2 = 0.9995
-80
-70
-60
-50
-40
-30
-20
-10
0
10
20
0 10 20 30 40 50 60 70 80 90 100
% Biodiesel
% C
hang
e in
Em
issi
ons
PM CO NOx HC
Figure 2.14 Adjustments to Baseline Diesel Emissions Curves for Different Biodiesel Blends

Life Cycle Cost & Emissions Model Alternative Bus Technologies
M.J. Bradley & Associates Final Report - December 2006 35
References (1) Department of Energy, Energy Efficiency & Renewable Energy, Clean Cities
Alternative Fuel Price Report, June 2006.
(2) National Renewable Energy Laboratory, New York City Transit Hybrid and CNG Transit Buses: Interim Evaluation Results, Technical Report NREL/TP-540-38843, January 2006
Booz Allen Hamilton and M.J. Bradley & Associates, An analysis of MBTA’s Emission-Controlled Diesel Buses and CNG-Fueled Buses, July 14, 2006
Personal correspondence with M. Bottone, Los Angeles County Metropolitan Transportation Authority
Personal correspondence with B. McAllister, Metropolitan Atlanta Regional Transit Authority
(3) United States General Accounting Office, Report to Congressional Committees – MASS TRANSIT, Use of Alternative Fuels in Transit Buses, GAO/RCED-00-18, December 1999
(4) Chandler, K.; Norton, P.; Clark, N.; Dallas Area Rapid Transit’s (DART) LNG Bus Fleet: Final Results; October 2000
(5) Booz Allen Hamilton and M.J. Bradley & Associates, An analysis of MBTA’s Emission-Controlled Diesel Buses and CNG-Fueled Buses, July 14, 2006
(6) Chandler, K., Battelle; and Walkowicz, K., National Renewable Energy Laboratory; King County Metro Hybrid Articulated Buses: Interim Evaluation Results; Technical Report NREL/TP-540-39742; April 2006
(7) Chandler, K., and Eberts, E., Battelle; Eudy, L., National Renewable Energy Laboratory; New York City Transit Hybrid and CNG Transit Buses: Interim Evaluation Results; Technical Report NREL/TP-540-38843; January 2006
(8) The agencies polled included:
Dallas Area Rapid Transit, Dallas, TX
Toronto Transit Commission, Toronto, ON
Washington Metropolitan Area Transit Authority, Washington, DC
MTA New York City Transit, Brooklyn, NY
Coast Mountain Bus Company, Vancouver, BC
Los Angeles County Metropolitan Transportation Authority, Los Angeles, CA
(9) American Public Transportation Association, Transit Vehicle Database, May 2006, www.apta.com/references/info/pubs

Life Cycle Cost & Emissions Model Alternative Bus Technologies
M.J. Bradley & Associates Final Report - December 2006 36
(10) Kassoy, E.; Kamakate, F.; Leonard, J.; TIAX LLC, Transit Costs1.0; September 2003; Developed under contract to U.S. Department of Energy; www.eere.gov/afdc/apps/toolkit/docs/Mod09b_Transitcost.xls
(11) Federal Transit Administration, National Transit Database, 2004: Table 17 (Energy Consumption) and Table 19 (Transit Operating Statistics); www.ntdprogram.com/ntdprogram/pubs/dt/2004/DataTables04TOC.htm
(12) National Renewable Energy Laboratory, New York City Transit Hybrid and CNG Transit Buses: Interim Evaluation Results, Technical Report NREL/TP-540-38843, January 2006
South Eastern Pennsylvania Transportation Authority, Philadelphia, PA, Hybrid Bus Interim Report.
Personal correspondence with M. Bottone, Los Angeles County Metropolitan Transportation Authority, Los Angeles, CA
Personal correspondence with B. McAllister, Metropolitan Atlanta Regional Transit Authority, Atlanta, GA
Personal correspondence with L. Olander, Duke University (Duke University Robertson buses), Durham, NC
Personal correspondence with D. Leicester, Greater Vancouver Transportation Authority, Vancouver, BC
Personal correspondence with G. LaBouff, MTA New York City Transit, Brooklyn, NY
Personal correspondence with T. Webb, BAE Systems (Syracuse transit)
(13) Pennsylvania Transportation Research Institute, Bus Testing and Research Center, Test Reports STUURA Tests: PTI-BT-R0312-P (New Flyer DE40LF); PTI-BT-R0410 (Gillig LF diesel); PTI-BT-R0113 (Orion VII CNG ); PTI-BT-R0304-P (Orion VII diesel ); PTI-BT-R0405 (Gillig LF hybrid)
(14) Northeast Advanced Vehicle Consortium; Heavy-Duty Vehicle Testing Project Report; Feb 2000 (NYCT/MBTA)
California Air Resources Board; Report 01-01; July 2001 (LACMTA)
Society of Automotive Engineers, SAE 2001-01-0511 (NYCT)
Society of Automotive Engineers, SAE 2002-01-1722 (CARB/LACMTA)
Society of Automotive Engineers, SAE 2002-01-0433 (LACMTA)
West Virginia University; A comparison of Emissions from Hybrid and Conventional Buses; July, 2002 (OCTA)
Society of Automotive Engineers , SAE 2003-01-0300 (NYCT)
Society of Automotive Engineers, SAE 2003-01-1900 (CARB)
Environment Canada; Emissions Research & Measurement Division; Report #04-18; Sept 2004 (BAE)

Life Cycle Cost & Emissions Model Alternative Bus Technologies
M.J. Bradley & Associates Final Report - December 2006 37
Environment Canada; Emissions Research & Measurement Division; Report #02-25-1(ALLISON)
National Renewable Energy Laboratory; Technical Report NREL/TP-540-36355; Dec 2005 (WMATA)
(15) Personal corresepondence with G. LaBouff, MTA New York City Transit, Brooklyn, NY
(16) US Environmental Protection Agency, Biodiesel Emission Reduction Calculation Spreadsheet, Voluntary Diesel Retrofit Program website, Retrofit Technologies – Biodiesel, www.epa.gov/otaq/retrofit/techlist-biodiesel.htm

Life Cycle Cost & Emissions Model Alternative Bus Technologies
APPENDIX A
M.J. Bradley & Associates FINAL Report December 2006 A1

Life Cycle Cost & Emissions Model Alternative Bus Technologies
APPENDIX A
M.J. Bradley & Associates FINAL Report December 2006 A2

Life Cycle Cost & Emissions Model Alternative Bus Technologies
APPENDIX A
M.J. Bradley & Associates FINAL Report December 2006 A3

Life Cycle Cost & Emissions Model Alternative Bus Technologies
APPENDIX A
M.J. Bradley & Associates FINAL Report December 2006 A4

Life Cycle Cost & Emissions Model Alternative Bus Technologies
APPENDIX A
M.J. Bradley & Associates FINAL Report December 2006 A5

Life Cycle Cost & Emissions Model Alternative Bus Technologies
APPENDIX A
M.J. Bradley & Associates FINAL Report December 2006 A6

Life Cycle Cost & Emissions Model Alternative Bus Technologies
APPENDIX A
M.J. Bradley & Associates FINAL Report December 2006 A7

Life Cycle Cost & Emissions Model Alternative Bus Technologies
APPENDIX A
M.J. Bradley & Associates FINAL Report December 2006 A8

Life Cycle Cost & Emissions Model Alternative Bus Technologies
APPENDIX A
M.J. Bradley & Associates FINAL Report December 2006 A9

Life Cycle Cost & Emissions Model Alternative Bus Technologies
APPENDIX A
M.J. Bradley & Associates FINAL Report December 2006 A10

Life Cycle Cost & Emissions Model Alternative Bus Technologies
APPENDIX A
M.J. Bradley & Associates FINAL Report December 2006 A11

Life Cycle Cost & Emissions Model Alternative Bus Technologies
APPENDIX A
M.J. Bradley & Associates FINAL Report December 2006 A12
1.50 (THIS CELL MUST BE FILLED IN)
Low AVG High Low AVG High Low AVG High Low AVG High Low AVG High Low AVG High Low AVG High
$5.71 $5.71 $5.71 $5.71 $5.71 $5.71 $5.71 $5.71 $5.71 $5.71 $5.71 $5.71 $5.71 $5.71 $5.71 $5.71 $5.71 $5.71 $5.71 $5.71 $5.71
$3.22 $3.22 $3.22 $3.25 $3.25 $3.25 $3.22 $3.22 $3.22 $4.31 $4.31 $4.31 $3.27 $3.27 $3.27 $4.42 $4.42 $4.42 $4.42 $4.42 $4.42
$0.32 $0.32 $0.32 $0.35 $0.35 $0.35 $0.32 $0.32 $0.32 $0.41 $0.41 $0.41 $0.35 $0.35 $0.35 $0.43 $0.43 $0.43 $0.38 $0.38 $0.38
$9.40 $10.94 $12.49 $9.43 $10.98 $12.53 $9.40 $10.94 $12.49 $10.35 $12.05 $13.74 $9.80 $11.41 $13.02 $9.74 $11.35 $12.97 $9.75 $11.36 $12.97
$0.00 $0.00 $0.00 $0.00 $0.00 $0.00 $0.00 $0.00 $0.00 $0.06 $0.06 $0.06 $0.00 $0.00 $0.00 $0.05 $0.05 $0.05 $0.05 $0.05 $0.05
DEPOT FLEET ($mil) $20.52 $22.07 $23.61 $20.64 $22.19 $23.74 $20.66 $22.20 $23.74 $22.48 $24.18 $25.88 $21.07 $22.68 $24.29 $21.82 $23.43 $25.05 $21.77 $23.38 $24.99
PER BUS ($mil) $3.08 $3.31 $3.54 $3.10 $3.33 $3.56 $3.10 $3.33 $3.56 $3.37 $3.63 $3.88 $3.16 $3.40 $3.64 $3.27 $3.52 $3.76 $3.27 $3.51 $3.75
PER MILE $8.55 $9.19 $9.84 $8.60 $9.24 $9.89 $8.61 $9.25 $9.89 $9.37 $10.07 $10.78 $8.78 $9.45 $10.12 $9.09 $9.76 $10.44 $9.07 $9.74 $10.41
40-foot buses $ PER MILE $6.79 $7.22 $7.65 $6.83 $7.26 $7.69 $6.83 $7.26 $7.69 $7.25 $7.72 $8.19 $6.95 $7.40 $7.85 $7.31 $7.75 $8.20 $7.29 $7.74 $8.19
26% 27% 29% 26% 27% 29% 26% 27% 29% 29% 30% 32% 26% 28% 29% 24% 26% 27% 24% 26% 27%
40-foot buses TOTAL FLEET COSTS ($mil) $24.45 $25.99 $27.54 $24.58 $26.13 $27.68 $24.60 $26.15 $27.69 $26.10 $27.80 $29.50 $25.03 $26.64 $28.25 $26.30 $27.91 $29.53 $26.25 $27.86 $29.47
-16% -15% -14% -16% -15% -14% -16% -15% -14% -14% -13% -12% -16% -15% -14% -17% -16% -15% -17% -16% -15%
NOTES
1 For 6.7 articulated buses at one depot over 12 years (useful life of buses). CNG Hybrid
2 Assumes that diesel articulated buses cost 480,000$ to purchase and that the increase in cost compared to diesel for Clean Diesel, Biodiesel and DPF retrofit artics is the same 40-foot buses. Assumes the % increase for CNG and Hybrid artic buses 25% 35%
3 Assumes that overhaul costs for articulated buses are 50% greater than for 40-foot buses
4 Assumes that per-mile maintenance costs for articulated buses are 50% greater than for 40-foot buses
5 Assumes that fuel economy from articulated buses is 30% less than from 40-ft buses and 45% less than from 35-ft buses
6 For 12 years (useful life of buses).
$1.90 $2.01
ARTICULATED Clean Diesel
Retrofit Vehicles New Vehicles
ARTICULATED Parallel Hybrid ARTICULATED Series HybridARTICULATED DPF Retrofit
OUTPUT 8 - TOTAL LIFE CYCLE COSTS FOR ARTICULATED BUSES
ARTICULATED BASELINE DIESEL
$1.93 $1.47 $1.46
NPV of Operator Costs ($mil) (1)
$1.64
ARTICULATED Biodiesel ARTICULATED CNG
$1.88
% Difference for Articulated buses
One ARTICULATED Bus will replace 40-foot buses
% Difference for Articulated buses
NPV Of TOTAL COSTS
NPV of Annualized Capital Costs ($mil) (1, 2)
NPV of Bus Overhaul Costs ($mil) (1, 3)
NPV of Annual Bus Maintenance Costs ($mil) (1, 4)
NPV of Annual Bus Fuel Costs ($mil) (1,5)
NPV of Annual Depot Costs ($mil) (6)

Life Cycle Cost & Emissions Model Alternative Bus Technologies
APPENDIX A
M.J. Bradley & Associates FINAL Report December 2006 A13

Life Cycle Cost & Emissions Model Alternative Bus Technologies
APPENDIX A
M.J. Bradley & Associates FINAL Report December 2006 A14
Estimated Total Lifecycle Costs per Mile by Propulsion Technology
$3.00
$4.00
$5.00
$6.00
$7.00
$8.00
$9.00
$/m
i
AVERAGE
HIGH
LOW
KEY
BaselineDiesel
DPFDiesel
BioDiesel CNG CleanDiesel
ParallelHybrid
SeriesHybrid

Life Cycle Cost & Emissions Model Alternative Bus Technologies
APPENDIX A
M.J. Bradley & Associates FINAL Report December 2006 A15
Estimated Average Lifecycle Costs Per Bus by Propulsion Technology
$908,031 $908,031 $908,031 $908,031 $908,031 $908,031 $908,031
$348,557 $353,857 $348,557 $431,804 $357,037$530,777 $530,777
$31,989 $34,988 $31,989$40,503
$34,988
$43,099 $37,960
$1,094,144 $1,097,748 $1,094,144$1,204,545
$1,140,998
$1,135,470 $1,136,324
$216,534 $218,721 $231,846
$189,221$223,231
$169,346 $168,347$0 $0 $0
$6,179$0
$4,737 $4,737
$-
$500,000
$1,000,000
$1,500,000
$2,000,000
$2,500,000
$3,000,000
Life
cycl
e C
ost p
er B
us
Operator Wages Capital Costs Overhaul Costs Maintenance Costs Fuel Costs Depot Costs
BaselineDiesel
DPFDiesel
BioDiesel CNG CleanDiesel
ParallelHybrid
SeriesHybrid

Life Cycle Cost & Emissions Model Alternative Bus Technologies
APPENDIX A
M.J. Bradley & Associates FINAL Report December 2006 A16
Technology Comparison: CO2, GHG Emissions and Fuel Economy
0
500
1,000
1,500
2,000
2,500
3,000
3,500
Baseli
ne
DPF Retr
ofit
Biodies
el
CNG
Clean D
iesel
Paralle
l Hyb
rid
Series
Hyb
rid
Proj
ecte
d Em
issi
ons
(g/m
i)
0.0
0.5
1.0
1.5
2.0
2.5
3.0
3.5
4.0
4.5
5.0
Proj
ecte
d Fu
el E
cono
my
(mpg
)
GHG CO2 Fuel Economy

Life Cycle Cost & Emissions Model Alternative Bus Technologies
APPENDIX A
M.J. Bradley & Associates FINAL Report December 2006 A17
Technology Comparison: PM NMHC and CO Emissions
0.000
0.100
0.200
0.300
0.400
0.500
0.600
0.700
0.800
Baseli
ne
DPF Retr
ofit
Biodies
el
CNG
Clean D
iesel
Paralle
l Hyb
rid
Series
Hyb
rid
PM &
NM
HC
Pro
ject
ed E
mis
sion
s (g
/mi)
0.0
2.0
4.0
6.0
8.0
10.0
12.0
CO
Pro
ject
ed E
mis
sion
s (g
/mi)
PM NMHC CO

Life Cycle Cost & Emissions Model Alternative Bus Technologies
APPENDIX A
M.J. Bradley & Associates FINAL Report December 2006 A18
Technology Comparison: NOx Emissions
0
5
10
15
20
25
30
Baseline DPF Retrofit Biodiesel CNG (2007) CNG (2010) Clean Diesel ParallelHybrid
Series Hybrid
Proj
ecte
d N
Ox
Emis
sion
s (g
/mi)

Life Cycle Cost & Emissions Model Alternative Bus Technologies
APPENDIX A
M.J. Bradley & Associates FINAL Report December 2006 A19
Fuel Costs Used in the Model (per Diesel Equivalent Gallon)
$1.00
$1.50
$2.00
$2.50
$3.00
$3.50
$4.00
$4.50
$5.00
$5.50
$6.00
0 2 4 6 8 10 12 14 16 18 20 22 24
Year
Fuel
Cos
t ($/
DEG
)
#2 Diesel #1 Diesel Biodiesel (B100) Biodiesel (B5) CNG

Life Cycle Cost & Emissions Model Alternative Bus Technologies
APPENDIX A
M.J. Bradley & Associates FINAL Report December 2006 A20
Estimated Total Life-Cycle Fleet Costs - Articulated vs Standard Buses
$0.000
$5.000
$10.000
$15.000
$20.000
$25.000
$30.000
40-fo
ot B
us
Arti
c B
us
40-fo
ot B
us
Arti
c B
us
40-fo
ot B
us
Arti
c B
us
40-fo
ot B
us
Arti
c B
us
40-fo
ot B
us
Arti
c B
us
40-fo
ot B
us
Arti
c B
us
40-fo
ot B
us
Arti
c B
us
Tota
l Fle
et C
osts
Operator Wages Capital Costs Overhaul Costs Maintenance Costs Fuel Costs Depot Costs
BASELINEDIESEL
DPFRETROFIT BIODIESEL CNG CLEAN
DIESELPARALLEL
HYBRIDSERIESHYBRID
10 Based 40 - foot ) buses and 6.7 articulated busesstandard (

Life Cycle Cost & Emissions Model Alternative Bus Technologies
APPENDIX A
M.J. Bradley & Associates FINAL Report December 2006 A21
Incremental $/ton CO2 Reduced, Relative to Different Baselines
($5,000)
$0
$5,000
$10,000
$15,000
$20,000
$25,000
$30,000
DPF Retrofit Biodiesel CNG Clean Diesel Parallel Hybrid Series Hybrid
#2 Diesel Biodiesel (B20) Compressed NaturalGas
#2 Diesel #2 Diesel #2 Diesel
Relative to Baseline Diesel Relative to Clean Diesel Relative to DPF Retrofit Relative to Biodiesel
Negative $/ton indicates that the technology reduces CO2 relative to the baseline but is less expensive than the baseline.No bar indicates that the technology option does not reduce CO2 relative to the baseline.