Embed Size (px)
Citation preview

1
Alternative Designs for Tariffs on Embodied Carbon:
A Global Cost-Effectiveness Analysis
Christoph Böhringerac
, Brita Byebc
, Taran Fæhnbc
, and Knut Einar Rosendahlbc
Abstract: In the absence of effective world-wide cooperation to curb global warming, import tariffs
on embodied carbon have been proposed as a potential supplement to unilateral emissions pricing. We
systematically consider alternative designs for such tariffs, and analyze their effects on global welfare
within a multi-region, multi-sector computable general equilibrium (CGE) model of global trade and
energy. Our analysis shows that systems more likely to comply with international law yield very little
in terms of carbon leakage and efficiency. Generally, the effectiveness increases substantially with
complexity. However, regionalising the tariffs seems not to be worthwhile. Also, the most effective
system we identify is not based on fully input-output-corrected carbon contents, but on direct plus
electricity emissions, only. This reflects the more general problem of finding systems that are both
feasible and well-targeted in a real global economy.
Key Words: carbon leakage, embodied carbon, border tariffs
JEL Classification Numbers: Q43, Q54, H2, D61
aDepartment of Economics, University of Oldenburg, Germany
bStatistics Norway, Oslo, Norway
cWhile carrying out this research we have been associated with CREE - Oslo Centre for Research on
Environmentally Friendly Energy. The CREE Centre acknowledges financial support from The
Research Council of Norway, University of Oslo and user partners.

2
1. Introduction
In the absence of effective world-wide cooperation to curb global warming, some economies have
introduced national or regional climate policies. However, as the climate problem is global, unilateral
action potentially leads to carbon leakage1, i.e., the relocation of emissions to countries with no or
more lenient climate regulations. Theory suggests that border measures, like import tariffs and export
subsidies on the carbon embodied in trade, can be used as a second-best instrument to improve the
economic efficiency of unilateral emissions pricing policies (Markusen, 1975; Hoel, 1996; Gros,
2009).
Economic theory indicates that the most efficient import tariff system is one that mimics the carbon
pricing of domestic emissions. However, desirability and feasibility of border measures depend on
legal, practical and political considerations that must be balanced against the scope for efficiency
gains. We compute the efficiency impacts of a wide range of alternative tariff systems on embodied
carbon (so-called carbon tariffs) by means of a computable general equilibrium (CGE) model of the
world economy. In our impact assessment we combine the main elements of possible tariff structures
in a systematic way, quantify the efficiency gains of approaching more comprehensive and targeted
systems, and discuss the trade-offs involved. The quantified effectiveness gains of moving towards
more and more complex systems can provide useful policy guidance as to what are acceptable costs of
moving along that line in terms of legal, practical and political obstacles.
In our central case simulations, we consider Europe as the regulating coalition. Two further coalitions
are also analyzed, one including all Annex-1 regions (except for Russia) and an even larger one adding
China.
The carbon tariffs are varied along three dimensions:2
(i) embodied carbon coverage: what emissions embodied in the production of imported goods are
covered (only direct emissions, direct emissions plus indirect emissions embodied in
electricity input, or total input-output embodied emissions),
(ii) sector coverage: which goods are subject to tariffs (only the energy-intensive and trade-
exposed sectors or all sectors),
(iii) tariff rate differentiation: whether the carbon content basis is country- and sector-specific or
only sector-specific (in which case embodied carbon averages are used of either the coalition
regions or the non-coalition regions).
1 For a more comprehensive discussion of the concept carbon leakage, see the model comparison project in this special issue.
2 In all simulations, the sectoral aggregation level is fixed. Two other contributions in the Special Issue study this dimension.

3
Previous analyses of carbon tariff systems vary with respect to the choices along the dimensions
presented above, but few shed light on the relative performance of different choices.3 The bulk of
economic analyses assessing embodied carbon tariffs focuses on direct emissions from fossil fuel
inputs and indirect emissions from electricity use only (e.g., Winchester, 2011). Matto et al. (2009) use
total embodied carbon in their carbon content metric. Likewise, structural path analyses (see, e.g.,
Babiker et al., 1997; Peters and Hertwich, 2008) seek to grasp the carbon content of traded goods from
cradle to grave. Our study compares all these three carbon content metrics. The choices of goods
coverage likewise tend to vary from analysis to analysis. Our contribution is to compare different
coverages systematically with respect to leakage and efficiency outcomes. A few studies have
compared two different carbon content bases for the tariff calculation, one where the (direct) average
carbon content of non-abating regions is used and one where that of the abating regions is used; see
e.g. Mattoo et al. (2009) and Kuik and Hofkes (2010). They show that this choice is of vital
importance, as the abating regions have significantly lower carbon content in most relevant policy
scenarios. Our contribution along this dimension is that we also include analyses of country/region-
specified carbon content bases. Finally, we systematically investigate the effects of coalition size
variation, and we look at the interaction effects among the various choices.
Our numerical results largely confirm the qualitative insights from basic second-best reasoning. The
more complex and targeted systems are also the more cost-effective and capable of reducing leakage.
Surprisingly, irrespective of coalition size we find that the most cost-effective policy imposes tariffs
on all import products’ direct and electricity emissions, while excluding other indirect emissions.4 The
result illustrates the difficulty of finding metrics of the carbon content that are both realistic and well-
targeted as instructed by theory; see Hoel (1996). The total embodied carbon measure we apply still
leaves out numerous indirect emissions effects of the tariffs, which can increase leakage to non-
coalition countries. Furthermore, total embodiment tends to price some emissions in the coalition
twice, as parts of the embodied carbon in imports originate from intermediates already taxed and
exported from coalition to non-coalition countries. In addition, the CGE model incorporates numerous
existing tax and subsidy interventions that could give rise to distortions and thereby affect the welfare
effects of the tariffs.
Our numerical simulations reveal substantial differences in global cost savings across alternative tariff
designs. In our central case with Europe as the coalition, the global efficiency cost savings of imposing
carbon tariffs vis-à-vis emissions pricing stand-alone range between 2% and 16%. These potential
3 The model comparison project in this special issue have selected only one carbon tariff structure, where only emission-
intensive and trade-exposed (EITE) industries are subject to tariffs and where rates are based on the direct carbon content
plus indirect emissions from electricity inputs specified for each exporting region and sector. 4 When tariffs are imposed only on energy-intensive and trade-exposed products, using the total embodied carbon content
turns out more cost efficient than using the direct and electricity emissions, only.

4
savings indicate the cost ceiling of legal, political and administrative obstacles for the system to be
worthwhile. The least cost-effective systems are based on domestic carbon contents and direct
emissions, and cover only the particularly energy-intensive and trade-exposed industries. Such
systems have been advocated due to their advantageous legal, political and practical characteristics;
see, e.g., Ismer and Neuhoff (2007), Mattoo et al. (2009), and Persson (2010). Unfortunately, our
calculations indicate that imposing such systems would yield very little in terms of reduced leakage
and global cost reductions. Efficiency gains are not noteworthy unless tariffs are based on carbon
contents outside of the coalition. The good news is, however, that opting for region-specific rather
than average foreign carbon content bases adds very little in terms of efficiency and lower carbon
leakage. Sticking to averages can, thus, increase feasibility at virtually no effectiveness cost. Last but
not least, in most cases imposing tariffs on all import goods seems to be surprisingly more effective
than covering only the most energy-intensive and trade-exposed products. This has implications for
the amount of information and number of parties involved. I all cases we do, however, assess
information costs to be relatively low as long as the coalition harmonizes its procedures and relies on
official sources (Persson, 2010; Evans, 2003).
The remainder of the paper is structured as follows: Section 2 presents the ideal tariff system from a
strictly economic efficiency point of view. These conclusions are challenged when the perspective is
broadened, and some practicability issues are scrutinised in Section 3. Section 4 describes our
numerical method for assessment and the underlying data. Section 5 lays out the policy scenarios,
while Section 6 presents our numerical simulation results. Section 7 concludes.
2. Carbon tariffs – theoretical reasoning
Unilateral policy targeted towards greenhouse gas emissions involves the risk of so-called carbon
leakage. The issue of using trade policy measures to curb carbon leakage from countries that have
carbon policies was raised already by Markusen (1975) in a model for two countries and two goods,
and further developed by Hoel (1996) in a more general n-country, n-good model. Both authors show
that an optimal unilateral policy is to combine a uniform carbon tax (or auctioned emission quotas)
with tariffs on carbon-intensive imports and subsidies on carbon-intensive exports. The import tariffs
should mimic the domestic emission price on the carbon content of all goods that are not regulated in
the countries of origin.
Hoel (1996) maximizes domestic (or coalition) welfare with respect to a domestic (or coalition) carbon
tax and a system of import tariffs (and export subsidies), where welfare consists of the coalition’s
utility of consumption minus the environmental costs of global emissions. He finds that the optimal
tariffs consist of two terms. The first is the terms of trade effect: A tariff reduces imports, which in
general reduces the import price and improves terms of trade (alike optimal tariffs in the trade policy

5
literature). The second term is the foreign emission effect: A tariff reduces emissions abroad by
contracting foreign supply. In this study we evaluate the efficiency of different carbon metrics with
respect to global costs of achieving a global emissions target through unilateral action of a coalition.
In this case the strategic terms of trade effect disappears,5 and the optimal tariff for all traded goods tj
can be expressed by the foreign emission effect (Hoel, 1996, eq. 11):
(1) j jt e .
θ is the coalition’s (uniform) carbon tax and ej is the marginal effect on foreign emissions of changes
in net imports of j, mj. The vector of foreign emissions, e, depends on net imports via the effects of net
imports on the vector of international prices, p:
(2) ( ) ( ( ))e e m f p m .
The marginal effect on e of a change in mj is
(3) ij
i i j
pfe
p m
.
The foreign emission effect reflects the marginal change in all foreign emissions of increased net
imports, accounting for all market adjustments taking place and the respective emission intensities
involved. The optimal tariff will be higher the higher is the carbon tax in the coalition and the larger is
the reduction in foreign emissions for a given (net) import change. The latter depends on how strongly
tariffs affect international prices and thereby change supply and demand in the rest of the world.
Imposing updated firm- or even sector-specific import tariffs on total embodied carbon across all
traded goods is very data demanding and probably impeded by legal, practical and political
constraints, some of which we will discuss in the next section.
3. Feasibility of carbon tariffs
3.1. Legality
A major concern is how carbon tariffs would comply with the WTO law. Two central GATT (General
Agreement on Tariffs and Trade) rules that can be violated by carbon tariffs include (i) the most-
favoured nation principle (Article I), which ensures that imports from all parties of WTO be treated
similarly in accordance with the most favoured, and (ii) the national treatment principle (Article III),
which likewise prevents discrimination between similar imported and domestically produced products.
5 Gros (2009) maximizes global welfare and finds that the optimal tariff depends on the coalition’s carbon tax and a foreign
emission effect as in Hoel (1996).
6
Crucial for the considerations on discrimination is the question whether GATT rules can consider
products as dissimilar if their characteristics are similar, and only their production processes and
methods differ. If so, the challenge remains of what is sufficient documentation of the production
methods. This brings up the complex issue of carbon-content metrics. The metrics should give relevant
information about the production methods of the single products facing border measures, without
risking discrimination. At the same time, too complex and costly bureaucracy on the border can also
be a case of violation of the articles. Another criterion for non-discrimination is that the border
treatment of imports accounts for the carbon-restrictiveness of measures in the countries of origin.
Similar treatment implies that only the restrictiveness gap should be taxed. It is a major challenge to
compare different designs of carbon emission regulations across countries and quantify gaps in
restrictiveness on a bilateral basis.
Possible violations of Articles I and III, including the question of whether measures can be based on
production methods, can be overcome by resorting to Article XX of GATT. Production method bases
have been accepted in previous disputes (Pauwelyn, 2007). GATT’s Article XX has two clauses that
can justify exceptions in the case of carbon tariffs, one on ”necessary (measures) to protect human,
animal and plant life or health” and one on “(measures) relating the conservation of exhaustible
natural resources”.
The first clause involves an assessment of the necessity of the carbon tariff measure. Assessing the
necessity includes balancing the ends in the clause with other concerns, including the free trade
objectives of WTO. Previous disputes have put much emphasis on preventing measures from being
disguised trade restrictions or arbitrarily discriminatory. Another important concern has been fairness,
which in earlier cases has led to favourable treatment of less developed countries (Holzer, 2010).
Necessity considerations also relate to whether the measure empirically can help reach the ends and
can do so sufficiently more effectively than other, less trade-restrictive measures. In previous cases,
negotiations among the partners have been put forward as a prerequisite for trade-restrictive measures
to be justifiable. The question remains whether the UNFCCC-framed negotiations fulfil this
requirement.
The second clause can apply only if the climate can be regarded as an exhaustible natural resource. It
also involves the assessment of means and ends. Previous panels have ruled clean air as an exhaustible
natural resource, and climate can probably be covered by the same assessment. Besides, climate
change affects other natural resources. The long-term nature of climate change can pave the way for a
less restrictive interpretation of the observable evidence needed on the relationship between the means
and the ends.
In light of the legal obstacles, Ismer and Neuhoff (2007) suggest using the carbon content of the best
available technology. This will ensure that equal products are treated similarly in accordance with

7
Article I and III. Besides, it will avoid the obligation for each producer to demonstrate their true
carbon content on the border. Such a practice would, by law, have to be controlled by the exporting
jurisdiction and, most likely, weaken the enforcement power.
As carbon tariffs are likely to run counter some way or other with the current WTO rules, and as
litigations need to be instituted in each case – a procedure which is resource-consuming and short-
sighted – more permanent and practical solutions have been suggested. Changing WTO law involves
complex procedures. Hoerner and Muller (1996) rather suggest an institution established under the
UNFCCC umbrella, which overrides WTO law on trade-related climate measures. However, whether
negotiations on carbon tariffs take place within the UNFCCC or WTO consensus seems to be far-
fetched, given the developing countries’ opposition to greenhouse gas mitigation burdens and their
concern for market access.
A more feasible solution would be to grant a waiver to the WTO. That would need approval by three
fourth of the members and apply for a limited time, only (Holzer, 2010). Another approach would be
to enter separate multilateral or bilateral carbon tariffs agreements with parts of the WTO members
(Hufbauer et al, 2009; Bacchus, 2010). These would, however, bind only members who sign and, thus,
involve free-rider problems because of the most-favoured-nation principle of the WTO.
3.2. Practicability
Irrespective of legal problems, the formulation and implementation of rules and procedures for
calculating the carbon content of imports constitute complex tasks. Besides advising best available,
technologies as the basis for carbon content calculations, Ismer and Neuhoff (2007) recommend that
only emissions from the main basic materials and electricity are included in the basis for the tariff
calculations. They also suggest confining the coverage to the most energy-intensive and trade-exposed
industries. All these attributes would serve to moderate data requirements. However, by law a carbon
tariff system would have to allow for lowered tariffs if the foreign producers can document lower
emissions than presupposed.
The realistic solutions discussed in the literature will provide hardly any incentive at the firm level to
search for less carbon-intensive production methods and deliveries of intermediates. Though input-
output information is prepared for most economies, these data are, overall, too aggregate and too
infrequently updated for this purpose (Andrew et al., 2009). Even in the most detailed structural path
analyses (e.g., Peters and Hertwich, 2008) there are large uncertainties due to data inaccuracies,
approximations, and manipulations. Ismer and Neuhoff (2007) argue that bottom-up approaches are

8
more appropriate. For selected businesses such data could be collected on the border. A resembling
system exists for food products in many countries.6
To our knowledge, no calculations of costs associated with the governments’ administration and firms’
compliance of alternative carbon tariff designs have been undertaken so far. Persson (2010) presents
scattered estimates of transaction cost components in international trading and carbon accounting, and
concludes that costs will depend heavily on the data requirements needed and standardising efforts
undertaken. She refers to Hummel (2001), who calculated the costs of time-consuming border
procedures to a 0.8% extra tariff equivalent per day, however, without valuing border tariff systems in
terms of labour efforts. Further, she suggests that most of the costs of border measures will fall on the
regulating jurisdiction, while compliance costs of exporters could be held down by including the
system in existing customs procedures, establishing electronic infrastructures and harmonising the
guidelines among regulating countries. Evans (2003), who surveys estimates provided for other forms
of taxation based on product information, also finds that uniform systems are less costly. Further, he
finds clear evidence of economies of scale in tax systems, as also claimed by Persson (2010) in the
case of administrative costs of border measures.
A main finding in the surveyed material of Evans (2003) is that systems involving private compliance
costs are relatively costly compared with systems confined to entail public administration costs only.
Estimates of public administration costs correspond to around 1 % of the tax revenue, while the cost
estimates increase by another 2 to 16% when compliance costs for informants/firms are involved.
Operations are significantly cheaper when conducted in developed rather than in developing countries.
Consequently, it is reasonable to expect that less precise and less complex systems based on
centralised information from national accounts and other official sources will be significantly cheaper
than systems based on information collected from traders on the border.
3.3. Political considerations
One major political concern that triggered the debate on border measures is the issue of
competitiveness of energy-intensive firms in regulating countries. Besides national political
(economy) considerations, it can be argued that border measures can incentivise non-coalition
countries to commit to and sign international agreements on mitigation. However, even though
individual firms or industries might be hit hard, the non-coalition economies as a whole may be little
affected as long as exports subjected to tariffs constitute only a small share of domestic production or
re-routing of export to non-abating trading partners is relatively easy. The potential for efficiency
6 Prior to the Uruguay round the EU, for instance, applied variable import levies to ensure that the food industry was
compensated for cost variations stemming from input prices of agricultural products. Hence, for the border taxes to give the desired effects and incentives, information on the input structure of the production abroad was needed. In principle, also indirect inputs of agricultural products justified compensatory import levies.

9
gains has to be weighed against possible adverse effects such as legal disputes or the deterioration of
the political climate for international cooperation. Retaliation from countries like China is also a
possible strategic response that must be taken into account. Nothing can prevent non-coalition states
from introducing border measures based on their own climate policy principles, e.g. on emissions-per-
capita terms. The distributional effects of the tariff system, per se, might trigger trade disputes, even in
cases where the combined outcome of the carbon tax and tariff systems is still positive for foreign
stakeholders. Besides, the distributional impact is an issue in itself, given that the most probable
coalitions tend to consist of relatively wealthy countries, while those threatened by carbon tariffs tend
to be emerging or less developed economies. The latter on average are net exporters of embodied
carbon to industrialized countries and will most likely face terms-of-trade losses from the imposition
of carbon tariffs (Böhringer et al., 2011).
4. Numerical model and data
4.1. Computable general equilibrium model of the world economy
For our quantitative economic impact analysis of alternative carbon tariff designs we use a generic
multi-region, multi-sector CGE model of global trade and energy established for the analysis of
greenhouse gas emission control strategies (see, e.g., Böhringer et al., 2010). CGE models build upon
general equilibrium theory that combines behavioural assumptions on rational economic agents with
the analysis of equilibrium conditions. They provide counterfactual ex-ante comparisons, assessing the
outcomes with a reform in place with what would have happened had it not been undertaken. The
main virtue of the CGE approach is its comprehensive micro-consistent representation of price-
dependent market interactions in a setting with various, existing public interventions. The
simultaneous explanation of the origin and spending of the agents' income makes it possible to address
both economy-wide efficiency as well as distributional impacts of policy reforms.
Our model features a representative agent in each region that receives income from three primary
factors: labour, capital, and fossil-fuel resources. Labour and capital are intersectorally mobile within a
region but immobile between regions. Fossil-fuel resources are specific to fossil fuel production
sectors in each region. Production of commodities, other than primary fossil fuels is captured by three-
level constant elasticity of substitution (CES) cost functions describing the price-dependent use of
capital, labour, energy and materials (KLEM). At the top level, a CES composite of intermediate
material demands trades off with an aggregate of energy, capital, and labour subject to a constant
elasticity of substitution. At the second level, a CES function describes the substitution possibilities
between intermediate demand for the energy aggregate and a value-added composite of labour and
capital. At the third level, capital and labour substitution possibilities within the value-added

10
composite are captured by a CES function whereas different energy inputs (coal, gas, oil, and
electricity) enter the energy composite subject to a constant elasticity of substitution. In the production
of fossil fuels, all inputs, except for the sector-specific fossil fuel resource, are aggregated in fixed
proportions. This aggregate trades off with the sector-specific fossil fuel resource at a constant
elasticity of substitution.
Final consumption demand in each region is determined by the representative agent who maximizes
welfare subject to a budget constraint with fixed investment (i.e., a given demand for savings) and
exogenous government provision of public goods and services. Total income of the representative
household consists of net factor income and tax revenues. Consumption demand of the representative
agent is given as a CES composite that combines consumption of composite energy and an aggregate
of other (non-energy) consumption goods. Substitution patterns within the energy bundle as well as
within the non-energy composite are reflected by means of CES functions.
Bilateral trade is specified following the Armington’s differentiated goods approach, where domestic
and foreign goods are distinguished by origin (Armington, 1969). All goods used on the domestic
market in intermediate and final demand correspond to a CES composite that combines the
domestically produced good and the imported good from other regions. A balance of payment
constraint incorporates the base-year trade deficit or surplus for each region.
CO2-emissions are linked in fixed proportions to the use of fossil fuels, with CO2-coefficients
differentiated by the specific carbon content of fuels. Restrictions to the use of CO2-emissions in
production and consumption are implemented through exogenous emission constraints or
(equivalently) CO2-taxes. CO2-emission abatement then takes place by fuel switching (interfuel
substitution) or energy savings (either by fuel-non-fuel substitution or by a scale reduction of
production and final demand activities).
4.2. Data
Our CGE analysis of embodied carbon tariffs is based on the GTAP 7.1 dataset which includes
detailed national accounts on production and consumption (input-output tables) together with bilateral
trade flows and CO2 emissions for up to 112 regions and 57 sectors (Badri Narayanan and Walmsley,
2008). GTAP can be flexibly aggregated towards a composite dataset that accounts for the specific
requirements of the policy issue under investigation, in our case the global efficiency impacts of
alternative carbon tariff schemes. The composite dataset in use includes all major primary and
secondary energy carriers: coal, crude oil, natural gas, refined oil products, and electricity. This
disaggregation is essential in order to distinguish energy goods by CO2 intensity and the degree of
substitutability. In addition, we separate the main emission-intensive and trade-exposed sectors:
chemical products, non-metallic minerals, iron and steel products, and non-ferrous metals, as they will

11
be the most affected by emission control policies and the prime candidates for embodied carbon
tariffs. Regarding regional coverage, we explicitly include all major industrialized and developing
countries to capture international market responses to unilateral emission regulation. Table 1
summarizes the sectors (commodities) and regions present in our actual impact analysis of alternative
carbon tariff schemes.
Table 1: Model sectors and regions
Sectors and commodities Countries and regions
Energy Annex 1 (industrialized) regions
Coal (COL) Europe – EU-27 plus EFTA (EUR)
Crude oil (CRU) United States of America (USA)
Natural gas (GAS) Japan (JPN)
Refined oil products (OIL)* Canada (CAN)
Electricity (ELE) Australia and New Zealand (ANZ)
Russia (RUS)
Emission-intensive & trade-exposed sectors* Remaining Annex 1 (RA1)
Chemical products (CRP)
Non-metallic minerals (NMM) Non-Annex1 (developing) regions
Iron and steel industry (I_S) Energy exporting countries excl. Mexico (EEX)
Non-ferrous metals (NFM) Brazil (BRA)
Mexico (MEX)
Transport sectors** China (CHN)
Air transport (ATP) India (IND)
Water transport (WTP) Other middle income countries (MIC)
Other transport (OTP) Other low income countries (LIC)
Other industries and services**
Fishery (FSH)
Agriculture (AGR)
Paper–pulp–print (PPP)
All other manufactures and services (AOG) *Included in the composite Energy-intensive, trade-exposed industries (EITE). ** Included in the composite Other, non-energy sectors (OTH).
For model parameterization we follow the standard calibration procedure in applied general
equilibrium analysis: the base-year input-output data determines the free parameters of the functional
forms (cost and expenditure functions) such that the economic flows represented in the data are
consistent with the optimizing behaviour of the model agents. The responses of agents to price
changes are determined by a set of exogenous elasticities taken from the pertinent econometric
literature. Elasticities in international trade (Armington elasticities) and substitution possibilities in
production (between primary factor inputs) are directly provided by the GTAP database. The

12
elasticities of substitution in fossil fuel sectors are calibrated to match exogenous estimates of fossil-
fuel supply elasticities (Graham et al., 1999; Krichene, 2002).
For the design of alternative carbon tariff schemes we need to calculate the different components
adding up to the total carbon content embodied in goods. In addition to the direct carbon emissions
stemming from the combustion of fossil fuel inputs there are indirect carbon emissions associated with
intermediate non-fossil inputs which may be further decomposed into indirect carbon from electricity
inputs and indirect carbon from all other (non-electric and non-fossil) inputs. Following Böhringer et
al. (2011) we apply simple multi-region input-output calculus on the GTAP dataset to derive the total
carbon content of production across sectors and regions. Figure 1 compares cross-country differences
in embodied carbon for two production segments of the economy: the composites of Emission-
intensive, trade-exposed (EITE) sectors, and of Other, non-energy (OTH) sectors. We can furthermore
distinguish how indirect carbon emissions split up between domestically produced inputs and imported
inputs. Our decomposition of embodied carbon gives insights into the relative importance of embodied
carbon for imports of EITE and OTH goods (note that grid-based electricity is hardly traded across
larger geopolitical regions, and thus embodied carbon of imported electricity is omitted from Figure
1).
Figure 1. Embodied carbon in selected regions* for the EITE and OTH goods composites
0
0.5
1
1.5
2
2.5
3
3.5
4
EITE OTH EITE OTH EITE OTH EITE OTH EITE OTH EITE OTH EITE OTH EITE OTH
WORLD BRA CHN EUR IND JPN RUS USA
kg/$
direct electricity domestic other domestic other imported
* For the abbreviations of regions, see Table 1.

13
We see that emission intensities vary drastically across regions. Non-OECD regions are generally
more emission-intensive than OECD regions, with Brazil being an important exception (due to the
massive use of hydropower and biofuels). As expected, embodied carbon in EITE sectors is much
higher than that in OTH sectors within each region. Across regions, it is remarkable that the embodied
carbon content in OTH sectors of larger non-OECD regions such as China or Russia is higher than the
embodied carbon of EITE sectors in most OECD regions including Europe, Japan and USA.
Moreover, direct emissions constitute only a modest share of total embodied carbon, both for EITE
and OTH products. Indirect emissions from electricity use are on average of approximately the same
size as direct emissions, whereas other indirect emissions account for the largest share in most
countries. This is particularly the case for OTH goods.
The input-output calculations provide additional information on the carbon embodied in trade across
regions. Figure 2 reports global trade values and CO2-intensities of the two product categories EITE
and OTH, as well as the individual EITE sectors.
Figure 2. Global trade value and average CO2 intensity of selected sectors*
CR
P
I_S
NFM
NM
M
OIL
EIT
E
OTH
0
1000
2000
3000
4000
5000
6000
7000
8000
9000
0 0.5 1 1.5 2 2.5
CO2-intensity (kg/$)
Tra
de
(B
ill.
$)
* For abbreviations of goods, see Table 1.
The scatter plot shows that the value of global trade in OTH products is several times higher than
global trade in all EITE products, together. The emissions intensities on the other hand are lower.
Accounting for these differences in trade volume and CO2 intensity, global trade in carbon is about
30% higher for the OTH sector group than for the EITE group. This observation is important when we

14
consider import tariffs for all sectors, not only for EITE sectors. Among the EITE sectors, chemical
products account for the largest share of traded carbon worldwide.
5. Carbon tariff scenarios
We investigate combinations of tariff design variants along the following dimensions:7
(i) Embodied carbon coverage:
- DIR: the tariff is levied on direct (fuel) emissions, only.
- INDIR: the tariff is levied on direct (fuel) emissions plus indirect emissions from electricity.
- TOTAL: the tariff is levied on the total embodied carbon.8
(ii) Sector coverage:
- EITE: only emission-intensive and trade-exposed sectors are subject to import tariffs.
- ALL: all sectors are included in the tariff regime.
(iii) Tariff rate differentiation: 9
- DOMEST: Uniform embodied carbon tariffs are applied to all unregulated countries, based on
the average carbon content of the abating coalition.
- FOREIGN: Uniform embodied carbon tariffs are applied to all unregulated countries, based
on the average carbon content of the non-coalition (importing) countries.
- REGION: Tariffs are applied specific for each exporting country/region in the model, based
on their carbon content.
The scenarios seek to operationalize systems with different emphasis on the economic, practical, legal,
and political concerns discussed above. For all the three dimensions (i), (ii), and (iii), increasing
complexity and detail will in general serve economic efficiency, but at the potential expense of
practicability. However, data required to calculate carbon contents for the suggested systems are
publicly available from national accounts and other official sources. Based on Evans (2003) (cf. the
discussion in Section 3.2 above), private compliance costs can therefore be disregarded and public
administration costs held low. Legal and political cost implications of the systems are less obvious.
When (i) embodied carbon coverage is high, the legal risk of generating bureaucracy on the border,
along with the political risk of trade wars, will be high (because tariffs rise). On the other hand, higher
tariffs would be more politically effective, both as coercion tactics to join the coalition and as means to
satisfy domestic industry lobbyists. A complete versus a partial (ii) sector coverage also has
ambiguous political cost implications; while the risk of provoking resistance becomes more
widespread, it would avoid the politically delicate task of selecting some sectors. Increasing (iii) tariff
7 The tariffs are always calculated using base-year emission intensities provided by the GTAP dataset for 2004.
8 Including embodied carbon in imports to the exporting country may imply double regulation of emissions in coalition
countries when these emissions come from producing intermediate goods that are exported to non-coalition countries.

15
rate differentiation can provoke trade disputes initiated by countries facing relatively high tariff rates.
The legal basis can be the GATT I and III principles on non-discrimination of similar products. On the
other hand, more accurate carbon content bases lower the risk of illegal, arbitrary treatment of firms.
We assess the resulting 18 combinations of alternative tariff designs for three different coalition sizes:
the case in which Europe goes ahead with unilateral action (EU), the case where other Annex-1
regions except for Russia join an abatement coalition with the EU (A1xR) and finally the case in
which China enters the A1 coalition (A1xR_CHN). In total, this leaves us with 54 tariff scenarios. For
the sake of brevity and transparency, our results discussion focuses on those scenarios where only
Europe adopts an active climate policy and imposes carbon tariffs on the EITE sectors. Yet, we will
also briefly refer to the main findings with bigger coalitions and with carbon tariffs on all products.
The economic impacts of alternative tariff schemes are compared with a reference policy (ref) where
unilaterally abating regions abstain from the imposition of tariffs and just apply domestic emissions
pricing.10
In order to provide a meaningful cost-effectiveness analysis, global emissions must be kept
constant across all policy simulations (for a given size of the abatement coalition). The global
emissions level is defined as the sum of the emissions cap adopted by unilaterally abating regions and
base-year, business-as-usual (BaU) emissions of unregulated regions. In our central case simulations
we assume a unilateral cap at 80 % of the abating regions’ BaU emissions.11
6. Simulation results
6.1. Carbon leakage and carbon prices
Before discussing the efficiency effects of the different tariff designs, it is instructive to examine how
they affect carbon leakage and carbon prices. In the reference scenario, i.e., unilateral emissions
pricing without carbon tariffs, the leakage rate is 17%.12
This is in the mid-range of other estimates of
leakage due to pricing of CO2 (see e.g. Gerlagh and Kuik, 2007), including the estimates provided by
the current model comparison reported in this special issue. The leakage rate depends on a number of
more or less uncertain parameters, in particular Armington elasticities, fossil fuel supply elasticities,13
9 Tariffs are sector-specific in all the sub-variants considered here.
10 We assume that emissions are reduced efficiently within the abatement coalition through the implementation of a regional
emissions trading system. 11
The global emission constraint requires that the initial emission cap of the abating region is scaled endogenously to
“compensate” for emission leakage. 12
The leakage rate is conventionally measured as the emission increase in non-regulated countries over the emission
reduction in regulated countries. 13
One set of the scenarios in the model comparison project in this Special Issue assumes that fossil fuel prices are held
constant when climate policies are introduced in the EU (or a wider coalition). Then we are left with leakage through the

16
and KLEM substitution elasticities. As mentioned in Section 4.2, our parameter choices are based on
available estimates in the literature. The leakage rate also depends on the coalition size (Böhringer et
al., 2011), which we return to below, and the abatement ambitions.
The leakage effects – depicted in Figure 3 for the cases with EU climate policies – are consistent with
our previous theoretical discussion: Leakage declines as more embodied emissions are included, and is
lowest when tariffs are country-specific and thus more accurate. The leakage rate falls from 17% in
the reference scenario to 14%, 11% and 8% in the scenarios with region-specific tariffs on EITE
products (DIR, INDIR, TOTAL). With uniform tariffs based on total embodied carbon in the EU, the
leakage rates are slightly closer to the reference leakage rate than to the leakage rates with region-
specific tariffs. On the other hand, if the uniform tariffs are based on non-EU emissions, the leakage
rates are closer to the non-uniform rates.
Figure 3. Carbon leakage rates (%)* with EU coalition under alternative tariffs on EITE
products
0
2
4
6
8
10
12
14
16
18
DIR INDIR TOTAL
%
DOMEST FOREIGN REGION Reference
* For the definition of the carbon leakage rate, see Footnote 12.
We find similar conclusions for larger coalition sizes where leakage rates are in general much smaller
than for the EU coalition. In the reference scenarios they are 7% (coalition A1xR) and 4%
(A1xR_CHN). When tariffs are based on total region-specific emissions, the leakage rates fall to 2%
product markets, mainly the energy-intensive products. These simulations indicate that a majority of leakage takes place through the fossil fuel markets, although the simulation results vary somewhat.

17
and 1%, respectively. If the tariffs are introduced for all goods, not just EITE products, leakage rates
decline further.
Given that unilateral abatement policies must comply with an exogenous global emissions level,
reduced leakage implies that less emission reductions have to take place within the coalition. Thus, we
should expect that the carbon price drops when leakage rates fall. Whereas the carbon price is 57 $/ton
of CO2 in the EU’s reference scenario, it falls to 47 $/ton of CO2 in the scenario with region-specific
tariffs based on total embodied carbon. The carbon price reductions are smaller when all Annex 1
countries form the coalition, and much smaller when both Annex 1 and China join the coalition.
6.2. Global welfare effects
We now examine the global welfare effects, and start by looking at the scenarios where the EU
imposes carbon tariffs on EITE products. Changes in global welfare are measured from a utilitarian
perspective where we add up money-metric utility with equal weights across all regions. While this
measure is a standard metric to quantify global welfare changes, it remains agnostic about cost
distribution. In the reference scenario without tariffs, the global welfare costs amount to 0.28%, cf.
Figure 4. The imposition of carbon tariffs reduces global costs between 2% and 13%. As Figure 4
shows, there is a clear ordering when we focus on two dimensions of tariff design, i.e., embodied
carbon coverage and tariff rate differentiation: Global welfare costs are reduced when the embodied
carbon metric is changed from only direct emissions to direct plus electricity emissions, and further to
total embodied carbon. Moreover, costs are reduced when we move from uniform tariffs (across
regions) to country-specific tariffs, and uniform tariffs based on embodied carbon in the EU are more
costly than tariffs based on average carbon content in non-EU countries.

18
Figure 4. Global welfare costs (% of BaU welfare) with EU coalition under alternative tariffs on
EITE products
0
0.05
0.1
0.15
0.2
0.25
0.3
DIR INDIR TOTAL
%
DOMEST FOREIGN REGION Reference
These findings are in line with our basic theoretical propositions: The more emissions we account for,
and the more precise the tariff is (region-specific), the lower are the global welfare costs. However, we
notice that the difference between region-specific tariffs and uniform tariffs based on non-EU average
carbon content is quite small. It is much more important whether the tariff is based on embodied
carbon content of EU production or non-EU production. The reason for this is that emission intensities
in the EU are significantly lower than the average intensities in other regions (see Figure 1).
The same ordering as in Figure 4 occurs if we extend the coalition by considering climate policies for
the larger A1xR coalition (i.e., all Annex 1-countries excluding Russia). One difference, however, is
that the costs of uniform tariffs based on average embodied carbon in non-coalition regions are
somewhat closer to the costs of tariffs based on average coalition emissions. The explanation is that
the differences in emission intensities between coalition and non-coalition regions are reduced when
the coalition is extended from EU to A1. For instance, emissions intensities in the USA are much
higher than in the EU (see Figure 1). The global cost reductions of imposing carbon tariffs vary
between 1% and 7%, i.e., the relative cost savings are approximately halved compared to the
corresponding EU scenarios.
In the case where climate policies are imposed in China, too (coalition A1xR_CHN), the ordering is
robust with one exception: Uniform tariffs based on total embodied carbon in non-coalition regions are

19
less cost-efficient for the world than tariffs based on total embodied carbon in the coalition. They are
also more costly than uniform tariffs based on emissions from only direct fuel use and/or electricity in
non-coalition regions. This is due to total embodied carbon in Chinese EITE production being much
higher than the global average (see Figure 1). The global cost reductions of imposing carbon tariffs are
now merely 0.2-2.5%, reflecting the fact that efficiency losses from unilateral action become less of an
issue as the abatement coalition covers the bulk part of global emissions.
So far carbon tariffs have been discussed mostly with regard to EITE industries, which are the most
emission-intensive and trade-exposed segments in the economy. For practical policy conclusions it is
interesting also to investigate the impacts of imposing carbon tariffs on all products (ALL) to see if
there are significant additional efficiency gains from extending the use of tariffs beyond EITE
products. Figure 5 compares the global welfare costs of tariffs on ALL versus EITE products for the
case of climate policies in the EU under different tariff designs. We notice that the welfare costs are in
fact further reduced significantly, at least when tariffs are based on direct emissions or direct
emissions plus embodied emissions from electricity use. The global cost reductions (vis-à-vis emission
pricing stand-alone) more than double in the three DIR (direct fuel emissions only) scenarios, and
increase by 50-100% in the INDIR (direct plus indirect emissions from electricity) scenarios. The
reason is that embodied carbon in several trade-intensive non-EITE products is substantial, cf. Figures
1 and 2. For instance, embodied carbon of AOG goods (“All other manufactures and services”, which
includes electronics, cars, clothes, etc.) in China is on average comparable to embodied carbon in
EITE products in the EU when direct plus electricity emissions are included, and much higher when
total embodied carbon are considered.
When tariffs on all products are based on total embodied carbon, the efficiency gains are less clear.
There are a number of reasons for this. First of all, it is not necessarily optimal to implement an import
tariff that accounts for all embodied carbon, as reduced export from non-coalition countries to the
coalition may lead to some redirection of this output to non-coalition consumers, so that the emission
effects of reduced export is less than 100%. This also reflects the trade-off between finding feasible
political designs, on the one hand, and targeting emissions efficiently, on the other. Obviously, even
the most comprehensive carbon content metric in our study falls short of covering all emissions effects
in non-coalition countries, some of which can be negative (cf. Hoel, 1996). A second reason is that
some emissions in the coalition may be priced twice: Parts of the total embodied carbon in non-
coalition countries that are subject to tariffs come from emission-intensive intermediates exported

20
from coalition to non-coalition countries and, therefore, are already taxed.14
Third, existing taxes,
tariffs and subsidies could give rise to distortions that affect the optimal tariff level.
As a consequence, the biggest simulated welfare gain in the case of the EU coalition is seen when all
products face region-specific tariffs and when the carbon content is based on direct emissions plus
indirect emissions from electricity inputs. The welfare gain then amounts to 16% vis-à-vis emission
pricing stand-alone. Offsetting operational costs can be ignored: The carbon metric can be based on
already available official data, which avoids compliance costs of firms, and public administration
costs, roughly estimated at 1% of revenue (Evans, 2003), will be negligible. The legal and political
arguments remain and it is difficult to say whether they weigh towards or against such a system.
The welfare increase of extending the sector coverage is significant also in the cases where all Annex
1 countries except Russia (coalition A1xR) take part in the coalition, and where both Annex 1 excl.
Russia and China join the coalition (A1xR_CHN). This suggests that import tariffs, if introduced,
should be seriously considered also for other products than EITE products, but not based on total
embodied carbon in the non-coalition regions. There is still little risk of triggering high operational
costs, as the required information is already collected official data. However, legal and political costs
have to be considered.
14 We have run sensitivity analysis where we combine import tariffs with export rebates (i.e., full border tax adjustments),
and where export rebates are only accounting for direct emissions. According to these simulations, it is still more cost -effective to calculate tariffs based on direct plus electricity emissions, and not total embodied carbon, but the cost difference between these two scenarios have declined somewhat, as expected.

21
Figure 5. Global welfare costs (% of BaU welfare) with EU coalition and tariffs on EITE or ALL
sectors
0
0.05
0.1
0.15
0.2
0.25
0.3
DIR INDIR TOTAL
%
DOMEST - EITE DOMEST - ALL FOREIGN - EITE
FOREIGN - ALL REGION - EITE REGION - ALL
Reference
6.3. Distributional effects
Although our main focus is on global efficiency gains, political and legal concerns call for analyzing
the distributional impacts between coalition and non-coalition regions (both at the total welfare level
as well as at the production level of EITE industries). Figure 6 shows the effects on welfare costs of
different tariff designs for EITE products under EU climate policies for the EU coalition and for the
non-coalition, comprising the rest of the world. We see that the ranking between policies from the
perspective of the EU abatement coalition is almost the same as for global costs, with one slight
exception: Region-specific tariffs are marginally more costly for the EU than uniform tariffs based on
non-EU emissions when all emissions are embodied. We also notice that the relative benefits for the
EU of imposing carbon tariffs are bigger than for the whole world – the EU costs of reducing CO2
emissions are reduced by 4-37% (vis-à-vis emissions pricing stand-alone). Thus, the EU has
considerable incentives to impose carbon tariffs. This effect is even stronger if tariffs are imposed on
all products – welfare costs in the EU could then be reduced by more than 80%.
For the composite of non-coalition regions, the conclusions are turned around as expected (see also
Mattoo et al., 2009). That is, non-abating regions on average prefer no tariffs at all.15
Moreover, if a
15 China, however, is slightly better off with EU tariff, unless the tariff is based on direct plus indirect or total embodied
carbon emissions in China. Mattoo et al. (2009) that neither varies embodied carbon nor coalition sizes, finds no positive welfare effects for China.

22
tariff is levied, non-abating countries are better off the lower the tariff is, i.e., with the tariff based on
direct emissions, only. For most countries, however, the differences between the policy scenarios are
rather small.16
Regions with particularly emission-intensive EITE production obviously prefer uniform
tariffs, which are calculated based on average emission intensities. This explains why non-OECD
regions mainly prefer uniform tariffs, whereas OECD regions mainly prefer country-specific tariffs
(with EU climate policies), cf. the regional embodied carbon in Figure 1.17
Figure 6. EU welfare costs (% of BaU welfare) with EU coalition under alternative tariffs on
EITE products
0
0.1
0.2
0.3
0.4
0.5
0.6
0.7
EU Non-Coalition EU Non-Coalition EU Non-Coalition
DIR INDIR TOTAL
%
DOMEST FOREIGN REGION Reference (EU) Reference (Non-Coalition)
What happens to the EITE industries in the different scenarios? If import tariffs lead to a significant
reduction in EITE exports from non-coalition countries relative to exports from the coalition, the risk
of trade disputes can evolve. This risk would be even more imminent if non-coalition’s (likely)
deterioration of competitiveness in the EITE markets from carbon tariffs dominates the (likely)
improvement in competitiveness from the coalition’s CO2 pricing, so that they face reduced
competitiveness also relative to the BaU scenario without any climate policies. We find that in the
case with EU climate policies and import tariffs on EITE goods, total output of EITE goods in the EU
falls in all scenarios except if tariffs are based on total embodied carbon, and on either region-specific
or uniform carbon content based on non-coalition emissions. The same is true when it comes to total
16 This holds for e.g. China, the USA and India. One exception is Russia, where welfare costs increase from 2% to 3% when
going from no-tariff to tariff based on country-specific total embodied carbon.
23
exports of EITE products from the EU. If we consider EITE exports from individual non-coalition
countries, exports always increase (vis-à-vis BaU) if the EU introduces uniform tariffs based on own
direct emissions. On the other hand, in the cases where EU exports increase as mentioned above,
exports from most non-coalition countries decrease. Exports also decrease in some other policy
scenarios for most non-coalition countries.18
Thus, the most cost-efficient unilateral climate policy
designs could very well trigger a trade dispute.
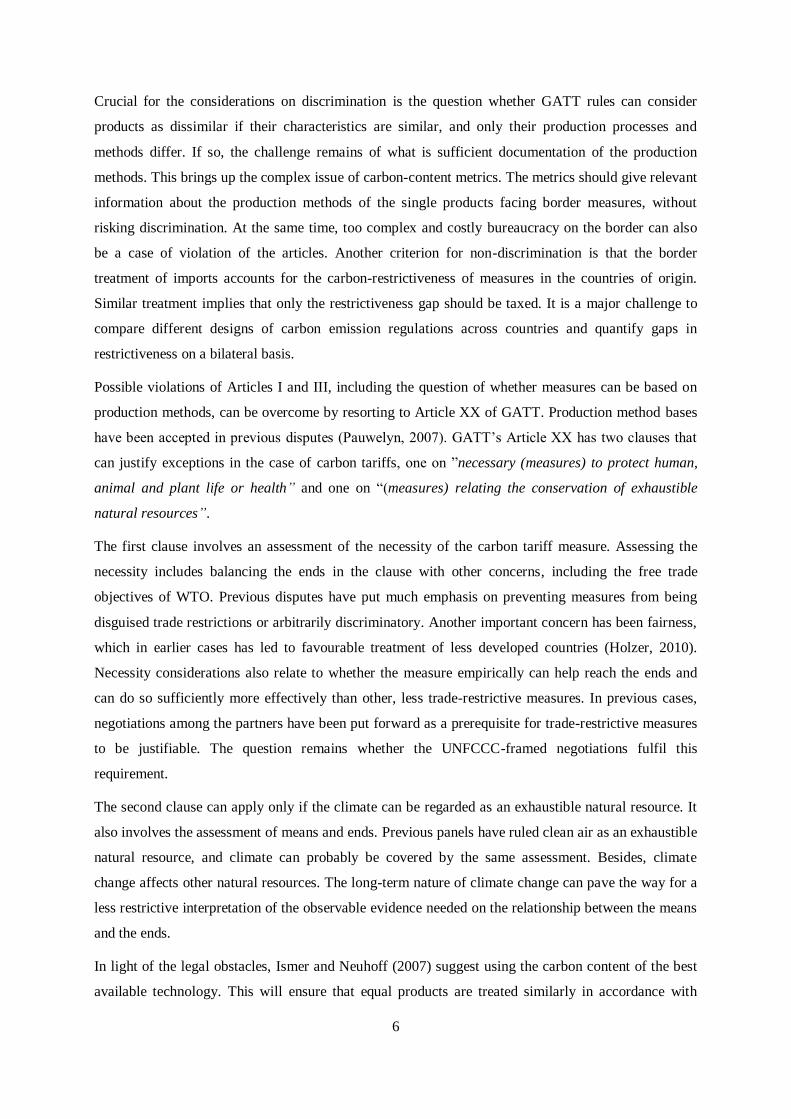
A similar picture is seen if the coalition is extended to coalitions A1xR or A1xR_CHN. However, in
the latter case with the largest coalition, the coalition as a whole decreases both output and exports of
EITE goods in all scenarios. The same holds for the USA and China. On the other hand, the EU
increases its EITE exports in all but one of the tariff scenarios with this large coalition.
7. Conclusions
Given that an effective global agreement on emission reductions remains elusive, individual countries
go ahead or at least consider unilateral action. Carbon tariffs to counteract emission leakage and
thereby increase global cost-effectiveness play an important role in the policy debate on the
appropriate design of unilateral emission abatement strategies. Basic economic efficiency concerns
call for border measures like the carbon tariff structures discussed in this paper. We have assessed the
economic impacts of alternative systems to gain insights into the pending trade-offs between more
narrowly defined economic efficiency gains and the potential costs from legal, practical, and political
perspectives.
Our efficiency results mostly support the expectations that more complex and detailed systems yield
more efficient outcomes. Grasping as much as possible of the embodied carbon content and covering
more goods is important in efficiency terms. It is essential to use non-coalition technologies as the
basis for carbon content calculations. However, the quantitative differences between systems based on
region-specific carbon information and on the regional averages are small, at least for the smaller
coalition comprising only the EU. This indicates one possibility for economising administration and
compliance costs without very large efficiency losses.
Even though the operationalized systems closest to the ideal cost-efficient system mainly are ranked
according to theoretical expectations, we find that, irrespective of coalition size, the most cost-efficient
simulated policy is not based on total embodied carbon, but includes indirect electricity emissions,
only. The result first of all reflects the challenge of finding operationalized metrics of the carbon
17 The welfare difference for China between uniform (based on non-coalition regions) and non-uniform tariffs is 0.1
percentage points when total embodied carbon are used to calculate tariffs. The USA unambiguously prefer non-uniform tariffs.
18 For instance, U.S. EITE exports are reduced vis-à-vis BaU in six out of nine tariff scenarios.

24
content that are both realistically feasible and well-targeted in an efficiency sense. Tax-interaction
effects of the tariffs also contribute to alter the ranking of the tariff design compared to the expected
second-best optimal.
For small coalition sizes, introducing the more complex and comprehensive systems can lead to
significant reductions in carbon leakage and global costs. However, although legal impacts cannot be
quantified, it is clear that legal barriers could seriously challenge these systems. Systems that are more
likely to comply with international law would be characterised by low rates and narrow coverage.
Unfortunately, these are shown to yield very little in terms of cost effectiveness. For all the studied
systems, we consider administration and compliance costs of firms as a minor obstacle. However, a
drawback of the systems in this study is their inability to incentivize abatement efforts in the firms
outside the coalition. A call for more accurate systems would inevitably involve compliance costs of
firms in the non-abating regions, and this could increase operational costs manifold.
The political implications of the various systems are ambiguous. Not even the signs are easy to
identify, as arguments pull in both directions. Distributional aspects are important for how
stakeholders at the national and international policy level will embrace or reject climate policies. We
find that non-coalition regions suffer from carbon tariffs, and mostly so when the tariffs are high and
cover all goods. From a political economy perspective, the impacts for influential emission-intensive
and trade-exposed industries are important, as well, since they drive lobbying activities and the
probability of trade disputes. To what extent carbon tariffs could provide a credible threat for
enhancing international cooperation or bear the risk of causing detrimental trade wars is an open issue
which we leave for future research.
Acknowledgement: We are grateful for comments from Karl W. Steininger and two anonymous
referees on an earlier draft. Support from the Renergi programme of the Research Council of Norway
is gratefully acknowledged.
References
Andrew, R., Peters, G.P., Lennox J. (2009), “Approximation and regional aggregation in multi-
regional input-output analysis for national carbon footprint accounting”, Economic Systems
Research 21(3), 311-335.
Armington, P.S. (1969), “A Theory of Demand for Producers Distinguished by Place of Production”,
IMF Staff Papers 16(1), 159–78.
Babiker, M.H., Maskus, K.E., Rutherford, T.F. (1997), “Carbon Taxes and the Global Trading
System”, Working Paper 97-7, University of Colorado, Boulder.
25
Bacchus, J. (2010), “Questions in Search of Answers: Trade, Climate Change, and the Rule of Law”,
Keynote Address to the conference on “Climate Change, Trade and Competitiveness: Issues for
the WTO”, Geneva, 16 June 2010, available at: http://www.gtlaw.com/portalresource/bacchus1
Badri Narayanan, G., Walmsley, T.L. (2008), “Global Trade, Assistance, and Production: The GTAP
7 Data Base. West Lafayette”, in: Center for Global Trade Analysis, Purdue University.
Böhringer, C., Fischer, C., Rosendahl, K.E. (2010), “The Global Effects of Subglobal Climate
Policies”, The B.E. Journal of Economic Analysis & Policy 10(2) (Symposium): Article 13.
Böhringer, C., Fischer, C., Rosendahl, K.E. (2011), “Cost-Effective Unilateral Climate Policy Design:
Size Matters”, RFF DP 11-34, Resources for the future (RFF).
Böhringer, C., Carbone, J., Rutherford, T.F. (2011), “Embodied carbon tariffs”, NBER working paper,
17376, Cambridge.
Brooke, A., Kendrick, B., Meeraus, A. (1996), “GAMS: A User’s Guide”, GAMS Development
Corporation, Washington, DC.
Dirkse, S., Ferris, M. (1995), “The PATH Solver: A Non-monotone Stabilization Scheme for Mixed
Complementarity Problems”, Optimization Methods & Software 5, 123–56.
Evans, C. (2003), “Studying the studies: An overview of recent research into taxation operating costs”,
Journal of Tax Research 1(1), 64-92.
Gerlagh, R., Kuik, O. (2007), “Carbon Leakage with International Technology Spillovers”, Note di
Lavoro 33.2007, Fondazione Eni Enrico Mattei (FEEM).
Graham, P., Thorpe, S., Hogan, L. (1999), “Non-competitive market behaviour in the international
coking coal market”, Energy Economics 21, 195–212.
Gros, D. (2009), “Global Welfare Implications of Carbon Border Taxes”, CEPS Working Document
No. 315/July 2009.
Hoel, M. (1996), “Should a carbon tax be differentiated across sectors?”, Journal of Public Economics
59, 17–32.
Hoerner, J.A., Muller, F. (1996), “Carbon Taxes for Climate Protection in a Competitive World”,
Report for the Swiss Federal Office for Foreign Economic Affairs. Environmental Tax Program
of the Center for Global Change. University of Maryland College Park, Maryland.
Holzer, K. (2010), “Trade and Climate Policy Interaction: Dealing with WTO Law Inconsistencies of
Carbon-related Border Adjustment Measures”, NCCR-Climate Working paper 2010/06, NCCR-
Climate, Bern.
Hufbauer, G.C., Charnovitz, S., Kim J. (2009), “Global Warming and the World Trading System”,
Peterson Institute for International Economics, Washington, D.C.
Ismer, R., Neuhoff, K. (2007), “Border tax adjustment: a feasible way to support stringent emission
trading”, European Journal of Law and Economics 24(2), 137-164.

26
Kuik, O.J., Hofkes, M. (2010), “Border adjustment for European emissions trading: competitiveness
and carbon leakage”, Energy Policy 38(4), 1741-1784.
Krichene, N. (2002), “World crude oil and natural gas: a demand and supply model”, Energy
Economics 24, 557–576.
Markusen, J.R. (1975), “International Externalities and Optimal Tax Structures”, Journal of
International Economics 5, 15–29.
Mattoo, A., Subramanian, A., van der Mensbrugghe, D., and He, J. (2009): Reconciling Climate
Change and Trade Policy, Policy Research Working Paper Series 5123, the World Bank.
Okagawa, A., Ban, K. (2008), “Estimation of substitution elasticities for CGE models”, Discussion
Paper 08-16, Osaka University.
Pauwelyn, J. (2007), “U.S. Federal Climate Policy and Competitiveness Concerns: The Limits and
Options of International Trade Law”, Nicholas Institute for Environmental Policy Solutions,
Working Paper 07-02, Durham, North Carolina: Duke University.
Persson, S, (2010): Practical Aspects of Border Carbon Adjustment Measures: Using a Trade
Facilitation Perspective to Assess Trade Costs, Issue Paper No. 13, International Centre for
Trade and Sustainable Development (ICTSD), Geneva, Switzerland.
http://ictsd.org/i/publications/129482/
Peters, G.P., Hertwich E.G. (2008), “CO2 Embodied in International Trade with Implications for
Global Climate Policy”, Environmental Science & Technology 42(5), 1401–1407.
Winchester, N. (2011), “The impact of border carbon adjustments under alternative producer
responses”, American Journal of Agricultural Economics, forthcoming.
Yonezawa, H., Balistreri, E.J., Kaffine, D.T. (2011): “The suboptimal nature of applying Pigouvian
rates as border adjustments”, Draft paper, November 2011.

27
Appendix: Algebraic Model Summary
The CGE model is formulated as a system of nonlinear inequalities. The inequalities correspond to the
two classes of conditions associated with a general equilibrium: (i) exhaustion of product (zero profit)
conditions for producers with constant returns to scale; and (ii) market clearance for all goods and
factors. The former class determines activity levels, and the latter determines price levels. In
equilibrium, each variable is linked to one inequality condition: an activity level to an exhaustion of
product constraint and a commodity price to a market clearance condition.
In our algebraic exposition, the notation z
ir is used to denote the unit profit function (calculated as
the difference between unit revenue and unit cost) for production with constant returns to scale of
sector i in region r, where z is the name assigned to the associated production activity. Differentiating
the unit profit function with respect to input and output prices provides compensated demand and
supply coefficients (Hotelling’s lemma), which appear subsequently in the market clearance
conditions. We use g as an index comprising all sectors/commodities i (g=i), the final consumption
composite (g=C), the public good composite (g=G), and investment composite (g=I). The index r
(aliased with s) denotes regions. The index EG represents the subset of energy goods coal, oil, gas,
electricity, and the label FF denotes the subset of fossil fuels coal, oil, gas. Tables B1–B6 explain the
notations for variables and parameters employed within our algebraic exposition. Figures B1–B3
provide a graphical exposition of the production structure. Numerically, the model is implemented in
GAMS (Brooke et al., 1996) and solved using PATH (Dirkse and Ferris, 1995).
Zero Profit Conditions:
1. Production of goods except fossil fuels (gFF):
KLEMgrKLEM KLE
gr grKLEM KLE KLEgr gr gr
1/(1 )(1 ) /(1 )
(1 ) (1 ) (1 )Y M M M E E E KL
gr gr gr gr gr gr gr gr grp p 1 p 1 p 0.
2. Sector-specific material aggregate:
Mgr
Mgr
1/(1 )
M 1M MN A
igr igrgrgri EG
= p 0.p

28
3. Sector-specific energy aggregate:
EgrE
gr2 2
1/(1 )1E E CO COEN A
igr igr r igrgrgri EG
= p p a 0.p
4. Sector-specific value-added aggregate:
KLgrKL KL
gr gr
1/(1 )(1 ) (1 )KL KL K K
gr gr gr grp v 1 w 0.
5. Production of fossil fuels (gFF):
QgrQ
grQ
gr
1/(1 )1
Y 1Q Q L K FF Ar rgr gr gr gr gr igrgr igr
i FF
= - (1 ) gr
p q p 0.w v
6. Armington aggregate:
AirA A1-1
ir ir
1/(1 )A A IMA A
igr igrigr ir irigr = - + ( ) 0.p p p1
7. Aggregate imports across import regions:
IMir
IMir
1/(1 )
1IM IM IMisr isirir
s
= p 0.p
Market Clearance Conditions:
8. Labor:
KLgrKL
grr
rg
Y L
w
.
9. Capital:
KLgrKL
grgr
gr
Y K
v
.
10. Fossil-fuel resources (gFF):
Ygr
grgr
gr
Q Y
q
.
11. Material composite:
Ygr
grgr M
gr
M Y
p
.

29
12. Energy composite:
Ygr
gr gr E
gr
E Y
p
.
13. Value-added composite:
Ygr
grgr KL
gr
KL Y
p
.
14. Import composite:
Aigr
ir igr IMg ir
IM A
p
.
15. Armington aggregate:
Ygr
igr gr A
igr
= A Y
p
.
16. Commodities (g=i):
A IMigr is
ir igr is
g s rir ir
IMY A
p p
.
17. Private consumption composite (g=C):
2COr2rr gr irCr Cr ir rr gr
g i FF
Y p + + q Q p CO Bw vL K
.
18. Public consumption composite (g=G):
rGrY G .
19. Investment composite (g=I):
rIrY I .
20. Carbon emissions:
2
2 2
Egr CO
2r gr igrCO COAg i FF igr r igr
CO E a
p p a
.

30
Table A1. Indices (sets)
G Sectors and commodities (g=i), final consumption composite (g=C), public good composite
(g=G), investment composite (g=I)
I Sectors and commodities
r (alias s) Regions
EG Energy goods: coal, crude oil, refined oil, gas, and electricity
FF Fossil fuels: coal, crude oil, and gas
Table A2. Activity Variables
grY Production of item g in region r
grM Material composite for item g in region r
grE Energy composite for item g in region r
grKL Value-added composite for item g in region r
igrA Armington aggregate of commodity i for demand category (item) g in region r
irIM Aggregate imports of commodity i and region r
Table A3. Price Variables
grp Price of item g in region r
M
grp Price of material composite for item g in region r
E
grp Price of energy composite for item g in region r
KL
grp Price of value-added composite for item g in region r
A
igrp Price of Armington good i for demand category (item) g in region r
IM
irp Price of import composite for good i in region r
rw Price of labor (wage rate) in region r
irv Price of capital services (rental rate) in sector i and region r
irq Rent to fossil-fuel resources in region r (i FF)
2CO
rp Carbon value in region r

31
Table B4. Endowments and Emissions Coefficients
Lr Aggregate labor endowment for region r
irK Capital endowment of sector i in region r
irQ Endowment of fossil-fuel resource i for region r (iFF)
Br Initial balance of payment deficit or surplus in region r (note: 0
r
rB )
2rCO Endowment of carbon emissions rights in region r
2CO
igra Carbon emissions coefficient for fossil fuel i in demand category g of region r (i FF)
Table B5. Cost Shares
M
gr Cost share of the material composite in production of item g in region r
E
gr Cost share of the energy composite in the aggregate of energy and value-added of item g in region r
MN
igr Cost share of the material input i in the material composite of item g in region r
EN
igr Cost share of the energy input i in the energy composite of item g in region r
K
gr Cost share of capital within the value-added of item g in region r
Q
gr Cost share of fossil-fuel resource in fossil-fuel production (g FF) of region r
L
gr Cost share of labor in nonresource inputs to fossil-fuel production (g FF) of region r
K
gr Cost share of capital in nonresource inputs to fossil-fuel production (g FF) of region r
FF
igr Cost share of good i in nonresource inputs to fossil-fuel production (g FF) of region r
Aigr Cost share of domestic output i within the Armington item g of region r
Misr Cost share of exports of good i from region s in the import composite of good i in region r

32
Table B6. Elasticities
KLEM
gr Substitution between the material composite and the energy value–added aggregate in the production
of item g in region r*
KLE
gr Substitution between energy and the value-added nest of production of item g in region r*
M
gr Substitution between material inputs within the energy composite in the production of item g in region
r*
KL
gr Substitution between capital and labor within the value-added composite in the production of item g in
region r*
E
gr Substitution between energy inputs within the energy composite in the production of item g in region
r (by default: 0.5)
Q
gr Substitution between natural resource input and the composite of other inputs in fossil-fuel production
(g FF) of region r (calibrated consistently to exogenous supply elasticities)
A
ir Substitution between the import composite and the domestic input to Armington production of good i
in region r**
IM
ir Substitution between imports from different regions within the import composite for good i in region
r**
*See Okagawa and Ban (2008).
**See Badri Narayanan and Walmsley (2008).

33
Figure B1. Nesting in Nonfossil-Fuel Production
CES
CES
CES
CES
Domestic market variety
Material CES composite (M)
Capital (K) Labor (L)
Capital-Labour (KL) Energy CES composite (E)
Capital-Labour-Energy (KLE)
KLEM
gr
KLE
gr
KL
gr
M
gr
E
gr
CES
CES
CES
CES
Domestic market variety
Material CES composite (M)
Capital (K) Labor (L)
Capital-Labour (KL) Energy CES composite (E)
Capital-Labour-Energy (KLE)
KLEM
gr
KLE
gr
KL
gr
M
gr
E
gr
Note: CES=constant elasticity of substitution.
Figure B2. Nesting in Fossil-Fuel Production
CES
Leontief
Domestic market variety
Fuel specific resource
Intermediate inputs Labour Capital
Non-fuel specific resource inputs Q
grCES
Leontief
Domestic market variety
Fuel specific resource
Intermediate inputs Labour Capital
Non-fuel specific resource inputs Q
gr
Note: CES=constant elasticity of substitution.
Figure B3. Nesting in Armington Production
CES
Domestic market variety CES import composite from other regions
Armington good
A
ir
IM
ir
CES
Domestic market variety CES import composite from other regions
Armington good
A
ir
IM
ir
Note: CES=constant elasticity of substitution.