Embed Size (px)
Citation preview
Final Research Report
ALTERNATIVE FUEL FOR PORTLAND CEMENT PROCESSING
Submitted to
United States Department of Energy
Prepared by
Anton K. Schindler, Steve R. Duke, Thomas E. Burch, Edward W. Davis,
Ralph H. Zee, David I. Bransby, Carla Hopkins, Rutherford L. Thompson, Jingran Duan,
Vignesh Venkatasubramanian, and Stephen Giles.
SEPTEMBER 2012
i
DISCLAIMERS
The contents of this report reflect the views of the authors, who are responsible for the facts and
the accuracy of the data presented herein. The contents do not necessarily reflect the official
views or policies of Auburn University or the U.S. Department of Energy. This report does not
constitute a standard, specification, or regulation.
NOT INTENDED FOR CONSTRUCTION, BIDDING, OR PERMIT PURPOSES
ACKNOWLEDGEMENTS
Material contained herein was obtained during research for the project titled “Alternative
Fuel for Cement Processing, (AL), OE 1.09: Evaluate the Use of Alternative Fuels to Lessen the
Dependence on Non-renewable Resources to Produce Portland Cement,” funded by the U.S.
Department of Energy under project number DE-OE-0000113. The assistance and cooperation
of Mr. Darshan Goswami, Project Manager, U.S. Department of Energy, is much appreciated.
The cooperation of many staff from Lafarge North America’s Roberta cement plant and its
employees is gratefully acknowledged. The authors would like to specifically acknowledge the
contributions of the following individuals:
Don Stafford Lafarge North America, Alpharetta, Georgia
Horace Compton Compton Consulting, Leeds, AL
Travis Reed Lafarge North America, Calera, Alabama
Mike Hooper Lafarge North America, Calera, Alabama
Rick Darnell Lafarge North America, Calera, Alabama
Nick Ewing Lafarge North America, Calera, Alabama
Simon Ward Lafarge North America, Calera, Alabama
Munzer Ghosh Lafarge North America, Whitehall, Pennsylvania
Paul Cunningham Lafarge North America, Calera, Alabama
Anthony Perry Lafarge North America, Calera, Alabama
Ken Evans Systech, Calera, Alabama

ii
ABSTRACT
The production of cement involves a combination of numerous raw materials, strictly monitored
system processes, and temperatures on the order of 1500 °C. Immense quantities of fuel are
required for the production of cement. Traditionally, energy from fossil fuels was solely relied
upon for the production of cement. The overarching project objective is to evaluate the use of
alternative fuels to lessen the dependence on non-renewable resources to produce portland
cement. The key objective of using alternative fuels is to continue to produce high-quality cement
while decreasing the use of non-renewable fuels and minimizing the impact on the environment.
Burn characteristics and thermodynamic parameters were evaluated with a laboratory
burn simulator under conditions that mimic those in the preheater where the fuels are brought into
a cement plant. A drop-tube furnace and visualization method were developed that show
potential for evaluating time- and space-resolved temperature distributions for fuel solid particles
and liquid droplets undergoing combustion in various combustion atmospheres.
Downdraft gasification has been explored as a means to extract chemical energy from
poultry litter while limiting the throughput of potentially deleterious components with regards to
use in firing a cement kiln. Results have shown that the clinkering is temperature independent, at
least within the controllable temperature range. Limestone also had only a slight effect on the
fusion when used to coat the pellets. However, limestone addition did display some promise in
regards to chlorine capture, as ash analyses showed chlorine concentrations of more than four
times greater in the limestone infused ash as compared to raw poultry litter.
A reliable and convenient sampling procedure was developed to estimate the combustion
quality of broiler litter that is the best compromise between convenience and reliability by means
of statistical analysis.
Multi-day trial burns were conducted at a full-scale cement plant with alternative fuels to
examine their compatibility with the cement production process. Construction and demolition
waste, woodchips, and soybean seeds were used as alternative fuels at a full-scale cement
production facility. These fuels were co-fired with coal and waste plastics. The alternative fuels
used in this trial accounted for 5 to 16 % of the total energy consumed during these burns. The
overall performance of the portland cement produced during the various trial burns performed for
practical purposes very similar to the cement produced during the control burn. The cement plant
was successful in implementing alternative fuels to produce a consistent, high-quality product that
increased cement performance while reducing the environmental footprint of the plant. The
utilization of construction and demolition waste, woodchips and soybean seeds proved to be
viable replacements for traditional fuels. The future use of these fuels depends on local
availability, associated costs, and compatibility with a facility’s production process.
iii
TABLE OF CONTENTS
LIST OF TABLES ............................................................................................................................... viii
LIST OF FIGURES ............................................................................................................................. xiii
CHAPTER 1: INTRODUCTION .............................................................................................................. 1
1.1 Project Background ................................................................................................................... 4
1.2 Research Objectives ................................................................................................................. 4
1.3 Research Plan .......................................................................................................................... 4
1.4 Report Organization .................................................................................................................. 5
PART 1: DETERMINE THE BURN CHARACTERISTICS OF ALTERNATIVE FUELS
WITH BURN SIMULATOR
CHAPTER 2: DETERMINE THE BURN CHARACTERISTICS OF ALTERNATIVE FUELS
WITH BURN SIMULATOR .............................................................................................. 7
2.1 Development of a Laboratory Burn Simulator Facility .............................................................. 7
2.1.1 Experimental Work ......................................................................................................... 7
2.2 Visualization Studies of New Fuel Types Undergoing Combustion ......................................... 9
2.2.1 Experimental Work ......................................................................................................... 9
2.3 Obtaining Spatial Temperature Distributions from Particle Visualizations ............................ 18
2.3.1 Experimental Work ....................................................................................................... 18
2.4 Combustion of Liquid Fuels in the Furnace Drop Tube ......................................................... 23
2.4.1 Experimental Work ....................................................................................................... 23
2.5 Summary ................................................................................................................................ 39
2.6 Conclusions ........................................................................................................................... 40
2.7 Recommendations for Future Research ................................................................................ 40
2.8 Recommendations for Implementation .................................................................................. 40
PART 2: FULL-SCALE TRIAL BURNS WITH ALTERNATIVE FUELS AT CEMENT PLANT
CHAPTER 3: PART 2—INTRODUCTION ........................................................................................... 42
3.1 Introduction ............................................................................................................................ 42
3.2 Objectives or Part 2 ............................................................................................................... 43
3.3 Portland Cement Production ................................................................................................... 44
3.3.1 Raw Materials ............................................................................................................... 46
3.3.2 Pyroprocessing ............................................................................................................. 49
iv
3.3.3 Clinker Cooling ............................................................................................................. 51
3.3.4 Grinding and Finishing ................................................................................................. 52
3.4 Use of Alternative Fuels in Portland Cement Production... .................................................... 53
3.4.1 Alternative Fuels in Cement Kilns ................................................................................ 55
3.4.2 Advantages of Alternative Fuels .................................................................................. 56
3.4.3 Disadvantages of Alternative Fuels .............................................................................. 59
3.4.4 Alternative Fuel Options ............................................................................................... 59
3.5 Emissions... ............................................................................................................................. 68
3.5.1 Carbon Emissions ........................................................................................................ 68
3.5.2 Nitrogen Oxide Emissions ............................................................................................ 70
3.5.3 Sulfur Oxide Emissions ................................................................................................ 72
3.5.4 Other Problematic Emissions ....................................................................................... 72
3.6 Hydration of Portland Cement... ............................................................................................. 76
3.6.1 Chemical Admixture Effects on Portland Cement ......................................................... 72
3.7 Concluding Remarks... ............................................................................................................ 78
CHAPTER 4: PART 2—EXPERIMENTAL PLAN ................................................................................ 80
4.1 Introduction ............................................................................................................................. 83
4.1.1 Definitions ...................................................................................................................... 84
4.2 Sampling and Testing Overview ............................................................................................. 84
4.3 Sampling ................................................................................................................................. 86
4.3.1 Sample Collection ......................................................................................................... 87
4.3.2 Sample Conditioning, Shipping, and Storage ............................................................... 92
4.4 Test Methods... ....................................................................................................................... 93
4.4.1 Chemical Compositions ................................................................................................. 93
4.4.2 Cement Physical Properties .......................................................................................... 97
4.4.3 Concrete Properties ...................................................................................................... 98
4.4.4 Plant Emissions .......................................................................................................... 100
4.5 Concluding Remarks... .......................................................................................................... 100
CHAPTER 5: PART 2—DATA PRESENTATION AND ANALYSIS ................................................. 101
5.1 Introduction ........................................................................................................................... 101
5.2 Statistical Analysis Background ............................................................................................ 101
5.3 Research Conditions ............................................................................................................. 103
5.4 Data Presentation and Analysis ............................................................................................ 104
5.4.1 Chemical Composition of Raw Materials .................................................................... 105
5.4.2 Chemical Composition of Kiln Feed ............................................................................ 112
v
5.4.3 Chemical Composition of Cement Kiln Dust ............................................................... 117
5.4.4 Fuel Properties ............................................................................................................ 123
5.4.5 Chemical Composition of Clinker ................................................................................ 139
5.4.6 Chemical Composition of Cement ............................................................................... 148
5.4.7 Physical Properties of Cement .................................................................................... 156
5.4.8 Concrete Properties ................................................................................................... 167
5.4.9 Comparison of Paste, Mortar, and Concrete Properties ............................................. 183
5.4.10 Plant Emissions ......................................................................................................... 190
5.5 Concluding Remarks ............................................................................................................. 197
CHAPTER 6: PART 2—SUMMARY, CONCLUSIONS, AND RECOMMENDATIONS .................... 200
6.1 Summary .............................................................................................................................. 200
6.2 Conclusions ......................................................................................................................... 200
6.3 Recommendations ............................................................................................................... 202
PART 3: EVALUATE GASIFICATION TO REMOVE CONTAMINANTS IN CEMENT
PRODUCTION
CHAPTER 7: PART 3—INTRODUCTION ......................................................................................... 205
7.1 Poultry Litter ......................................................................................................................... 205
7.2 Cement Kiln .......................................................................................................................... 205
7.3 Gasification ........................................................................................................................... 206
7.4 Objective Statement for Part Three ...................................................................................... 207
7.5 Abbreviations for this Part of the Report ............................................................................... 208
CHAPTER 8: PART 3—BACKGROUND ........................................................................................... 210
8.1 Poultry Litter Composition .................................................................................................... 212
8.2 Undesirable Elements in Cement Kilns ................................................................................ 215
8.3 Chlorine and Alkali Release from Biomass Under Gasification and Combustion
Conditions .................................................................................................................... 215
8.4 Gasification of Poultry Litter .................................................................................................. 217
8.5 Reasons for Clinker Formation and Possible Solutions ....................................................... 217
8.6 Limiting The Release of Chlorine and Alkalis ....................................................................... 218
CHAPTER 9: PART 3—EXPERIMENTAL SETUP AND PROCEDURE ........................................... 220
9.1 Experimental Setup ............................................................................................................... 220
9.1.1 Gasifier ........................................................................................................................ 220
vi
9.1.2 Gas Analysis ............................................................................................................... 226
9.1.3 Feedstock/Ash Analysis .............................................................................................. 228
9.2 Procedure ............................................................................................................................ 228
9.2.1 Exploration of Poultry Litter Gasification Procedure ................................................... 228
9.2.2 Quantification of Contaminant Retention Procedure ................................................... 230
9.2.3 Data Analysis .............................................................................................................. 233
CHAPTER 10: PART 3—RESULTS AND DISCUSSION .................................................................. 236
10.1 Exploration of Poultry Litter Gasification ............................................................................. 236
10.1.1 Initial Tests and Woodchip Dilution ........................................................................... 237
10.1.2 Flue Gas Recirculation ............................................................................................. 239
10.1.3 Limestone Additive ................................................................................................... 242
10.1.4 Raw Poultry Litter and Limestone Addition ............................................................... 244
10.1.5 Summary of Results .................................................................................................. 245
10.2 Quantification of Contaminant Retention Study .................................................................. 246
10.2.1 Contaminant Mass Balances..................................................................................... 252
10.2.2 Contaminant Distribution ........................................................................................... 260
10.2.3 Conclusions, Recommendations, and Sources of Error ........................................... 264
CHAPTER 11: PART 3—CONCLUSIONS AND RECOMMENDATIONS ......................................... 266
11.1 Summary of Work and Conclusions ................................................................................... 266
11.2 Recommendations for Future Research ............................................................................. 267
11.3 Recommendations for Implementation ............................................................................... 267
PART 4: DEVELOP SAMPLING PROCEDURE TO ESTIMATE COMBUSTION QUALITY OF
BROILER LITTER
CHAPTER 12: Develop Sampling Procedure to Estimate Combustion Quality of
Broiler Litter ........................................................................................................... 269
12.1 Introduction ........................................................................................................................ 269
12.1.1 Objectives .................................................................................................................. 270
12.2 Experimental Procedure ..................................................................................................... 270
12.3 Results and Discussion....................................................................................................... 273
12.3.1Sampling Procedure ................................................................................................... 273
PART 5: FEASIBILITY OF USING SELECTED ALTERNATE FUELS IN PORTLAND CEMENT
PRODUCTION
vii
CHAPTER 13: Feasibility of Using Selected Alternate Fuels in Portland Cement
Production .............................................................................................................. 280
13.1 Introduction ........................................................................................................................ 280
13.1.1 Objectives .................................................................................................................. 280
13.1.2 Research Approach ................................................................................................... 280
13.2 Summary of Work ............................................................................................................... 280
13.2.1 Broiler Litter .............................................................................................................. 281
13.2.2 Post-Industrial Plastic Waste ..................................................................................... 282
13.2.3 Tires .......................................................................................................................... 283
13.2.4 Wood Chips (forest trimmings) and Railroad Ties ................................................... 283
13.2.5 Switch Grass and Straw ........................................................................................... 284
13.2.6 Construction and Demolition Waste and Municipal Solid Waste ............................. 284
13.2.7 Liquid Waste Fuel ..................................................................................................... 285
13.3 Conclusions ........................................................................................................................ 285
CHAPTER 14: Conclusions and Recommendations .................................................................. 287
14.1 Conclusions ........................................................................................................................ 287
14.2 Recommendations for Future Research ............................................................................. 290
REFERENCES ................................................................................................................................... 292
APPENDIX A: CONTAMINANT MASS BALANCE SPREADSHEETS ............................................ 300
APPENDIX B: SAMPLE CALCULATIONS ....................................................................................... 307
APPENDIX C: UNCERTAINTY ANALYSIS ....................................................................................... 309
APPENDIX D: ADDITIONAL FIGURES ............................................................................................. 313
viii
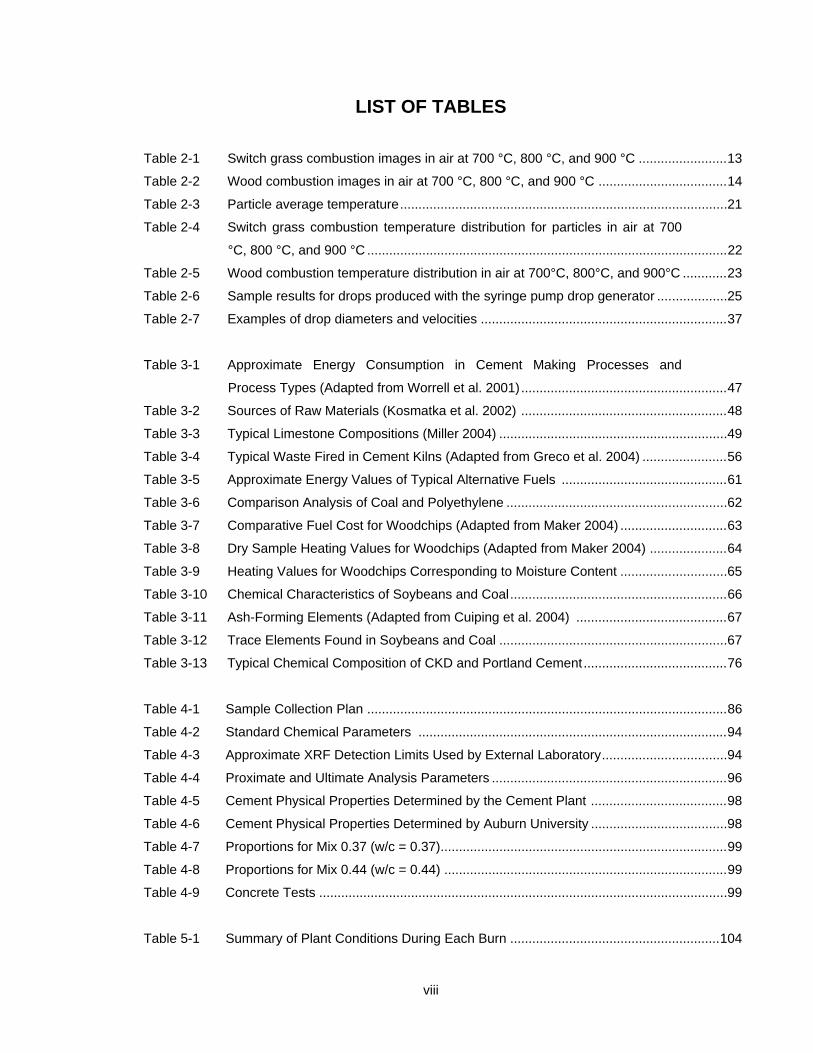
LIST OF TABLES
Table 2-1 Switch grass combustion images in air at 700 °C, 800 °C, and 900 °C ........................ 13
Table 2-2 Wood combustion images in air at 700 °C, 800 °C, and 900 °C ................................... 14
Table 2-3 Particle average temperature .......................................................................... ...............21
Table 2-4 Switch grass combustion temperature distribution for particles in air at 700
°C, 800 °C, and 900 °C .................................................................................................. 22
Table 2-5 Wood combustion temperature distribution in air at 700°C, 800°C, and 900°C ............ 23
Table 2-6 Sample results for drops produced with the syringe pump drop generator .... ...............25
Table 2-7 Examples of drop diameters and velocities ................................................................... 37
Table 3-1 Approximate Energy Consumption in Cement Making Processes and
Process Types (Adapted from Worrell et al. 2001) ........................................................ 47
Table 3-2 Sources of Raw Materials (Kosmatka et al. 2002) ........................................................ 48
Table 3-3 Typical Limestone Compositions (Miller 2004) ............................................... ...............49
Table 3-4 Typical Waste Fired in Cement Kilns (Adapted from Greco et al. 2004) ....................... 56
Table 3-5 Approximate Energy Values of Typical Alternative Fuels ............................................. 61
Table 3-6 Comparison Analysis of Coal and Polyethylene ............................................. ...............62
Table 3-7 Comparative Fuel Cost for Woodchips (Adapted from Maker 2004) ............................. 63
Table 3-8 Dry Sample Heating Values for Woodchips (Adapted from Maker 2004) ..................... 64
Table 3-9 Heating Values for Woodchips Corresponding to Moisture Content .............. ...............65
Table 3-10 Chemical Characteristics of Soybeans and Coal ........................................................... 66
Table 3-11 Ash-Forming Elements (Adapted from Cuiping et al. 2004) ......................................... 67
Table 3-12 Trace Elements Found in Soybeans and Coal ............................................... ...............67
Table 3-13 Typical Chemical Composition of CKD and Portland Cement ....................................... 76
Table 4-1 Sample Collection Plan .................................................................................................. 86
Table 4-2 Standard Chemical Parameters .................................................................................... 94
Table 4-3 Approximate XRF Detection Limits Used by External Laboratory ................... ...............94
Table 4-4 Proximate and Ultimate Analysis Parameters ................................................................ 96
Table 4-5 Cement Physical Properties Determined by the Cement Plant ..................................... 98
Table 4-6 Cement Physical Properties Determined by Auburn University ...................... ...............98
Table 4-7 Proportions for Mix 0.37 (w/c = 0.37) .............................................................................. 99
Table 4-8 Proportions for Mix 0.44 (w/c = 0.44) ............................................................................. 99
Table 4-9 Concrete Tests ................................................................................................ ...............99
Table 5-1 Summary of Plant Conditions During Each Burn ......................................................... 104
ix
Table 5-2 ELR – Chemical Composition of RM1 for All Burns .................................................... 106
Table 5-3 ELR – Chemical Composition of RM2 for All Burns ...................................... ...............107
Table 5-4 ELR – Chemical Composition of RM3 for All Burns ..................................................... 108
Table 5-5 ELR – Chemical Composition of RM4 for All Burns ..................................................... 109
Table 5-6 ELR – Chemical Composition of RM5 for All Burns ...................................... ...............110
Table 5-7 ELR – Chemical Composition of RM6 for All Burns ..................................................... 111
Table 5-8 CPR – Kiln Feed Compositions for All Burns .............................................................. 113
Table 5-9 ELR – Kiln Feed Compositions and Percentage Difference Relative to
Baseline for All Burns .................................................................................... ...............115
Table 5-10 CPR – CKD Compositions for All Burns ....................................................................... 118
Table 5-11 ELR – CKD Compositions and Percentage Difference to Baseline for All
Burns ........................................................................................................................... 121
Table 5-12 ELR – Fuel Heating Values and Percent Utilization ..................................... ...............123
Table 5-13 ELR – Proximate, Ultimate, and Combustion Analysis of Coal for All Burns ............... 127
Table 5-14 ELR – Standard Parameters of Coal for All Burns ....................................................... 129
Table 5-15 ELR – Proximate, Ultimate, and Combustion Analysis of Plastics for All
Burns ............................................................................................................................ 132
Table 5-16 ELR – Standard Parameters of Plastics for All Burns ................................................ 133
Table 5-17 ELR – Proximate, Ultimate, and Combustion Analysis of All Fuels from C&D
Burn ............................................................................................................... ...............135
Table 5-18 ELR – Standard Parameters of All Fuels from C&D Burn ........................................... 136
Table 5-19 ELR – Average Proximate, Ultimate, and Combustion Analysis of All Fuels
from VF 5-15% Burns .................................................................................................. 137
Table 5-20 ELR – Average Standard Parameters for All Fuels from VF 5-15% Burns ................ 138
Table 5-21 ELR – Proximate, Ultimate, and Combustion Analysis of All Fuels from the
Soy Burn........................................................................................................ ...............139
Table 5-22 ELR – Standard Parameters of All Fuels from the Soy Burn ...................................... 140
Table 5-23 CPR – Statistical Significance and Percent Difference of Clinker Relative to
Baseline Medium .......................................................................................................... 141
Table 5-24 ELR – Chemical Composition of Clinker and Percent Difference Relative to
Baseline for All Burns .................................................................................... ...............146
Table 5-25 SLR – Rietveld Analysis of Clinker and Percent Difference Relative to
Baseline ........................................................................................................................ 147
Table 5-26 CPR – Average Cement Composition and Percent Difference Relative to
Baseline Results ......................................................................................................... 150
Table 5-27 ELR – Average Cement Composition and Percent Difference Relative to
Baseline Results ......................................................................................................... 153
x
Table 5-28 SLR – Rietveld Analysis and Percent Difference of Trial Burn Cement
Relative to Baseline Results ......................................................................... ...............154
Table 5-29 Precision Requirements for Single and Multiple Laboratories for Cement
Physical Properties ...................................................................................................... 156
Table 5-30 CPR – Physical Properties of Cement and Percent Difference Relative to
Baseline for All Burns ................................................................................................... 159
Table 5-31 AUR – Physical Properties of Cement and Percent Difference Relative to
Baseline for All Burns .................................................................................... ...............160
Table 5-32 Single-Lab and Multi-Lab Precision for Concrete Physical Properties ......................... 167
Table 5-33 AUR – Physical Properties and Percent Difference Relative to Baseline for
Mix 0.44 Concrete for All Burns .................................................................... ...............169
Table 5-34 AUR – Air-Corrected Compressive Strength and Percent Difference Relative
to Baseline for Mix 0.44 Concrete ............................................................................... 172
Table 5-35 AUR – Drying Shrinkage Development and Percent Difference Relative to
Baseline for Mix 0.44 Concrete for All Burns ............................................................... 172
Table 5-36 AUR – Physical Properties and Percent Difference Relative to Baseline for
Mix 0.37 Concrete for All Burns .................................................................... ...............178
Table 5-37 AUR – Air-Corrected Compressive Strength and Percent Difference Relative
to Baseline for Mix 0.37 Concrete ................................................................................ 180
Table 5-38 AUR – Drying Shrinkage Development and Percent Difference Relative to
Baseline for Mix 0.37 Concrete for All Burns ................................................ ...............180
Table 5-39 Summary of Physical Properties of Cement and Concrete from the C&D Trial
Burn ............................................................................................................................. 184
Table 5-40 Summary of Physical Properties of Cement and Concrete from the VF 5%
Trial Burn ...................................................................................................................... 184
Table 5-41 Summary of Physical Properties of Cement and Concrete from the VF 10%
Trial Burn ...................................................................................................................... 185
Table 5-42 Summary of Physical Properties of Cement and Concrete from the VF 15%
Trial Burn ....................................................................................................... ...............186
Table 5-43 Summary of Physical Properties of Cement and Concrete from the Soy Trial
Burn .............................................................................................................................. 187
Table 5-44 CPR – Emission Wilcoxon Rank Sum Results and Percent Difference
Relative to Baseline ..................................................................................................... 192
Table 5-45 ADEM Emission Limits and Normalized Limits for Each Burn ...................... ...............195
Table 8-1 Proximate analyses (% mass, dry basis) of five litter samples from the
literature ....................................................................................................................... 210
xi
Table 8-2 Ultimate analyses (% mass, dry basis), chlorine content, and heating value of
six litter samples from the literature ............................................................................. 211
Table 8-3 Ash analyses (% mass, ignited basis) of five litter samples from the literature ........... 211
Table 8-4 Origins of poultry litter components relevant to cement kiln implementation.
Element % are elemental, not oxide (Price 2010; Misra et al. 1993) .......................... 212
Table 8-5 List of elements relevant to cement manufacturing that are present in poultry
litter and their effects, adapted from Bhatty (2004) ..................................................... 213
Table 8-6 Comparison of poultry litter composition (% mass, dry) to coal and coke
samples used at the Lafarge Roberta plant (Folta 2010) ........................................... 214
Table 8-7 Comparison of poultry litter composition (g/MJ, dry) to coal and coke
samples used at the Lafarge Roberta plant (Folta 2010) ........................................... 215
Table 10-1 Poultry litter pellet proximate analysis .......................................................................... 236
Table 10-2 Poultry litter pellet ultimate analysis ............................................................................. 236
Table 10-3 Poultry litter pellet ash analysis .................................................................................... 237
Table 10-4 Powdered limestone analysis ....................................................................................... 243
Table 10-5 Dense, gray, easily crumbled, amorphous ash analysis .............................................. 244
Table 10-6 Summary of primary experiments and results, avg. syngas HHV≈5.4 MJ/m³ ............. 246
Table 10-7 Proximate analysis of charcoal, woodchips, and poultry litter (% dry basis) .............. 246
Table 10-8 Ultimate analysis of charcoal, woodchips, and poultry litter (% dry basis) ................. 247
Table 10-9 Ash analysis of charcoal, woodchips, and poultry litter (% Ignited Basis) .................. 247
Table 10-10 Retention percentage of notable elements, not accounting for conveyor
losses .......................................................................................................................... 253
Table 10-11 Average retention percentage of notable elements at the three limestone set
points, not accounting for conveyor losses ................................................................. 253
Table 10-12 Percent of total input ash content accounted for by conveyer losses and
absolute % difference between total input ash and output ash with and
without conveyor losses factored in ............................................................................ 254
Table 10-13 Retention percentage of notable elements, conveyor losses factored in ................... 254
Table 10-14 Average retention percentage of notable elements, conveyor losses factored
in .................................................................................................................................. 255
Table 10-15 Retention percentage of notable elements, normalized to Ca .................................... 257
Table 10-16 Average retention percentage of notable elements, normalized to Ca ........................ 258
Table 12-1 Testing Performed for work in this task ....................................................................... 274
Table 12-2 Parameter values obtained by NIRS Analysis (% DM) ............................................... 275
Table 12-3 Parameter values obtained by ICAP Analysis (% DM) ................................................ 275
xii
Table 12-4 Parameter values obtained by ICAP Analysis (% DM) ............................................... 276
Table 12-5 Parameter values obtained by Anion Analysis (ppm as is basis) ............................... 276
Table 12-6 Parameter values obtained by other analysis ............................................................. 277
Table 12-7 Correlation Parameters ................................................................................................ 277
Table 12-8 Regression Equations developed from NIRS analysis of broiler litter ......................... 278
Table 12-9 Smallest sample size at which the % deviation from TRUE is < 20% ...................... 278
Table 13-1 Summary of Collected Data for use in Feasibility Evaluation ...................................... 286
xiii
LIST OF FIGURES
Figure 1-1 Full-Scale Portland Cement Production Facility ............................................................... 2
Figure 2-1 Photograph of the burn simulator system with visualization setup .................................. 8
Figure 2-2 Switch grass at 900 C in air (100 micrometer nominal particle) .................................... 10
Figure 2-3 Wood at 900 °C in air (100 micrometer nominal particle) .............................................. 10
Figure 2-4 The image sequence shows switch grass combusting in the retort at 900 °C
and 20.9 % O2 at 500 FPS ............................................................................................ 11
Figure 2-5 Images of switch grass particles undergoing combustion in air at 900 °C .................... 12
Figure 2-6 Images of 99% hexadecane droplets undergoing combustion in air at 800 °C ............ 15
Figure 2-7 Cetane at 500 °C and 20.9% oxygen. Images are displayed at 17 fps and
originally taken at 50 fps . .............................................................................................. 16
Figure 2-8 Cetane at 500 °C and 20.9% oxygen. Images are displayed at 10 fps and
originally taken at 50 fps ............................................................................................... 17
Figure 2-9 Cetane at 500 °C and 20.9% oxygen. Images are displayed at 4 fps and
originally taken at 50 fps ............................................................................................... 17
Figure 2-10 Wood combustion image and surface temperature estimates at 900 °C in air ............. 19
Figure 2-11 Wood combustion image and surface temperature estimates at 900 °C in air ............. 20
Figure 2-12 Syringe pump drop generation apparatus and image of sample drop of
glycerin .......................................................................................................................... 24
Figure 2-13 The piezoelectric droplet generator and its components ................................................ 2
Figure 2-14 Piezoelectric drop generator system ............................................................................. 26
Figure 2-15 Glass nozzles for the piezoelectric drop generator ....................................................... 27
Figure 2-16 Droplets generated for water ......................................................................................... 28
Figure 2-17 (a) TEGAM high voltage amplifier, (b) Piezoelectric buzzers of resonant
frequency 2khz (b1) and 3.4khz (b2) ............................................................................. 28
Figure 2-18 Diagram of the microdrop generation setup with the imaging technique ....................... 29
Figure 2-19 Detailed view of piezoelectric droplet generator ............................................................ 30
Figure 2-20 Back lit images of 60% aqueous glycerin as it is ejected from the nozzle ..................... 30
Figure 2-21 Image showing how much the droplet skews as it is ejected ....................................... 31
Figure 2-22 High magnification images taken with Questar lens showing nozzle
imperfections ................................................................................................................. 32
Figure 2-23 60% aqueous glycerin microdroplet generation at different voltages ............................ 32
Figure 2-24 70% aqueous glycerin microdroplet generation at different voltages ............................ 33
Figure 2-25 Isopropyl Alcohol microdroplet generation at different voltages .................................... 34
xiv
Figure 2-26 Hexadecane microdroplet generation at different voltages............................................ 35
Figure 2-27 Iso-octane microdroplet generation at different voltages .............................................. 36
Figure 2-28 Images of 50 % glycerin droplets produced at 3.0 Hz, 0.01 μL/min, 55 V drive
amplitude ....................................................................................................................... 37
Figure 2-29 Liquid fuel prototype drop generation and injection system .......................................... 38
Figure 2-30 Schematic diagram of the liquid fuel water-cooled nozzle recently fabricated ............. 39
Figure 2-31 Hexadecane microdroplet generation at different voltages............................................ 35
Figure 3-1 Layout of a Typical Dry-Process Portland Cement Production Facility
(Kosmatka et al. 2002) ................................................................................................... 45
Figure 3-2 Gas and Material Temperature Inside a Typical Cement Kiln (Mokrzycki and
Uliasz-Bocheńczyk 2003) ............................................................................................... 51
Figure 3-3 Grate Cooler for Cooling Clinker (Network Solutions 2010) .......................................... 51
Figure 3-4 Various Fuels and Their Origin (Adapted from Greco et al. 2004) ................................ 54
Figure 3-5 Average Yearly Trend of Fossil Fuel Prices (Shafiee and Topal 2010) ......................... 58
Figure 3-6 Share of Carbon Emissions from Global Cement Production ........................................ 70
Figure 3-7 Change in Emission Levels Due to Changes in Fuel Types (Prisciandaro et
al. 2003) ......................................................................................................................... 73
Figure 3-9 Influence of A/S on Setting Characteristics of Portland Cement (Mehta and
Monteiro 2006) ............................................................................................................... 78
Figure 4-1 Waste Plastic Blend ....................................................................................................... 81
Figure 4-2 Construction and Demolition Waste ............................................................................... 81
Figure 4-3 Woodchip Waste ............................................................................................................ 82
Figure 4-4 Treated Soybean Seeds ................................................................................................ 82
Figure 4-5 Classification of the Fuels Utilized During the Study ..................................................... 83
Figure 4-6 Sampling and Testing Plan (Adapted from Folta 2010) ................................................. 85
Figure 4-7 Schematic of Cement Plant Operation (Folta 2010) ...................................................... 88
Figure 4-8 Raw Material Sampling Point ......................................................................................... 89
Figure 4-9 Kiln Feed Sampling Point ............................................................................................... 89
Figure 4-10 Alternative Fuel Conveyer and Injection System ........................................................... 90
Figure 4-11 Automated Plunger System ........................................................................................... 91
Figure 4-12 Clinker Sampling Point ................................................................................................... 91
Figure 4-13 Portland Cement Sampling Point ................................................................................... 92
Figure 5-1 Analysis Plan ................................................................................................................ 102
Figure 5-2 CPR – Percent Difference in Kiln Feed Composition Relative to Baseline .................. 114
xv
Figure 5-3 CPR – CKD Compositions Relative to Baseline for All Burns...................................... 119
Figure 5-4 Fuel Heating Values Based on As-Received Conditions ............................................. 125
Figure 5-5 CPR – Fuel Utilization for All Burns ............................................................................. 126
Figure 5-6 CPR – Average Clinker Composition with 5th and 95th Percentiles .............................. 143
Figure 5-7 CPR – Percent Difference in Clinker Composition Relative to Baseline ...................... 144
Figure 5-8 CPR – Average Cement Composition with 5th and 95th Percentiles ............................ 151
Figure 5-9 CPR – Percent Difference of Cement Composition Relative to Baseline .................... 152
Figure 5-10 SLR – Percent Difference of Bogue Compounds Relative to Baseline ....................... 155
Figure 5-11 CPR – Percent Difference in Cement Properties Relative to Baseline ........................ 161
Figure 5-12 AUR – Percent Difference in Cement Properties Relative to Baseline ........................ 162
Figure 5-13 CPR – Mortar Cube Compressive Strengths for All Burns .......................................... 163
Figure 5-14 AUR – Mortar Cube Compressive Strengths for All Burns .......................................... 164
Figure 5-15 AUR – Average Drying Shrinkage of Mortar Prisms for All Burns ............................... 165
Figure 5-16 SLR – Particle Size Distribution of Cement for All Burns ............................................. 166
Figure 5-17 AUR – Percent Difference in Physical Properties Relative to Baseline for Mix
0.44 Concrete for Trial Burns ....................................................................................... 170
Figure 5-18 AUR – Air-Corrected Compressive Strengths for Mix 0.44 for All Burns ..................... 173
Figure 5-19 AUR – Drying Shrinkage Development of Concrete Prisms for Mix 0.44
Concrete ....................................................................................................................... 174
Figure 5-20 AUR – Percent Difference in Physical Properties Relative to Baseline for Mix
0.37 Concrete for Trial Burns ....................................................................................... 179
Figure 5-21 AUR – Air-Corrected Compressive Strengths for Mix 0.37 for All Burns ..................... 181
Figure 5-22 AUR – Drying Shrinkage Development of Concrete Prisms for Mix 0.37
Concrete ....................................................................................................................... 182
Figure 5-23 Percent Difference Relative to Baseline Emissions for All Burns ................................ 193
Figure 5-24 Average Normalized Plant Emissions with ADEM Limits for All Burns ........................ 196
Figure 8-1 % Cl released by switchgrass and coal at varying pyrolysis temperatures
(Bjorkman, et al. 1997) ................................................................................................ 216
Figure 8-2 Alkali concentration in fluidized bed product gas before and after the gas
cooler for various fuels (Salo et al. 1998) ................................................................... 218
Figure 9-1 CPC mobile gasifier unit parked outside of the Alabama Capitol Building .................. 220
Figure 9-2 Labview schematic of Biomax 25 Gasifier .................................................................. 221
Figure 9-3 Gasifier with secondary air injection levels and grate level labeled ............................ 222
Figure 9-4 Average temperature profile inside the gasifier during a standard woodchip
run ............................................................................................................................... 222
xvi
Figure 9-5 Average temperature of the syngas at different locations in the system
starting at gasifier exit, proceeding through the heat exchanger (HEX), and
finally after the filter ..................................................................................................... 221
Figure 9-6 Gasifier opened at seam 10cm above the grate ......................................................... 224
Figure 9-7 Chamber below grate, slanted entrance to tube leading to heat exchanger at
right. Larger, heavier ash particles settle here ............................................................ 224
Figure 9-8 Access port at heat exchanger entrance, Shop-Vac in use ........................................ 225
Figure 9-9 Heat exchanger exit, tubes visible inside at left. Pipe bend and flexible hose
leading to filter box at right .......................................................................................... 225
Figure 9-10 Filter box with doors open. Bags are inverted inside barrels by syngas flow ............. 226
Figure 9-11 Gas analysis flow diagram .......................................................................................... 226
Figure 9-12 Gas analyzer train used during experiments .............................................................. 227
Figure 9-13 DewPro MMR101 used in contaminant quantification experiments ........................... 228
Figure 9-14 Poultry litter pellet detail and raw poultry litter ............................................................. 229
Figure 9-15 Propane water heater used for flue gas generation ..................................................... 230
Figure 10-1 Poultry litter clinker from initial trial, ~18 cm wide ........................................................ 237
Figure 10-2 Poultry litter pellet clinkers from 40% pellet run ........................................................... 239
Figure 10-3 View from top of gasifier of poultry litter pellet clinkers hung up between
levels 3 and 4 after loose biomass char had been removed. Level 5 is
obscured by clinkers .................................................................................................... 239
Figure 10-4 Average gasifier temperature profile during a typical run with pine chips ................... 240
Figure 10-5 Impression of nozzle in poultry pellet clinker .............................................................. 241
Figure 10-6 Average gasifier temperature profile during flue gas recirculation poultry litter ........... 241
Figure 10-7 Easily crumbled, grey amorphous ash from raw poultry litter with limestone .............. 245
Figure 10-8 ‘Woodchip Char’ sample, collected from the top of the gasifier ................................... 249
Figure 10-9 Ash mound as seen when gasifier is opened at crack above grate ............................ 249
Figure 10-10 Crumbled poultry litter ash as sent for analysis in one experiment for each
limestone set point (3.71, 5.71, and 7.71 % Lime/Wet PL), labeled ‘PL Ash’ .............. 250
Figure 10-11 ‘Rest of Gasifier’ sample, comprised mostly of charcoal and wood char .................... 250
Figure 10-12 Char collected from chamber below gasifier grate, labeled ‘Below Grate’ .................. 251
Figure 10-13 Char from inside and just after the heat exchanger, labeled ‘HEX’ ............................. 251
Figure 10-14 Char from inside and just after the heat exchanger, labeled ‘HEX’ ............................. 252
Figure 10-15 Chlorine Retention vs. Limestone Percentage ............................................................. 255
Figure 10-16 Alkali Retention vs. Limestone Percentage ................................................................. 256
Figure 10-17 Phosphorus and Calcium Retention vs. Limestone Percentage .................................. 257
Figure 10-18 Chlorine Retention vs. Limestone Percentage, Normalized to Calcium ...................... 258
xvii
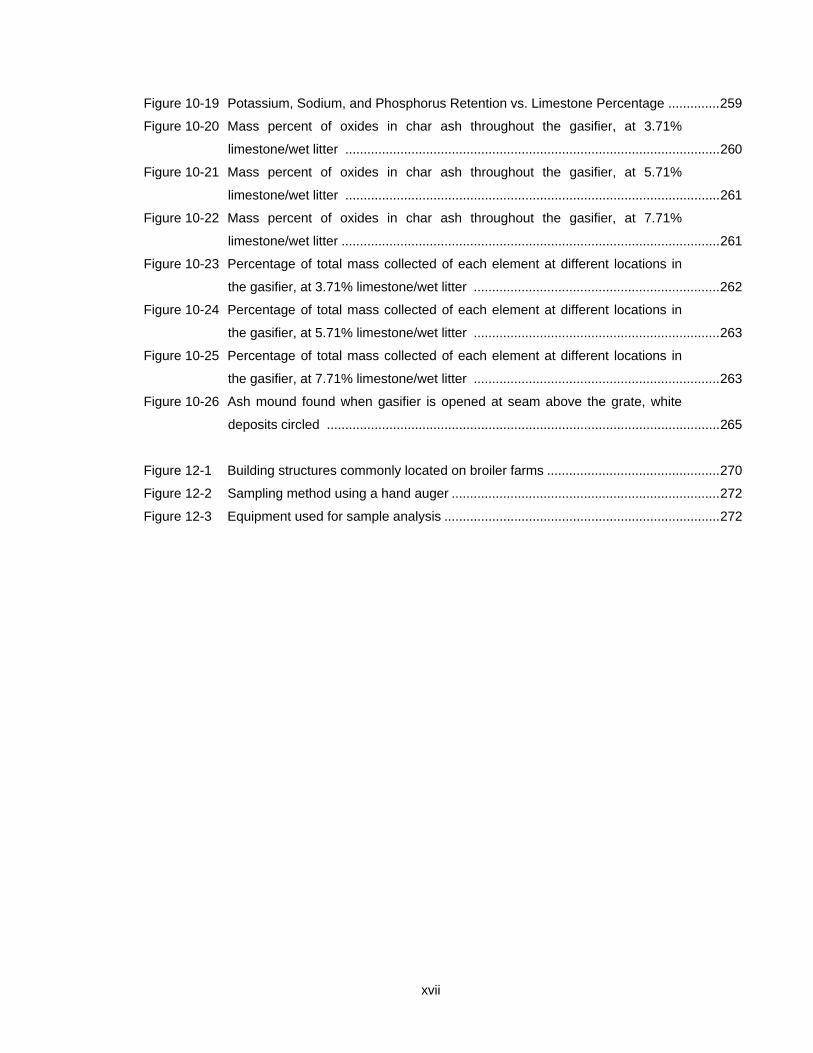
Figure 10-19 Potassium, Sodium, and Phosphorus Retention vs. Limestone Percentage .............. 259
Figure 10-20 Mass percent of oxides in char ash throughout the gasifier, at 3.71%
limestone/wet litter ...................................................................................................... 260
Figure 10-21 Mass percent of oxides in char ash throughout the gasifier, at 5.71%
limestone/wet litter ...................................................................................................... 261
Figure 10-22 Mass percent of oxides in char ash throughout the gasifier, at 7.71%
limestone/wet litter ....................................................................................................... 261
Figure 10-23 Percentage of total mass collected of each element at different locations in
the gasifier, at 3.71% limestone/wet litter ................................................................... 262
Figure 10-24 Percentage of total mass collected of each element at different locations in
the gasifier, at 5.71% limestone/wet litter ................................................................... 263
Figure 10-25 Percentage of total mass collected of each element at different locations in
the gasifier, at 7.71% limestone/wet litter ................................................................... 263
Figure 10-26 Ash mound found when gasifier is opened at seam above the grate, white
deposits circled ........................................................................................................... 265
Figure 12-1 Building structures commonly located on broiler farms ............................................... 270
Figure 12-2 Sampling method using a hand auger ......................................................................... 272
Figure 12-3 Equipment used for sample analysis ........................................................................... 272

1
CHAPTER 1
INTRODUCTION
1.1 PROJECT BACKGROUND
In 2010, over 3 billion tons of portland cement were produced globally making it the most widely
used and manufactured material in the world (Chen and Juenger 2009; ICR 2011). In the United
States, 113 cement plants that operate in 36 states produced 65 million tons of cement in 2010.
The United States is the third largest cement producer following China and India (PCA 2010; ICR
2011). The contribution of various countries to the total 3.3 billion tons of cement produced in
2010 is summarized in Figure 1-1.
Figure 1-1: World Cement Production in 2010 (Cembureau 2010)
The production of cement involves a combination of numerous raw materials, complex
facilities, and strictly monitored system processes. Portland cement is the primary ingredient in
concrete, which is used worldwide, as a construction material in order to form buildings, roads,
dams, and virtually any super- or substructure used by mankind. During the manufacture of
cement, immense quantities of fuels are used in order to reach temperatures necessary to

2
produce cement that bears the ideal chemical composition. Traditionally, fossil fuels have been
solely relied upon for the production of cement. Over the past few decades, concerns of
sustainability and environmental impact from fossil fuels have influenced the research of and
utilization of alternative fuel sources.
Portland cement is produced from several raw material mined from the earth. When
mixed in the proper proportions, and exposed to gas temperatures in excess of 1800 °C, the raw
materials fuse together to form a product known as clinker (Uliasz-Bocheńczyk 2003). The
clinker is then ground with an addition of sulfate to a specific fineness to produce a product
known as portland cement. A full-scale cement manufacturing facility is shown in Figure 1.1.
Figure 1-1: Full-Scale Portland Cement Production Facility (Folta 2010)
In order to produce high kiln temperatures, fossil fuels such as coal, petroleum coke, and
natural gas are regularly used. It is not uncommon for a modern cement plant to use 1,200 tons
of coal every day (Manias 2004). With the rising cost of energy, it is easy to see why fuel costs
comprise around 40 percent of a manufacturer’s budget and the incentive to seek less costly
fuels (Jackson 1998).
Around the 1970’s, alternative fuels began to be used by the cement industry
(Karstensen 2004). Modern facilities typically use alternative fuels to partially replace fossil fuels
at rates around 20% (PCA 2009). Alternative fuels are typically waste products from other
industries that are destined to be land-filled or incinerated. Examples that have successfully been
used in cement manufacture include used oils, municipal solid wastes, tires, solvents, plastic, and
biomass (Greco et al. 2004). Not only can waste fuels provide significant savings to a
3
manufacturer, if properly utilized alternative fuels can benefit the community and environment
(Mokrzycki and Uliasz-Bocheńczyk 2003). It is, however, necessary to test and thoroughly
understand all the attributes of the alternative fuel and its effects on the final product and
manufacturing process.
As a means to reduce congestion in landfills, waste incineration has been used for a
number of years. Waste incinerators also use fossil fuels in order to destroy the landfill material,
but emit more harmful pollutants than cement plants because of lower temperatures and
residence times. There is also no final product, like cement, produced from waste incineration.
Regardless of the whether the fuel is a natural resource or a second life for a waste
product, the chemical makeup of the fuel and its interaction with the chemical components of the
raw materials determine the final chemical composition of the clinker. Also, the majority of the
noncombustible components of the fuel and raw material are incorporated in the clinker.
Therefore, the use of alternative fuels could alter the chemical composition of cement and thus
negatively affect the properties of the cement and concrete. During this study, the chemical
composition of each fuel, raw material, and process output were determined. In addition, fresh
and hardened concrete property tests were performed to determine if any change in the cement
could be directly linked to the use of alternative fuels. If detrimental effects are found within a
particular cement, any advantage gained from the utilization of the alternative fuel is lost.
The utilization of alternative fuels has proven to be both beneficial to the cement industry
and the environment. It is, however, imperative to fully understand the effects of each new fuel.
This study considers three fuels, one of which utilized three different replacement rates.
Emissions such as nitrogen oxides, sulfur dioxide, and volatile organic compounds from the firing
of raw material and the combustion of fuel can be a significant health risk. Allowable emissions
limits set by environmental agencies were continuously monitored throughout each burn.
Preliminary testing of alternative fuels provides information about the chemical properties and
expected emissions.
The use of alternative fuels for direct burn in cement kilns can be limited by the presence
of fuel constituents that negatively impact kiln operation and/or the quality of cement produced.
Gasification has the potential to directly remove deleterious constituents that are components of
the fuel ash and allows for the possibility of cleanup of the syngas before it is introduced into the
cement kiln as fuel. Another objective of one of the phases of this research is to evaluate this
potential for fuels that were used in direct-burn trials for this research but where substitution rates
were limited because of deleterious components.
1.2 RESEARCH OBJECTIVES
The overarching project objective is to evaluate the use of alternative fuels to lessen the
dependence on non-renewable resources to produce portland cement. The key objective of
4
using alternative fuels is to continue to produce high-quality cement while decreasing the use of
non-renewable fuels and minimizing the impact on the environment. The objectives of this project
are as follows:
1. Collect data on the burn characteristics and thermodynamic parameters with a laboratory
burn simulator under conditions that mimic those in the preheater where the fuels are
brought into a cement plant.
2. Conduct trial burns at a full-scale cement plant with alternative fuels to examine their
compatibility with the cement production process.
3. Determine the feasibility of removing non-volatile and semi-volatile components of
alternative fuels through gasification in a small-scale downdraft gasifier.
4. Develop a reliable, but convenient, sampling procedure to estimate the combustion
quality of broiler litter that is the best compromise between convenience and reliability by
means of statistical analysis.
1.3 RESEARCH PLAN
This project will address the area of renewable energy integration by evaluating the reduction of
emissions of air pollutants through increased use of renewable energy sources. A laboratory
burn simulator was used to assess the high temperature conversion of a variety of alternate fuels
under conditions that mimic those in the cement preheater. Studies were performed with a small-
scale downdraft gasifier to identify candidate alternative fuels that have demonstrated deleterious
effects in direct burn and then measure the ability of gasification to remove the contaminants.
The research with the gasifier focused on determining the feasibility of removing the non-volatile
and semi-volatile components of interest through gasification. Broiler litter stacks at commercial
broiler farms were sampled and analyzed to determine the nature of the chemical composition of
composted broiler litter. Statistical analysis results of these data were evaluated to develop a
sampling procedure for estimating the combustion quality of broiler litter that is the best
compromise between convenience and reliability.
Trial burns were conducted at a full-scale cement plant to determine the effect of using
alternative fuels on cement plant production, the chemical composition of clinker and cement
produced, the physical properties of the cement produced, the properties of concrete made from
this cement, and the emissions released by the cement plant.
1.4 REPORT ORGANIZATION
This document is organized into five parts, with twelve chapters followed by some appendices.
The parts of the report are as follows:
Part 1 - Determine the Burn Characteristics of Alternative Fuels with Burn Simulator,
5
Part 2 - Full-Scale Trial Burns with Alternative Fuels at Cement Plant,
Part 3 - Evaluate Gasification to Remove Contaminants in Cement Production,
Part 4 - Develop Sampling Procedure to Estimate Combustion Quality of Broiler Litter, and
Part 5 - Feasibility of Using Selected Alternate Fuels in Portland Cement Production.
Chapter 2 contains all the work performed for Part 1 of this research project. A
laboratory-scale, drop-tube furnace was designed and manufactured that enabled the research
team to mimic conditions of the preheater section of the cement plant. The focus of the work was
to develop imaging and visualization methods to obtain images and video of particles and
droplets of various fuels undergoing combustion that are of high enough quality and resolution to
allow development of three-color pyrometry to determine surface temperatures.
Chapters 3 through 6 contain all the work performed for Part 2 of this research project.
Chapter 3 details previous research and literature that pertain to many facets of this phase of the
project. The experimental plan used throughout Part 2 of this project is defined in Chapter 4.
The data collected during Part 2 are presented, analyzed, and discussed in Chapter 5. The
conclusions and recommendations of the work performed for Part 2 are presented in Chapter 6.
Chapters 7 through 11 contain all the work performed for Part 3 of this research project.
Chapter 7 contains an introduction, a brief literature review of the issues related to gasification
and the use of poultry litter as alternative fuel. Section 7.4 defines the research objectives for
Part 3 and Section 7.5 contains the definition of acronyms and abbreviations used in Part 3.
Chapter 8 provides background information for Part 3. The experimental setup and procedures
used for Part 3 of this project is presented in Chapter 9. The data collected during Part 3 are
presented and discussed in Chapter 10. The conclusions and recommendations of the work
performed for Part 3 are presented in Chapter 11.
Chapter 12 contains all the work performed for Part 4 of this research project. The
experimental procedures used for this effort are defined and the statistical methods used to
develop the sampling procedure is presented in detail.
Chapter 13 contains all the work performed for Part 5 of this research project. The work
presented in this chapter is aimed at determining factors that may drive the availability and cost of
alternative fuels relative to the availability and cost of traditional, non-renewable fuel sources.
The final chapter, Chapter 14, of this report contains the main conclusions and
recommendations related to this research project. Conclusions are drawn as they pertain to the
objectives. This chapter concludes with recommendations on a number of aspects of this project.
The report also contains some appendices that contain some of the information
supporting Part 3.
6
PART 1
Determine the Burn Characteristics of
Alternative Fuels with Burn Simulator
7
CHAPTER 2
DETERMINE THE BURN CHARACTERISTICS OF ALTERNATIVE
FUELS WITH BURN SIMULATOR
The overarching project objective is to evaluate the use of alternative fuels to lessen the
dependence on non-renewable resources to produce portland cement. The key objective of
using alternative fuels is to continue to produce high-quality cement while decreasing the use of
non-renewable fuels and minimizing the impact on the environment. One major facet of the
research conducted for this part one of this study is to evaluate individual particles and droplets of
fuels undergoing combustion to provide a fundamental understanding of the burn characteristics
of the fuels to complement the industrial and pilot scale studies for the same alternative fuels.
2.1 DEVELOPMENT OF A LABORATORY BURN SIMULATOR FACILITY
A laboratory scale drop tube furnace was designed and manufactured by ATS that enables us to
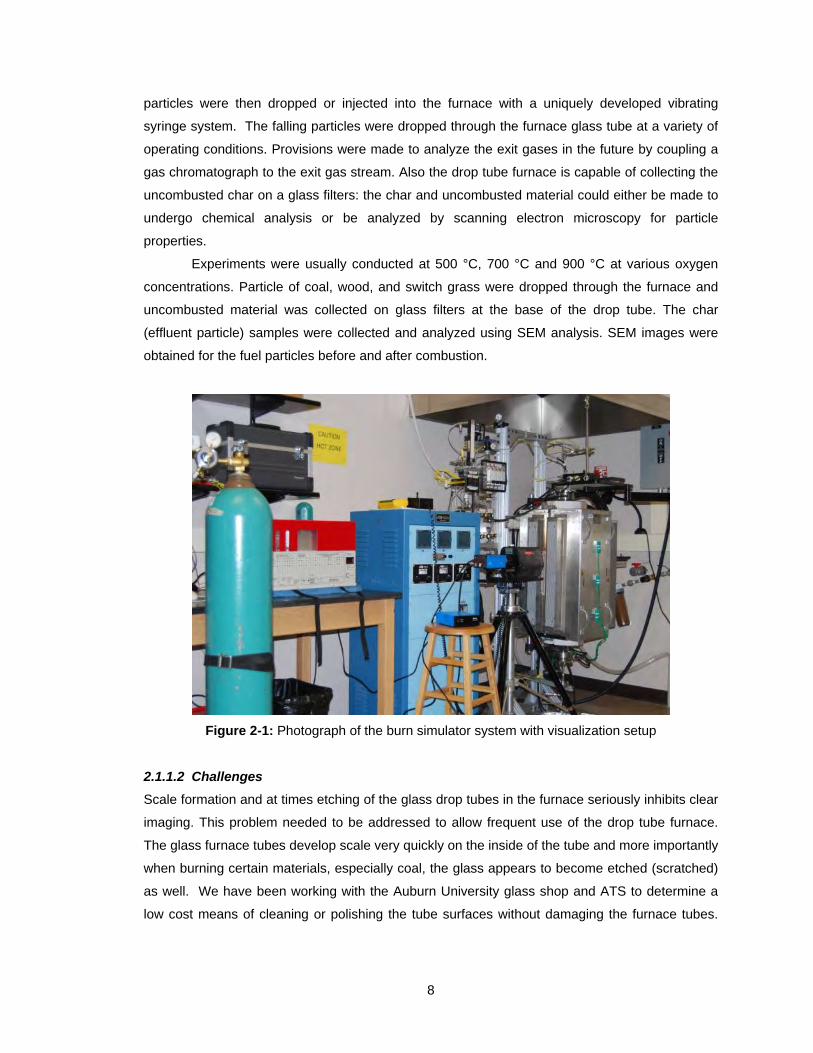
mimic conditions of the preheater section of the cement plant. A photograph of the burn simulator
system with visualization setup used for this research is shown in Figure 2-1. It can be operated
over a wide range of temperatures ranging from 20 °C to 1400 °C and at varying oxygen
concentrations ranging from 0 % to above 21 %. A filter at the exit of the drop tube allows
collection of uncombusted material. The effluent gases can be vented or sent through a GC.
However, the focus of the work completed for this project has been the development of imaging
and visualization methods to obtain images and video of particles and droplets of various fuels
undergoing combustion that are of high enough quality and resolution to allow development of
three-color pyrometry to determine surface temperatures.
The objective of the work document in this section is to obtain burn characteristics and
understand the phenomenon in high temperature conversion of the alternate fuels under
conditions that mimic those in the cement preheater where the fuels are brought into the industrial
process.
2.1.1 Experimental Work
2.1.1.1 Burn Simulator Setup
Samples of alternative fuel types that were used at the cement plant were collected by Auburn
laboratories. These alternative fuel samples of switch grass and wood along with coal (used as
the standard fossil fuel) were ground to approximately 100 micron sized particles. These fine
8
particles were then dropped or injected into the furnace with a uniquely developed vibrating
syringe system. The falling particles were dropped through the furnace glass tube at a variety of
operating conditions. Provisions were made to analyze the exit gases in the future by coupling a
gas chromatograph to the exit gas stream. Also the drop tube furnace is capable of collecting the
uncombusted char on a glass filters: the char and uncombusted material could either be made to
undergo chemical analysis or be analyzed by scanning electron microscopy for particle
properties.
Experiments were usually conducted at 500 °C, 700 °C and 900 °C at various oxygen
concentrations. Particle of coal, wood, and switch grass were dropped through the furnace and
uncombusted material was collected on glass filters at the base of the drop tube. The char
(effluent particle) samples were collected and analyzed using SEM analysis. SEM images were
obtained for the fuel particles before and after combustion.
Figure 2-1: Photograph of the burn simulator system with visualization setup
2.1.1.2 Challenges
Scale formation and at times etching of the glass drop tubes in the furnace seriously inhibits clear
imaging. This problem needed to be addressed to allow frequent use of the drop tube furnace.
The glass furnace tubes develop scale very quickly on the inside of the tube and more importantly
when burning certain materials, especially coal, the glass appears to become etched (scratched)
as well. We have been working with the Auburn University glass shop and ATS to determine a
low cost means of cleaning or polishing the tube surfaces without damaging the furnace tubes.
9
We redesigned the effluent piping to incorporate an in-line vacuum pump that enables oxygen
and GC sensors to provide useful measurements of gas composition.
2.2 VISUALIZATION STUDIES OF NEW FUEL TYPES UNDERGOING COMBUSTION
The objective of this work is to visualize the alternative fuel particles of 100 micrometers size
undergoing combustion inside the drop tube furnace in order to get a better understanding of the
mechanisms contributing to effective of combustion at different temperature and oxygen
concentrations.
Visualization of particles in combustion was carried out by means of a high speed camera
and high magnification lens setup. Both monochrome and high intensity color cameras were
employed in combination with varying lens magnification systems to get a good quality image.
2.2.1 Experimental Work
Initial visualization exploration was conducted with a monochrome camera because the simplicity
of the camera allowed evaluation of potential for focus clarity and magnification level, and allowed
assessment of light intensity. Lens and light settings were then used to evaluate potential for
visualization with a Cooke PCO 1200 high speed color camera. The PCO camera is very
sensitive to light level and we continue to struggle with the procedures and settings needed to
obtain visualizations. The particles fall through the drop tube at high velocities; however motion
blur can be eliminated with exposure time settings and high frame rates (up to 3000 frames per
second). Unfortunately, focus and light level issues related to use of the new specialized camera
with the existing high magnification Questar lens still exist.
2.2.1.1 Solid Fuel Combustion Visualization
Visualizations of combustion of 100 micrometer particles of coal, wood, and switch grass in the
drop tube furnace at various temperature and oxygen concentrations were obtained. We had to
work with a variety of lens and camera combinations to develop focus techniques that will allow
consistent acquisition of color images of particle undergoing combustion. The images thus
obtained had sufficient clarity and adjustable degrees of magnification. Figures 2-2 and 2-3 show
sample images from experiments with switch grass and wood.
10
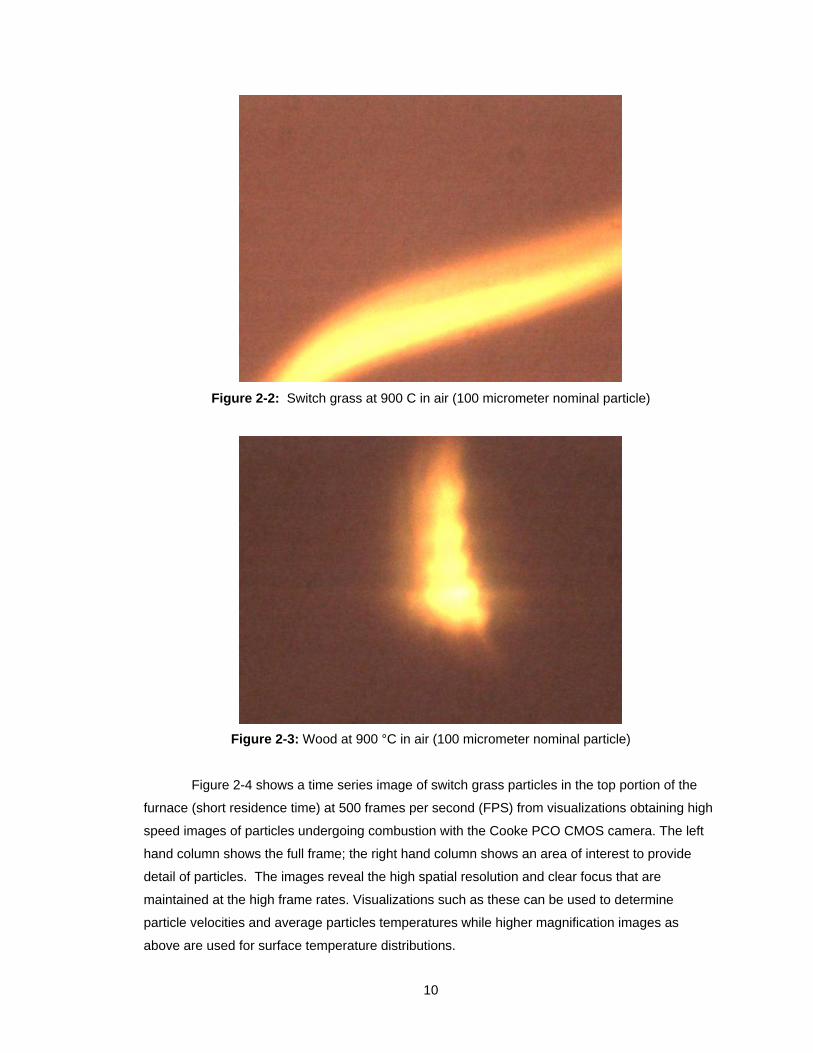
Figure 2-2: Switch grass at 900 C in air (100 micrometer nominal particle)
Figure 2-3: Wood at 900 °C in air (100 micrometer nominal particle)
Figure 2-4 shows a time series image of switch grass particles in the top portion of the
furnace (short residence time) at 500 frames per second (FPS) from visualizations obtaining high
speed images of particles undergoing combustion with the Cooke PCO CMOS camera. The left
hand column shows the full frame; the right hand column shows an area of interest to provide
detail of particles. The images reveal the high spatial resolution and clear focus that are
maintained at the high frame rates. Visualizations such as these can be used to determine
particle velocities and average particles temperatures while higher magnification images as
above are used for surface temperature distributions.
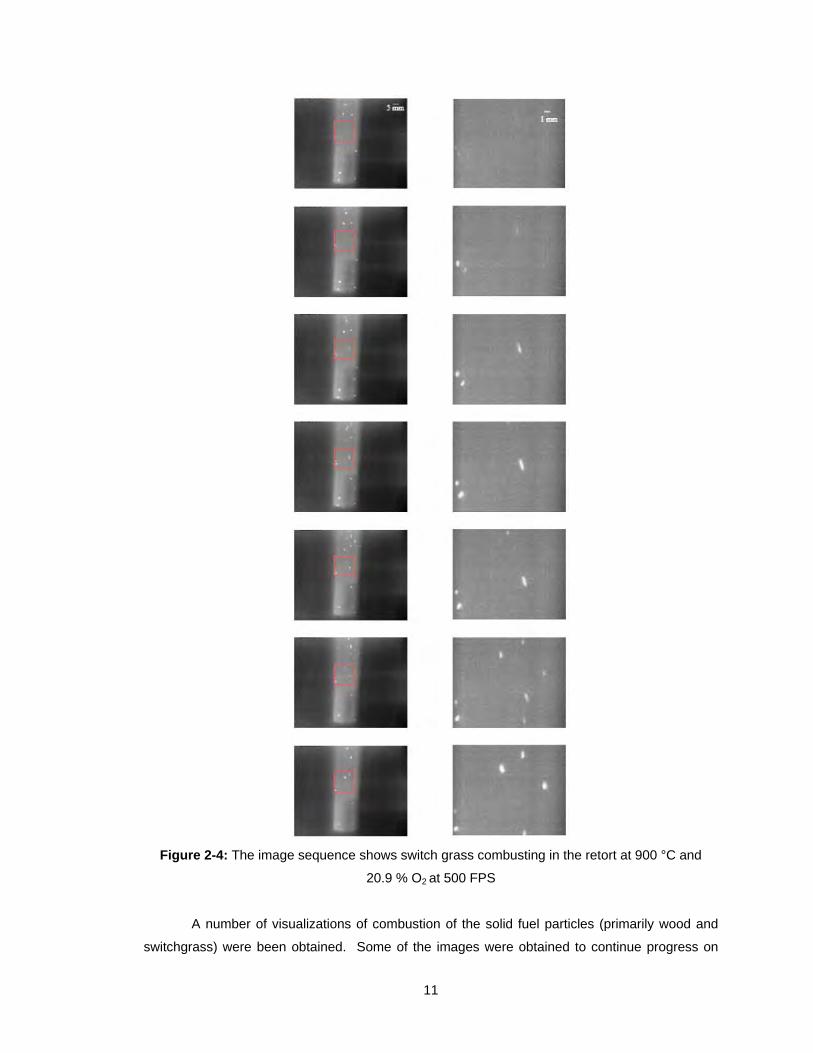
11
Figure 2-4: The image sequence shows switch grass combusting in the retort at 900 °C and
20.9 % O2 at 500 FPS
A number of visualizations of combustion of the solid fuel particles (primarily wood and
switchgrass) were been obtained. Some of the images were obtained to continue progress on
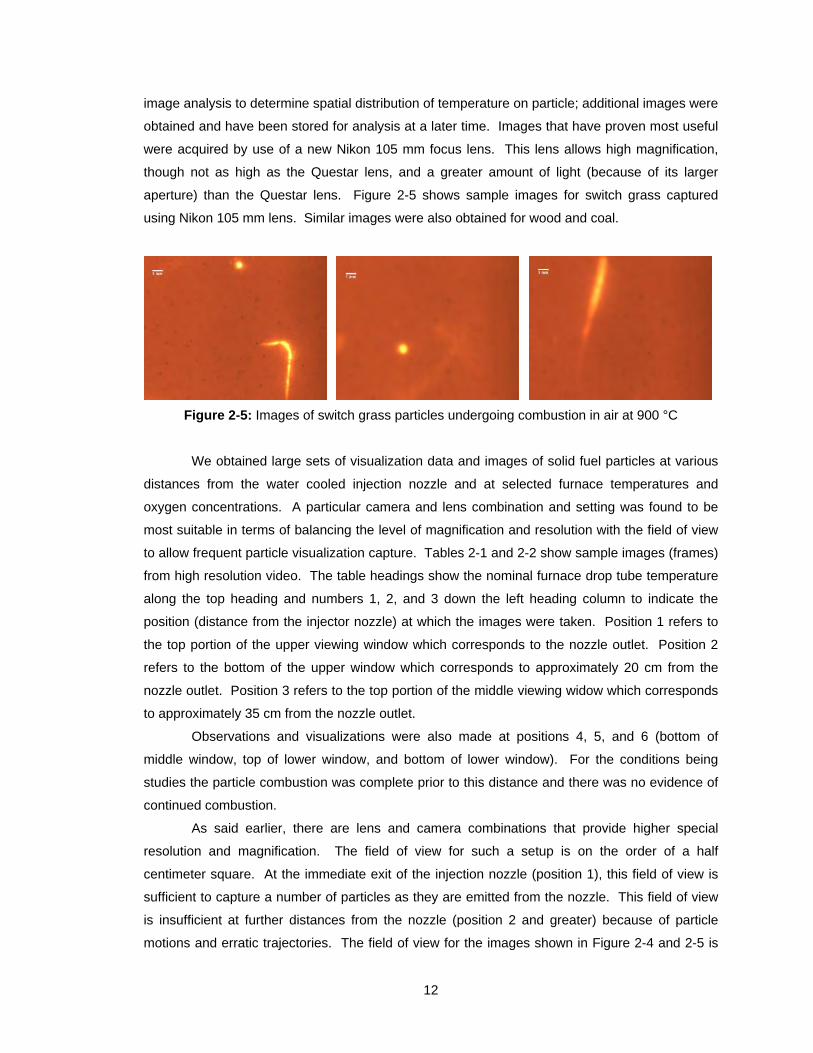
12
image analysis to determine spatial distribution of temperature on particle; additional images were
obtained and have been stored for analysis at a later time. Images that have proven most useful
were acquired by use of a new Nikon 105 mm focus lens. This lens allows high magnification,
though not as high as the Questar lens, and a greater amount of light (because of its larger
aperture) than the Questar lens. Figure 2-5 shows sample images for switch grass captured
using Nikon 105 mm lens. Similar images were also obtained for wood and coal.
Figure 2-5: Images of switch grass particles undergoing combustion in air at 900 °C
We obtained large sets of visualization data and images of solid fuel particles at various
distances from the water cooled injection nozzle and at selected furnace temperatures and
oxygen concentrations. A particular camera and lens combination and setting was found to be
most suitable in terms of balancing the level of magnification and resolution with the field of view
to allow frequent particle visualization capture. Tables 2-1 and 2-2 show sample images (frames)
from high resolution video. The table headings show the nominal furnace drop tube temperature
along the top heading and numbers 1, 2, and 3 down the left heading column to indicate the
position (distance from the injector nozzle) at which the images were taken. Position 1 refers to
the top portion of the upper viewing window which corresponds to the nozzle outlet. Position 2
refers to the bottom of the upper window which corresponds to approximately 20 cm from the
nozzle outlet. Position 3 refers to the top portion of the middle viewing widow which corresponds
to approximately 35 cm from the nozzle outlet.
Observations and visualizations were also made at positions 4, 5, and 6 (bottom of
middle window, top of lower window, and bottom of lower window). For the conditions being
studies the particle combustion was complete prior to this distance and there was no evidence of
continued combustion.
As said earlier, there are lens and camera combinations that provide higher special
resolution and magnification. The field of view for such a setup is on the order of a half
centimeter square. At the immediate exit of the injection nozzle (position 1), this field of view is
sufficient to capture a number of particles as they are emitted from the nozzle. This field of view
is insufficient at further distances from the nozzle (position 2 and greater) because of particle
motions and erratic trajectories. The field of view for the images shown in Figure 2-4 and 2-5 is
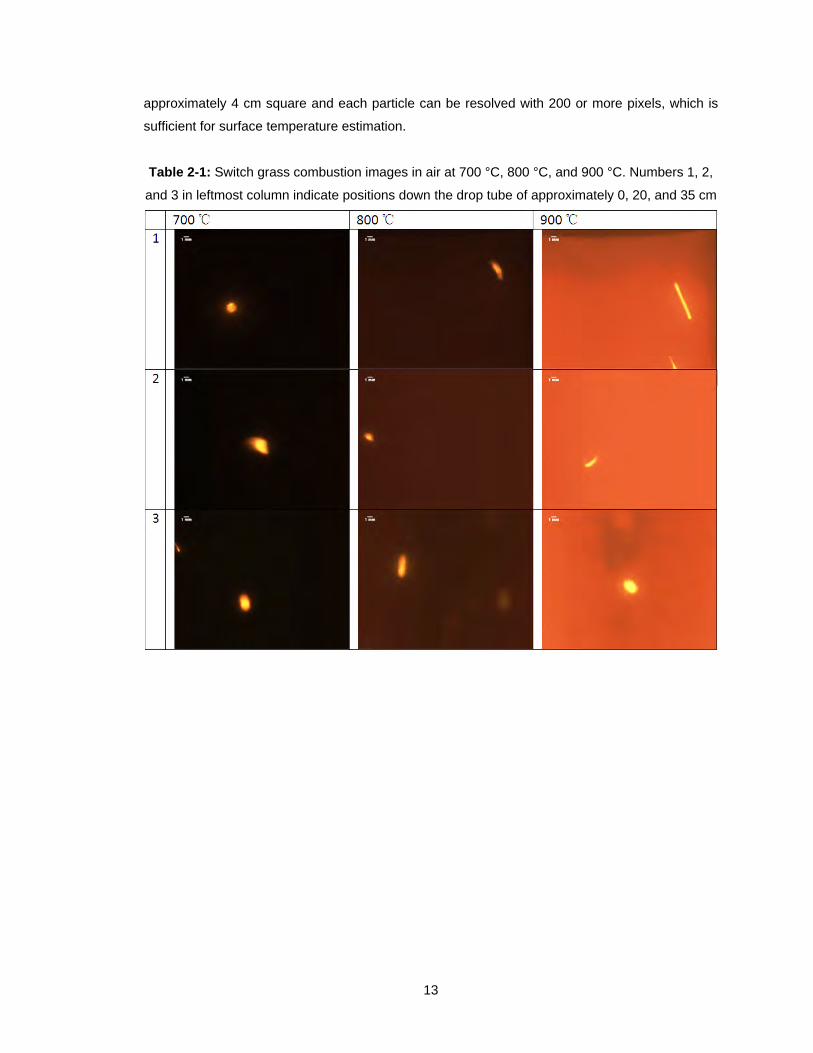
13
approximately 4 cm square and each particle can be resolved with 200 or more pixels, which is
sufficient for surface temperature estimation.
Table 2-1: Switch grass combustion images in air at 700 °C, 800 °C, and 900 °C. Numbers 1, 2,
and 3 in leftmost column indicate positions down the drop tube of approximately 0, 20, and 35 cm
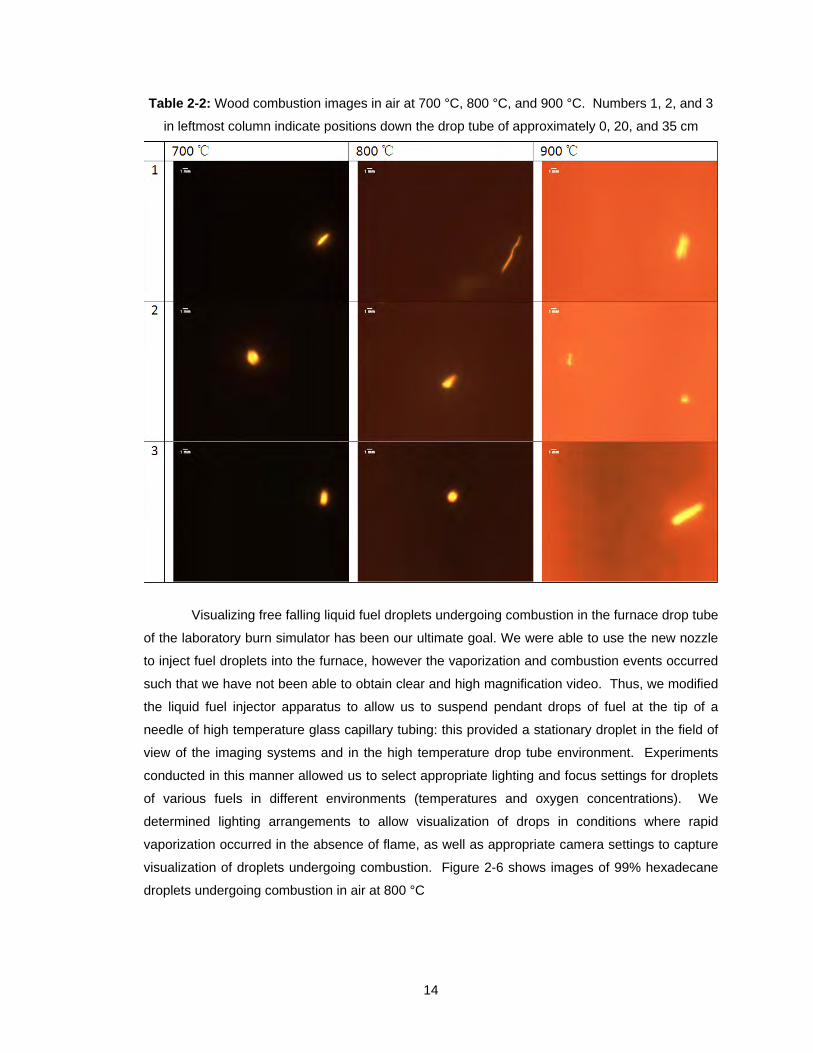
14
Table 2-2: Wood combustion images in air at 700 °C, 800 °C, and 900 °C. Numbers 1, 2, and 3
in leftmost column indicate positions down the drop tube of approximately 0, 20, and 35 cm
Visualizing free falling liquid fuel droplets undergoing combustion in the furnace drop tube
of the laboratory burn simulator has been our ultimate goal. We were able to use the new nozzle
to inject fuel droplets into the furnace, however the vaporization and combustion events occurred
such that we have not been able to obtain clear and high magnification video. Thus, we modified
the liquid fuel injector apparatus to allow us to suspend pendant drops of fuel at the tip of a
needle of high temperature glass capillary tubing: this provided a stationary droplet in the field of
view of the imaging systems and in the high temperature drop tube environment. Experiments
conducted in this manner allowed us to select appropriate lighting and focus settings for droplets
of various fuels in different environments (temperatures and oxygen concentrations). We
determined lighting arrangements to allow visualization of drops in conditions where rapid
vaporization occurred in the absence of flame, as well as appropriate camera settings to capture
visualization of droplets undergoing combustion. Figure 2-6 shows images of 99% hexadecane
droplets undergoing combustion in air at 800 °C
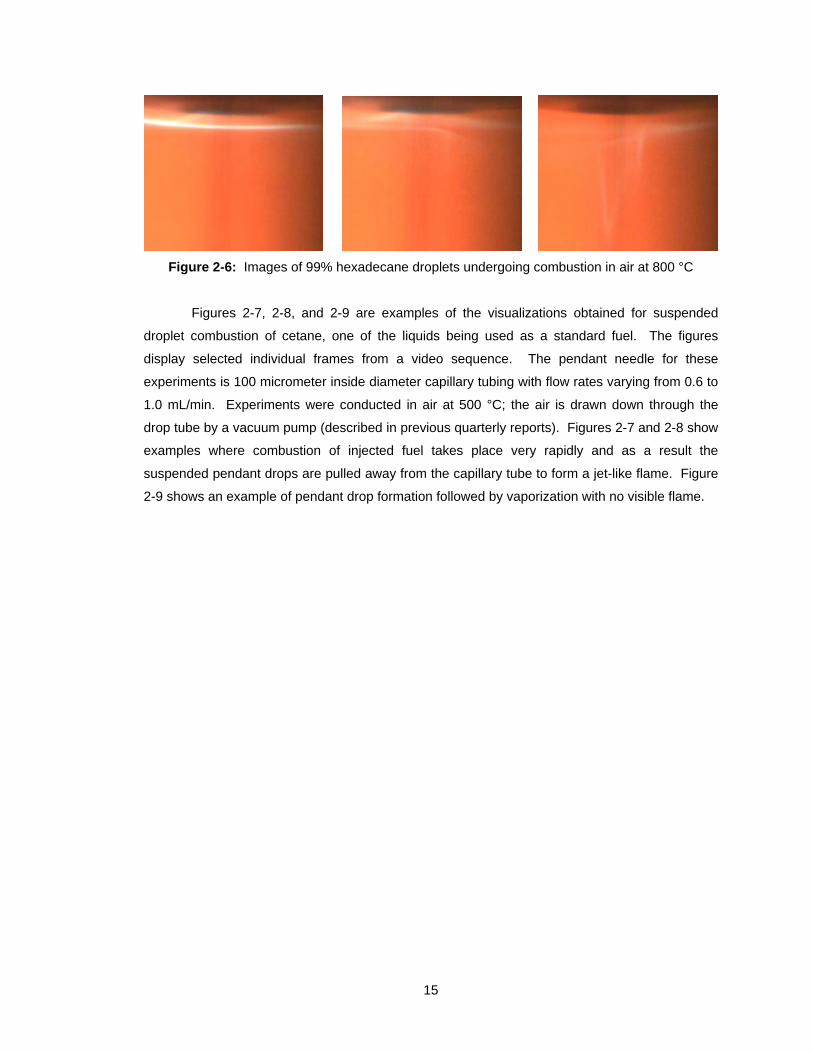
15
Figure 2-6: Images of 99% hexadecane droplets undergoing combustion in air at 800 °C
Figures 2-7, 2-8, and 2-9 are examples of the visualizations obtained for suspended
droplet combustion of cetane, one of the liquids being used as a standard fuel. The figures
display selected individual frames from a video sequence. The pendant needle for these
experiments is 100 micrometer inside diameter capillary tubing with flow rates varying from 0.6 to
1.0 mL/min. Experiments were conducted in air at 500 °C; the air is drawn down through the
drop tube by a vacuum pump (described in previous quarterly reports). Figures 2-7 and 2-8 show
examples where combustion of injected fuel takes place very rapidly and as a result the
suspended pendant drops are pulled away from the capillary tube to form a jet-like flame. Figure
2-9 shows an example of pendant drop formation followed by vaporization with no visible flame.
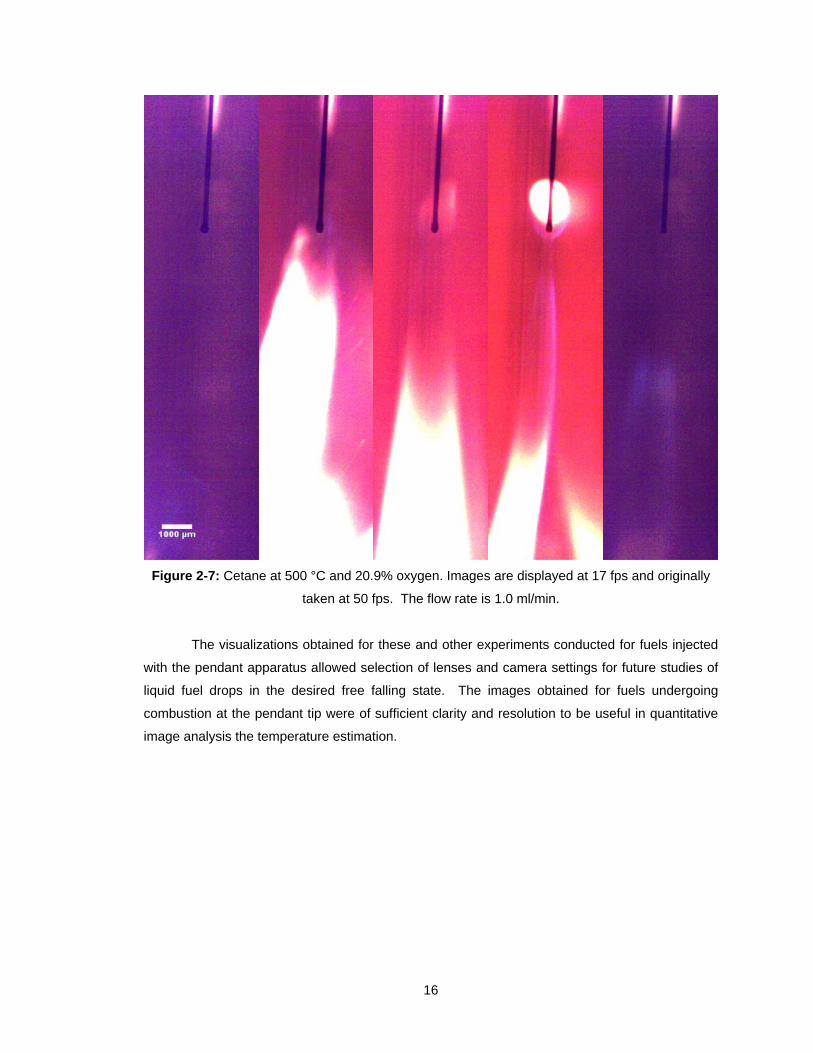
16
Figure 2-7: Cetane at 500 °C and 20.9% oxygen. Images are displayed at 17 fps and originally
taken at 50 fps. The flow rate is 1.0 ml/min.
The visualizations obtained for these and other experiments conducted for fuels injected
with the pendant apparatus allowed selection of lenses and camera settings for future studies of
liquid fuel drops in the desired free falling state. The images obtained for fuels undergoing
combustion at the pendant tip were of sufficient clarity and resolution to be useful in quantitative
image analysis the temperature estimation.
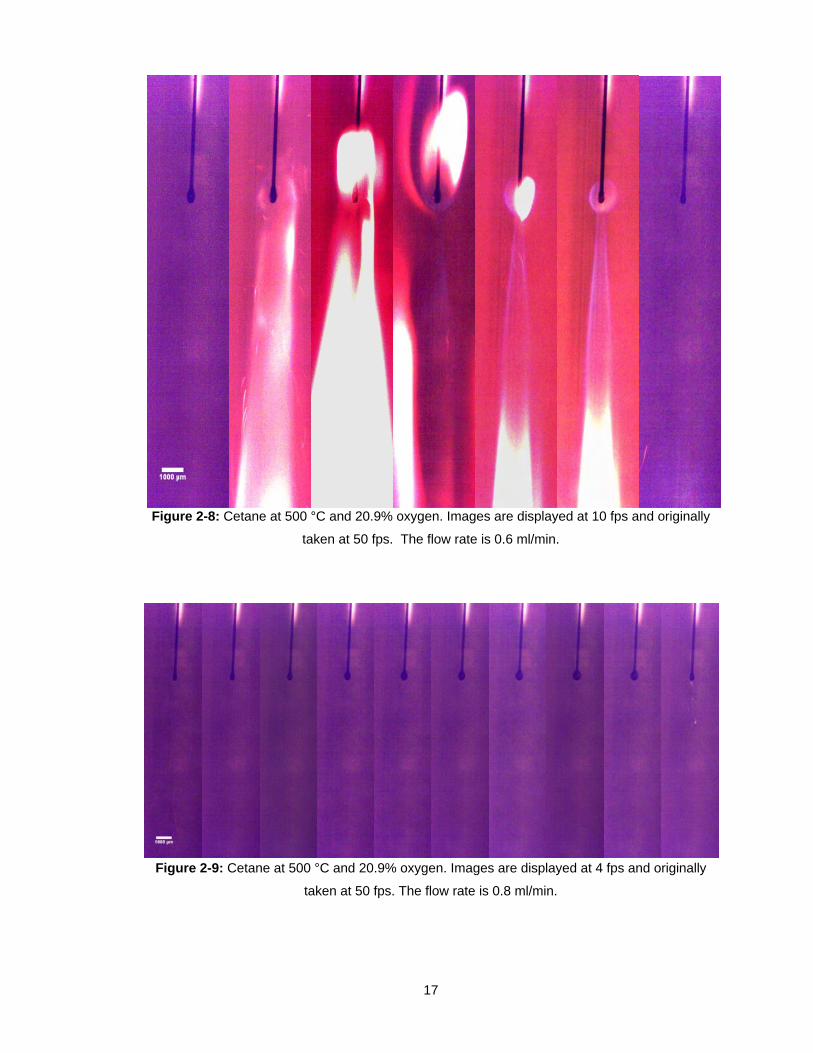
17
Figure 2-8: Cetane at 500 °C and 20.9% oxygen. Images are displayed at 10 fps and originally
taken at 50 fps. The flow rate is 0.6 ml/min.
Figure 2-9: Cetane at 500 °C and 20.9% oxygen. Images are displayed at 4 fps and originally
taken at 50 fps. The flow rate is 0.8 ml/min.
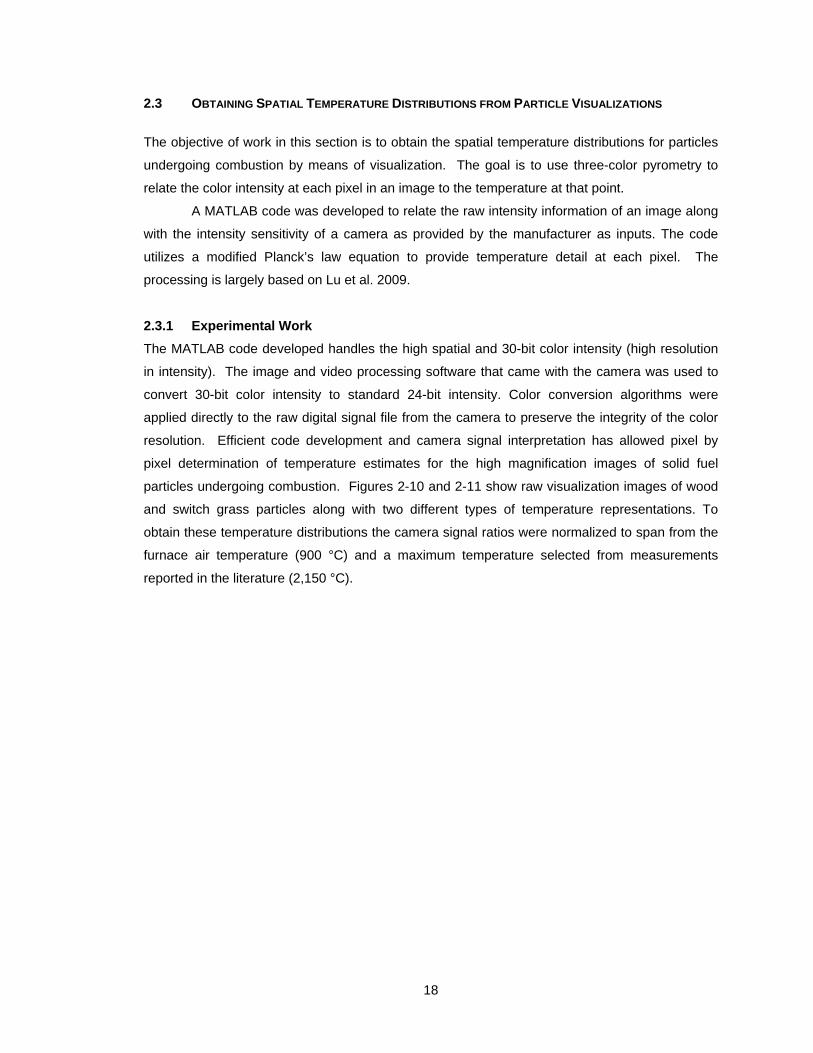
18
2.3 OBTAINING SPATIAL TEMPERATURE DISTRIBUTIONS FROM PARTICLE VISUALIZATIONS
The objective of work in this section is to obtain the spatial temperature distributions for particles
undergoing combustion by means of visualization. The goal is to use three-color pyrometry to
relate the color intensity at each pixel in an image to the temperature at that point.
A MATLAB code was developed to relate the raw intensity information of an image along
with the intensity sensitivity of a camera as provided by the manufacturer as inputs. The code
utilizes a modified Planck’s law equation to provide temperature detail at each pixel. The
processing is largely based on Lu et al. 2009.
2.3.1 Experimental Work
The MATLAB code developed handles the high spatial and 30-bit color intensity (high resolution
in intensity). The image and video processing software that came with the camera was used to
convert 30-bit color intensity to standard 24-bit intensity. Color conversion algorithms were
applied directly to the raw digital signal file from the camera to preserve the integrity of the color
resolution. Efficient code development and camera signal interpretation has allowed pixel by
pixel determination of temperature estimates for the high magnification images of solid fuel
particles undergoing combustion. Figures 2-10 and 2-11 show raw visualization images of wood
and switch grass particles along with two different types of temperature representations. To
obtain these temperature distributions the camera signal ratios were normalized to span from the
furnace air temperature (900 °C) and a maximum temperature selected from measurements
reported in the literature (2,150 °C).
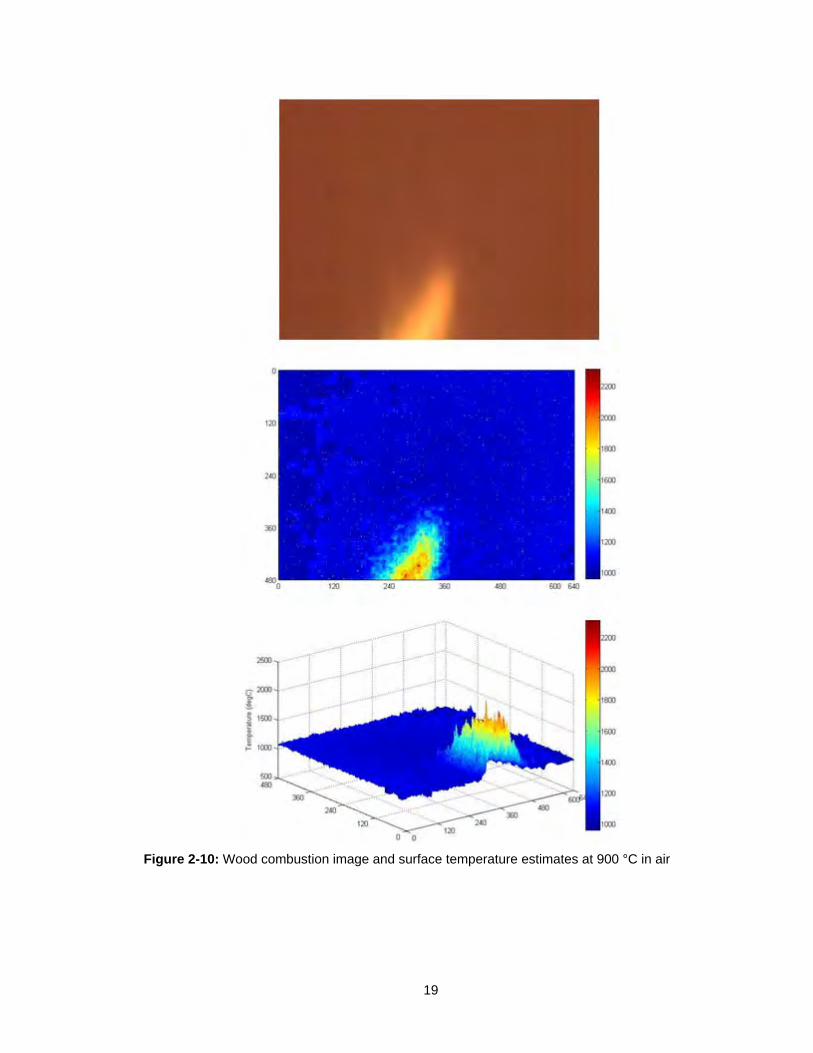
19
Figure 2-10: Wood combustion image and surface temperature estimates at 900 °C in air
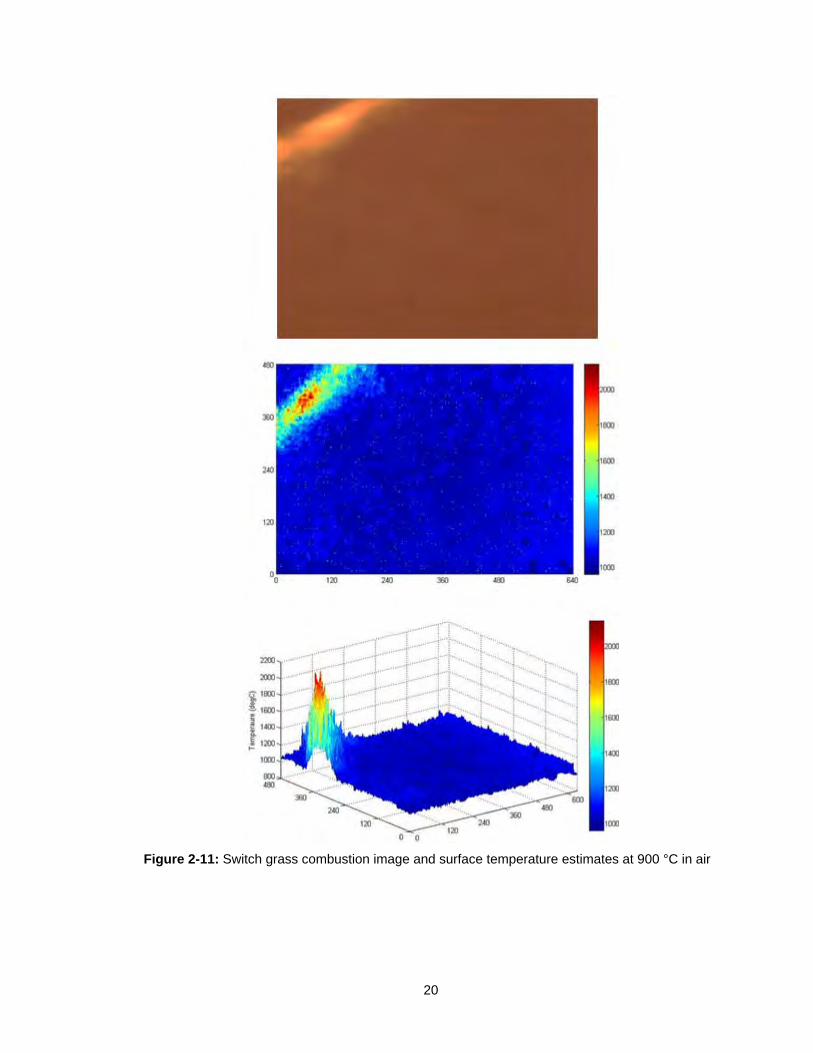
20
Figure 2-11: Switch grass combustion image and surface temperature estimates at 900 °C in air
21
At the end of this project, the challenge remained to develop a process to obtain known
temperature sources to calibrate the temperature range. As of now, the temperature distributions
at this point do not account for particle shape (surface angle with respect to the camera). Table 2-
3 shows the average temperatures obtained from analysis of images for particle combustion. The
values shown are only preliminary and are displayed to indicate that the temperatures are
consistent with those anticipated from literature.
Table 2-3: Particle Average Temperature
Condition Switch Grass Wood
Air (20.9% O2) 1740 °C 1810 °C
5% O2 1530 °C Not Applicable
Tables 2-4 and 2-5 show temperature surface distribution estimates for switch grass and
wood particles for furnace temperatures of 700 C, 800 °C and 900 °C at various distances from
the drop tube nozzle. The raw images were displayed in Tables 2-1 and 2-2.
We incorporated the equation for the wall effect on temperature emission and performed
a sensitivity analysis to determine that the wall had less than a 3% influence on temperature
determination. Therefore the assumption that wall effect is negligible is reasonable, and this
assumption greatly reduced computational time. The temperature distribution calculations reveal
that additional smoothing and shape factor considerations need to be incorporated into the image
analysis and processing algorithms and the computational processing (MATLAB coding).
Nevertheless, the temperature estimations show that the visualization quality and the image
processing are capable of obtaining temperatures in the expected range for the wall surroundings
and for the maximum temperatures at the particle surface. Further improvements to the image
processing are recommended for future research.
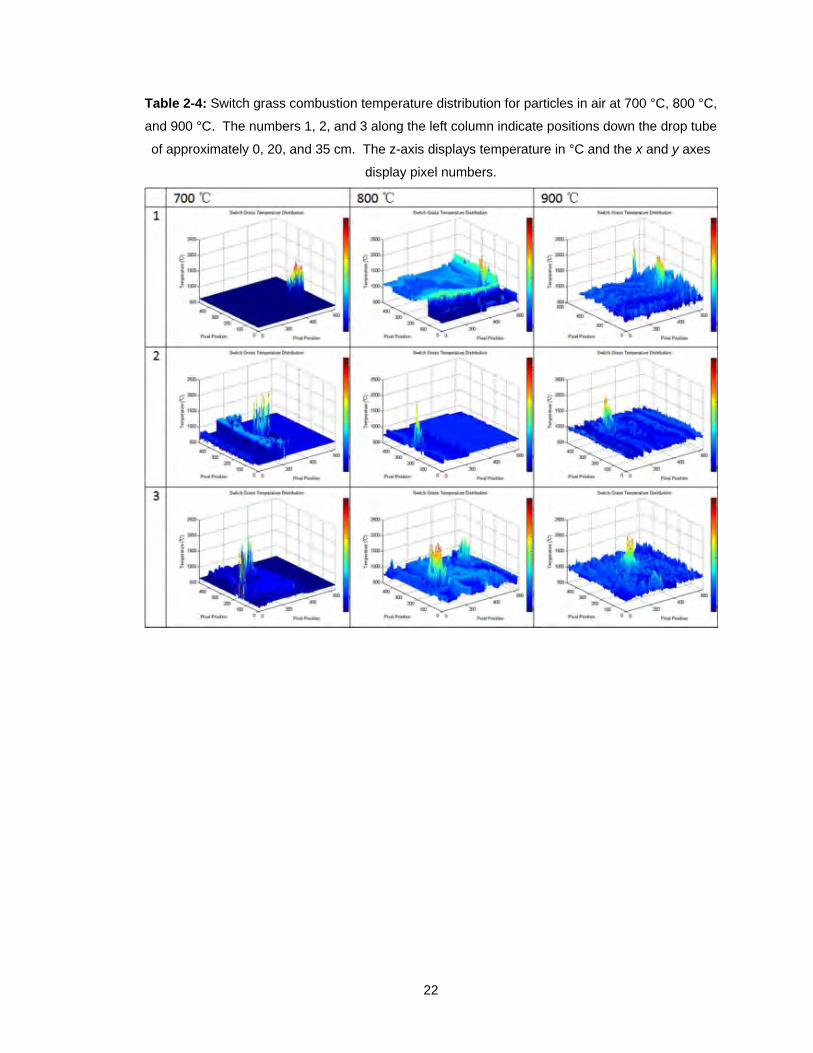
22
Table 2-4: Switch grass combustion temperature distribution for particles in air at 700 °C, 800 °C,
and 900 °C. The numbers 1, 2, and 3 along the left column indicate positions down the drop tube
of approximately 0, 20, and 35 cm. The z-axis displays temperature in °C and the x and y axes
display pixel numbers.
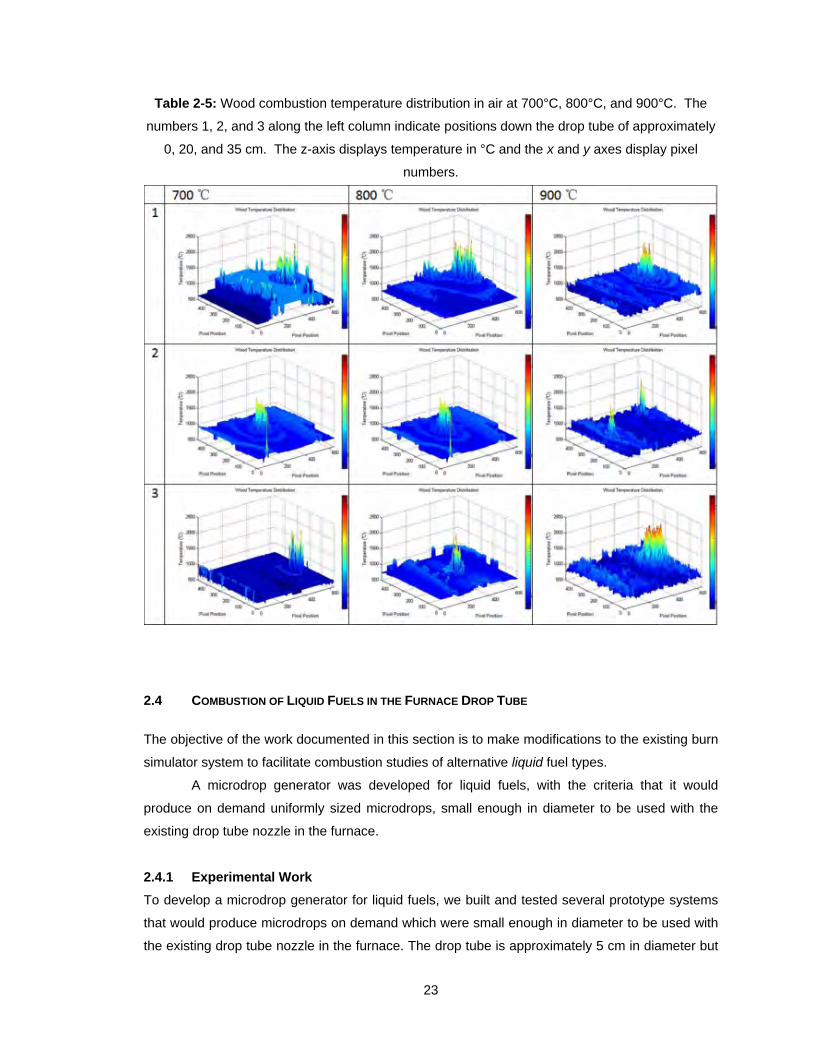
23
Table 2-5: Wood combustion temperature distribution in air at 700°C, 800°C, and 900°C. The
numbers 1, 2, and 3 along the left column indicate positions down the drop tube of approximately
0, 20, and 35 cm. The z-axis displays temperature in °C and the x and y axes display pixel
numbers.
2.4 COMBUSTION OF LIQUID FUELS IN THE FURNACE DROP TUBE
The objective of the work documented in this section is to make modifications to the existing burn
simulator system to facilitate combustion studies of alternative liquid fuel types.
A microdrop generator was developed for liquid fuels, with the criteria that it would
produce on demand uniformly sized microdrops, small enough in diameter to be used with the
existing drop tube nozzle in the furnace.
2.4.1 Experimental Work
To develop a microdrop generator for liquid fuels, we built and tested several prototype systems
that would produce microdrops on demand which were small enough in diameter to be used with
the existing drop tube nozzle in the furnace. The drop tube is approximately 5 cm in diameter but
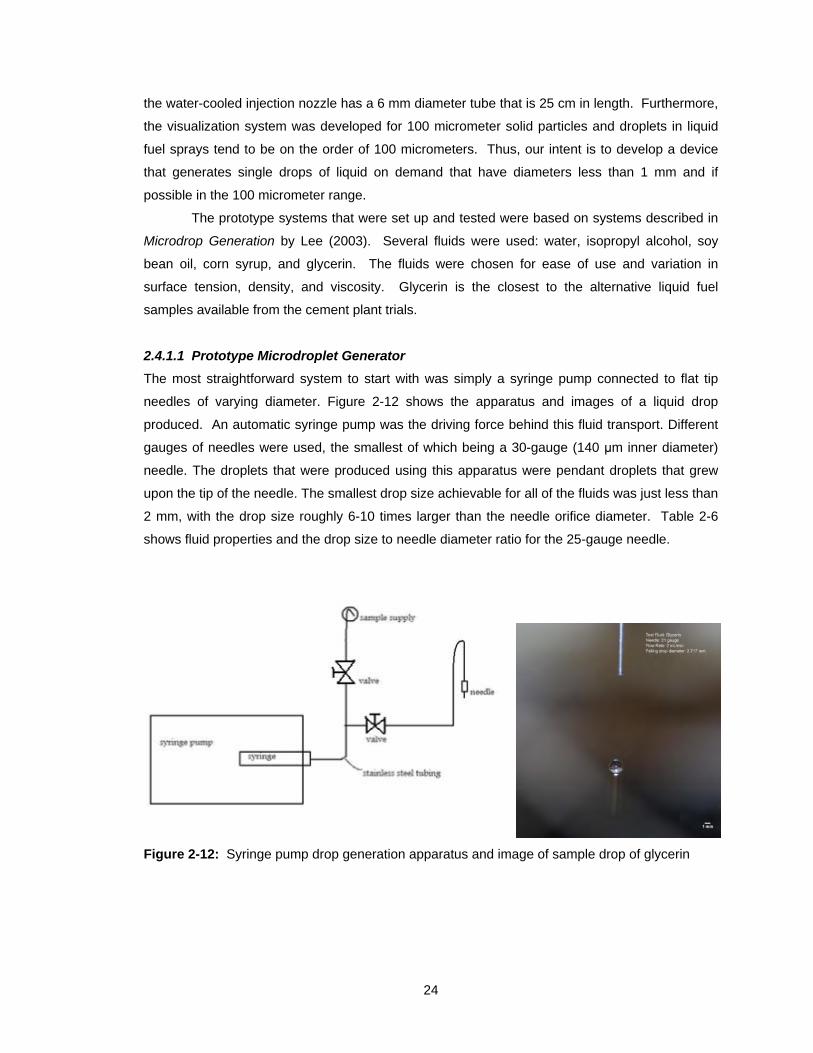
24
the water-cooled injection nozzle has a 6 mm diameter tube that is 25 cm in length. Furthermore,
the visualization system was developed for 100 micrometer solid particles and droplets in liquid
fuel sprays tend to be on the order of 100 micrometers. Thus, our intent is to develop a device
that generates single drops of liquid on demand that have diameters less than 1 mm and if
possible in the 100 micrometer range.
The prototype systems that were set up and tested were based on systems described in
Microdrop Generation by Lee (2003). Several fluids were used: water, isopropyl alcohol, soy
bean oil, corn syrup, and glycerin. The fluids were chosen for ease of use and variation in
surface tension, density, and viscosity. Glycerin is the closest to the alternative liquid fuel
samples available from the cement plant trials.
2.4.1.1 Prototype Microdroplet Generator
The most straightforward system to start with was simply a syringe pump connected to flat tip
needles of varying diameter. Figure 2-12 shows the apparatus and images of a liquid drop
produced. An automatic syringe pump was the driving force behind this fluid transport. Different
gauges of needles were used, the smallest of which being a 30-gauge (140 μm inner diameter)
needle. The droplets that were produced using this apparatus were pendant droplets that grew
upon the tip of the needle. The smallest drop size achievable for all of the fluids was just less than
2 mm, with the drop size roughly 6-10 times larger than the needle orifice diameter. Table 2-6
shows fluid properties and the drop size to needle diameter ratio for the 25-gauge needle.
Figure 2-12: Syringe pump drop generation apparatus and image of sample drop of glycerin
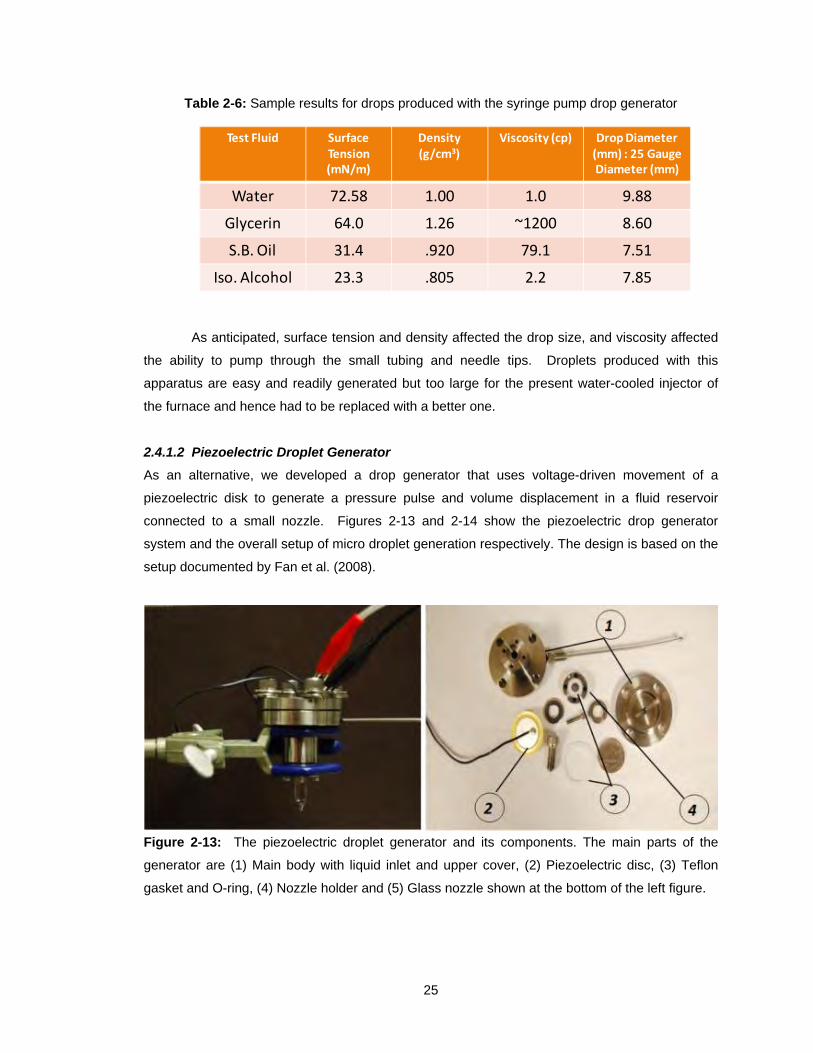
25
Table 2-6: Sample results for drops produced with the syringe pump drop generator
As anticipated, surface tension and density affected the drop size, and viscosity affected
the ability to pump through the small tubing and needle tips. Droplets produced with this
apparatus are easy and readily generated but too large for the present water-cooled injector of
the furnace and hence had to be replaced with a better one.
2.4.1.2 Piezoelectric Droplet Generator
As an alternative, we developed a drop generator that uses voltage-driven movement of a
piezoelectric disk to generate a pressure pulse and volume displacement in a fluid reservoir
connected to a small nozzle. Figures 2-13 and 2-14 show the piezoelectric drop generator
system and the overall setup of micro droplet generation respectively. The design is based on the
setup documented by Fan et al. (2008).
Figure 2-13: The piezoelectric droplet generator and its components. The main parts of the
generator are (1) Main body with liquid inlet and upper cover, (2) Piezoelectric disc, (3) Teflon
gasket and O-ring, (4) Nozzle holder and (5) Glass nozzle shown at the bottom of the left figure.
Test Fluid SurfaceTension (mN/m)
Density (g/cm3)
Viscosity (cp) Drop Diameter (mm) : 25 Gauge Diameter (mm)
Water 72.58 1.00 1.0 9.88
Glycerin 64.0 1.26 ~1200 8.60
S.B. Oil 31.4 .920 79.1 7.51
Iso. Alcohol 23.3 .805 2.2 7.85
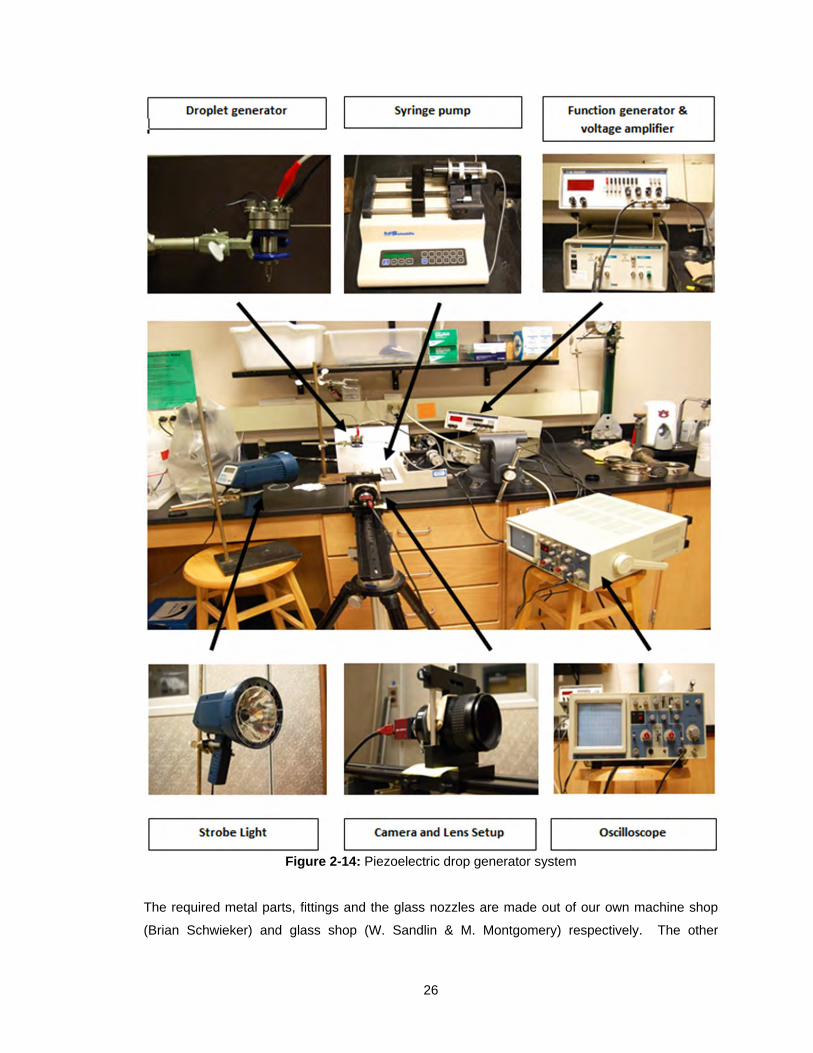
26
Figure 2-14: Piezoelectric drop generator system
The required metal parts, fittings and the glass nozzles are made out of our own machine shop
(Brian Schwieker) and glass shop (W. Sandlin & M. Montgomery) respectively. The other
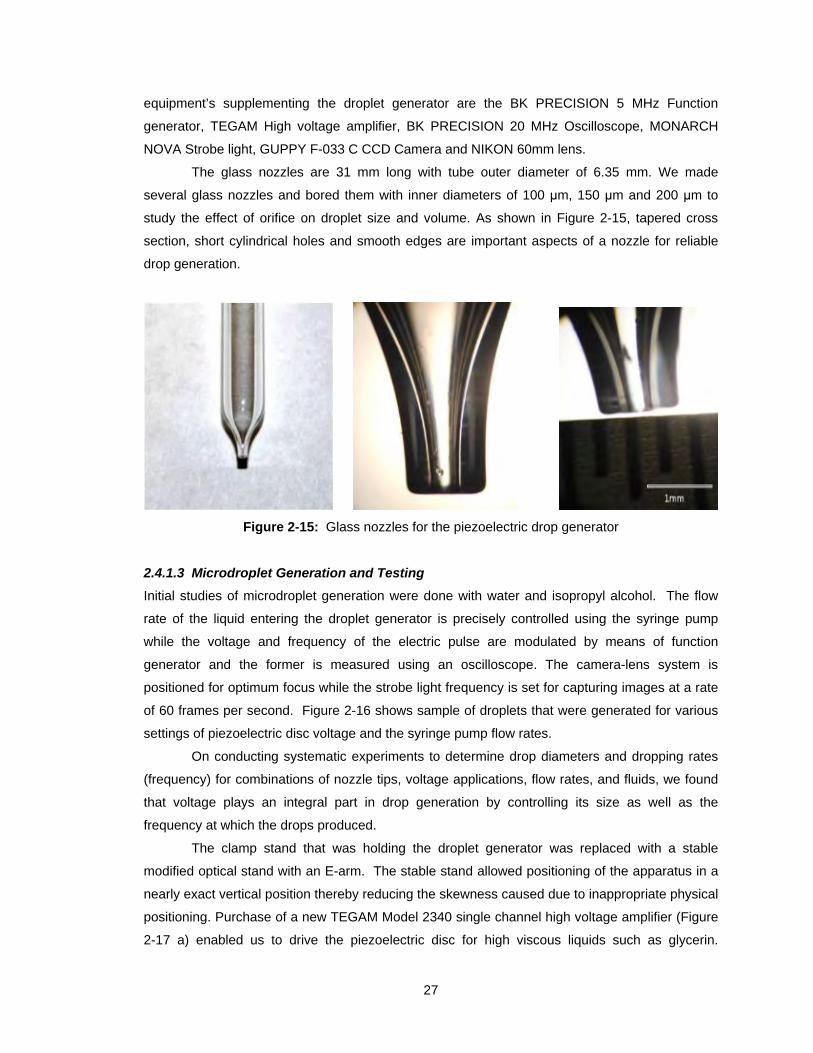
27
equipment’s supplementing the droplet generator are the BK PRECISION 5 MHz Function
generator, TEGAM High voltage amplifier, BK PRECISION 20 MHz Oscilloscope, MONARCH
NOVA Strobe light, GUPPY F-033 C CCD Camera and NIKON 60mm lens.
The glass nozzles are 31 mm long with tube outer diameter of 6.35 mm. We made
several glass nozzles and bored them with inner diameters of 100 μm, 150 μm and 200 μm to
study the effect of orifice on droplet size and volume. As shown in Figure 2-15, tapered cross
section, short cylindrical holes and smooth edges are important aspects of a nozzle for reliable
drop generation.
Figure 2-15: Glass nozzles for the piezoelectric drop generator
2.4.1.3 Microdroplet Generation and Testing
Initial studies of microdroplet generation were done with water and isopropyl alcohol. The flow
rate of the liquid entering the droplet generator is precisely controlled using the syringe pump
while the voltage and frequency of the electric pulse are modulated by means of function
generator and the former is measured using an oscilloscope. The camera-lens system is
positioned for optimum focus while the strobe light frequency is set for capturing images at a rate
of 60 frames per second. Figure 2-16 shows sample of droplets that were generated for various
settings of piezoelectric disc voltage and the syringe pump flow rates.
On conducting systematic experiments to determine drop diameters and dropping rates
(frequency) for combinations of nozzle tips, voltage applications, flow rates, and fluids, we found
that voltage plays an integral part in drop generation by controlling its size as well as the
frequency at which the drops produced.
The clamp stand that was holding the droplet generator was replaced with a stable
modified optical stand with an E-arm. The stable stand allowed positioning of the apparatus in a
nearly exact vertical position thereby reducing the skewness caused due to inappropriate physical
positioning. Purchase of a new TEGAM Model 2340 single channel high voltage amplifier (Figure
2-17 a) enabled us to drive the piezoelectric disc for high viscous liquids such as glycerin.
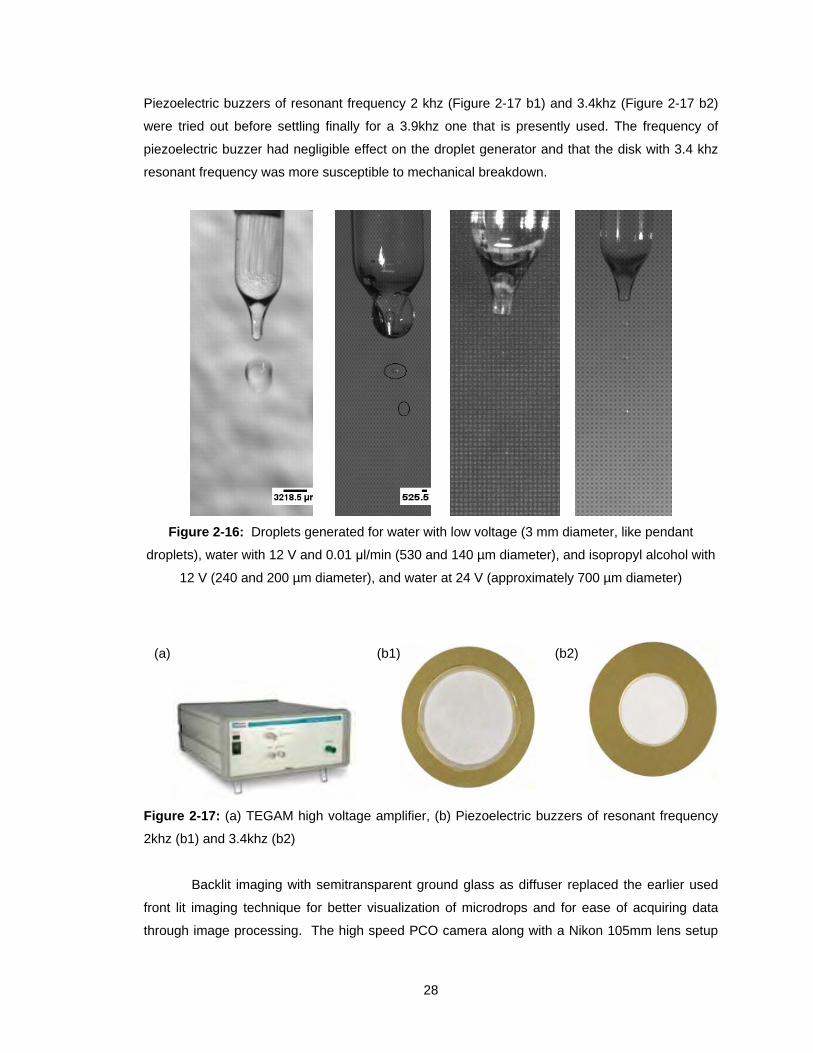
28
Piezoelectric buzzers of resonant frequency 2 khz (Figure 2-17 b1) and 3.4khz (Figure 2-17 b2)
were tried out before settling finally for a 3.9khz one that is presently used. The frequency of
piezoelectric buzzer had negligible effect on the droplet generator and that the disk with 3.4 khz
resonant frequency was more susceptible to mechanical breakdown.
Figure 2-16: Droplets generated for water with low voltage (3 mm diameter, like pendant
droplets), water with 12 V and 0.01 μl/min (530 and 140 µm diameter), and isopropyl alcohol with
12 V (240 and 200 µm diameter), and water at 24 V (approximately 700 µm diameter)
Figure 2-17: (a) TEGAM high voltage amplifier, (b) Piezoelectric buzzers of resonant frequency
2khz (b1) and 3.4khz (b2)
Backlit imaging with semitransparent ground glass as diffuser replaced the earlier used
front lit imaging technique for better visualization of microdrops and for ease of acquiring data
through image processing. The high speed PCO camera along with a Nikon 105mm lens setup
(a) (b1) (b2)
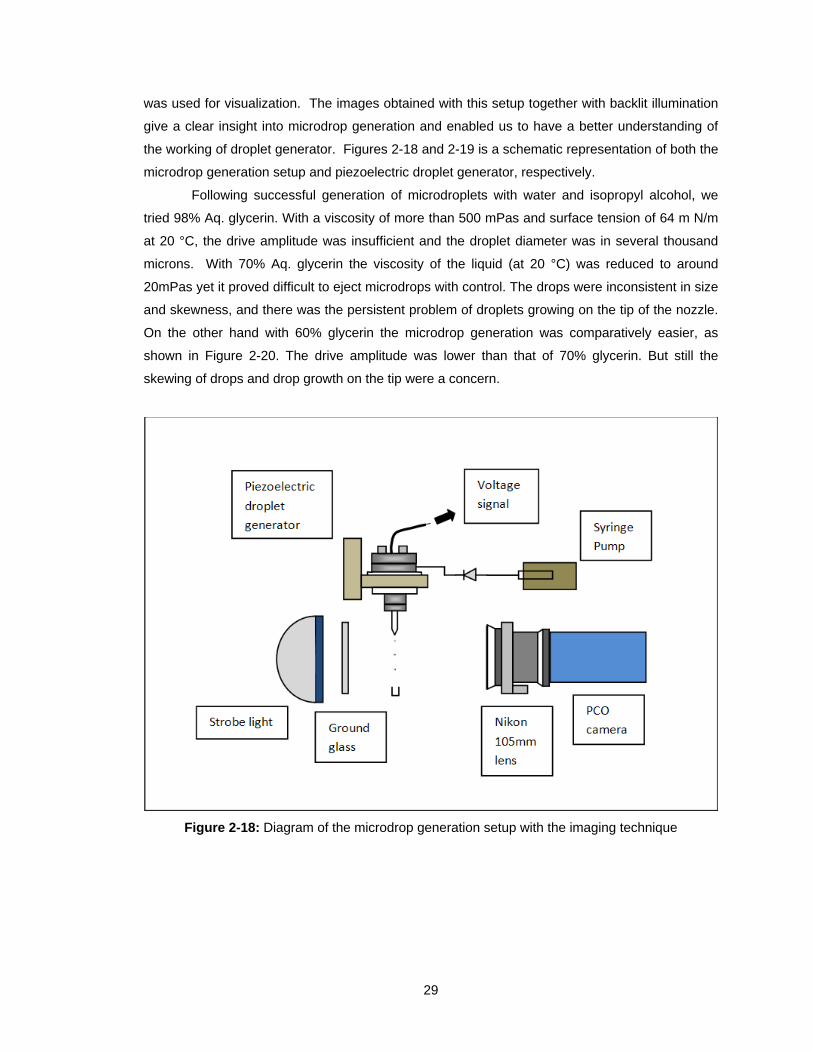
29
was used for visualization. The images obtained with this setup together with backlit illumination
give a clear insight into microdrop generation and enabled us to have a better understanding of
the working of droplet generator. Figures 2-18 and 2-19 is a schematic representation of both the
microdrop generation setup and piezoelectric droplet generator, respectively.
Following successful generation of microdroplets with water and isopropyl alcohol, we
tried 98% Aq. glycerin. With a viscosity of more than 500 mPas and surface tension of 64 m N/m
at 20 °C, the drive amplitude was insufficient and the droplet diameter was in several thousand
microns. With 70% Aq. glycerin the viscosity of the liquid (at 20 °C) was reduced to around
20mPas yet it proved difficult to eject microdrops with control. The drops were inconsistent in size
and skewness, and there was the persistent problem of droplets growing on the tip of the nozzle.
On the other hand with 60% glycerin the microdrop generation was comparatively easier, as
shown in Figure 2-20. The drive amplitude was lower than that of 70% glycerin. But still the
skewing of drops and drop growth on the tip were a concern.
Figure 2-18: Diagram of the microdrop generation setup with the imaging technique
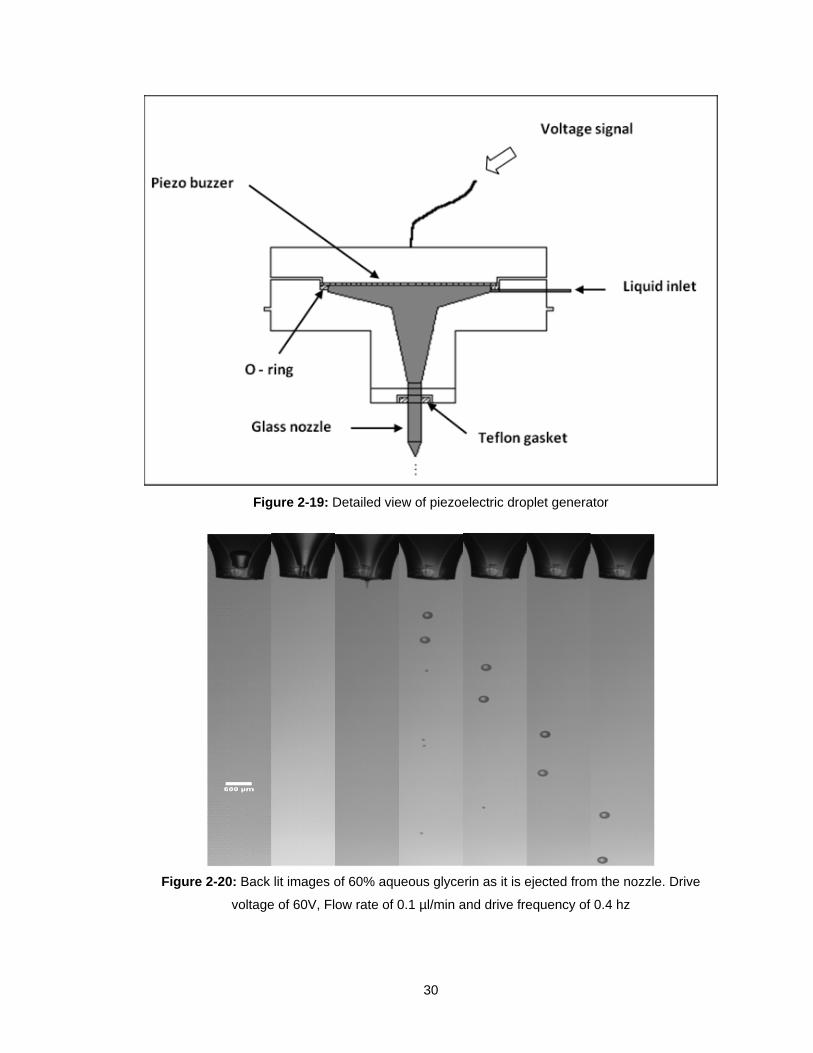
30
Figure 2-19: Detailed view of piezoelectric droplet generator
Figure 2-20: Back lit images of 60% aqueous glycerin as it is ejected from the nozzle. Drive
voltage of 60V, Flow rate of 0.1 µl/min and drive frequency of 0.4 hz
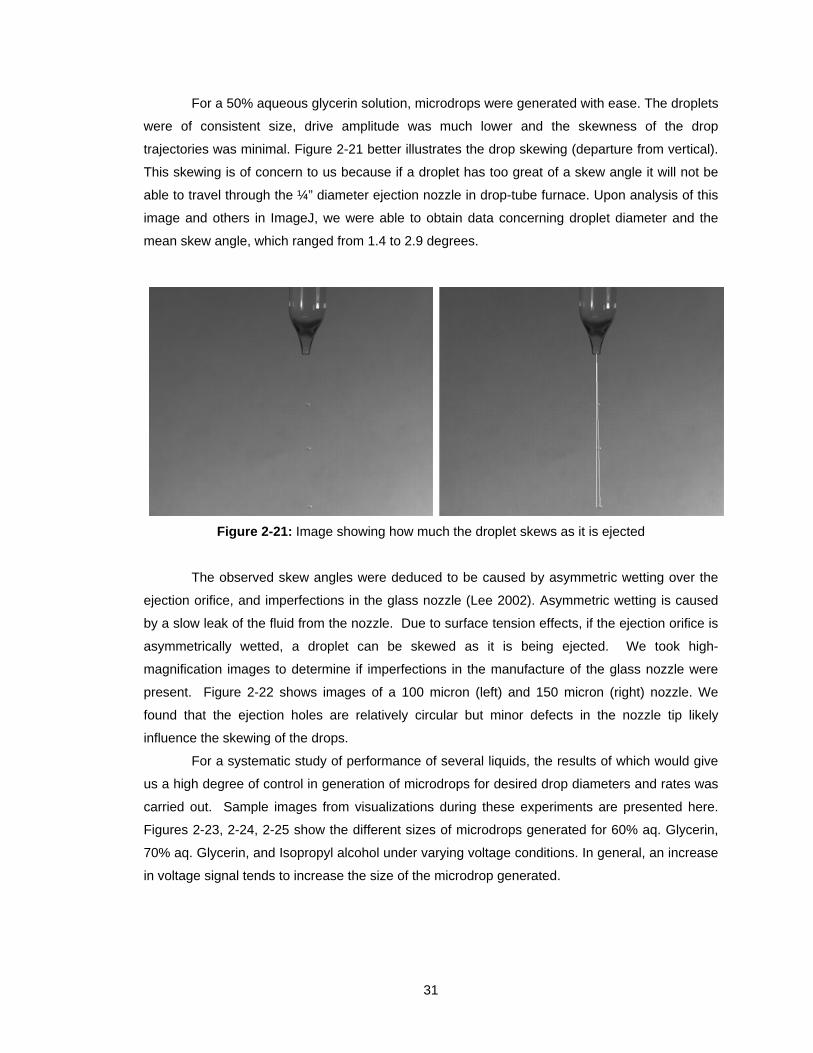
31
For a 50% aqueous glycerin solution, microdrops were generated with ease. The droplets
were of consistent size, drive amplitude was much lower and the skewness of the drop
trajectories was minimal. Figure 2-21 better illustrates the drop skewing (departure from vertical).
This skewing is of concern to us because if a droplet has too great of a skew angle it will not be
able to travel through the ¼” diameter ejection nozzle in drop-tube furnace. Upon analysis of this
image and others in ImageJ, we were able to obtain data concerning droplet diameter and the
mean skew angle, which ranged from 1.4 to 2.9 degrees.
Figure 2-21: Image showing how much the droplet skews as it is ejected
The observed skew angles were deduced to be caused by asymmetric wetting over the
ejection orifice, and imperfections in the glass nozzle (Lee 2002). Asymmetric wetting is caused
by a slow leak of the fluid from the nozzle. Due to surface tension effects, if the ejection orifice is
asymmetrically wetted, a droplet can be skewed as it is being ejected. We took high-
magnification images to determine if imperfections in the manufacture of the glass nozzle were
present. Figure 2-22 shows images of a 100 micron (left) and 150 micron (right) nozzle. We
found that the ejection holes are relatively circular but minor defects in the nozzle tip likely
influence the skewing of the drops.
For a systematic study of performance of several liquids, the results of which would give
us a high degree of control in generation of microdrops for desired drop diameters and rates was
carried out. Sample images from visualizations during these experiments are presented here.
Figures 2-23, 2-24, 2-25 show the different sizes of microdrops generated for 60% aq. Glycerin,
70% aq. Glycerin, and Isopropyl alcohol under varying voltage conditions. In general, an increase
in voltage signal tends to increase the size of the microdrop generated.

32
Figure 2-22: High magnification images taken with Questar lens showing nozzle imperfections
Figure 2-23: 60% aqueous glycerin microdroplet generation at different voltages
Liquid - 60% Aqueous Glycerin, Piezo Conditions (25V, 3.5 Hz, 10 μL/min), Camera
(fps - 143), Droplet size – 260
µm.
Liquid - 60% Aqueous
Glycerin, Piezo Conditions
(37.5V, 3.5 Hz, 10 μL/min), Camera
(fps - 143), Droplet size – 340
µm.
Liquid - 60% Aqueous
Glycerin, Piezo Conditions (50V, 3.5 Hz, 5 μL/min),
Camera (fps - 143), Droplet size
– 400 µm.
Liquid - 60% Aqueous
Glycerin, Piezo Conditions
(62.5V, 3.5 Hz, 5 μL/min), Camera
(fps - 143), Droplet size – 345
µm.
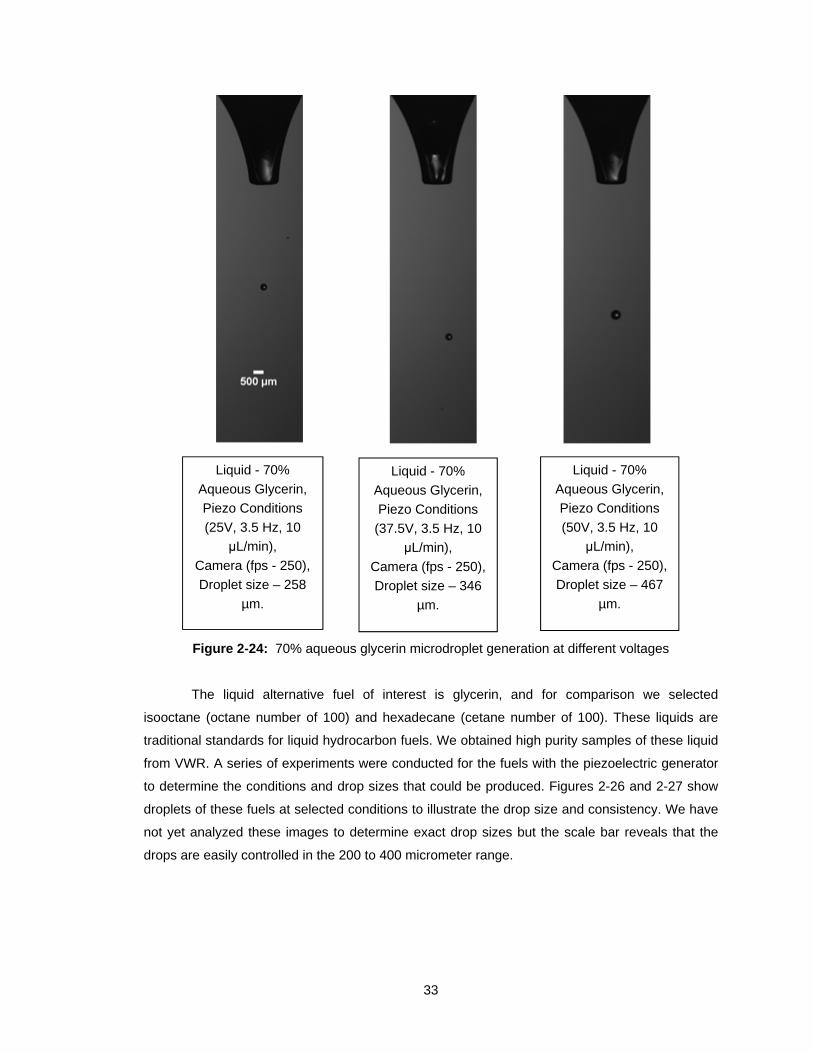
33
Figure 2-24: 70% aqueous glycerin microdroplet generation at different voltages
The liquid alternative fuel of interest is glycerin, and for comparison we selected
isooctane (octane number of 100) and hexadecane (cetane number of 100). These liquids are
traditional standards for liquid hydrocarbon fuels. We obtained high purity samples of these liquid
from VWR. A series of experiments were conducted for the fuels with the piezoelectric generator
to determine the conditions and drop sizes that could be produced. Figures 2-26 and 2-27 show
droplets of these fuels at selected conditions to illustrate the drop size and consistency. We have
not yet analyzed these images to determine exact drop sizes but the scale bar reveals that the
drops are easily controlled in the 200 to 400 micrometer range.
Liquid - 70%
Aqueous Glycerin,
Piezo Conditions
(25V, 3.5 Hz, 10
μL/min),
Camera (fps - 250),
Droplet size – 258
µm.
Liquid - 70%
Aqueous Glycerin,
Piezo Conditions
(37.5V, 3.5 Hz, 10
μL/min),
Camera (fps - 250),
Droplet size – 346
µm.
Liquid - 70%
Aqueous Glycerin,
Piezo Conditions
(50V, 3.5 Hz, 10
μL/min),
Camera (fps - 250),
Droplet size – 467
µm.
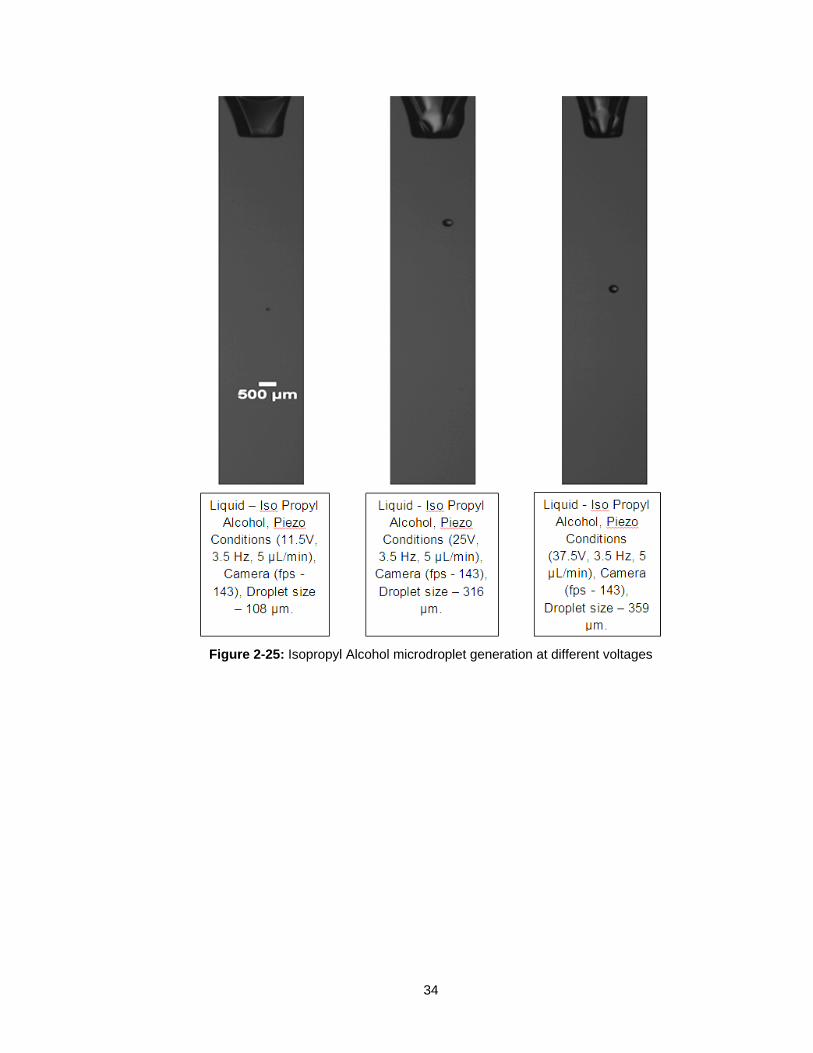
34
Figure 2-25: Isopropyl Alcohol microdroplet generation at different voltages
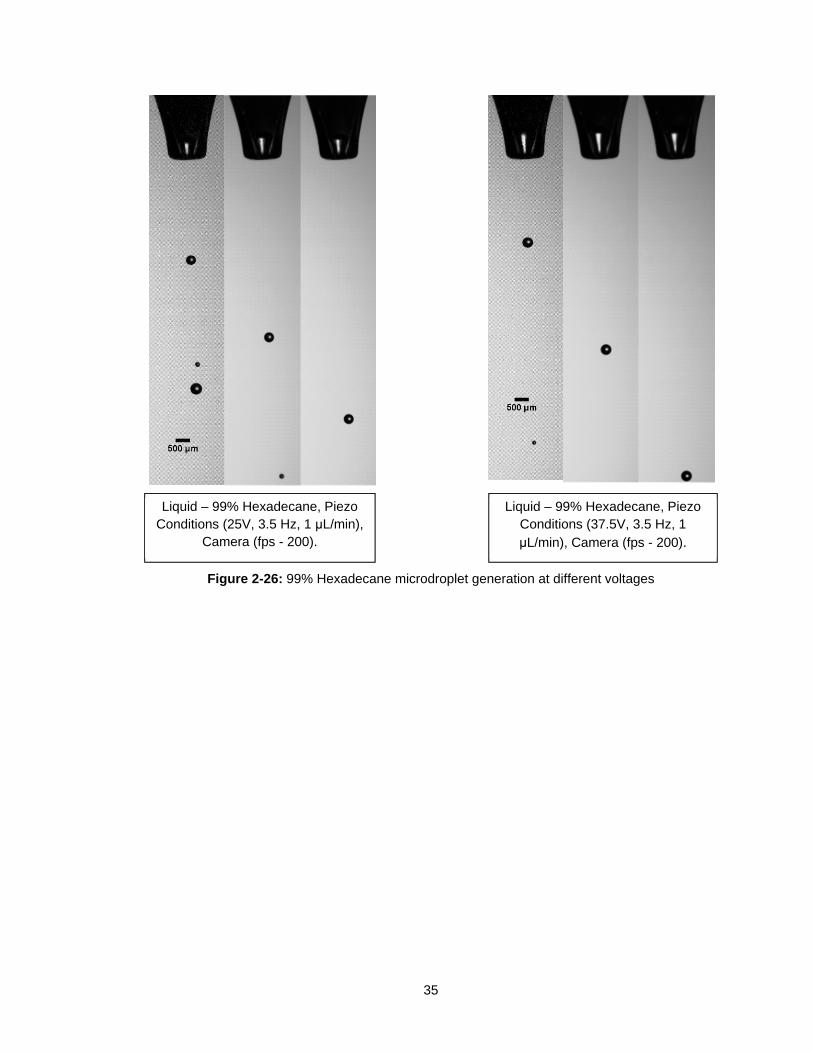
35
Figure 2-26: 99% Hexadecane microdroplet generation at different voltages
Liquid – 99% Hexadecane, Piezo Conditions (25V, 3.5 Hz, 1 μL/min),
Camera (fps - 200).
Liquid – 99% Hexadecane, Piezo Conditions (37.5V, 3.5 Hz, 1 μL/min), Camera (fps - 200).
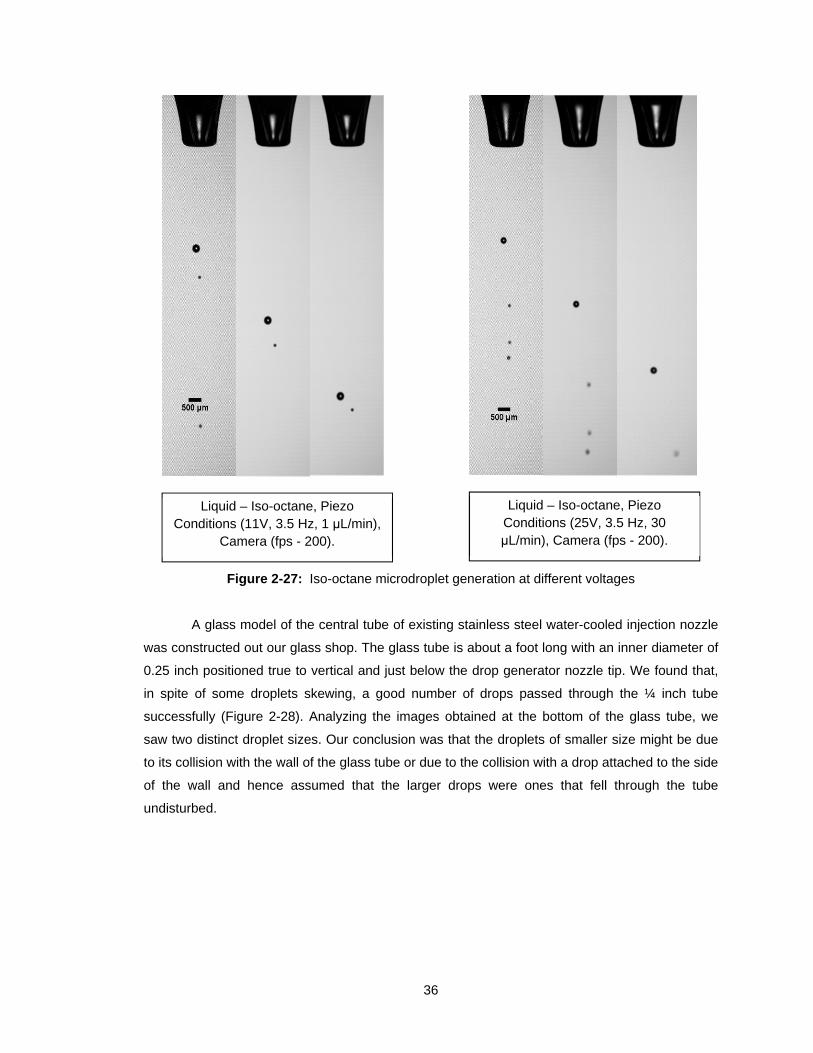
36
Figure 2-27: Iso-octane microdroplet generation at different voltages
A glass model of the central tube of existing stainless steel water-cooled injection nozzle
was constructed out our glass shop. The glass tube is about a foot long with an inner diameter of
0.25 inch positioned true to vertical and just below the drop generator nozzle tip. We found that,
in spite of some droplets skewing, a good number of drops passed through the ¼ inch tube
successfully (Figure 2-28). Analyzing the images obtained at the bottom of the glass tube, we
saw two distinct droplet sizes. Our conclusion was that the droplets of smaller size might be due
to its collision with the wall of the glass tube or due to the collision with a drop attached to the side
of the wall and hence assumed that the larger drops were ones that fell through the tube
undisturbed.
Liquid – Iso-octane, Piezo Conditions (11V, 3.5 Hz, 1 μL/min),
Camera (fps - 200).
Liquid – Iso-octane, Piezo Conditions (25V, 3.5 Hz, 30 μL/min), Camera (fps - 200).
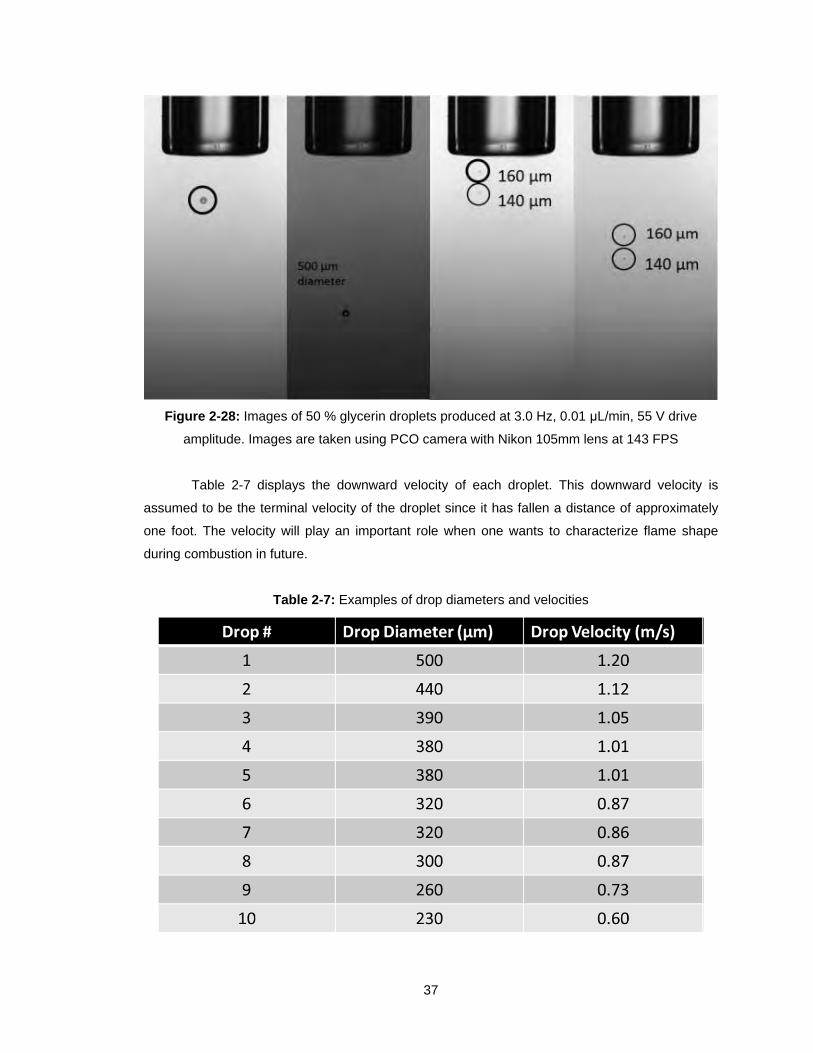
37
Figure 2-28: Images of 50 % glycerin droplets produced at 3.0 Hz, 0.01 μL/min, 55 V drive
amplitude. Images are taken using PCO camera with Nikon 105mm lens at 143 FPS
Table 2-7 displays the downward velocity of each droplet. This downward velocity is
assumed to be the terminal velocity of the droplet since it has fallen a distance of approximately
one foot. The velocity will play an important role when one wants to characterize flame shape
during combustion in future.
Table 2-7: Examples of drop diameters and velocities
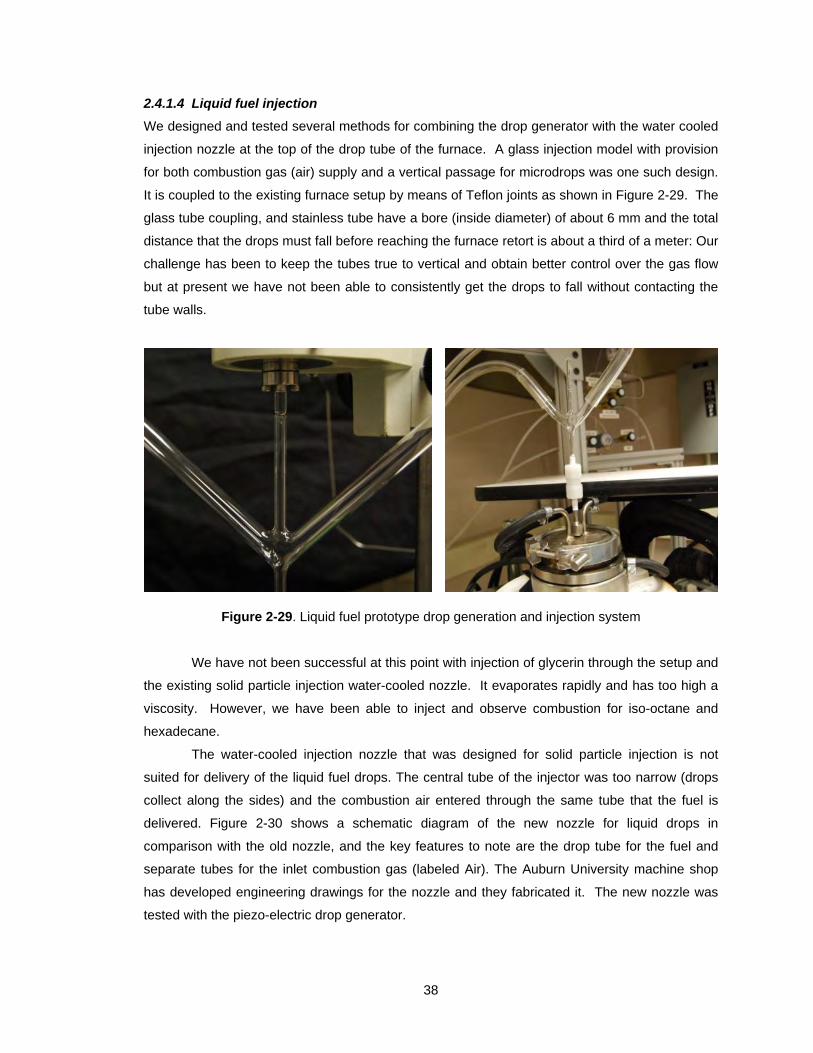
38
2.4.1.4 Liquid fuel injection
We designed and tested several methods for combining the drop generator with the water cooled
injection nozzle at the top of the drop tube of the furnace. A glass injection model with provision
for both combustion gas (air) supply and a vertical passage for microdrops was one such design.
It is coupled to the existing furnace setup by means of Teflon joints as shown in Figure 2-29. The
glass tube coupling, and stainless tube have a bore (inside diameter) of about 6 mm and the total
distance that the drops must fall before reaching the furnace retort is about a third of a meter: Our
challenge has been to keep the tubes true to vertical and obtain better control over the gas flow
but at present we have not been able to consistently get the drops to fall without contacting the
tube walls.
Figure 2-29. Liquid fuel prototype drop generation and injection system
We have not been successful at this point with injection of glycerin through the setup and
the existing solid particle injection water-cooled nozzle. It evaporates rapidly and has too high a
viscosity. However, we have been able to inject and observe combustion for iso-octane and
hexadecane.
The water-cooled injection nozzle that was designed for solid particle injection is not
suited for delivery of the liquid fuel drops. The central tube of the injector was too narrow (drops
collect along the sides) and the combustion air entered through the same tube that the fuel is
delivered. Figure 2-30 shows a schematic diagram of the new nozzle for liquid drops in
comparison with the old nozzle, and the key features to note are the drop tube for the fuel and
separate tubes for the inlet combustion gas (labeled Air). The Auburn University machine shop
has developed engineering drawings for the nozzle and they fabricated it. The new nozzle was
tested with the piezo-electric drop generator.
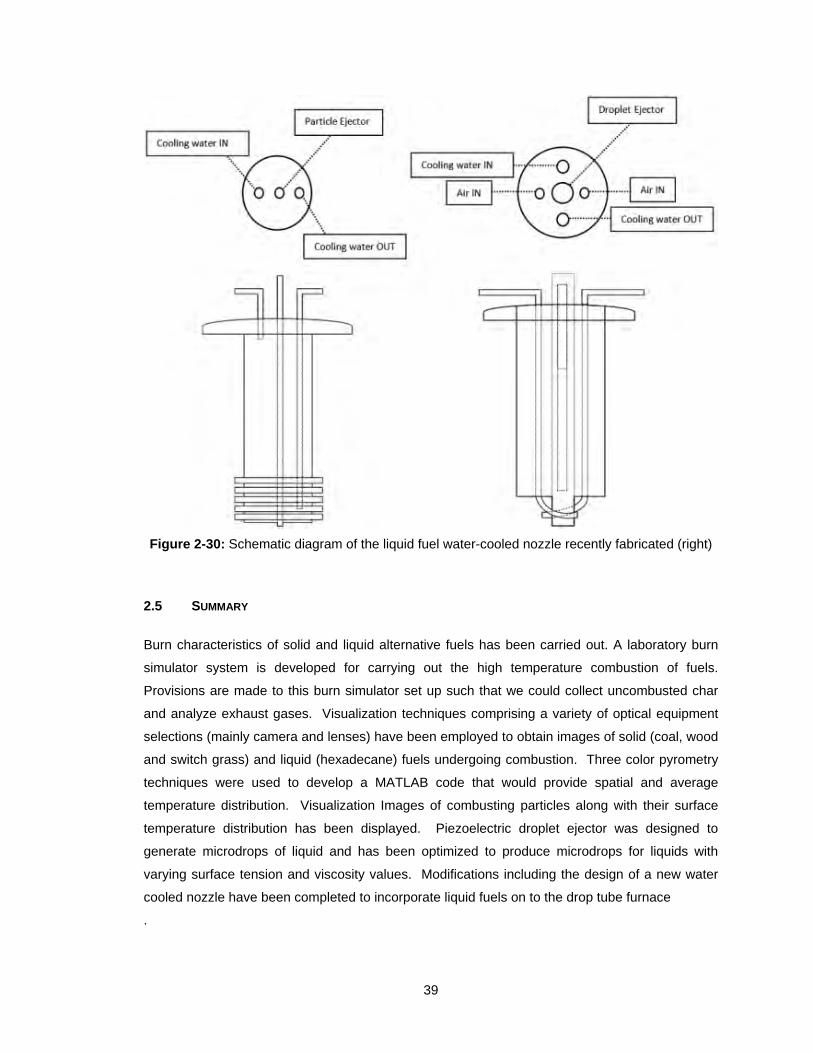
39
Figure 2-30: Schematic diagram of the liquid fuel water-cooled nozzle recently fabricated (right)
2.5 SUMMARY
Burn characteristics of solid and liquid alternative fuels has been carried out. A laboratory burn
simulator system is developed for carrying out the high temperature combustion of fuels.
Provisions are made to this burn simulator set up such that we could collect uncombusted char
and analyze exhaust gases. Visualization techniques comprising a variety of optical equipment
selections (mainly camera and lenses) have been employed to obtain images of solid (coal, wood
and switch grass) and liquid (hexadecane) fuels undergoing combustion. Three color pyrometry
techniques were used to develop a MATLAB code that would provide spatial and average
temperature distribution. Visualization Images of combusting particles along with their surface
temperature distribution has been displayed. Piezoelectric droplet ejector was designed to
generate microdrops of liquid and has been optimized to produce microdrops for liquids with
varying surface tension and viscosity values. Modifications including the design of a new water
cooled nozzle have been completed to incorporate liquid fuels on to the drop tube furnace
.
40
2.6 CONCLUSION
A drop tube furnace and visualization method were developed that show potential for evaluating
time- and space-resolved temperature distributions for fuel solid particles and liquid droplets
undergoing combustion in various combustion atmospheres.
2.7 RECOMMENDATIONS FOR FUTURE RESEARCH
The future research recommended includes continued development of the burn simulator to
include effluent gas analysis. Further improvement of visualization quality and inclusion of shape
correction for the image processing and analysis are needed.
2.8 RECOMMENDATIONS FOR IMPLEMENTATION
For implementation, a model needs to be developed to apply the temperature distributions to
estimations of combustion rates for various fuel types in conditions that mimic those of the
cement plant.
41
PART 2
Full-Scale Trial Burns with
Alternative Fuels at Cement Plant
42
CHAPTER 3
PART 2—INTRODUCTION
3.1 INTRODUCTION
This task primarily involves the subcontractor and will be conducted at a full-scale cement plant.
Alternative fuels were selected based on local availability, cost, emissions, and system
compatibility. Alternative fuels included in this study are construction and demolition waste,
woodchips, and soybeans. Each of these fuels was utilized in order to partially replace and
therefore lessen the demand for traditional fuels. Each trial fuel was co-fired with traditional fuels.
Lafarge North America’s Roberta cement plant, a full-scale cement plant located in Calera,
Alabama, produced the cement during each trial. Each trial or burn, as it will be referred from this
point forward, was continuous for between 3 and 6 days. A thorough sampling plan was
implemented during each of the burns to carry out the objectives listed above. Although each
burn utilized a unique fuel, the plant made an effort to maintain consistent conditions in all other
aspects of operation.
The first burn conducted, which will be known as the baseline burn, utilized coal and
plastics. All the alternative fuel burns are compared to this baseline burn. Although plastics are
generally considered alternative fuels, in this study the plastic blend is considered a traditional
fuel because it is routinely used by this cement plant. The baseline burn was performed in June
of 2010 and lasted 3 days.
The first alternative fuel burn utilized coal, plastics, and construction and demolition
waste. The construction and demolition waste consisted of wood paper and plastics. The types
of wood utilized include dimensional lumber, plywood, and pallets. The paper included
corrugated boxes and miscellaneous paper materials. The plastic consisted of solid and cellular
foam and polyethylene film. This burn lasted for 80 hours and also occurred in June of 2010.
The first two burns were closely spaced in order to maintain similar plant conditions.
The second alternative fuel burn utilized coal, plastics, and woodchips. This burn was
conducted over a 6-day period in July of 2010. This burn was unique to this phase of the project
due to the progressively increasing substitution rate of woodchips. This trial burn was broken into
three phases. The initial substitution rate of woodchips was 5 percent and every two days
thereafter the substitution rate increased by 5 percent. Therefore the average substitution rates
for the burn were 5, 10, and 15 percent.
43
The third and final burn utilized coal, plastics, and soybeans. The soybeans were treated
with herbicide. This burn was conducted over a 3-day period in October of 2010.
During each of the burns, samples were collected according to the sampling plan. These
samples were transported to Auburn University for further conditioning and testing. The cement
plant tested all materials to determine chemical composition except for the fuels used. The
cement plant also tested various properties of the final cement to ensure adequate properties
were being obtained during production. The final responsibility of the cement plant was to
monitor emissions produced during each burn.
Specimens were prepared at Auburn University from each of the samples transported
from the cement plant. The specimens were then shipped to the external chemical laboratory for
further testing. The external laboratory determined the chemical compositions of each specimen
and they conducted proximate, ultimate, and combustion analyses on each fuel.
Auburn University was responsible for the transportation, preparation, and shipment of all
specimens. Auburn University also conducted testing on mortar, paste, and concrete to
determine the behavior of the cement. Results from each party were collected and analyzed by
Auburn University in order to determine the effect of using alternative fuels on portland cement.
3.2 OBJECTIVES OF PART 2
The three fuels investigated during this study were construction and demolition waste, woodchips,
and soybeans. The woodchips trial implemented a progressively increasing substitution rate.
Each fuel was evaluated separately to assess its viability as a fuel for the production of portland
cement. The following assessments were used in order to measure the viability of an alternative
fuel:
1. the ability of the cement plant to maintain productive operations,
2. the chemical composition of clinker and portland cement,
3. the physical properties of the portland cement,
4. the properties of concrete made from the portland cement, and
5. the emissions released by the cement plant.
Collaborative efforts between three parties were required to fulfill these objectives. The parties
involved included a full-scale cement production facility, and external chemical laboratory, and
Auburn University.
The first objective was responsibility of the cement plant personnel. Fuels that produce
problems in the manufacturing process cannot be considered as viable replacement options.
The performance of the cement is directly related to its chemical composition and
therefore, the chemical components of the cement and clinker needed were determined. Using
44
two laboratories satisfied the second objective as well as provided confidence in accuracy of the
data received.
The third and fourth objectives of this study were the primary objectives in this study.
The cement plant conducted tests on mortar specimens made from the produced cement.
Auburn University conducted testing on mortar, paste, and concrete specimens. The results of
these tests were compared to results of similar specimens prepared by each entity from cement
produced by only traditional fuels.
The final objective was to monitor emissions released by the cement plant during each
trial. The emissions data collection was performed by the cement plant using a continuous
emission monitoring system (CEMS). Results from each trial were compared to emissions data
collected during a burn that utilized traditional fuels.
3.3 PORTLAND CEMENT PRODUCTION
Portland cement is manufactured by combining raw materials containing calcium, silica, alumina,
and iron. After the raw materials are crushed to a specific fineness and blended together, the
mixture, or kiln feed, is transported to the kiln where it is heated to temperatures in excess of
1600 °C. This fuses the homogeneous mixture together into a uniform product known as clinker.
The clinker is immediately cooled as it exits the kiln and is stored in silos until it is ready to be
ground with a predetermined quantity of sulfates. The final product is known as portand cement.
Since the quantity of raw materials used is dependent on the material’s chemical composition, a
facility’s geographical location and local industrial conditions determines its use of the raw
materials.
Cement is manufactured through a wet or dry process. Dry process manufacturing is the
most modern approach and is more fuel efficient and widely used than the wet process. The
cement produced from either process is packaged, stored, and sold to consumers.
Figure 3-1 shows a schematic of a typical dry process cement manufacturing facility.
Predetermined quantities of raw materials are first fed into grinders that simultaneously crush the
raw materials to a certain fineness and create a homogeneous mixture. Next, the raw material is
sent through a series of preheaters where the mixture is partially calcined. The calcination
process is discussed in more detail in later sections. The mixture in then fed from the preheating
tower into the kiln where high temperatures causes the materials to chemically fuse together.
Rapid cooling of the fused material forms clinker. The clinker is ground with an addition of
gypsum to a specified fineness to form portland cement. Dust, commonly known as cement kiln
dust (CKD), is collected through the entire process and is recycled back into the raw feed.
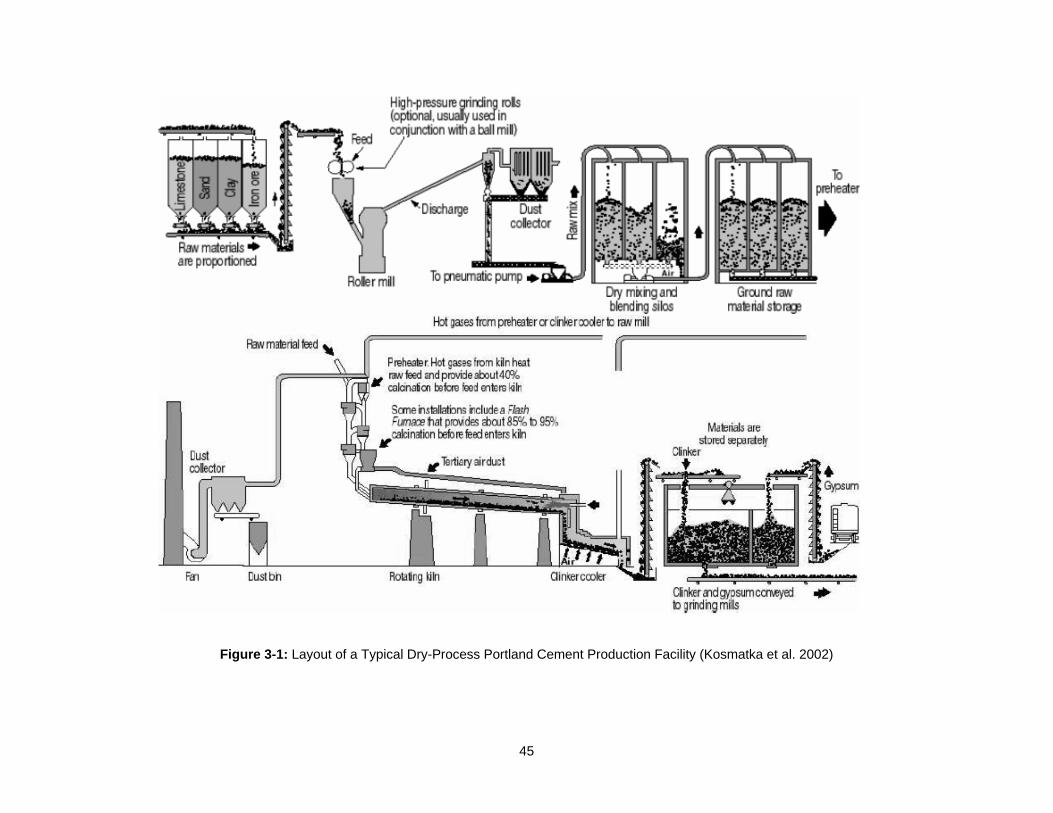
45
Figure 3-1: Layout of a Typical Dry-Process Portland Cement Production Facility (Kosmatka et al. 2002)
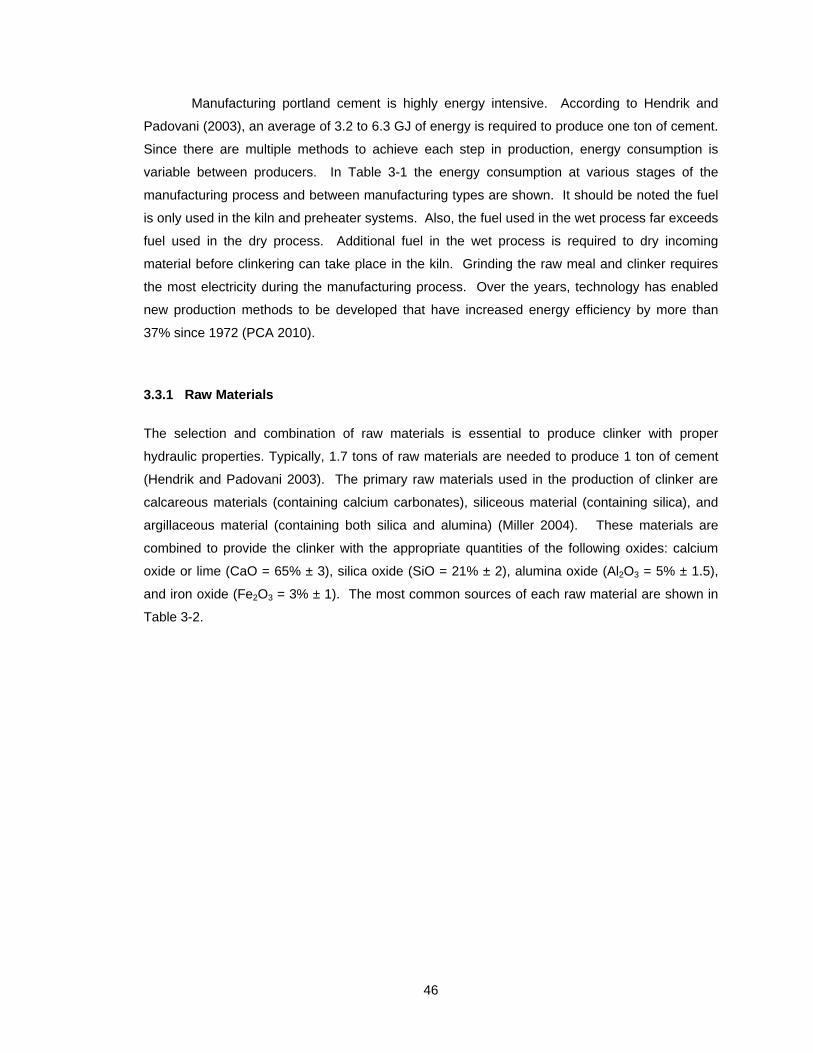
46
Manufacturing portland cement is highly energy intensive. According to Hendrik and
Padovani (2003), an average of 3.2 to 6.3 GJ of energy is required to produce one ton of cement.
Since there are multiple methods to achieve each step in production, energy consumption is
variable between producers. In Table 3-1 the energy consumption at various stages of the
manufacturing process and between manufacturing types are shown. It should be noted the fuel
is only used in the kiln and preheater systems. Also, the fuel used in the wet process far exceeds
fuel used in the dry process. Additional fuel in the wet process is required to dry incoming
material before clinkering can take place in the kiln. Grinding the raw meal and clinker requires
the most electricity during the manufacturing process. Over the years, technology has enabled
new production methods to be developed that have increased energy efficiency by more than
37% since 1972 (PCA 2010).
3.3.1 Raw Materials
The selection and combination of raw materials is essential to produce clinker with proper
hydraulic properties. Typically, 1.7 tons of raw materials are needed to produce 1 ton of cement
(Hendrik and Padovani 2003). The primary raw materials used in the production of clinker are
calcareous materials (containing calcium carbonates), siliceous material (containing silica), and
argillaceous material (containing both silica and alumina) (Miller 2004). These materials are
combined to provide the clinker with the appropriate quantities of the following oxides: calcium
oxide or lime (CaO = 65% ± 3), silica oxide (SiO = 21% ± 2), alumina oxide (Al2O3 = 5% ± 1.5),
and iron oxide (Fe2O3 = 3% ± 1). The most common sources of each raw material are shown in
Table 3-2.
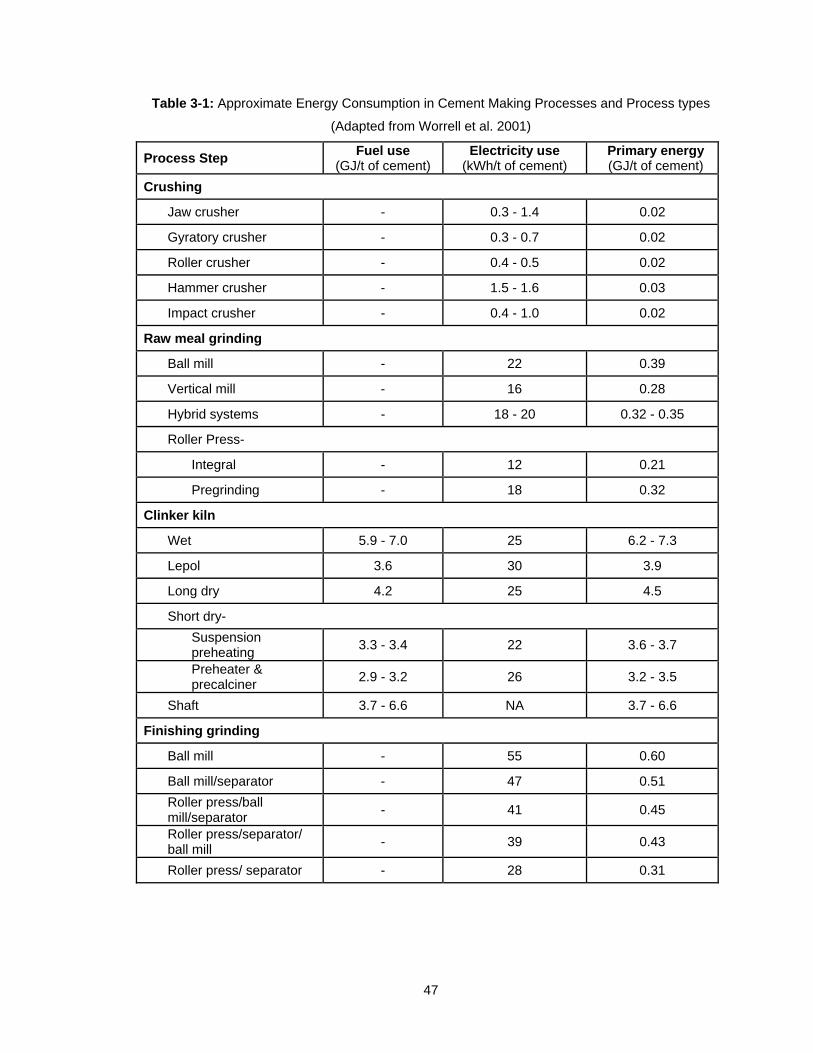
47
Table 3-1: Approximate Energy Consumption in Cement Making Processes and Process types
(Adapted from Worrell et al. 2001)
Process Step Fuel use
(GJ/t of cement) Electricity use
(kWh/t of cement) Primary energy (GJ/t of cement)
Crushing
Jaw crusher - 0.3 - 1.4 0.02
Gyratory crusher - 0.3 - 0.7 0.02
Roller crusher - 0.4 - 0.5 0.02
Hammer crusher - 1.5 - 1.6 0.03
Impact crusher - 0.4 - 1.0 0.02
Raw meal grinding
Ball mill - 22 0.39
Vertical mill - 16 0.28
Hybrid systems - 18 - 20 0.32 - 0.35
Roller Press-
Integral - 12 0.21
Pregrinding - 18 0.32
Clinker kiln
Wet 5.9 - 7.0 25 6.2 - 7.3
Lepol 3.6 30 3.9
Long dry 4.2 25 4.5
Short dry-
Suspension preheating
3.3 - 3.4 22 3.6 - 3.7
Preheater & precalciner
2.9 - 3.2 26 3.2 - 3.5
Shaft 3.7 - 6.6 NA 3.7 - 6.6
Finishing grinding
Ball mill - 55 0.60
Ball mill/separator - 47 0.51
Roller press/ball mill/separator
- 41 0.45
Roller press/separator/ ball mill
- 39 0.43
Roller press/ separator - 28 0.31
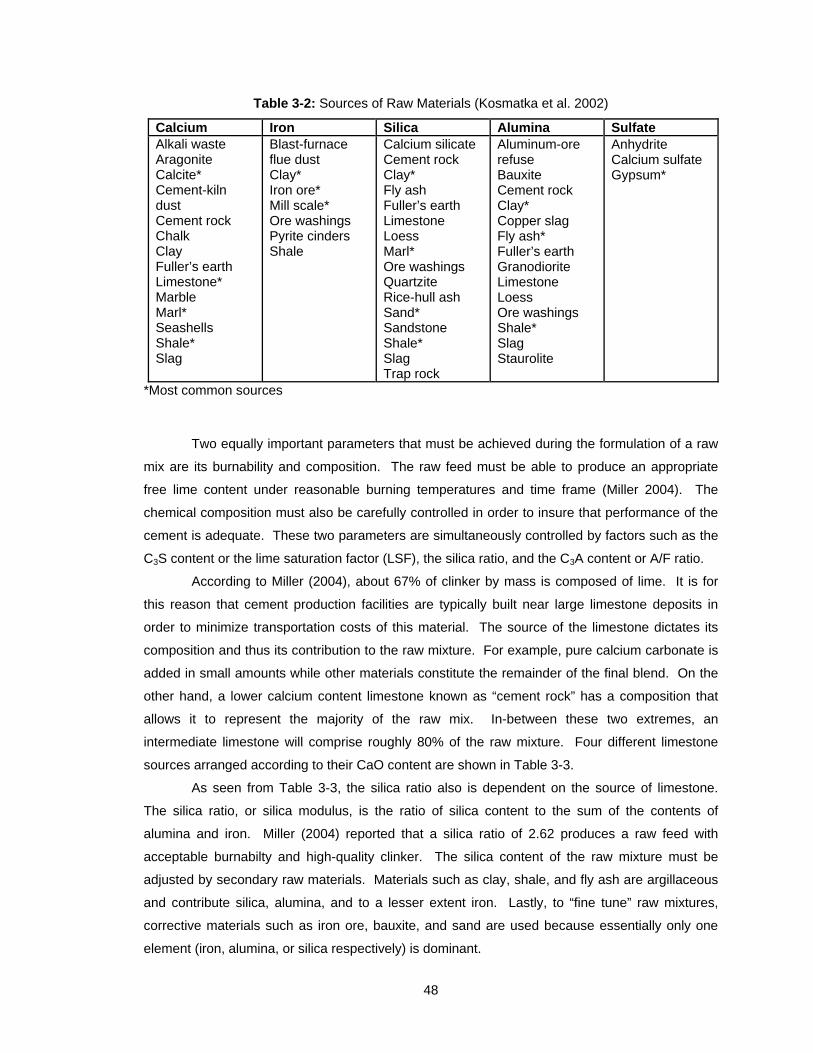
48
Table 3-2: Sources of Raw Materials (Kosmatka et al. 2002)
Calcium Iron Silica Alumina Sulfate Alkali waste Aragonite Calcite* Cement-kiln dust Cement rock Chalk Clay Fuller’s earth Limestone* Marble Marl* Seashells Shale* Slag
Blast-furnace flue dust Clay* Iron ore* Mill scale* Ore washings Pyrite cinders Shale
Calcium silicate Cement rock Clay* Fly ash Fuller’s earth Limestone Loess Marl* Ore washings Quartzite Rice-hull ash Sand* Sandstone Shale* Slag Trap rock
Aluminum-ore refuse Bauxite Cement rock Clay* Copper slag Fly ash* Fuller’s earth Granodiorite Limestone Loess Ore washings Shale* Slag Staurolite
Anhydrite Calcium sulfate Gypsum*
*Most common sources
Two equally important parameters that must be achieved during the formulation of a raw
mix are its burnability and composition. The raw feed must be able to produce an appropriate
free lime content under reasonable burning temperatures and time frame (Miller 2004). The
chemical composition must also be carefully controlled in order to insure that performance of the
cement is adequate. These two parameters are simultaneously controlled by factors such as the
C3S content or the lime saturation factor (LSF), the silica ratio, and the C3A content or A/F ratio.
According to Miller (2004), about 67% of clinker by mass is composed of lime. It is for
this reason that cement production facilities are typically built near large limestone deposits in
order to minimize transportation costs of this material. The source of the limestone dictates its
composition and thus its contribution to the raw mixture. For example, pure calcium carbonate is
added in small amounts while other materials constitute the remainder of the final blend. On the
other hand, a lower calcium content limestone known as “cement rock” has a composition that
allows it to represent the majority of the raw mix. In-between these two extremes, an
intermediate limestone will comprise roughly 80% of the raw mixture. Four different limestone
sources arranged according to their CaO content are shown in Table 3-3.
As seen from Table 3-3, the silica ratio also is dependent on the source of limestone.
The silica ratio, or silica modulus, is the ratio of silica content to the sum of the contents of
alumina and iron. Miller (2004) reported that a silica ratio of 2.62 produces a raw feed with
acceptable burnabilty and high-quality clinker. The silica content of the raw mixture must be
adjusted by secondary raw materials. Materials such as clay, shale, and fly ash are argillaceous
and contribute silica, alumina, and to a lesser extent iron. Lastly, to “fine tune” raw mixtures,
corrective materials such as iron ore, bauxite, and sand are used because essentially only one
element (iron, alumina, or silica respectively) is dominant.
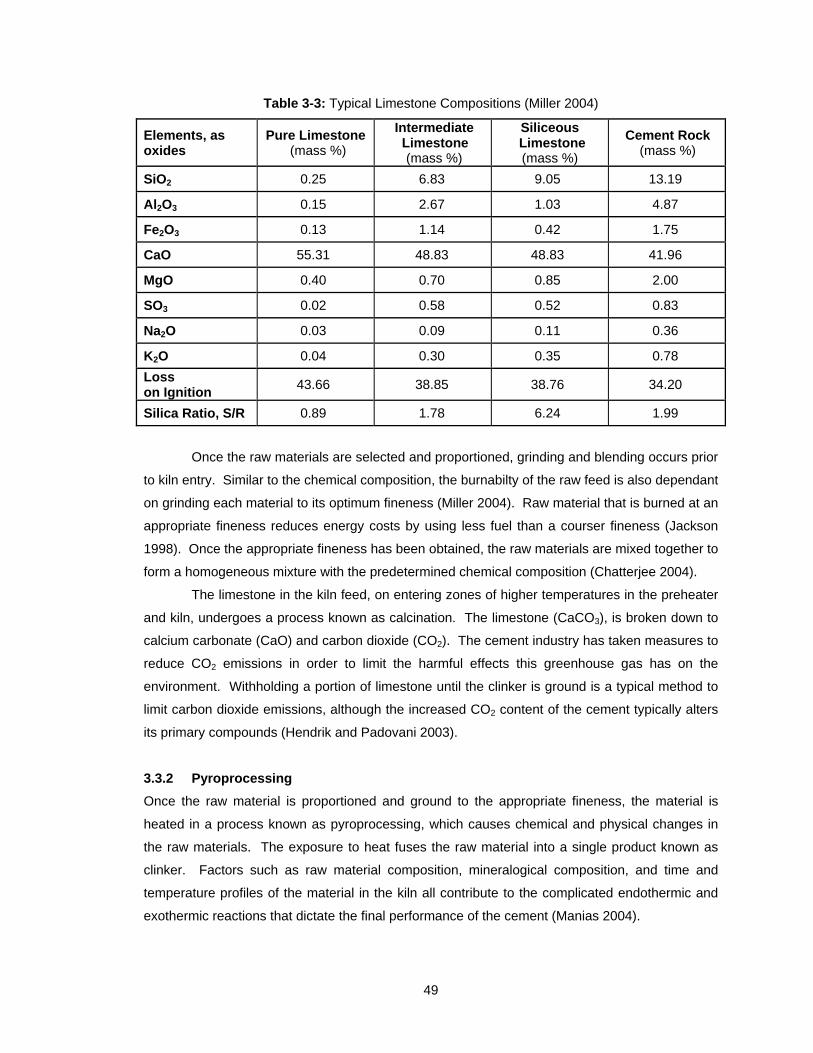
49
Table 3-3: Typical Limestone Compositions (Miller 2004)
Elements, as oxides
Pure Limestone (mass %)
Intermediate Limestone (mass %)
Siliceous Limestone (mass %)
Cement Rock (mass %)
SiO2 0.25 6.83 9.05 13.19
Al2O3 0.15 2.67 1.03 4.87
Fe2O3 0.13 1.14 0.42 1.75
CaO 55.31 48.83 48.83 41.96
MgO 0.40 0.70 0.85 2.00
SO3 0.02 0.58 0.52 0.83
Na2O 0.03 0.09 0.11 0.36
K2O 0.04 0.30 0.35 0.78
Loss on Ignition
43.66 38.85 38.76 34.20
Silica Ratio, S/R 0.89 1.78 6.24 1.99
Once the raw materials are selected and proportioned, grinding and blending occurs prior
to kiln entry. Similar to the chemical composition, the burnabilty of the raw feed is also dependant
on grinding each material to its optimum fineness (Miller 2004). Raw material that is burned at an
appropriate fineness reduces energy costs by using less fuel than a courser fineness (Jackson
1998). Once the appropriate fineness has been obtained, the raw materials are mixed together to
form a homogeneous mixture with the predetermined chemical composition (Chatterjee 2004).
The limestone in the kiln feed, on entering zones of higher temperatures in the preheater
and kiln, undergoes a process known as calcination. The limestone (CaCO3), is broken down to
calcium carbonate (CaO) and carbon dioxide (CO2). The cement industry has taken measures to
reduce CO2 emissions in order to limit the harmful effects this greenhouse gas has on the
environment. Withholding a portion of limestone until the clinker is ground is a typical method to
limit carbon dioxide emissions, although the increased CO2 content of the cement typically alters
its primary compounds (Hendrik and Padovani 2003).
3.3.2 Pyroprocessing
Once the raw material is proportioned and ground to the appropriate fineness, the material is
heated in a process known as pyroprocessing, which causes chemical and physical changes in
the raw materials. The exposure to heat fuses the raw material into a single product known as
clinker. Factors such as raw material composition, mineralogical composition, and time and
temperature profiles of the material in the kiln all contribute to the complicated endothermic and
exothermic reactions that dictate the final performance of the cement (Manias 2004).
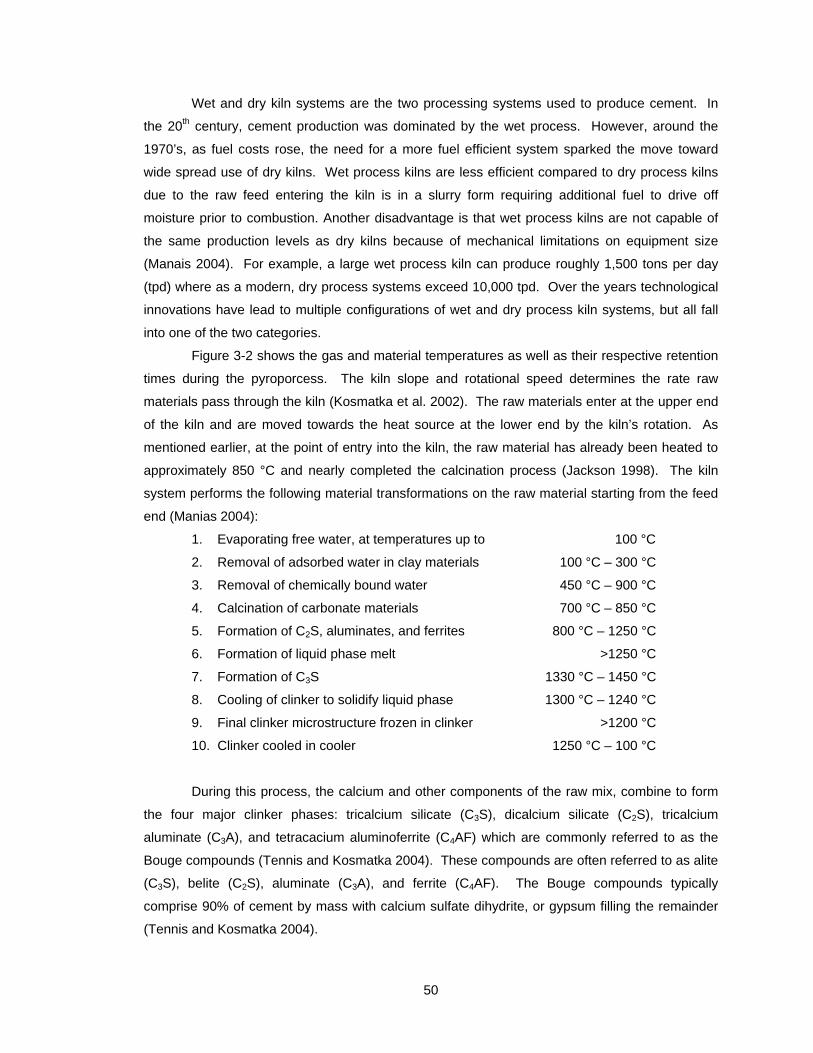
50
Wet and dry kiln systems are the two processing systems used to produce cement. In
the 20th century, cement production was dominated by the wet process. However, around the
1970’s, as fuel costs rose, the need for a more fuel efficient system sparked the move toward
wide spread use of dry kilns. Wet process kilns are less efficient compared to dry process kilns
due to the raw feed entering the kiln is in a slurry form requiring additional fuel to drive off
moisture prior to combustion. Another disadvantage is that wet process kilns are not capable of
the same production levels as dry kilns because of mechanical limitations on equipment size
(Manais 2004). For example, a large wet process kiln can produce roughly 1,500 tons per day
(tpd) where as a modern, dry process systems exceed 10,000 tpd. Over the years technological
innovations have lead to multiple configurations of wet and dry process kiln systems, but all fall
into one of the two categories.
Figure 3-2 shows the gas and material temperatures as well as their respective retention
times during the pyroporcess. The kiln slope and rotational speed determines the rate raw
materials pass through the kiln (Kosmatka et al. 2002). The raw materials enter at the upper end
of the kiln and are moved towards the heat source at the lower end by the kiln’s rotation. As
mentioned earlier, at the point of entry into the kiln, the raw material has already been heated to
approximately 850 °C and nearly completed the calcination process (Jackson 1998). The kiln
system performs the following material transformations on the raw material starting from the feed
end (Manias 2004):
1. Evaporating free water, at temperatures up to 100 °C
2. Removal of adsorbed water in clay materials 100 °C – 300 °C
3. Removal of chemically bound water 450 °C – 900 °C
4. Calcination of carbonate materials 700 °C – 850 °C
5. Formation of C2S, aluminates, and ferrites 800 °C – 1250 °C
6. Formation of liquid phase melt >1250 °C
7. Formation of C3S 1330 °C – 1450 °C
8. Cooling of clinker to solidify liquid phase 1300 °C – 1240 °C
9. Final clinker microstructure frozen in clinker >1200 °C
10. Clinker cooled in cooler 1250 °C – 100 °C
During this process, the calcium and other components of the raw mix, combine to form
the four major clinker phases: tricalcium silicate (C3S), dicalcium silicate (C2S), tricalcium
aluminate (C3A), and tetracacium aluminoferrite (C4AF) which are commonly referred to as the
Bouge compounds (Tennis and Kosmatka 2004). These compounds are often referred to as alite
(C3S), belite (C2S), aluminate (C3A), and ferrite (C4AF). The Bouge compounds typically
comprise 90% of cement by mass with calcium sulfate dihydrite, or gypsum filling the remainder
(Tennis and Kosmatka 2004).
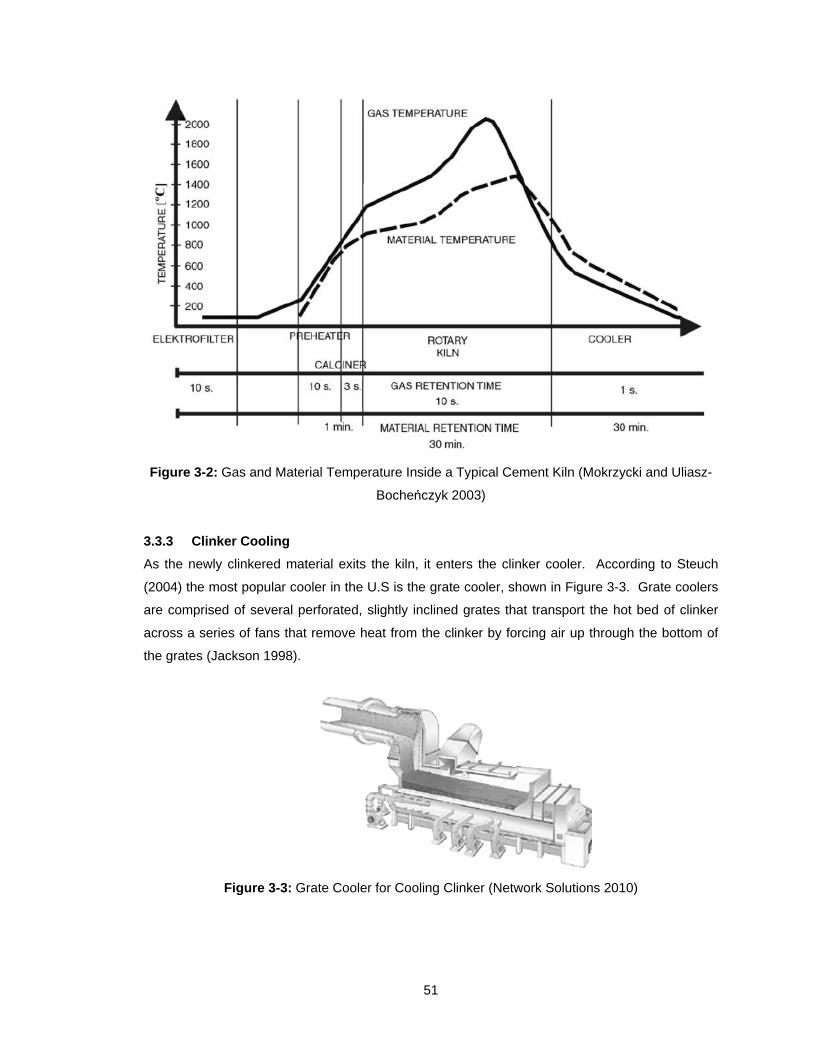
51
Figure 3-2: Gas and Material Temperature Inside a Typical Cement Kiln (Mokrzycki and Uliasz-
Bocheńczyk 2003)
3.3.3 Clinker Cooling
As the newly clinkered material exits the kiln, it enters the clinker cooler. According to Steuch
(2004) the most popular cooler in the U.S is the grate cooler, shown in Figure 3-3. Grate coolers
are comprised of several perforated, slightly inclined grates that transport the hot bed of clinker
across a series of fans that remove heat from the clinker by forcing air up through the bottom of
the grates (Jackson 1998).
Figure 3-3: Grate Cooler for Cooling Clinker (Network Solutions 2010)
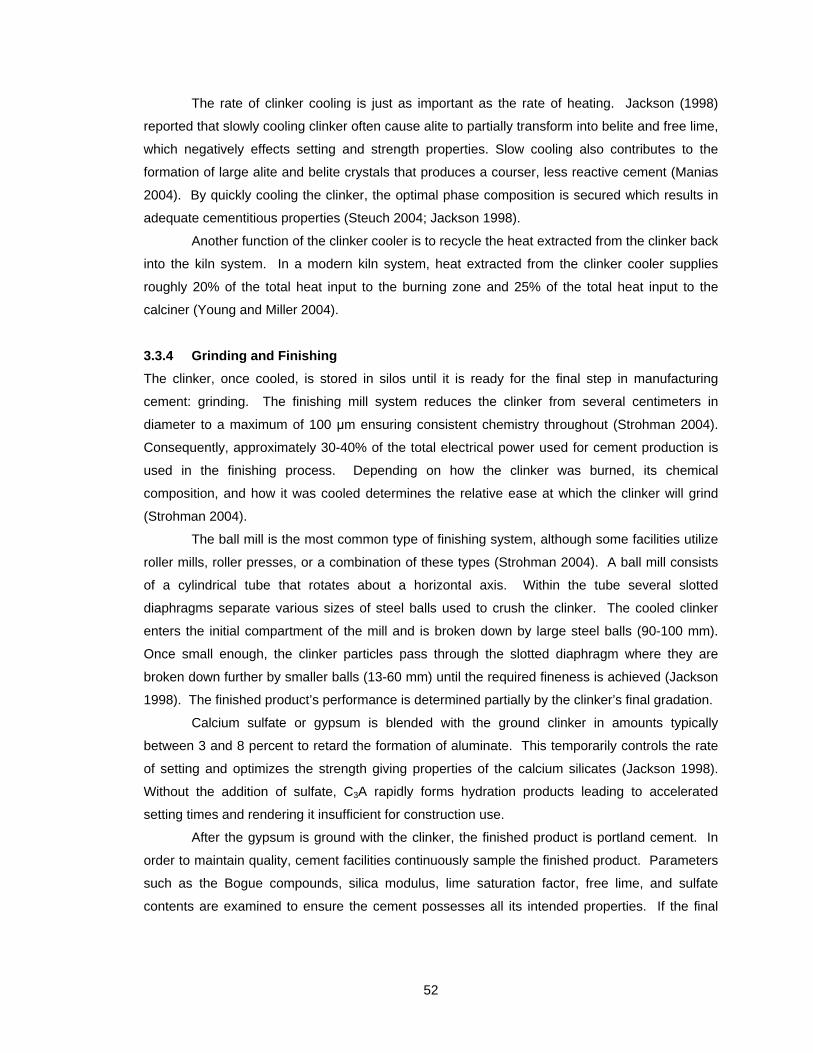
52
The rate of clinker cooling is just as important as the rate of heating. Jackson (1998)
reported that slowly cooling clinker often cause alite to partially transform into belite and free lime,
which negatively effects setting and strength properties. Slow cooling also contributes to the
formation of large alite and belite crystals that produces a courser, less reactive cement (Manias
2004). By quickly cooling the clinker, the optimal phase composition is secured which results in
adequate cementitious properties (Steuch 2004; Jackson 1998).
Another function of the clinker cooler is to recycle the heat extracted from the clinker back
into the kiln system. In a modern kiln system, heat extracted from the clinker cooler supplies
roughly 20% of the total heat input to the burning zone and 25% of the total heat input to the
calciner (Young and Miller 2004).
3.3.4 Grinding and Finishing
The clinker, once cooled, is stored in silos until it is ready for the final step in manufacturing
cement: grinding. The finishing mill system reduces the clinker from several centimeters in
diameter to a maximum of 100 μm ensuring consistent chemistry throughout (Strohman 2004).
Consequently, approximately 30-40% of the total electrical power used for cement production is
used in the finishing process. Depending on how the clinker was burned, its chemical
composition, and how it was cooled determines the relative ease at which the clinker will grind
(Strohman 2004).
The ball mill is the most common type of finishing system, although some facilities utilize
roller mills, roller presses, or a combination of these types (Strohman 2004). A ball mill consists
of a cylindrical tube that rotates about a horizontal axis. Within the tube several slotted
diaphragms separate various sizes of steel balls used to crush the clinker. The cooled clinker
enters the initial compartment of the mill and is broken down by large steel balls (90-100 mm).
Once small enough, the clinker particles pass through the slotted diaphragm where they are
broken down further by smaller balls (13-60 mm) until the required fineness is achieved (Jackson
1998). The finished product’s performance is determined partially by the clinker’s final gradation.
Calcium sulfate or gypsum is blended with the ground clinker in amounts typically
between 3 and 8 percent to retard the formation of aluminate. This temporarily controls the rate
of setting and optimizes the strength giving properties of the calcium silicates (Jackson 1998).
Without the addition of sulfate, C3A rapidly forms hydration products leading to accelerated
setting times and rendering it insufficient for construction use.
After the gypsum is ground with the clinker, the finished product is portland cement. In
order to maintain quality, cement facilities continuously sample the finished product. Parameters
such as the Bogue compounds, silica modulus, lime saturation factor, free lime, and sulfate
contents are examined to ensure the cement possesses all its intended properties. If the final
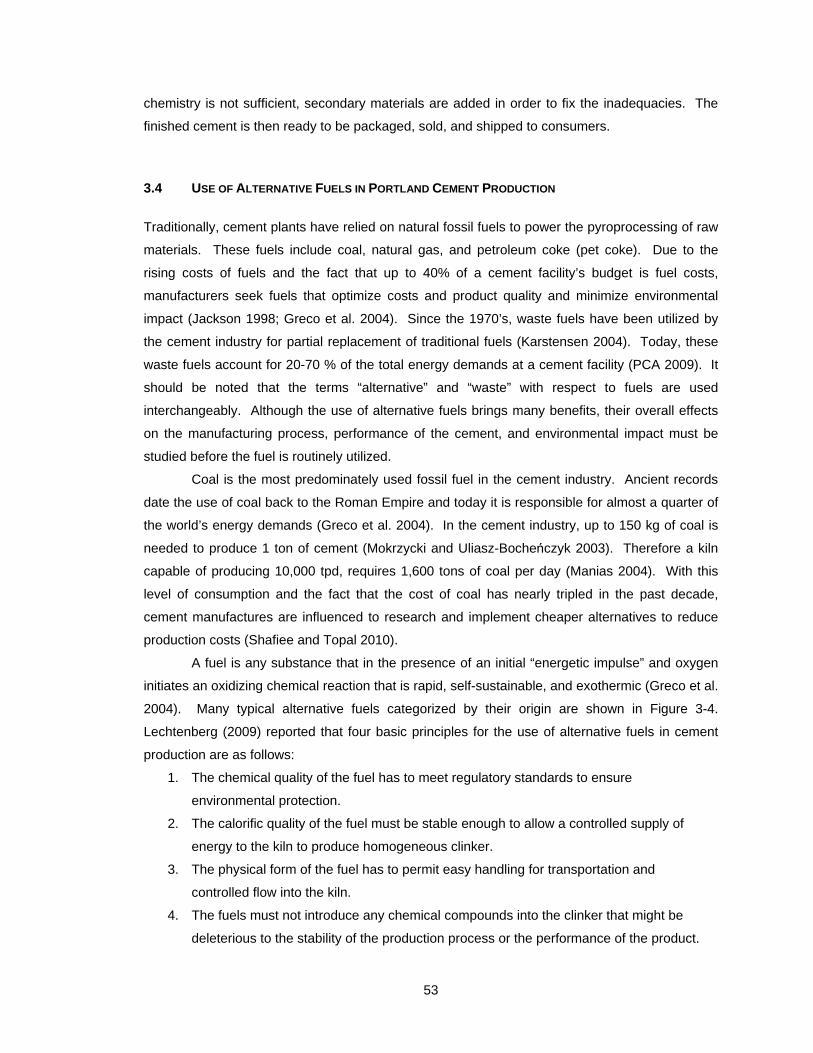
53
chemistry is not sufficient, secondary materials are added in order to fix the inadequacies. The
finished cement is then ready to be packaged, sold, and shipped to consumers.
3.4 USE OF ALTERNATIVE FUELS IN PORTLAND CEMENT PRODUCTION
Traditionally, cement plants have relied on natural fossil fuels to power the pyroprocessing of raw
materials. These fuels include coal, natural gas, and petroleum coke (pet coke). Due to the
rising costs of fuels and the fact that up to 40% of a cement facility’s budget is fuel costs,
manufacturers seek fuels that optimize costs and product quality and minimize environmental
impact (Jackson 1998; Greco et al. 2004). Since the 1970’s, waste fuels have been utilized by
the cement industry for partial replacement of traditional fuels (Karstensen 2004). Today, these
waste fuels account for 20-70 % of the total energy demands at a cement facility (PCA 2009). It
should be noted that the terms “alternative” and “waste” with respect to fuels are used
interchangeably. Although the use of alternative fuels brings many benefits, their overall effects
on the manufacturing process, performance of the cement, and environmental impact must be
studied before the fuel is routinely utilized.
Coal is the most predominately used fossil fuel in the cement industry. Ancient records
date the use of coal back to the Roman Empire and today it is responsible for almost a quarter of
the world’s energy demands (Greco et al. 2004). In the cement industry, up to 150 kg of coal is
needed to produce 1 ton of cement (Mokrzycki and Uliasz-Bocheńczyk 2003). Therefore a kiln
capable of producing 10,000 tpd, requires 1,600 tons of coal per day (Manias 2004). With this
level of consumption and the fact that the cost of coal has nearly tripled in the past decade,
cement manufactures are influenced to research and implement cheaper alternatives to reduce
production costs (Shafiee and Topal 2010).
A fuel is any substance that in the presence of an initial “energetic impulse” and oxygen
initiates an oxidizing chemical reaction that is rapid, self-sustainable, and exothermic (Greco et al.
2004). Many typical alternative fuels categorized by their origin are shown in Figure 3-4.
Lechtenberg (2009) reported that four basic principles for the use of alternative fuels in cement
production are as follows:
1. The chemical quality of the fuel has to meet regulatory standards to ensure
environmental protection.
2. The calorific quality of the fuel must be stable enough to allow a controlled supply of
energy to the kiln to produce homogeneous clinker.
3. The physical form of the fuel has to permit easy handling for transportation and
controlled flow into the kiln.
4. The fuels must not introduce any chemical compounds into the clinker that might be
deleterious to the stability of the production process or the performance of the product.
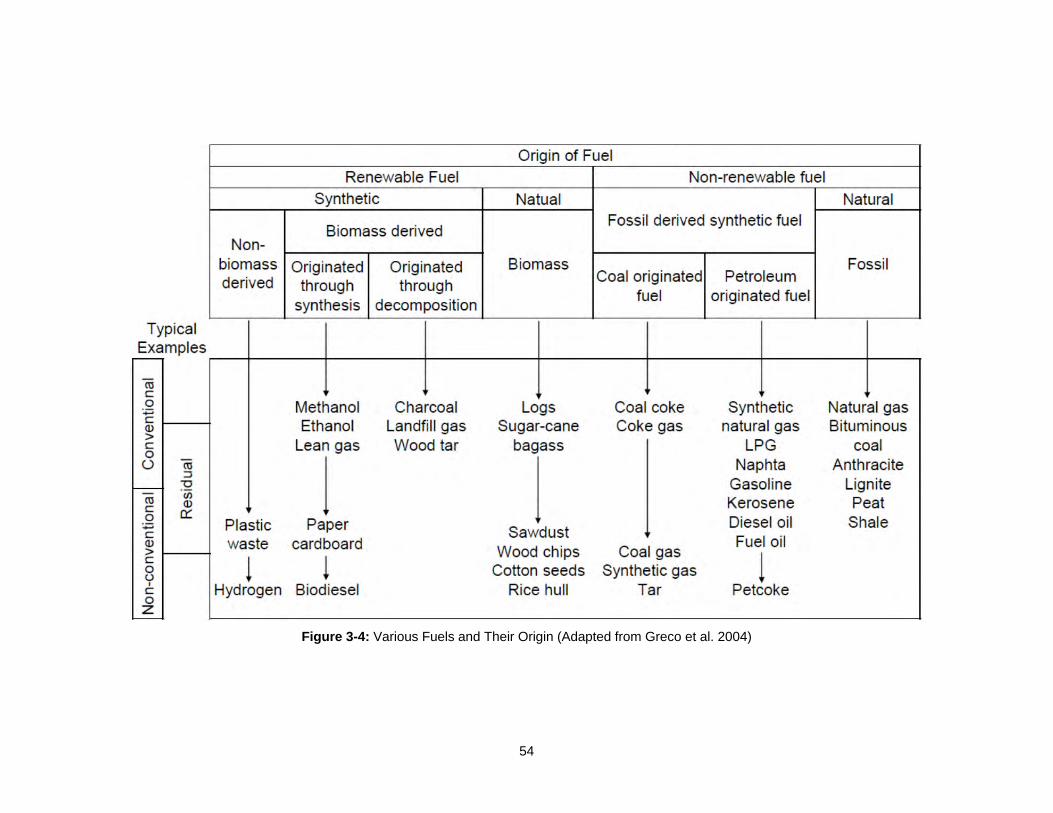
54
Figure 3-4: Various Fuels and Their Origin (Adapted from Greco et al. 2004)
55
Alternative fuels are divided into three distinct categories: solid, liquid, and gaseous fuels
(Greco et al. 2004; Mokrzycki et al. 2003). Examples of each type of waste fuel commonly used
are shown in Table 3-4. Each category requires specific plant modifications in order to condition,
dose, and fire the alternative fuel. Replacement levels for alternative fuels vary according to
physical and chemical properties and are governed differently from country to country. For
example, Conesa et al. (2007) reported, Switzerland has no replacement limit while Spain is
limited to 15%. However, appropriate waste fuels could represent 80 to 100 % of fossil fuel
replacement according to Willitsch and Strum (2002).
The implementation of waste fuels in the cement industry resulted from diminishing
resources and increased fuel costs. The effects are reduced production costs, which create a
competitive edge against other cement manufacturers and a decreased environmental impact.
3.4.1 Alternative Fuels in Cement Kilns
To adequately burn waste material, sufficient oxygen and temperature must be supplied as well
as retention time, and proper mixing conditions (Karstensen 2008). Greco et al. (2004) reported
the following kiln characteristics that render a sufficient environment for waste disposal:
1. The residence time and the temperature exceed minimum environmental regulations,
2. During the firing process, the alkaline environment inside the kiln absorbs the majority
of acid gasses produced by the oxidation of sulfur and chlorine,
3. Non-combustible compounds and other metallic oxides do not harm the production or
quality of clinker, and
4. The dusting system traps and recycles most other metals.
As stated earlier, it is important to fully understand the chemical composition of a waste
material before use. Excess compounds such as sulfur and nitrogen oxides can cause kiln rings
and build ups that lead to kiln shutdowns. In addition, extra quality assurance measures should
be taken to ensure complete combustion of material and parameter control (Greco et al. 2004).
Lastly, emissions must also be carefully monitored due to costly fines completely negating the
cost savings of the alternative fuel.
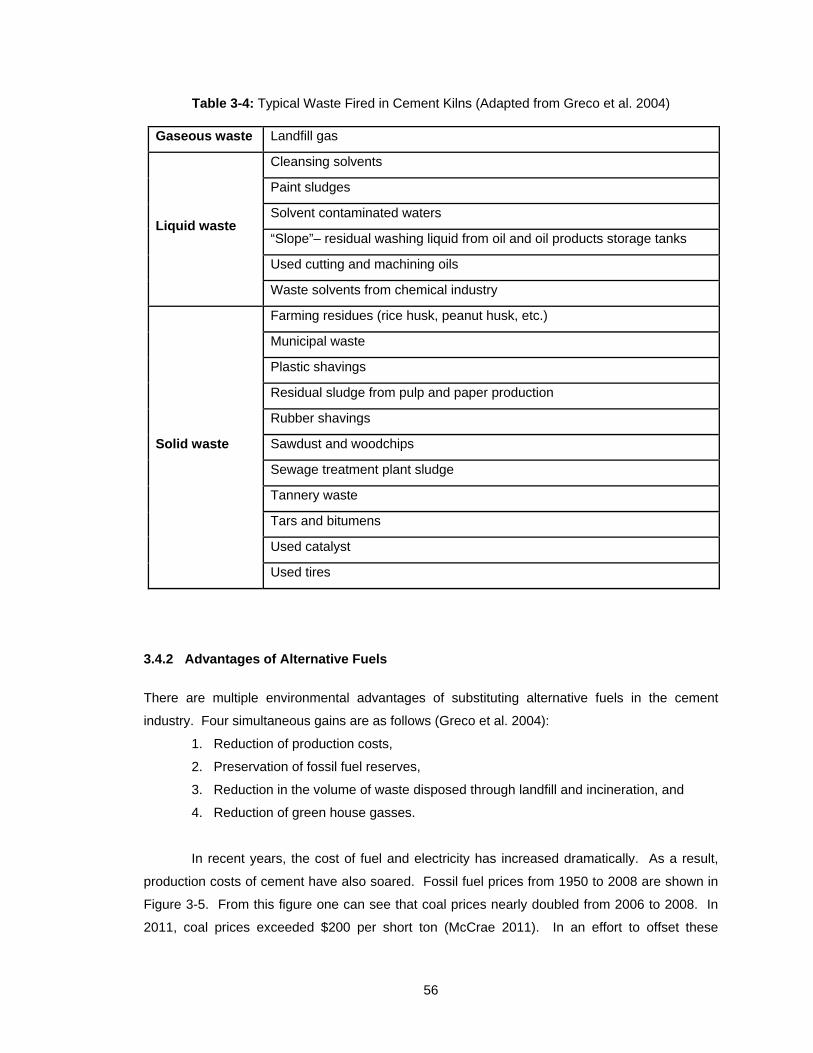
56
Table 3-4: Typical Waste Fired in Cement Kilns (Adapted from Greco et al. 2004)
Gaseous waste Landfill gas
Liquid waste
Cleansing solvents
Paint sludges
Solvent contaminated waters
“Slope”– residual washing liquid from oil and oil products storage tanks
Used cutting and machining oils
Waste solvents from chemical industry
Solid waste
Farming residues (rice husk, peanut husk, etc.)
Municipal waste
Plastic shavings
Residual sludge from pulp and paper production
Rubber shavings
Sawdust and woodchips
Sewage treatment plant sludge
Tannery waste
Tars and bitumens
Used catalyst
Used tires
3.4.2 Advantages of Alternative Fuels
There are multiple environmental advantages of substituting alternative fuels in the cement
industry. Four simultaneous gains are as follows (Greco et al. 2004):
1. Reduction of production costs,
2. Preservation of fossil fuel reserves,
3. Reduction in the volume of waste disposed through landfill and incineration, and
4. Reduction of green house gasses.
In recent years, the cost of fuel and electricity has increased dramatically. As a result,
production costs of cement have also soared. Fossil fuel prices from 1950 to 2008 are shown in
Figure 3-5. From this figure one can see that coal prices nearly doubled from 2006 to 2008. In
2011, coal prices exceeded $200 per short ton (McCrae 2011). In an effort to offset these

57
increases, manufacturers employ waste fuels because their cost per unit energy is far below that
of fossil fuels (Greco et al. 2004). According to Hendrik and Padovani (2003), some cement
plants in the United States are even paid to take waste, which in some cases completely offsets
the conventional fuel costs.
Coal, natural gas, and petroleum coke are the predominate fossil fuels used to produce
cement. The conservation of fossil fuels is important because they are non-renewable resources.
At the present world consumption level, coal reserves will last approximately 119 more years
(WCA 2011). Although coal and other fossil fuels are extensively used in the production of
cement, electricity and steel, the use of waste fuels reduces the ecological footprint made by the
cement industry.
As the world’s population continues to grow, landfill space is becoming scarce. Waste
incineration is a typical method used to free landfill space. Waste incinerators use large
quantities of fossil fuels to reach temperatures of at least 850 °C in order to break down materials.
The drawback to waste incinerators is that no product, such as portland cement, is formed from
the use of fuel. Waste incineration also produces higher emissions than cement kilns. The
material breakdown in a cement kiln is much more complete because of the significantly higher
temperatures and the longer residence times. Incidentally, Mokrzycki and Bocheńczyk (2003)
point out that it is cheaper to modify an existing kiln to burn waste fuels than it is to build a new
incineration plant.
Greenhouse gasses are produced through the firing of raw materials and fuels. Carbon
dioxide is one of these gasses that has come to the forefront due to its negative impact on the
environment. Carbon dioxide is formed during the production of electricity, calcination of lime, and
combustion of carbon-based fuels (Worrell et al. 2001). Green house gasses are of concern
because they trap radiation within the atmosphere. Worrell et al. (2001) reported that the use of
waste fuels may reduce the carbon dioxide emissions by 0.1 to 0.5 kg/kg of cement compared to
traditional fuel emissions.
Alternative fuels can also supplement raw materials in cement production. Jackson
(1998) reported that rice husk ash significantly reduces the required additions of silica in the raw
feed because of its high silica content (78-90 %). Kääntee et al. (2002) also reported that iron
found in the steel belts of automobile tires reduces the required iron in the raw feed.
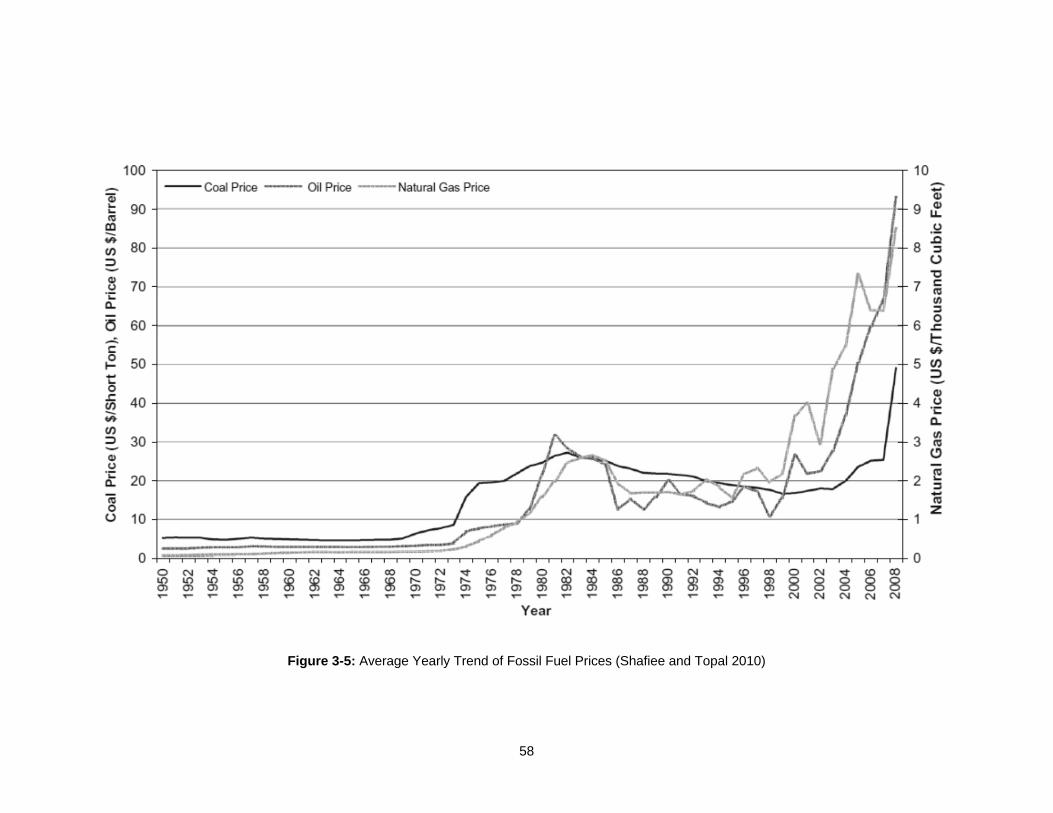
58
Figure 3-5: Average Yearly Trend of Fossil Fuel Prices (Shafiee and Topal 2010)
59
3.4.3 Disadvantages of Alternative Fuels
Many factors such as increased emissions, altered clinker composition, and initial investment
costs must be considered prior to the implementation of waste fuels. The effects of the
disadvantages, if not addressed, can negate all other advantages.
The availability and cost often determines the viability of an alternative fuel (Kääntee et
al. 2002). Preliminary conditioning of waste materials such as shredding, drying, and removal of
detrimental contents is typically outsourced, but is critical before use and imposes a significant
cost to the producer (Greco et al. 2004). The final condition of the waste material determines its
energy output and replacement rate. Purchasing and installing mechanical equipment specifically
designed to condition, convey, and dose the waste fuel are not only cost intensive, but if the
waste material source is depleted or becomes unavailable, the need for the equipment also may
become obsolete.
Metering and feeding systems must be installed to covey the waste fuel to the kiln.
Although the prices vary according to capacity and precision, state of the art storage, metering,
and feeding systems require large initial investments upwards of several million dollars
(Lechtenberg 2009). The cost of training personnel to operate the continuous feed systems
should also be considered (Willitsch and Strum 2002). The difficulty surrounding the ability to
accurately monitor heterogeneous mixtures with varying densities was also noted by Willitsch and
Srum (2002).
According to Hendrik and Padovani (2003), waste fuels can induce or increase kiln
emissions. Chemical composition of the cement can also be altered by waste fuels. Waste fuels
with high chloride concentrations can lead to the formation of sodium and potassium chloride
gasses in the kiln and calcium chloride in the clinker. Updates to emission control systems as
well as quality control systems may be necessary to ensure emissions remain within limits and
the performance of the clinker is no altered. Buildup of chloride gasses in the kiln can also cause
blockages in the cyclone pipes and therefore kiln shutdowns (Lechtenberg 2009). Unnecessary
kiln shutdowns reduce production rates and are an avoidable loss of revenue.
3.4.4 Alternative Fuel Options
Examples of typical waste fuels and their origins were shown earlier in Table 3-4 and Figure 3-4.
These fuels are readily accessible to most geographic locations. Not only must the fuel release
large amounts of energy when burnt, but there are a number of other characteristics that the fuel
must possess in order to be considered for implementation. In order to validate a waste fuel’s
potential, the following factors should be considered (Mokrzycki and Uliasz-Bocheńczyk (2003):

60
1. Physical state of fuel (solid, liquid, gaseous),
2. Content of circulating elements (Na, K, Cl, S),
3. Toxicity (organic compounds, heavy metals),
4. Composition and ash content,
5. Volatile content,
6. Calorific, or heating value,
7. Physical properties (particle size, density, homogeneity), and
8. Moisture Content.
The replacement rate of a fuel is determined by a combination of the parameters listed
above and is the reason why knowledge of the fuel’s chemical composition is essential (Kääntee
et al. 2002). For example, it would not be beneficial or make sense to replace a traditional fuel
with an alternate, if the alternative fuel’s low heating value requires excessive replacement rates.
Although minimum requirements for a waste fuel differ among cement facilities, an example of
criteria used by the Lafarge Cement Polska group is shown below (Mokrzycki et al. 2003):
Heating Value > 6019 BTU/lb (weekly average)
Chlorine content < 0.2%
Sulfur content < 2.5%
Polychlorinated Biphenyls (PCBs) content < 50ppm, and
Heavy metals content < 2500 ppm, out of which:
o Hg < 10ppm
o Cd + Tl + Hg < 100ppm
The heating value, expressed in British Thermal Units (BTU), or calorific value,
expressed in calories (cal), is the energy output upon combustion and is a key parameter in
determining the viability of a fuel. The conditioning of the waste material before combustion also
has a dramatic impact on the performance of the fuel. Material with a high moisture content will
release less net energy than a material with a lower moisture content. This is due to extra fuel
being required to remove the moisture before combustion. The approximate energy values of
typical alternative fuels is shown in Table 3-5. Note the significant difference in energy values
between the As-Received and Dry columns. The As-Received energy value is the energy value
associated with the fuels natural moisture content.
The alternative fuels utilized in this study include construction and demolition waste,
woodchips, and soybean seeds. A brief description of their historical use as alternative fuels will
be discussed in the following sections. A comprehensive discussion of other alternative fuels
utilized in previous studies is available, but will not be discussed further here.
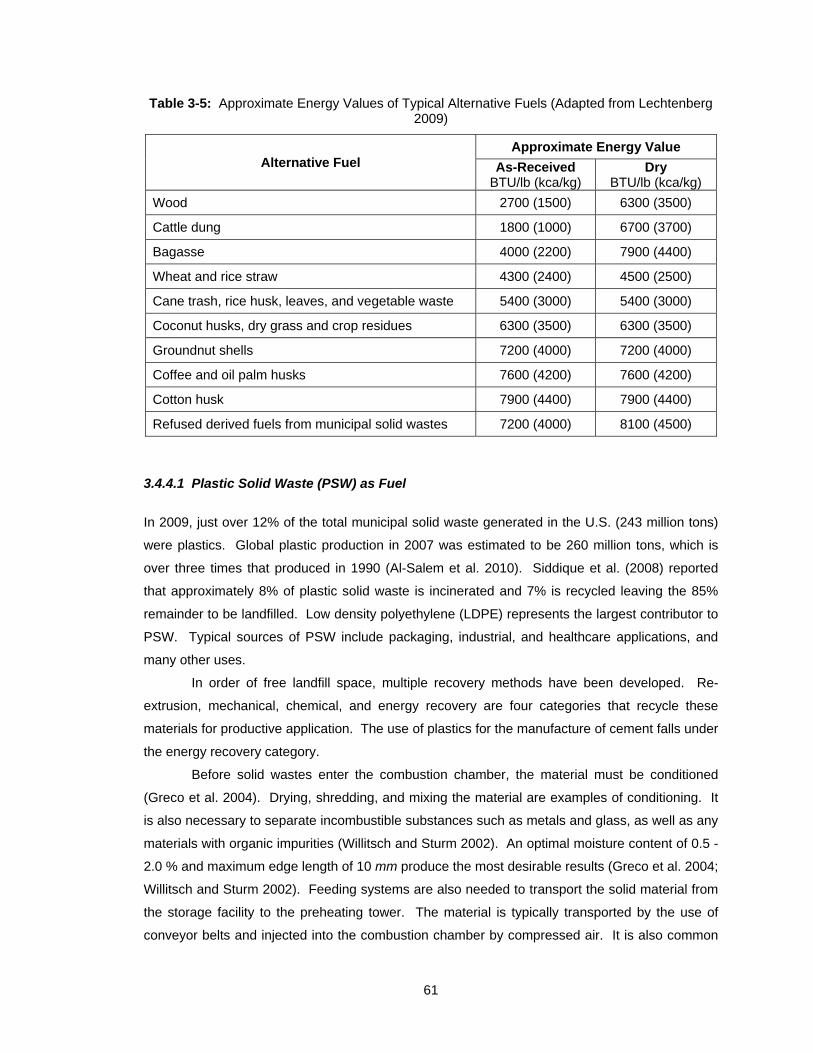
61
Table 3-5: Approximate Energy Values of Typical Alternative Fuels (Adapted from Lechtenberg 2009)
Alternative Fuel Approximate Energy Value
As-Received BTU/lb (kca/kg)
Dry BTU/lb (kca/kg)
Wood 2700 (1500) 6300 (3500)
Cattle dung 1800 (1000) 6700 (3700)
Bagasse 4000 (2200) 7900 (4400)
Wheat and rice straw 4300 (2400) 4500 (2500)
Cane trash, rice husk, leaves, and vegetable waste 5400 (3000) 5400 (3000)
Coconut husks, dry grass and crop residues 6300 (3500) 6300 (3500)
Groundnut shells 7200 (4000) 7200 (4000)
Coffee and oil palm husks 7600 (4200) 7600 (4200)
Cotton husk 7900 (4400) 7900 (4400)
Refused derived fuels from municipal solid wastes 7200 (4000) 8100 (4500)
3.4.4.1 Plastic Solid Waste (PSW) as Fuel
In 2009, just over 12% of the total municipal solid waste generated in the U.S. (243 million tons)
were plastics. Global plastic production in 2007 was estimated to be 260 million tons, which is
over three times that produced in 1990 (Al-Salem et al. 2010). Siddique et al. (2008) reported
that approximately 8% of plastic solid waste is incinerated and 7% is recycled leaving the 85%
remainder to be landfilled. Low density polyethylene (LDPE) represents the largest contributor to
PSW. Typical sources of PSW include packaging, industrial, and healthcare applications, and
many other uses.
In order of free landfill space, multiple recovery methods have been developed. Re-
extrusion, mechanical, chemical, and energy recovery are four categories that recycle these
materials for productive application. The use of plastics for the manufacture of cement falls under
the energy recovery category.
Before solid wastes enter the combustion chamber, the material must be conditioned
(Greco et al. 2004). Drying, shredding, and mixing the material are examples of conditioning. It
is also necessary to separate incombustible substances such as metals and glass, as well as any
materials with organic impurities (Willitsch and Sturm 2002). An optimal moisture content of 0.5 -
2.0 % and maximum edge length of 10 mm produce the most desirable results (Greco et al. 2004;
Willitsch and Sturm 2002). Feeding systems are also needed to transport the solid material from
the storage facility to the preheating tower. The material is typically transported by the use of
conveyor belts and injected into the combustion chamber by compressed air. It is also common
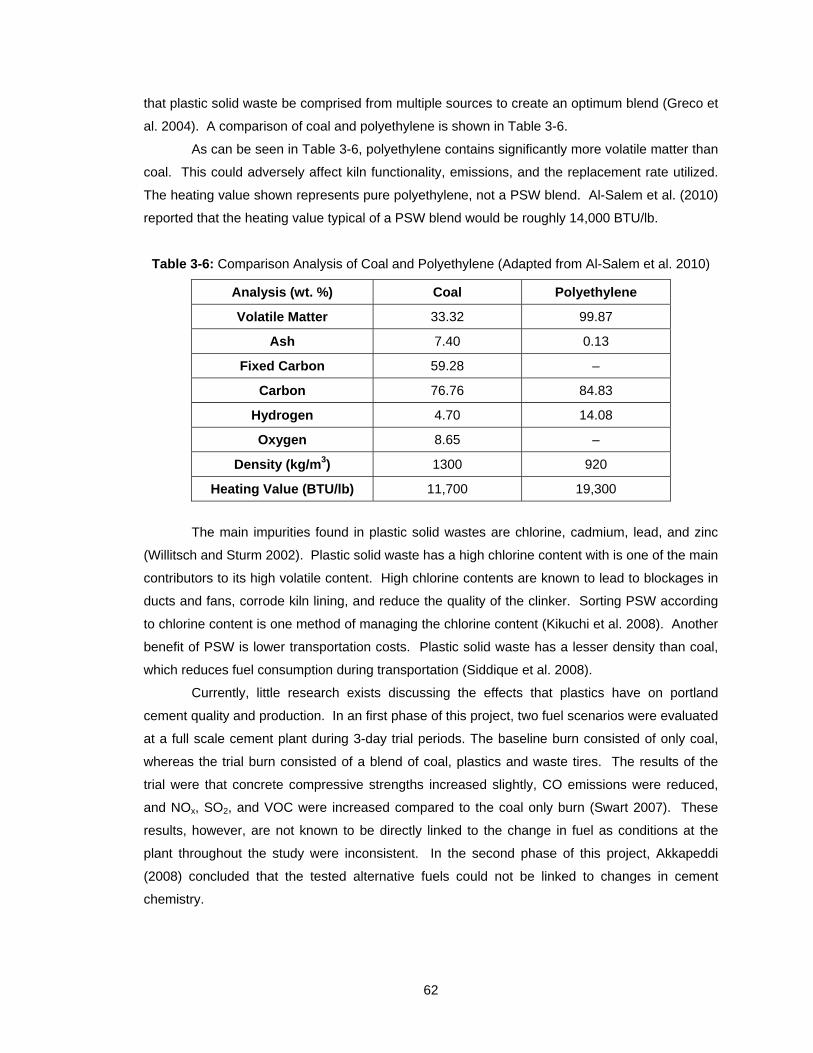
62
that plastic solid waste be comprised from multiple sources to create an optimum blend (Greco et
al. 2004). A comparison of coal and polyethylene is shown in Table 3-6.
As can be seen in Table 3-6, polyethylene contains significantly more volatile matter than
coal. This could adversely affect kiln functionality, emissions, and the replacement rate utilized.
The heating value shown represents pure polyethylene, not a PSW blend. Al-Salem et al. (2010)
reported that the heating value typical of a PSW blend would be roughly 14,000 BTU/lb.
Table 3-6: Comparison Analysis of Coal and Polyethylene (Adapted from Al-Salem et al. 2010)
Analysis (wt. %) Coal Polyethylene
Volatile Matter 33.32 99.87
Ash 7.40 0.13
Fixed Carbon 59.28 –
Carbon 76.76 84.83
Hydrogen 4.70 14.08
Oxygen 8.65 –
Density (kg/m3) 1300 920
Heating Value (BTU/lb) 11,700 19,300
The main impurities found in plastic solid wastes are chlorine, cadmium, lead, and zinc
(Willitsch and Sturm 2002). Plastic solid waste has a high chlorine content with is one of the main
contributors to its high volatile content. High chlorine contents are known to lead to blockages in
ducts and fans, corrode kiln lining, and reduce the quality of the clinker. Sorting PSW according
to chlorine content is one method of managing the chlorine content (Kikuchi et al. 2008). Another
benefit of PSW is lower transportation costs. Plastic solid waste has a lesser density than coal,
which reduces fuel consumption during transportation (Siddique et al. 2008).
Currently, little research exists discussing the effects that plastics have on portland
cement quality and production. In an first phase of this project, two fuel scenarios were evaluated
at a full scale cement plant during 3-day trial periods. The baseline burn consisted of only coal,
whereas the trial burn consisted of a blend of coal, plastics and waste tires. The results of the
trial were that concrete compressive strengths increased slightly, CO emissions were reduced,
and NOx, SO2, and VOC were increased compared to the coal only burn (Swart 2007). These
results, however, are not known to be directly linked to the change in fuel as conditions at the
plant throughout the study were inconsistent. In the second phase of this project, Akkapeddi
(2008) concluded that the tested alternative fuels could not be linked to changes in cement
chemistry.
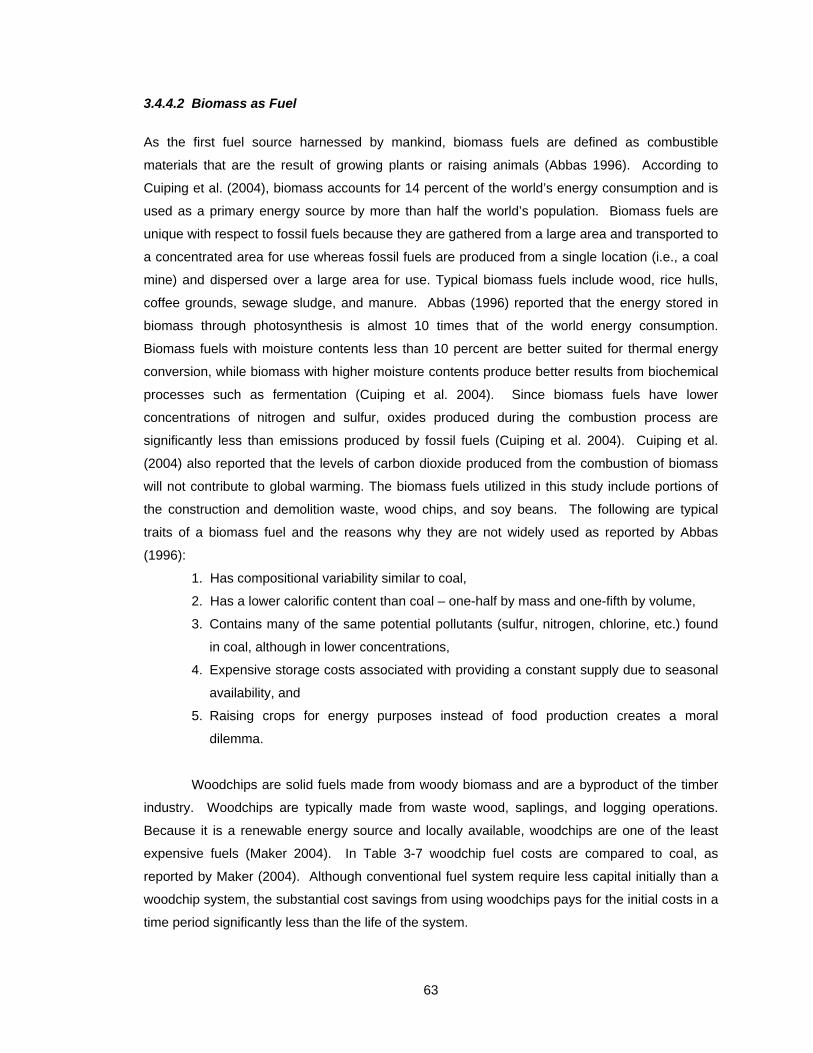
63
3.4.4.2 Biomass as Fuel
As the first fuel source harnessed by mankind, biomass fuels are defined as combustible
materials that are the result of growing plants or raising animals (Abbas 1996). According to
Cuiping et al. (2004), biomass accounts for 14 percent of the world’s energy consumption and is
used as a primary energy source by more than half the world’s population. Biomass fuels are
unique with respect to fossil fuels because they are gathered from a large area and transported to
a concentrated area for use whereas fossil fuels are produced from a single location (i.e., a coal
mine) and dispersed over a large area for use. Typical biomass fuels include wood, rice hulls,
coffee grounds, sewage sludge, and manure. Abbas (1996) reported that the energy stored in
biomass through photosynthesis is almost 10 times that of the world energy consumption.
Biomass fuels with moisture contents less than 10 percent are better suited for thermal energy
conversion, while biomass with higher moisture contents produce better results from biochemical
processes such as fermentation (Cuiping et al. 2004). Since biomass fuels have lower
concentrations of nitrogen and sulfur, oxides produced during the combustion process are
significantly less than emissions produced by fossil fuels (Cuiping et al. 2004). Cuiping et al.
(2004) also reported that the levels of carbon dioxide produced from the combustion of biomass
will not contribute to global warming. The biomass fuels utilized in this study include portions of
the construction and demolition waste, wood chips, and soy beans. The following are typical
traits of a biomass fuel and the reasons why they are not widely used as reported by Abbas
(1996):
1. Has compositional variability similar to coal,
2. Has a lower calorific content than coal – one-half by mass and one-fifth by volume,
3. Contains many of the same potential pollutants (sulfur, nitrogen, chlorine, etc.) found
in coal, although in lower concentrations,
4. Expensive storage costs associated with providing a constant supply due to seasonal
availability, and
5. Raising crops for energy purposes instead of food production creates a moral
dilemma.
Woodchips are solid fuels made from woody biomass and are a byproduct of the timber
industry. Woodchips are typically made from waste wood, saplings, and logging operations.
Because it is a renewable energy source and locally available, woodchips are one of the least
expensive fuels (Maker 2004). In Table 3-7 woodchip fuel costs are compared to coal, as
reported by Maker (2004). Although conventional fuel system require less capital initially than a
woodchip system, the substantial cost savings from using woodchips pays for the initial costs in a
time period significantly less than the life of the system.
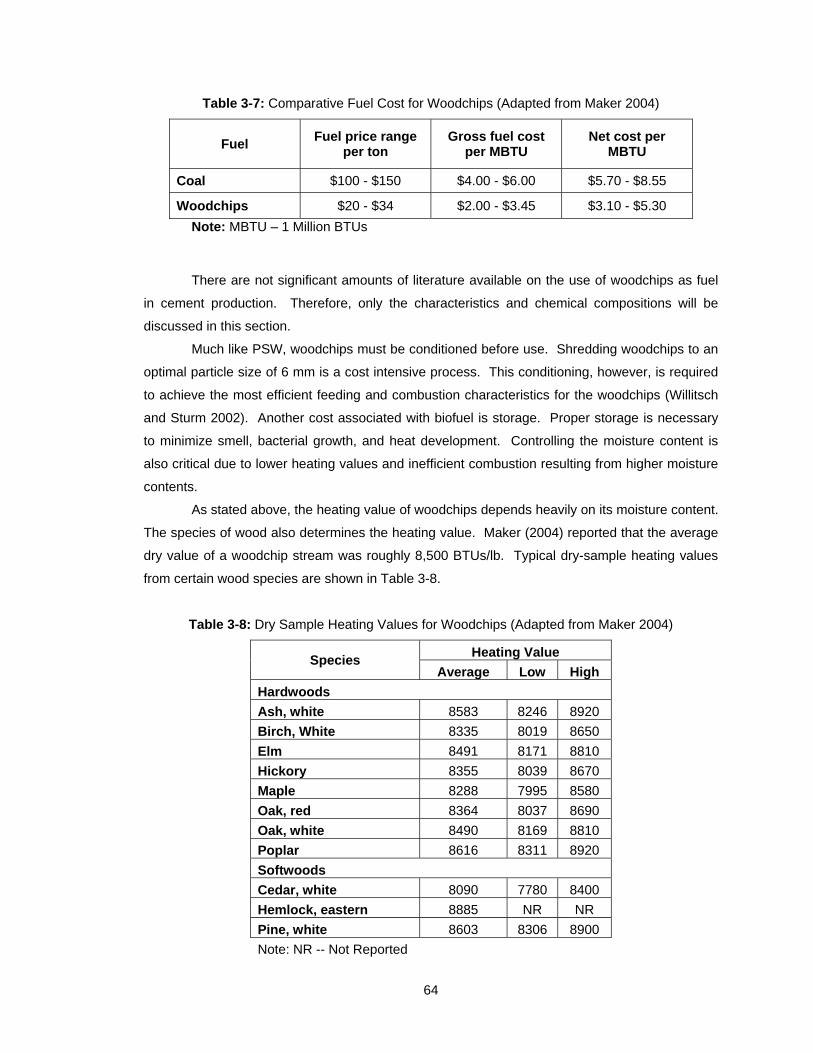
64
Table 3-7: Comparative Fuel Cost for Woodchips (Adapted from Maker 2004)
Fuel Fuel price range
per ton Gross fuel cost
per MBTU Net cost per
MBTU
Coal $100 - $150 $4.00 - $6.00 $5.70 - $8.55
Woodchips $20 - $34 $2.00 - $3.45 $3.10 - $5.30
Note: MBTU – 1 Million BTUs
There are not significant amounts of literature available on the use of woodchips as fuel
in cement production. Therefore, only the characteristics and chemical compositions will be
discussed in this section.
Much like PSW, woodchips must be conditioned before use. Shredding woodchips to an
optimal particle size of 6 mm is a cost intensive process. This conditioning, however, is required
to achieve the most efficient feeding and combustion characteristics for the woodchips (Willitsch
and Sturm 2002). Another cost associated with biofuel is storage. Proper storage is necessary
to minimize smell, bacterial growth, and heat development. Controlling the moisture content is
also critical due to lower heating values and inefficient combustion resulting from higher moisture
contents.
As stated above, the heating value of woodchips depends heavily on its moisture content.
The species of wood also determines the heating value. Maker (2004) reported that the average
dry value of a woodchip stream was roughly 8,500 BTUs/lb. Typical dry-sample heating values
from certain wood species are shown in Table 3-8.
Table 3-8: Dry Sample Heating Values for Woodchips (Adapted from Maker 2004)
Species Heating Value
Average Low High
Hardwoods
Ash, white 8583 8246 8920
Birch, White 8335 8019 8650
Elm 8491 8171 8810
Hickory 8355 8039 8670
Maple 8288 7995 8580
Oak, red 8364 8037 8690
Oak, white 8490 8169 8810
Poplar 8616 8311 8920
Softwoods
Cedar, white 8090 7780 8400
Hemlock, eastern 8885 NR NR
Pine, white 8603 8306 8900
Note: NR -- Not Reported
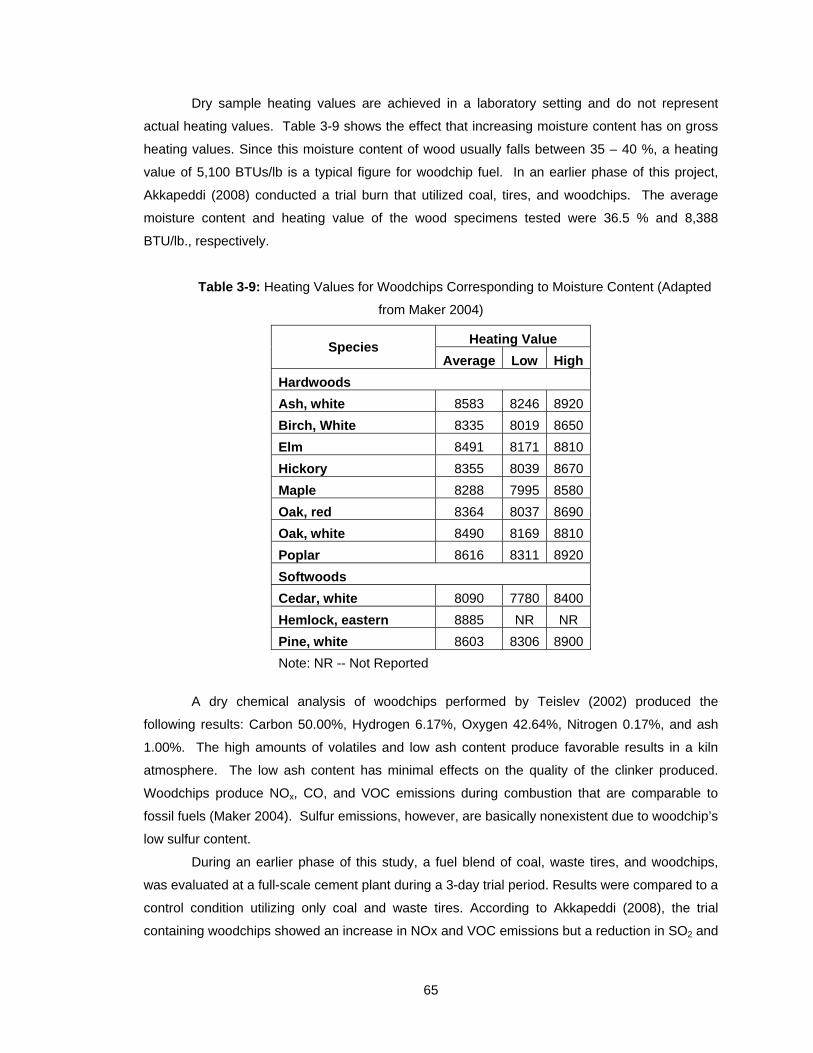
65
Dry sample heating values are achieved in a laboratory setting and do not represent
actual heating values. Table 3-9 shows the effect that increasing moisture content has on gross
heating values. Since this moisture content of wood usually falls between 35 – 40 %, a heating
value of 5,100 BTUs/lb is a typical figure for woodchip fuel. In an earlier phase of this project,
Akkapeddi (2008) conducted a trial burn that utilized coal, tires, and woodchips. The average
moisture content and heating value of the wood specimens tested were 36.5 % and 8,388
BTU/lb., respectively.
Table 3-9: Heating Values for Woodchips Corresponding to Moisture Content (Adapted
from Maker 2004)
Species Heating Value
Average Low High
Hardwoods
Ash, white 8583 8246 8920
Birch, White 8335 8019 8650
Elm 8491 8171 8810
Hickory 8355 8039 8670
Maple 8288 7995 8580
Oak, red 8364 8037 8690
Oak, white 8490 8169 8810
Poplar 8616 8311 8920
Softwoods
Cedar, white 8090 7780 8400
Hemlock, eastern 8885 NR NR
Pine, white 8603 8306 8900
Note: NR -- Not Reported
A dry chemical analysis of woodchips performed by Teislev (2002) produced the
following results: Carbon 50.00%, Hydrogen 6.17%, Oxygen 42.64%, Nitrogen 0.17%, and ash
1.00%. The high amounts of volatiles and low ash content produce favorable results in a kiln
atmosphere. The low ash content has minimal effects on the quality of the clinker produced.
Woodchips produce NOx, CO, and VOC emissions during combustion that are comparable to
fossil fuels (Maker 2004). Sulfur emissions, however, are basically nonexistent due to woodchip’s
low sulfur content.
During an earlier phase of this study, a fuel blend of coal, waste tires, and woodchips,
was evaluated at a full-scale cement plant during a 3-day trial period. Results were compared to a
control condition utilizing only coal and waste tires. According to Akkapeddi (2008), the trial
containing woodchips showed an increase in NOx and VOC emissions but a reduction in SO2 and
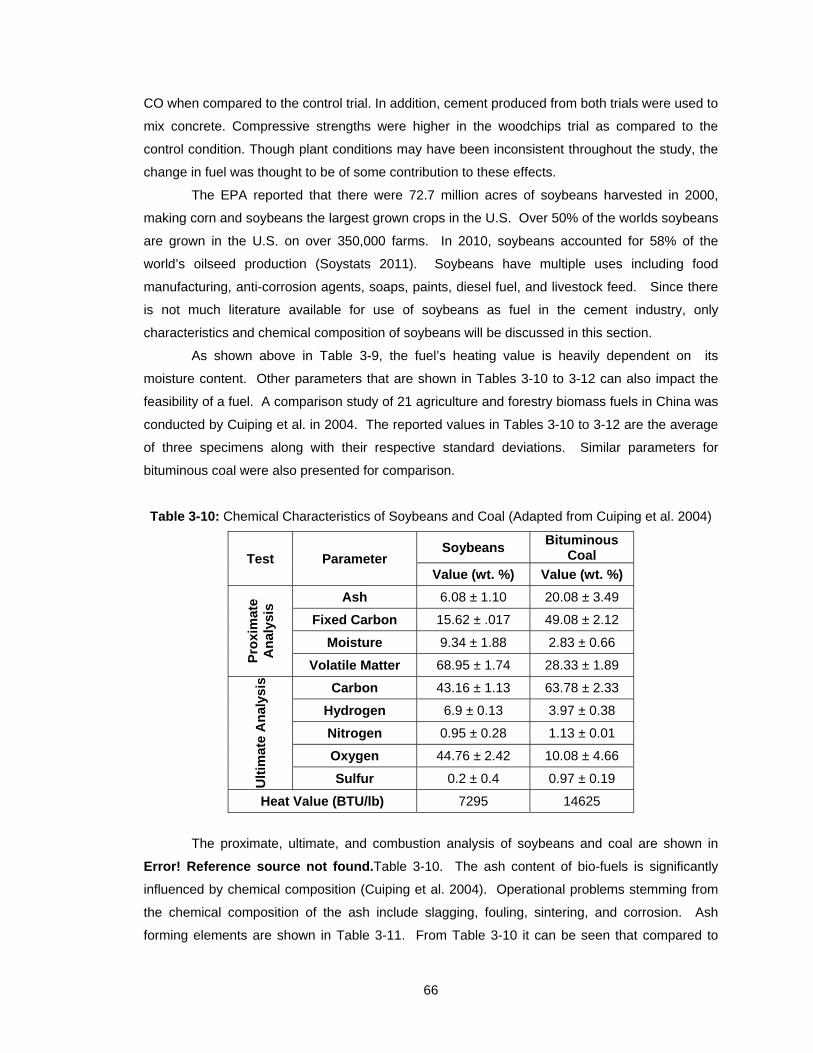
66
CO when compared to the control trial. In addition, cement produced from both trials were used to
mix concrete. Compressive strengths were higher in the woodchips trial as compared to the
control condition. Though plant conditions may have been inconsistent throughout the study, the
change in fuel was thought to be of some contribution to these effects.
The EPA reported that there were 72.7 million acres of soybeans harvested in 2000,
making corn and soybeans the largest grown crops in the U.S. Over 50% of the worlds soybeans
are grown in the U.S. on over 350,000 farms. In 2010, soybeans accounted for 58% of the
world’s oilseed production (Soystats 2011). Soybeans have multiple uses including food
manufacturing, anti-corrosion agents, soaps, paints, diesel fuel, and livestock feed. Since there
is not much literature available for use of soybeans as fuel in the cement industry, only
characteristics and chemical composition of soybeans will be discussed in this section.
As shown above in Table 3-9, the fuel’s heating value is heavily dependent on its
moisture content. Other parameters that are shown in Tables 3-10 to 3-12 can also impact the
feasibility of a fuel. A comparison study of 21 agriculture and forestry biomass fuels in China was
conducted by Cuiping et al. in 2004. The reported values in Tables 3-10 to 3-12 are the average
of three specimens along with their respective standard deviations. Similar parameters for
bituminous coal were also presented for comparison.
Table 3-10: Chemical Characteristics of Soybeans and Coal (Adapted from Cuiping et al. 2004)
Test Parameter Soybeans
Bituminous Coal
Value (wt. %) Value (wt. %)
Pro
xim
ate
An
alys
is Ash 6.08 ± 1.10 20.08 ± 3.49
Fixed Carbon 15.62 ± .017 49.08 ± 2.12
Moisture 9.34 ± 1.88 2.83 ± 0.66
Volatile Matter 68.95 ± 1.74 28.33 ± 1.89
Ult
imat
e A
nal
ysis
Carbon 43.16 ± 1.13 63.78 ± 2.33
Hydrogen 6.9 ± 0.13 3.97 ± 0.38
Nitrogen 0.95 ± 0.28 1.13 ± 0.01
Oxygen 44.76 ± 2.42 10.08 ± 4.66
Sulfur 0.2 ± 0.4 0.97 ± 0.19
Heat Value (BTU/lb) 7295 14625
The proximate, ultimate, and combustion analysis of soybeans and coal are shown in
Error! Reference source not found.Table 3-10. The ash content of bio-fuels is significantly
influenced by chemical composition (Cuiping et al. 2004). Operational problems stemming from
the chemical composition of the ash include slagging, fouling, sintering, and corrosion. Ash
forming elements are shown in Table 3-11. From Table 3-10 it can be seen that compared to
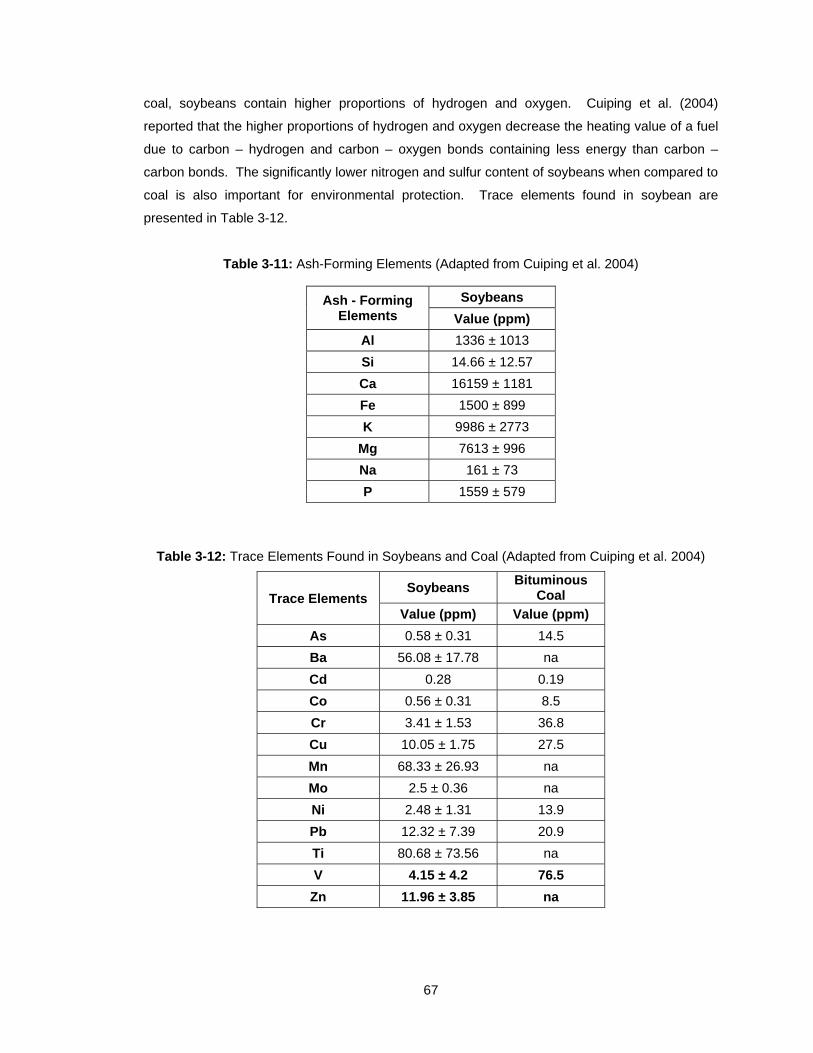
67
coal, soybeans contain higher proportions of hydrogen and oxygen. Cuiping et al. (2004)
reported that the higher proportions of hydrogen and oxygen decrease the heating value of a fuel
due to carbon – hydrogen and carbon – oxygen bonds containing less energy than carbon –
carbon bonds. The significantly lower nitrogen and sulfur content of soybeans when compared to
coal is also important for environmental protection. Trace elements found in soybean are
presented in Table 3-12.
Table 3-11: Ash-Forming Elements (Adapted from Cuiping et al. 2004)
Ash - Forming Elements
Soybeans
Value (ppm)
Al 1336 ± 1013
Si 14.66 ± 12.57
Ca 16159 ± 1181
Fe 1500 ± 899
K 9986 ± 2773
Mg 7613 ± 996
Na 161 ± 73
P 1559 ± 579
Table 3-12: Trace Elements Found in Soybeans and Coal (Adapted from Cuiping et al. 2004)
Trace Elements Soybeans
Bituminous Coal
Value (ppm) Value (ppm)
As 0.58 ± 0.31 14.5
Ba 56.08 ± 17.78 na
Cd 0.28 0.19
Co 0.56 ± 0.31 8.5
Cr 3.41 ± 1.53 36.8
Cu 10.05 ± 1.75 27.5
Mn 68.33 ± 26.93 na
Mo 2.5 ± 0.36 na
Ni 2.48 ± 1.31 13.9
Pb 12.32 ± 7.39 20.9
Ti 80.68 ± 73.56 na
V 4.15 ± 4.2 76.5
Zn 11.96 ± 3.85 na
68
3.5 EMISSIONS
The cement industry follows guidelines set by local, state, and federal agencies to minimize its
environmental impact (Greer et al. 2004). Harmful pollutants emitted into the atmosphere can be
transferred directly to humans through air inhalation as well as indirectly through pathways such
as drinking water, skin absorption, and contaminated food (Conesa et al. 2008; Schuhmacher et
al. 2004). The dominate types of emissions formed during the manufacture of cement are
particulate matter (PM), produced from the acquisition and preparation of raw materials, and
gaseous pollutants, produced during the pyroprocess. The formation and control of particulate
matter is discussed in more detail in latter sections. Jackson (1998) reported that a cement
facility producing 1 million tons of cement a year will also produce approximately 1.5 billion cubic
meters of gasses. These gaseous pollutants include carbon dioxide (CO2), nitrogen and sulfur
oxides (NOx, SOx), volatile organic compounds (VOCs), metals, and other minor pollutants (Greer
et al. 2004; Schuhmacher et al. 2004). The quantity and composition of emissions for a particular
cement plant are determined by a combination of the physical and chemical properties of the raw
materials and fuels as well as the kiln type and configuration.
Air pollution control devices (APCD) are used to control the harmful emissions from the
kiln. The most common being electrostatic precipitators (ESP), which are closely spaced,
positively charged plates paired with negatively charged woven wires in between the plates. The
wires ionize the stack gases, which in turn causes the dust particles in the gas to become
negatively charged and stick to the plates. Periodically the plates are cleaned and the waste
particles disposed of (Jackson 1998).
Using alternative fuels not only can lower emissions and free space in landfills, but some
plants in the United States are reimbursed to take waste. In some cases this revenue offsets the
remaining costs of the conventional fuels (Hendrik and Padovani 2003). Cement kilns incinerate
waste materials more efficiently, and emit less harmful emissions while producing a final product
when compared to a typical waste incinerator that has no final product, burns at a lower
temperature, and uses fossils fuels merely to free landfill space. Although the economics of using
an alternative fuel can be easily justified, before use, the fuel’s environmental effects must also
be considered along with its effect on cement quality. The following sections will discuss the
primary emission components as they pertain to the scope of this project.
3.5.1 Carbon Emissions
The carbon emissions that the cement industry and environmental agencies are most concerned
with are carbon monoxide (CO) and carbon dioxide (CO2). As previously mentioned, CO2 is the
primary agent responsible for the “greenhouse effect,” and is therefore monitored by
environmental agencies around the world. Carbon credits are rewarded to companies that do not
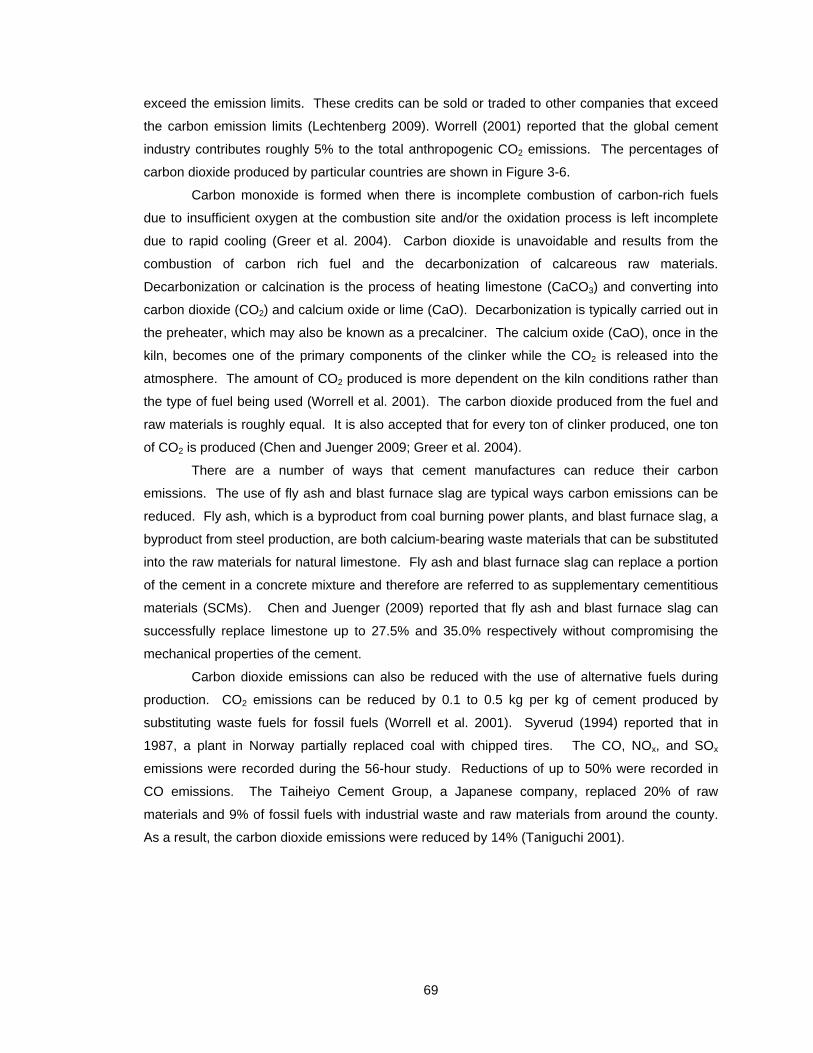
69
exceed the emission limits. These credits can be sold or traded to other companies that exceed
the carbon emission limits (Lechtenberg 2009). Worrell (2001) reported that the global cement
industry contributes roughly 5% to the total anthropogenic CO2 emissions. The percentages of
carbon dioxide produced by particular countries are shown in Figure 3-6.
Carbon monoxide is formed when there is incomplete combustion of carbon-rich fuels
due to insufficient oxygen at the combustion site and/or the oxidation process is left incomplete
due to rapid cooling (Greer et al. 2004). Carbon dioxide is unavoidable and results from the
combustion of carbon rich fuel and the decarbonization of calcareous raw materials.
Decarbonization or calcination is the process of heating limestone (CaCO3) and converting into
carbon dioxide (CO2) and calcium oxide or lime (CaO). Decarbonization is typically carried out in
the preheater, which may also be known as a precalciner. The calcium oxide (CaO), once in the
kiln, becomes one of the primary components of the clinker while the CO2 is released into the
atmosphere. The amount of CO2 produced is more dependent on the kiln conditions rather than
the type of fuel being used (Worrell et al. 2001). The carbon dioxide produced from the fuel and
raw materials is roughly equal. It is also accepted that for every ton of clinker produced, one ton
of CO2 is produced (Chen and Juenger 2009; Greer et al. 2004).
There are a number of ways that cement manufactures can reduce their carbon
emissions. The use of fly ash and blast furnace slag are typical ways carbon emissions can be
reduced. Fly ash, which is a byproduct from coal burning power plants, and blast furnace slag, a
byproduct from steel production, are both calcium-bearing waste materials that can be substituted
into the raw materials for natural limestone. Fly ash and blast furnace slag can replace a portion
of the cement in a concrete mixture and therefore are referred to as supplementary cementitious
materials (SCMs). Chen and Juenger (2009) reported that fly ash and blast furnace slag can
successfully replace limestone up to 27.5% and 35.0% respectively without compromising the
mechanical properties of the cement.
Carbon dioxide emissions can also be reduced with the use of alternative fuels during
production. CO2 emissions can be reduced by 0.1 to 0.5 kg per kg of cement produced by
substituting waste fuels for fossil fuels (Worrell et al. 2001). Syverud (1994) reported that in
1987, a plant in Norway partially replaced coal with chipped tires. The CO, NOx, and SOx
emissions were recorded during the 56-hour study. Reductions of up to 50% were recorded in
CO emissions. The Taiheiyo Cement Group, a Japanese company, replaced 20% of raw
materials and 9% of fossil fuels with industrial waste and raw materials from around the county.
As a result, the carbon dioxide emissions were reduced by 14% (Taniguchi 2001).
70
Figure 3-6: Share of Carbon Emissions from Global Cement Production
(Worrell et al. 2001)
3.5.2 Nitrogen Oxide Emissions
Nitrogen oxides (NOx) are a family of nitrogen-based compounds that are formed through
nitrogen oxidation from the combustion of fuels and raw materials in the presence of atmospheric
air (Greco et al. 2004; Walters et al. 1999). Nitrogen oxide (NO) and Nitrogen dioxide (NO2) are
the two most common forms of NOx and comprise roughly 90% and 10% of NOx respectively
(Greer 2004). Once nitrogen oxide is formed, it is quickly oxidized again to form nitrogen dioxide.
Naik (2005) reported that for every ton of cement produced, 1.5 to 10 kg of NOx is emitted into the
atmosphere. The fuel type, feed rate, air flow, and kiln temperatures influence the quantity of
emissions. In order to accurately document NOx emissions, several measurements over closely
spaced time intervals are needed.
Nitrogen oxides are formed through four mechanisms: thermal, fuel, feed, and prompt
(Greco et al. 2004; Hendrik and Padovani 2003). Thermal NOx makes up around 70% of the total
NOx that occurs when the atmospheric nitrogen begins to oxidize around temperatures of
1200°C. Rapid formation starts to occur at slightly hotter temperatures of 1600°C (Hendrik and
Padovani 2003). Thermal NOx forms around the main burner in the sinistering zone and the
amount of thermal NOx formed primarily depends on the amount of available oxygen.
71
Fuel NOx is formed from the oxidation of nitrogen within fuels such as coal during
combustion. Fuel NOx forms at any temperature above the ignition temperature of the fuel. Due
to the lower temperatures in the precalciner, the oxidation temperature of thermal NOx has not
been reached. Therefore, fuel NOx is more prevalent at this location (Greco et al. 2004; Hendrik
and Padovani 2003). On the other hand, the quantity of nitrogen is much more prevalent in the
atmosphere than in fuel which means that in the sinistering zone thermal NOx dominates. As
mentioned above, the contribution of fuel NOx is relatively small compared to thermal NOx.
However, Greer (1986) reported that if all other factors controlling NOx formation are held
constant, the total amount to NOx can be altered by controlling the nitrogen content in the fuel.
Feed NOx is formed when the nitrogen that is chemically attached to the feed is released
and oxidized. Greco et al. (2004) reported that feed NOx has only been generated in a laboratory
by slowly heating raw materials to 300-800°C in the presence of oxygen. Older technology, such
as wet and long dry kilns may exhibit an increase in feed NOx because of the slow temperature
rise of the raw material (Greco et al. 2004; Hendrik and Padovani 2003). Feed NOx has a
minimal impact on total NOx production in the kiln due to the small quantities of the nitrogen
present in the feed.
Finally, prompt NOx refers to NO that is formed in excess of what is expected from
thermal NOx and is generated from fuel derived radicals, a fuel rich flame and elemental nitrogen
(Greer et al. 2004; Hendrik and Padovani 2003). Similar to feed NOx, prompt NOx are considered
minor contributors to total NOx generation.
Although 70% of NOx consist of nitrogen oxide, according to Greer (2004), the
predominate “environmental evil” is nitrogen dioxide. Nitrogen dioxide creates two main
problems. When nitrogen dioxide is mixed with water, nitrous acid (HNO2) and nitric acid (HNO3)
are formed. The result of these highly corrosive acids is acid rain, which is the main contributor to
building and vegetation destruction (Greco 2004). Smog, an atmospheric pollutant, is the
resultant of a photochemical reaction between nitrogen dioxide, hydrocarbons, and solar
radiation. On November 7, 1997, the Environmental Protection Agency instated a law requiring
up to 70% reductions of mass NOx emissions that would apply to cement plants in 22 states. An
emission credit system similar to carbon emission credits was also instated (Walters et al. 1999).
The majority of NOx produced in cement kilns comes from thermal NOx. The use of
alternative fuels cannot significantly change its concentration in either direction. Fuel NOx,
however, can be controlled by the use of fuels low in nitrogen concentrations. The study
conducted by Prisciandaro et al. (2003) shows and increase in NOx emissions in Plant 1, and a
decrease in NOx emission at Plant 2, as shown in Figure 3-7. Chipped tires were utilized to
partially replace coal in the study conducted by Syverud (1994). NOx emissions were reduced by
45%.
72
3.5.3 Sulfur Oxide Emissions
In cement manufacturing, sulfur oxides (SOx) are formed from the combustion of sulfur bearing
compounds in the fuels and raw materials (Hendrik and Padovani 2003). The most prevalent SOx
in the cement industry are sulfur dioxide (SO2) and sulfur trioxide (SO3), which begin to form at a
temperature range of 300 to 600 °C (Greer et al. 2004; PCA 2009). SO2 is more abundant than
SO3 because it forms at higher temperatures (Greco et al. 2004). Sulfur dioxide is a colorless
gas with a strong odor that can be harmful to the respiratory tract of humans and damage
vegetation (Greco et al. 2004; Greer 1986). Sulfur dioxide, when combined with water forms
sulfuric acid (H2SO4) rain (Greco et al. 2004).
Although the amount of SOx production varies from plant to plant, a large measure, more
than 50 to 90% is absorbed by the kiln feed, clinker, cement kiln dust, or left in the kiln as a
coating that helps preserve the brink lining (Greer 1986; Hendrik and Padovani 2003). The
clinkering process removes the majority of the SOx build up on the inside of the kiln. This is
beneficial to the cement producer because less gypsum can be added later during clinker
grinding. If excessive SOx buildup accumulates on the inside of the kiln, blockages can impede
material movement causing kiln shutdowns (Hendrik and Padovani 2003).
During the 56-hour trial Syverud (1994) mentioned earlier, chipped tires were used as an
alternative fuel to partially replace coal. Over the 56-hour period, the SO2 levels dropped 25%.
However, the plant experienced operational problems from the rapid increase in SO3 levels that
caused build-up and the smell of sulfur in the preheater.
3.5.4 Other Problematic Emissions
Many other compounds may be created in the kiln system and emitted into the atmosphere in
addition to the three predominate emission types previously discussed. There is a lack of
literature directly relating alternative fuels and emissions of these compounds, so a brief
discussion of their formation and potential dangers will be presented in the following sections.
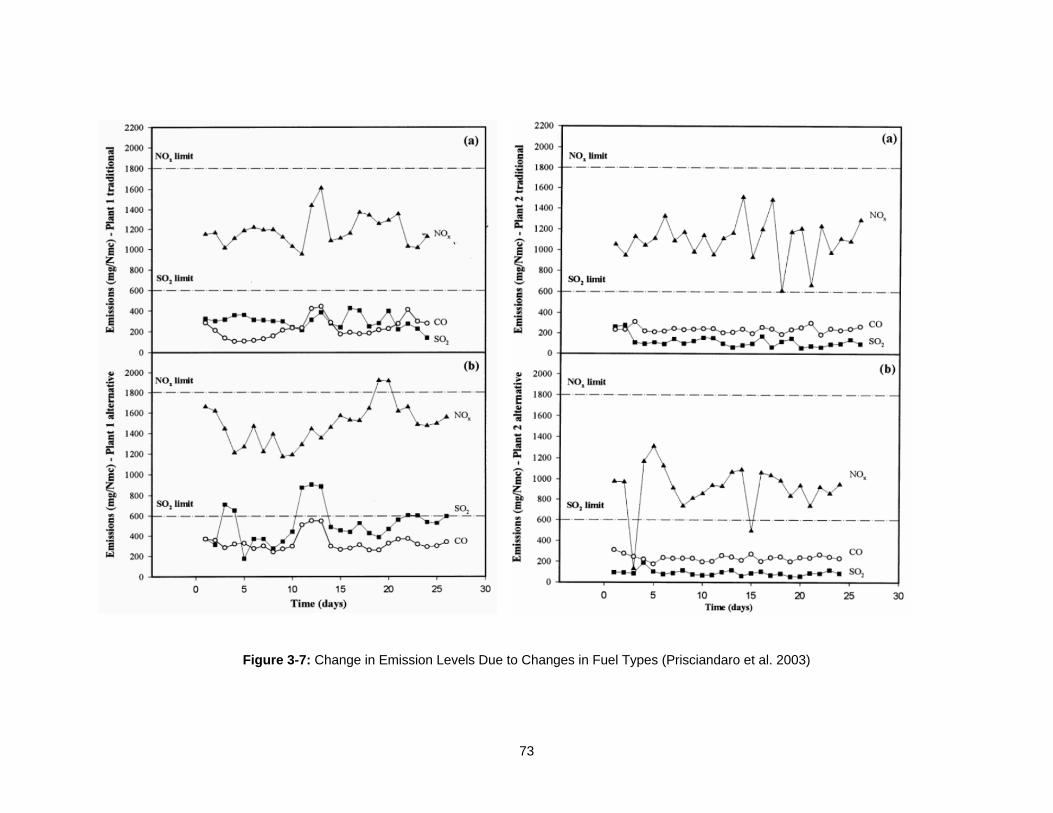
73
Figure 3-7: Change in Emission Levels Due to Changes in Fuel Types (Prisciandaro et al. 2003)
74
3.5.4.1 Dioxins and Furans
Polychlorinated dibenzodioxins (dioxins) and polychlorinated dibenzofurans (furans) are
byproducts from the combustion of organic compounds mainly found in the raw materials.
Dioxins and furans will be denoted PCDD and PCDF respectively hereafter. PCDD and PCDF
are considered unintentional persistent organic pollutants (POPs) and measures were taken to
minimize these pollutants by the Cement Sustainability Initiative (CSI) (Loo 2007). PCDD and
PCDF form between 290-790°C with the latter forming at a temperature greater than 700°C
(Bech and Mishulovich 2004). These temperatures concentrate the formation of PCDD/PCDF to
the preheater zone and post preheater zone, which includes the particulate matter control device
(PMCD). Karstensen (2008) reported that temperatures in the preheater and post preheater
zones range from 850-1250°C and 250-290°C respectively. The control of PCDD/PCDF
emissions is possible and can be reduced if the number of stages in the preheater is increased,
thus reducing the flu gas temperature below the formation threshold of 260°C (Bech and
Mishulovich 2004). According to Conesa et al. (2008) and others, the type of fuel used does not
significantly impact the amount of PCDD or PCDF formed in the preheater or post preheater (Loo
2008, Karstensen 2008).
Dioxins and furans are transported to humans through the food chain as well as dermal
absorption and inhalation (Kirk 2000). PCDD/PCDF are a known animal carcinogen and
probable human carcinogen. Once ingested, short term effects of PCDD/PCDF can include
allergic dermatitis, eye irritation, and gastrointestinal disturbances. Long term effects include liver
and kidney damage and reproductive affects (Kirk 2000).
3.5.4.2 Metals
Metals are present in small concentrations in both fuels and raw materials used during the
production of cement (Schuhmacher et al. 2004). Metals that are not adsorbed into the clinker are
either collected by particulate matter control devices with the cement kiln dust or emitted to the
atmosphere through stack emissions (Conesa et al. 2008). The toxicity of some heavy metals in
stack emissions raises concern for public heath. Three classes of metals were formed to
differentiate between their toxicity levels. The classes are as follows:
Class I: Cadmium (Cd), Mercury (Hg), Titanium (Ti)
Class II: Arsenic (As), Cobalt (Co), Nickel (Ni), Selenium (Se),
Tellurium (Te)
Class III: Lead (Pb), Cromium (Cr), Copper (Cu), Platinum (Pt), Vanadium (V),
Tin (Sn), Palladium (Pd), Antimony (Sb), Manganese (Mn), Rhodium
(Rh)
75
Class I contains the metals that are most toxic and Class III contains the least toxic. The volatility
of the metals is determined by their behavior in the kiln and how they exit the kiln. The majority of
the metals are carried out by the clinker, but metals such as mercury is of concern because it
remains volatile, cannot be controlled by dedusting, and exits the kiln in a vaporous form (Conesa
et al. 2008). Conditioning alternative fuels by removing metals that could disrupt the mechanical
operation or cause environmental concerns is necessary and considered a method for reducing
metallic emissions (Bhatty 2004).
3.5.4.3 Particulate Matter and Cement Kiln Dust (CKD)
Particulate matter is created throughout the entire process of cement manufacturing. Grinding,
crushing, and pyroprocessing create particles that range from 1-100 μm in diameter (Richards
2004). To add perspective to size, a human hair’s diameter is roughly 50 μm (Richards 2004).
The dividing line between coarse and fine particles is 10 μm (PM10). The former can cause
respiratory problems due to the potentially toxic concentrations of metals and other compounds,
while coarse particles tend not to cause health concerns and are considered merely a public
nuisance (Hendrik and Padovani 2003). In 1997 the Environmental Protection Agency (EPA)
revised the National Ambient Air Quality Standard to include a 50% cut point for particulate matter
with diameters less than 2.5 μm (PM2.5). The EPA deemed that particles of this size are of
greater concern because they can efficiently penetrate deeply into the respiratory track (Richards
2004).
Particulate matter control device (PMCD) is any device such as a fabric filter or
electrostatic precipitators (ESP) used to collect cement kiln dust (CKD). Today, these filters are
quite efficient and have the ability to collect upwards of 99% of CKD (Hendrik and Padovani
2003). Since the captured CKD is nearly identical chemically to the kiln feed, rerouting it from the
baghouse to the kiln reduces energy and material costs (Hendrik and Padovani 2003).
Cement kiln dust is a loosely labeled material referring to the unburned and partially
burned particles from the kiln feed, clinker and interior lining of the kiln (Hendrik and Padovani
2003). The particle size and chemistry greatly vary depending on the raw materials, fuel,
pyroprocessing type, and equipment layout (Hawkins et al. 2004). Cement kiln dust is typically
collected by fabric filters and electrostatic precipitators (ESP) from stack emissions, alkali bypass
systems and clinker coolers (Hendrik and Padovani 2003). The majority, if not 100% of CKD, is
typically recycled back into the kiln feed unless the alkali or sulfur contents are excessively high.
In this case, the CKD is used for other purposes that are discussed later or landfilled (Hawkins et
al. 2004).
Although there is not much information on total quantities of CKD produced by cement
plants, the Portland Cement Association (PCA) conducted several decade-long U.S. industry-
wide surveys to follow the production and disposition of CKD. Hawkins et al. (2004) reported that
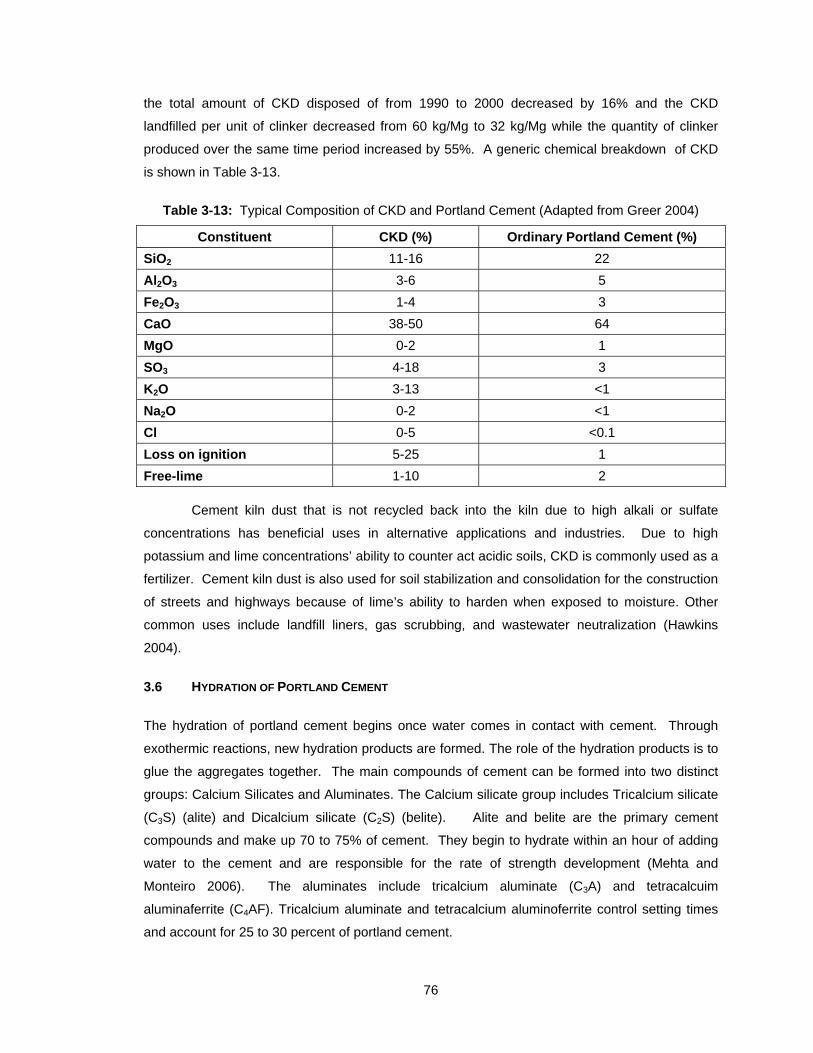
76
the total amount of CKD disposed of from 1990 to 2000 decreased by 16% and the CKD
landfilled per unit of clinker decreased from 60 kg/Mg to 32 kg/Mg while the quantity of clinker
produced over the same time period increased by 55%. A generic chemical breakdown of CKD
is shown in Table 3-13.
Table 3-13: Typical Composition of CKD and Portland Cement (Adapted from Greer 2004)
Constituent CKD (%) Ordinary Portland Cement (%)
SiO2 11-16 22
Al2O3 3-6 5
Fe2O3 1-4 3
CaO 38-50 64
MgO 0-2 1
SO3 4-18 3
K2O 3-13 <1
Na2O 0-2 <1
Cl 0-5 <0.1
Loss on ignition 5-25 1
Free-lime 1-10 2
Cement kiln dust that is not recycled back into the kiln due to high alkali or sulfate
concentrations has beneficial uses in alternative applications and industries. Due to high
potassium and lime concentrations’ ability to counter act acidic soils, CKD is commonly used as a
fertilizer. Cement kiln dust is also used for soil stabilization and consolidation for the construction
of streets and highways because of lime’s ability to harden when exposed to moisture. Other
common uses include landfill liners, gas scrubbing, and wastewater neutralization (Hawkins
2004).
3.6 HYDRATION OF PORTLAND CEMENT
The hydration of portland cement begins once water comes in contact with cement. Through
exothermic reactions, new hydration products are formed. The role of the hydration products is to
glue the aggregates together. The main compounds of cement can be formed into two distinct
groups: Calcium Silicates and Aluminates. The Calcium silicate group includes Tricalcium silicate
(C3S) (alite) and Dicalcium silicate (C2S) (belite). Alite and belite are the primary cement
compounds and make up 70 to 75% of cement. They begin to hydrate within an hour of adding
water to the cement and are responsible for the rate of strength development (Mehta and
Monteiro 2006). The aluminates include tricalcium aluminate (C3A) and tetracalcuim
aluminaferrite (C4AF). Tricalcium aluminate and tetracalcium aluminoferrite control setting times
and account for 25 to 30 percent of portland cement.
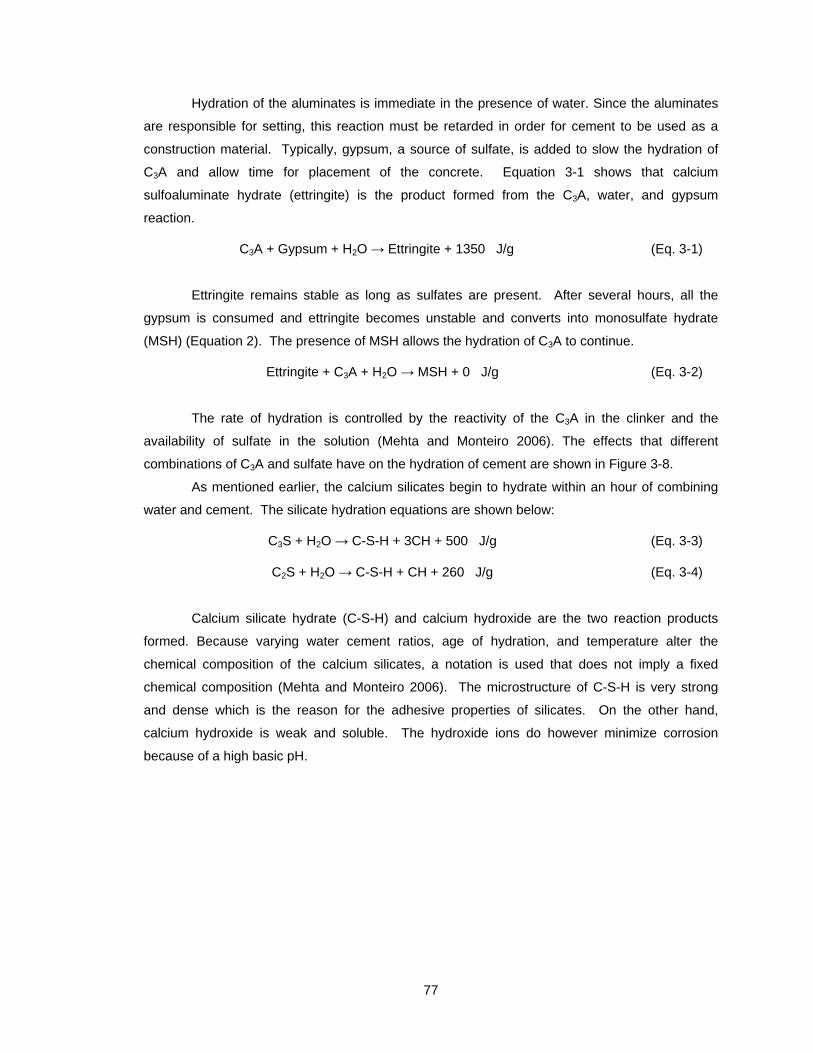
77
Hydration of the aluminates is immediate in the presence of water. Since the aluminates
are responsible for setting, this reaction must be retarded in order for cement to be used as a
construction material. Typically, gypsum, a source of sulfate, is added to slow the hydration of
C3A and allow time for placement of the concrete. Equation 3-1 shows that calcium
sulfoaluminate hydrate (ettringite) is the product formed from the C3A, water, and gypsum
reaction.
C3A + Gypsum + H2O → Ettringite + 1350 J/g (Eq. 3-1)
Ettringite remains stable as long as sulfates are present. After several hours, all the
gypsum is consumed and ettringite becomes unstable and converts into monosulfate hydrate
(MSH) (Equation 2). The presence of MSH allows the hydration of C3A to continue.
Ettringite + C3A + H2O → MSH + 0 J/g (Eq. 3-2)
The rate of hydration is controlled by the reactivity of the C3A in the clinker and the
availability of sulfate in the solution (Mehta and Monteiro 2006). The effects that different
combinations of C3A and sulfate have on the hydration of cement are shown in Figure 3-8.
As mentioned earlier, the calcium silicates begin to hydrate within an hour of combining
water and cement. The silicate hydration equations are shown below:
C3S + H2O → C-S-H + 3CH + 500 J/g (Eq. 3-3)
C2S + H2O → C-S-H + CH + 260 J/g (Eq. 3-4)
Calcium silicate hydrate (C-S-H) and calcium hydroxide are the two reaction products
formed. Because varying water cement ratios, age of hydration, and temperature alter the
chemical composition of the calcium silicates, a notation is used that does not imply a fixed
chemical composition (Mehta and Monteiro 2006). The microstructure of C-S-H is very strong
and dense which is the reason for the adhesive properties of silicates. On the other hand,
calcium hydroxide is weak and soluble. The hydroxide ions do however minimize corrosion
because of a high basic pH.
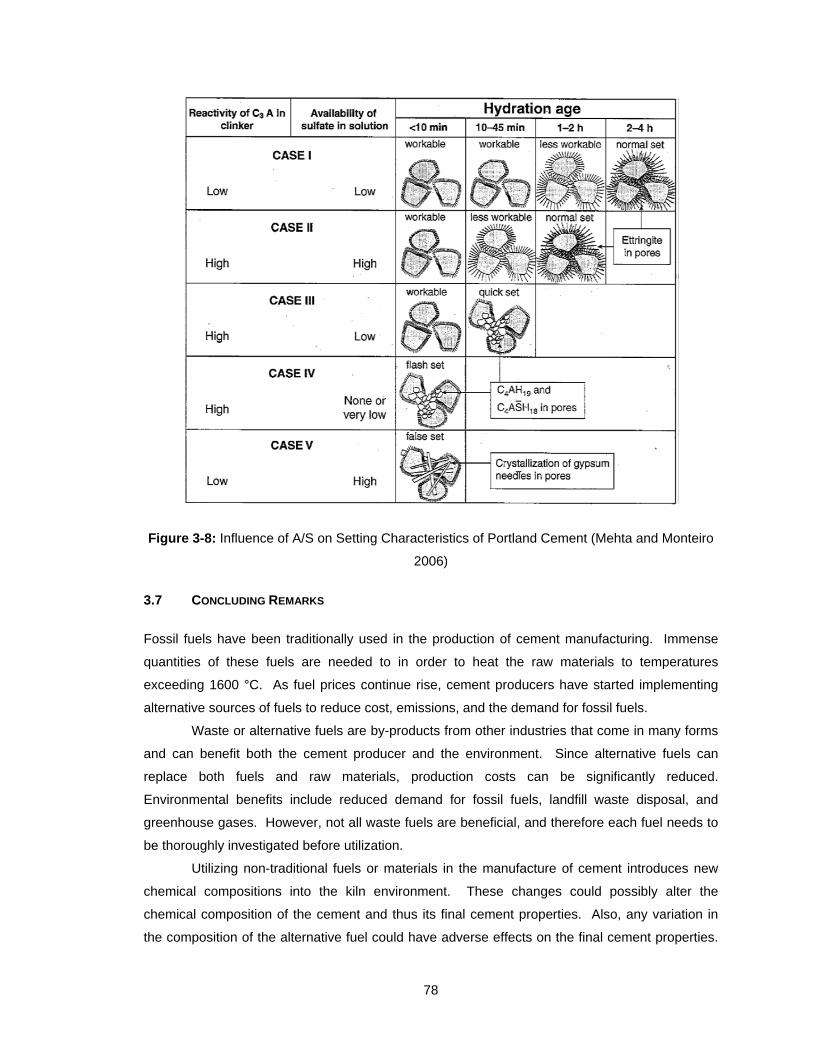
78
Figure 3-8: Influence of A/S on Setting Characteristics of Portland Cement (Mehta and Monteiro
2006)
3.7 CONCLUDING REMARKS
Fossil fuels have been traditionally used in the production of cement manufacturing. Immense
quantities of these fuels are needed to in order to heat the raw materials to temperatures
exceeding 1600 °C. As fuel prices continue rise, cement producers have started implementing
alternative sources of fuels to reduce cost, emissions, and the demand for fossil fuels.
Waste or alternative fuels are by-products from other industries that come in many forms
and can benefit both the cement producer and the environment. Since alternative fuels can
replace both fuels and raw materials, production costs can be significantly reduced.
Environmental benefits include reduced demand for fossil fuels, landfill waste disposal, and
greenhouse gases. However, not all waste fuels are beneficial, and therefore each fuel needs to
be thoroughly investigated before utilization.
Utilizing non-traditional fuels or materials in the manufacture of cement introduces new
chemical compositions into the kiln environment. These changes could possibly alter the
chemical composition of the cement and thus its final cement properties. Also, any variation in
the composition of the alternative fuel could have adverse effects on the final cement properties.
79
If successfully utilizing alternative fuels, the final composition of the cement would be a near
match to cement produced with traditional fuels.
Emissions are heavily dependent on the fuels used during production. In the transition
from fossil fuels to waste fuels, harmful gases produced in the pyroprocess can be reduced.
Testing emissions produced by alternative fuels allows limits to be determined for feasible
replacement rates as well as environmental protection. Emissions must also be continuously
monitored throughout production to ensure environmental limitations are not exceeded.
Every alternative fuel produces a unique effect on the production of cement and final
product. Effects can also differ between cement facilities. The geographical location of the
cement plant, availability of fuel alternatives, and plant modification costs are considerations that
must be addressed prior to implementing any fuel. Informed use of alternative fuels can benefit
not only the manufacturer, but the rest of society.
80
CHAPTER 4
PART 2—EXPERIMENTAL PLAN
4.1 INTRODUCTION
The production of portland cement is a complex process involving many systems and materials
working in synchronization. The objective of this part of the study was to determine if the partial
replacement of a traditional fuel by an alternative fuel affects the manufacture and/or the cement
performance.
In this study, traditional and alternative fuels were used simultaneously to produce
portland cement. Two of the three alternative fuels tested were fired continuously over a 3-4 day
period. The third fuel was fired over a 6-day period with the replacement rate of the alternative
fuel increasing every two days. Lafarge North America’s Roberta cement plant, a full-scale
cement manufacturing facility in Calera, Alabama, conducted the trial burns. The cement plant
conducted four separate trials, or burns, with each burn utilizing a different alternative fuel. A
short description of each burn is provided below. Note that there are three trial burns and one
baseline burn. “B” denotes the baseline burn with the remaining letters serving as an acronym for
the fuel utilized.
1. B-CP – Coal (C) and plastics (P) were the fuels utilized during this burn period. This
was the baseline burn to serve as reference for the construction and demolition
(C&D), variable feed wood chips (VF), and soybean seed (Soy) trial burns shown
below. This was a 72-hour continuous burn that took place in June of 2010. A
sample of the waste plastic blend is shown in Figure 4-1.
2. C&D – Coal (C), plastics (P), and construction and demolition waste (C&D) were the
fuels utilized during this trial burn. The types of wood utilized include dimensional
lumber, plywood, and pallets. The paper included corrugated boxes and
miscellaneous paper materials. The plastic consisted of solid and cellular foam and
polyethylene film. This was an 80-hour continuous burn that took place in June of
2010. A sample of the construction and demolition waste is shown in Figure 4-2.
3. VF – Coal (C), plastics (P), and variable feed (VF) woodchips were the fuels utilized
during this trial burn. This was a 148-hour, continuous burn that took place in July of
2010. This trial was broken into three phases, each representing an increased
substitution percentage of wood chips. The phases are denoted according to their
substitution rates as follows: VF 5%, VF 10%, VF15%. A sample of woodchips is
shown in Figure 4-3.
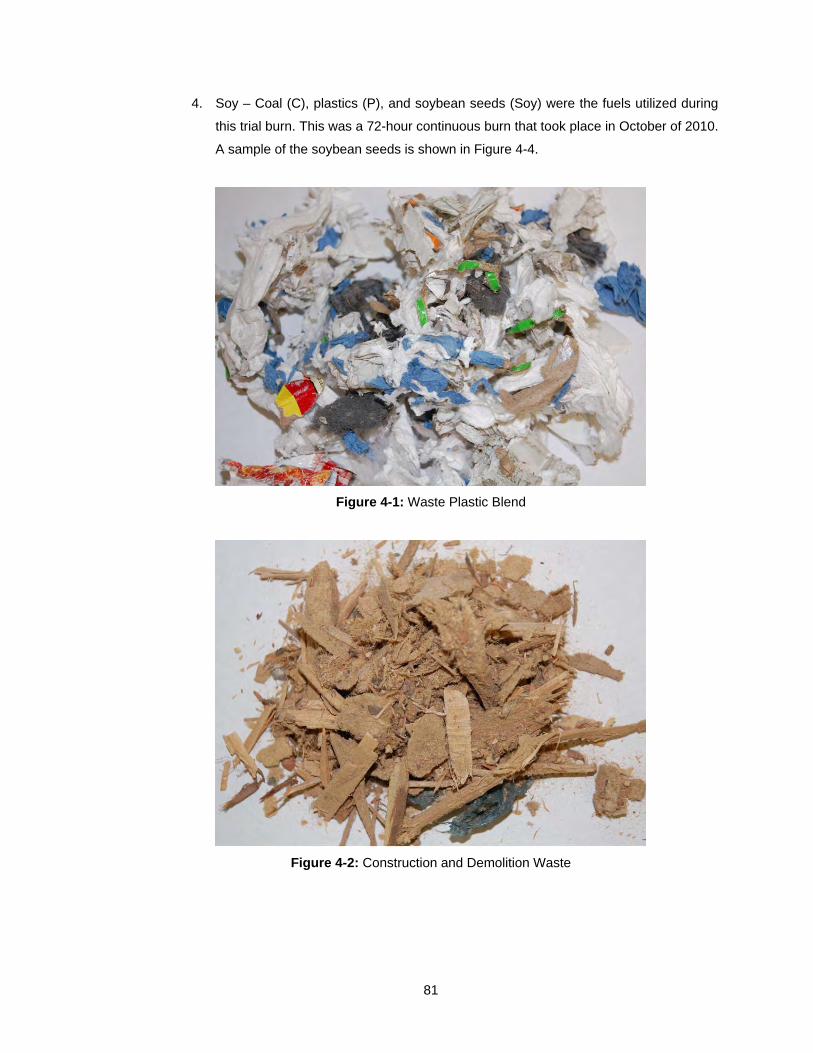
81
4. Soy – Coal (C), plastics (P), and soybean seeds (Soy) were the fuels utilized during
this trial burn. This was a 72-hour continuous burn that took place in October of 2010.
A sample of the soybean seeds is shown in Figure 4-4.
Figure 4-1: Waste Plastic Blend
Figure 4-2: Construction and Demolition Waste
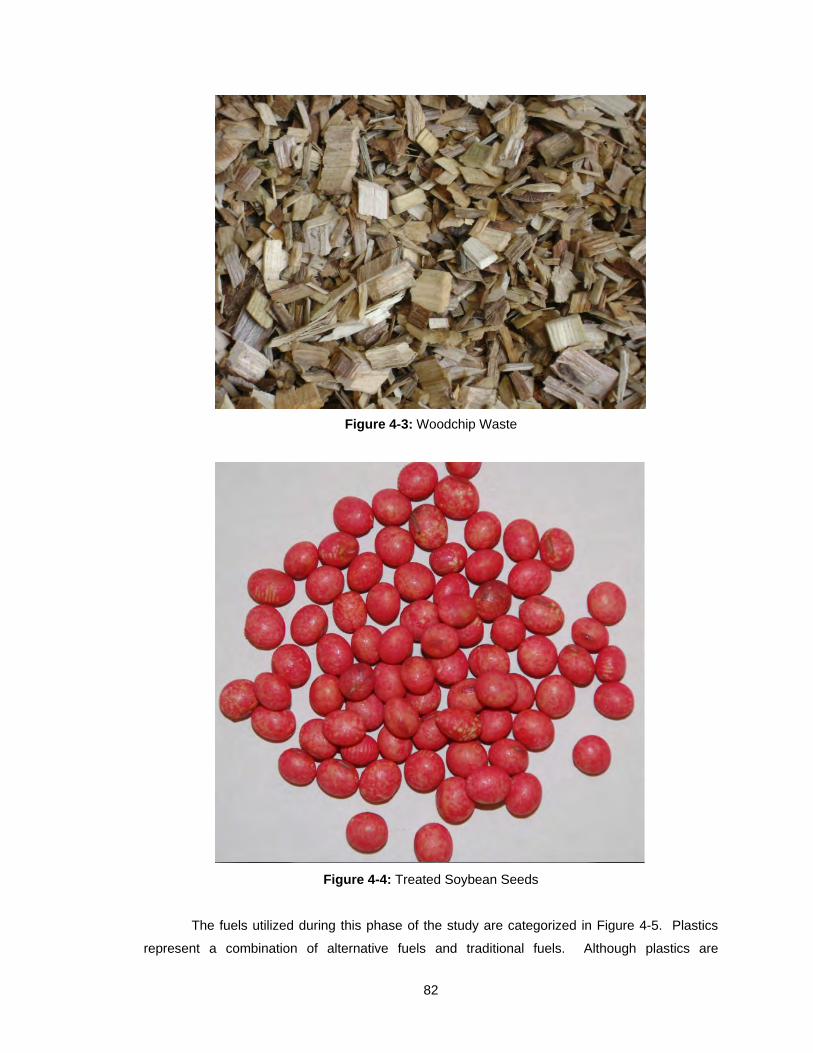
82
Figure 4-3: Woodchip Waste
Figure 4-4: Treated Soybean Seeds
The fuels utilized during this phase of the study are categorized in Figure 4-5. Plastics
represent a combination of alternative fuels and traditional fuels. Although plastics are
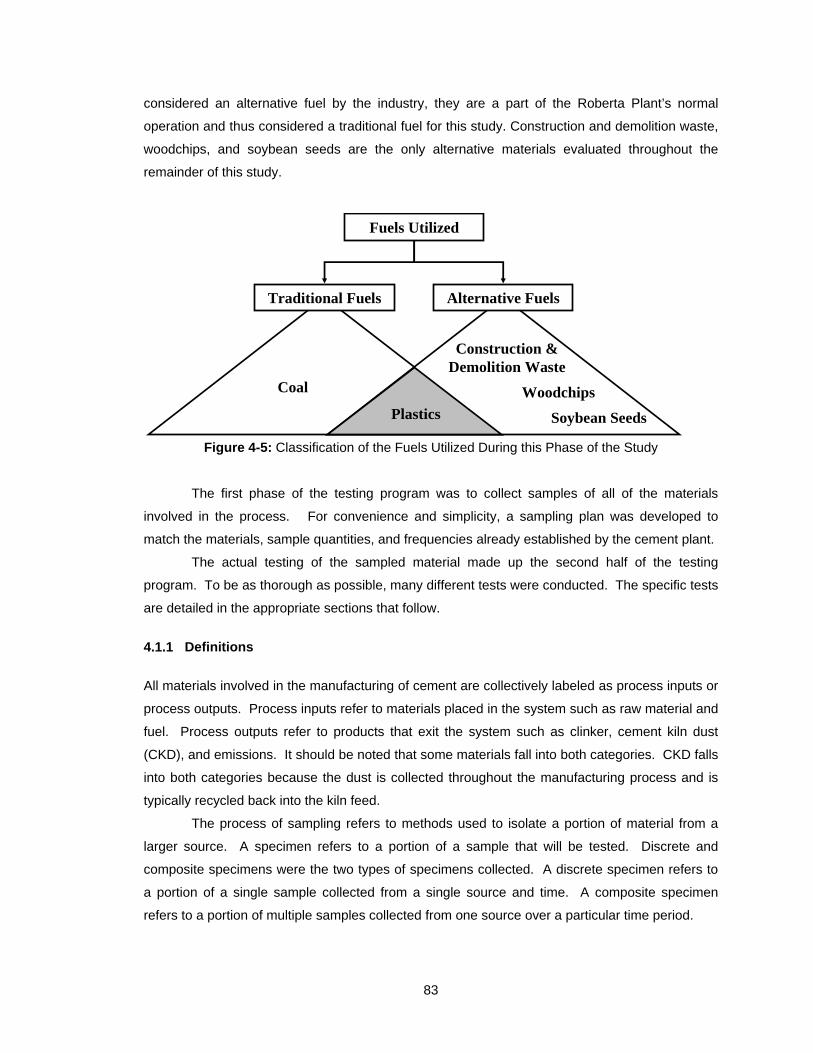
83
considered an alternative fuel by the industry, they are a part of the Roberta Plant’s normal
operation and thus considered a traditional fuel for this study. Construction and demolition waste,
woodchips, and soybean seeds are the only alternative materials evaluated throughout the
remainder of this study.
Figure 4-5: Classification of the Fuels Utilized During this Phase of the Study
The first phase of the testing program was to collect samples of all of the materials
involved in the process. For convenience and simplicity, a sampling plan was developed to
match the materials, sample quantities, and frequencies already established by the cement plant.
The actual testing of the sampled material made up the second half of the testing
program. To be as thorough as possible, many different tests were conducted. The specific tests
are detailed in the appropriate sections that follow.
4.1.1 Definitions
All materials involved in the manufacturing of cement are collectively labeled as process inputs or
process outputs. Process inputs refer to materials placed in the system such as raw material and
fuel. Process outputs refer to products that exit the system such as clinker, cement kiln dust
(CKD), and emissions. It should be noted that some materials fall into both categories. CKD falls
into both categories because the dust is collected throughout the manufacturing process and is
typically recycled back into the kiln feed.
The process of sampling refers to methods used to isolate a portion of material from a
larger source. A specimen refers to a portion of a sample that will be tested. Discrete and
composite specimens were the two types of specimens collected. A discrete specimen refers to
a portion of a single sample collected from a single source and time. A composite specimen
refers to a portion of multiple samples collected from one source over a particular time period.
Plastics
Coal
Construction & Demolition Waste
Woodchips
Soybean Seeds
Fuels Utilized
Traditional Fuels Alternative Fuels
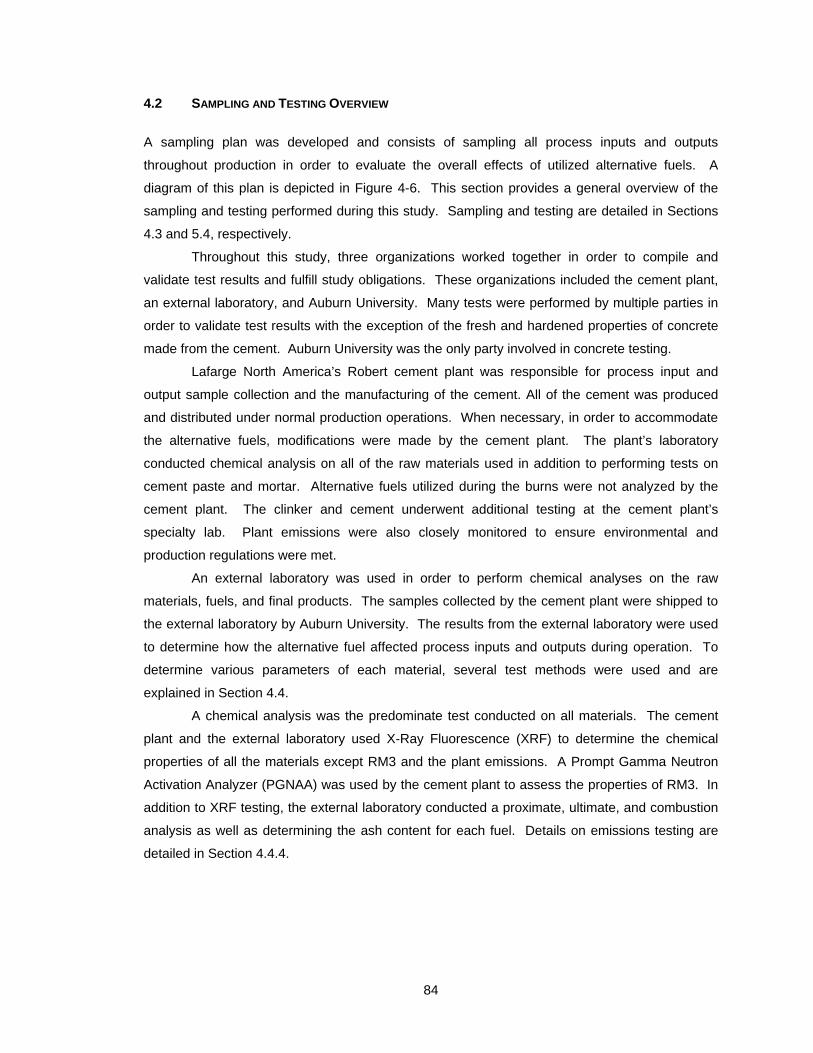
84
4.2 SAMPLING AND TESTING OVERVIEW
A sampling plan was developed and consists of sampling all process inputs and outputs
throughout production in order to evaluate the overall effects of utilized alternative fuels. A
diagram of this plan is depicted in Figure 4-6. This section provides a general overview of the
sampling and testing performed during this study. Sampling and testing are detailed in Sections
4.3 and 5.4, respectively.
Throughout this study, three organizations worked together in order to compile and
validate test results and fulfill study obligations. These organizations included the cement plant,
an external laboratory, and Auburn University. Many tests were performed by multiple parties in
order to validate test results with the exception of the fresh and hardened properties of concrete
made from the cement. Auburn University was the only party involved in concrete testing.
Lafarge North America’s Robert cement plant was responsible for process input and
output sample collection and the manufacturing of the cement. All of the cement was produced
and distributed under normal production operations. When necessary, in order to accommodate
the alternative fuels, modifications were made by the cement plant. The plant’s laboratory
conducted chemical analysis on all of the raw materials used in addition to performing tests on
cement paste and mortar. Alternative fuels utilized during the burns were not analyzed by the
cement plant. The clinker and cement underwent additional testing at the cement plant’s
specialty lab. Plant emissions were also closely monitored to ensure environmental and
production regulations were met.
An external laboratory was used in order to perform chemical analyses on the raw
materials, fuels, and final products. The samples collected by the cement plant were shipped to
the external laboratory by Auburn University. The results from the external laboratory were used
to determine how the alternative fuel affected process inputs and outputs during operation. To
determine various parameters of each material, several test methods were used and are
explained in Section 4.4.
A chemical analysis was the predominate test conducted on all materials. The cement
plant and the external laboratory used X-Ray Fluorescence (XRF) to determine the chemical
properties of all the materials except RM3 and the plant emissions. A Prompt Gamma Neutron
Activation Analyzer (PGNAA) was used by the cement plant to assess the properties of RM3. In
addition to XRF testing, the external laboratory conducted a proximate, ultimate, and combustion
analysis as well as determining the ash content for each fuel. Details on emissions testing are
detailed in Section 4.4.4.
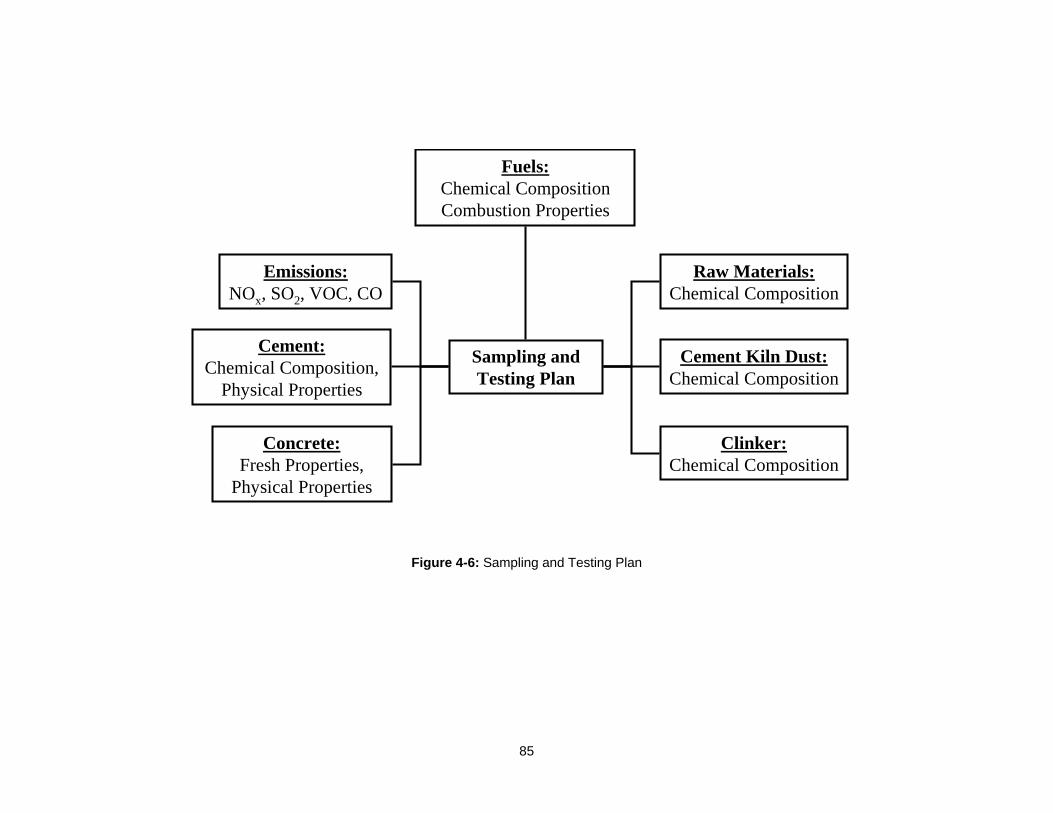
85
Figure 4-6: Sampling and Testing Plan
Fuels:Chemical CompositionCombustion Properties
Sampling and Testing Plan
Emissions:NOx, SO2, VOC, CO
Cement:Chemical Composition,
Physical Properties
Concrete:Fresh Properties,
Physical Properties
Clinker:Chemical Composition
Cement Kiln Dust:Chemical Composition
Raw Materials:Chemical Composition

86
Auburn University was the final party involved in this study. Samples collected by the
cement plant were collected, conditioned, and shipped to the external laboratory by Auburn
University. Cement from each burn was also collected by Auburn University for the purpose of
conducting tests on paste, mortar, and concrete. All the results from the cement plant and the
external laboratory were collected and compiled by Auburn University in order to be presented in
this document.
4.3 SAMPLING
Cement plant personnel collected samples of all materials used during the trial burns. The
sampling plan developed by Auburn University followed an in situ-plan used by the cement plant
and was modified to include all fuels. The sampling plan used by the cement plant with its
respective burn is shown in Table 4-1. All of the process inputs and outputs were collected in
one-gallon tin containers with the exception of the cement and liquid fuel. The cement was
collected in one-gallon plastic containers and the liquid fuel was collected in 16-ounce, high-
density polyethylene bottles.
The projected total number of samples collected during each burn is shown in Table 4-1.
It should be noted that fewer samples may have been collected due to the plant’s staffing during
the burns. The raw materials were sampled once during each burn. The remaining materials
were sampled at a regular frequency.
Table 4-1: Sample Collection Plan
Material
Samples per burn
Trial Burn
B-CP (June 2010)
C&D (July 2010)
VF (July 2010)
Soy (Oct. 2010)
RM1 - RM5 1 1 1 1
Kiln Feed 6 6 12 6
Pulverized Coal 6 6 12 6
Cement Kiln Dust 6 6 12 6
Clinker 36 36 72 36
Plastics 24 24 48 24
Alternative Fuel NA 24 48 24
Material Samples per grinding period
RM6 6 6 12 6
Cement 10 10 20 10
Notes: RM – Raw Material NA – Not applicable
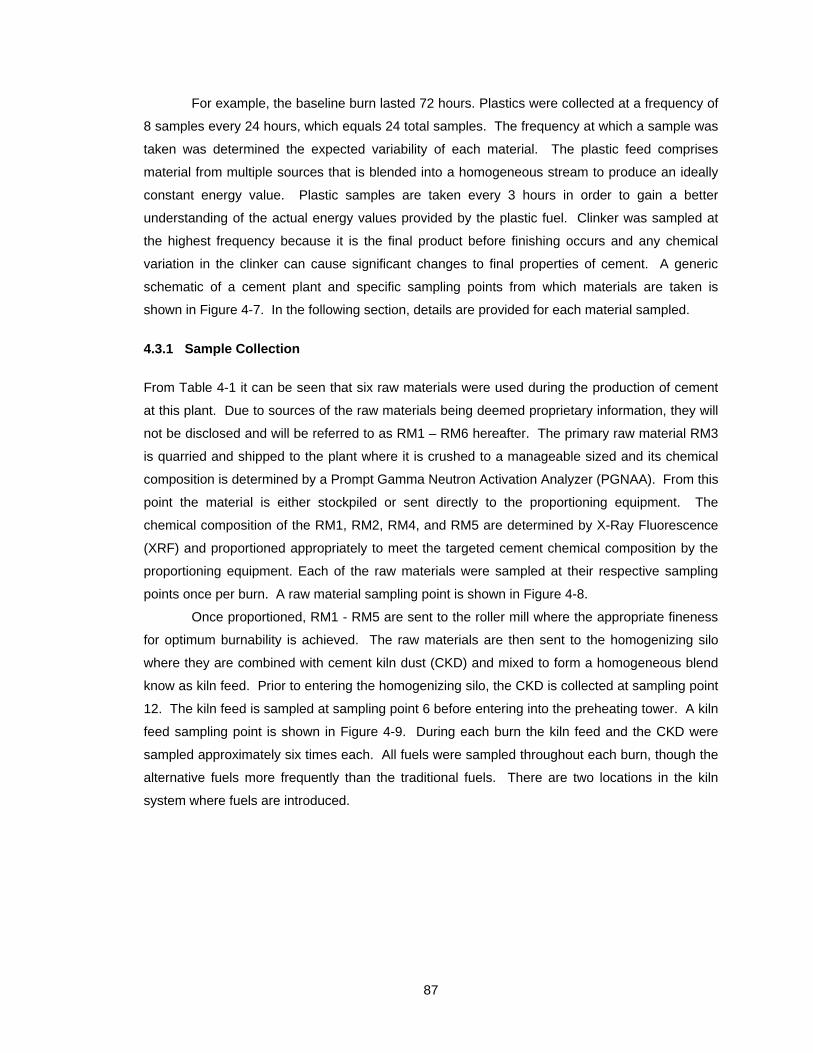
87
For example, the baseline burn lasted 72 hours. Plastics were collected at a frequency of
8 samples every 24 hours, which equals 24 total samples. The frequency at which a sample was
taken was determined the expected variability of each material. The plastic feed comprises
material from multiple sources that is blended into a homogeneous stream to produce an ideally
constant energy value. Plastic samples are taken every 3 hours in order to gain a better
understanding of the actual energy values provided by the plastic fuel. Clinker was sampled at
the highest frequency because it is the final product before finishing occurs and any chemical
variation in the clinker can cause significant changes to final properties of cement. A generic
schematic of a cement plant and specific sampling points from which materials are taken is
shown in Figure 4-7. In the following section, details are provided for each material sampled.
4.3.1 Sample Collection
From Table 4-1 it can be seen that six raw materials were used during the production of cement
at this plant. Due to sources of the raw materials being deemed proprietary information, they will
not be disclosed and will be referred to as RM1 – RM6 hereafter. The primary raw material RM3
is quarried and shipped to the plant where it is crushed to a manageable sized and its chemical
composition is determined by a Prompt Gamma Neutron Activation Analyzer (PGNAA). From this
point the material is either stockpiled or sent directly to the proportioning equipment. The
chemical composition of the RM1, RM2, RM4, and RM5 are determined by X-Ray Fluorescence
(XRF) and proportioned appropriately to meet the targeted cement chemical composition by the
proportioning equipment. Each of the raw materials were sampled at their respective sampling
points once per burn. A raw material sampling point is shown in Figure 4-8.
Once proportioned, RM1 - RM5 are sent to the roller mill where the appropriate fineness
for optimum burnability is achieved. The raw materials are then sent to the homogenizing silo
where they are combined with cement kiln dust (CKD) and mixed to form a homogeneous blend
know as kiln feed. Prior to entering the homogenizing silo, the CKD is collected at sampling point
12. The kiln feed is sampled at sampling point 6 before entering into the preheating tower. A kiln
feed sampling point is shown in Figure 4-9. During each burn the kiln feed and the CKD were
sampled approximately six times each. All fuels were sampled throughout each burn, though the
alternative fuels more frequently than the traditional fuels. There are two locations in the kiln
system where fuels are introduced.

88
Figure 4-7: Schematic of Cement Plant Operation (Folta 2010)
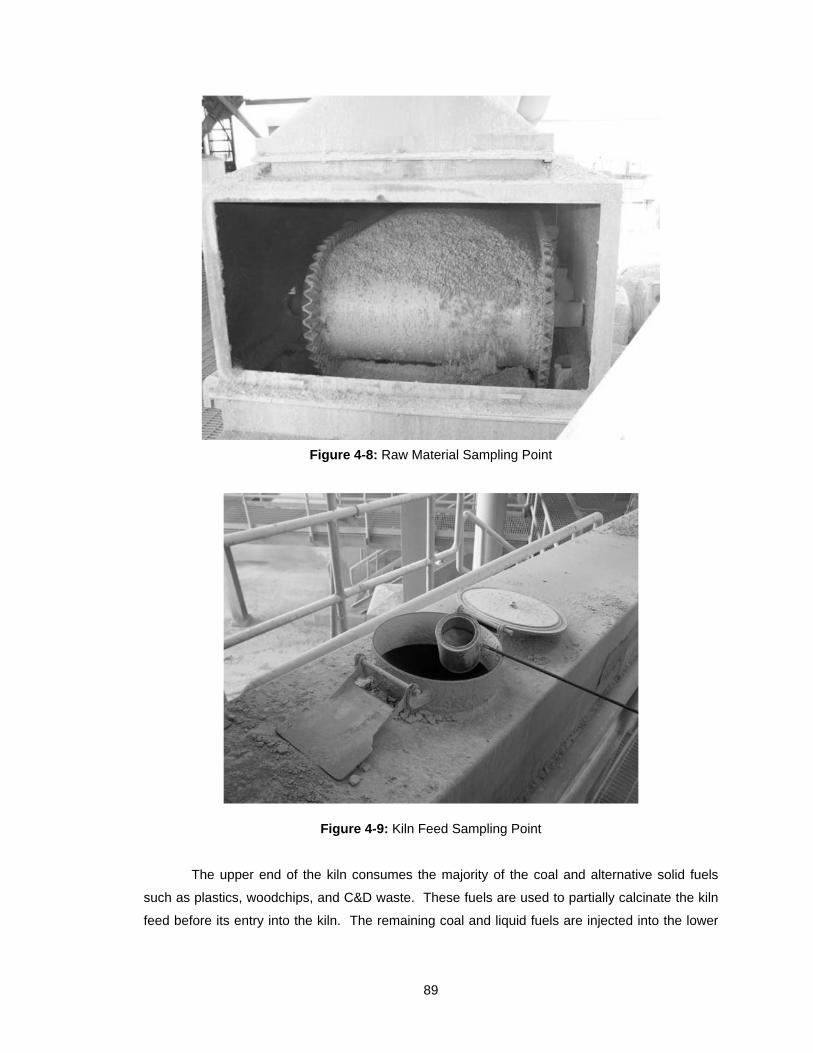
89
Figure 4-8: Raw Material Sampling Point
Figure 4-9: Kiln Feed Sampling Point
The upper end of the kiln consumes the majority of the coal and alternative solid fuels
such as plastics, woodchips, and C&D waste. These fuels are used to partially calcinate the kiln
feed before its entry into the kiln. The remaining coal and liquid fuels are injected into the lower
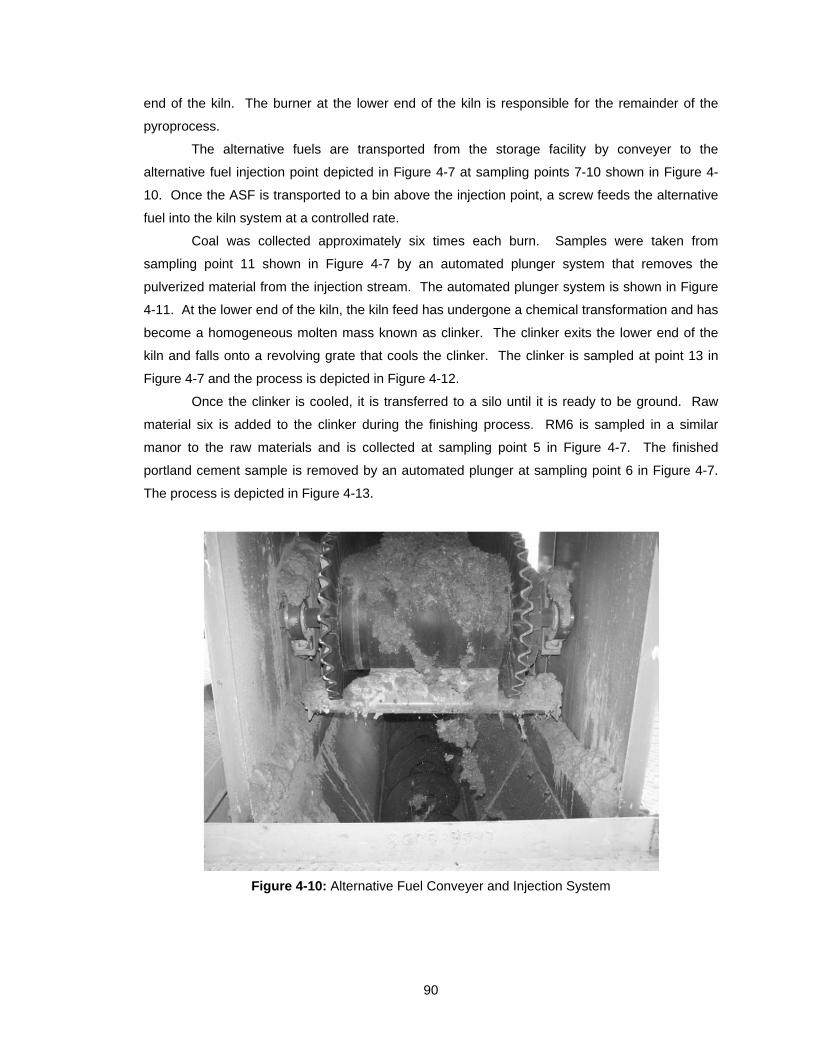
90
end of the kiln. The burner at the lower end of the kiln is responsible for the remainder of the
pyroprocess.
The alternative fuels are transported from the storage facility by conveyer to the
alternative fuel injection point depicted in Figure 4-7 at sampling points 7-10 shown in Figure 4-
10. Once the ASF is transported to a bin above the injection point, a screw feeds the alternative
fuel into the kiln system at a controlled rate.
Coal was collected approximately six times each burn. Samples were taken from
sampling point 11 shown in Figure 4-7 by an automated plunger system that removes the
pulverized material from the injection stream. The automated plunger system is shown in Figure
4-11. At the lower end of the kiln, the kiln feed has undergone a chemical transformation and has
become a homogeneous molten mass known as clinker. The clinker exits the lower end of the
kiln and falls onto a revolving grate that cools the clinker. The clinker is sampled at point 13 in
Figure 4-7 and the process is depicted in Figure 4-12.
Once the clinker is cooled, it is transferred to a silo until it is ready to be ground. Raw
material six is added to the clinker during the finishing process. RM6 is sampled in a similar
manor to the raw materials and is collected at sampling point 5 in Figure 4-7. The finished
portland cement sample is removed by an automated plunger at sampling point 6 in Figure 4-7.
The process is depicted in Figure 4-13.
Figure 4-10: Alternative Fuel Conveyer and Injection System
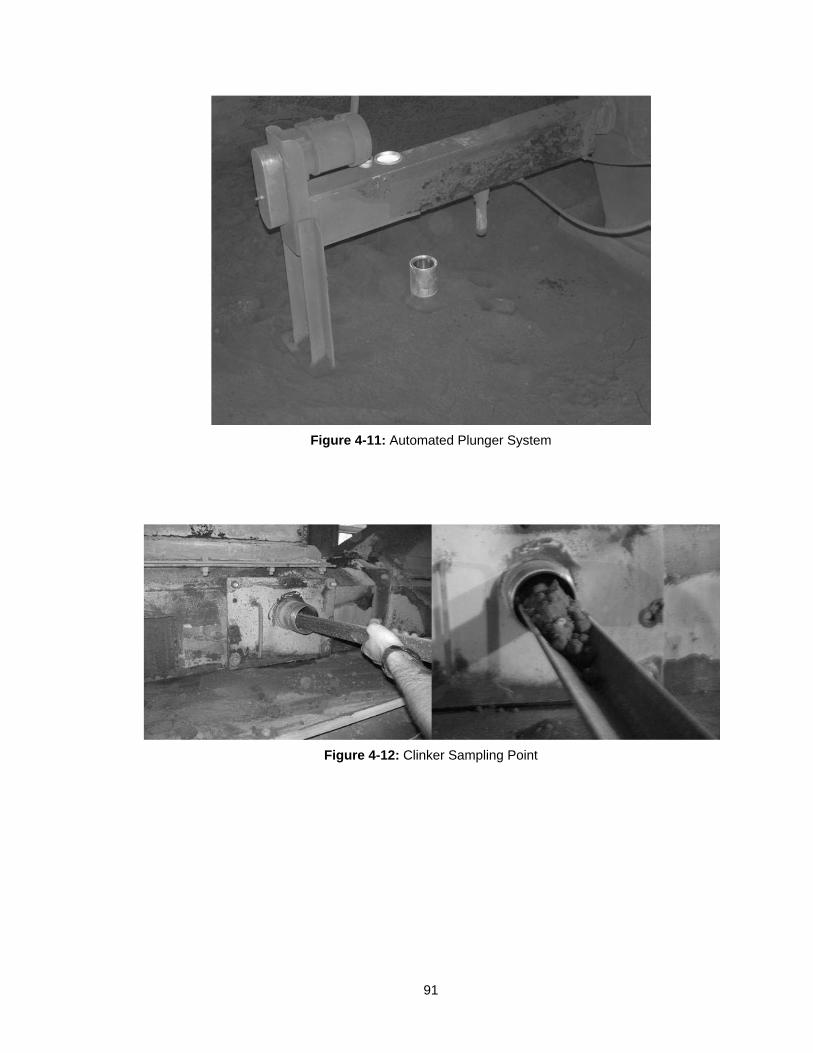
91
Figure 4-11: Automated Plunger System
Figure 4-12: Clinker Sampling Point
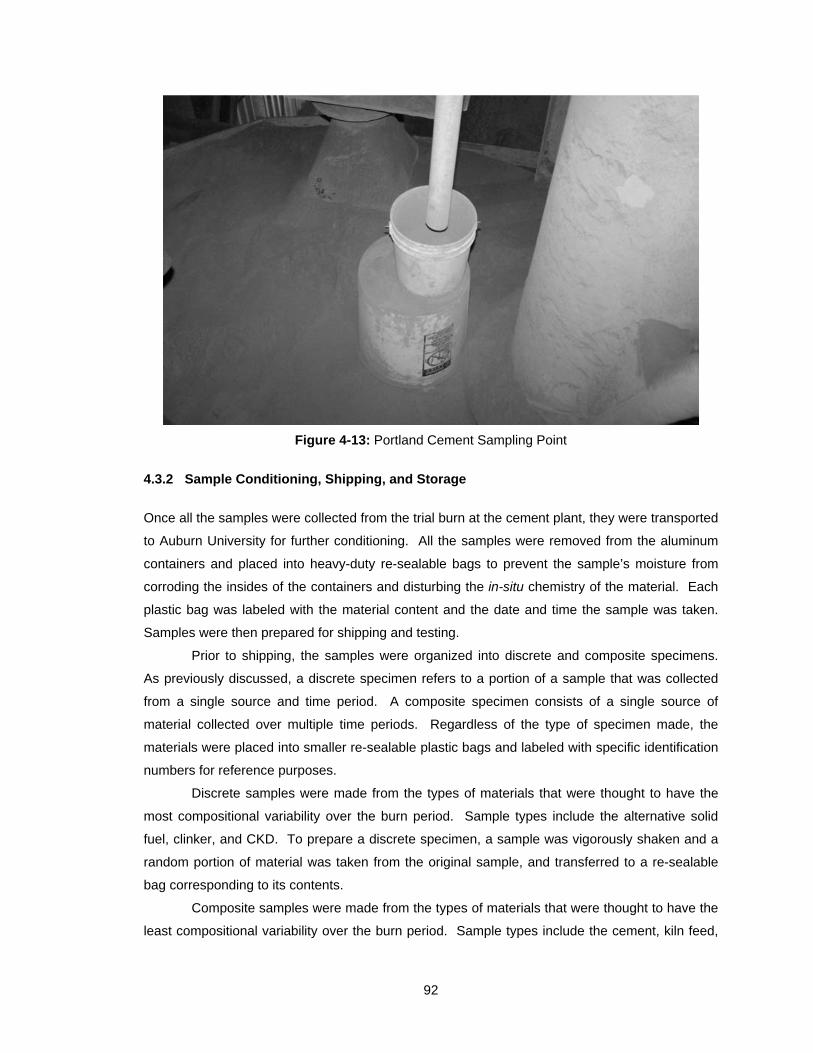
92
Figure 4-13: Portland Cement Sampling Point
4.3.2 Sample Conditioning, Shipping, and Storage
Once all the samples were collected from the trial burn at the cement plant, they were transported
to Auburn University for further conditioning. All the samples were removed from the aluminum
containers and placed into heavy-duty re-sealable bags to prevent the sample’s moisture from
corroding the insides of the containers and disturbing the in-situ chemistry of the material. Each
plastic bag was labeled with the material content and the date and time the sample was taken.
Samples were then prepared for shipping and testing.
Prior to shipping, the samples were organized into discrete and composite specimens.
As previously discussed, a discrete specimen refers to a portion of a sample that was collected
from a single source and time period. A composite specimen consists of a single source of
material collected over multiple time periods. Regardless of the type of specimen made, the
materials were placed into smaller re-sealable plastic bags and labeled with specific identification
numbers for reference purposes.
Discrete samples were made from the types of materials that were thought to have the
most compositional variability over the burn period. Sample types include the alternative solid
fuel, clinker, and CKD. To prepare a discrete specimen, a sample was vigorously shaken and a
random portion of material was taken from the original sample, and transferred to a re-sealable
bag corresponding to its contents.
Composite samples were made from the types of materials that were thought to have the
least compositional variability over the burn period. Sample types include the cement, kiln feed,
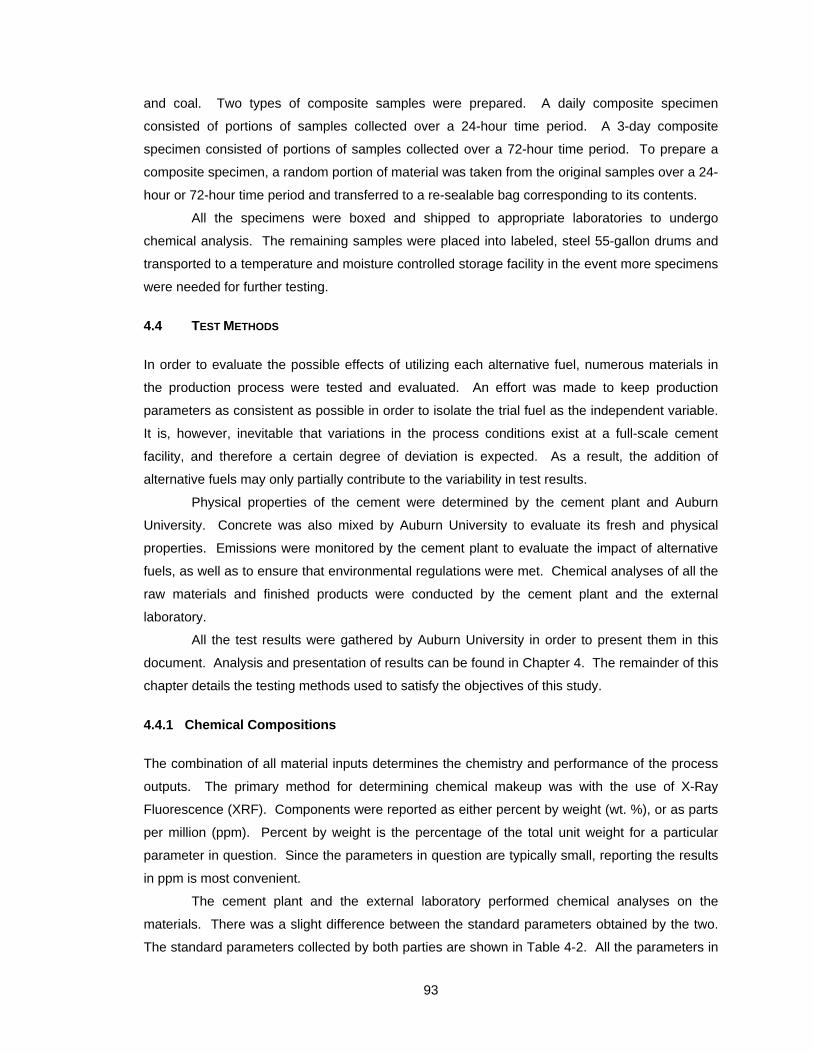
93
and coal. Two types of composite samples were prepared. A daily composite specimen
consisted of portions of samples collected over a 24-hour time period. A 3-day composite
specimen consisted of portions of samples collected over a 72-hour time period. To prepare a
composite specimen, a random portion of material was taken from the original samples over a 24-
hour or 72-hour time period and transferred to a re-sealable bag corresponding to its contents.
All the specimens were boxed and shipped to appropriate laboratories to undergo
chemical analysis. The remaining samples were placed into labeled, steel 55-gallon drums and
transported to a temperature and moisture controlled storage facility in the event more specimens
were needed for further testing.
4.4 TEST METHODS
In order to evaluate the possible effects of utilizing each alternative fuel, numerous materials in
the production process were tested and evaluated. An effort was made to keep production
parameters as consistent as possible in order to isolate the trial fuel as the independent variable.
It is, however, inevitable that variations in the process conditions exist at a full-scale cement
facility, and therefore a certain degree of deviation is expected. As a result, the addition of
alternative fuels may only partially contribute to the variability in test results.
Physical properties of the cement were determined by the cement plant and Auburn
University. Concrete was also mixed by Auburn University to evaluate its fresh and physical
properties. Emissions were monitored by the cement plant to evaluate the impact of alternative
fuels, as well as to ensure that environmental regulations were met. Chemical analyses of all the
raw materials and finished products were conducted by the cement plant and the external
laboratory.
All the test results were gathered by Auburn University in order to present them in this
document. Analysis and presentation of results can be found in Chapter 4. The remainder of this
chapter details the testing methods used to satisfy the objectives of this study.
4.4.1 Chemical Compositions
The combination of all material inputs determines the chemistry and performance of the process
outputs. The primary method for determining chemical makeup was with the use of X-Ray
Fluorescence (XRF). Components were reported as either percent by weight (wt. %), or as parts
per million (ppm). Percent by weight is the percentage of the total unit weight for a particular
parameter in question. Since the parameters in question are typically small, reporting the results
in ppm is most convenient.
The cement plant and the external laboratory performed chemical analyses on the
materials. There was a slight difference between the standard parameters obtained by the two.
The standard parameters collected by both parties are shown in Table 4-2. All the parameters in
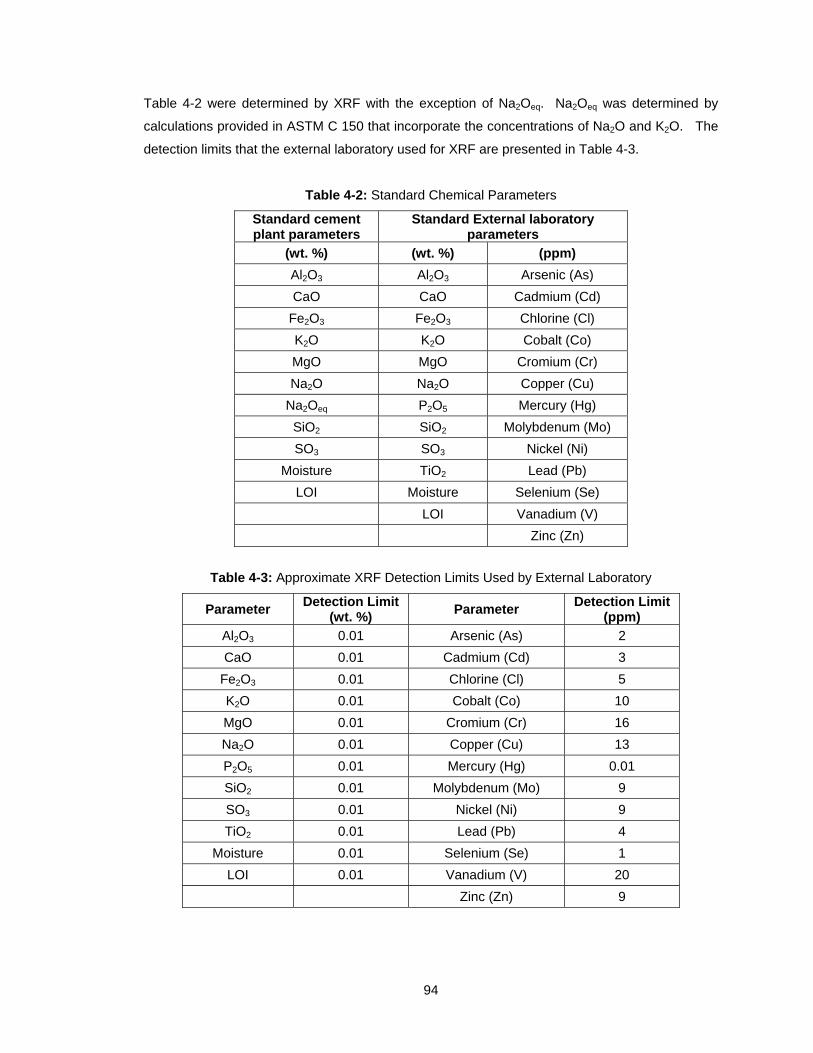
94
Table 4-2 were determined by XRF with the exception of Na2Oeq. Na2Oeq was determined by
calculations provided in ASTM C 150 that incorporate the concentrations of Na2O and K2O. The
detection limits that the external laboratory used for XRF are presented in Table 4-3.
Table 4-2: Standard Chemical Parameters
Standard cement plant parameters
Standard External laboratory parameters
(wt. %) (wt. %) (ppm)
Al2O3 Al2O3 Arsenic (As)
CaO CaO Cadmium (Cd)
Fe2O3 Fe2O3 Chlorine (Cl)
K2O K2O Cobalt (Co)
MgO MgO Cromium (Cr)
Na2O Na2O Copper (Cu)
Na2Oeq P2O5 Mercury (Hg)
SiO2 SiO2 Molybdenum (Mo)
SO3 SO3 Nickel (Ni)
Moisture TiO2 Lead (Pb)
LOI Moisture Selenium (Se)
LOI Vanadium (V)
Zinc (Zn)
Table 4-3: Approximate XRF Detection Limits Used by External Laboratory
Parameter Detection Limit
(wt. %)Parameter
Detection Limit (ppm)
Al2O3 0.01 Arsenic (As) 2
CaO 0.01 Cadmium (Cd) 3
Fe2O3 0.01 Chlorine (Cl) 5
K2O 0.01 Cobalt (Co) 10
MgO 0.01 Cromium (Cr) 16
Na2O 0.01 Copper (Cu) 13
P2O5 0.01 Mercury (Hg) 0.01
SiO2 0.01 Molybdenum (Mo) 9
SO3 0.01 Nickel (Ni) 9
TiO2 0.01 Lead (Pb) 4
Moisture 0.01 Selenium (Se) 1
LOI 0.01 Vanadium (V) 20
Zinc (Zn) 9

95
4.4.1.1 Raw Materials and Kiln Feed
During the burns, there were six raw materials (RMs) collected. Due to the sources of these
materials being proprietary and the request of the cement plant they will not be disclosed. RM1 –
RM5 were each sampled once per trial before grinding and mixing and discrete specimens for
each material was prepared for testing by the external laboratory. RM6 was sampled
approximately 6 times during each trial and was sampled prior to being ground with the clinker. A
3-day composite specimen of RM6 was prepared for the external laboratory for each trial.
The kiln feed consisted of a blend of RM1 – RM5 and was sampled approximately 6
times per trial. A 3-day composite specimen was prepared for testing by the external laboratory
for each trial. As discussed earlier, with the exception of RM3, RM1 – RM5 were chemically
analyzed by the cement plant and external laboratory utilizing XRF to acquire the standard
parameter listed in Table 4-2. RM6 is typically not tested by the cement plant. RM3 is analyzed
at the cement plant by using a Prompt-Gamma Neutron Activation Analyzer (PGNAA). The
PGNAA obtains immediate compositional results that allow the remaining raw materials to be
proportioned correctly.
The cement plant did not test all the raw materials during each burn. Reasons for this
include the source of the material remaining constant or the tests just never being conducted. All
the data provided by the cement plant, however, are the most recent available.
4.4.1.2 Cement Kiln Dust (CKD)
As stated previously, cement kiln dust is a unique material in that it is a process input and a
process output. During the pyroporcess, dust is collected and recycled into the kiln feed if its
chemical composition is acceptable. Approximately six samples were taken during each trial and
tested as discrete specimens by both laboratories. XRF was used to determine each parameter
listed in Table 4-2 except for moisture and Loss on Ignition (LOI). The external laboratory was
the only entity to include these parameters.
4.4.1.3 Fuel Sources
As shown in Figure 4-1, each alternative fuel was sampled approximately 8 times each day. In
addition to using XRF for each fuel, proximate and ultimate analyses were conducted by the
external laboratory. A list of parameters for the proximate and ultimate analyses is shown in
Table 4-4. A calorific value was also collected by measuring the energy released through
combustion. This value was reported on a dry basis and expressed in BTU/lb. The ash resulting
from combustion was tested using XRF to determine the parameters listed in Table 4-2.
Coal was sampled six times over each burn period. The external laboratory tested 3-day
composite specimens prepared from the samples collected. The results consisted of all the
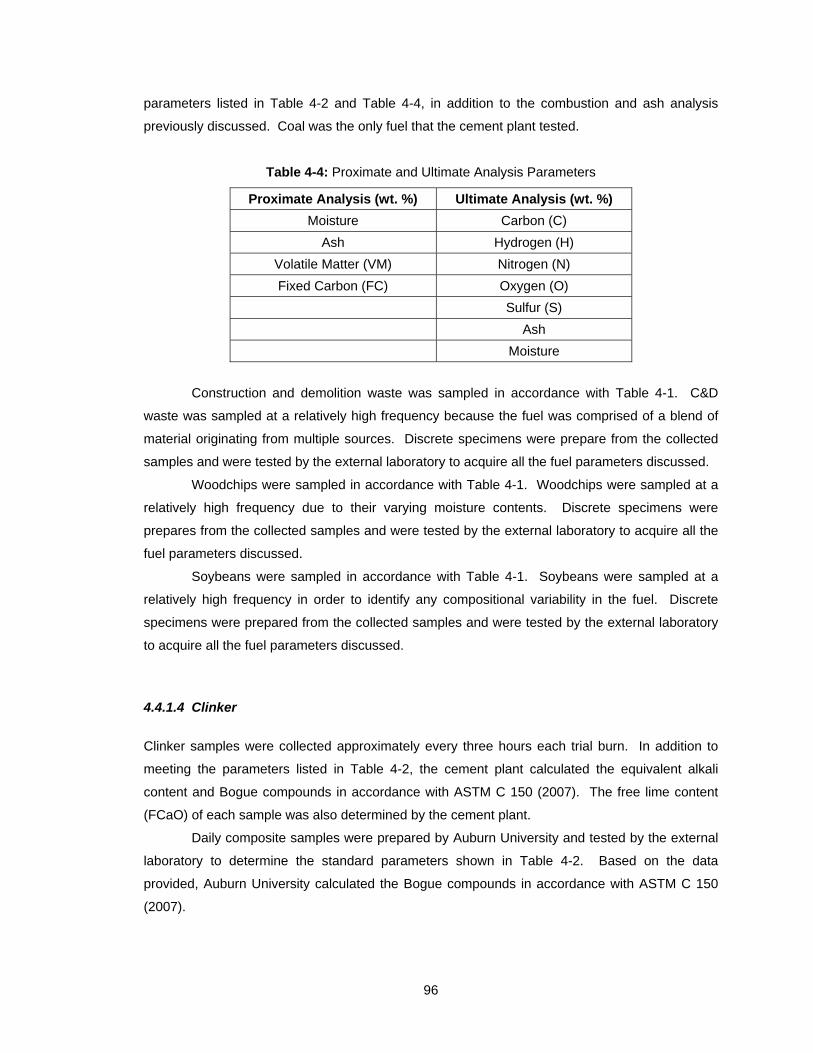
96
parameters listed in Table 4-2 and Table 4-4, in addition to the combustion and ash analysis
previously discussed. Coal was the only fuel that the cement plant tested.
Table 4-4: Proximate and Ultimate Analysis Parameters
Proximate Analysis (wt. %) Ultimate Analysis (wt. %)
Moisture Carbon (C)
Ash Hydrogen (H)
Volatile Matter (VM) Nitrogen (N)
Fixed Carbon (FC) Oxygen (O)
Sulfur (S)
Ash
Moisture
Construction and demolition waste was sampled in accordance with Table 4-1. C&D
waste was sampled at a relatively high frequency because the fuel was comprised of a blend of
material originating from multiple sources. Discrete specimens were prepare from the collected
samples and were tested by the external laboratory to acquire all the fuel parameters discussed.
Woodchips were sampled in accordance with Table 4-1. Woodchips were sampled at a
relatively high frequency due to their varying moisture contents. Discrete specimens were
prepares from the collected samples and were tested by the external laboratory to acquire all the
fuel parameters discussed.
Soybeans were sampled in accordance with Table 4-1. Soybeans were sampled at a
relatively high frequency in order to identify any compositional variability in the fuel. Discrete
specimens were prepared from the collected samples and were tested by the external laboratory
to acquire all the fuel parameters discussed.
4.4.1.4 Clinker
Clinker samples were collected approximately every three hours each trial burn. In addition to
meeting the parameters listed in Table 4-2, the cement plant calculated the equivalent alkali
content and Bogue compounds in accordance with ASTM C 150 (2007). The free lime content
(FCaO) of each sample was also determined by the cement plant.
Daily composite samples were prepared by Auburn University and tested by the external
laboratory to determine the standard parameters shown in Table 4-2. Based on the data
provided, Auburn University calculated the Bogue compounds in accordance with ASTM C 150
(2007).
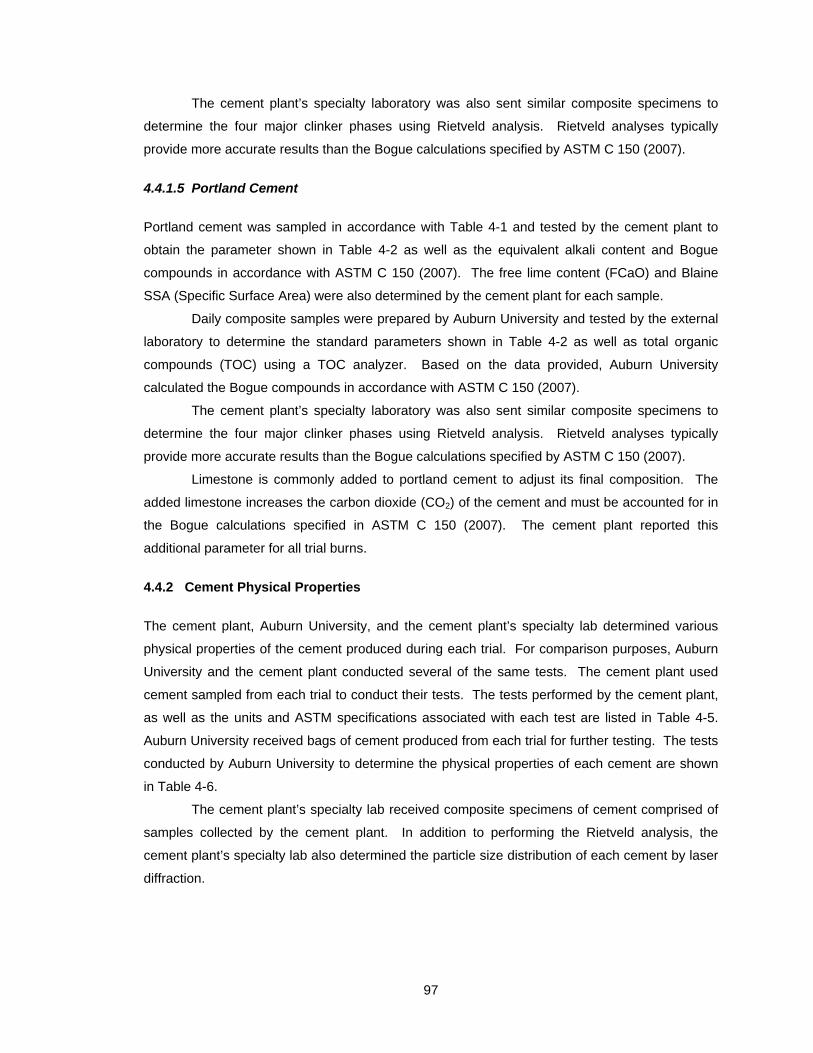
97
The cement plant’s specialty laboratory was also sent similar composite specimens to
determine the four major clinker phases using Rietveld analysis. Rietveld analyses typically
provide more accurate results than the Bogue calculations specified by ASTM C 150 (2007).
4.4.1.5 Portland Cement
Portland cement was sampled in accordance with Table 4-1 and tested by the cement plant to
obtain the parameter shown in Table 4-2 as well as the equivalent alkali content and Bogue
compounds in accordance with ASTM C 150 (2007). The free lime content (FCaO) and Blaine
SSA (Specific Surface Area) were also determined by the cement plant for each sample.
Daily composite samples were prepared by Auburn University and tested by the external
laboratory to determine the standard parameters shown in Table 4-2 as well as total organic
compounds (TOC) using a TOC analyzer. Based on the data provided, Auburn University
calculated the Bogue compounds in accordance with ASTM C 150 (2007).
The cement plant’s specialty laboratory was also sent similar composite specimens to
determine the four major clinker phases using Rietveld analysis. Rietveld analyses typically
provide more accurate results than the Bogue calculations specified by ASTM C 150 (2007).
Limestone is commonly added to portland cement to adjust its final composition. The
added limestone increases the carbon dioxide (CO2) of the cement and must be accounted for in
the Bogue calculations specified in ASTM C 150 (2007). The cement plant reported this
additional parameter for all trial burns.
4.4.2 Cement Physical Properties
The cement plant, Auburn University, and the cement plant’s specialty lab determined various
physical properties of the cement produced during each trial. For comparison purposes, Auburn
University and the cement plant conducted several of the same tests. The cement plant used
cement sampled from each trial to conduct their tests. The tests performed by the cement plant,
as well as the units and ASTM specifications associated with each test are listed in Table 4-5.
Auburn University received bags of cement produced from each trial for further testing. The tests
conducted by Auburn University to determine the physical properties of each cement are shown
in Table 4-6.
The cement plant’s specialty lab received composite specimens of cement comprised of
samples collected by the cement plant. In addition to performing the Rietveld analysis, the
cement plant’s specialty lab also determined the particle size distribution of each cement by laser
diffraction.
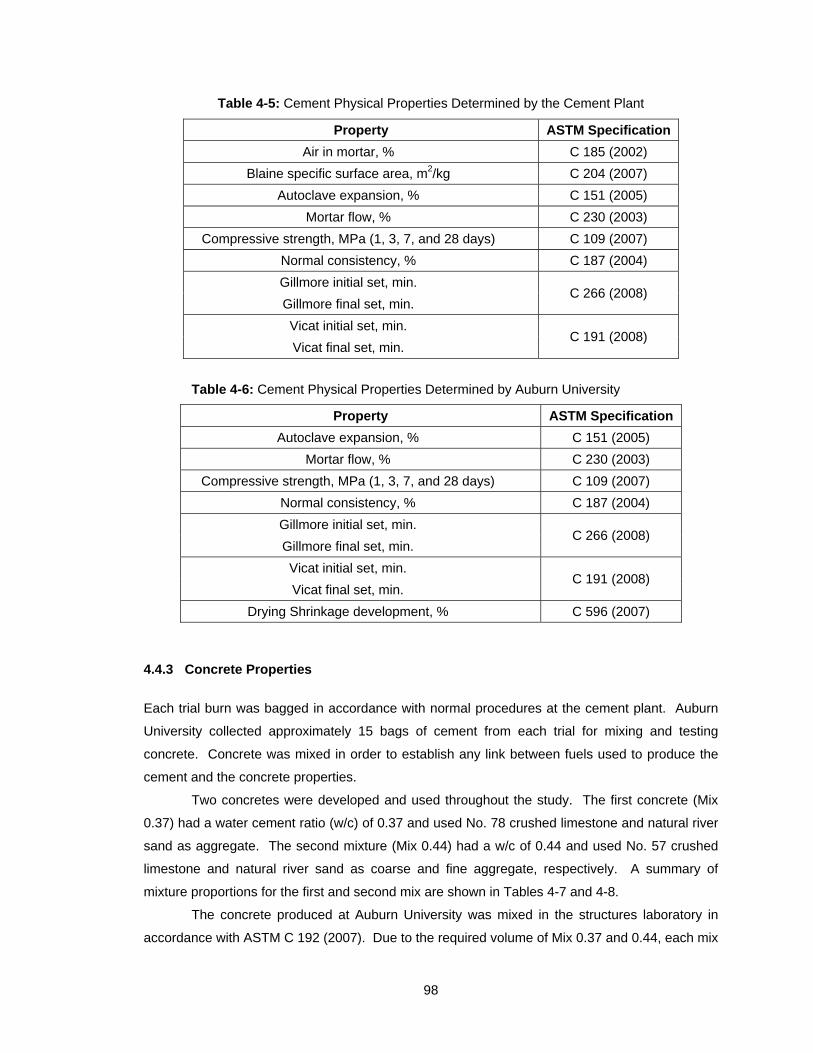
98
Table 4-5: Cement Physical Properties Determined by the Cement Plant
Property ASTM Specification
Air in mortar, % C 185 (2002)
Blaine specific surface area, m2/kg C 204 (2007)
Autoclave expansion, % C 151 (2005)
Mortar flow, % C 230 (2003)
Compressive strength, MPa (1, 3, 7, and 28 days) C 109 (2007)
Normal consistency, % C 187 (2004)
Gillmore initial set, min. C 266 (2008)
Gillmore final set, min.
Vicat initial set, min. C 191 (2008)
Vicat final set, min.
Table 4-6: Cement Physical Properties Determined by Auburn University
Property ASTM Specification
Autoclave expansion, % C 151 (2005)
Mortar flow, % C 230 (2003)
Compressive strength, MPa (1, 3, 7, and 28 days) C 109 (2007)
Normal consistency, % C 187 (2004)
Gillmore initial set, min. C 266 (2008)
Gillmore final set, min.
Vicat initial set, min. C 191 (2008)
Vicat final set, min.
Drying Shrinkage development, % C 596 (2007)
4.4.3 Concrete Properties
Each trial burn was bagged in accordance with normal procedures at the cement plant. Auburn
University collected approximately 15 bags of cement from each trial for mixing and testing
concrete. Concrete was mixed in order to establish any link between fuels used to produce the
cement and the concrete properties.
Two concretes were developed and used throughout the study. The first concrete (Mix
0.37) had a water cement ratio (w/c) of 0.37 and used No. 78 crushed limestone and natural river
sand as aggregate. The second mixture (Mix 0.44) had a w/c of 0.44 and used No. 57 crushed
limestone and natural river sand as coarse and fine aggregate, respectively. A summary of
mixture proportions for the first and second mix are shown in Tables 4-7 and 4-8.
The concrete produced at Auburn University was mixed in the structures laboratory in
accordance with ASTM C 192 (2007). Due to the required volume of Mix 0.37 and 0.44, each mix
99
was divided into two batches of approximately equal volumes. Fresh concrete properties were
tested for each batch mixed prior to preparing test specimens listed in Figure 4-9. The tests
conducted for each mixture in addition to the ASTM specifications followed for each are shown in
Figure 4-9.
The slump and air content of the concrete was tested in both batches in accordance with
ASTM C 192 (2007). Tolerances set by Section 9.2 of ASTM C 192 (2007) to ensure consistency
between the two batches were obtained.
Table 4-7: Proportions for Mix 0.37 (w/c = 0.37)
Material Proportion Volume
Water content 260 lb/yd3 4.17 ft3
Cement content 705 lb/yd3 3.59 ft3
Coarse aggregate content (# 78 crushed limestone)
1942 lb/yd3 11.40 ft3
Fine aggregate content (natural river sand)
1104 lb/yd3 6.73 ft3
Total air content 4.0 % 1.08 ft3
Air-entraining admixture 1.8 oz/yd3 0.002 ft3
Water-reducing admixture 35.3 oz/yd3 0.035 ft3
Table 4-8: Proportions for Mix 0.44 (w/c = 0.44)
Material Proportion Volume
Water content 273 lb/yd3 4.38 ft3
Cement content 620 lb/yd3 3.15 ft3
Coarse aggregate content (# 57 crushed limestone)
1900 lb/yd3 10.77 ft3
Fine aggregate content (natural river sand)
1247 lb/yd3 7.60 ft3
Total air content 4.0 % 1.08 ft3
Air-entraining admixture 1.2 oz/yd3 0.001 ft3
Water-reducing admixture 12.4 oz/yd3 0.012 ft3
Table 4-9: Concrete Tests
Test ASTM Specification
Slump C 143 (2008)
Total air content C 231 (2008)
Setting Time C 403 (2008)
Compressive Strength (1, 3, 7, 28, and 91 days)
C 39 (2005)
Drying shrinkage development C 157 (2006)
Permeability (RCPT) C 1202 (2007)
100
Four by eight in. cylinders were prepared for rapid chloride ion penetration testing
(RCPT). Ten 6 x 12 in. cylinders were used for compressive testing. One 6 x 12 in. cylinder was
used for a semi-adiabatic (heat of hydration) test. Prisms (3 x 3 x 11.25 in.) were prepared for
drying shrinkage development. A setting specimen was also prepared in accordance with ASTM
C 403 to determine initial and final setting times of the trial cement.
4.4.4 Plant Emissions
In order to satisfy limits set by the Alabama Department of Environmental Management (ADEM),
plant emissions were monitored by a Continuous Emissions Monitoring System (CEMS). The
main stack emissions monitored were carbon monoxide (CO), nitrogen oxides (NOx), sulfur
dioxide (SO2) and volatile organic compounds (VOCs). The emissions data, though continuously
monitored, was reported in average tons per hour. In order to normalize these data, the
production data detailing the amount of clinker produced per hour were used. Emission
quantities were reported in tons per ton of clinker. These data were used to evaluate the effects
of utilizing alternative fuels.
4.5 CONCLUDING REMARKS
Four individual burns were conducted at a full-scale cement plant during this phase of the
alternative fuels study, each yielding portland cement from different fuel scenarios. Two of the
trials conducted utilized a constant feed rate. Unique to this study, one trial utilized a variable
feed rate which consisted of 5, 10, and 15 percent replacement of woodchips. This chapter
described all testing plans and methods used to satisfy objectives of this study.
The cement plant’s laboratory and external laboratory were responsible for testing all
material input and outputs. Material inputs included raw material, and fuels. Material outputs
included CKD, clinker, and cement. Chemical analyses of the input and output materials were
used to determine if there were significant differences that could be attributed to the utilization of
alternative fuels
Physical properties of cement were tested by the cement plant as well as Auburn
University. Cement produced during each trial was collected by Auburn University for fresh and
physical concrete property testing.
Emissions were monitored continuously during each trial to ensure environmental
regulations were met and evaluate the impact of alternative fuels on portland cement. The
emissions monitored during each trial were carbon monoxide (CO), sulfur dioxide (SO2), nitrogen
oxides (NOx), and volatile organic compounds (VOCs).
101
CHAPTER 5
PART 2—DATA PRESENTATION AND ANALYSIS
5.1 INTRODUCTION
A summary of all collected data in addition to an analysis and discussion of the results are
presented in the chapter. The data pertaining to each material follow the same order of
presentation used in Chapter Four. Each material’s results as reported from the testing
laboratories are discussed separately. Similar analyses between entities are compared where
necessary. Results from trial burns are compared to these obtained from the baseline burn.
An analysis plan was developed and is sown in Figure 5-1. It should be noted that the
construction and demolition waste, variable feed woodchip, and soybean seed burns represent
the trial burns. The trial burns are compared to the baseline burn.
5.2 STATISTICAL ANALYSIS BACKGROUND
In this chapter, data pertaining to each test or parameter are presented. Where more than ten
data points are available for a data set, statistical analysis results are also presented for the data.
It should be noted that the term significant is used frequently throughout this chapter.
This could indicate that there is a large change or difference between two or more results. Also,
the terms statistical significance and practical significance are used. Statistical significance
implies the result is supported by statistical analysis and unlikely to have occurred by chance.
Practical significance is based on the performance of a cement or concrete. Data may show any
combination of these two types of significance.
The normality of all applicable data was tested using the Anderson-Darling test
(Gingerich 1995). The Wilcoxon rank-sum test, which is not dependent on sample size or
normality, is presented in this chapter for applicable data (Bridge and Sawilowsky 1999).
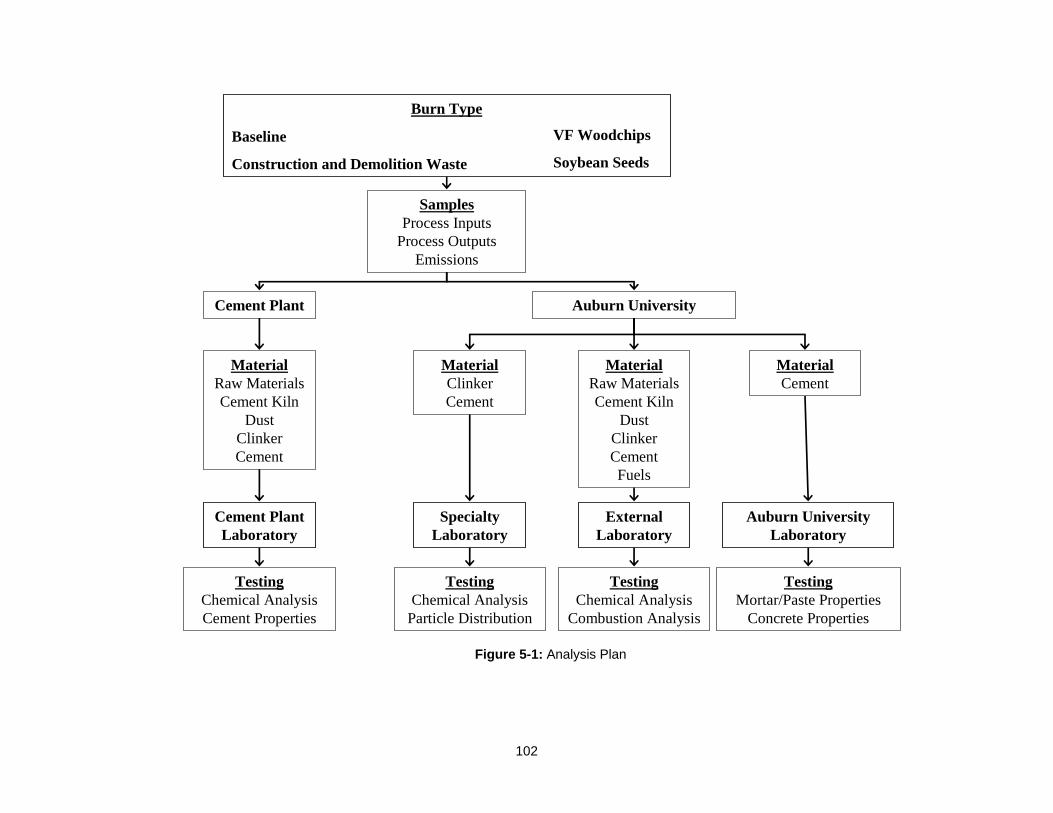
102
Figure 5-1: Analysis Plan
SamplesProcess Inputs
Process OutputsEmissions
Cement Plant Auburn University
MaterialCement
MaterialRaw MaterialsCement Kiln
DustClinkerCementFuels
MaterialClinkerCement
Specialty Laboratory
External Laboratory
Auburn University Laboratory
TestingChemical Analysis
Particle Distribution
TestingChemical Analysis
Combustion Analysis
TestingMortar/Paste Properties
Concrete Properties
MaterialRaw MaterialsCement Kiln
DustClinkerCement
Cement Plant Laboratory
TestingChemical AnalysisCement Properties
Burn Type
Baseline
Construction and Demolition Waste
VF Woodchips
Soybean Seeds

103
The Anderson-Darling and Wilcoxon rank-sum tests are both based around two
competing hypotheses: a null hypothesis (Ho), which is considered true until statistics proves
otherwise, and an alternative hypotheses (Ha) (Gingerich 1995). A p-value is the probability of
failing to reject the null hypotheses in favor of the alternative hypothesis. A confidence level of 90
% was used for both statistical tests because most of the sample sizes in this study are small. If
the p-value calculated is less than the confidence level, the null hypothesis is rejected for the
alternative hypothesis.
The Anderson-Darling statistic for all the applicable data was calculated with Statistical
Analysis Software (SAS 9.2) utilizing the following hypotheses:
Ho: The data follow a normal distribution, and
Ha: The data do not follow a normal distribution.
The 90 % confidence level was represented by a limiting alpha value of 0.1. A p-value
less than 0.1 indicates that the null hypothesis is likely to be false, and thus the data do not follow
a normal distribution. All values resulting from the Anderson-Darling statistic presented in this
study that do not follow a normal distribution are indicated by a superscript when presented in
tabular from.
The Wilcoxon rank-sum test was used to determine the statistical significance between
means of two samples. The Wilcoxon rank-sum test for all the applicable data was calculated
with Statistical Analysis Software (SAS 9.2) and utilized the following hypotheses:
Ho: The means of the two data sets are equal, and
Ha: The means of the two data sets are not equal.
The 90 % confidence level was represented by a limiting alpha value of 0.1. A p-value
less than 0.1 indicates that the null hypothesis is likely to be false, and thus the means between
the trial and the baseline are different. All trial values that possess statistically different means
compared to the baseline mean are indicated by a superscript.
5.3 RESEARCH CONDITIONS
The burns conducted for this study were described in Chapter Four. All trial fuels were used to
partially replace traditional fuels and were co-fired with traditional fuels over a 3-6 day period.
Each 3-day burn lasted between 72 and 80 hours. The variable-feed 6-day burn lasted 148
hours. Although efforts were made to maintain consistent plant conditions, changes that may
have occurred include process inputs such as raw material sources, fuel feed rates, and
production rates. These changes are unavoidable with respect to the study and necessary for the
cement facility to maintain its normal operations. The range of values for the rates of process
inputs and outputs are presented in Table 5-1. It should be noted that the alternative solid fuel
incorporates the plastic blend as well as the alternative fuel utilized during the burn.
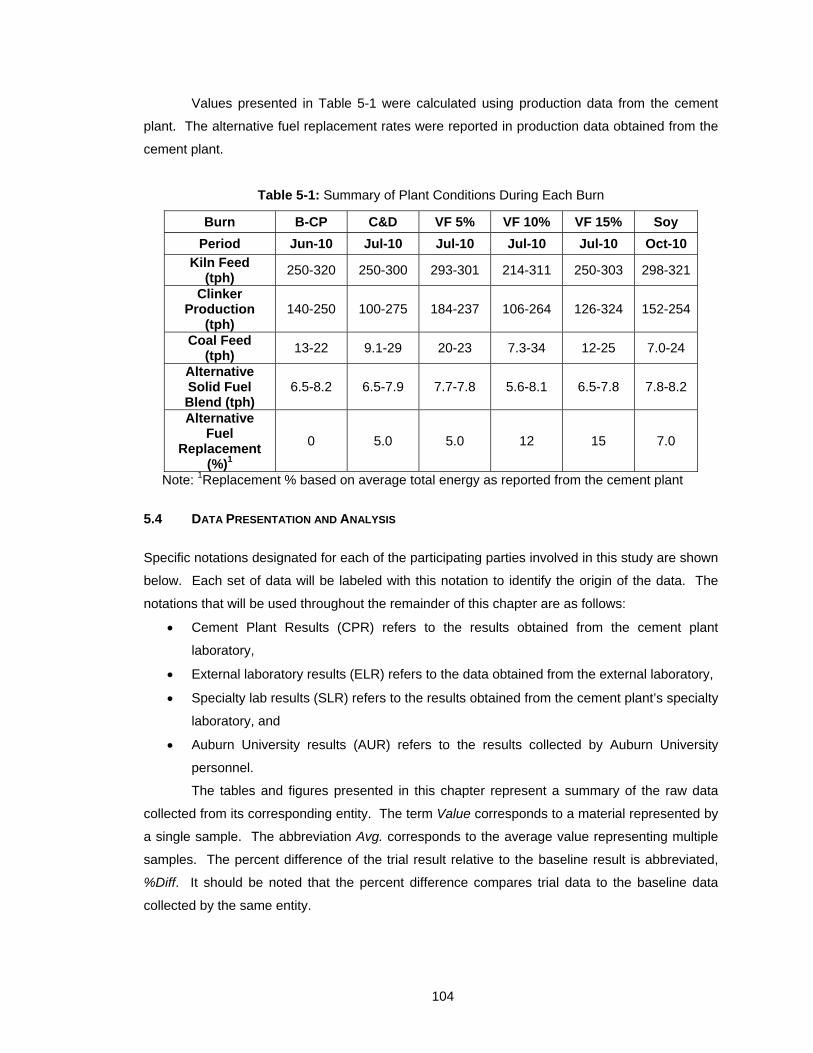
104
Values presented in Table 5-1 were calculated using production data from the cement
plant. The alternative fuel replacement rates were reported in production data obtained from the
cement plant.
Table 5-1: Summary of Plant Conditions During Each Burn
Burn B-CP C&D VF 5% VF 10% VF 15% Soy
Period Jun-10 Jul-10 Jul-10 Jul-10 Jul-10 Oct-10
Kiln Feed (tph)
250-320 250-300 293-301 214-311 250-303 298-321
Clinker Production
(tph) 140-250 100-275 184-237 106-264 126-324 152-254
Coal Feed (tph)
13-22 9.1-29 20-23 7.3-34 12-25 7.0-24
Alternative Solid Fuel Blend (tph)
6.5-8.2 6.5-7.9 7.7-7.8 5.6-8.1 6.5-7.8 7.8-8.2
Alternative Fuel
Replacement (%)1
0 5.0 5.0 12 15 7.0
Note: 1Replacement % based on average total energy as reported from the cement plant
5.4 DATA PRESENTATION AND ANALYSIS
Specific notations designated for each of the participating parties involved in this study are shown
below. Each set of data will be labeled with this notation to identify the origin of the data. The
notations that will be used throughout the remainder of this chapter are as follows:
Cement Plant Results (CPR) refers to the results obtained from the cement plant
laboratory,
External laboratory results (ELR) refers to the data obtained from the external laboratory,
Specialty lab results (SLR) refers to the results obtained from the cement plant’s specialty
laboratory, and
Auburn University results (AUR) refers to the results collected by Auburn University
personnel.
The tables and figures presented in this chapter represent a summary of the raw data
collected from its corresponding entity. The term Value corresponds to a material represented by
a single sample. The abbreviation Avg. corresponds to the average value representing multiple
samples. The percent difference of the trial result relative to the baseline result is abbreviated,
%Diff. It should be noted that the percent difference compares trial data to the baseline data
collected by the same entity.
105
5.4.1 Chemical Composition of Raw Materials
The results from RM1 – RM6 are reported in Tables 5-2 to 5-7. It should be noted that the raw
material values represent one specimen. The percent difference also is provided to compare the
trial burn to the baseline. Testing only one specimen between burns can increase the percent
difference relative to the baseline due to the fluctuations in material chemistry. Since these data
are represented by one specimen, they are not shown in the appendices.
The external laboratory results for raw material 1 are tabulated in Table 5-2. The most
noticeable decrease is in the SO3 content. A decrease in SO3 could affect emissions and cement
physical properties. Notable trace elements include arsenic (As) and mercury (Hg). Their levels
significantly vary from the baseline results. The effects from the fluctuations in all raw materials
will be determined from the final cement composition.
The external laboratory results for raw material 2 are tabulated in Table 5-2. The most
noticeable decrease is in the SO3 content. A decrease in SO3 could affect emissions and cement
physical properties. Notable trace elements that significantly varied from the baseline include As,
Hg, Cu, Ni, Pb, and Zn.
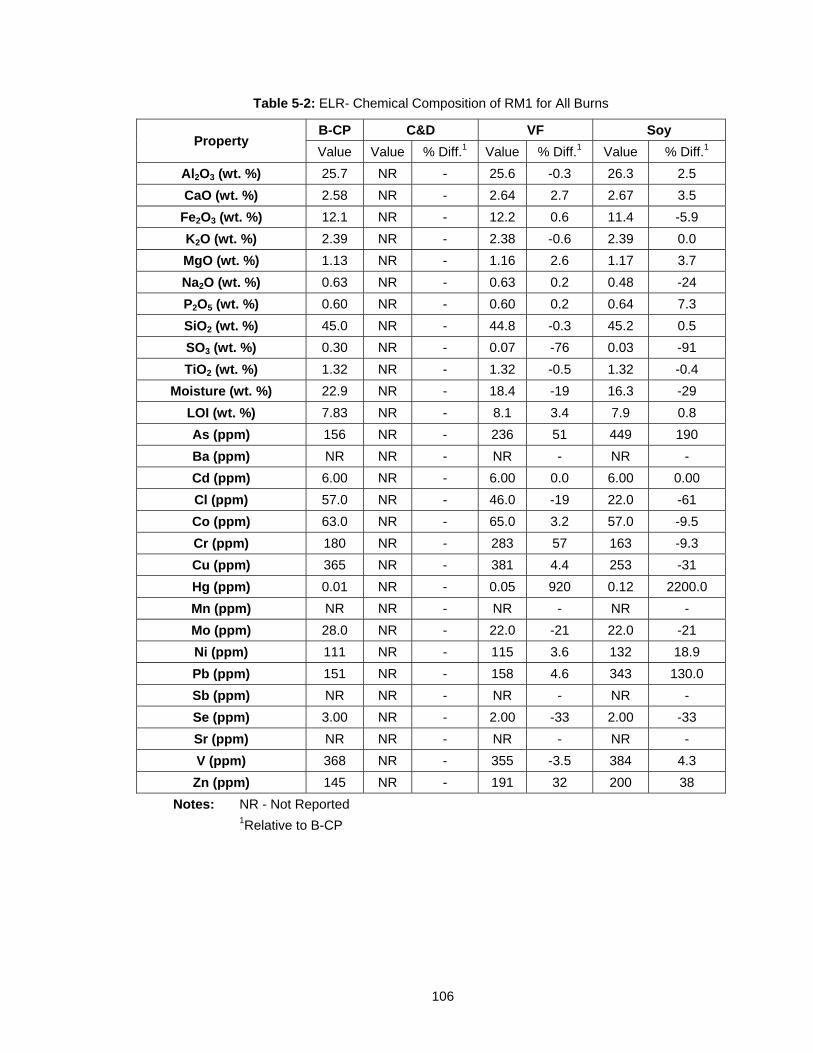
106
Table 5-2: ELR- Chemical Composition of RM1 for All Burns
Property B-CP C&D VF Soy
Value Value % Diff.1 Value % Diff.1 Value % Diff.1
Al2O3 (wt. %) 25.7 NR - 25.6 -0.3 26.3 2.5
CaO (wt. %) 2.58 NR - 2.64 2.7 2.67 3.5
Fe2O3 (wt. %) 12.1 NR - 12.2 0.6 11.4 -5.9
K2O (wt. %) 2.39 NR - 2.38 -0.6 2.39 0.0
MgO (wt. %) 1.13 NR - 1.16 2.6 1.17 3.7
Na2O (wt. %) 0.63 NR - 0.63 0.2 0.48 -24
P2O5 (wt. %) 0.60 NR - 0.60 0.2 0.64 7.3
SiO2 (wt. %) 45.0 NR - 44.8 -0.3 45.2 0.5
SO3 (wt. %) 0.30 NR - 0.07 -76 0.03 -91
TiO2 (wt. %) 1.32 NR - 1.32 -0.5 1.32 -0.4
Moisture (wt. %) 22.9 NR - 18.4 -19 16.3 -29
LOI (wt. %) 7.83 NR - 8.1 3.4 7.9 0.8
As (ppm) 156 NR - 236 51 449 190
Ba (ppm) NR NR - NR - NR -
Cd (ppm) 6.00 NR - 6.00 0.0 6.00 0.00
Cl (ppm) 57.0 NR - 46.0 -19 22.0 -61
Co (ppm) 63.0 NR - 65.0 3.2 57.0 -9.5
Cr (ppm) 180 NR - 283 57 163 -9.3
Cu (ppm) 365 NR - 381 4.4 253 -31
Hg (ppm) 0.01 NR - 0.05 920 0.12 2200.0
Mn (ppm) NR NR - NR - NR -
Mo (ppm) 28.0 NR - 22.0 -21 22.0 -21
Ni (ppm) 111 NR - 115 3.6 132 18.9
Pb (ppm) 151 NR - 158 4.6 343 130.0
Sb (ppm) NR NR - NR - NR -
Se (ppm) 3.00 NR - 2.00 -33 2.00 -33
Sr (ppm) NR NR - NR - NR -
V (ppm) 368 NR - 355 -3.5 384 4.3
Zn (ppm) 145 NR - 191 32 200 38
Notes: NR - Not Reported 1Relative to B-CP
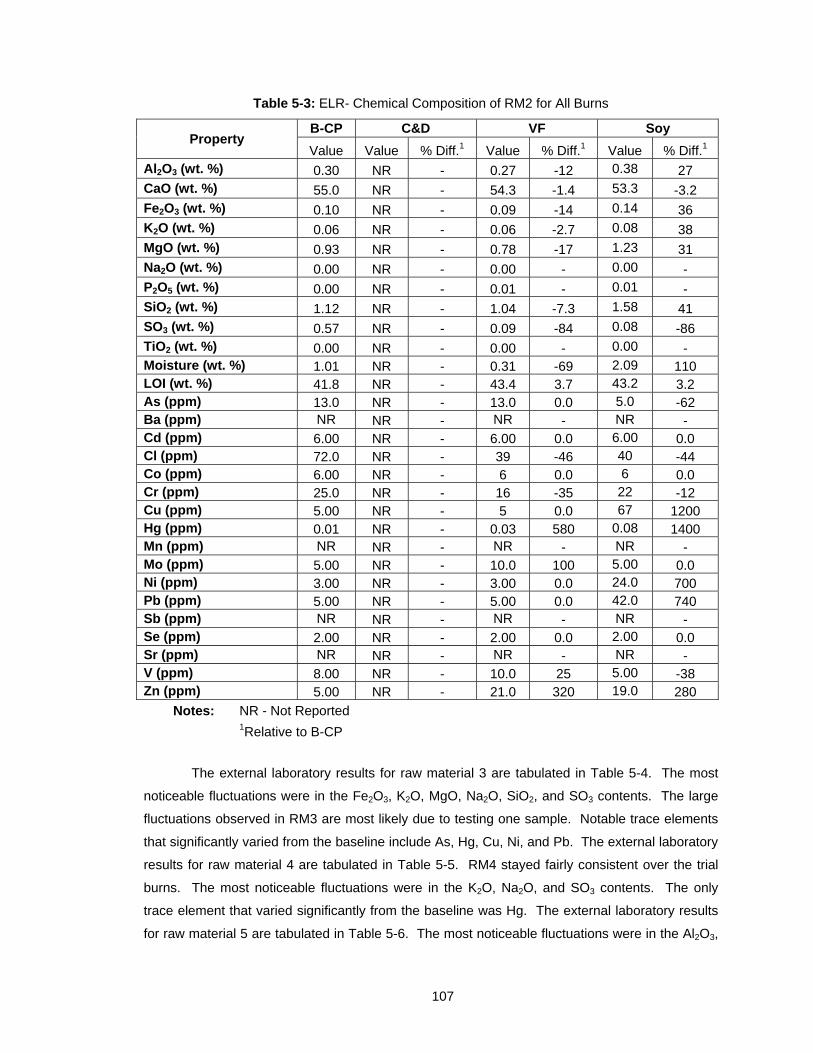
107
Table 5-3: ELR- Chemical Composition of RM2 for All Burns
Property B-CP C&D VF Soy
Value Value % Diff.1 Value % Diff.1 Value % Diff.1 Al2O3 (wt. %) 0.30 NR - 0.27 -12 0.38 27 CaO (wt. %) 55.0 NR - 54.3 -1.4 53.3 -3.2 Fe2O3 (wt. %) 0.10 NR - 0.09 -14 0.14 36 K2O (wt. %) 0.06 NR - 0.06 -2.7 0.08 38 MgO (wt. %) 0.93 NR - 0.78 -17 1.23 31 Na2O (wt. %) 0.00 NR - 0.00 - 0.00 - P2O5 (wt. %) 0.00 NR - 0.01 - 0.01 - SiO2 (wt. %) 1.12 NR - 1.04 -7.3 1.58 41 SO3 (wt. %) 0.57 NR - 0.09 -84 0.08 -86 TiO2 (wt. %) 0.00 NR - 0.00 - 0.00 - Moisture (wt. %) 1.01 NR - 0.31 -69 2.09 110 LOI (wt. %) 41.8 NR - 43.4 3.7 43.2 3.2 As (ppm) 13.0 NR - 13.0 0.0 5.0 -62 Ba (ppm) NR NR - NR - NR - Cd (ppm) 6.00 NR - 6.00 0.0 6.00 0.0 Cl (ppm) 72.0 NR - 39 -46 40 -44 Co (ppm) 6.00 NR - 6 0.0 6 0.0 Cr (ppm) 25.0 NR - 16 -35 22 -12 Cu (ppm) 5.00 NR - 5 0.0 67 1200 Hg (ppm) 0.01 NR - 0.03 580 0.08 1400 Mn (ppm) NR NR - NR - NR - Mo (ppm) 5.00 NR - 10.0 100 5.00 0.0 Ni (ppm) 3.00 NR - 3.00 0.0 24.0 700 Pb (ppm) 5.00 NR - 5.00 0.0 42.0 740 Sb (ppm) NR NR - NR - NR - Se (ppm) 2.00 NR - 2.00 0.0 2.00 0.0 Sr (ppm) NR NR - NR - NR - V (ppm) 8.00 NR - 10.0 25 5.00 -38 Zn (ppm) 5.00 NR - 21.0 320 19.0 280
Notes: NR - Not Reported 1Relative to B-CP
The external laboratory results for raw material 3 are tabulated in Table 5-4. The most
noticeable fluctuations were in the Fe2O3, K2O, MgO, Na2O, SiO2, and SO3 contents. The large
fluctuations observed in RM3 are most likely due to testing one sample. Notable trace elements
that significantly varied from the baseline include As, Hg, Cu, Ni, and Pb. The external laboratory
results for raw material 4 are tabulated in Table 5-5. RM4 stayed fairly consistent over the trial
burns. The most noticeable fluctuations were in the K2O, Na2O, and SO3 contents. The only
trace element that varied significantly from the baseline was Hg. The external laboratory results
for raw material 5 are tabulated in Table 5-6. The most noticeable fluctuations were in the Al2O3,
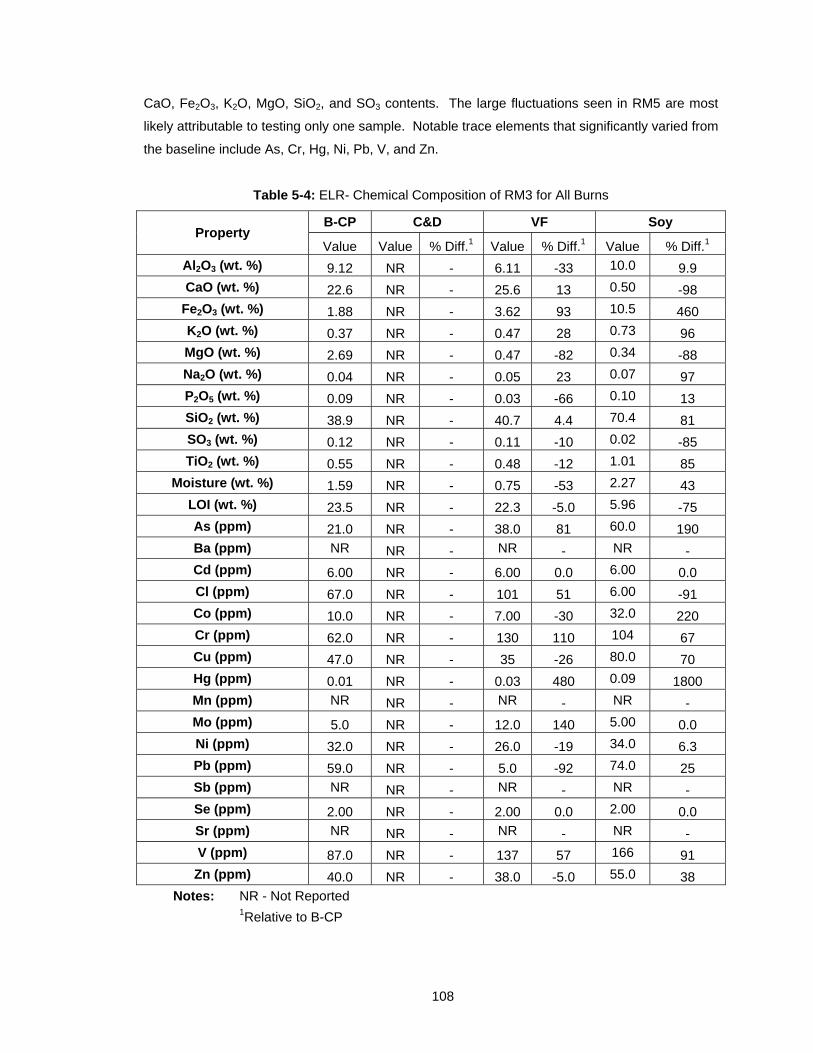
108
CaO, Fe2O3, K2O, MgO, SiO2, and SO3 contents. The large fluctuations seen in RM5 are most
likely attributable to testing only one sample. Notable trace elements that significantly varied from
the baseline include As, Cr, Hg, Ni, Pb, V, and Zn.
Table 5-4: ELR- Chemical Composition of RM3 for All Burns
Property B-CP C&D VF Soy
Value Value % Diff.1 Value % Diff.1 Value % Diff.1
Al2O3 (wt. %) 9.12 NR - 6.11 -33 10.0 9.9
CaO (wt. %) 22.6 NR - 25.6 13 0.50 -98
Fe2O3 (wt. %) 1.88 NR - 3.62 93 10.5 460
K2O (wt. %) 0.37 NR - 0.47 28 0.73 96
MgO (wt. %) 2.69 NR - 0.47 -82 0.34 -88
Na2O (wt. %) 0.04 NR - 0.05 23 0.07 97
P2O5 (wt. %) 0.09 NR - 0.03 -66 0.10 13
SiO2 (wt. %) 38.9 NR - 40.7 4.4 70.4 81
SO3 (wt. %) 0.12 NR - 0.11 -10 0.02 -85
TiO2 (wt. %) 0.55 NR - 0.48 -12 1.01 85
Moisture (wt. %) 1.59 NR - 0.75 -53 2.27 43
LOI (wt. %) 23.5 NR - 22.3 -5.0 5.96 -75
As (ppm) 21.0 NR - 38.0 81 60.0 190
Ba (ppm) NR NR - NR - NR -
Cd (ppm) 6.00 NR - 6.00 0.0 6.00 0.0
Cl (ppm) 67.0 NR - 101 51 6.00 -91
Co (ppm) 10.0 NR - 7.00 -30 32.0 220
Cr (ppm) 62.0 NR - 130 110 104 67
Cu (ppm) 47.0 NR - 35 -26 80.0 70
Hg (ppm) 0.01 NR - 0.03 480 0.09 1800
Mn (ppm) NR NR - NR - NR -
Mo (ppm) 5.0 NR - 12.0 140 5.00 0.0
Ni (ppm) 32.0 NR - 26.0 -19 34.0 6.3
Pb (ppm) 59.0 NR - 5.0 -92 74.0 25
Sb (ppm) NR NR - NR - NR -
Se (ppm) 2.00 NR - 2.00 0.0 2.00 0.0
Sr (ppm) NR NR - NR - NR -
V (ppm) 87.0 NR - 137 57 166 91
Zn (ppm) 40.0 NR - 38.0 -5.0 55.0 38
Notes: NR - Not Reported 1Relative to B-CP
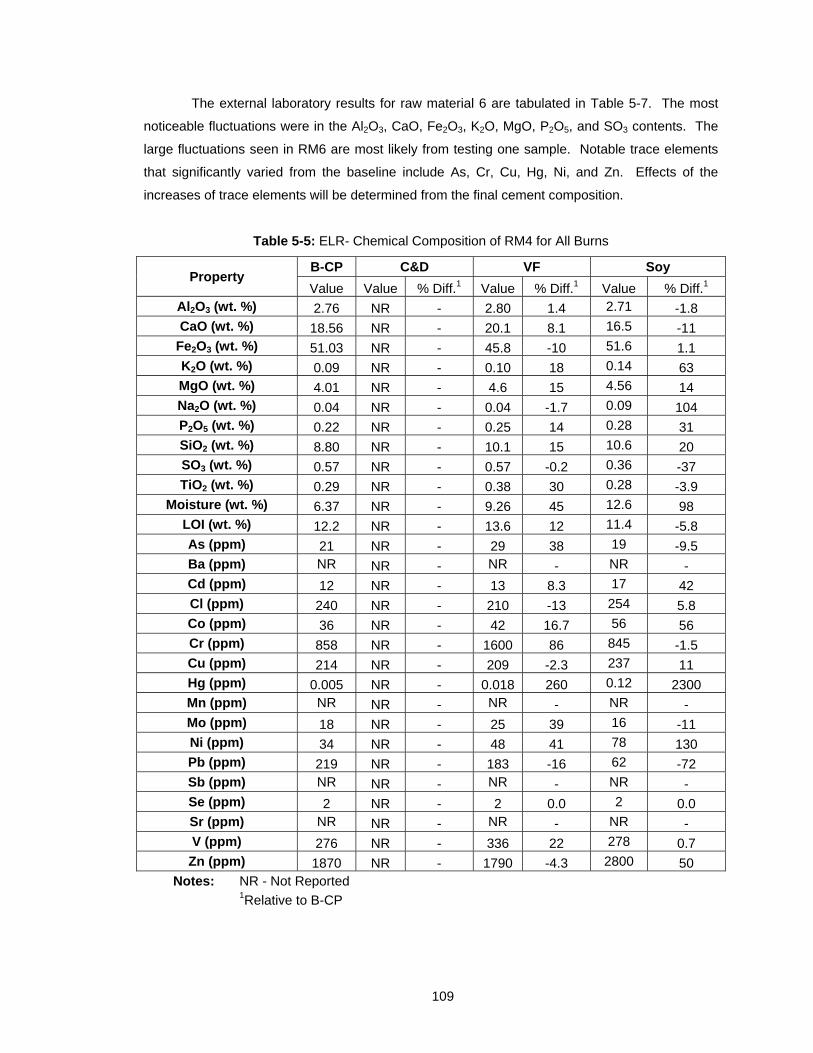
109
The external laboratory results for raw material 6 are tabulated in Table 5-7. The most
noticeable fluctuations were in the Al2O3, CaO, Fe2O3, K2O, MgO, P2O5, and SO3 contents. The
large fluctuations seen in RM6 are most likely from testing one sample. Notable trace elements
that significantly varied from the baseline include As, Cr, Cu, Hg, Ni, and Zn. Effects of the
increases of trace elements will be determined from the final cement composition.
Table 5-5: ELR- Chemical Composition of RM4 for All Burns
Property B-CP C&D VF Soy
Value Value % Diff.1 Value % Diff.1 Value % Diff.1 Al2O3 (wt. %) 2.76 NR - 2.80 1.4 2.71 -1.8 CaO (wt. %) 18.56 NR - 20.1 8.1 16.5 -11
Fe2O3 (wt. %) 51.03 NR - 45.8 -10 51.6 1.1 K2O (wt. %) 0.09 NR - 0.10 18 0.14 63 MgO (wt. %) 4.01 NR - 4.6 15 4.56 14 Na2O (wt. %) 0.04 NR - 0.04 -1.7 0.09 104 P2O5 (wt. %) 0.22 NR - 0.25 14 0.28 31 SiO2 (wt. %) 8.80 NR - 10.1 15 10.6 20 SO3 (wt. %) 0.57 NR - 0.57 -0.2 0.36 -37 TiO2 (wt. %) 0.29 NR - 0.38 30 0.28 -3.9
Moisture (wt. %) 6.37 NR - 9.26 45 12.6 98 LOI (wt. %) 12.2 NR - 13.6 12 11.4 -5.8 As (ppm) 21 NR - 29 38 19 -9.5 Ba (ppm) NR NR - NR - NR - Cd (ppm) 12 NR - 13 8.3 17 42 Cl (ppm) 240 NR - 210 -13 254 5.8 Co (ppm) 36 NR - 42 16.7 56 56 Cr (ppm) 858 NR - 1600 86 845 -1.5 Cu (ppm) 214 NR - 209 -2.3 237 11 Hg (ppm) 0.005 NR - 0.018 260 0.12 2300 Mn (ppm) NR NR - NR - NR - Mo (ppm) 18 NR - 25 39 16 -11 Ni (ppm) 34 NR - 48 41 78 130 Pb (ppm) 219 NR - 183 -16 62 -72 Sb (ppm) NR NR - NR - NR - Se (ppm) 2 NR - 2 0.0 2 0.0 Sr (ppm) NR NR - NR - NR - V (ppm) 276 NR - 336 22 278 0.7 Zn (ppm) 1870 NR - 1790 -4.3 2800 50
Notes: NR - Not Reported 1Relative to B-CP
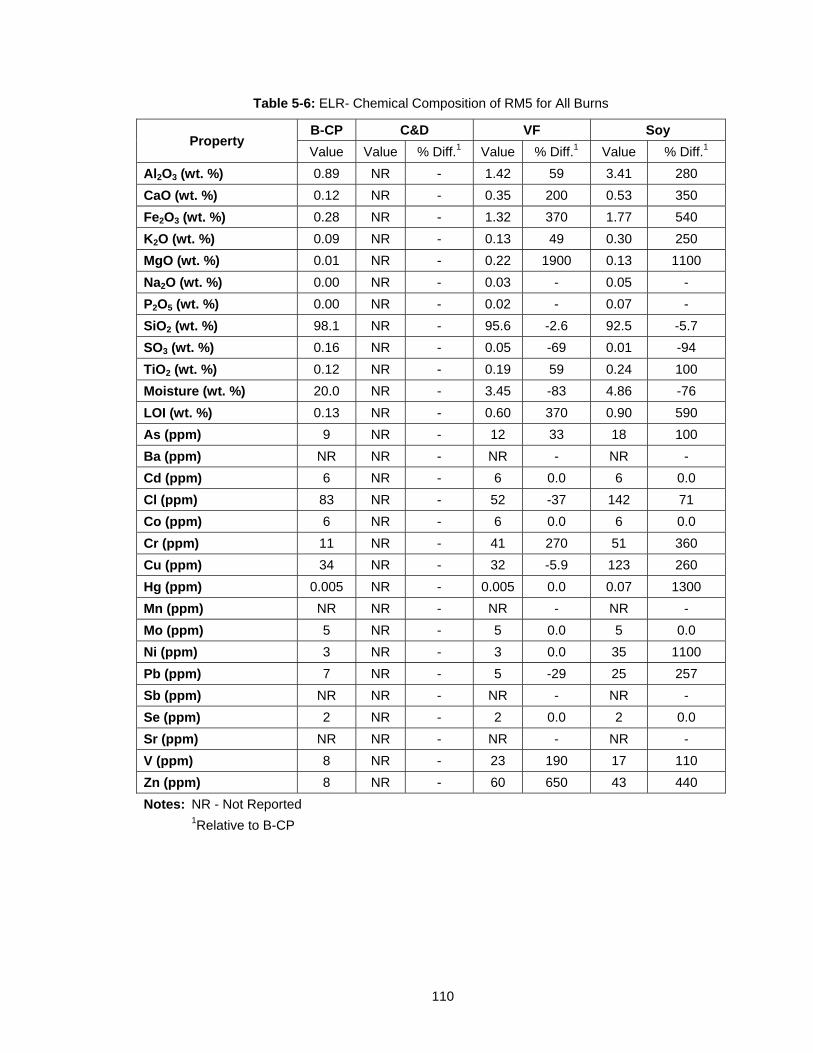
110
Table 5-6: ELR- Chemical Composition of RM5 for All Burns
Property B-CP C&D VF Soy
Value Value % Diff.1 Value % Diff.1 Value % Diff.1
Al2O3 (wt. %) 0.89 NR - 1.42 59 3.41 280
CaO (wt. %) 0.12 NR - 0.35 200 0.53 350
Fe2O3 (wt. %) 0.28 NR - 1.32 370 1.77 540
K2O (wt. %) 0.09 NR - 0.13 49 0.30 250
MgO (wt. %) 0.01 NR - 0.22 1900 0.13 1100
Na2O (wt. %) 0.00 NR - 0.03 - 0.05 -
P2O5 (wt. %) 0.00 NR - 0.02 - 0.07 -
SiO2 (wt. %) 98.1 NR - 95.6 -2.6 92.5 -5.7
SO3 (wt. %) 0.16 NR - 0.05 -69 0.01 -94
TiO2 (wt. %) 0.12 NR - 0.19 59 0.24 100
Moisture (wt. %) 20.0 NR - 3.45 -83 4.86 -76
LOI (wt. %) 0.13 NR - 0.60 370 0.90 590
As (ppm) 9 NR - 12 33 18 100
Ba (ppm) NR NR - NR - NR -
Cd (ppm) 6 NR - 6 0.0 6 0.0
Cl (ppm) 83 NR - 52 -37 142 71
Co (ppm) 6 NR - 6 0.0 6 0.0
Cr (ppm) 11 NR - 41 270 51 360
Cu (ppm) 34 NR - 32 -5.9 123 260
Hg (ppm) 0.005 NR - 0.005 0.0 0.07 1300
Mn (ppm) NR NR - NR - NR -
Mo (ppm) 5 NR - 5 0.0 5 0.0
Ni (ppm) 3 NR - 3 0.0 35 1100
Pb (ppm) 7 NR - 5 -29 25 257
Sb (ppm) NR NR - NR - NR -
Se (ppm) 2 NR - 2 0.0 2 0.0
Sr (ppm) NR NR - NR - NR -
V (ppm) 8 NR - 23 190 17 110
Zn (ppm) 8 NR - 60 650 43 440
Notes: NR - Not Reported 1Relative to B-CP
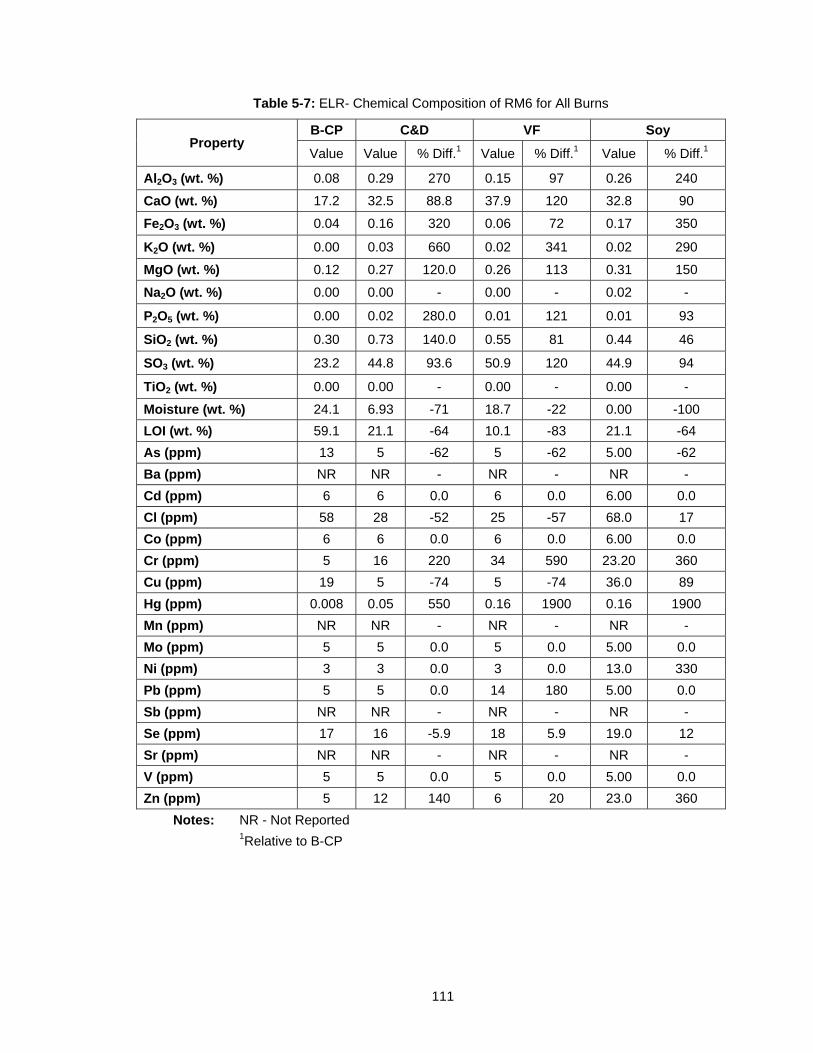
111
Table 5-7: ELR- Chemical Composition of RM6 for All Burns
Property B-CP C&D VF Soy
Value Value % Diff.1 Value % Diff.1 Value % Diff.1
Al2O3 (wt. %) 0.08 0.29 270 0.15 97 0.26 240
CaO (wt. %) 17.2 32.5 88.8 37.9 120 32.8 90
Fe2O3 (wt. %) 0.04 0.16 320 0.06 72 0.17 350
K2O (wt. %) 0.00 0.03 660 0.02 341 0.02 290
MgO (wt. %) 0.12 0.27 120.0 0.26 113 0.31 150
Na2O (wt. %) 0.00 0.00 - 0.00 - 0.02 -
P2O5 (wt. %) 0.00 0.02 280.0 0.01 121 0.01 93
SiO2 (wt. %) 0.30 0.73 140.0 0.55 81 0.44 46
SO3 (wt. %) 23.2 44.8 93.6 50.9 120 44.9 94
TiO2 (wt. %) 0.00 0.00 - 0.00 - 0.00 -
Moisture (wt. %) 24.1 6.93 -71 18.7 -22 0.00 -100
LOI (wt. %) 59.1 21.1 -64 10.1 -83 21.1 -64
As (ppm) 13 5 -62 5 -62 5.00 -62
Ba (ppm) NR NR - NR - NR -
Cd (ppm) 6 6 0.0 6 0.0 6.00 0.0
Cl (ppm) 58 28 -52 25 -57 68.0 17
Co (ppm) 6 6 0.0 6 0.0 6.00 0.0
Cr (ppm) 5 16 220 34 590 23.20 360
Cu (ppm) 19 5 -74 5 -74 36.0 89
Hg (ppm) 0.008 0.05 550 0.16 1900 0.16 1900
Mn (ppm) NR NR - NR - NR -
Mo (ppm) 5 5 0.0 5 0.0 5.00 0.0
Ni (ppm) 3 3 0.0 3 0.0 13.0 330
Pb (ppm) 5 5 0.0 14 180 5.00 0.0
Sb (ppm) NR NR - NR - NR -
Se (ppm) 17 16 -5.9 18 5.9 19.0 12
Sr (ppm) NR NR - NR - NR -
V (ppm) 5 5 0.0 5 0.0 5.00 0.0
Zn (ppm) 5 12 140 6 20 23.0 360
Notes: NR - Not Reported 1Relative to B-CP
112
5.4.2 Chemical Composition of Kiln Feed
Kiln feed comprises specific proportions of ground raw materials and recycled cement kiln dust
and is the primary process input into the kiln system. Changes in the chemical composition of
any of the raw material can influence the chemical composition of the kiln feed. Throughout this
study, kiln feed was sampled twice per day in order to obtain the average chemical composition.
The average percent by weight (Avg. wt. %) and the percent difference relative to the baseline
(%Diff.) for all burns collected by the cement plant are tabulated in Table 5-8. Summary statistics
are not presented for the kiln feed due to the limited number of samples collected.
The percent differences between the trial burns and the baseline burn as reported by the
cement plant are shown in Figure 5-2Error! Reference source not found.. Most of the
parameters are seen to be relatively consistent with the baseline conditions. The greatest
difference is seen in the increase of SO3 content over all the burns conducted. This increase may
be attributed to the significantly higher sulfite contents of the cement kiln dust for each trial burn
compared to the baseline. The SO3 was elevated in the cement kiln dust over 400 % for all the
trial burns. These results are shown in Figure 5-3 B.
The results from the external laboratory are presented in Table 5-9. Compared to the
cement laboratory results, the external lab results showed more variability in most compounds in
the kiln feed throughout this study. The sulfite levels reported by the external laboratory for the
trial burns are similar to the cement plant laboratory findings. Hg and Cr were increased over all
burns. Pb, Cu, and Zn varied over all the burns. Cl and V were decreased over the trial burns
compared to the baseline’s results.
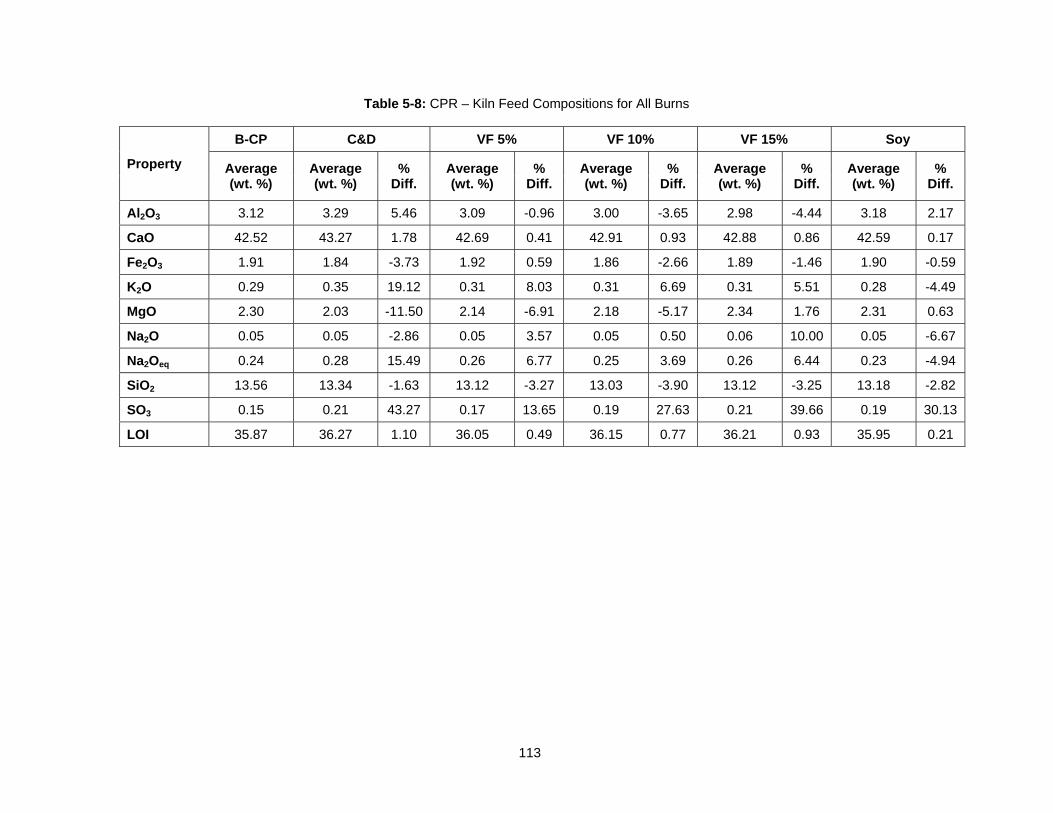
113
Table 5-8: CPR – Kiln Feed Compositions for All Burns
Property
B-CP C&D VF 5% VF 10% VF 15% Soy
Average (wt. %)
Average (wt. %)
% Diff.
Average (wt. %)
% Diff.
Average (wt. %)
% Diff.
Average (wt. %)
% Diff.
Average (wt. %)
% Diff.
Al2O3 3.12 3.29 5.46 3.09 -0.96 3.00 -3.65 2.98 -4.44 3.18 2.17
CaO 42.52 43.27 1.78 42.69 0.41 42.91 0.93 42.88 0.86 42.59 0.17
Fe2O3 1.91 1.84 -3.73 1.92 0.59 1.86 -2.66 1.89 -1.46 1.90 -0.59
K2O 0.29 0.35 19.12 0.31 8.03 0.31 6.69 0.31 5.51 0.28 -4.49
MgO 2.30 2.03 -11.50 2.14 -6.91 2.18 -5.17 2.34 1.76 2.31 0.63
Na2O 0.05 0.05 -2.86 0.05 3.57 0.05 0.50 0.06 10.00 0.05 -6.67
Na2Oeq 0.24 0.28 15.49 0.26 6.77 0.25 3.69 0.26 6.44 0.23 -4.94
SiO2 13.56 13.34 -1.63 13.12 -3.27 13.03 -3.90 13.12 -3.25 13.18 -2.82
SO3 0.15 0.21 43.27 0.17 13.65 0.19 27.63 0.21 39.66 0.19 30.13
LOI 35.87 36.27 1.10 36.05 0.49 36.15 0.77 36.21 0.93 35.95 0.21
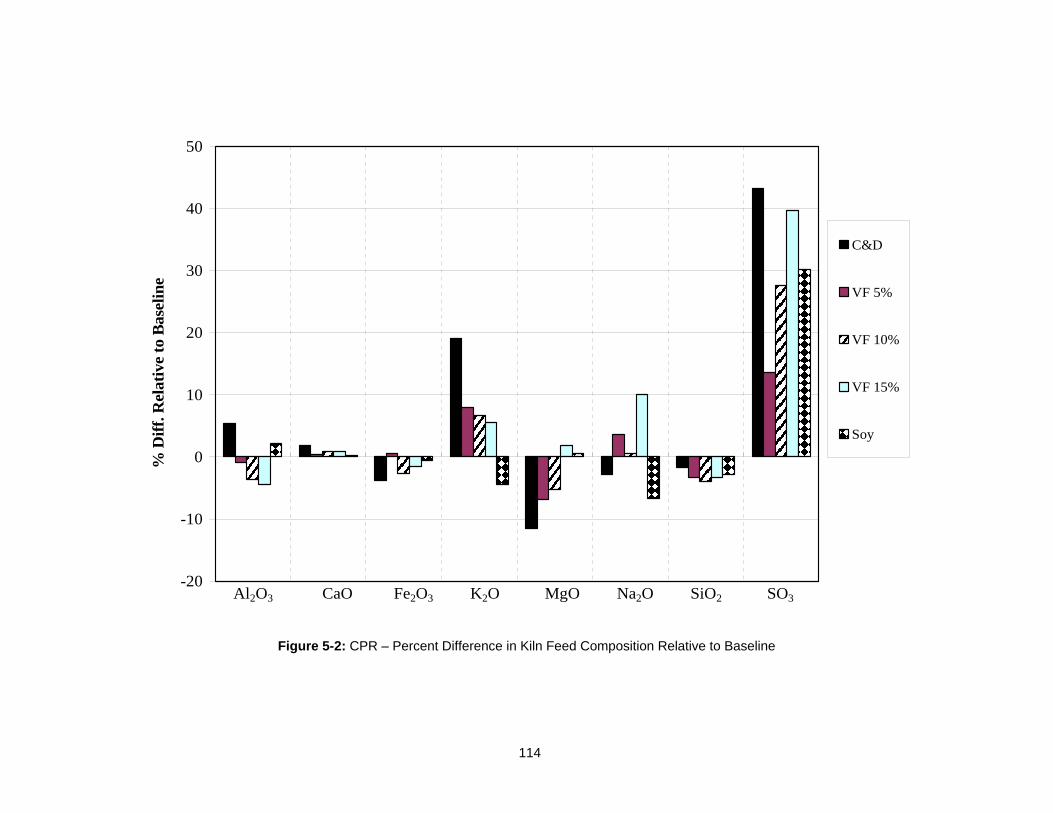
114
Figure 5-2: CPR – Percent Difference in Kiln Feed Composition Relative to Baseline
-20
-10
0
10
20
30
40
50%
Dif
f. R
elat
ive
to B
asel
ine
C&D
VF 5%
VF 10%
VF 15%
Soy
Al2O3 CaO Fe2O3 K2O MgO Na2O SiO2 SO3
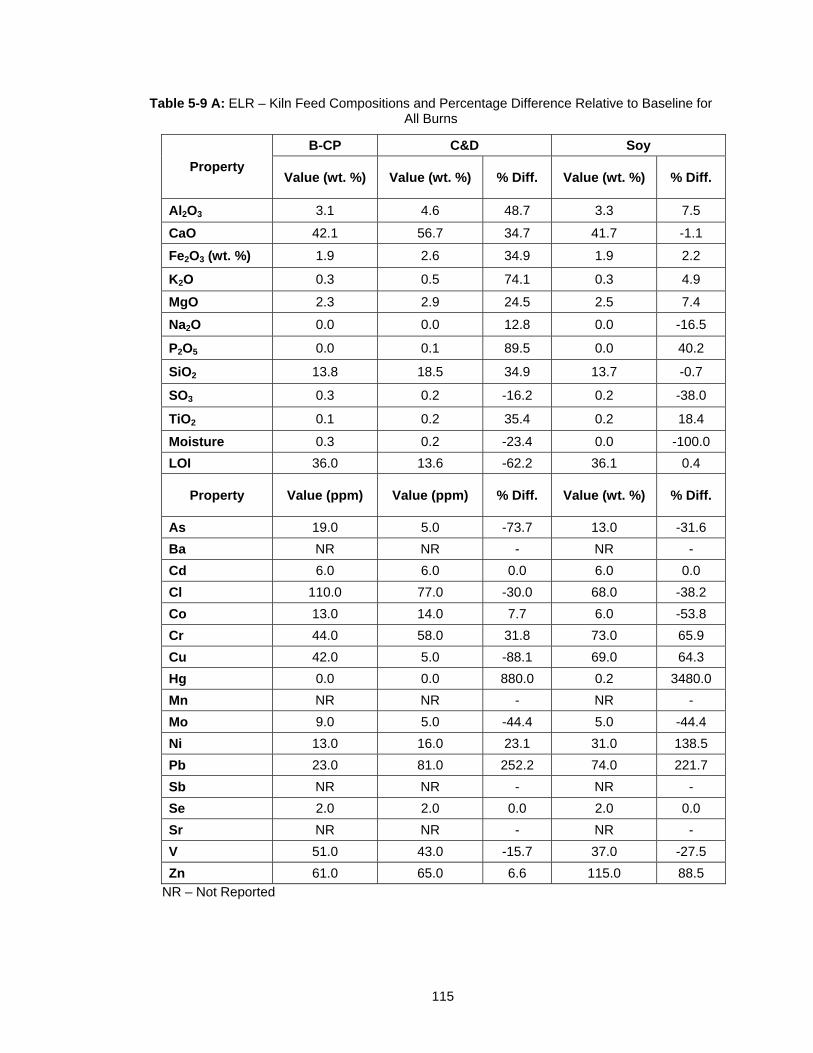
115
Table 5-9 A: ELR – Kiln Feed Compositions and Percentage Difference Relative to Baseline for All Burns
Property
B-CP C&D Soy
Value (wt. %) Value (wt. %) % Diff. Value (wt. %) % Diff.
Al2O3 3.1 4.6 48.7 3.3 7.5
CaO 42.1 56.7 34.7 41.7 -1.1
Fe2O3 (wt. %) 1.9 2.6 34.9 1.9 2.2
K2O 0.3 0.5 74.1 0.3 4.9
MgO 2.3 2.9 24.5 2.5 7.4
Na2O 0.0 0.0 12.8 0.0 -16.5
P2O5 0.0 0.1 89.5 0.0 40.2
SiO2 13.8 18.5 34.9 13.7 -0.7
SO3 0.3 0.2 -16.2 0.2 -38.0
TiO2 0.1 0.2 35.4 0.2 18.4
Moisture 0.3 0.2 -23.4 0.0 -100.0
LOI 36.0 13.6 -62.2 36.1 0.4
Property Value (ppm) Value (ppm) % Diff. Value (wt. %) % Diff.
As 19.0 5.0 -73.7 13.0 -31.6
Ba NR NR - NR -
Cd 6.0 6.0 0.0 6.0 0.0
Cl 110.0 77.0 -30.0 68.0 -38.2
Co 13.0 14.0 7.7 6.0 -53.8
Cr 44.0 58.0 31.8 73.0 65.9
Cu 42.0 5.0 -88.1 69.0 64.3
Hg 0.0 0.0 880.0 0.2 3480.0
Mn NR NR - NR -
Mo 9.0 5.0 -44.4 5.0 -44.4
Ni 13.0 16.0 23.1 31.0 138.5
Pb 23.0 81.0 252.2 74.0 221.7
Sb NR NR - NR -
Se 2.0 2.0 0.0 2.0 0.0
Sr NR NR - NR -
V 51.0 43.0 -15.7 37.0 -27.5
Zn 61.0 65.0 6.6 115.0 88.5
NR – Not Reported

116
Table 5-9 B: ELR – Kiln Feed Compositions and Percentage Difference Relative to Baseline for All Burns
Property
B-CP VF 5% VF 10% VF 15%
Value (wt. %)
Value (wt. %)
% Diff.Value (wt. %)
% Diff. Value (wt. %)
% Diff.
Al2O3 3.1 3.1 -0.2 3.0 -1.8 3.0 -3.3
CaO 42.1 42.5 1.1 42.5 0.9 42.4 0.8
Fe2O3 (wt. %) 1.9 1.9 1.0 1.9 0.7 1.9 0.4
K2O 0.3 0.3 6.4 0.3 7.7 0.3 8.9
MgO 2.3 2.3 -1.8 2.3 1.3 2.4 4.4
Na2O 0.0 0.0 -0.6 0.0 -17.2 0.0 -33.7
P2O5 0.0 0.0 39.1 0.0 29.2 0.0 19.3
SiO2 13.8 13.4 -2.4 13.4 -2.3 13.5 -2.1
SO3 0.3 0.2 -26.7 0.2 -27.8 0.2 -29.0
TiO2 0.1 0.2 8.4 0.2 8.4 0.2 8.4
Moisture 0.3 0.2 -46.5 0.2 -42.4 0.2 -38.3
LOI 36.0 36.0 -0.1 36.0 0.0 36.0 0.0
Property Value (ppm)
Value (ppm)
% Diff.Value (ppm)
% Diff. Value (wt. %)
% Diff.
As 19.0 35.0 84.2 30.0 57.9 25.0 31.6
Ba NR NR - NR - NR -
Cd 6.0 6.0 0.0 6.0 0.0 6.0 0.0
Cl 110.0 115.0 4.5 98.0 -10.9 81.0 -26.4
Co 13.0 11.0 -15.4 9.5 -26.9 8.0 -38.5
Cr 44.0 61.5 39.7 58.0 31.9 54.6 24.1
Cu 42.0 47.0 11.9 43.5 3.6 40.0 -4.8
Hg 0.0 0.0 160.0 0.0 150.0 0.0 140.0
Mn NR NR - NR - NR -
Mo 9.0 5.0 -44.4 6.0 -33.3 6.0 -33.3
Ni 13.0 10.0 -23.1 10.5 -19.2 11.0 -15.4
Pb 23.0 5.0 -78.3 20.0 -13.0 20.0 -13.0
Sb NR NR - NR - NR -
Se 2.0 2.0 0.0 2.0 0.0 2.0 0.0
Sr NR NR - NR - NR -
V 51.0 48.0 -5.9 50.0 -2.0 52.0 2.0
Zn 61.0 54.0 -11.5 58.0 -4.9 62.0 1.6
NR – Not Reported

117
5.4.3 Chemical Composition of Cement Kiln Dust
Dust collected throughout the pyroprocess is known as cement kiln dust (CKD). Since CKD is
primarily comprised of calcinated and partially calcinated kiln feed, it is often recycled into the kiln
feed. During this study, CKD samples were collected twice daily and tested as discrete
specimens by both chemical analysis laboratories. Statistical analysis was not conducted for the
cement kiln dust due to an insufficient number of samples collected.
The average weights and percent difference relative to the baseline for each CKD
parameter collected over the duration of this study are presented in Table 5-10. The loss on
ignition (LOI) and moisture content parameters of the CKD specimens were not determined by
the cement plant. A graphical representation of the percent difference is shown in Figure 5-3.
From this figure, it can be seen that most of the parameters show consistency with the baseline
burn. The MgO and SO3 contents are increased from the baseline burn. Both the laboratories
show an increase in MgO for the VF 15% burn. RM5 also showed elevated MgO contents
relative to the baseline conditions. Similar to the kiln feed, the SO3 content is drastically elevated
over the baseline. External laboratory results also show a significant SO3 increase over baseline
conditions.
The External laboratory results are shown in Table 5-11. All the burns exhibited
significant decreases in Hg, Cl, and Pb. The results from Cu, Cr, V, and Zn varied greatly for all
the trial burns. Some of the same fluctuations were noticed with the kiln feed as well. This is
expected due to typical incorporation of CKD into the kiln feed.
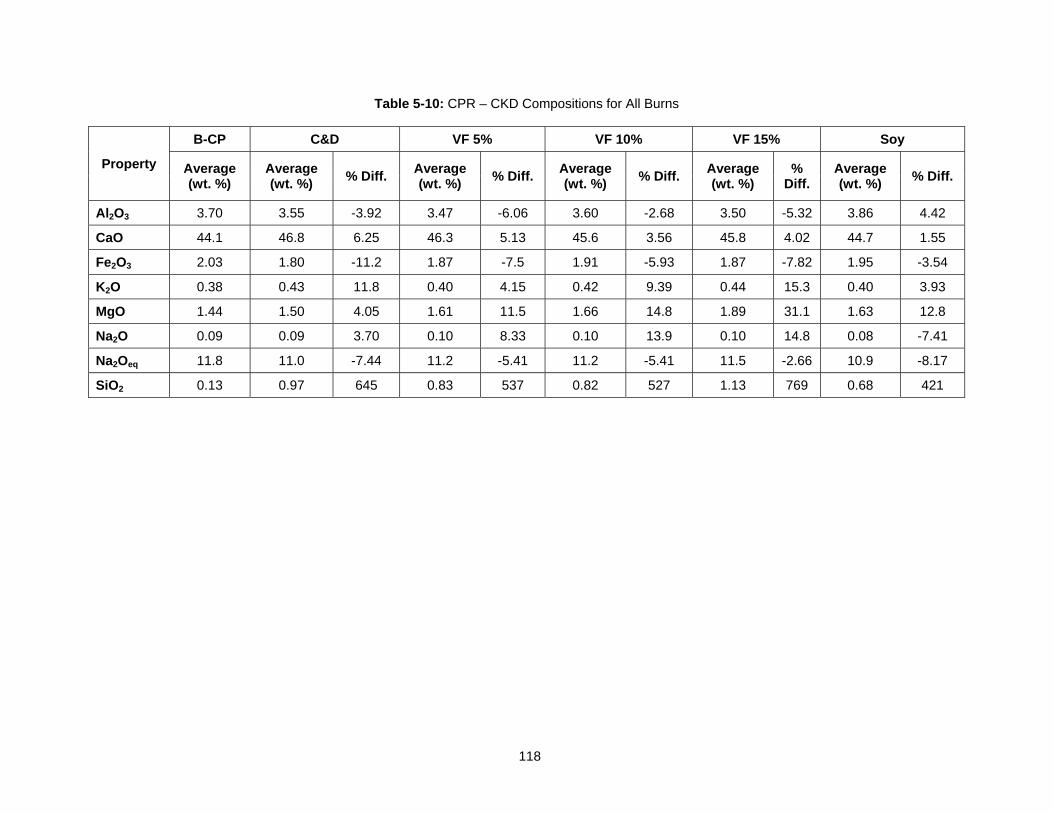
118
Table 5-10: CPR – CKD Compositions for All Burns
Property
B-CP C&D VF 5% VF 10% VF 15% Soy
Average (wt. %)
Average (wt. %)
% Diff. Average (wt. %)
% Diff. Average (wt. %)
% Diff. Average (wt. %)
% Diff.
Average (wt. %)
% Diff.
Al2O3 3.70 3.55 -3.92 3.47 -6.06 3.60 -2.68 3.50 -5.32 3.86 4.42
CaO 44.1 46.8 6.25 46.3 5.13 45.6 3.56 45.8 4.02 44.7 1.55
Fe2O3 2.03 1.80 -11.2 1.87 -7.5 1.91 -5.93 1.87 -7.82 1.95 -3.54
K2O 0.38 0.43 11.8 0.40 4.15 0.42 9.39 0.44 15.3 0.40 3.93
MgO 1.44 1.50 4.05 1.61 11.5 1.66 14.8 1.89 31.1 1.63 12.8
Na2O 0.09 0.09 3.70 0.10 8.33 0.10 13.9 0.10 14.8 0.08 -7.41
Na2Oeq 11.8 11.0 -7.44 11.2 -5.41 11.2 -5.41 11.5 -2.66 10.9 -8.17
SiO2 0.13 0.97 645 0.83 537 0.82 527 1.13 769 0.68 421
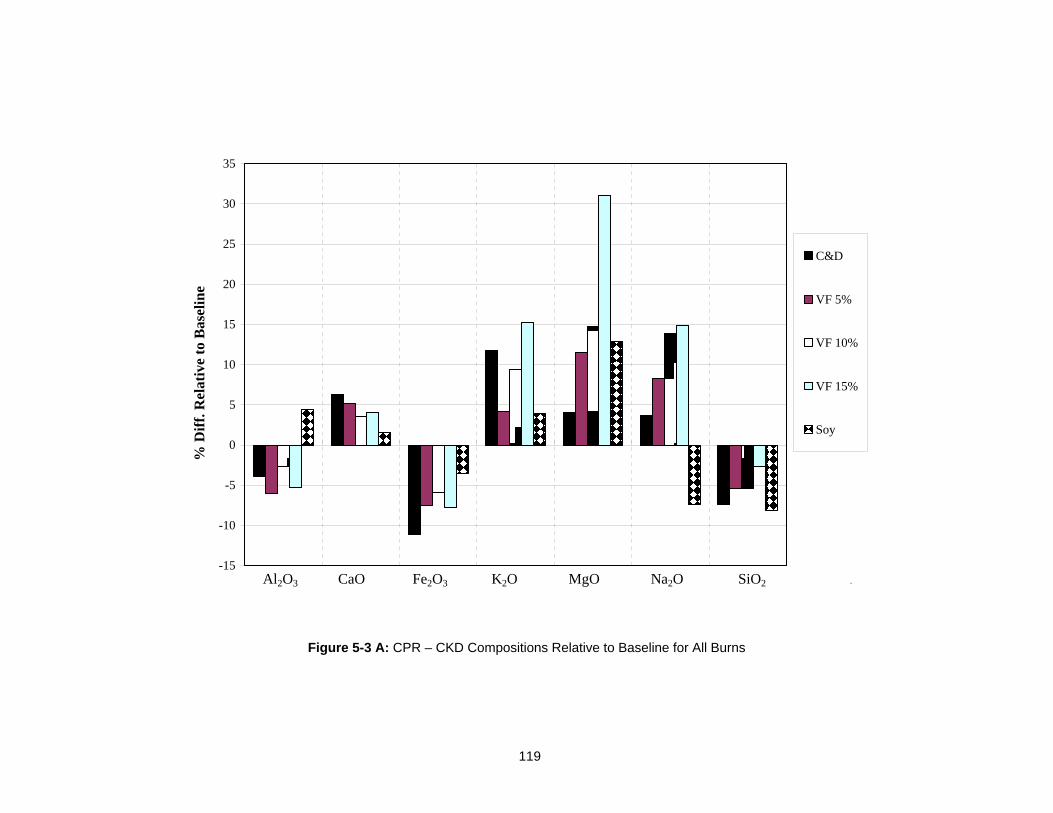
119
Figure 5-3 A: CPR – CKD Compositions Relative to Baseline for All Burns
-15
-10
-5
0
5
10
15
20
25
30
35
% D
iff.
Rel
ativ
e to
Bas
elin
e
C&D
VF 5%
VF 10%
VF 15%
Soy
Al2O3 CaO Fe2O3 K2O MgO Na2O SiO2 .
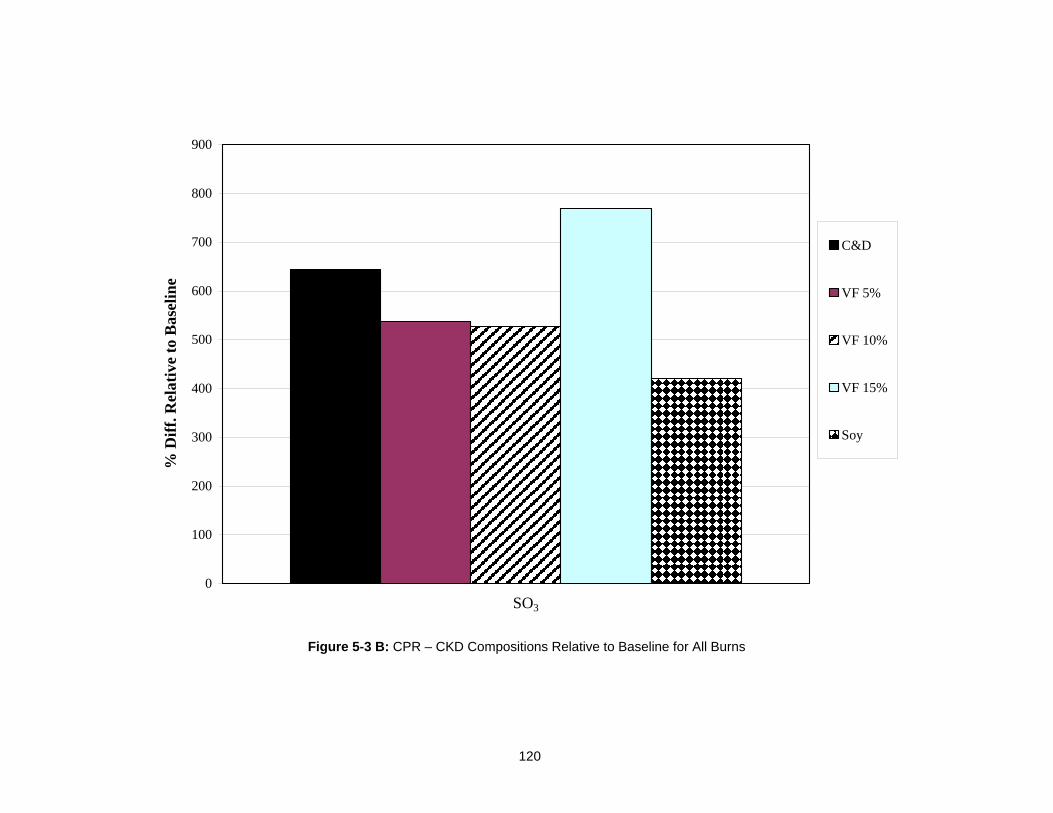
120
Figure 5-3 B: CPR – CKD Compositions Relative to Baseline for All Burns
0
100
200
300
400
500
600
700
800
900
% D
iff.
Rel
ativ
e to
Bas
elin
e
C&D
VF 5%
VF 10%
VF 15%
Soy
SO3
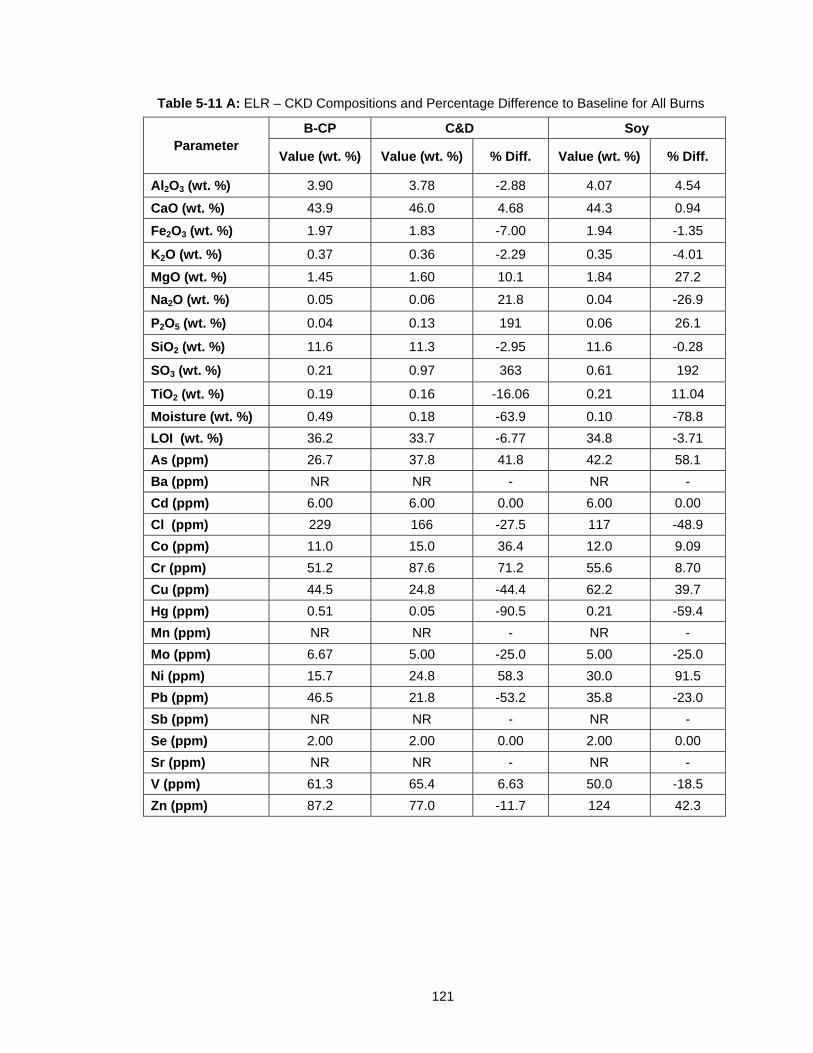
121
Table 5-11 A: ELR – CKD Compositions and Percentage Difference to Baseline for All Burns
Parameter B-CP C&D Soy
Value (wt. %) Value (wt. %) % Diff. Value (wt. %) % Diff.
Al2O3 (wt. %) 3.90 3.78 -2.88 4.07 4.54
CaO (wt. %) 43.9 46.0 4.68 44.3 0.94
Fe2O3 (wt. %) 1.97 1.83 -7.00 1.94 -1.35
K2O (wt. %) 0.37 0.36 -2.29 0.35 -4.01
MgO (wt. %) 1.45 1.60 10.1 1.84 27.2
Na2O (wt. %) 0.05 0.06 21.8 0.04 -26.9
P2O5 (wt. %) 0.04 0.13 191 0.06 26.1
SiO2 (wt. %) 11.6 11.3 -2.95 11.6 -0.28
SO3 (wt. %) 0.21 0.97 363 0.61 192
TiO2 (wt. %) 0.19 0.16 -16.06 0.21 11.04
Moisture (wt. %) 0.49 0.18 -63.9 0.10 -78.8
LOI (wt. %) 36.2 33.7 -6.77 34.8 -3.71
As (ppm) 26.7 37.8 41.8 42.2 58.1
Ba (ppm) NR NR - NR -
Cd (ppm) 6.00 6.00 0.00 6.00 0.00
Cl (ppm) 229 166 -27.5 117 -48.9
Co (ppm) 11.0 15.0 36.4 12.0 9.09
Cr (ppm) 51.2 87.6 71.2 55.6 8.70
Cu (ppm) 44.5 24.8 -44.4 62.2 39.7
Hg (ppm) 0.51 0.05 -90.5 0.21 -59.4
Mn (ppm) NR NR - NR -
Mo (ppm) 6.67 5.00 -25.0 5.00 -25.0
Ni (ppm) 15.7 24.8 58.3 30.0 91.5
Pb (ppm) 46.5 21.8 -53.2 35.8 -23.0
Sb (ppm) NR NR - NR -
Se (ppm) 2.00 2.00 0.00 2.00 0.00
Sr (ppm) NR NR - NR -
V (ppm) 61.3 65.4 6.63 50.0 -18.5
Zn (ppm) 87.2 77.0 -11.7 124 42.3

122
Table 5-11 B: ELR – CKD Compositions and Percentage Difference to Baseline for All Burns
Parameter
B-CP VF 5% VF 10% VF 15%
Value (wt. %)
Value (wt. %)
% Diff. Value (wt. %)
% Diff. Value (wt. %)
% Diff.
Al2O3 (wt. %) 3.9 3.78 -2.9 3.92 0.5 3.88 -0.5
CaO (wt. %) 43.9 47.1 7.1 47.40 88.9 46.84 6.6
Fe2O3 (wt. %) 2.0 1.86 -5.3 1.93 -1.0 1.93 -2.0
K2O (wt. %) 0.4 0.36 -1.3 0.42 1.3 0.45 20.7
MgO (wt. %) 1.4 1.60 10.1 1.75 7.6 1.98 36.4
Na2O (wt. %) 0.0 0.05 -3.9 0.05 0.0 0.05 11.2
P2O5 (wt. %) 0.0 0.05 15.5 0.05 0.2 0.05 16.8
SiO2 (wt. %) 11.6 11.05 -5.0 10.98 -16.6 11.61 -0.2
SO3 (wt. %) 0.2 0.81 285 1.04 21.3 1.14 444
TiO2 (wt. %) 0.2 0.19 -0.5 0.19 0.0 0.20 5.3
Moisture (wt. %) 0.5 0.11 -77.6 0.08 -10.5 0.06 -87.7
LOI (wt. %) 36.2 33.1 -8.5 32.2 -102 31.8 -12.1
As (ppm) 26.7 38 43.4 42 394 45 67.5
Ba (ppm) NR NR - NR - NR -
Cd (ppm) 6.0 6 0.0 6 0.0 6 0.0
Cl (ppm) 229 192 -16.1 245 415 173 -24.3
Co (ppm) 11.0 14 27.3 12 25.7 12 12.1
Cr (ppm) 51.2 71 39.2 61 257 71 38.4
Cu (ppm) 45 70 57.3 37 -183.9 50 13.1
Hg (ppm) 0.5 0 -89.2 0 -12.0 0.02 -95.5
Mn (ppm) NR NR - NR - NR -
Mo (ppm) 6.7 5 -25.0 8 34.2 8 12.5
Ni (ppm) 15.7 17 8.5 23 180 54 245
Pb (ppm) 46.5 26 -43.5 32 -381 28 -40.9
Sb (ppm) NR NR - NR - NR -
Se (ppm) 2.0 2 0.0 2 0.0 2 0.0
Sr (ppm) NR NR - NR - NR -
V (ppm) 61.3 61 -0.1 70 222 274 346
Zn (ppm) 87.2 65 -25.1 79 -218 61 -29.6
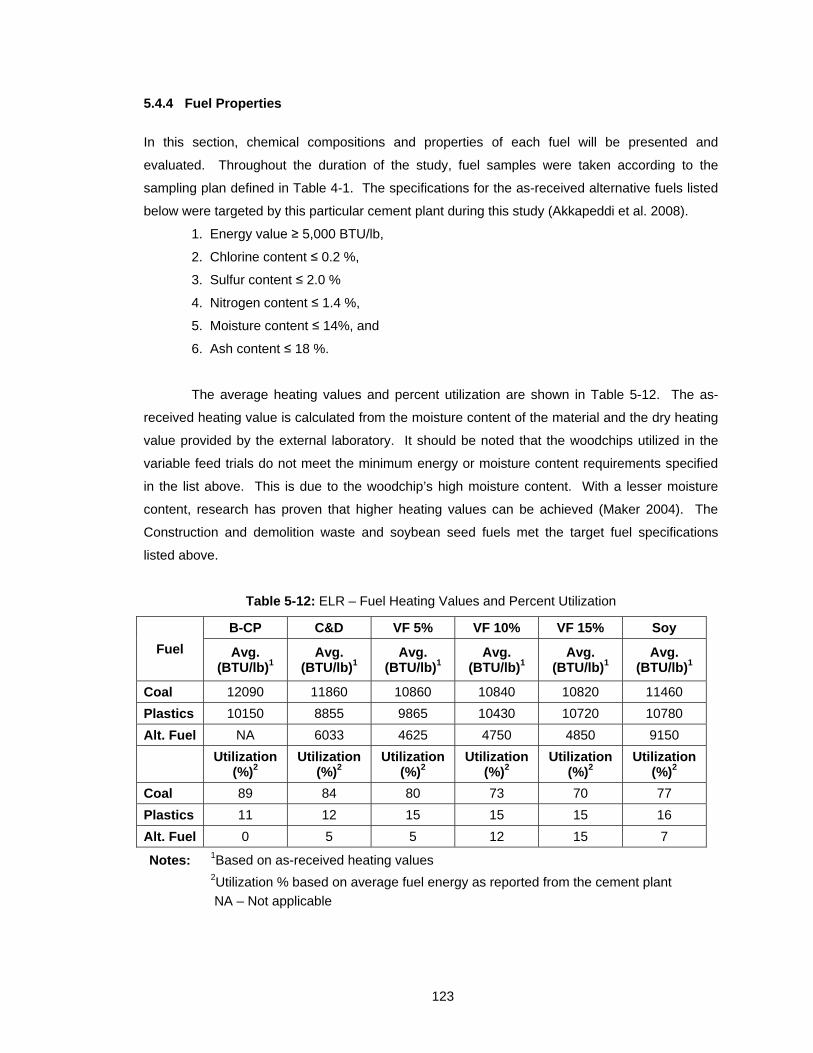
123
5.4.4 Fuel Properties
In this section, chemical compositions and properties of each fuel will be presented and
evaluated. Throughout the duration of the study, fuel samples were taken according to the
sampling plan defined in Table 4-1. The specifications for the as-received alternative fuels listed
below were targeted by this particular cement plant during this study (Akkapeddi et al. 2008).
1. Energy value ≥ 5,000 BTU/lb,
2. Chlorine content ≤ 0.2 %,
3. Sulfur content ≤ 2.0 %
4. Nitrogen content ≤ 1.4 %,
5. Moisture content ≤ 14%, and
6. Ash content ≤ 18 %.
The average heating values and percent utilization are shown in Table 5-12. The as-
received heating value is calculated from the moisture content of the material and the dry heating
value provided by the external laboratory. It should be noted that the woodchips utilized in the
variable feed trials do not meet the minimum energy or moisture content requirements specified
in the list above. This is due to the woodchip’s high moisture content. With a lesser moisture
content, research has proven that higher heating values can be achieved (Maker 2004). The
Construction and demolition waste and soybean seed fuels met the target fuel specifications
listed above.
Table 5-12: ELR – Fuel Heating Values and Percent Utilization
Fuel
B-CP C&D VF 5% VF 10% VF 15% Soy
Avg. (BTU/lb)1
Avg. (BTU/lb)1
Avg. (BTU/lb)1
Avg. (BTU/lb)1
Avg. (BTU/lb)1
Avg. (BTU/lb)1
Coal 12090 11860 10860 10840 10820 11460
Plastics 10150 8855 9865 10430 10720 10780
Alt. Fuel NA 6033 4625 4750 4850 9150
Utilization
(%)2 Utilization
(%)2 Utilization
(%)2 Utilization
(%)2 Utilization
(%)2 Utilization
(%)2
Coal 89 84 80 73 70 77
Plastics 11 12 15 15 15 16
Alt. Fuel 0 5 5 12 15 7
Notes: 1Based on as-received heating values
2Utilization % based on average fuel energy as reported from the cement plant
NA – Not applicable
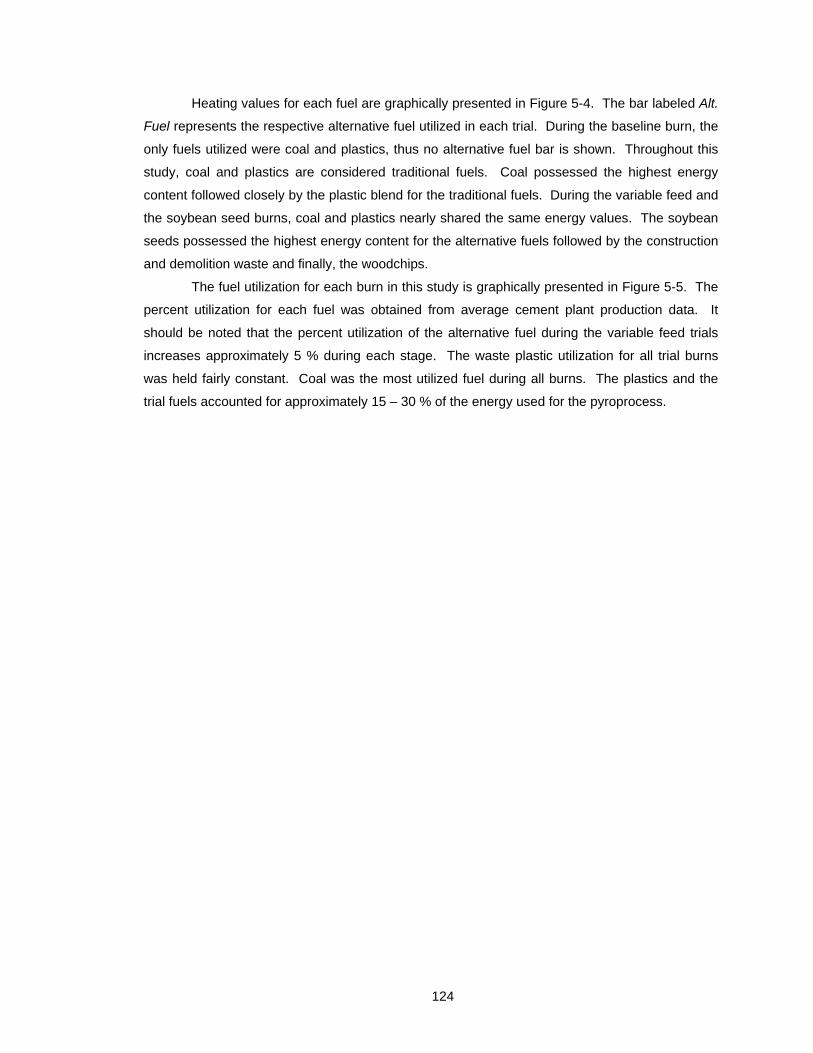
124
Heating values for each fuel are graphically presented in Figure 5-4. The bar labeled Alt.
Fuel represents the respective alternative fuel utilized in each trial. During the baseline burn, the
only fuels utilized were coal and plastics, thus no alternative fuel bar is shown. Throughout this
study, coal and plastics are considered traditional fuels. Coal possessed the highest energy
content followed closely by the plastic blend for the traditional fuels. During the variable feed and
the soybean seed burns, coal and plastics nearly shared the same energy values. The soybean
seeds possessed the highest energy content for the alternative fuels followed by the construction
and demolition waste and finally, the woodchips.
The fuel utilization for each burn in this study is graphically presented in Figure 5-5. The
percent utilization for each fuel was obtained from average cement plant production data. It
should be noted that the percent utilization of the alternative fuel during the variable feed trials
increases approximately 5 % during each stage. The waste plastic utilization for all trial burns
was held fairly constant. Coal was the most utilized fuel during all burns. The plastics and the
trial fuels accounted for approximately 15 – 30 % of the energy used for the pyroprocess.
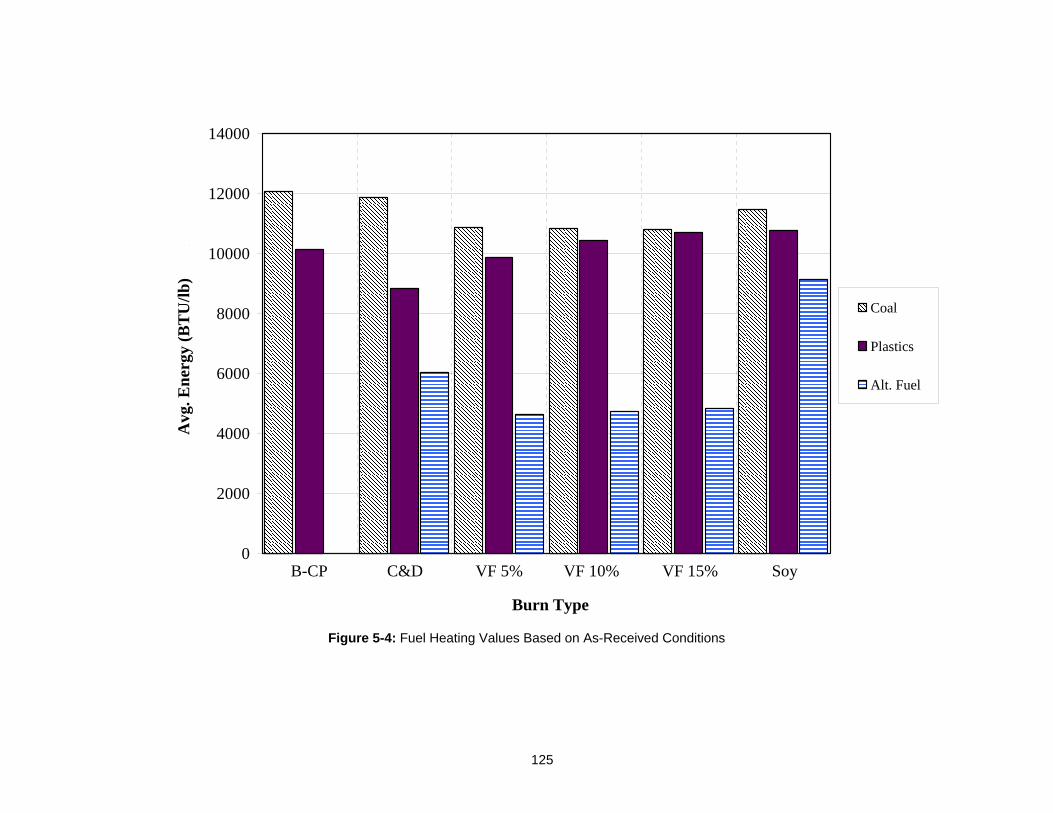
125
Figure 5-4: Fuel Heating Values Based on As-Received Conditions
0
2000
4000
6000
8000
10000
12000
14000
Burn Type
Avg
. En
ergy
(B
TU
/lb)
.
Coal
Plastics
Alt. Fuel
VF 15%C&DB-CP SoyVF 10%VF 5%
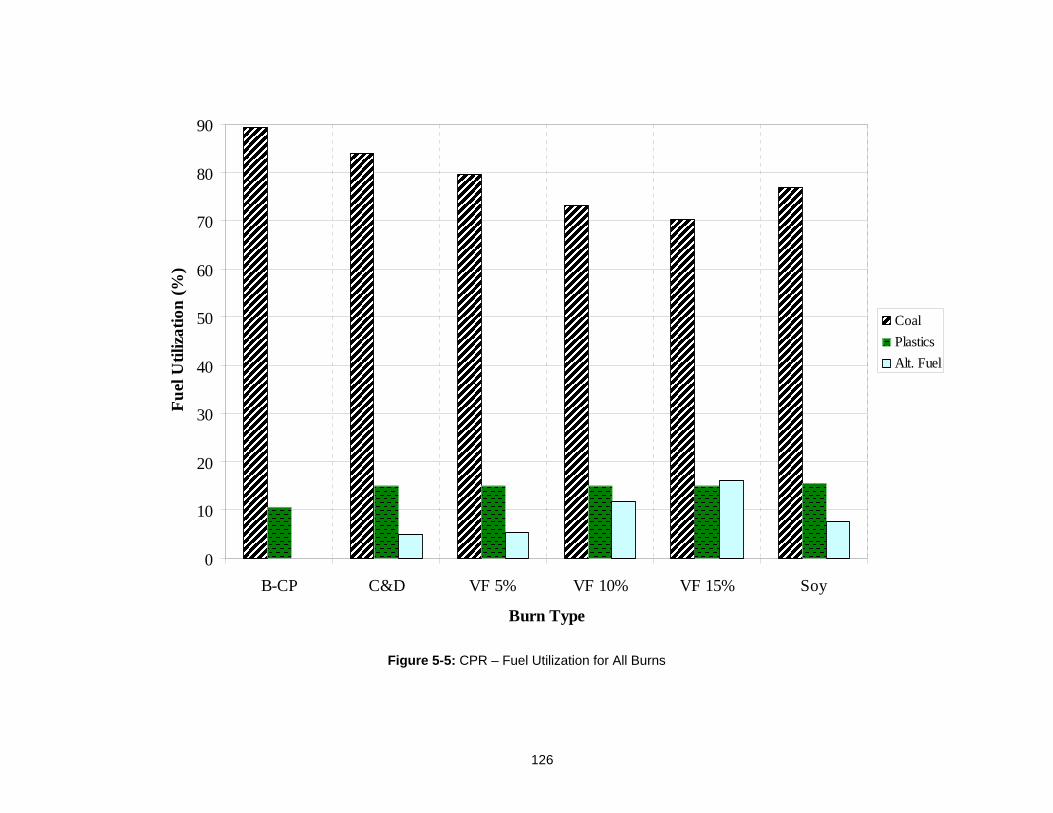
126
Figure 5-5: CPR – Fuel Utilization for All Burns
0
10
20
30
40
50
60
70
80
90
B-CP C&D VF 5% VF 10% VF 15% Soy
Burn Type
Fu
el U
tiliz
atio
n (
%)
Coal
Plastics
Alt. Fuel
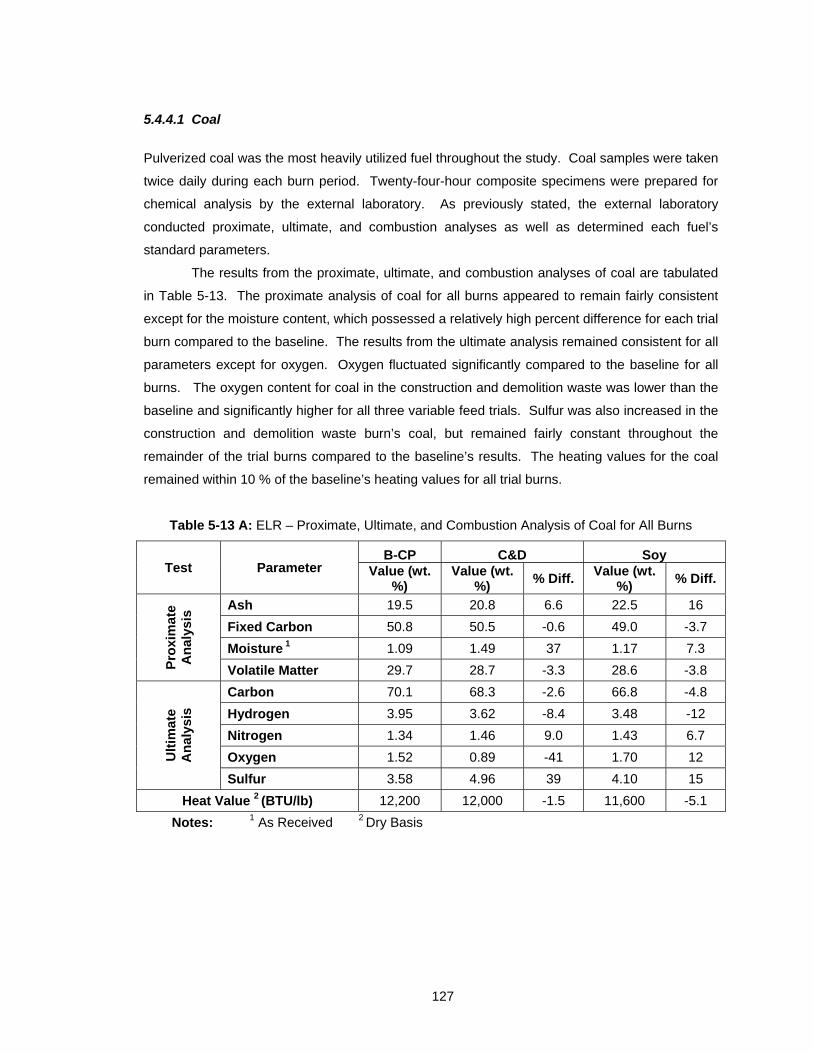
127
5.4.4.1 Coal
Pulverized coal was the most heavily utilized fuel throughout the study. Coal samples were taken
twice daily during each burn period. Twenty-four-hour composite specimens were prepared for
chemical analysis by the external laboratory. As previously stated, the external laboratory
conducted proximate, ultimate, and combustion analyses as well as determined each fuel’s
standard parameters.
The results from the proximate, ultimate, and combustion analyses of coal are tabulated
in Table 5-13. The proximate analysis of coal for all burns appeared to remain fairly consistent
except for the moisture content, which possessed a relatively high percent difference for each trial
burn compared to the baseline. The results from the ultimate analysis remained consistent for all
parameters except for oxygen. Oxygen fluctuated significantly compared to the baseline for all
burns. The oxygen content for coal in the construction and demolition waste was lower than the
baseline and significantly higher for all three variable feed trials. Sulfur was also increased in the
construction and demolition waste burn’s coal, but remained fairly constant throughout the
remainder of the trial burns compared to the baseline’s results. The heating values for the coal
remained within 10 % of the baseline’s heating values for all trial burns.
Table 5-13 A: ELR – Proximate, Ultimate, and Combustion Analysis of Coal for All Burns
Test Parameter B-CP C&D Soy
Value (wt. %)
Value (wt. %)
% Diff. Value (wt.
%) % Diff.
Pro
xim
ate
An
alys
is Ash 19.5 20.8 6.6 22.5 16
Fixed Carbon 50.8 50.5 -0.6 49.0 -3.7
Moisture 1 1.09 1.49 37 1.17 7.3
Volatile Matter 29.7 28.7 -3.3 28.6 -3.8
Ult
imat
e A
nal
ysis
Carbon 70.1 68.3 -2.6 66.8 -4.8
Hydrogen 3.95 3.62 -8.4 3.48 -12
Nitrogen 1.34 1.46 9.0 1.43 6.7
Oxygen 1.52 0.89 -41 1.70 12
Sulfur 3.58 4.96 39 4.10 15
Heat Value 2 (BTU/lb) 12,200 12,000 -1.5 11,600 -5.1
Notes: 1 As Received 2 Dry Basis
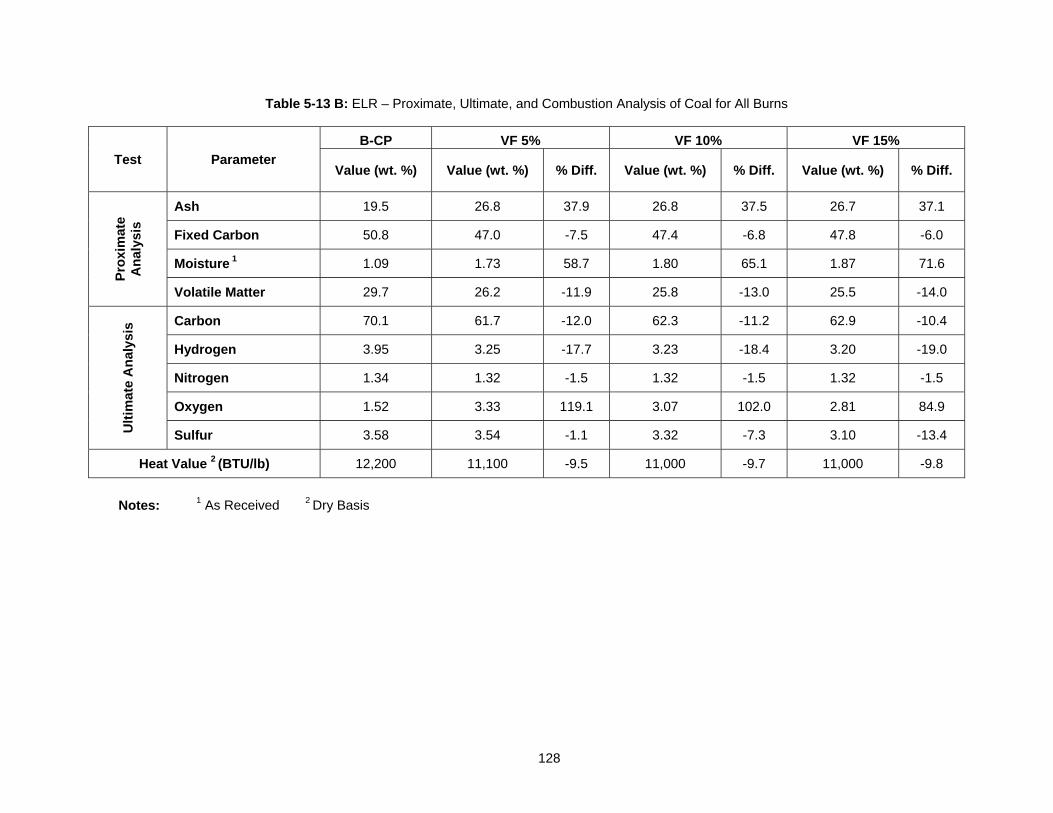
128
Table 5-13 B: ELR – Proximate, Ultimate, and Combustion Analysis of Coal for All Burns
Test Parameter
B-CP VF 5% VF 10% VF 15%
Value (wt. %) Value (wt. %) % Diff. Value (wt. %) % Diff. Value (wt. %) % Diff.
Pro
xim
ate
An
alys
is
Ash 19.5 26.8 37.9 26.8 37.5 26.7 37.1
Fixed Carbon 50.8 47.0 -7.5 47.4 -6.8 47.8 -6.0
Moisture 1 1.09 1.73 58.7 1.80 65.1 1.87 71.6
Volatile Matter 29.7 26.2 -11.9 25.8 -13.0 25.5 -14.0
Ult
imat
e A
nal
ysis
Carbon 70.1 61.7 -12.0 62.3 -11.2 62.9 -10.4
Hydrogen 3.95 3.25 -17.7 3.23 -18.4 3.20 -19.0
Nitrogen 1.34 1.32 -1.5 1.32 -1.5 1.32 -1.5
Oxygen 1.52 3.33 119.1 3.07 102.0 2.81 84.9
Sulfur 3.58 3.54 -1.1 3.32 -7.3 3.10 -13.4
Heat Value 2 (BTU/lb) 12,200 11,100 -9.5 11,000 -9.7 11,000 -9.8
Notes: 1 As Received 2 Dry Basis
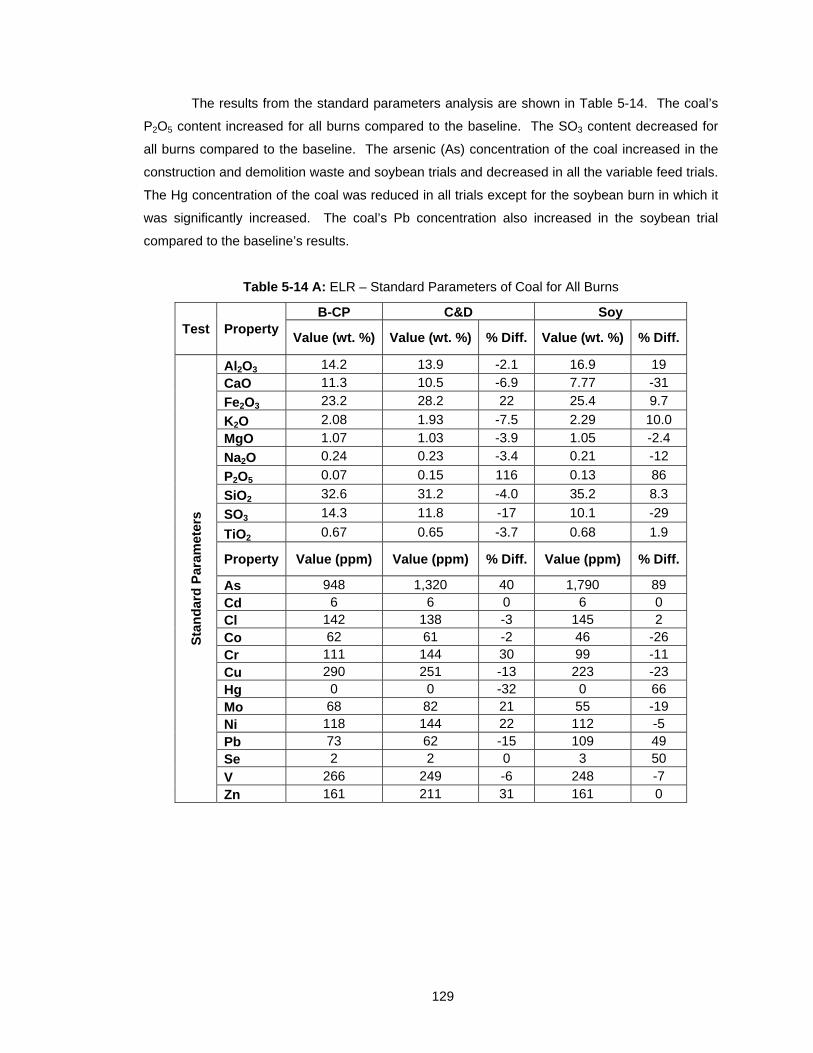
129
The results from the standard parameters analysis are shown in Table 5-14. The coal’s
P2O5 content increased for all burns compared to the baseline. The SO3 content decreased for
all burns compared to the baseline. The arsenic (As) concentration of the coal increased in the
construction and demolition waste and soybean trials and decreased in all the variable feed trials.
The Hg concentration of the coal was reduced in all trials except for the soybean burn in which it
was significantly increased. The coal’s Pb concentration also increased in the soybean trial
compared to the baseline’s results.
Table 5-14 A: ELR – Standard Parameters of Coal for All Burns
Test Property B-CP C&D Soy
Value (wt. %) Value (wt. %) % Diff. Value (wt. %) % Diff.
Sta
nd
ard
Par
amet
ers
Al2O3 14.2 13.9 -2.1 16.9 19
CaO 11.3 10.5 -6.9 7.77 -31
Fe2O3 23.2 28.2 22 25.4 9.7
K2O 2.08 1.93 -7.5 2.29 10.0
MgO 1.07 1.03 -3.9 1.05 -2.4
Na2O 0.24 0.23 -3.4 0.21 -12
P2O5 0.07 0.15 116 0.13 86
SiO2 32.6 31.2 -4.0 35.2 8.3
SO3 14.3 11.8 -17 10.1 -29
TiO2 0.67 0.65 -3.7 0.68 1.9
Property Value (ppm) Value (ppm) % Diff. Value (ppm) % Diff.
As 948 1,320 40 1,790 89 Cd 6 6 0 6 0 Cl 142 138 -3 145 2 Co 62 61 -2 46 -26 Cr 111 144 30 99 -11 Cu 290 251 -13 223 -23 Hg 0 0 -32 0 66 Mo 68 82 21 55 -19 Ni 118 144 22 112 -5 Pb 73 62 -15 109 49 Se 2 2 0 3 50
V 266 249 -6 248 -7 Zn 161 211 31 161 0
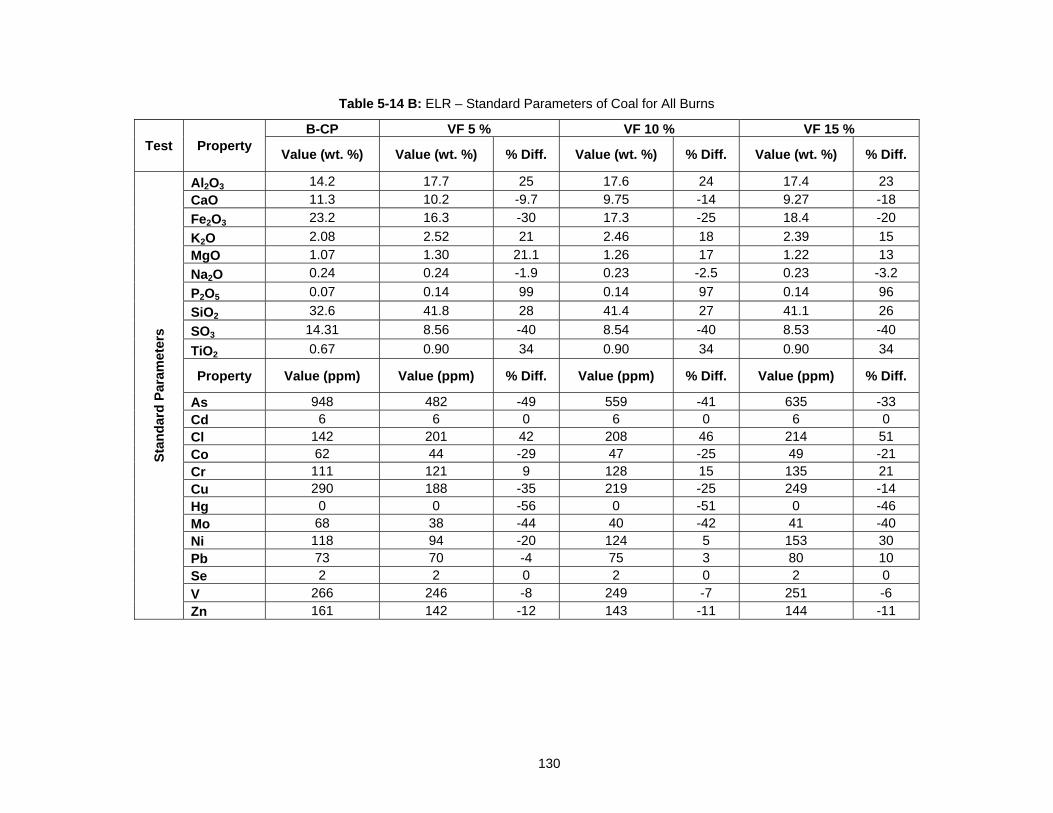
130
Table 5-14 B: ELR – Standard Parameters of Coal for All Burns
Test Property B-CP VF 5 % VF 10 % VF 15 %
Value (wt. %) Value (wt. %) % Diff. Value (wt. %) % Diff. Value (wt. %) % Diff. S
tan
dar
d P
aram
eter
s
Al2O3 14.2 17.7 25 17.6 24 17.4 23
CaO 11.3 10.2 -9.7 9.75 -14 9.27 -18
Fe2O3 23.2 16.3 -30 17.3 -25 18.4 -20
K2O 2.08 2.52 21 2.46 18 2.39 15
MgO 1.07 1.30 21.1 1.26 17 1.22 13
Na2O 0.24 0.24 -1.9 0.23 -2.5 0.23 -3.2
P2O5 0.07 0.14 99 0.14 97 0.14 96
SiO2 32.6 41.8 28 41.4 27 41.1 26
SO3 14.31 8.56 -40 8.54 -40 8.53 -40
TiO2 0.67 0.90 34 0.90 34 0.90 34
Property Value (ppm) Value (ppm) % Diff. Value (ppm) % Diff. Value (ppm) % Diff.
As 948 482 -49 559 -41 635 -33 Cd 6 6 0 6 0 6 0 Cl 142 201 42 208 46 214 51 Co 62 44 -29 47 -25 49 -21 Cr 111 121 9 128 15 135 21 Cu 290 188 -35 219 -25 249 -14 Hg 0 0 -56 0 -51 0 -46 Mo 68 38 -44 40 -42 41 -40 Ni 118 94 -20 124 5 153 30 Pb 73 70 -4 75 3 80 10 Se 2 2 0 2 0 2 0
V 266 246 -8 249 -7 251 -6 Zn 161 142 -12 143 -11 144 -11
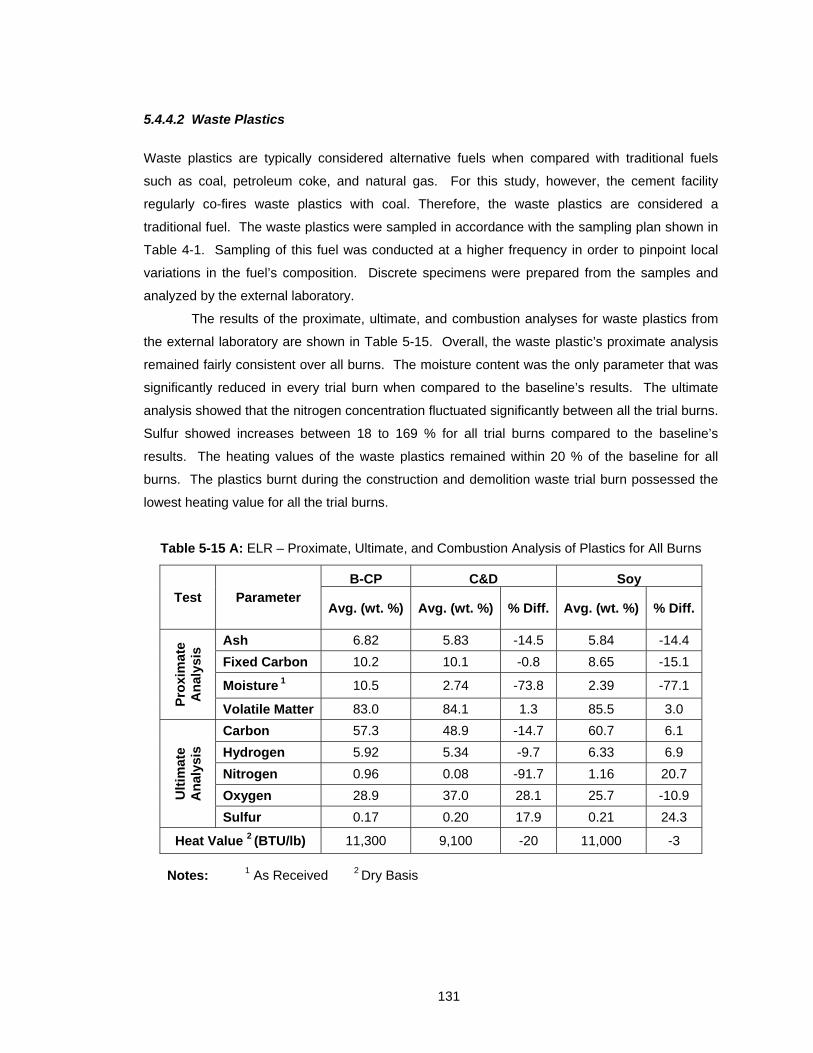
131
5.4.4.2 Waste Plastics
Waste plastics are typically considered alternative fuels when compared with traditional fuels
such as coal, petroleum coke, and natural gas. For this study, however, the cement facility
regularly co-fires waste plastics with coal. Therefore, the waste plastics are considered a
traditional fuel. The waste plastics were sampled in accordance with the sampling plan shown in
Table 4-1. Sampling of this fuel was conducted at a higher frequency in order to pinpoint local
variations in the fuel’s composition. Discrete specimens were prepared from the samples and
analyzed by the external laboratory.
The results of the proximate, ultimate, and combustion analyses for waste plastics from
the external laboratory are shown in Table 5-15. Overall, the waste plastic’s proximate analysis
remained fairly consistent over all burns. The moisture content was the only parameter that was
significantly reduced in every trial burn when compared to the baseline’s results. The ultimate
analysis showed that the nitrogen concentration fluctuated significantly between all the trial burns.
Sulfur showed increases between 18 to 169 % for all trial burns compared to the baseline’s
results. The heating values of the waste plastics remained within 20 % of the baseline for all
burns. The plastics burnt during the construction and demolition waste trial burn possessed the
lowest heating value for all the trial burns.
Table 5-15 A: ELR – Proximate, Ultimate, and Combustion Analysis of Plastics for All Burns
Test Parameter B-CP C&D Soy
Avg. (wt. %) Avg. (wt. %) % Diff. Avg. (wt. %) % Diff.
Pro
xim
ate
An
alys
is Ash 6.82 5.83 -14.5 5.84 -14.4
Fixed Carbon 10.2 10.1 -0.8 8.65 -15.1
Moisture 1 10.5 2.74 -73.8 2.39 -77.1
Volatile Matter 83.0 84.1 1.3 85.5 3.0
Ult
imat
e A
nal
ysis
Carbon 57.3 48.9 -14.7 60.7 6.1
Hydrogen 5.92 5.34 -9.7 6.33 6.9
Nitrogen 0.96 0.08 -91.7 1.16 20.7
Oxygen 28.9 37.0 28.1 25.7 -10.9
Sulfur 0.17 0.20 17.9 0.21 24.3
Heat Value 2 (BTU/lb) 11,300 9,100 -20 11,000 -3
Notes: 1 As Received 2 Dry Basis
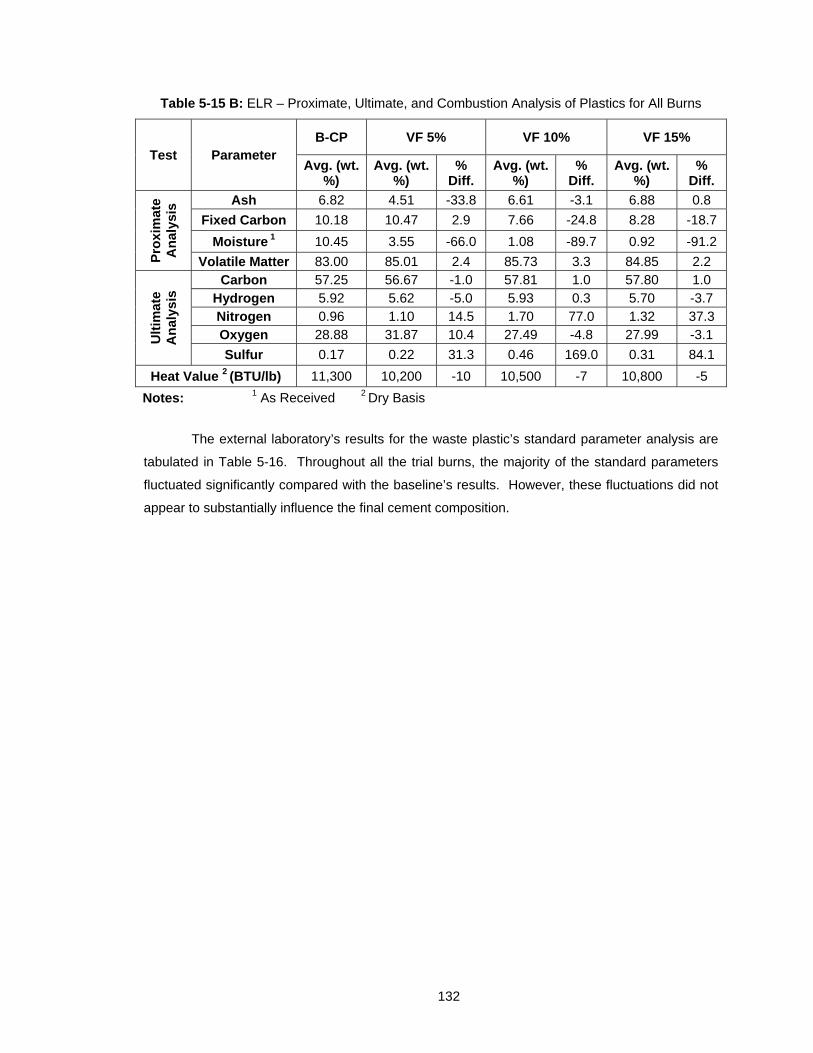
132
Table 5-15 B: ELR – Proximate, Ultimate, and Combustion Analysis of Plastics for All Burns
Test Parameter B-CP VF 5% VF 10% VF 15%
Avg. (wt. %)
Avg. (wt. %)
% Diff.
Avg. (wt. %)
% Diff.
Avg. (wt. %)
% Diff.
Pro
xim
ate
An
alys
is Ash 6.82 4.51 -33.8 6.61 -3.1 6.88 0.8
Fixed Carbon 10.18 10.47 2.9 7.66 -24.8 8.28 -18.7
Moisture 1 10.45 3.55 -66.0 1.08 -89.7 0.92 -91.2
Volatile Matter 83.00 85.01 2.4 85.73 3.3 84.85 2.2
Ult
imat
e A
nal
ysis
Carbon 57.25 56.67 -1.0 57.81 1.0 57.80 1.0 Hydrogen 5.92 5.62 -5.0 5.93 0.3 5.70 -3.7 Nitrogen 0.96 1.10 14.5 1.70 77.0 1.32 37.3 Oxygen 28.88 31.87 10.4 27.49 -4.8 27.99 -3.1
Sulfur 0.17 0.22 31.3 0.46 169.0 0.31 84.1
Heat Value 2 (BTU/lb) 11,300 10,200 -10 10,500 -7 10,800 -5
Notes: 1 As Received 2 Dry Basis
The external laboratory’s results for the waste plastic’s standard parameter analysis are
tabulated in Table 5-16. Throughout all the trial burns, the majority of the standard parameters
fluctuated significantly compared with the baseline’s results. However, these fluctuations did not
appear to substantially influence the final cement composition.
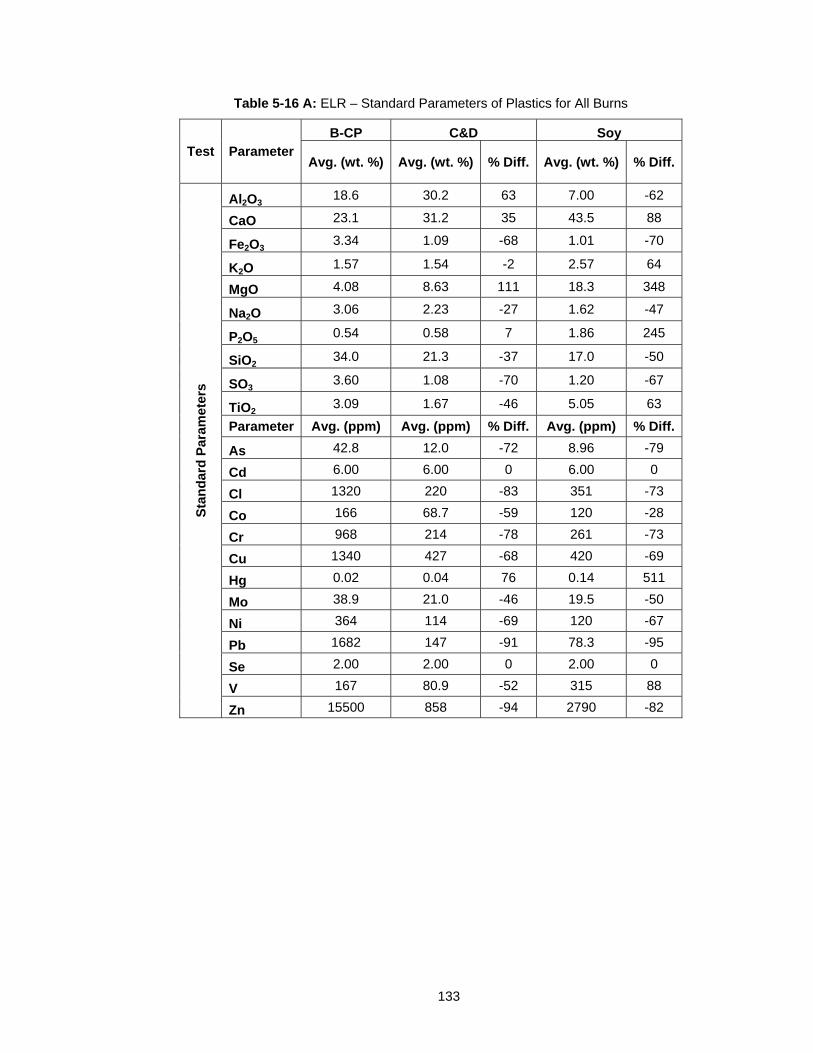
133
Table 5-16 A: ELR – Standard Parameters of Plastics for All Burns
Test Parameter B-CP C&D Soy
Avg. (wt. %) Avg. (wt. %) % Diff. Avg. (wt. %) % Diff.
Sta
nd
ard
Par
amet
ers
Al2O3 18.6 30.2 63 7.00 -62
CaO 23.1 31.2 35 43.5 88
Fe2O3 3.34 1.09 -68 1.01 -70
K2O 1.57 1.54 -2 2.57 64
MgO 4.08 8.63 111 18.3 348
Na2O 3.06 2.23 -27 1.62 -47
P2O5 0.54 0.58 7 1.86 245
SiO2 34.0 21.3 -37 17.0 -50
SO3 3.60 1.08 -70 1.20 -67
TiO2 3.09 1.67 -46 5.05 63
Parameter Avg. (ppm) Avg. (ppm) % Diff. Avg. (ppm) % Diff.
As 42.8 12.0 -72 8.96 -79
Cd 6.00 6.00 0 6.00 0
Cl 1320 220 -83 351 -73
Co 166 68.7 -59 120 -28
Cr 968 214 -78 261 -73
Cu 1340 427 -68 420 -69
Hg 0.02 0.04 76 0.14 511
Mo 38.9 21.0 -46 19.5 -50
Ni 364 114 -69 120 -67
Pb 1682 147 -91 78.3 -95
Se 2.00 2.00 0 2.00 0
V 167 80.9 -52 315 88
Zn 15500 858 -94 2790 -82
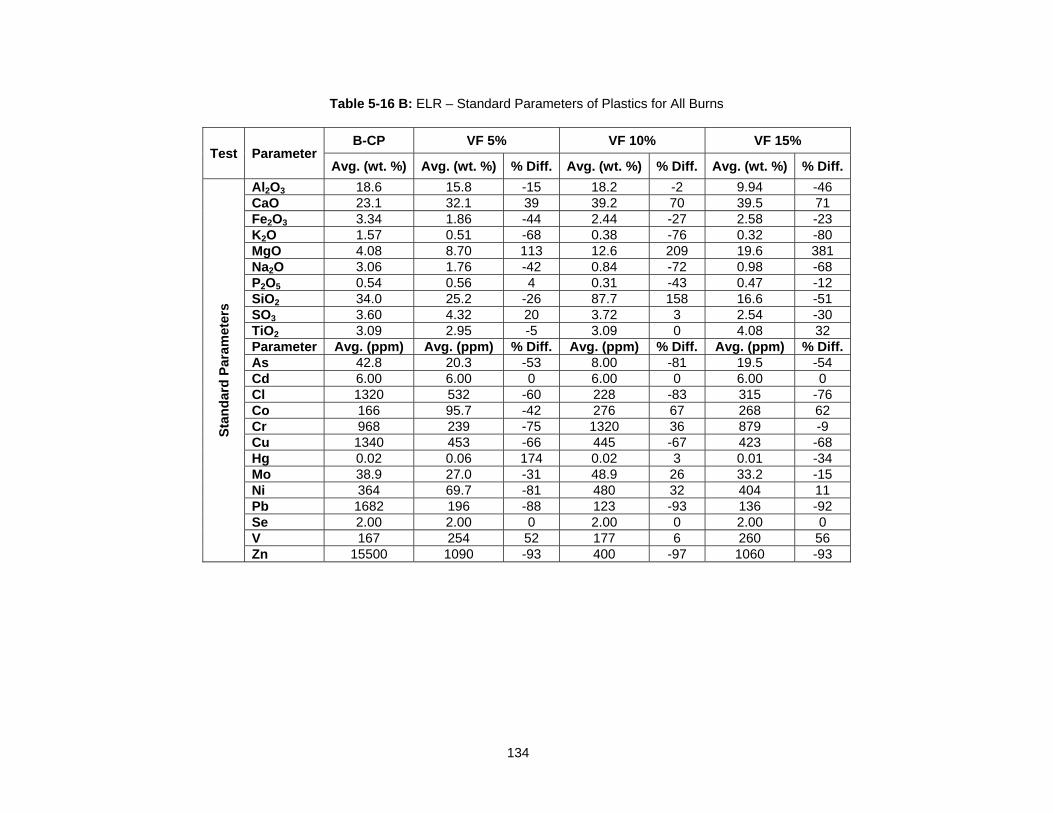
134
Table 5-16 B: ELR – Standard Parameters of Plastics for All Burns
Test Parameter B-CP VF 5% VF 10% VF 15%
Avg. (wt. %) Avg. (wt. %) % Diff. Avg. (wt. %) % Diff. Avg. (wt. %) % Diff.
Sta
nd
ard
Par
amet
ers
Al2O3 18.6 15.8 -15 18.2 -2 9.94 -46 CaO 23.1 32.1 39 39.2 70 39.5 71 Fe2O3 3.34 1.86 -44 2.44 -27 2.58 -23 K2O 1.57 0.51 -68 0.38 -76 0.32 -80 MgO 4.08 8.70 113 12.6 209 19.6 381 Na2O 3.06 1.76 -42 0.84 -72 0.98 -68 P2O5 0.54 0.56 4 0.31 -43 0.47 -12 SiO2 34.0 25.2 -26 87.7 158 16.6 -51 SO3 3.60 4.32 20 3.72 3 2.54 -30 TiO2 3.09 2.95 -5 3.09 0 4.08 32 Parameter Avg. (ppm) Avg. (ppm) % Diff. Avg. (ppm) % Diff. Avg. (ppm) % Diff.As 42.8 20.3 -53 8.00 -81 19.5 -54 Cd 6.00 6.00 0 6.00 0 6.00 0 Cl 1320 532 -60 228 -83 315 -76 Co 166 95.7 -42 276 67 268 62 Cr 968 239 -75 1320 36 879 -9 Cu 1340 453 -66 445 -67 423 -68 Hg 0.02 0.06 174 0.02 3 0.01 -34 Mo 38.9 27.0 -31 48.9 26 33.2 -15 Ni 364 69.7 -81 480 32 404 11 Pb 1682 196 -88 123 -93 136 -92 Se 2.00 2.00 0 2.00 0 2.00 0 V 167 254 52 177 6 260 56 Zn 15500 1090 -93 400 -97 1060 -93
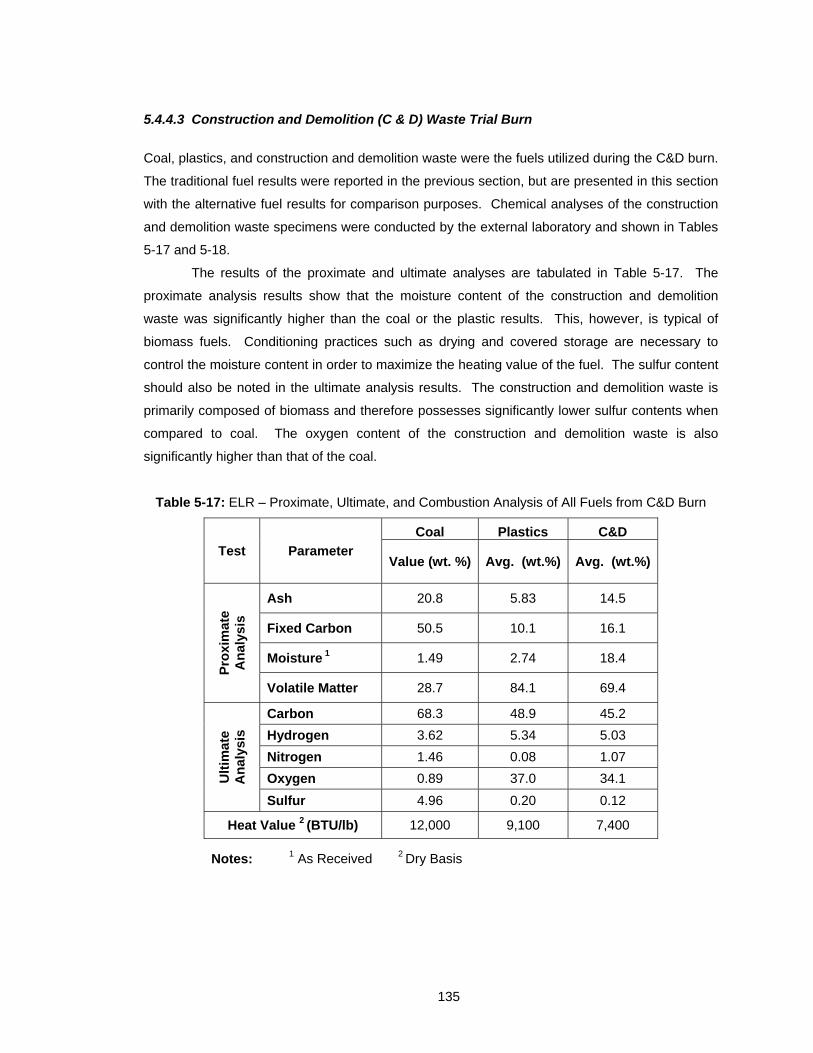
135
5.4.4.3 Construction and Demolition (C & D) Waste Trial Burn
Coal, plastics, and construction and demolition waste were the fuels utilized during the C&D burn.
The traditional fuel results were reported in the previous section, but are presented in this section
with the alternative fuel results for comparison purposes. Chemical analyses of the construction
and demolition waste specimens were conducted by the external laboratory and shown in Tables
5-17 and 5-18.
The results of the proximate and ultimate analyses are tabulated in Table 5-17. The
proximate analysis results show that the moisture content of the construction and demolition
waste was significantly higher than the coal or the plastic results. This, however, is typical of
biomass fuels. Conditioning practices such as drying and covered storage are necessary to
control the moisture content in order to maximize the heating value of the fuel. The sulfur content
should also be noted in the ultimate analysis results. The construction and demolition waste is
primarily composed of biomass and therefore possesses significantly lower sulfur contents when
compared to coal. The oxygen content of the construction and demolition waste is also
significantly higher than that of the coal.
Table 5-17: ELR – Proximate, Ultimate, and Combustion Analysis of All Fuels from C&D Burn
Test Parameter
Coal Plastics C&D
Value (wt. %) Avg. (wt.%) Avg. (wt.%)
Pro
xim
ate
An
alys
is
Ash 20.8 5.83 14.5
Fixed Carbon 50.5 10.1 16.1
Moisture 1 1.49 2.74 18.4
Volatile Matter 28.7 84.1 69.4
Ult
imat
e A
nal
ysis
Carbon 68.3 48.9 45.2
Hydrogen 3.62 5.34 5.03
Nitrogen 1.46 0.08 1.07
Oxygen 0.89 37.0 34.1
Sulfur 4.96 0.20 0.12
Heat Value 2 (BTU/lb) 12,000 9,100 7,400
Notes: 1 As Received 2 Dry Basis
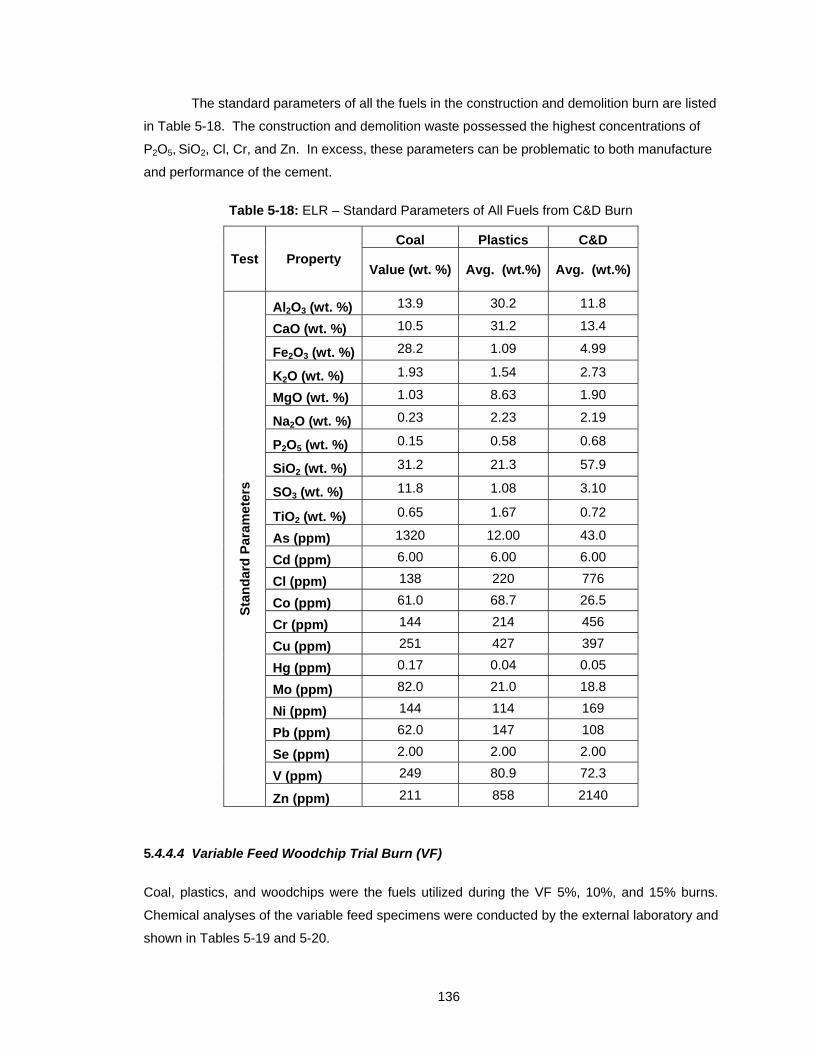
136
The standard parameters of all the fuels in the construction and demolition burn are listed
in Table 5-18. The construction and demolition waste possessed the highest concentrations of
P2O5, SiO2, Cl, Cr, and Zn. In excess, these parameters can be problematic to both manufacture
and performance of the cement.
Table 5-18: ELR – Standard Parameters of All Fuels from C&D Burn
Test Property
Coal Plastics C&D
Value (wt. %) Avg. (wt.%) Avg. (wt.%)
Sta
nd
ard
Par
amet
ers
Al2O3 (wt. %) 13.9 30.2 11.8
CaO (wt. %) 10.5 31.2 13.4
Fe2O3 (wt. %) 28.2 1.09 4.99
K2O (wt. %) 1.93 1.54 2.73
MgO (wt. %) 1.03 8.63 1.90
Na2O (wt. %) 0.23 2.23 2.19
P2O5 (wt. %) 0.15 0.58 0.68
SiO2 (wt. %) 31.2 21.3 57.9
SO3 (wt. %) 11.8 1.08 3.10
TiO2 (wt. %) 0.65 1.67 0.72
As (ppm) 1320 12.00 43.0
Cd (ppm) 6.00 6.00 6.00
Cl (ppm) 138 220 776
Co (ppm) 61.0 68.7 26.5
Cr (ppm) 144 214 456
Cu (ppm) 251 427 397
Hg (ppm) 0.17 0.04 0.05
Mo (ppm) 82.0 21.0 18.8
Ni (ppm) 144 114 169
Pb (ppm) 62.0 147 108
Se (ppm) 2.00 2.00 2.00
V (ppm) 249 80.9 72.3
Zn (ppm) 211 858 2140
5.4.4.4 Variable Feed Woodchip Trial Burn (VF)
Coal, plastics, and woodchips were the fuels utilized during the VF 5%, 10%, and 15% burns.
Chemical analyses of the variable feed specimens were conducted by the external laboratory and
shown in Tables 5-19 and 5-20.
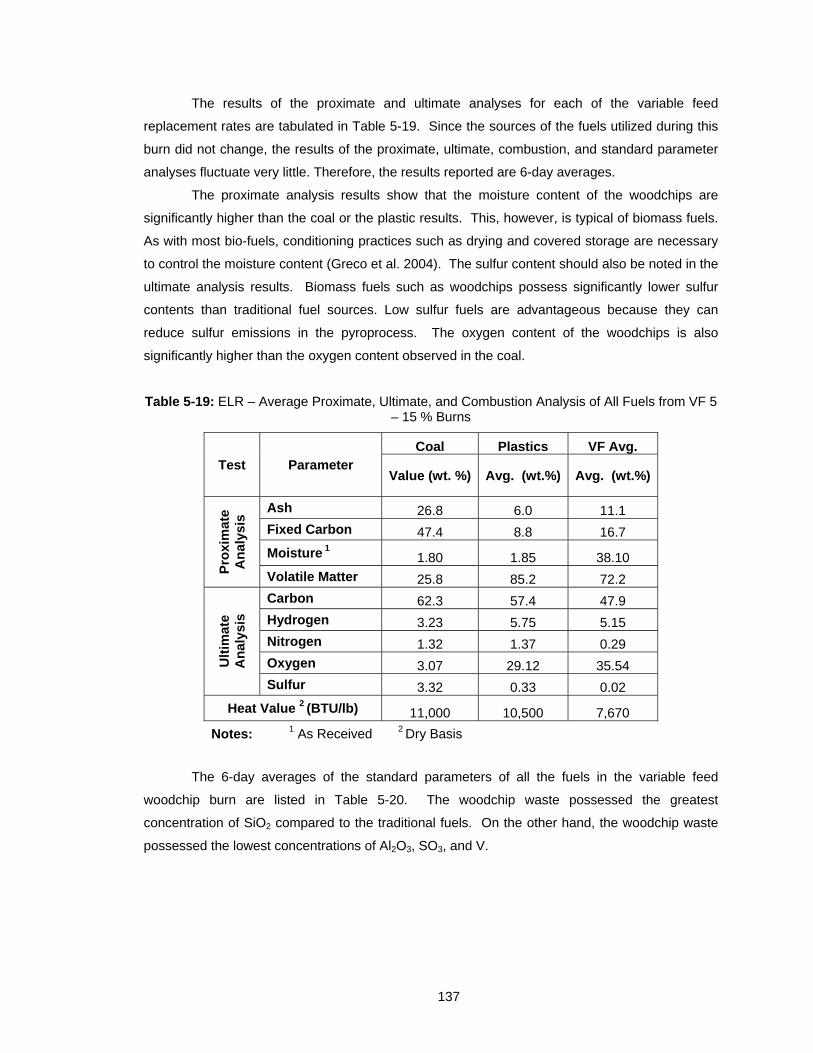
137
The results of the proximate and ultimate analyses for each of the variable feed
replacement rates are tabulated in Table 5-19. Since the sources of the fuels utilized during this
burn did not change, the results of the proximate, ultimate, combustion, and standard parameter
analyses fluctuate very little. Therefore, the results reported are 6-day averages.
The proximate analysis results show that the moisture content of the woodchips are
significantly higher than the coal or the plastic results. This, however, is typical of biomass fuels.
As with most bio-fuels, conditioning practices such as drying and covered storage are necessary
to control the moisture content (Greco et al. 2004). The sulfur content should also be noted in the
ultimate analysis results. Biomass fuels such as woodchips possess significantly lower sulfur
contents than traditional fuel sources. Low sulfur fuels are advantageous because they can
reduce sulfur emissions in the pyroprocess. The oxygen content of the woodchips is also
significantly higher than the oxygen content observed in the coal.
Table 5-19: ELR – Average Proximate, Ultimate, and Combustion Analysis of All Fuels from VF 5 – 15 % Burns
Test Parameter Coal Plastics VF Avg.
Value (wt. %) Avg. (wt.%) Avg. (wt.%)
Pro
xim
ate
An
alys
is Ash 26.8 6.0 11.1
Fixed Carbon 47.4 8.8 16.7
Moisture 1 1.80 1.85 38.10
Volatile Matter 25.8 85.2 72.2
Ult
imat
e A
nal
ysis
Carbon 62.3 57.4 47.9
Hydrogen 3.23 5.75 5.15
Nitrogen 1.32 1.37 0.29
Oxygen 3.07 29.12 35.54
Sulfur 3.32 0.33 0.02
Heat Value 2 (BTU/lb) 11,000 10,500 7,670
Notes: 1 As Received 2 Dry Basis
The 6-day averages of the standard parameters of all the fuels in the variable feed
woodchip burn are listed in Table 5-20. The woodchip waste possessed the greatest
concentration of SiO2 compared to the traditional fuels. On the other hand, the woodchip waste
possessed the lowest concentrations of Al2O3, SO3, and V.
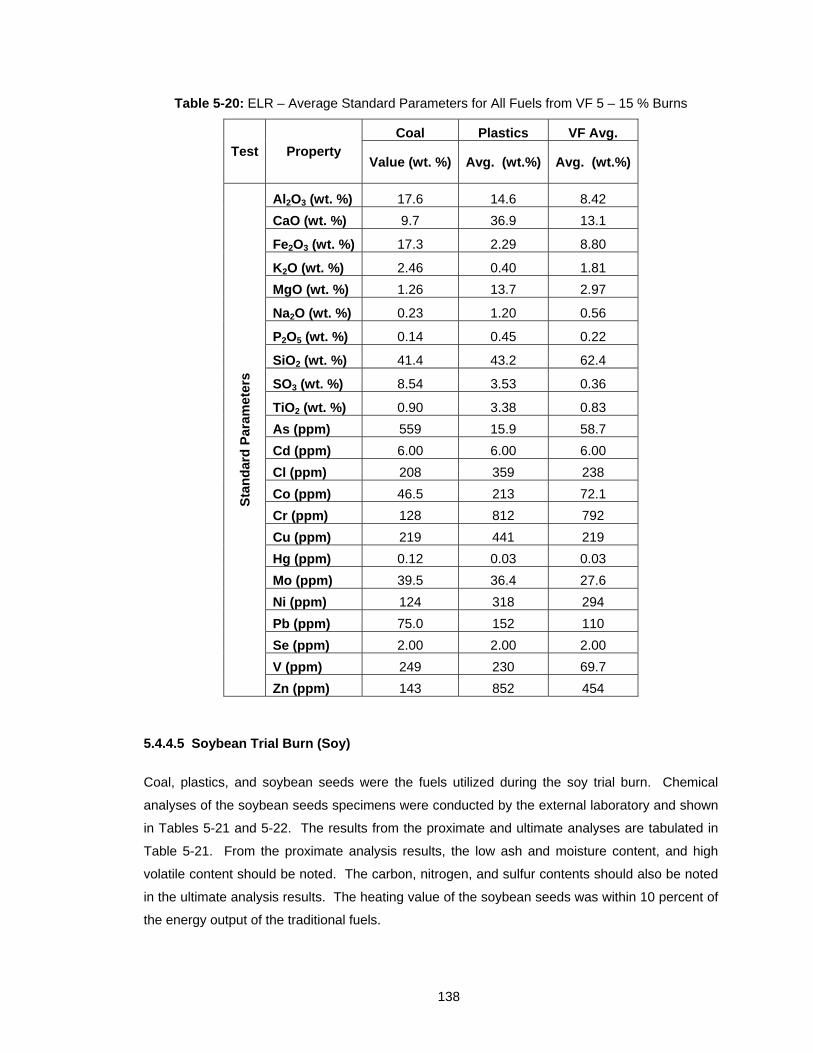
138
Table 5-20: ELR – Average Standard Parameters for All Fuels from VF 5 – 15 % Burns
Test Property Coal Plastics VF Avg.
Value (wt. %) Avg. (wt.%) Avg. (wt.%)
Sta
nd
ard
Par
amet
ers
Al2O3 (wt. %) 17.6 14.6 8.42
CaO (wt. %) 9.7 36.9 13.1
Fe2O3 (wt. %) 17.3 2.29 8.80
K2O (wt. %) 2.46 0.40 1.81
MgO (wt. %) 1.26 13.7 2.97
Na2O (wt. %) 0.23 1.20 0.56
P2O5 (wt. %) 0.14 0.45 0.22
SiO2 (wt. %) 41.4 43.2 62.4
SO3 (wt. %) 8.54 3.53 0.36
TiO2 (wt. %) 0.90 3.38 0.83
As (ppm) 559 15.9 58.7
Cd (ppm) 6.00 6.00 6.00
Cl (ppm) 208 359 238
Co (ppm) 46.5 213 72.1
Cr (ppm) 128 812 792
Cu (ppm) 219 441 219
Hg (ppm) 0.12 0.03 0.03
Mo (ppm) 39.5 36.4 27.6
Ni (ppm) 124 318 294
Pb (ppm) 75.0 152 110
Se (ppm) 2.00 2.00 2.00
V (ppm) 249 230 69.7
Zn (ppm) 143 852 454
5.4.4.5 Soybean Trial Burn (Soy)
Coal, plastics, and soybean seeds were the fuels utilized during the soy trial burn. Chemical
analyses of the soybean seeds specimens were conducted by the external laboratory and shown
in Tables 5-21 and 5-22. The results from the proximate and ultimate analyses are tabulated in
Table 5-21. From the proximate analysis results, the low ash and moisture content, and high
volatile content should be noted. The carbon, nitrogen, and sulfur contents should also be noted
in the ultimate analysis results. The heating value of the soybean seeds was within 10 percent of
the energy output of the traditional fuels.
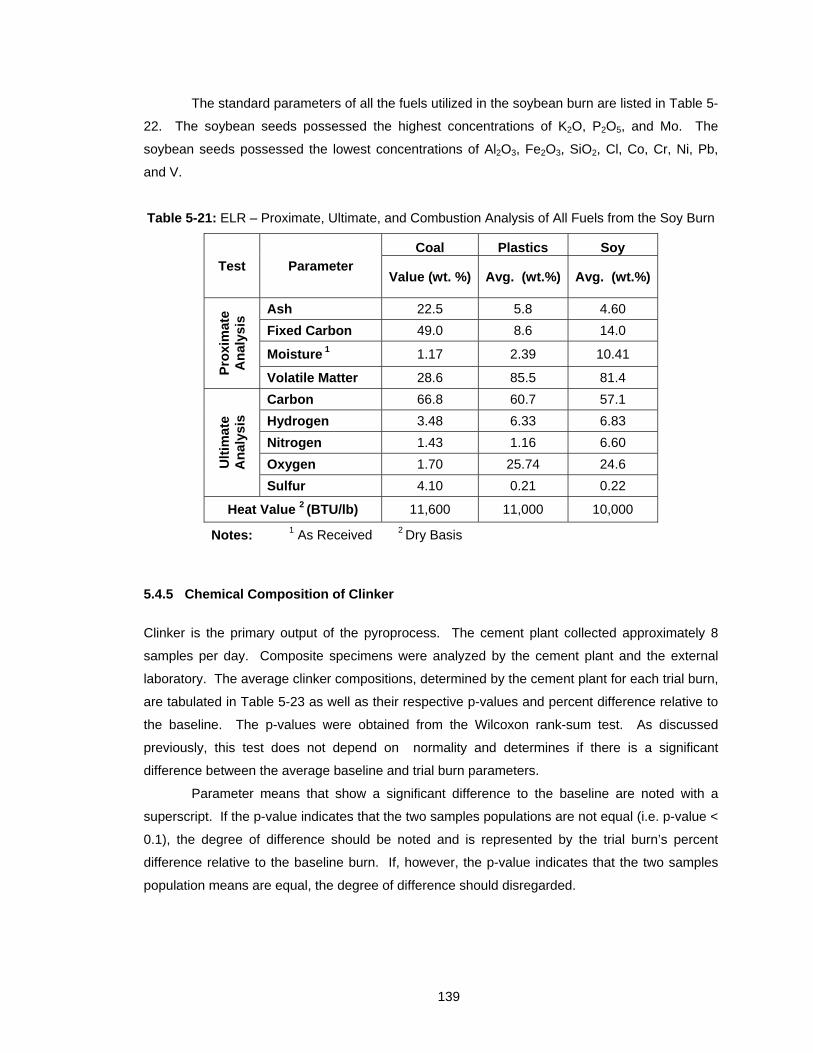
139
The standard parameters of all the fuels utilized in the soybean burn are listed in Table 5-
22. The soybean seeds possessed the highest concentrations of K2O, P2O5, and Mo. The
soybean seeds possessed the lowest concentrations of Al2O3, Fe2O3, SiO2, Cl, Co, Cr, Ni, Pb,
and V.
Table 5-21: ELR – Proximate, Ultimate, and Combustion Analysis of All Fuels from the Soy Burn
Test Parameter Coal Plastics Soy
Value (wt. %) Avg. (wt.%) Avg. (wt.%)
Pro
xim
ate
An
alys
is Ash 22.5 5.8 4.60
Fixed Carbon 49.0 8.6 14.0
Moisture 1 1.17 2.39 10.41
Volatile Matter 28.6 85.5 81.4
Ult
imat
e A
nal
ysis
Carbon 66.8 60.7 57.1
Hydrogen 3.48 6.33 6.83
Nitrogen 1.43 1.16 6.60
Oxygen 1.70 25.74 24.6
Sulfur 4.10 0.21 0.22
Heat Value 2 (BTU/lb) 11,600 11,000 10,000
Notes: 1 As Received 2 Dry Basis
5.4.5 Chemical Composition of Clinker
Clinker is the primary output of the pyroprocess. The cement plant collected approximately 8
samples per day. Composite specimens were analyzed by the cement plant and the external
laboratory. The average clinker compositions, determined by the cement plant for each trial burn,
are tabulated in Table 5-23 as well as their respective p-values and percent difference relative to
the baseline. The p-values were obtained from the Wilcoxon rank-sum test. As discussed
previously, this test does not depend on normality and determines if there is a significant
difference between the average baseline and trial burn parameters.
Parameter means that show a significant difference to the baseline are noted with a
superscript. If the p-value indicates that the two samples populations are not equal (i.e. p-value <
0.1), the degree of difference should be noted and is represented by the trial burn’s percent
difference relative to the baseline burn. If, however, the p-value indicates that the two samples
population means are equal, the degree of difference should disregarded.
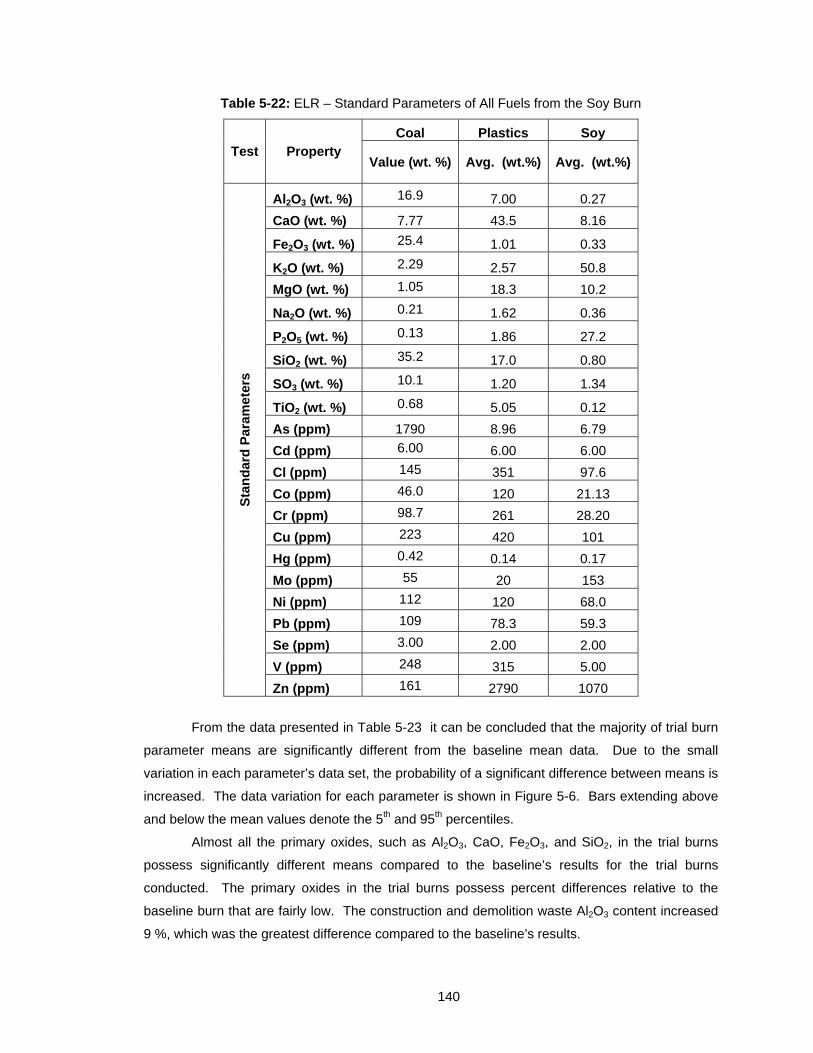
140
Table 5-22: ELR – Standard Parameters of All Fuels from the Soy Burn
Test Property Coal Plastics Soy
Value (wt. %) Avg. (wt.%) Avg. (wt.%)
Sta
nd
ard
Par
amet
ers
Al2O3 (wt. %) 16.9 7.00 0.27
CaO (wt. %) 7.77 43.5 8.16
Fe2O3 (wt. %) 25.4 1.01 0.33
K2O (wt. %) 2.29 2.57 50.8
MgO (wt. %) 1.05 18.3 10.2
Na2O (wt. %) 0.21 1.62 0.36
P2O5 (wt. %) 0.13 1.86 27.2
SiO2 (wt. %) 35.2 17.0 0.80
SO3 (wt. %) 10.1 1.20 1.34
TiO2 (wt. %) 0.68 5.05 0.12
As (ppm) 1790 8.96 6.79
Cd (ppm) 6.00 6.00 6.00
Cl (ppm) 145 351 97.6
Co (ppm) 46.0 120 21.13
Cr (ppm) 98.7 261 28.20
Cu (ppm) 223 420 101
Hg (ppm) 0.42 0.14 0.17
Mo (ppm) 55 20 153
Ni (ppm) 112 120 68.0
Pb (ppm) 109 78.3 59.3
Se (ppm) 3.00 2.00 2.00
V (ppm) 248 315 5.00
Zn (ppm) 161 2790 1070
From the data presented in Table 5-23 it can be concluded that the majority of trial burn
parameter means are significantly different from the baseline mean data. Due to the small
variation in each parameter’s data set, the probability of a significant difference between means is
increased. The data variation for each parameter is shown in Figure 5-6. Bars extending above
and below the mean values denote the 5th and 95th percentiles.
Almost all the primary oxides, such as Al2O3, CaO, Fe2O3, and SiO2, in the trial burns
possess significantly different means compared to the baseline’s results for the trial burns
conducted. The primary oxides in the trial burns possess percent differences relative to the
baseline burn that are fairly low. The construction and demolition waste Al2O3 content increased
9 %, which was the greatest difference compared to the baseline’s results.
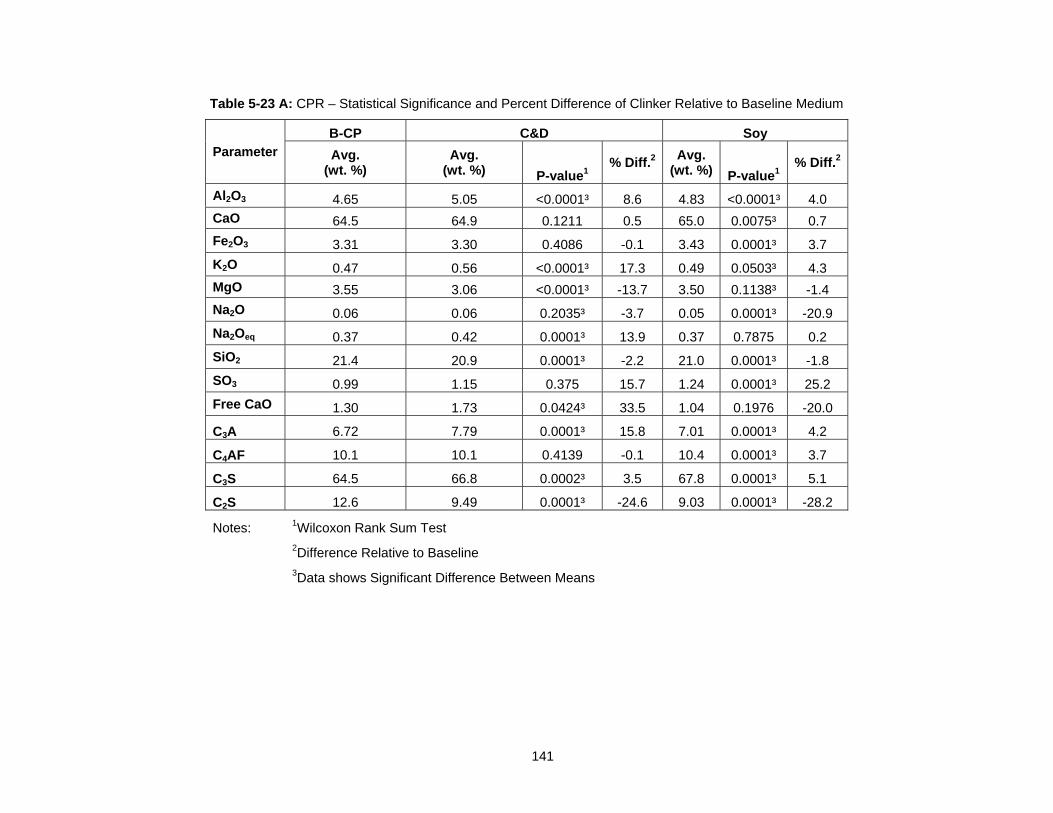
141
Table 5-23 A: CPR – Statistical Significance and Percent Difference of Clinker Relative to Baseline Medium
Parameter B-CP C&D Soy
Avg. (wt. %)
Avg. (wt. %) P-value1
% Diff.2Avg.
(wt. %) P-value1% Diff.2
Al2O3 4.65 5.05 <0.0001³ 8.6 4.83 <0.0001³ 4.0
CaO 64.5 64.9 0.1211 0.5 65.0 0.0075³ 0.7
Fe2O3 3.31 3.30 0.4086 -0.1 3.43 0.0001³ 3.7
K2O 0.47 0.56 <0.0001³ 17.3 0.49 0.0503³ 4.3
MgO 3.55 3.06 <0.0001³ -13.7 3.50 0.1138³ -1.4
Na2O 0.06 0.06 0.2035³ -3.7 0.05 0.0001³ -20.9
Na2Oeq 0.37 0.42 0.0001³ 13.9 0.37 0.7875 0.2
SiO2 21.4 20.9 0.0001³ -2.2 21.0 0.0001³ -1.8
SO3 0.99 1.15 0.375 15.7 1.24 0.0001³ 25.2
Free CaO 1.30 1.73 0.0424³ 33.5 1.04 0.1976 -20.0
C3A 6.72 7.79 0.0001³ 15.8 7.01 0.0001³ 4.2
C4AF 10.1 10.1 0.4139 -0.1 10.4 0.0001³ 3.7
C3S 64.5 66.8 0.0002³ 3.5 67.8 0.0001³ 5.1
C2S 12.6 9.49 0.0001³ -24.6 9.03 0.0001³ -28.2
Notes: 1Wilcoxon Rank Sum Test
2Difference Relative to Baseline
3Data shows Significant Difference Between Means
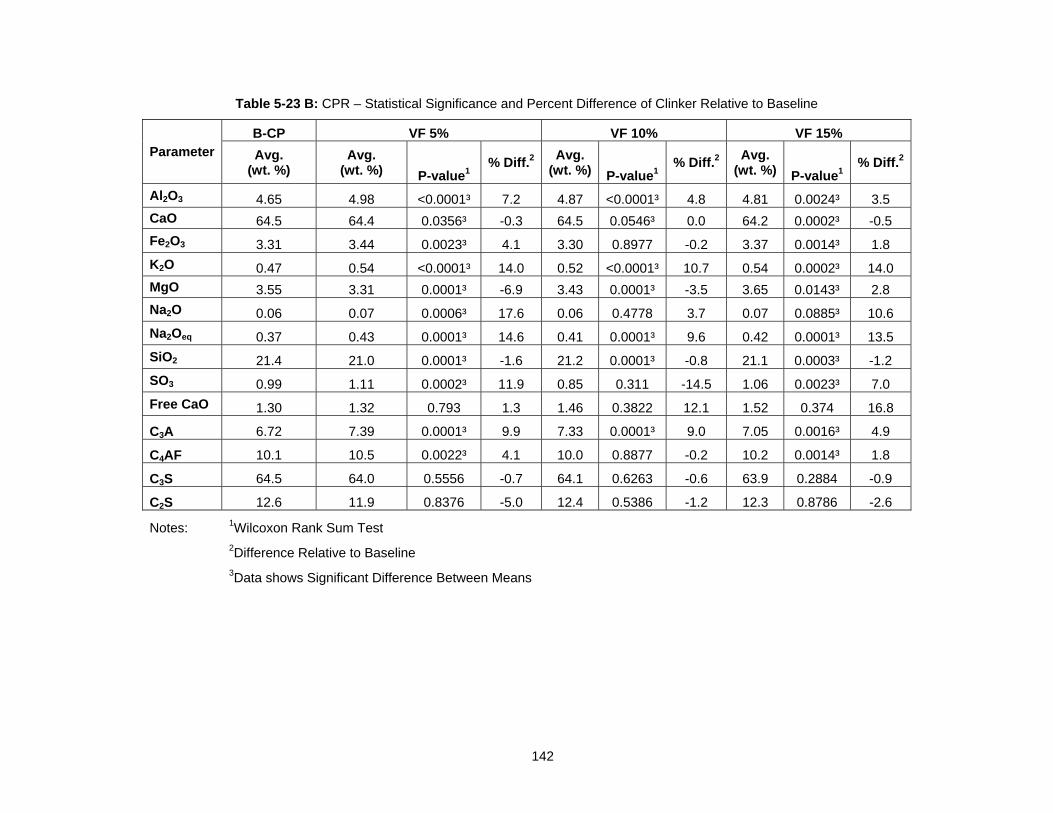
142
Table 5-23 B: CPR – Statistical Significance and Percent Difference of Clinker Relative to Baseline
Parameter B-CP VF 5% VF 10% VF 15%
Avg. (wt. %)
Avg. (wt. %) P-value1
% Diff.2Avg.
(wt. %) P-value1% Diff.2
Avg. (wt. %) P-value1
% Diff.2
Al2O3 4.65 4.98 <0.0001³ 7.2 4.87 <0.0001³ 4.8 4.81 0.0024³ 3.5
CaO 64.5 64.4 0.0356³ -0.3 64.5 0.0546³ 0.0 64.2 0.0002³ -0.5
Fe2O3 3.31 3.44 0.0023³ 4.1 3.30 0.8977 -0.2 3.37 0.0014³ 1.8
K2O 0.47 0.54 <0.0001³ 14.0 0.52 <0.0001³ 10.7 0.54 0.0002³ 14.0
MgO 3.55 3.31 0.0001³ -6.9 3.43 0.0001³ -3.5 3.65 0.0143³ 2.8
Na2O 0.06 0.07 0.0006³ 17.6 0.06 0.4778 3.7 0.07 0.0885³ 10.6
Na2Oeq 0.37 0.43 0.0001³ 14.6 0.41 0.0001³ 9.6 0.42 0.0001³ 13.5
SiO2 21.4 21.0 0.0001³ -1.6 21.2 0.0001³ -0.8 21.1 0.0003³ -1.2
SO3 0.99 1.11 0.0002³ 11.9 0.85 0.311 -14.5 1.06 0.0023³ 7.0
Free CaO 1.30 1.32 0.793 1.3 1.46 0.3822 12.1 1.52 0.374 16.8
C3A 6.72 7.39 0.0001³ 9.9 7.33 0.0001³ 9.0 7.05 0.0016³ 4.9
C4AF 10.1 10.5 0.0022³ 4.1 10.0 0.8877 -0.2 10.2 0.0014³ 1.8
C3S 64.5 64.0 0.5556 -0.7 64.1 0.6263 -0.6 63.9 0.2884 -0.9
C2S 12.6 11.9 0.8376 -5.0 12.4 0.5386 -1.2 12.3 0.8786 -2.6
Notes: 1Wilcoxon Rank Sum Test
2Difference Relative to Baseline
3Data shows Significant Difference Between Means
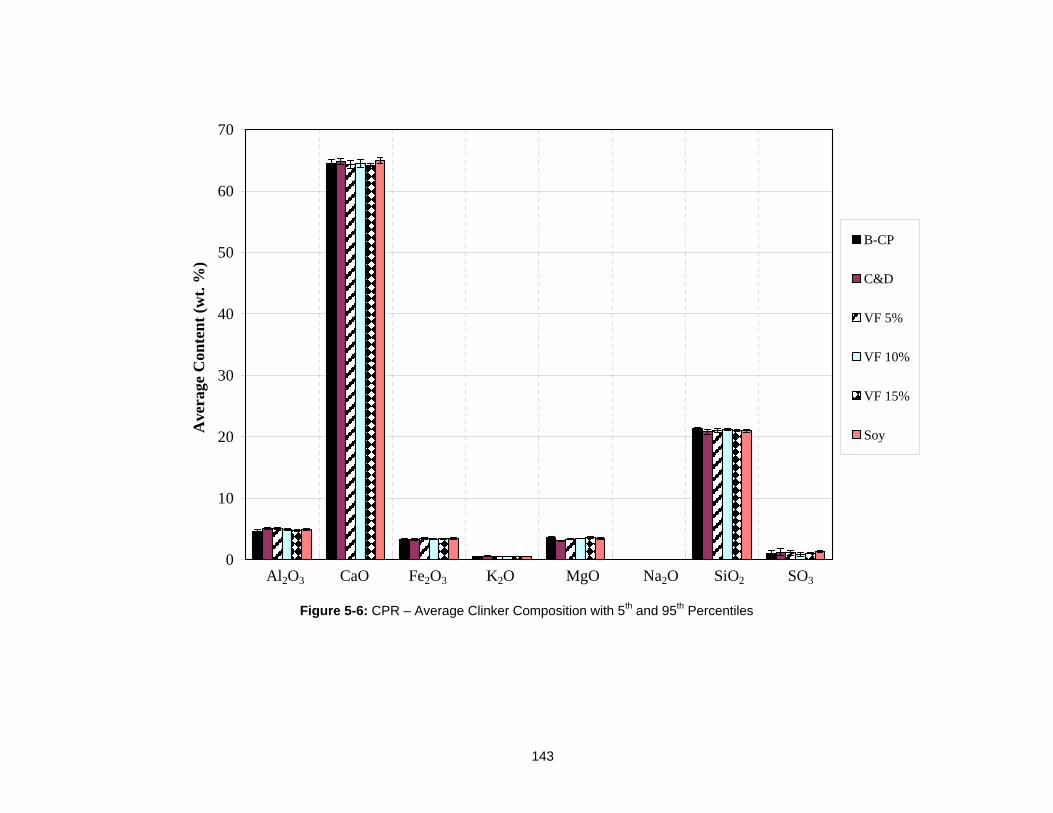
143
Figure 5-6: CPR – Average Clinker Composition with 5th and 95th Percentiles
0
10
20
30
40
50
60
70
Ave
rage
Con
ten
t (w
t. %
)
B-CP
C&D
VF 5%
VF 10%
VF 15%
Soy
Al2O3 CaO Fe2O3 K2O MgO Na2O SiO2 SO3
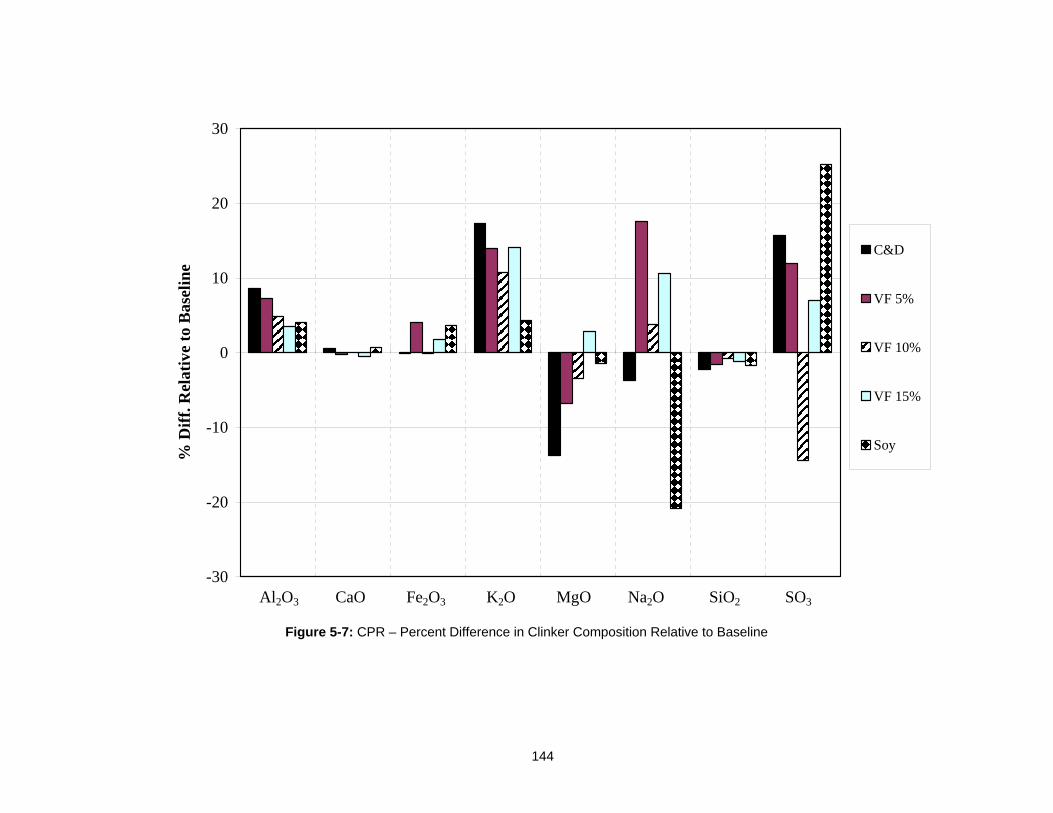
144
Figure 5-7: CPR – Percent Difference in Clinker Composition Relative to Baseline
-30
-20
-10
0
10
20
30
% D
iff.
Rel
ativ
e to
Bas
elin
e
C&D
VF 5%
VF 10%
VF 15%
Soy
Al2O3 CaO Fe2O3 K2O MgO Na2O SiO2 SO3
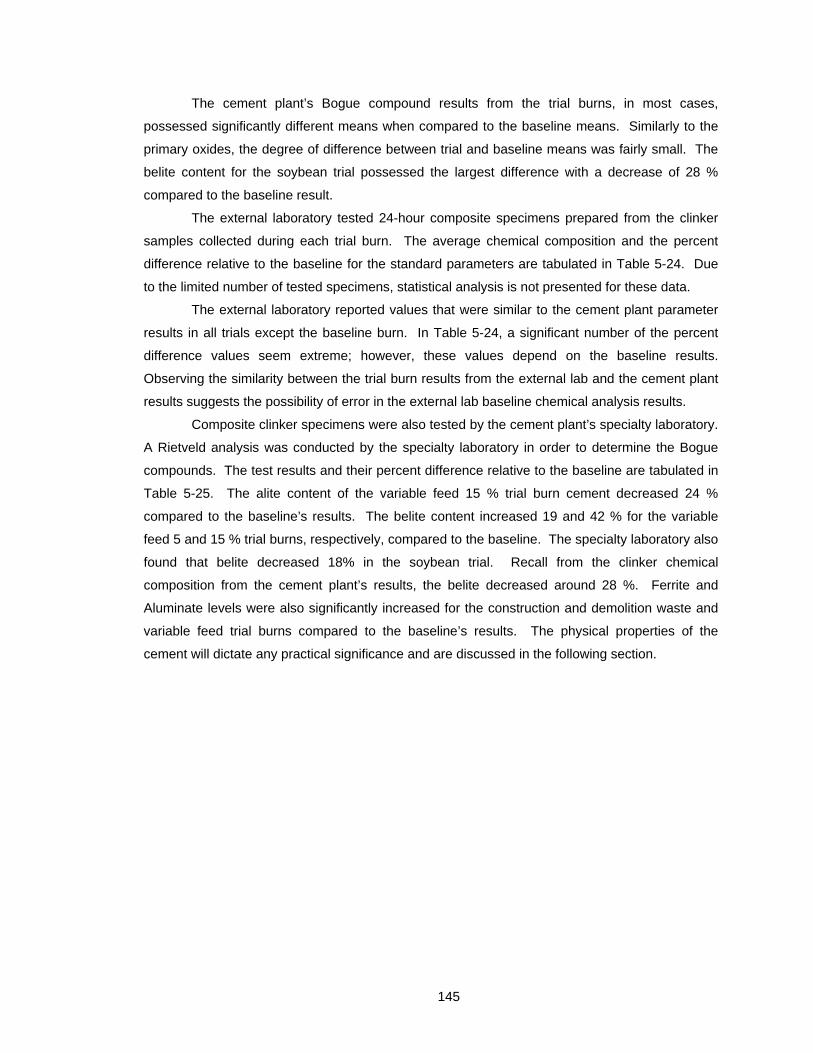
145
The cement plant’s Bogue compound results from the trial burns, in most cases,
possessed significantly different means when compared to the baseline means. Similarly to the
primary oxides, the degree of difference between trial and baseline means was fairly small. The
belite content for the soybean trial possessed the largest difference with a decrease of 28 %
compared to the baseline result.
The external laboratory tested 24-hour composite specimens prepared from the clinker
samples collected during each trial burn. The average chemical composition and the percent
difference relative to the baseline for the standard parameters are tabulated in Table 5-24. Due
to the limited number of tested specimens, statistical analysis is not presented for these data.
The external laboratory reported values that were similar to the cement plant parameter
results in all trials except the baseline burn. In Table 5-24, a significant number of the percent
difference values seem extreme; however, these values depend on the baseline results.
Observing the similarity between the trial burn results from the external lab and the cement plant
results suggests the possibility of error in the external lab baseline chemical analysis results.
Composite clinker specimens were also tested by the cement plant’s specialty laboratory.
A Rietveld analysis was conducted by the specialty laboratory in order to determine the Bogue
compounds. The test results and their percent difference relative to the baseline are tabulated in
Table 5-25. The alite content of the variable feed 15 % trial burn cement decreased 24 %
compared to the baseline’s results. The belite content increased 19 and 42 % for the variable
feed 5 and 15 % trial burns, respectively, compared to the baseline. The specialty laboratory also
found that belite decreased 18% in the soybean trial. Recall from the clinker chemical
composition from the cement plant’s results, the belite decreased around 28 %. Ferrite and
Aluminate levels were also significantly increased for the construction and demolition waste and
variable feed trial burns compared to the baseline’s results. The physical properties of the
cement will dictate any practical significance and are discussed in the following section.
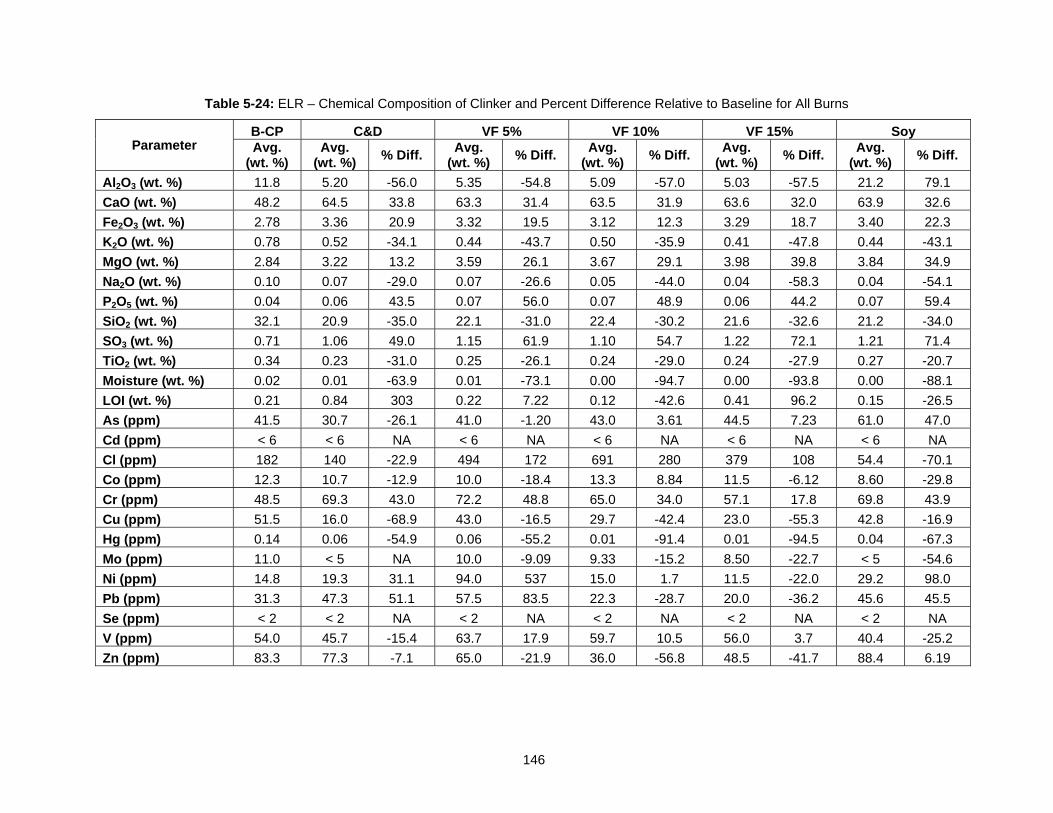
146
Table 5-24: ELR – Chemical Composition of Clinker and Percent Difference Relative to Baseline for All Burns
Parameter B-CP C&D VF 5% VF 10% VF 15% Soy Avg.
(wt. %) Avg.
(wt. %) % Diff.
Avg. (wt. %)
% Diff. Avg.
(wt. %) % Diff.
Avg. (wt. %)
% Diff. Avg.
(wt. %) % Diff.
Al2O3 (wt. %) 11.8 5.20 -56.0 5.35 -54.8 5.09 -57.0 5.03 -57.5 21.2 79.1
CaO (wt. %) 48.2 64.5 33.8 63.3 31.4 63.5 31.9 63.6 32.0 63.9 32.6
Fe2O3 (wt. %) 2.78 3.36 20.9 3.32 19.5 3.12 12.3 3.29 18.7 3.40 22.3
K2O (wt. %) 0.78 0.52 -34.1 0.44 -43.7 0.50 -35.9 0.41 -47.8 0.44 -43.1
MgO (wt. %) 2.84 3.22 13.2 3.59 26.1 3.67 29.1 3.98 39.8 3.84 34.9
Na2O (wt. %) 0.10 0.07 -29.0 0.07 -26.6 0.05 -44.0 0.04 -58.3 0.04 -54.1
P2O5 (wt. %) 0.04 0.06 43.5 0.07 56.0 0.07 48.9 0.06 44.2 0.07 59.4
SiO2 (wt. %) 32.1 20.9 -35.0 22.1 -31.0 22.4 -30.2 21.6 -32.6 21.2 -34.0
SO3 (wt. %) 0.71 1.06 49.0 1.15 61.9 1.10 54.7 1.22 72.1 1.21 71.4
TiO2 (wt. %) 0.34 0.23 -31.0 0.25 -26.1 0.24 -29.0 0.24 -27.9 0.27 -20.7
Moisture (wt. %) 0.02 0.01 -63.9 0.01 -73.1 0.00 -94.7 0.00 -93.8 0.00 -88.1
LOI (wt. %) 0.21 0.84 303 0.22 7.22 0.12 -42.6 0.41 96.2 0.15 -26.5
As (ppm) 41.5 30.7 -26.1 41.0 -1.20 43.0 3.61 44.5 7.23 61.0 47.0
Cd (ppm) < 6 < 6 NA < 6 NA < 6 NA < 6 NA < 6 NA
Cl (ppm) 182 140 -22.9 494 172 691 280 379 108 54.4 -70.1
Co (ppm) 12.3 10.7 -12.9 10.0 -18.4 13.3 8.84 11.5 -6.12 8.60 -29.8
Cr (ppm) 48.5 69.3 43.0 72.2 48.8 65.0 34.0 57.1 17.8 69.8 43.9
Cu (ppm) 51.5 16.0 -68.9 43.0 -16.5 29.7 -42.4 23.0 -55.3 42.8 -16.9
Hg (ppm) 0.14 0.06 -54.9 0.06 -55.2 0.01 -91.4 0.01 -94.5 0.04 -67.3
Mo (ppm) 11.0 < 5 NA 10.0 -9.09 9.33 -15.2 8.50 -22.7 < 5 -54.6
Ni (ppm) 14.8 19.3 31.1 94.0 537 15.0 1.7 11.5 -22.0 29.2 98.0
Pb (ppm) 31.3 47.3 51.1 57.5 83.5 22.3 -28.7 20.0 -36.2 45.6 45.5
Se (ppm) < 2 < 2 NA < 2 NA < 2 NA < 2 NA < 2 NA
V (ppm) 54.0 45.7 -15.4 63.7 17.9 59.7 10.5 56.0 3.7 40.4 -25.2
Zn (ppm) 83.3 77.3 -7.1 65.0 -21.9 36.0 -56.8 48.5 -41.7 88.4 6.19
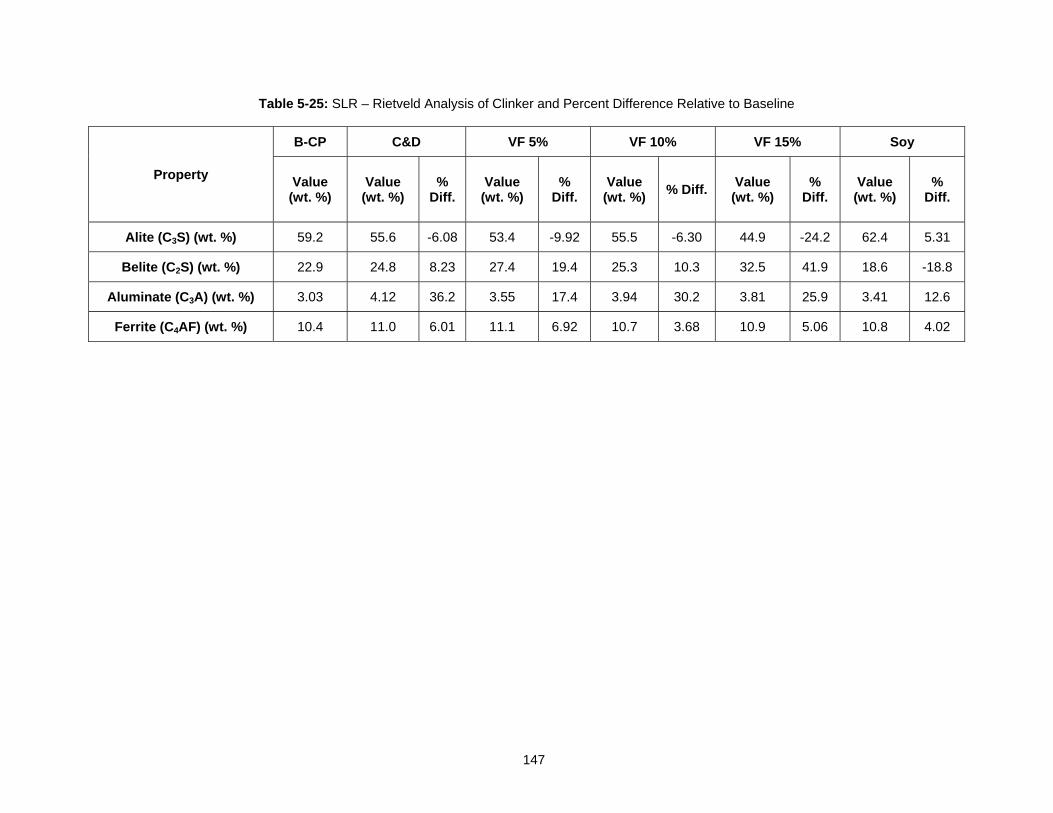
147
Table 5-25: SLR – Rietveld Analysis of Clinker and Percent Difference Relative to Baseline
Property
B-CP C&D VF 5% VF 10% VF 15% Soy
Value (wt. %)
Value (wt. %)
% Diff.
Value (wt. %)
% Diff.
Value (wt. %)
% Diff. Value (wt. %)
% Diff.
Value (wt. %)
% Diff.
Alite (C3S) (wt. %) 59.2 55.6 -6.08 53.4 -9.92 55.5 -6.30 44.9 -24.2 62.4 5.31
Belite (C2S) (wt. %) 22.9 24.8 8.23 27.4 19.4 25.3 10.3 32.5 41.9 18.6 -18.8
Aluminate (C3A) (wt. %) 3.03 4.12 36.2 3.55 17.4 3.94 30.2 3.81 25.9 3.41 12.6
Ferrite (C4AF) (wt. %) 10.4 11.0 6.01 11.1 6.92 10.7 3.68 10.9 5.06 10.8 4.02

148
5.4.6 Chemical Composition of Cement
The final product of the manufacturing process is portland cement. All of the cement produced
during the trial burns by the cement plant was indented to meet ASTM C 150 specifications for
Type I/II cement. Samples were gathered by the cement plant during each burn period.
Composite specimens were prepared and tested by the cement plant and sent to the external
laboratory for analysis. Sample sizes were not large enough in order to perform Wilcoxon rank-
sum tests for each parameter. Therefore, only the average values and percent difference relative
to the baseline test results are presented.
The cement chemical composition data obtained from the cement plant are shown in
Table 5-26 and Figure 5-8. Most parameters are fairly consistent throughout trial burns. The
average content as well as the 5th and 95th percentiles of the data collected are shown in Table 5-
26 and Figure 5-8. Since the data from the trials have a small variance, the percentile bars are
nearly equal to the mean value.
All the primary oxides decreased slightly from the reported values from the clinker. The
SO3 contents increased from the clinker results which is due to the addition of gypsum or other
sources of sulfates during grinding. The SO3 contents in the baseline and soybean burn cements
slightly exceeded the allowable 3 % maximum to be considered Type I and II cement. A slight
excess is permissible, however, if the cement is in compliance with ASTM C 563 and 1038.
Overall, the parameter values from the cement plant stayed fairly consistent between the clinker
and cement results. The percent difference relative to the baseline, depicted Figure 5-9, shows
that the parameters for all the trial burns stayed fairly consistent. The greatest fluctuation was
found in the K2O and Na2O contents. The K2O content for the construction and demolition waste
trial burn differed by 19 % from the baseline burn. The Na2O content increased by 14 % and 17
% for the variable feed 5 % and 10 % burns, respectively. The Na2O content decreased by 12 %
in the soy trial burn.
Composite cement specimens were prepared for testing by the external laboratory for
every 24-hour period during each burn. The external laboratory results are shown in Table 5-27.
The results of each parameter between the external and cement plant laboratories are similar.
This provides a high level of confidence in precision of the results.
In the external laboratory results, the primary oxides stayed fairly consistent compared to
the baseline. Due to the addition of sulfate during grinding, the SO3 content in the cement
increased from the clinker composition just as it did in the cement plant results. The external
laboratory reported that the P2O5 content increased over the variable feed 5 and 10 % and
soybean seed trial burns compared to the control results. Excessive P2O5 concentrations can
inhibit the formation of C3S. However, the external laboratory reported that the C3S content of the
variable feed 5 and 10 % trial burns decreased 17 and 14 %, respectively, compared to the
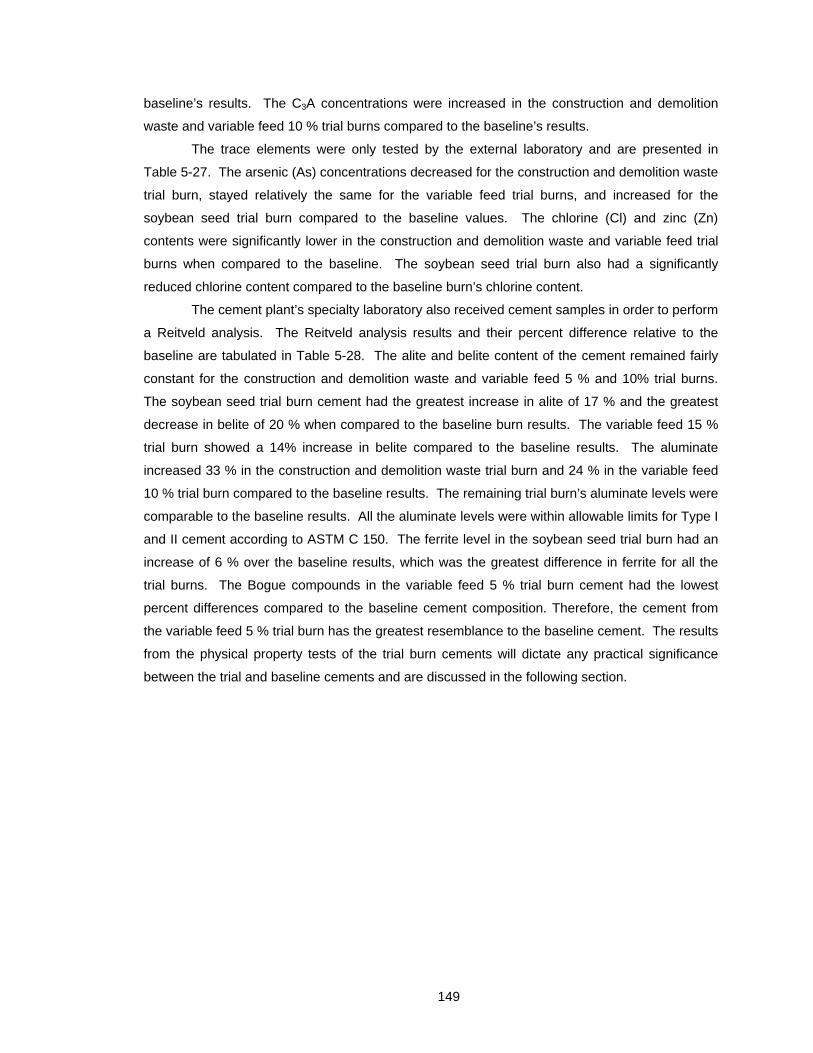
149
baseline’s results. The C3A concentrations were increased in the construction and demolition
waste and variable feed 10 % trial burns compared to the baseline’s results.
The trace elements were only tested by the external laboratory and are presented in
Table 5-27. The arsenic (As) concentrations decreased for the construction and demolition waste
trial burn, stayed relatively the same for the variable feed trial burns, and increased for the
soybean seed trial burn compared to the baseline values. The chlorine (Cl) and zinc (Zn)
contents were significantly lower in the construction and demolition waste and variable feed trial
burns when compared to the baseline. The soybean seed trial burn also had a significantly
reduced chlorine content compared to the baseline burn’s chlorine content.
The cement plant’s specialty laboratory also received cement samples in order to perform
a Reitveld analysis. The Reitveld analysis results and their percent difference relative to the
baseline are tabulated in Table 5-28. The alite and belite content of the cement remained fairly
constant for the construction and demolition waste and variable feed 5 % and 10% trial burns.
The soybean seed trial burn cement had the greatest increase in alite of 17 % and the greatest
decrease in belite of 20 % when compared to the baseline burn results. The variable feed 15 %
trial burn showed a 14% increase in belite compared to the baseline results. The aluminate
increased 33 % in the construction and demolition waste trial burn and 24 % in the variable feed
10 % trial burn compared to the baseline results. The remaining trial burn’s aluminate levels were
comparable to the baseline results. All the aluminate levels were within allowable limits for Type I
and II cement according to ASTM C 150. The ferrite level in the soybean seed trial burn had an
increase of 6 % over the baseline results, which was the greatest difference in ferrite for all the
trial burns. The Bogue compounds in the variable feed 5 % trial burn cement had the lowest
percent differences compared to the baseline cement composition. Therefore, the cement from
the variable feed 5 % trial burn has the greatest resemblance to the baseline cement. The results
from the physical property tests of the trial burn cements will dictate any practical significance
between the trial and baseline cements and are discussed in the following section.

150
Table 5-26: CPR – Average Cement Composition and Percent Differences Relative to Baseline Results
Parameter B-CP C&D VF 5% VF 10% VF 15% Soy
Average (wt. %)
Average(wt. %)
% Diff.
Average(wt. %)
% Diff.
Average (wt. %)
% Diff.
Average(wt. %)
% Diff. Average(wt. %)
% Diff.
Al2O3 4.51 4.95 9.63 4.76 5.58 4.73 4.75 4.73 4.84 4.54 0.55
CaO 62.8 63.1 0.60 62.9 0.24 62.9 0.17 62.6 -0.31 63.4 1.06
CO2 1.30 1.30 0.00 1.30 0.00 1.30 0.00 1.30 0.00 1.55 19.2
Fe2O3 3.11 3.08 -0.90 3.21 3.22 3.11 -0.11 3.18 2.35 3.18 2.43
K2O 0.44 0.52 19.4 0.48 9.89 0.48 10.3 0.46 5.67 0.45 2.53
MgO 3.44 3.13 -8.91 3.26 -5.38 3.33 -3.36 3.53 2.70 3.40 -1.04
Na2O 0.07 0.07 0.00 0.08 14.3 0.08 17.0 0.07 0.39 0.06 -12.28
Na2Oeq 0.35 0.41 15.7 0.39 10.7 0.40 11.4 0.37 4.65 0.35 -0.33
SiO2 19.9 19.6 -1.66 19.3 -3.32 19.6 -1.63 19.6 -1.49 19.4 -2.71
SO3 3.18 2.78 -12.6 2.97 -6.73 2.75 -13.7 2.82 -11.27 3.23 1.46
Free CaO 1.20 1.51 25.7 1.03 -14.4 1.02 -15.2 0.78 -35.18 1.16 -3.88
LOI 2.50 2.08 -16.9 2.46 -1.92 2.53 1.04 2.42 -3.55 2.51 0.11
C3A 6.70 7.90 17.9 7.20 7.43 7.28 8.58 7.16 6.80 6.64 -0.92
C4AF 9.46 9.37 -0.90 9.76 3.22 9.45 -0.15 9.68 2.35 9.69 2.43
C3S 53.4 55.7 4.32 57.8 8.26 56.1 5.08 54.3 1.69 58.5 9.57
C2S 16.8 14.1 -16.0 11.6 -31.0 13.9 -17.7 15.3 -9.10 11.4 -32.1
Blaine SSA (m2/kg) 387 374 -3.3 379 -2.1 369 -4.7 367 -5.2 385 -0.5
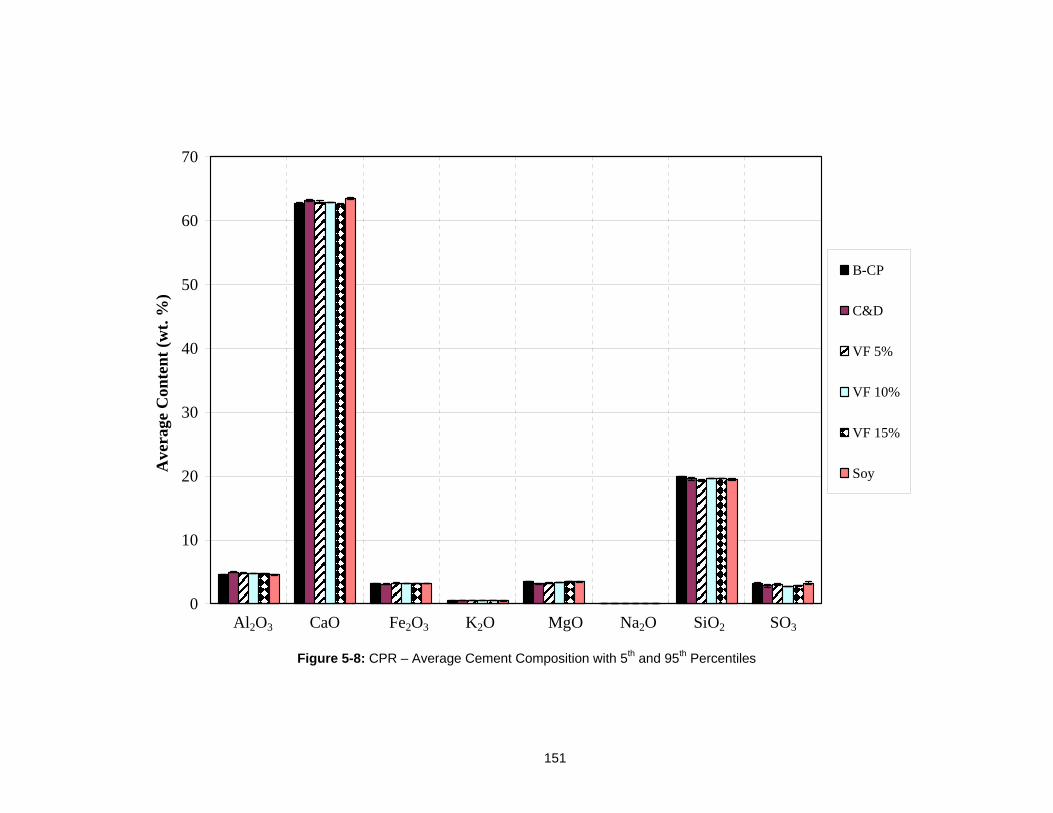
151
Figure 5-8: CPR – Average Cement Composition with 5th and 95th Percentiles
0
10
20
30
40
50
60
70A
vera
ge C
onte
nt
(wt.
%)
B-CP
C&D
VF 5%
VF 10%
VF 15%
Soy
Al2O3 CaO Fe2O3 K2O MgO Na2O SiO2 SO3
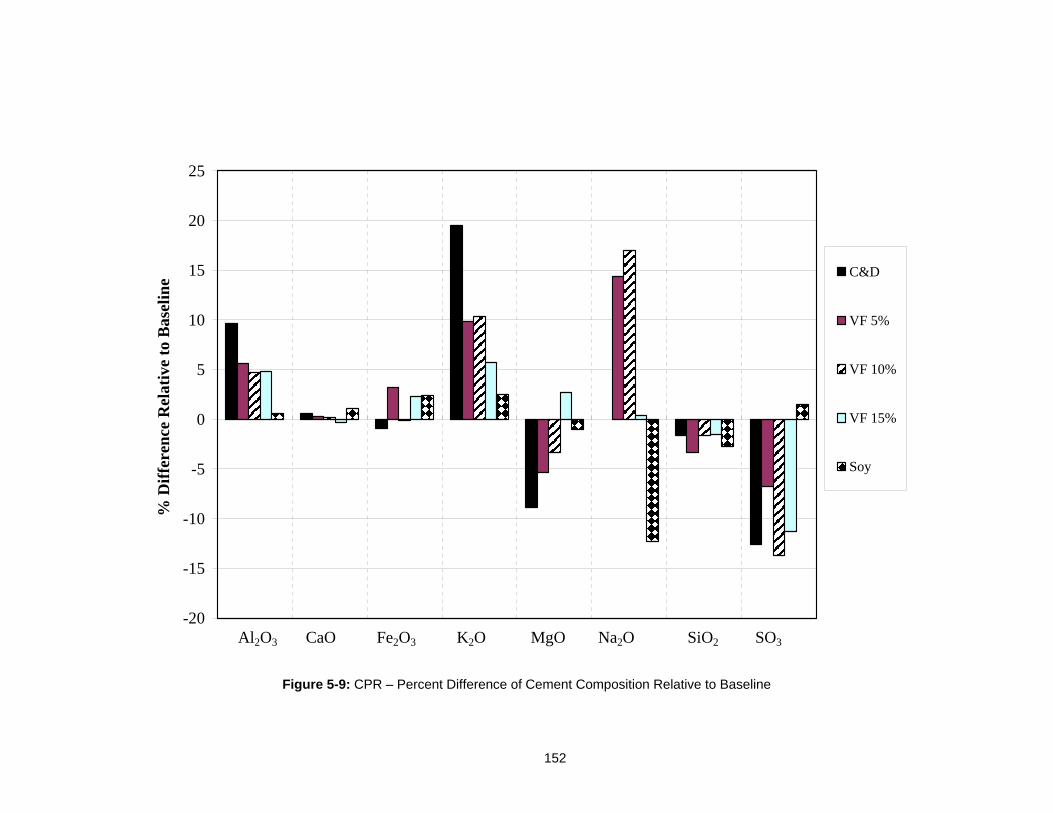
152
Figure 5-9: CPR – Percent Difference of Cement Composition Relative to Baseline
-20
-15
-10
-5
0
5
10
15
20
25%
Dif
fere
nce
Rel
ativ
e to
Bas
elin
e
C&D
VF 5%
VF 10%
VF 15%
Soy
Al2O3 CaO Fe2O3 K2O MgO Na2O SiO2 SO3
153
Table 5-27: ELR – Average Cement Composition and Percent Difference Relative to Baseline Results
Property B-CP C&D VF 5% VF 10% VF 15% Soy Value (wt. %)
Value (wt. %)
% Diff. Value (wt. %)
% Diff. Value (wt. %)
% Diff. Value (wt. %)
% Diff. Value (wt. %)
% Diff.
Al2O3 (wt. %) 4.64 5.23 12.8 5.00 7.79 5.01 8.01 4.97 7.23 4.88 5.36 CaO (wt. %) 62.4 62.5 0.25 62.0 -0.66 61.9 -0.81 61.6 -1.22 62.4 0.04 Fe2O3 (wt. %) 3.08 3.12 1.35 3.19 3.68 3.07 -0.20 3.13 1.56 3.18 3.06 K2O (wt. %) 0.38 0.47 26.4 0.33 -11.25 0.39 4.01 0.42 11.7 0.33 -13.3 MgO (wt. %) 3.45 3.15 -8.65 3.34 -3.19 3.46 0.11 3.67 6.19 3.65 5.64 Na2O (wt. %) 0.05 0.06 23.0 0.06 20.6 0.05 0.13 0.06 20.0 0.05 -0.39 P2O5 (wt. %) 0.05 0.06 11.8 0.07 27.9 0.07 27.4 0.06 9.08 0.08 44.8 SiO2 (wt. %) 20.1 20.2 0.62 20.4 1.72 20.4 1.77 20.4 1.83 19.6 -2.46 SO3 (wt. %) 3.03 2.91 -3.82 3.07 1.31 2.77 -8.43 2.92 -3.40 3.23 6.81 TiO2 (wt. %) 0.21 0.21 0.13 0.23 5.07 0.23 9.22 0.23 9.07 0.25 17.70 Moisture (wt. %) 0.12 0.19 64.4 0.25 114 0.35 205 0.34 196 0.53 360 LOI (wt. %) 2.55 1.93 -24.1 2.22 -12.61 2.54 -0.19 2.39 -6.17 2.25 -11.77 C3S (wt. %) 49.0 44.8 -8.71 40.8 -16.8 42.0 -14.2 40.6 -17.3 50.9 3.77 C2S (wt. %) 20.5 24.1 17.4 27.7 35.2 26.8 30.6 28.0 36.2 17.7 -13.7 C3A (wt. %) 7.07 8.58 21.3 7.84 10.8 8.07 14.1 7.88 11.4 7.57 7.05 C4AF (wt. %) 9.38 9.50 1.35 9.72 3.68 9.36 -0.20 9.52 1.56 9.66 3.06 TOC (wt. %) 0.08 1.84 2350 1.50 1900 1.48 1870.0 1.88 2400 0.03 -66.7 As (ppm) 42.5 27.0 -36.5 40.0 -5.88 47.0 10.6 40.0 -5.88 62.5 47.1 Cd (ppm) 6.00 6.00 0.00 6.00 0.00 6.00 0.00 6.00 0.00 6.00 0.00 Cl (ppm) 423 200 -52.8 200 -52.7 163.0 -61.5 135 -68.1 121 -71.4 Co (ppm) 10.0 11.5 15.0 12.0 20.0 6.0 -40.0 17.0 70.0 6.00 -40.0 Cr (ppm) 57.0 64.0 12.3 61.0 7.00 66.7 16.9 84.6 48.4 95.8 68.0 Cu (ppm) 28.0 13.0 -53.6 27.0 -3.57 43.0 53.6 26.0 -7.14 56.5 102 Hg (ppm) 0.01 0.02 250 0.01 0.00 0.01 20.0 0.01 20.0 0.14 2640 Mo (ppm) 5.00 5.00 0.00 5.00 0.00 5.00 0.00 5.00 0.00 5.00 0.00 Ni (ppm) 13.0 19.5 50.0 13.0 0.00 18.0 38.5 12.0 -7.69 27.5 111.5 Pb (ppm) 5.00 51.5 930 102 1940 5.00 0.00 5.00 0.00 15.5 210.0 Se (ppm) 2.00 2.00 0.00 2.00 0.00 2.00 0.00 2.00 0.00 2.00 0.00 V (ppm) 58.0 40.5 -30.2 58.00 0.00 51.0 -12.1 60.0 3.45 37.0 -36.2 Zn (ppm) 95.0 73.5 -22.6 62.0 -34.7 41.0 -56.8 66.0 -30.5 87.0 -8.42
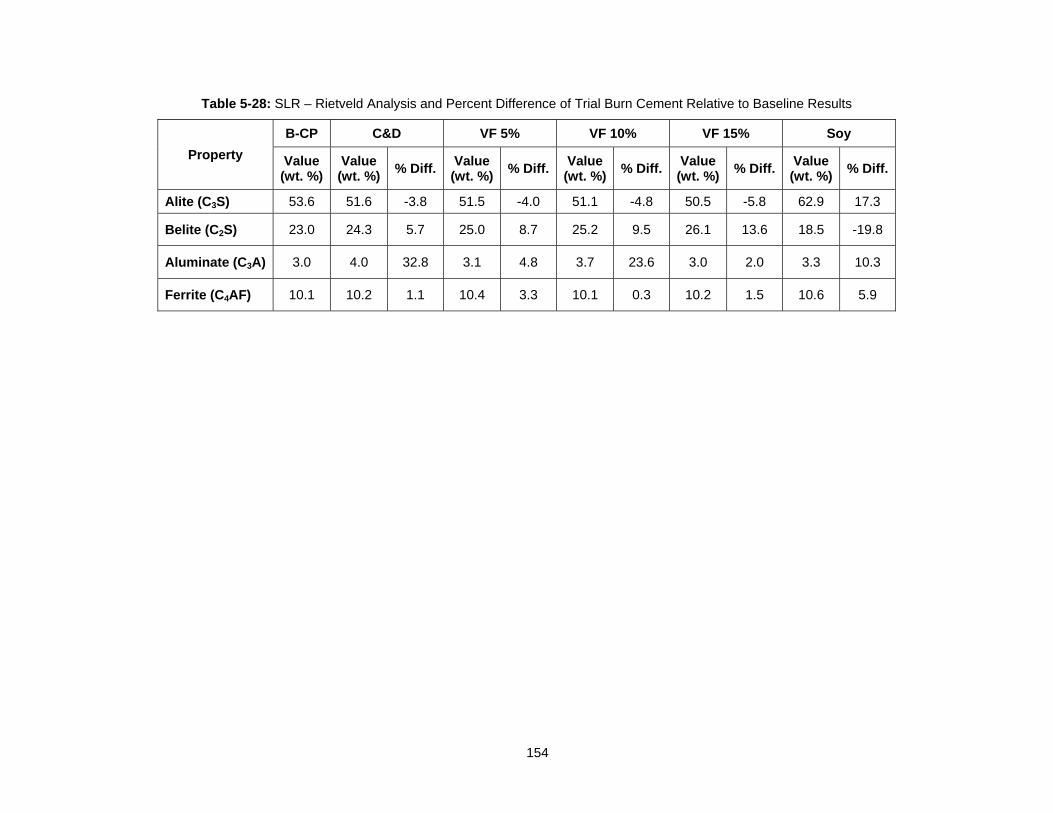
154
Table 5-28: SLR – Rietveld Analysis and Percent Difference of Trial Burn Cement Relative to Baseline Results
Property
B-CP C&D VF 5% VF 10% VF 15% Soy
Value (wt. %)
Value(wt. %)
% Diff.Value(wt. %)
% Diff.Value(wt. %)
% Diff.Value(wt. %)
% Diff.Value(wt. %)
% Diff.
Alite (C3S) 53.6 51.6 -3.8 51.5 -4.0 51.1 -4.8 50.5 -5.8 62.9 17.3
Belite (C2S) 23.0 24.3 5.7 25.0 8.7 25.2 9.5 26.1 13.6 18.5 -19.8
Aluminate (C3A) 3.0 4.0 32.8 3.1 4.8 3.7 23.6 3.0 2.0 3.3 10.3
Ferrite (C4AF) 10.1 10.2 1.1 10.4 3.3 10.1 0.3 10.2 1.5 10.6 5.9
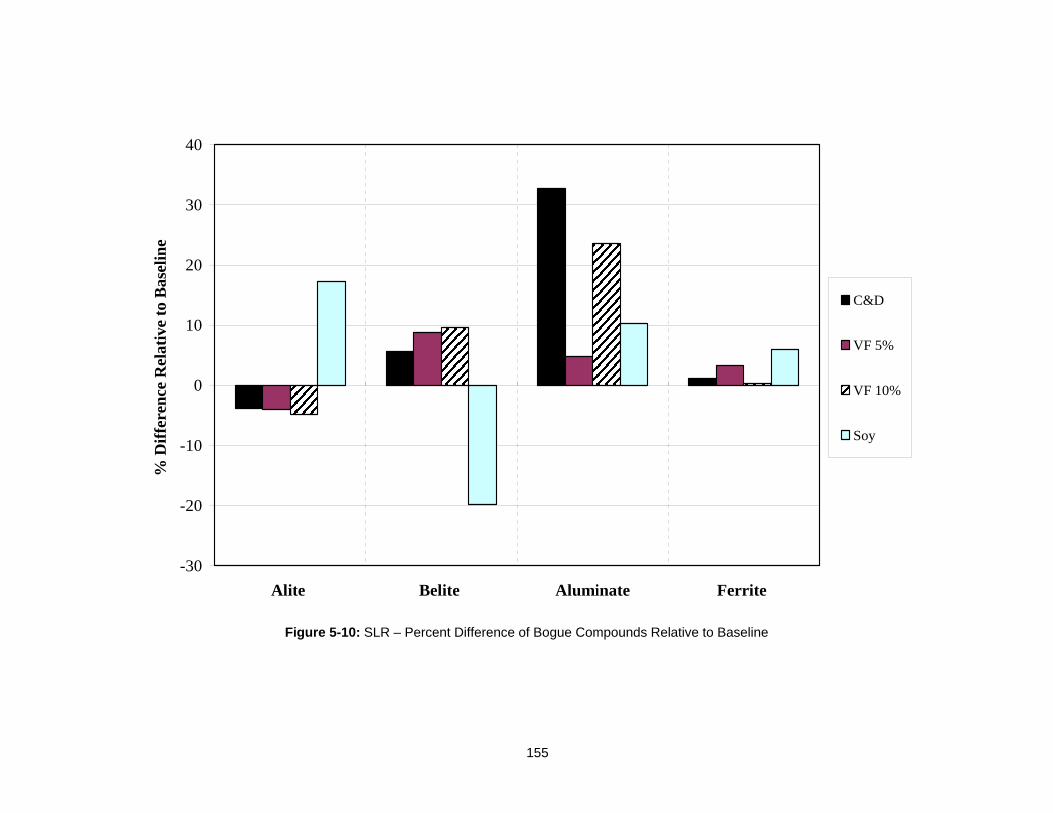
155
Figure 5-10: SLR – Percent Difference of Bogue Compounds Relative to Baseline
-30
-20
-10
0
10
20
30
40
Alite Belite Aluminate Ferrite
% D
iffe
ren
ce R
elat
ive
to B
asel
ine
C&D
VF 5%
VF 10%
Soy
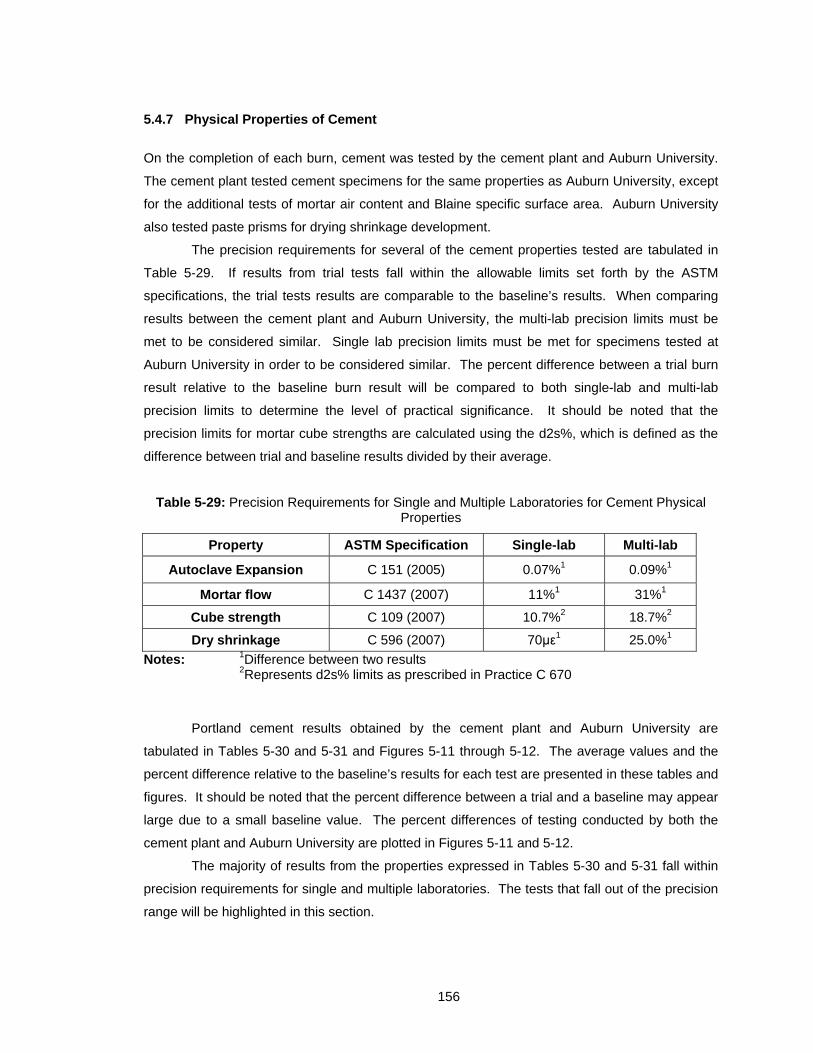
156
5.4.7 Physical Properties of Cement
On the completion of each burn, cement was tested by the cement plant and Auburn University.
The cement plant tested cement specimens for the same properties as Auburn University, except
for the additional tests of mortar air content and Blaine specific surface area. Auburn University
also tested paste prisms for drying shrinkage development.
The precision requirements for several of the cement properties tested are tabulated in
Table 5-29. If results from trial tests fall within the allowable limits set forth by the ASTM
specifications, the trial tests results are comparable to the baseline’s results. When comparing
results between the cement plant and Auburn University, the multi-lab precision limits must be
met to be considered similar. Single lab precision limits must be met for specimens tested at
Auburn University in order to be considered similar. The percent difference between a trial burn
result relative to the baseline burn result will be compared to both single-lab and multi-lab
precision limits to determine the level of practical significance. It should be noted that the
precision limits for mortar cube strengths are calculated using the d2s%, which is defined as the
difference between trial and baseline results divided by their average.
Table 5-29: Precision Requirements for Single and Multiple Laboratories for Cement Physical Properties
Property ASTM Specification Single-lab Multi-lab
Autoclave Expansion C 151 (2005) 0.07%1 0.09%1
Mortar flow C 1437 (2007) 11%1 31%1
Cube strength C 109 (2007) 10.7%2 18.7%2
Dry shrinkage C 596 (2007) 70με1 25.0%1
Notes: 1Difference between two results 2Represents d2s% limits as prescribed in Practice C 670
Portland cement results obtained by the cement plant and Auburn University are
tabulated in Tables 5-30 and 5-31 and Figures 5-11 through 5-12. The average values and the
percent difference relative to the baseline’s results for each test are presented in these tables and
figures. It should be noted that the percent difference between a trial and a baseline may appear
large due to a small baseline value. The percent differences of testing conducted by both the
cement plant and Auburn University are plotted in Figures 5-11 and 5-12.
The majority of results from the properties expressed in Tables 5-30 and 5-31 fall within
precision requirements for single and multiple laboratories. The tests that fall out of the precision
range will be highlighted in this section.
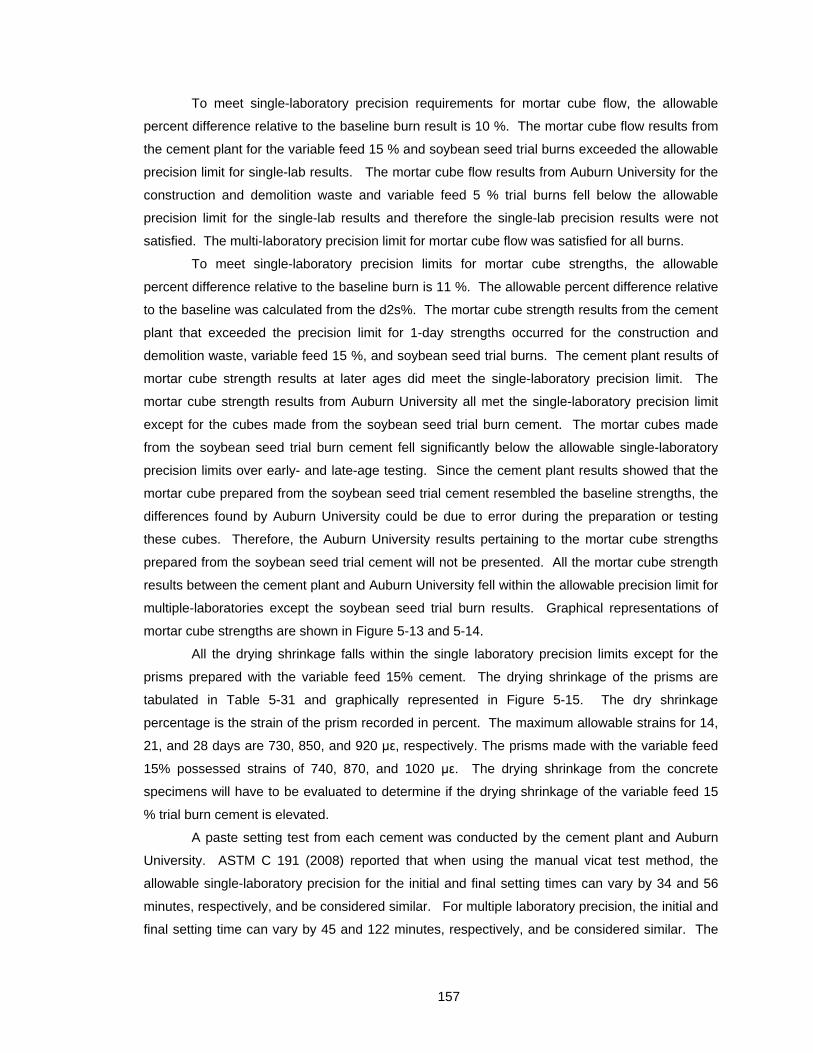
157
To meet single-laboratory precision requirements for mortar cube flow, the allowable
percent difference relative to the baseline burn result is 10 %. The mortar cube flow results from
the cement plant for the variable feed 15 % and soybean seed trial burns exceeded the allowable
precision limit for single-lab results. The mortar cube flow results from Auburn University for the
construction and demolition waste and variable feed 5 % trial burns fell below the allowable
precision limit for the single-lab results and therefore the single-lab precision results were not
satisfied. The multi-laboratory precision limit for mortar cube flow was satisfied for all burns.
To meet single-laboratory precision limits for mortar cube strengths, the allowable
percent difference relative to the baseline burn is 11 %. The allowable percent difference relative
to the baseline was calculated from the d2s%. The mortar cube strength results from the cement
plant that exceeded the precision limit for 1-day strengths occurred for the construction and
demolition waste, variable feed 15 %, and soybean seed trial burns. The cement plant results of
mortar cube strength results at later ages did meet the single-laboratory precision limit. The
mortar cube strength results from Auburn University all met the single-laboratory precision limit
except for the cubes made from the soybean seed trial burn cement. The mortar cubes made
from the soybean seed trial burn cement fell significantly below the allowable single-laboratory
precision limits over early- and late-age testing. Since the cement plant results showed that the
mortar cube prepared from the soybean seed trial cement resembled the baseline strengths, the
differences found by Auburn University could be due to error during the preparation or testing
these cubes. Therefore, the Auburn University results pertaining to the mortar cube strengths
prepared from the soybean seed trial cement will not be presented. All the mortar cube strength
results between the cement plant and Auburn University fell within the allowable precision limit for
multiple-laboratories except the soybean seed trial burn results. Graphical representations of
mortar cube strengths are shown in Figure 5-13 and 5-14.
All the drying shrinkage falls within the single laboratory precision limits except for the
prisms prepared with the variable feed 15% cement. The drying shrinkage of the prisms are
tabulated in Table 5-31 and graphically represented in Figure 5-15. The dry shrinkage
percentage is the strain of the prism recorded in percent. The maximum allowable strains for 14,
21, and 28 days are 730, 850, and 920 με, respectively. The prisms made with the variable feed
15% possessed strains of 740, 870, and 1020 με. The drying shrinkage from the concrete
specimens will have to be evaluated to determine if the drying shrinkage of the variable feed 15
% trial burn cement is elevated.
A paste setting test from each cement was conducted by the cement plant and Auburn
University. ASTM C 191 (2008) reported that when using the manual vicat test method, the
allowable single-laboratory precision for the initial and final setting times can vary by 34 and 56
minutes, respectively, and be considered similar. For multiple laboratory precision, the initial and
final setting time can vary by 45 and 122 minutes, respectively, and be considered similar. The
158
initial and final setting results from the cement plant can be considered similar to the baseline
cement for each trial burn cement. All setting results from Auburn University fell within precision
limits. A graphical representation of the cement properties percent difference relative to the
baseline for the cement plant and Auburn University results are shown in Table 5-11 and 5-12.
The particle size distribution of each cement produced in this study was determined by
laser diffraction at the cement plant’s specialty laboratory. The particle size distribution of each
cement is shown in Figure 5-16. The graph shows that all the cements in the study were ground
to nearly the same size distribution. Thus, differences in cement behavior cannot be attributed to
different particle size distributions.
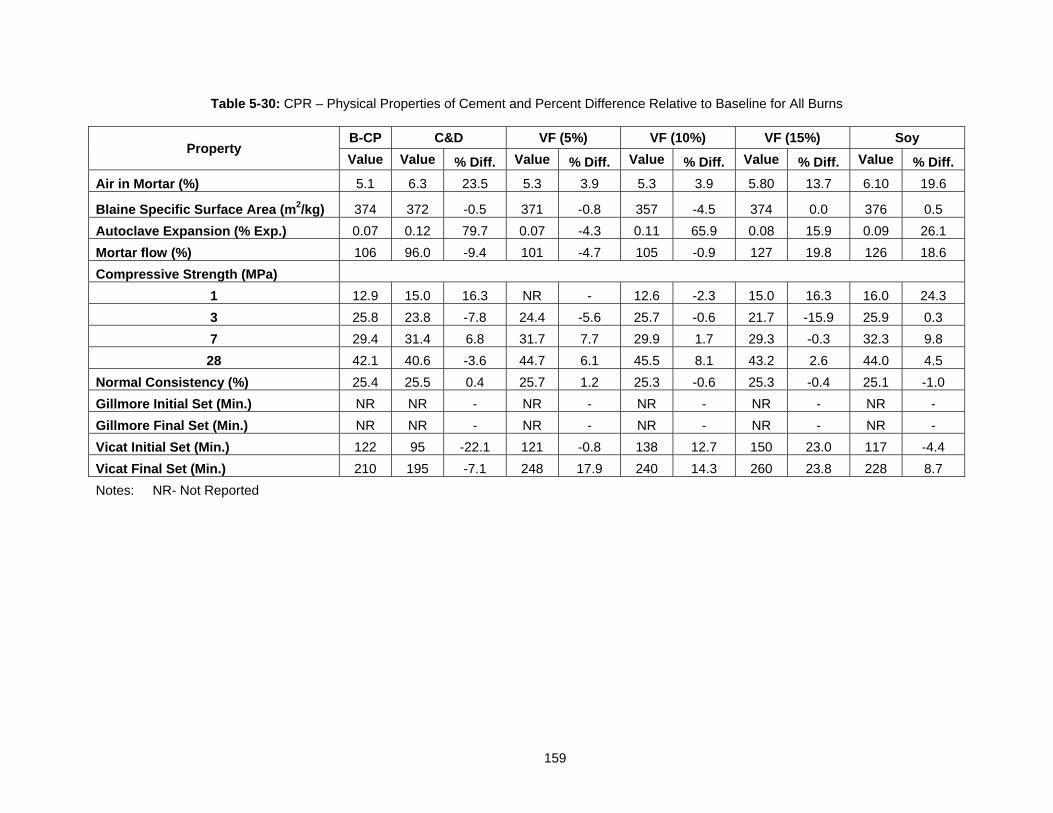
159
Table 5-30: CPR – Physical Properties of Cement and Percent Difference Relative to Baseline for All Burns
Property B-CP C&D VF (5%) VF (10%) VF (15%) Soy
Value Value % Diff. Value % Diff. Value % Diff. Value % Diff. Value % Diff.
Air in Mortar (%) 5.1 6.3 23.5 5.3 3.9 5.3 3.9 5.80 13.7 6.10 19.6
Blaine Specific Surface Area (m2/kg) 374 372 -0.5 371 -0.8 357 -4.5 374 0.0 376 0.5
Autoclave Expansion (% Exp.) 0.07 0.12 79.7 0.07 -4.3 0.11 65.9 0.08 15.9 0.09 26.1
Mortar flow (%) 106 96.0 -9.4 101 -4.7 105 -0.9 127 19.8 126 18.6
Compressive Strength (MPa)
1 12.9 15.0 16.3 NR - 12.6 -2.3 15.0 16.3 16.0 24.3
3 25.8 23.8 -7.8 24.4 -5.6 25.7 -0.6 21.7 -15.9 25.9 0.3
7 29.4 31.4 6.8 31.7 7.7 29.9 1.7 29.3 -0.3 32.3 9.8
28 42.1 40.6 -3.6 44.7 6.1 45.5 8.1 43.2 2.6 44.0 4.5
Normal Consistency (%) 25.4 25.5 0.4 25.7 1.2 25.3 -0.6 25.3 -0.4 25.1 -1.0
Gillmore Initial Set (Min.) NR NR - NR - NR - NR - NR -
Gillmore Final Set (Min.) NR NR - NR - NR - NR - NR -
Vicat Initial Set (Min.) 122 95 -22.1 121 -0.8 138 12.7 150 23.0 117 -4.4
Vicat Final Set (Min.) 210 195 -7.1 248 17.9 240 14.3 260 23.8 228 8.7
Notes: NR- Not Reported
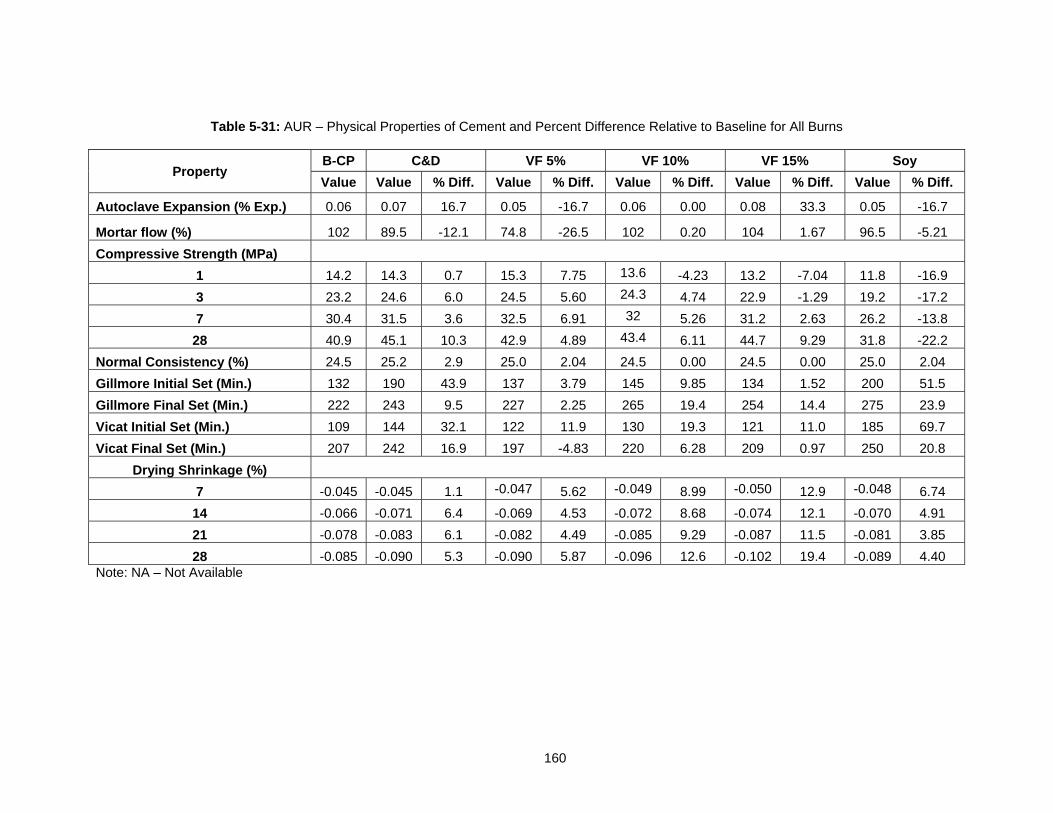
160
Table 5-31: AUR – Physical Properties of Cement and Percent Difference Relative to Baseline for All Burns
Property B-CP C&D VF 5% VF 10% VF 15% Soy
Value Value % Diff. Value % Diff. Value % Diff. Value % Diff. Value % Diff.
Autoclave Expansion (% Exp.) 0.06 0.07 16.7 0.05 -16.7 0.06 0.00 0.08 33.3 0.05 -16.7
Mortar flow (%) 102 89.5 -12.1 74.8 -26.5 102 0.20 104 1.67 96.5 -5.21
Compressive Strength (MPa)
1 14.2 14.3 0.7 15.3 7.75 13.6 -4.23 13.2 -7.04 11.8 -16.9
3 23.2 24.6 6.0 24.5 5.60 24.3 4.74 22.9 -1.29 19.2 -17.2
7 30.4 31.5 3.6 32.5 6.91 32 5.26 31.2 2.63 26.2 -13.8
28 40.9 45.1 10.3 42.9 4.89 43.4 6.11 44.7 9.29 31.8 -22.2
Normal Consistency (%) 24.5 25.2 2.9 25.0 2.04 24.5 0.00 24.5 0.00 25.0 2.04
Gillmore Initial Set (Min.) 132 190 43.9 137 3.79 145 9.85 134 1.52 200 51.5
Gillmore Final Set (Min.) 222 243 9.5 227 2.25 265 19.4 254 14.4 275 23.9
Vicat Initial Set (Min.) 109 144 32.1 122 11.9 130 19.3 121 11.0 185 69.7
Vicat Final Set (Min.) 207 242 16.9 197 -4.83 220 6.28 209 0.97 250 20.8
Drying Shrinkage (%)
7 -0.045 -0.045 1.1 -0.047 5.62 -0.049 8.99 -0.050 12.9 -0.048 6.74
14 -0.066 -0.071 6.4 -0.069 4.53 -0.072 8.68 -0.074 12.1 -0.070 4.91
21 -0.078 -0.083 6.1 -0.082 4.49 -0.085 9.29 -0.087 11.5 -0.081 3.85
28 -0.085 -0.090 5.3 -0.090 5.87 -0.096 12.6 -0.102 19.4 -0.089 4.40 Note: NA – Not Available
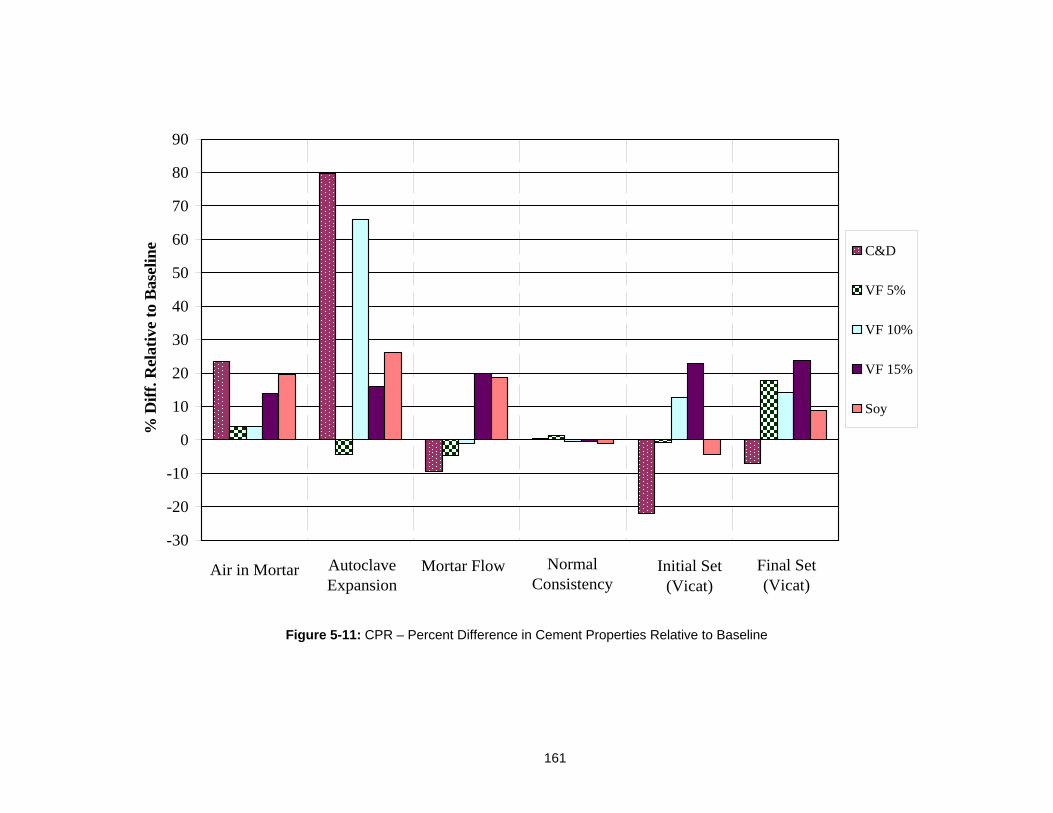
161
Figure 5-11: CPR – Percent Difference in Cement Properties Relative to Baseline
-30
-20
-10
0
10
20
30
40
50
60
70
80
90%
Dif
f. R
elat
ive
to B
asel
ine C&D
VF 5%
VF 10%
VF 15%
Soy
Autoclave Expansion
Final Set (Vicat)
Initial Set (Vicat)
Normal Consistency
Mortar Flow Air in Mortar
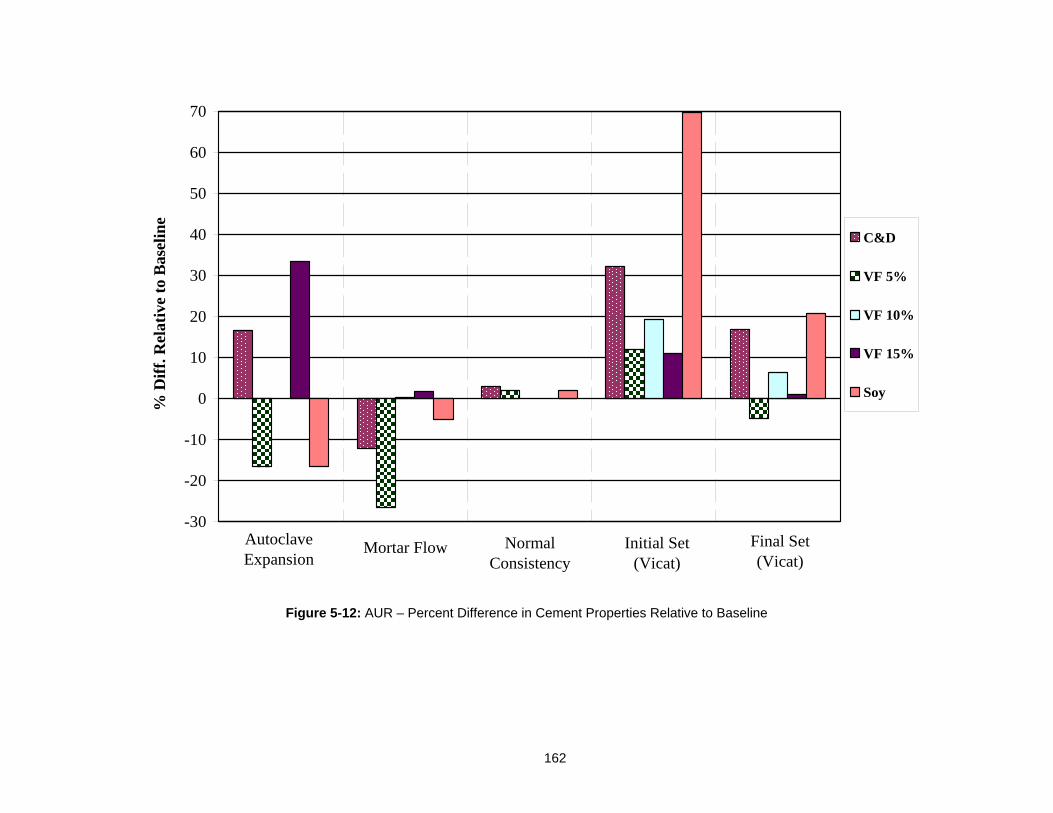
162
Figure 5-12: AUR – Percent Difference in Cement Properties Relative to Baseline
-30
-20
-10
0
10
20
30
40
50
60
70
% D
iff.
Rel
ativ
e to
Bas
elin
e
C&D
VF 5%
VF 10%
VF 15%
Soy
Autoclave Expansion
Final Set (Vicat)
Initial Set (Vicat)
Normal Consistency
Mortar Flow
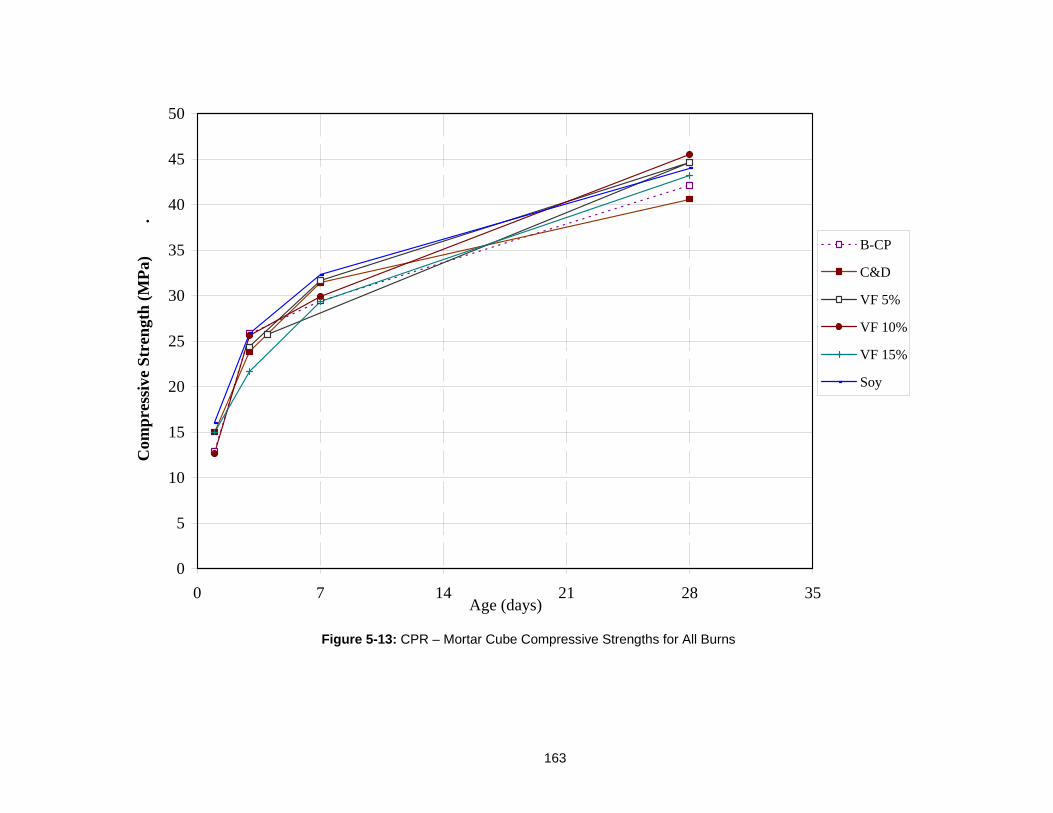
163
Figure 5-13: CPR – Mortar Cube Compressive Strengths for All Burns
0
5
10
15
20
25
30
35
40
45
50
0 7 14 21 28 35Age (days)
Com
pre
ssiv
e S
tren
gth
(M
Pa)
.
B-CP
C&D
VF 5%
VF 10%
VF 15%
Soy
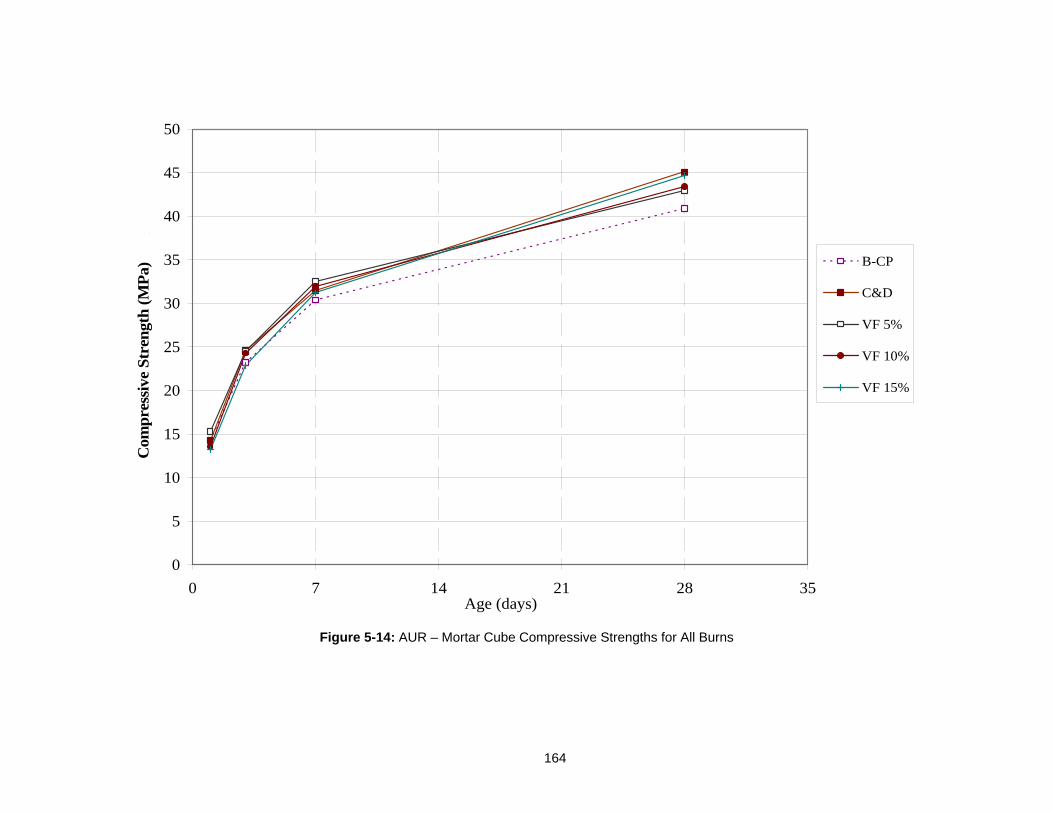
164
Figure 5-14: AUR – Mortar Cube Compressive Strengths for All Burns
0
5
10
15
20
25
30
35
40
45
50
0 7 14 21 28 35Age (days)
Com
pre
ssiv
e S
tren
gth
(M
Pa)
.
B-CP
C&D
VF 5%
VF 10%
VF 15%
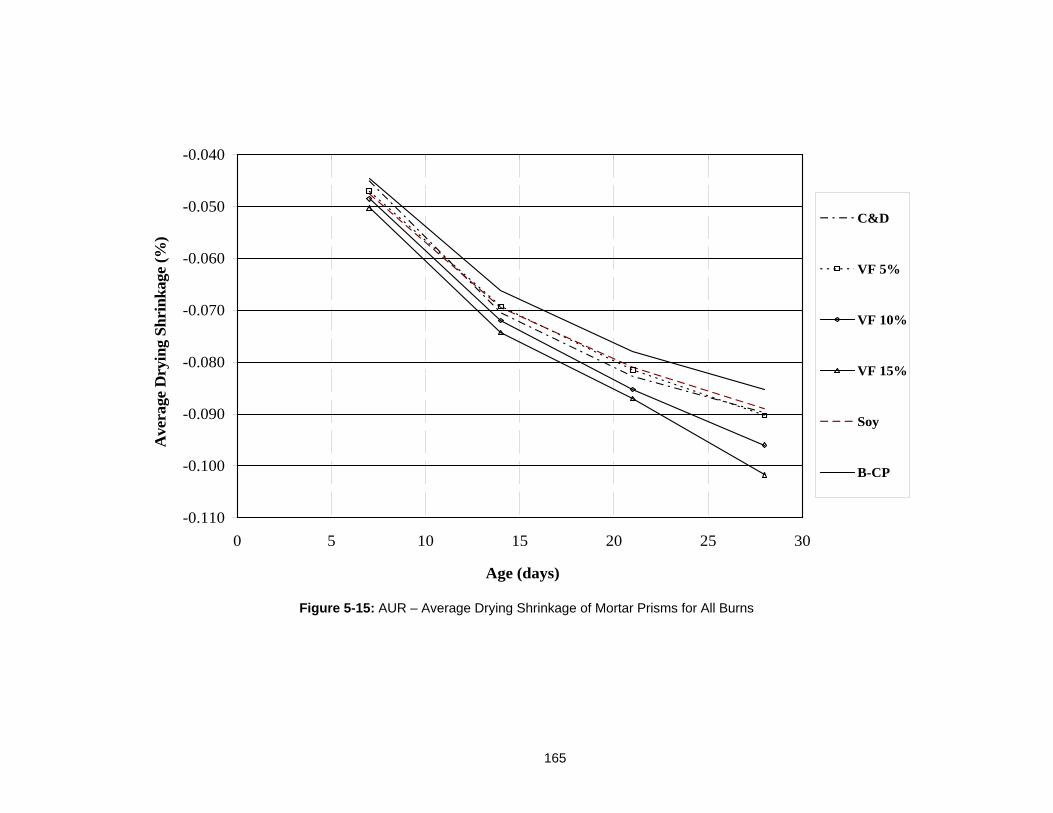
165
Figure 5-15: AUR – Average Drying Shrinkage of Mortar Prisms for All Burns
-0.110
-0.100
-0.090
-0.080
-0.070
-0.060
-0.050
-0.040
0 5 10 15 20 25 30
Age (days)
Ave
rage
Dry
ing
Sh
rin
kag
e (%
)
C&D
VF 5%
VF 10%
VF 15%
Soy
B-CP
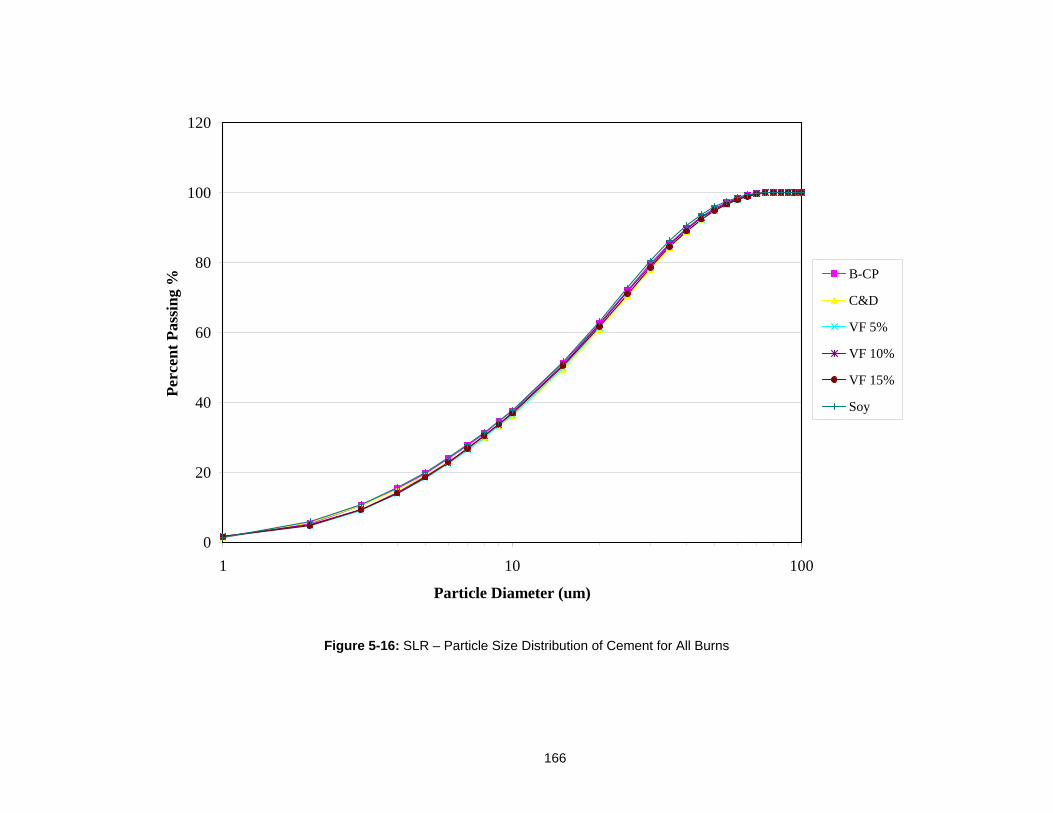
166
Figure 5-16: SLR – Particle Size Distribution of Cement for All Burns
0
20
40
60
80
100
120
1 10 100
Particle Diameter (um)
Per
cen
t P
assi
ng
% B-CP
C&D
VF 5%
VF 10%
VF 15%
Soy
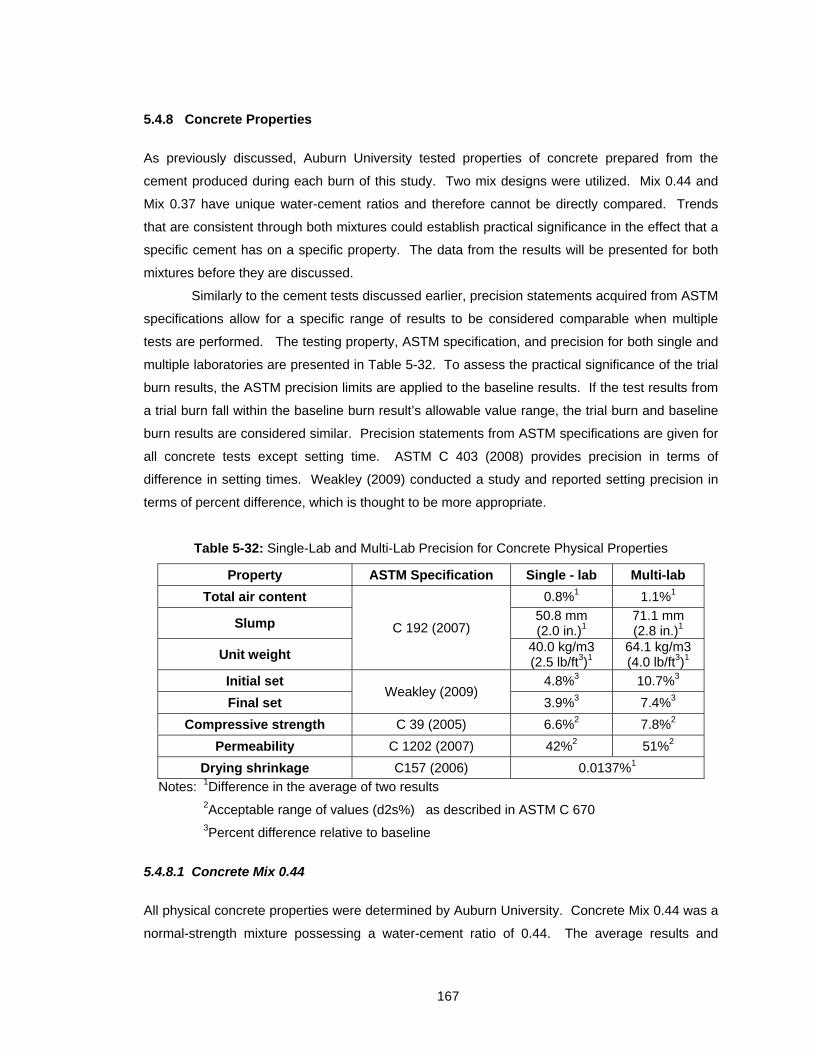
167
5.4.8 Concrete Properties
As previously discussed, Auburn University tested properties of concrete prepared from the
cement produced during each burn of this study. Two mix designs were utilized. Mix 0.44 and
Mix 0.37 have unique water-cement ratios and therefore cannot be directly compared. Trends
that are consistent through both mixtures could establish practical significance in the effect that a
specific cement has on a specific property. The data from the results will be presented for both
mixtures before they are discussed.
Similarly to the cement tests discussed earlier, precision statements acquired from ASTM
specifications allow for a specific range of results to be considered comparable when multiple
tests are performed. The testing property, ASTM specification, and precision for both single and
multiple laboratories are presented in Table 5-32. To assess the practical significance of the trial
burn results, the ASTM precision limits are applied to the baseline results. If the test results from
a trial burn fall within the baseline burn result’s allowable value range, the trial burn and baseline
burn results are considered similar. Precision statements from ASTM specifications are given for
all concrete tests except setting time. ASTM C 403 (2008) provides precision in terms of
difference in setting times. Weakley (2009) conducted a study and reported setting precision in
terms of percent difference, which is thought to be more appropriate.
Table 5-32: Single-Lab and Multi-Lab Precision for Concrete Physical Properties
Property ASTM Specification Single - lab Multi-lab
Total air content
C 192 (2007)
0.8%1 1.1%1
Slump 50.8 mm (2.0 in.)1
71.1 mm (2.8 in.)1
Unit weight 40.0 kg/m3 (2.5 lb/ft3)1
64.1 kg/m3 (4.0 lb/ft3)1
Initial set Weakley (2009)
4.8%3 10.7%3
Final set 3.9%3 7.4%3
Compressive strength C 39 (2005) 6.6%2 7.8%2
Permeability C 1202 (2007) 42%2 51%2
Drying shrinkage C157 (2006) 0.0137%1
Notes: 1Difference in the average of two results
2Acceptable range of values (d2s%) as described in ASTM C 670
3Percent difference relative to baseline
5.4.8.1 Concrete Mix 0.44
All physical concrete properties were determined by Auburn University. Concrete Mix 0.44 was a
normal-strength mixture possessing a water-cement ratio of 0.44. The average results and
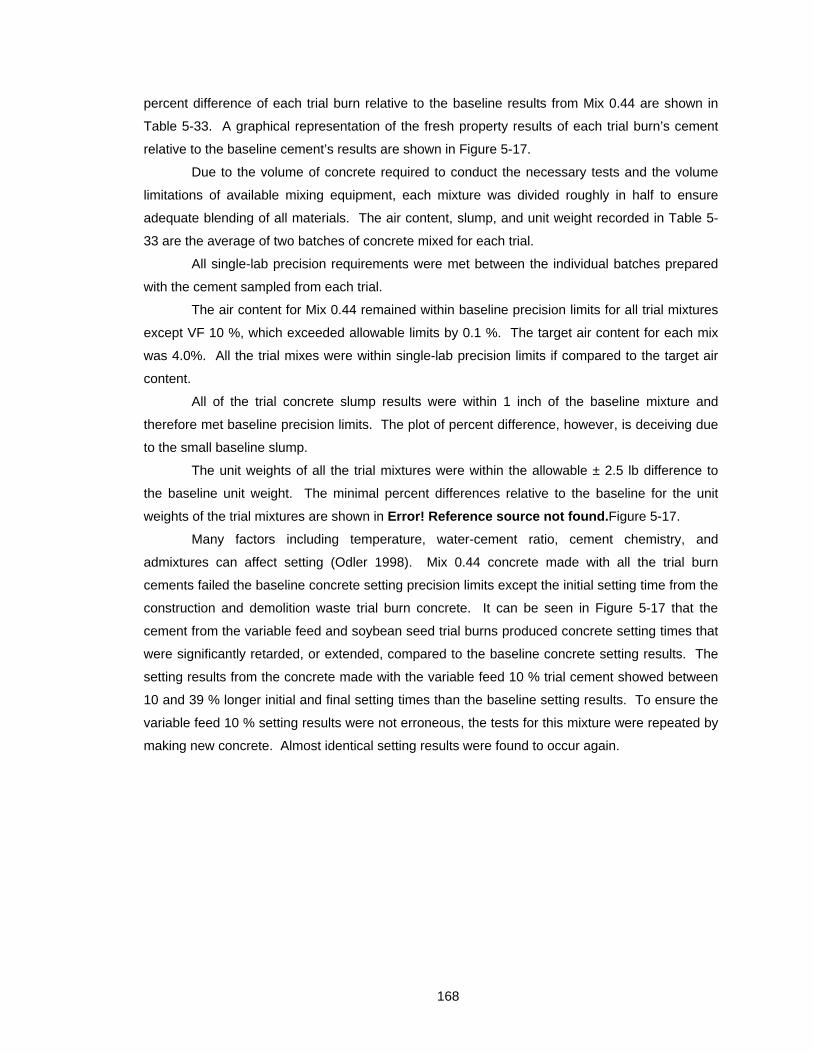
168
percent difference of each trial burn relative to the baseline results from Mix 0.44 are shown in
Table 5-33. A graphical representation of the fresh property results of each trial burn’s cement
relative to the baseline cement’s results are shown in Figure 5-17.
Due to the volume of concrete required to conduct the necessary tests and the volume
limitations of available mixing equipment, each mixture was divided roughly in half to ensure
adequate blending of all materials. The air content, slump, and unit weight recorded in Table 5-
33 are the average of two batches of concrete mixed for each trial.
All single-lab precision requirements were met between the individual batches prepared
with the cement sampled from each trial.
The air content for Mix 0.44 remained within baseline precision limits for all trial mixtures
except VF 10 %, which exceeded allowable limits by 0.1 %. The target air content for each mix
was 4.0%. All the trial mixes were within single-lab precision limits if compared to the target air
content.
All of the trial concrete slump results were within 1 inch of the baseline mixture and
therefore met baseline precision limits. The plot of percent difference, however, is deceiving due
to the small baseline slump.
The unit weights of all the trial mixtures were within the allowable ± 2.5 lb difference to
the baseline unit weight. The minimal percent differences relative to the baseline for the unit
weights of the trial mixtures are shown in Error! Reference source not found.Figure 5-17.
Many factors including temperature, water-cement ratio, cement chemistry, and
admixtures can affect setting (Odler 1998). Mix 0.44 concrete made with all the trial burn
cements failed the baseline concrete setting precision limits except the initial setting time from the
construction and demolition waste trial burn concrete. It can be seen in Figure 5-17 that the
cement from the variable feed and soybean seed trial burns produced concrete setting times that
were significantly retarded, or extended, compared to the baseline concrete setting results. The
setting results from the concrete made with the variable feed 10 % trial cement showed between
10 and 39 % longer initial and final setting times than the baseline setting results. To ensure the
variable feed 10 % setting results were not erroneous, the tests for this mixture were repeated by
making new concrete. Almost identical setting results were found to occur again.
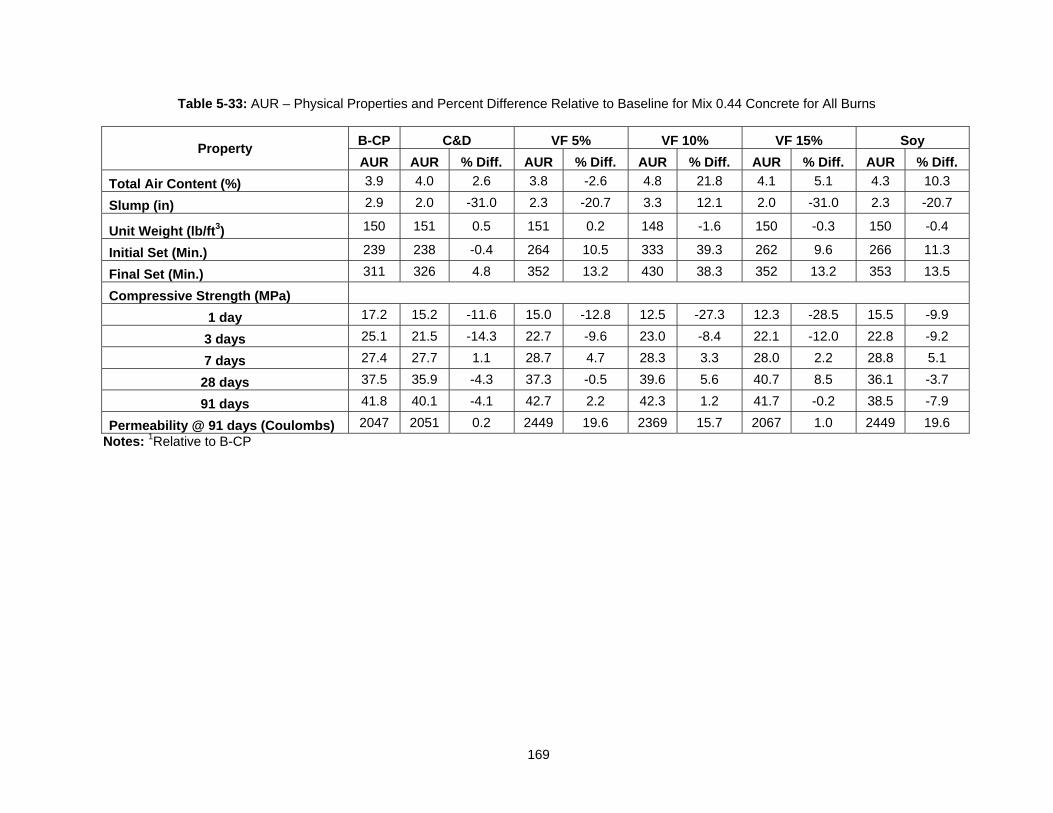
169
Table 5-33: AUR – Physical Properties and Percent Difference Relative to Baseline for Mix 0.44 Concrete for All Burns
Property B-CP C&D VF 5% VF 10% VF 15% Soy
AUR AUR % Diff. AUR % Diff. AUR % Diff. AUR % Diff. AUR % Diff.
Total Air Content (%) 3.9 4.0 2.6 3.8 -2.6 4.8 21.8 4.1 5.1 4.3 10.3
Slump (in) 2.9 2.0 -31.0 2.3 -20.7 3.3 12.1 2.0 -31.0 2.3 -20.7
Unit Weight (lb/ft3) 150 151 0.5 151 0.2 148 -1.6 150 -0.3 150 -0.4
Initial Set (Min.) 239 238 -0.4 264 10.5 333 39.3 262 9.6 266 11.3
Final Set (Min.) 311 326 4.8 352 13.2 430 38.3 352 13.2 353 13.5
Compressive Strength (MPa)
1 day 17.2 15.2 -11.6 15.0 -12.8 12.5 -27.3 12.3 -28.5 15.5 -9.9
3 days 25.1 21.5 -14.3 22.7 -9.6 23.0 -8.4 22.1 -12.0 22.8 -9.2
7 days 27.4 27.7 1.1 28.7 4.7 28.3 3.3 28.0 2.2 28.8 5.1
28 days 37.5 35.9 -4.3 37.3 -0.5 39.6 5.6 40.7 8.5 36.1 -3.7
91 days 41.8 40.1 -4.1 42.7 2.2 42.3 1.2 41.7 -0.2 38.5 -7.9
Permeability @ 91 days (Coulombs) 2047 2051 0.2 2449 19.6 2369 15.7 2067 1.0 2449 19.6
Notes: 1Relative to B-CP
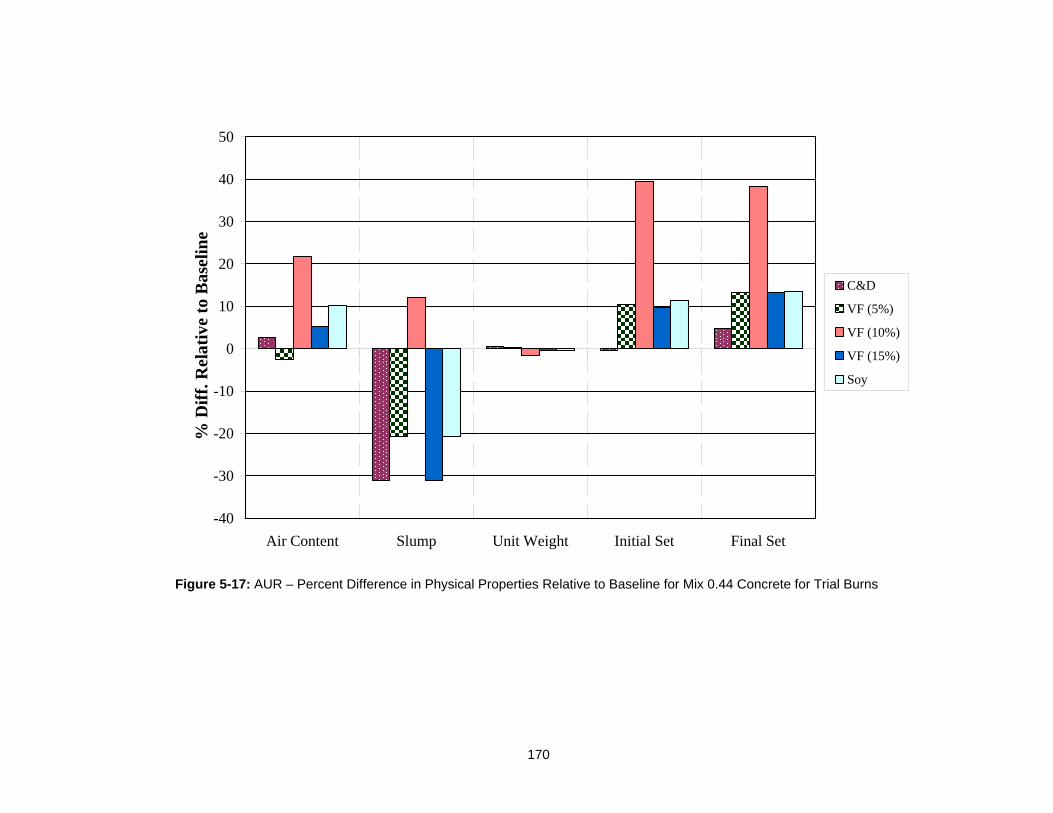
170
Figure 5-17: AUR – Percent Difference in Physical Properties Relative to Baseline for Mix 0.44 Concrete for Trial Burns
-40
-30
-20
-10
0
10
20
30
40
50
Air Content Slump Unit Weight Initial Set Final Set
% D
iff.
Rel
ativ
e to
Bas
elin
e
C&D
VF (5%)
VF (10%)
VF (15%)
Soy
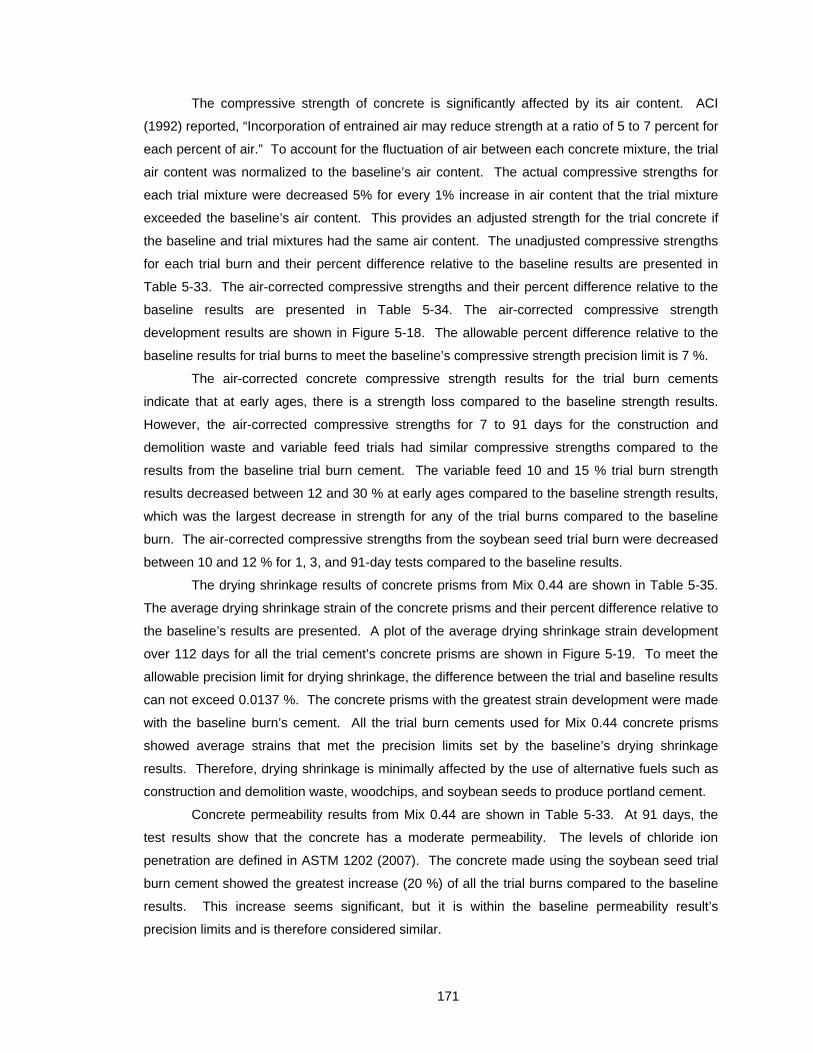
171
The compressive strength of concrete is significantly affected by its air content. ACI
(1992) reported, “Incorporation of entrained air may reduce strength at a ratio of 5 to 7 percent for
each percent of air.” To account for the fluctuation of air between each concrete mixture, the trial
air content was normalized to the baseline’s air content. The actual compressive strengths for
each trial mixture were decreased 5% for every 1% increase in air content that the trial mixture
exceeded the baseline’s air content. This provides an adjusted strength for the trial concrete if
the baseline and trial mixtures had the same air content. The unadjusted compressive strengths
for each trial burn and their percent difference relative to the baseline results are presented in
Table 5-33. The air-corrected compressive strengths and their percent difference relative to the
baseline results are presented in Table 5-34. The air-corrected compressive strength
development results are shown in Figure 5-18. The allowable percent difference relative to the
baseline results for trial burns to meet the baseline’s compressive strength precision limit is 7 %.
The air-corrected concrete compressive strength results for the trial burn cements
indicate that at early ages, there is a strength loss compared to the baseline strength results.
However, the air-corrected compressive strengths for 7 to 91 days for the construction and
demolition waste and variable feed trials had similar compressive strengths compared to the
results from the baseline trial burn cement. The variable feed 10 and 15 % trial burn strength
results decreased between 12 and 30 % at early ages compared to the baseline strength results,
which was the largest decrease in strength for any of the trial burns compared to the baseline
burn. The air-corrected compressive strengths from the soybean seed trial burn were decreased
between 10 and 12 % for 1, 3, and 91-day tests compared to the baseline results.
The drying shrinkage results of concrete prisms from Mix 0.44 are shown in Table 5-35.
The average drying shrinkage strain of the concrete prisms and their percent difference relative to
the baseline’s results are presented. A plot of the average drying shrinkage strain development
over 112 days for all the trial cement’s concrete prisms are shown in Figure 5-19. To meet the
allowable precision limit for drying shrinkage, the difference between the trial and baseline results
can not exceed 0.0137 %. The concrete prisms with the greatest strain development were made
with the baseline burn’s cement. All the trial burn cements used for Mix 0.44 concrete prisms
showed average strains that met the precision limits set by the baseline’s drying shrinkage
results. Therefore, drying shrinkage is minimally affected by the use of alternative fuels such as
construction and demolition waste, woodchips, and soybean seeds to produce portland cement.
Concrete permeability results from Mix 0.44 are shown in Table 5-33. At 91 days, the
test results show that the concrete has a moderate permeability. The levels of chloride ion
penetration are defined in ASTM 1202 (2007). The concrete made using the soybean seed trial
burn cement showed the greatest increase (20 %) of all the trial burns compared to the baseline
results. This increase seems significant, but it is within the baseline permeability result’s
precision limits and is therefore considered similar.
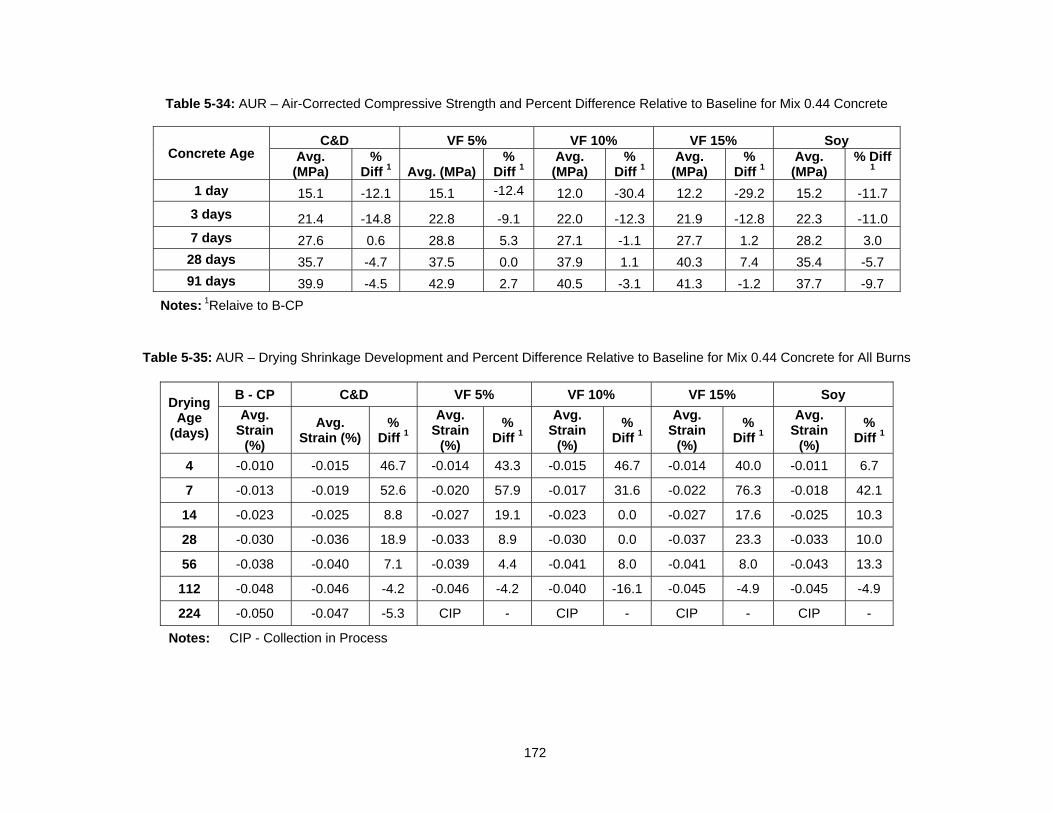
172
Table 5-34: AUR – Air-Corrected Compressive Strength and Percent Difference Relative to Baseline for Mix 0.44 Concrete
Concrete Age C&D VF 5% VF 10% VF 15% Soy
Avg. (MPa)
% Diff 1 Avg. (MPa)
% Diff 1
Avg. (MPa)
% Diff 1
Avg. (MPa)
% Diff 1
Avg. (MPa)
% Diff 1
1 day 15.1 -12.1 15.1 -12.4 12.0 -30.4 12.2 -29.2 15.2 -11.7
3 days 21.4 -14.8 22.8 -9.1 22.0 -12.3 21.9 -12.8 22.3 -11.0
7 days 27.6 0.6 28.8 5.3 27.1 -1.1 27.7 1.2 28.2 3.0
28 days 35.7 -4.7 37.5 0.0 37.9 1.1 40.3 7.4 35.4 -5.7
91 days 39.9 -4.5 42.9 2.7 40.5 -3.1 41.3 -1.2 37.7 -9.7
Notes: 1Relaive to B-CP
Table 5-35: AUR – Drying Shrinkage Development and Percent Difference Relative to Baseline for Mix 0.44 Concrete for All Burns
Drying Age
(days)
B - CP C&D VF 5% VF 10% VF 15% Soy
Avg. Strain
(%)
Avg. Strain (%)
% Diff 1
Avg. Strain
(%)
% Diff 1
Avg. Strain
(%)
% Diff 1
Avg. Strain
(%)
% Diff 1
Avg. Strain
(%)
% Diff 1
4 -0.010 -0.015 46.7 -0.014 43.3 -0.015 46.7 -0.014 40.0 -0.011 6.7
7 -0.013 -0.019 52.6 -0.020 57.9 -0.017 31.6 -0.022 76.3 -0.018 42.1
14 -0.023 -0.025 8.8 -0.027 19.1 -0.023 0.0 -0.027 17.6 -0.025 10.3
28 -0.030 -0.036 18.9 -0.033 8.9 -0.030 0.0 -0.037 23.3 -0.033 10.0
56 -0.038 -0.040 7.1 -0.039 4.4 -0.041 8.0 -0.041 8.0 -0.043 13.3
112 -0.048 -0.046 -4.2 -0.046 -4.2 -0.040 -16.1 -0.045 -4.9 -0.045 -4.9
224 -0.050 -0.047 -5.3 CIP - CIP - CIP - CIP -
Notes: CIP - Collection in Process
173
Figure 5-18: AUR – Air-Corrected Compressive Strengths for Mix 0.44 for All Burns
0
10
20
30
40
50
0 28 56 84 112
Concrete Age (days)
Com
pre
ssiv
e S
tren
gth
(M
Pa)
B-CP
C&D
VF (5%)
VF (10%)
VF (15%)
Soy
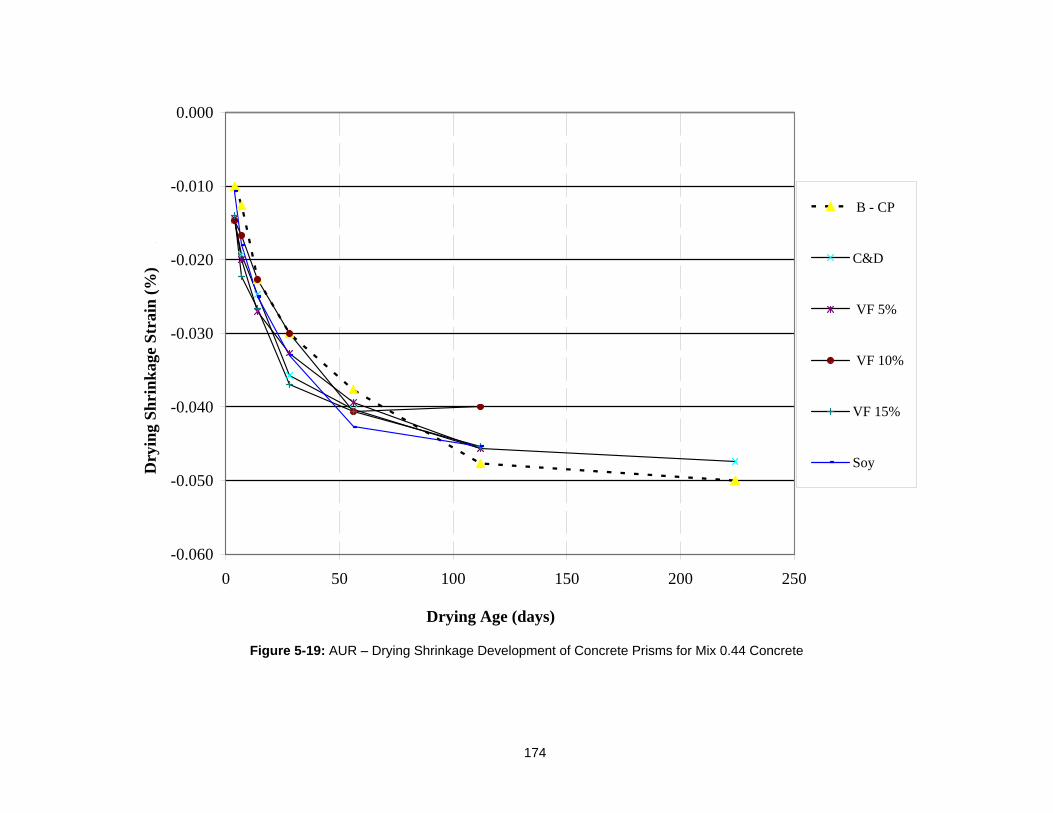
174
Figure 5-19: AUR – Drying Shrinkage Development of Concrete Prisms for Mix 0.44 Concrete
-0.060
-0.050
-0.040
-0.030
-0.020
-0.010
0.000
0 50 100 150 200 250
Drying Age (days)
Dry
ing
Sh
rin
kag
e S
trai
n (
%)
.
B - CP
C&D
VF 5%
VF 10%
VF 15%
Soy
175
5.4.8.2 Concrete Mix 0.37
All physical concrete properties were determined by Auburn University. Concrete Mix 0.37 was a
high-strength mixture possessing a water-cement ratio of 0.37. The average results and percent
difference of each trial burn relative to the baseline results from Mix 0.37 are shown in Table 5-
36. A graphical representation of the fresh property results relative to the baseline is shown in
Figure 5-20.
This is a high-performance concrete, and its fresh properties are highly dependent on the
functionality of chemical admixtures. Therefore, the results are more variable for the mixture than
Mix 0.44.
Due to the volume of concrete required to conduct the necessary tests and the volume
limitations of available mixing equipment, each mixture was divided roughly in half to ensure
adequate blending of all materials. The air content, slump, and unit weight shown in Table 5-36
are the average of two batches of concrete mixed for each trial. All single lab precision
requirements were met between the individual batches prepared for each trial.
The air content for Mix 0.37 decreased significantly over all trials and are outside the
allowable precision limits for the baseline concrete. Interactions between the high-range water-
reducing admixture and the cement and/or the air-entraining admixture used in each 0.37
concrete mixture could be the cause for the fluctuation in air content. The target air content for
each mix was 4.0 %. The trial mixture made with the construction and demolition waste trial burn
cement was 0.2 % outside the baseline’s allowable precision limit of 0.8 % and was the only trial
mixture to fall outside the precision limits.
The Mix 0.37 trial mixtures failed to meet slump precision requirements when compared
to the baseline. The slump test results showed a significant decrease in slump for all trial burn
mixtures. The low air content for each trial mixture is one of the possible causes for the low
slump in each trial. If the precision statement for concrete slump is converted into an allowable
percentage relative to the baseline, the limiting value is ± 42.6%. From Figure 5-20, VF 5 %
shows the largest decrease in slump relative to the baseline. This concrete mixture was repeated
in order to rule out possible human error that may have occurred during the initial mixture. The
results from the repeated concrete tests were within precision limits when compared to all the
original results obtained.
The unit weight results of the variable feed trials and the soy trial slightly exceeded the
allowable limits to be deemed similar to the baseline. The small percent differences relative to
the baseline for all the trial mixtures unit weight are presented in Figure 5-20. The increase in
unit weight can be attributed to the lower air contents of the trial mixtures relative to the baseline
mixture.
176
Many factors including temperature, water-cement ratio, cement chemistry, and
admixtures control setting (Odler 1998). The concrete produced from the variable feed 5 % trial
burn cement was the only trial concrete that met the setting precision limits when compared to the
baseline setting results. From Figure 5-20, it can be seen that the setting times for concrete
made with the construction and demolition waste, variable feed 15 %, and soybean seed trial
burn cement’s were reduced compared to the baseline setting results. The concrete produced
from the variable feed 10 % trial burn cement significantly increased for initial and final setting
times compared to the baseline burn setting results.
The air-corrected compressive strengths were calculated in the same manner as
described for Mix 0.44. The unadjusted compressive strengths for each trial burn and their
percent difference relative to the baseline results are presented in Table 5-36. The air-corrected
compressive strengths and their percent difference relative to the baseline results are presented
in Table 5-37. The air-corrected compressive strength development data for Mix 0.37 are shown
in Figure 5-21. The allowable percent difference relative to the baseline results for trial burns to
meet the baseline’s compressive strength precision limit is 7 %.
The compressive strengths from the concrete prepared with the construction and
demolition waste burn cement was the most comparable to the baseline. One-day compressive
strength results from concrete made using cement from the variable feed 10 and 15 % trial burns
showed reductions of 20 and 18 %, respectively, compared to the baseline compressive strength
results. Seven to 91-day day compressive strength results from concrete made using cement
from the variable feed 5 and 15 % and the soybean seed trial burns increased 8 to 20 %
compared to the baseline results. The late-age compressive strength results from the variable
feed 10 % trial burn are similar to the baseline strength results. Compressive strength results
from concrete made using cement produced during the soybean trial burn exhibited slightly higher
strengths over the majority of testing ages compared to the baseline.
Drying shrinkage results of concrete prisms from Mix 0.37 are shown in Table 5-38. The
average drying shrinkage strain of the concrete prisms and their percent difference relative to the
baseline’s results are presented. A plot of the average drying shrinkage strain development over
112 days for all the trial cement’s concrete prisms are shown in Figure 5-22. To meet the
allowable precision limit for drying shrinkage, the difference between the trial and baseline results
cannot exceed 0.0137 %. The concrete prisms with the greatest drying shrinkage strain
development were made with the baseline burn’s cement. The concrete prisms made with the
soybean seed trial burn cement fell below the allowable precision limit for the 112-day test. All
the other the trial burn cements used for Mix 0.37 concrete prisms showed average strains that
met the precision limits set by the baseline’s drying shrinkage results. Therefore, overall drying
shrinkage is minimally affected by the utilization of alternative fuel cements.

177
Concrete permeability results from Mix 0.37 are shown in Table 5-35. At 91 days, the
test results show that the concrete has a low permeability. The levels of chloride ion penetration
are defined in ASTM 1202 (2007). The concrete made using the soybean seed trial burn cement
showed the greatest increase (19 %) of all the trial burns compared to the baseline results. The
concrete permeability that was made from the soybean seed cement is within the baseline
permeability result’s precision limit and is therefore considered similar.
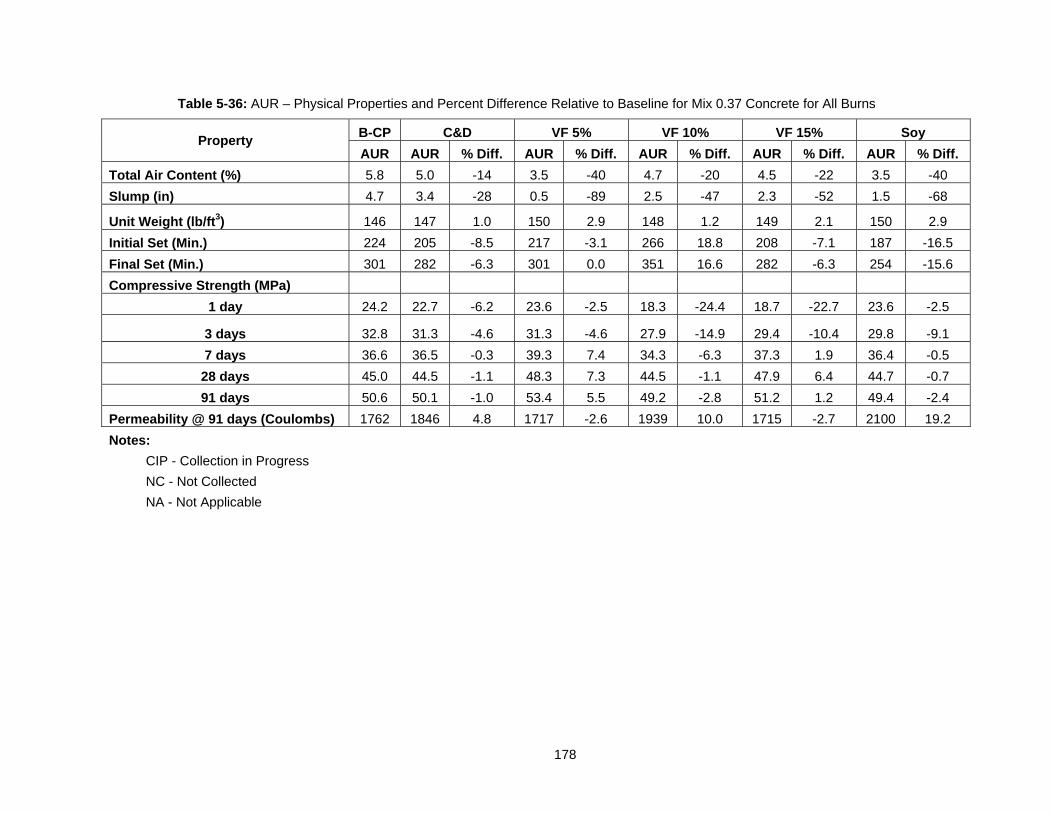
178
Table 5-36: AUR – Physical Properties and Percent Difference Relative to Baseline for Mix 0.37 Concrete for All Burns
Property B-CP C&D VF 5% VF 10% VF 15% Soy
AUR AUR % Diff. AUR % Diff. AUR % Diff. AUR % Diff. AUR % Diff.
Total Air Content (%) 5.8 5.0 -14 3.5 -40 4.7 -20 4.5 -22 3.5 -40
Slump (in) 4.7 3.4 -28 0.5 -89 2.5 -47 2.3 -52 1.5 -68
Unit Weight (lb/ft3) 146 147 1.0 150 2.9 148 1.2 149 2.1 150 2.9
Initial Set (Min.) 224 205 -8.5 217 -3.1 266 18.8 208 -7.1 187 -16.5
Final Set (Min.) 301 282 -6.3 301 0.0 351 16.6 282 -6.3 254 -15.6
Compressive Strength (MPa)
1 day 24.2 22.7 -6.2 23.6 -2.5 18.3 -24.4 18.7 -22.7 23.6 -2.5
3 days 32.8 31.3 -4.6 31.3 -4.6 27.9 -14.9 29.4 -10.4 29.8 -9.1
7 days 36.6 36.5 -0.3 39.3 7.4 34.3 -6.3 37.3 1.9 36.4 -0.5
28 days 45.0 44.5 -1.1 48.3 7.3 44.5 -1.1 47.9 6.4 44.7 -0.7
91 days 50.6 50.1 -1.0 53.4 5.5 49.2 -2.8 51.2 1.2 49.4 -2.4
Permeability @ 91 days (Coulombs) 1762 1846 4.8 1717 -2.6 1939 10.0 1715 -2.7 2100 19.2
Notes:
CIP - Collection in Progress
NC - Not Collected
NA - Not Applicable
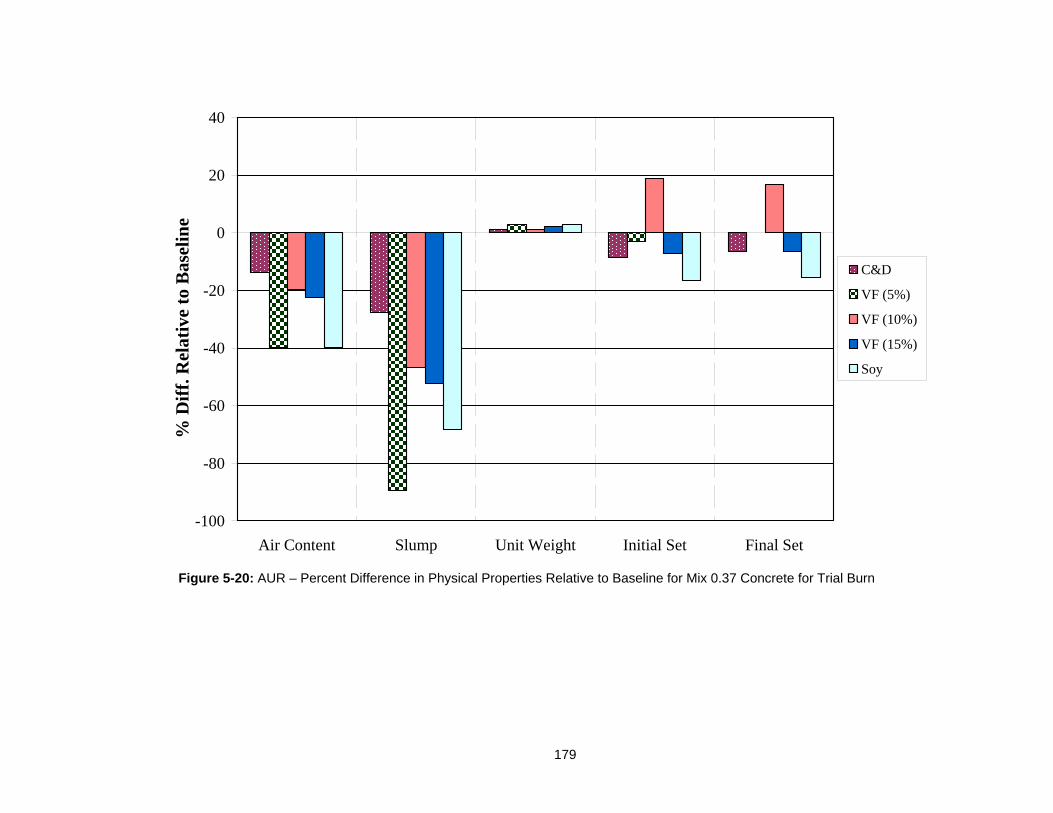
179
Figure 5-20: AUR – Percent Difference in Physical Properties Relative to Baseline for Mix 0.37 Concrete for Trial Burn
-100
-80
-60
-40
-20
0
20
40
Air Content Slump Unit Weight Initial Set Final Set
% D
iff.
Rel
ativ
e to
Bas
elin
e
C&D
VF (5%)
VF (10%)
VF (15%)
Soy
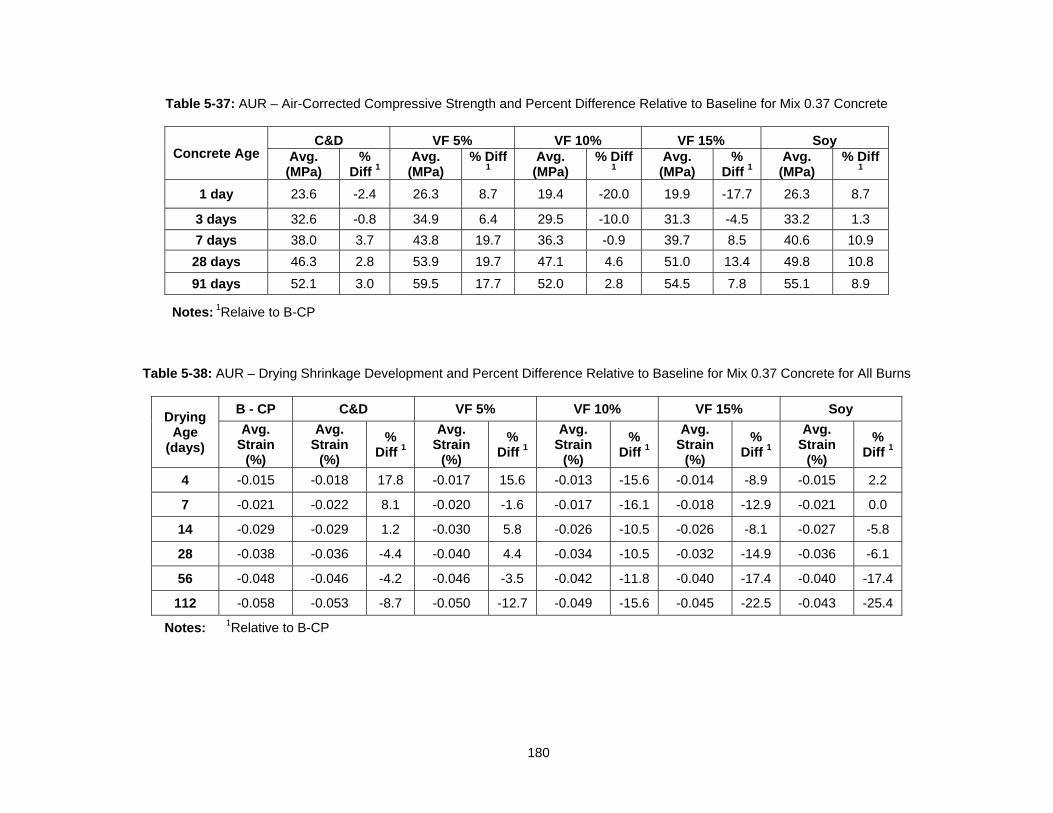
180
Table 5-37: AUR – Air-Corrected Compressive Strength and Percent Difference Relative to Baseline for Mix 0.37 Concrete
Concrete Age C&D VF 5% VF 10% VF 15% Soy
Avg. (MPa)
% Diff 1
Avg. (MPa)
% Diff 1
Avg. (MPa)
% Diff 1
Avg. (MPa)
% Diff 1
Avg. (MPa)
% Diff 1
1 day 23.6 -2.4 26.3 8.7 19.4 -20.0 19.9 -17.7 26.3 8.7
3 days 32.6 -0.8 34.9 6.4 29.5 -10.0 31.3 -4.5 33.2 1.3
7 days 38.0 3.7 43.8 19.7 36.3 -0.9 39.7 8.5 40.6 10.9
28 days 46.3 2.8 53.9 19.7 47.1 4.6 51.0 13.4 49.8 10.8
91 days 52.1 3.0 59.5 17.7 52.0 2.8 54.5 7.8 55.1 8.9
Notes: 1Relaive to B-CP
Table 5-38: AUR – Drying Shrinkage Development and Percent Difference Relative to Baseline for Mix 0.37 Concrete for All Burns
Drying Age
(days)
B - CP C&D VF 5% VF 10% VF 15% Soy
Avg. Strain
(%)
Avg. Strain
(%)
% Diff 1
Avg. Strain
(%)
% Diff 1
Avg. Strain
(%)
% Diff 1
Avg. Strain
(%)
% Diff 1
Avg. Strain
(%)
% Diff 1
4 -0.015 -0.018 17.8 -0.017 15.6 -0.013 -15.6 -0.014 -8.9 -0.015 2.2
7 -0.021 -0.022 8.1 -0.020 -1.6 -0.017 -16.1 -0.018 -12.9 -0.021 0.0
14 -0.029 -0.029 1.2 -0.030 5.8 -0.026 -10.5 -0.026 -8.1 -0.027 -5.8
28 -0.038 -0.036 -4.4 -0.040 4.4 -0.034 -10.5 -0.032 -14.9 -0.036 -6.1
56 -0.048 -0.046 -4.2 -0.046 -3.5 -0.042 -11.8 -0.040 -17.4 -0.040 -17.4
112 -0.058 -0.053 -8.7 -0.050 -12.7 -0.049 -15.6 -0.045 -22.5 -0.043 -25.4
Notes: 1Relative to B-CP
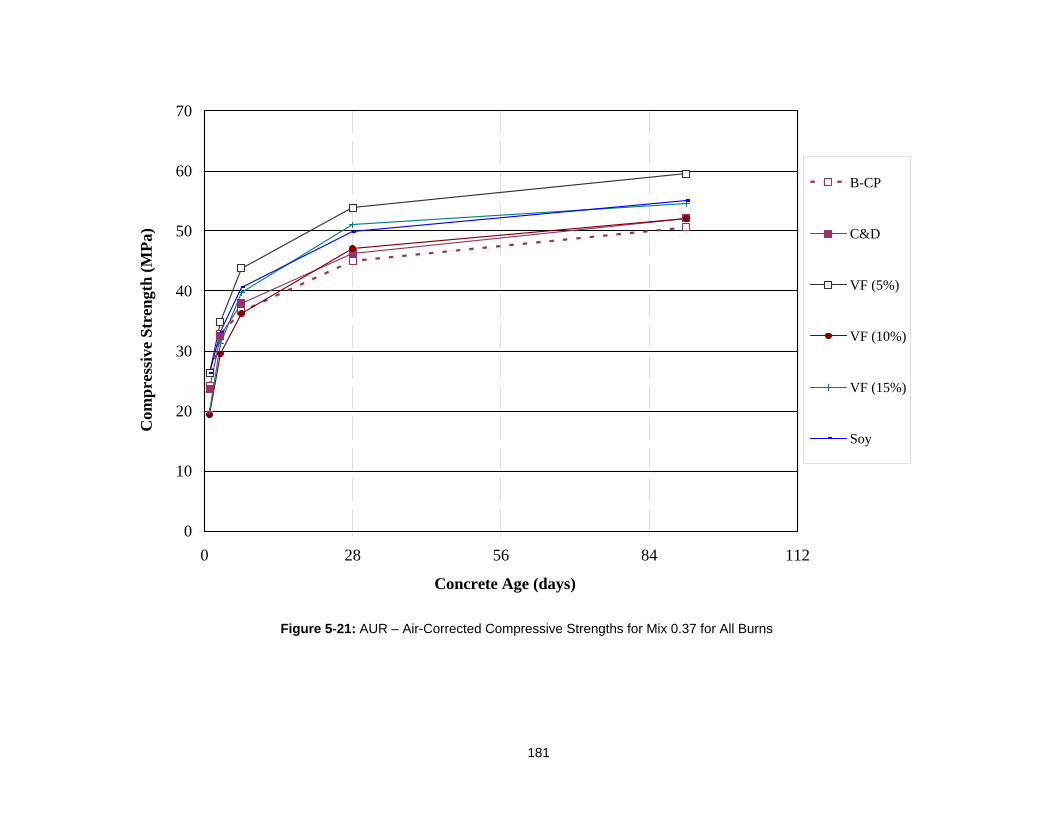
181
Figure 5-21: AUR – Air-Corrected Compressive Strengths for Mix 0.37 for All Burns
0
10
20
30
40
50
60
70
0 28 56 84 112
Concrete Age (days)
Com
pre
ssiv
e S
tren
gth
(M
Pa)
B-CP
C&D
VF (5%)
VF (10%)
VF (15%)
Soy

182
Figure 5-22: AUR – Drying Shrinkage Development of Concrete Prisms for Mix 0.37 Concrete
-0.060
-0.050
-0.040
-0.030
-0.020
-0.010
0.000
0 50 100 150 200 250
Drying Age (days)
Dry
ing
Sh
rin
kag
e S
trai
n (
%)
.
B - CP
C&D
VF 5%
VF 10%
VF 15%
Soy
183
5.4.9 Comparison of Paste, Mortar, and Concrete Properties
The properties of paste, mortar, and concrete that were made with the cement of each trial burn
are compared in this section. A brief review of the test results is presented followed by a
discussion of any trends that are consistent between the paste, mortar, and concrete results.
The physical changes observed from the cement and concrete testing are presented in
Tables 5-39 through 5-43. The number of tests conducted for a particular property as well as the
medium of the observed effect (paste, mortar, or concrete) are presented in order to add
perspective to the observed effects. Each arrow indicates a significant change in an individual
test compared to the baseline’s results. A trial test result is considered significantly different from
the baseline result if the trial’s result falls outside the baseline’s allowable range of values. These
values are specified by the test’s ASTM precision statement. The results that are not significantly
different are not reported unless all the test results for a particular property show similarities to the
baseline result.
The physical properties of the paste, mortar, and concrete made with the construction
and demolition waste trial burn cement are presented in Table 5-39. The concrete setting time
and mortar cube flow are the only properties that did not show similarities to the baseline’s
results. Both mortar setting results for initial and final setting tests were comparable to the
baseline’s results. The chemical admixtures used in each concrete mixture could have caused
the fluctuations observed in the setting times.
The physical properties of the paste, mortar, and concrete made with the variable feed 5
% trial burn cement are presented in Table 5-40. The decreased slump and increased unit
weight compared to the baseline could be caused by the decrease in air content observed in the
Mix 0.37 concrete mixture. Since the mortar setting times were comparable to the baseline’s
results, the concrete’s chemical admixtures could be the cause of the concrete’s retarded setting
times. Two concrete 28-day strength results showed strength increases compared to the
baseline’s results. Both the mortar cube 28-day strength results were comparable to the
baseline’s results.
The physical properties of the paste, mortar, and concrete made with the variable feed 10
% trial burn cement are presented in Table 5-41. The air content tests did not produce any trends
that were consistent over the mortar and concrete testing. The concrete setting and 28-day
strengths showed increases in two tests. Since increases in the mortar setting and 28-day
strength tests did not show increases, the increases seen in the concrete tests could have been
caused by admixture-cement interactions.
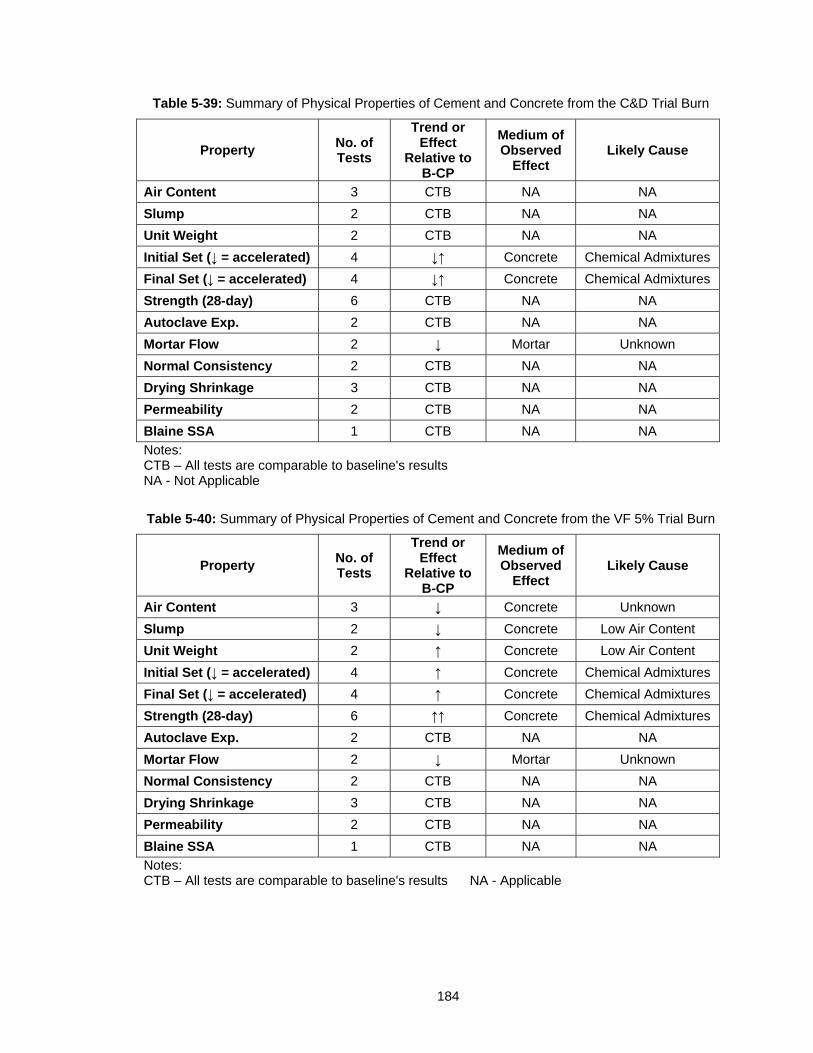
184
Table 5-39: Summary of Physical Properties of Cement and Concrete from the C&D Trial Burn
Property No. of Tests
Trend or Effect
Relative to B-CP
Medium of Observed
Effect Likely Cause
Air Content 3 CTB NA NA
Slump 2 CTB NA NA
Unit Weight 2 CTB NA NA
Initial Set (↓ = accelerated) 4 ↓↑ Concrete Chemical Admixtures
Final Set (↓ = accelerated) 4 ↓↑ Concrete Chemical Admixtures
Strength (28-day) 6 CTB NA NA
Autoclave Exp. 2 CTB NA NA
Mortar Flow 2 ↓ Mortar Unknown
Normal Consistency 2 CTB NA NA
Drying Shrinkage 3 CTB NA NA
Permeability 2 CTB NA NA
Blaine SSA 1 CTB NA NA
Notes: CTB – All tests are comparable to baseline's results NA - Not Applicable
Table 5-40: Summary of Physical Properties of Cement and Concrete from the VF 5% Trial Burn
Property No. of Tests
Trend or Effect
Relative to B-CP
Medium of Observed
Effect Likely Cause
Air Content 3 ↓ Concrete Unknown
Slump 2 ↓ Concrete Low Air Content
Unit Weight 2 ↑ Concrete Low Air Content
Initial Set (↓ = accelerated) 4 ↑ Concrete Chemical Admixtures
Final Set (↓ = accelerated) 4 ↑ Concrete Chemical Admixtures
Strength (28-day) 6 ↑↑ Concrete Chemical Admixtures
Autoclave Exp. 2 CTB NA NA
Mortar Flow 2 ↓ Mortar Unknown
Normal Consistency 2 CTB NA NA
Drying Shrinkage 3 CTB NA NA
Permeability 2 CTB NA NA
Blaine SSA 1 CTB NA NA
Notes: CTB – All tests are comparable to baseline's results NA - Applicable
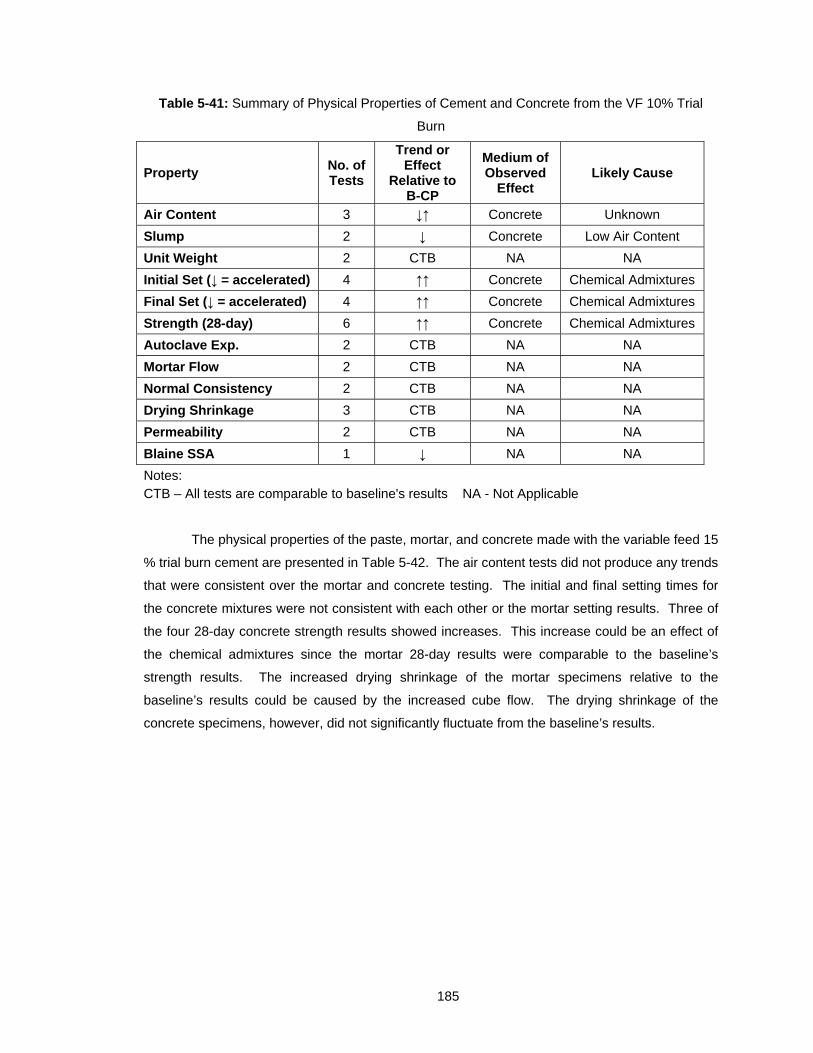
185
Table 5-41: Summary of Physical Properties of Cement and Concrete from the VF 10% Trial
Burn
Property No. of Tests
Trend or Effect
Relative to B-CP
Medium of Observed
Effect Likely Cause
Air Content 3 ↓↑ Concrete Unknown
Slump 2 ↓ Concrete Low Air Content
Unit Weight 2 CTB NA NA
Initial Set (↓ = accelerated) 4 ↑↑ Concrete Chemical Admixtures
Final Set (↓ = accelerated) 4 ↑↑ Concrete Chemical Admixtures
Strength (28-day) 6 ↑↑ Concrete Chemical Admixtures
Autoclave Exp. 2 CTB NA NA
Mortar Flow 2 CTB NA NA
Normal Consistency 2 CTB NA NA
Drying Shrinkage 3 CTB NA NA
Permeability 2 CTB NA NA
Blaine SSA 1 ↓ NA NA
Notes: CTB – All tests are comparable to baseline's results NA - Not Applicable
The physical properties of the paste, mortar, and concrete made with the variable feed 15
% trial burn cement are presented in Table 5-42. The air content tests did not produce any trends
that were consistent over the mortar and concrete testing. The initial and final setting times for
the concrete mixtures were not consistent with each other or the mortar setting results. Three of
the four 28-day concrete strength results showed increases. This increase could be an effect of
the chemical admixtures since the mortar 28-day results were comparable to the baseline’s
strength results. The increased drying shrinkage of the mortar specimens relative to the
baseline’s results could be caused by the increased cube flow. The drying shrinkage of the
concrete specimens, however, did not significantly fluctuate from the baseline’s results.

186
Table 5-42: Summary of Physical Properties of Cement and Concrete from the VF 15% Trial
Burn
Property No. of Tests
Trend or Effect Relative to B-
CP
Medium of Observed
Effect Likely Cause
Air Content 3 ↓ Concrete Unknown
Slump 2 ↓ Concrete Low Air Content
Unit Weight 2 ↑ Concrete Low Air Content
Initial Set (↓ = accelerated)
4 ↓↑ Concrete Chemical Admixtures
Final Set (↓ = accelerated) 4 ↓↑ Concrete Chemical Admixtures
Strength (28-day) 6 ↑↑↑ Concrete Chemical Admixtures
Autoclave Exp. 2 CTB NA NA
Mortar Flow 2 ↑ Mortar Unknown
Normal Consistency 2 CTB NA NA
Drying Shrinkage 3 ↑ Mortar Increased Cube Flow
Permeability 2 CTB NA NA
Blaine SSA 1 CTB NA NA
Notes: CTB – All tests are comparable to baseline's results NA - Not Applicable
The physical properties of the paste, mortar, and concrete made with the soybean seed
trial burn cement are presented in Table 5-43. The decrease air content observed in the Mix 0.37
concrete mixture could be the cause of the observed decrease slump and increase in unit weight.
There were no defined trends that were observed in the mortar or concrete setting times. One of
the two mortar setting tests showed acceleration compared to the baseline’s mortar setting
results. Both the final mortar setting time tests, however, were comparable to the baseline’s
mortar setting results. The 28-day mortar and concrete strength results were comparable to the
baseline’s strength results for 5 of 6 tests. The mortar cube flow was increased in one of two
tests. The mortar drying shrinkage, however, was not affected by the increased cube flow.

187
Table 5-43: Summary of Physical Properties of Cement and Concrete from the Soy Trial Burn
Property No. of Tests
Trend or Effect Relative to B-
CP
Medium of Observed
Effect Likely Cause
Air Content 3 ↓ Concrete Unknown Slump 2 ↓ Concrete Low Air Content Unit Weight 2 ↑ Concrete Low Air Content Initial Set (↓ = accelerated)
4 ↓ ↑↑ Paste and Concrete
Chemical Admixtures
Final Set (↓ = accelerated) 4 ↓↑ Concrete Chemical Admixtures Strength (28-day) 6 ↑ Concrete Chemical Admixtures Autoclave Exp. 2 CTB NA NA Mortar Flow 2 ↑ Mortar Unknown Normal Consistency 2 CTB NA NA Drying Shrinkage 3 CTB NA NA Permeability 2 CTB NA NA Blaine SSA 1 CTB NA NA Notes: CTB – All tests are comparable to baseline's results NA - Not Applicable
5.4.9.1 Workability
The cement plant and Auburn University conducted several tests to determine the workability of
each trial cement. The cement plant and Auburn University determined each trial cement’s
normal consistency and mortar flow. Auburn University also measured the slump of each
concrete mixture made with the trial cements.
The results from the cement plant and Auburn University showed that all trial burn
cement’s normal consistency were similar to the baseline cement’s results. The cement plant’s
results for mortar flow showed increases with the mortar made from the variable feed 15 % and
soybean seed trial burn cements. Auburn University’s mortar flow test results did not indicate
increases for the variable feed 15 % and soybean seed trial burn cements. Auburn University
found mortar flow decreases of 12 and 27 % with mortar made with the construction and
demolition waste and variable feed 5 % trial burn cements, respectively. The concrete slumps
measured for all Mix 0.44 trial mixtures were similar to the baseline’s slump results. The concrete
Mix 0.37 slumps made from the variable feed and soybean seed trial burn cements showed
decreases between 47 and 89 %, respectively, compared to the baseline’s slump results. The air
contents of the Mix 0.37 concrete mixtures were significantly decreased compared to the
baseline. The reduced air contents in the trial mixtures are thought to have reduced the slump of
the Mix 0.37 concrete. There were no consistent trends in the tests defining workability that were
found in the paste, mortar and concrete results. Therefore, the workability of paste, mortar and
concrete are minimally affected by the use of the trial burn cements.
188
5.4.9.2 Setting
The cement plant and Auburn University conducted paste setting tests on all the cements
produced during the trial burns. Auburn University also tested Mix 0.44 and Mix 0.37 concrete
setting times that were made with the trial burn cements. The Vicat paste setting tests were
conducted using ASTM C 191, and the concrete setting tests were conducted using ASTM C 403.
Both the cement plant and Auburn University results showed that the Vicat paste setting
times for all the trial cements were similar to the baseline’s paste setting results. The Mix 0.44
concrete setting results showed 10 to 39 % retardation compared to the baseline results for the
concretes made with the variable feed trial burn cements. The Mix 0.37 concrete setting results
made with the variable feed 10 and 15 % trial burn cements showed retardation and slight
acceleration compared to the baseline burn’s concrete setting results, respectively. The setting
times for the Mix 0.37 concrete made with the construction and demolition waste and soybean
seed trial burn cements were accelerated compared to the baseline’s results.
The aluminate content of the construction and demolition waste and the variable feed 10
% trial burn cements increased 33 and 24 %, respectively, compared to the baseline’s aluminate
content. However, the Vicat paste setting times for the construction and demolition waste and
variable feed 10 % trial burns did not seem to be affected by the aluminate increase and were
similar to the baseline’s results. The behavior of the concrete setting times are also not fully
described by the aluminate content found in the trial burn cements. Other factors such as
admixture-cement interaction, temperature, and the water-cement ratio can influence concrete
setting times. There were no consistent trends that appeared in both the paste and concrete
setting results. Since all the trial paste setting tests were similar to the baseline’s paste setting
results and the paste setting results were not influenced by the addition of admixtures, the effects
of the trial fuel cements had minimal impact on setting results.
5.4.9.3 Strength
The cement plant and Auburn University conducted compressive strength tests on mortar cube
specimens in order to determine the strength properties of the trial burn cements. Auburn
University tested the compressive strength development of the concrete made with cement
produced during the trial burns.
One-day compressive strength values for Mix 0.44 for the variable feed 15 % trial burn
cements was reduced by 29, compared to the baseline’s cement result. Since the mortar cube
results made with the variable feed 15 % cement did not show 1-day reductions in strength, no
trend could be established. Concrete Mix 0.37 compressive strengths made from variable feed
10 and 15 % trial cements showed reductions of 20 and 17 % in strength compared to the
baseline’s results for tests, respectively. Here again, the mortar cubes made from variable feed
189
10 and 15 % trial burn cement did not show 1-day reductions in strength and therefore trends
cannot be established.
The cement plant and Auburn University found that the 28-day mortar cube compressive
strength results were similar to the baseline’s results at this age. Twenty-eight-day Mix 0.44
concrete compressive strengths made with all the trial burn cements were similar to the
baseline’s 28-day compressive strength. Mix 0.37 concrete compressive strengths made with
variable feed 5 and 15 % and soybean seed trial burn cements showed increases in strength
between 10 and 20 % compared to the baseline’s results for 28-day tests. The strength
differences between the concrete and mortar results could be influenced by admixture-cement
interactions and differences in air content. Since chemical admixtures were not used in the
mortar specimens, their strength results are more representative of the trial cement’s strength
attributes than the concrete strength results. Given that the majority of trial mortar cube
compressive strengths were similar to the baseline’s results, the effect that the trial fuels had on
the cement is concluded to be minimal.
In an earlier phase of this project woodchips were used as an alternative fuel and co-fired
with coal and tires. The mortar cube strengths from the earlier trial and the cubes made with the
variable feed 10 % trial burn cement all fell within 12 % of each other. The 28-day strength
difference between the two trial’s mortar cube strength was 5 %. The Mix 0.44 concrete
compressive strengths made from the previous woodchip trial burn and the variable feed 10 %
trial burn were also compared. The 1- and 28-day strengths showed a 16 % and 7 % difference,
respectively. The 1-day strength showed the largest difference in strengths over all the testing
dates.
5.4.9.4 Drying Shrinkage
Mortar and concrete specimens were prepare with the cement produced during the trial burns in
order to measure the drying shrinkage characteristics of the cement. The mortar specimens that
were made with the cement produced in the variable feed 15 % trial burn showed the largest
drying shrinkage strains compared to the baseline’s strains. The remaining trial cements
produced mortar strains that were similar to the baseline results. The concrete specimens that
were made with the variable feed 15 % trial burn cement were similar to the baseline’s concrete
strains for both Mix 0.44 and 0.37. There were no consistent trends for drying shrinkage that
were found in both the mortar and concrete testing results. Therefore, mortar and concrete
drying shrinkage are minimally affected by the trial burn cements.
190
5.4.9.5 Permeability
Rapid chloride ion penetration tests were performed to obtain a measure of the concrete’s
permeability of the specimens made with the cement produced during the trial burns. Mix 0.44
produced moderate permeability concrete at 91-days of curing with each trial cement tested. Mix
0.37 produced low permeability concrete at 91-days of curing with each trial cement tested. A
lower permeability was expected from Mix 0.37 because it was a lower water-cement ratio
concrete than Mix 0.44. The fluctuation between trial cement and the baseline cement specimen
results were minimal for Mix 0.44 and 0.37 permeability tests. The permeability of the concrete
specimens tests do not appear to be affected by the trial burn cements.
5.4.10 Plant Emissions
Pollutants emitted from cement manufacturing facilities during production have raised
environmental concerns about the sustainability of the cement manufacturing process. Emissions
during this study were closely monitored by a Continuous Emission Monitoring System (CEMS)
that recorded data in five-minute intervals. The emissions of the cement plant used are regulated
by emission limits set by the Alabama Department of Environment Management (ADEM).
Emission data from the cement plant were reported in tons of emissions per hour.
Auburn University normalized the emission data to account for variations in production rate of
clinker. Therefore, the emission data are presented in tons per ton of clinker. Results are
presented in Table 5-44. The percent differences between the emissions from trial burns and the
emissions from the baseline burn are shown in Figure 5-23.
Similar to the clinker data, the emission results were statistically analyzed using the
Wilcoxon rank-sum test. If the Wilcoxon test showed a difference between the trial and baseline
means, the percent difference relative to the baseline’s result establishes the degree of
difference. If the statistical analysis does not show a difference between the baseline and trial
means, the percent difference is not meaningful.
The p-values calculated for the nitrogen oxides showed that all the trial burns except for
the soybean seed trial burn have significantly different means compared to the baseline’s NOx
mean. The nitrogen emissions were reduced for the construction and demolition waste and the
variable feed burns compared to the baseline burn.
Thermal nitrogen oxides constitute around 70% of the the total NOx emissions and are
created when atmospheric nitrogen begins to oxidize (Hendrik and Padovani 2003). Thermal
NOx is controlled by the amount of available oxygen during the pyroprocess (Greer et al. 2004).
The type of alternative fuels utilized has not been shown to alter the overall nitrogen oxide
191
emission. The decrease in NOx, therefore cannot be attributed to any of the trial fuels due to not
knowing the oxygen levels in the kiln during each burn.
The p-values calculated for sulfur dioxide show that all the burn means are significantly
different compared to the baseline mean. As shown in Figure 5-23, the SO2 emission levels for
the construction and demolition waste and soybean seed trials increased compared to the
baseline SO2 level. Conversely, the SO2 emission levels decreased for the variable feed 5 and
10 % woodchip trial burns. Sulfur dioxides are formed from raw materials and fuels (Hendrik and
Padovani 2003). The concentrations of sulfur within the alternative fuels are small compared to
the traditional fuels and the raw materials. Therefore, the trial alternative fuels seem to have little
effect on the SO2 emissions. In the previous woodchip trial, the SO2 level fell between the
variable feed 5 and 10 % trial burn SO2 values. This is notable because the woodchip
replacement rate during the previous woodchip trial was 7 %. The kiln feed for the construction
and demolition waste trial burn had a 43% increase in sulfur relative to the baseline. The coal
used for the construction and demolition waste trial burn also had a 38 % increase in sulfur. The
kiln feed and coal sulfur contents were also elevated for the soybean seed trial burn. The
increase in sulfur content in the kiln feed and coal could be the cause of the elevated SO2 content
shown in Figure 5-23 for the construction and demolition waste and soybean seed trial burns.
The sulfur content in the kiln feed and coal was slightly elevated and decreased, respectively for
the variable feed trial burns.
The p-values calculated for the volatile organic compounds (VOC) show that all the burn
means are significantly different. The percent difference relative to the baseline of the volatile
organic compound emissions for all the trial burns are shown in Figure 5-23. The volatile organic
emissions were significantly reduced throughout all the trials compared to the baseline.
Compared to the previous woodchip trial burn VOC level, the variable feed 5 and 10 % trial burn
CO levels were reduced 48 and 67 %, respectively. Volatile organic compounds are formed from
combustion of organic material within the raw materials and fuels. Research has shown that
system design and control, such as the number of stages in the preheater and the exiting flu-gas
temperatures, dictate the formation of dioxin and furan formations more so than the fuels utilized
(Bech and Mishulovich 2004; Loo 2008).
The p-values calculated for the carbon monoxide (CO) show that the construction and
demolition waste and variable feed 15 % woodchip trial burns are significantly different. The
variable feed 5 and 10 % and the soybean seed trial burns have statistically similar means to the
baseline, and therefore their percent differences relative to the baseline are negligible. The
carbon monoxide content in the variable feed 15 % trial burn was decreased by 19 % compared
to the baseline, which was the greatest difference for all the trial burns. Compared to the
previous woodchip trial burn CO level, the variable feed 5 and 10 % trial burn CO levels were
each reduced 34 %.
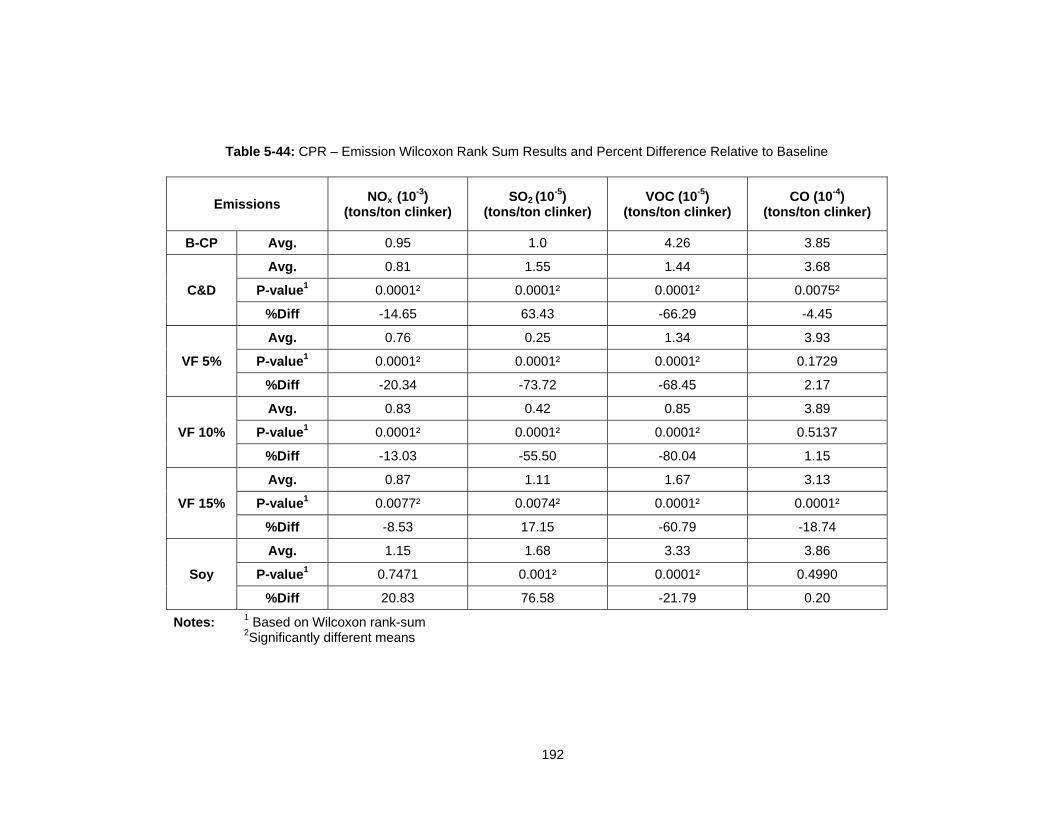
192
Table 5-44: CPR – Emission Wilcoxon Rank Sum Results and Percent Difference Relative to Baseline
Emissions NOx (10-3)
(tons/ton clinker) SO2 (10-5)
(tons/ton clinker) VOC (10-5)
(tons/ton clinker) CO (10-4)
(tons/ton clinker)
B-CP Avg. 0.95 1.0 4.26 3.85
C&D
Avg. 0.81 1.55 1.44 3.68
P-value1 0.0001² 0.0001² 0.0001² 0.0075²
%Diff -14.65 63.43 -66.29 -4.45
VF 5%
Avg. 0.76 0.25 1.34 3.93
P-value1 0.0001² 0.0001² 0.0001² 0.1729
%Diff -20.34 -73.72 -68.45 2.17
VF 10%
Avg. 0.83 0.42 0.85 3.89
P-value1 0.0001² 0.0001² 0.0001² 0.5137
%Diff -13.03 -55.50 -80.04 1.15
VF 15%
Avg. 0.87 1.11 1.67 3.13
P-value1 0.0077² 0.0074² 0.0001² 0.0001²
%Diff -8.53 17.15 -60.79 -18.74
Soy
Avg. 1.15 1.68 3.33 3.86
P-value1 0.7471 0.001² 0.0001² 0.4990
%Diff 20.83 76.58 -21.79 0.20
Notes: 1 Based on Wilcoxon rank-sum 2Significantly different means

193
Figure 5-23: Percent Difference Relative to Baseline Emissions for All Burns
-100
-80
-60
-40
-20
0
20
40
60
80
100%
Dif
fere
nce
Rel
ativ
e to
Bas
elin
e
.
C&D
VF 5%
VF 10%
VF 15%
Soy
NOx SO2 VOC CO
194
CO emissions remained within -19 to 2 % of the baseline CO emissions. Research has
shown that carbon monoxide develops from the incomplete combustion of carbon rich fuels due
to insufficient oxygen at the combustion site (Greer et al. 2004). Coal has the highest carbon
content of all the fuels used. The ultimate analysis showed that the carbon content of the coal
fluctuated more than the carbon contents of the plastic blend and trial fuels. Since coal was the
most utilized fuel during all the trial burns, the effects from changes in the coal’s chemical
composition are more likely to influence emission results than the plastic blend or the trial fuels.
As previously mentioned, the carbon monoxide emitted from the construction and demolition
waste and the variable feed 15 % burns were the two trials with differing means compared to the
baseline. Although the coal composition for the construction and demolition waste possessed a
negligible percent difference to the baseline, the variable feed 15 % showed a decrease of about
10 % in carbon content. This could explain a portion of the overall decrease in carbon monoxide
within the variable feed 15 % trial burn.
The ADEM limits pertaining to each emission monitored by the cement plant are
tabulated in Table 5-45. The emission limits are reported in tons per 30 days or tons per hour.
Utilizing the cement plant’s production rates from each trial, the emission limits were converted to
ton of emission per ton of clinker. The average of each emission for all the burns is presented at
the bottom of Table 5-45 and shown in Figure 5-24.
The average, 5th and 95th percentiles of each emission for all burns are shown in Figure
5-24. All the emissions remained within limits except for the volatile organic compounds within
the baseline and soybean seed burns. As previously stated, controlling the VOC emissions relies
more on system control than fuel utilization and this apparent non-compliance cannot be
attributed to the use of the trial fuels.
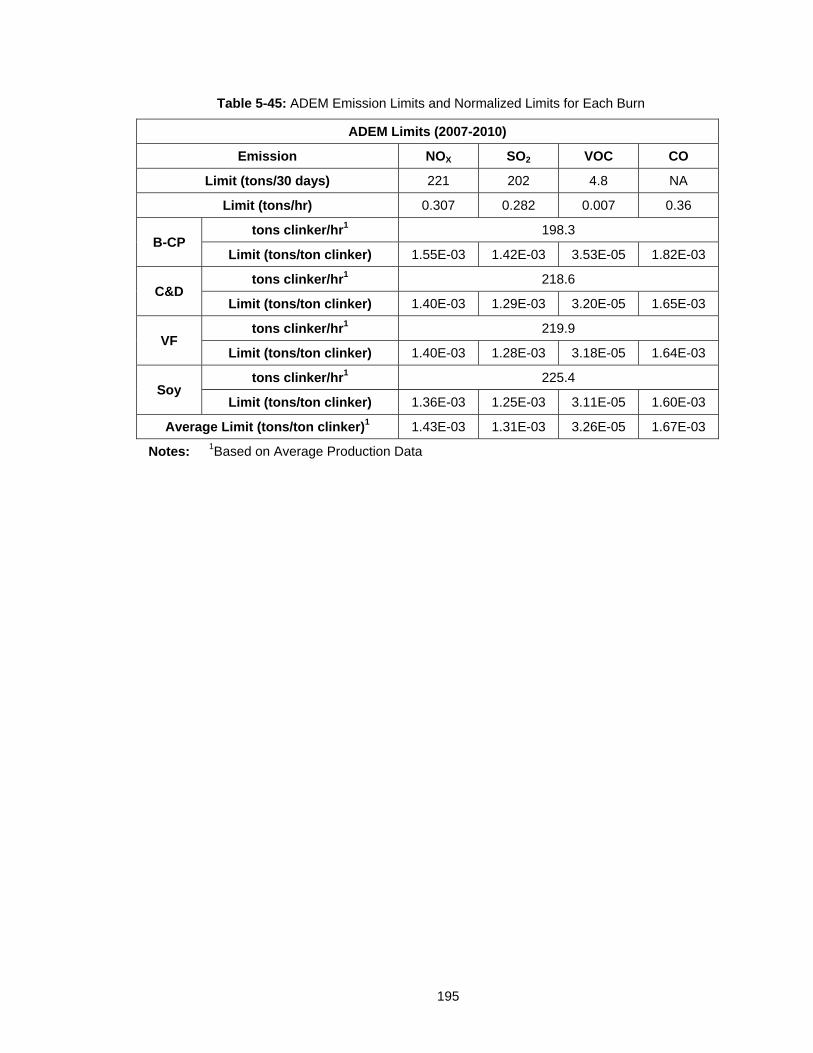
195
Table 5-45: ADEM Emission Limits and Normalized Limits for Each Burn
ADEM Limits (2007-2010)
Emission NOX SO2 VOC CO
Limit (tons/30 days) 221 202 4.8 NA
Limit (tons/hr) 0.307 0.282 0.007 0.36
B-CP tons clinker/hr1 198.3
Limit (tons/ton clinker) 1.55E-03 1.42E-03 3.53E-05 1.82E-03
C&D tons clinker/hr1 218.6
Limit (tons/ton clinker) 1.40E-03 1.29E-03 3.20E-05 1.65E-03
VF tons clinker/hr1 219.9
Limit (tons/ton clinker) 1.40E-03 1.28E-03 3.18E-05 1.64E-03
Soy tons clinker/hr1 225.4
Limit (tons/ton clinker) 1.36E-03 1.25E-03 3.11E-05 1.60E-03
Average Limit (tons/ton clinker)1 1.43E-03 1.31E-03 3.26E-05 1.67E-03
Notes: 1Based on Average Production Data

196
Figure 5-24: Average Normalized Plant Emissions with ADEM Limits for All Burns
0.0
1.0
2.0
3.0
4.0
5.0
6.0
7.0A
vg. E
mis
sion
Val
ue
(ton
s/to
n c
lin
ker
)
.
Baseline
C&D
VF 5%
VF 10%
VF 15%
SoyNOx Limit = 1.43 x 10⁻³
SO2 Limit = 131 x 10-5 CO Limit = 17 x 10-4
VOC Limit =
3.26 x 10⁻⁵
95th Percentile
5th Percentile
Mean Value
NOx (10-3) SO2 (10-5) VOC (10-5) CO (10-4)
Emission
197
5.5 CONCLUDING REMARKS
The complex nature of cement manufacturing and inherent variability in the chemical composition
of raw materials and fuels create challenges attributing the effects of one process input to the
overall production and performance of the cement. However, multiple conclusions have been
formed regarding the utilization of alternative fuels in the manufacture of portland cement.
The ability of the cement plant to maintain production rates and efficiently process and
dose the trial fuels were the initial objectives of this study. The processing ability of the available
equipment is one factor that limits substitution rates. The construction and demolition waste and
woodchip burns did not cause any feed problems. Several cement plant personnel experienced
allergic reactions due to handling and de-dusting the soybean seeds. This was most likely due to
the herbicide on the soybean seed. This problem, however, was eliminated with the use of
proper personal protective equipment.
The energy value associated with each fuel was also an important aspect in determining
the viability of the alternative fuel source. The energy values of the fuels utilized during all the
trials of this study were less than those of the traditional fuels. The as-received energy values for
each fuel utilized during this study were as follows:
1. Coal: 10,820 to 12,090 with an average of 11,320 BTU/lb,
2. Plastics: 8,855 to 10,780 with an average of 10,130 BTU/lb,
3. Construction and Demolition waste: 3,370 to 8,180 with an average of 6,050 BTU/lb,
4. Woodchips: 3,355 to 6,996 with an average of 4,736 BTU/lb, and
5. Soybean seeds: 8,977 to 9,375 with an average of 9,150 BTU/lb.
The coal had the highest energy content followed by the plastic waste and alternative
fuels. The high energy content of the plastic waste is one reason it has been utilized for a
number of years and is considered a traditional fuel for this study. The soybean seeds
possessed the highest energy values for the alternative fuels followed by the construction and
demolition waste and woodchips. The minimum and maximum heating values are expressed to
show the fluctuation in energy values associated with each fuel. Moisture content greatly affects
the energy content of a fuel. Coal, plastics, and soybean seeds all possessed fairly stable
moisture contents and thus the ranges of energy values are significantly lower than the
construction and demolition waste and the woodchip fuels heating ranges.
A goal of this this part of the study was to determine if the utilization of alternative fuels
had a direct impact on the chemical composition of the portland cement. The kiln feed and the
cement kiln dust were compared to their respective baseline values and found to be consistent
with the exception of an elevated SO3 content found in all the trial burns kiln feed. A probable
198
cause for the increase in SO3 was the elevated SO3 contents found in the of cement kiln dust,
which is recycled into the kiln feed.
The statistical analysis performed on the clinker data showed that the majority of
parameter means were significantly different than the parameter means of the baseline burn. This
was expected because of the narrow range of values surrounding the mean of each parameter.
Of the parameter means that showed significant differences, however, the percent difference
between the trial and baseline parameter means were small for most parameters. This indicates a
fair amount of consistency throughout the trial burns. An example of the consistency that was
maintained over all the trial burns can be seen in the chemical composition of the cement’s
primary oxides levels, Al2O3, CaO, Fe2O3, and SiO2 compared to the baseline cement. All of the
primary oxide levels are within 10 % of the baseline’s results. There were minimal fluctuations
found in the cement Bogue compounds. The alite content increased 17 % in the cement
produced during the soybean seed trial burn and the aluminate content of the construction and
demolition waste and variable feed 10 % trial cements also increased compared to the baseline
alite content. The Bogue compounds are influenced by multiple variables such as process inputs,
kiln temperature, and clinker cooling rates. Because of the inherent variability throughout
portland cement production, changes in cement chemistry are difficult to link to the utilization of a
particular fuel.
The physical property results from the cement plant and Auburn University were
compared. If consistent changes were observed between a trial and the baseline result
throughout paste, mortar, and concrete testing, the property change could be verified and
attributed to the trial cement. The majority of paste and mortar physical properties tested were
similar to the baseline’s paste and mortar results. Since the paste and mortar testing did not use
the admixtures found in the concrete mixtures, the paste and mortar tests were thought to better
represent the actual behavior of the trial cements. Overall, it was found that the trial burn
cements had minimal effects on workability, setting time, strength, drying shrinkage, and
permeability compared to the baseline cement.
The statistical analysis conducted for the NOx emission showed significant differences
between the trial and baseline means for all burns except the soybean seed trial. The NOx,
however, were reduced for the construction and demolition waste and variable feed trails. Since
the majority of NOx develops from the oxidation of atmospheric nitrogen, conclusions about the
effects of alternative fuels cannot be drawn without reports of oxygen levels in the kiln during the
pyroprocess.
Statistical analysis also showed significant differences between the baseline and trial
means for SO2. The increase of SO2 in the construction and demolition waste and soybean seed
trials was thought to be caused by the elevated sulfur contents found in the kiln feed and coal.
Because of the low sulfur content of woodchips, the increase in SO2 from the variable feed 5 % to
199
the 15 % trial burn is probably not due to the increase in woodchip substitution. The kiln feed of
the variable feed burns, however, showed progressively increasing SO3 levels compared to the
baseline.
All the trials showed significantly different means for the volatile organic compound
emissions. The VOC’s were reduced for all burns compared to the baseline’s VOC levels.
Research has proven that control of volatile organic emissions depend more on system design
and control than fuels utilized.
Statistical analysis of the carbon monoxide results for all burns showed that only the
construction and demolition waste and variable feed 15 % possessed significantly different
means compared to the baseline. The degree of difference between the construction and
demolition waste and the baseline, however, was almost a negligible. The decrease seen in the
variable feed 15 % trial is thought to be partially caused by a 10 % decrease in the carbon
content of the coal utilized during that trial.
Throughout this chapter, several physical changes in the cement could be attributed to
changes in chemical composition. It is, however, unfortunate that the variability in the production
of portland cement makes connecting changes in cement chemistry or physical properties directly
to the utilization of alternative fuels a difficult task. This study did not find conclusive evidence that
the changes in cement chemistry and performance were solely due to the utilized alternative
fuels. The implementation of trial fuels in this study successfully decreased the quantity of the
traditional fuels required and produced cement with equal if not slightly improved properties.
200
CHAPTER 6
PART 2—SUMMARY, CONCLUSIONS, AND
RECOMMENDATIONS
6.1 SUMMARY
Alternative fuels included in this study are construction and demolition waste, woodchips, and
soybean seeds. Each of these fuels was utilized in order to partially replace and therefore lessen
the demand for traditional fuels. Each trial fuel and was co-fired with coal and a waste-plastic
blend. In this phase of this study, the waste-plastic bend is considered a traditional fuel since it is
used during normal operation at the cement plant.
The first alternative utilized over a 3-day burn period was construction and demolition
waste (C&D). The construction and demolition waste consisted of wood, paper, and plastics.
The second trial utilized woodchips (VF) and was conducted over a 6 -day period. This burn was
unique to this study due to the progressively increasing substitution rate of woodchips. The third
and final burn, which utilized soybean seeds, was also conducted over a 3-day burn period.
Although this burn took place several months after the baseline, the conditions at the cement
plant were maintained to the best of the staffs’ ability. A baseline or control burn consisting of just
coal and the waste plastic blend occurred prior to the trial burns.
During each trial burn, samples of process inputs and outputs were sampled by the
cement plant. The chemical compositions of the samples were determined by two testing
agencies. The chemistry of the process inputs and outputs for each trial burn were compared to
the baseline’s burn results. Since chemical changes in clinker can be caused by the
incorporation of noncombustible materials, an attempt was made to establish connections
between the clinker chemistry and the alternative fuel. Cement physical properties were
determined by two agencies. Fresh and hardened concrete properties were determined by one
party. Finally, emissions were monitored by the cement plant during each trial burn. These
emissions were compared to the baseline’s emissions in order to determine if any correlations
could be established between the alternative fuels and their emission profiles.
6.2 CONCLUSIONS
The ability of the cement plant to maintain production rates and efficiently process and dose
alternative fuels was the initial objective of this study. The processing ability of the available
201
equipment is one factor that limits substitution rates. The construction and demolition waste and
woodchip burns did not cause any feed problems. Several cement plant personnel experienced
minor allergic reactions due to handling and de-dusting the soybean seeds. This problem;
however, was eliminated with the use of proper personal protective equipment.
The energy value associated with each fuel was also an important aspect in determining
the viability of the fuel. The energy values of the alternative fuels utilized during this study were
less than those of traditional fuels. The as-received energy values for each fuel utilized during
this study are presented in Section 5.4.4.
When assessing the feasibility of the alternative fuel, the unit cost of the fuel is an
important parameter. Although some of the alternative fuels possess energy values that are
roughly half that of the traditional fuels, the price for traditional fuels is typically significantly more
than alternative fuels. Due to fuel cost data being proprietary knowledge, the feasibility of the trial
alternative fuels based on price could not be evaluated or compared.
The utilization of each fuel remained fairly consistent over the burn periods. Coal
accounted for almost 90 percent of the required energy during the baseline burn, but was
reduced to 70 percent during the variable feed 15 percent trial burn. The plastic blend accounted
for roughly 15 percent of the required energy for all trial burns. Alternative fuels accounted for 5,
5.4, 11.8, 16, and 7.5 percent of the total energy for the construction and demolition waste,
variable feed 5, 10, and 15 percent, and soybean seed burns, respectively. Since the alternative
fuels and waste plastic blend only accounted for 20-30 percent of the total fuel energy, only
parameters possessing significant differences to the baseline have the possibility to affect the
cement and concrete properties.
Another goal of this part of this study was to determine if the utilization of alternative fuels
had a direct impact on the chemical composition of the portland cement. The kiln feed and the
cement kiln dust results were compared to their respective baseline values and found to be
consistent over all trials with the exceptions of elevated SO3 and P2O5 concentrations. A probable
cause for the increase in SO3 was significantly elevated SO3 contents found in the cement kiln
dust. Cement kiln dust is routinely recycled into the kiln feed because it contains many of the
same chemical properties that are found in the kiln feed. Since none of the raw materials
possessed elevated SO3 concentrations, the cement kiln dust SO3 content was more than likely
increased by the utilized fuels. It was, however, determined from the standard parameters that
the SO3 content for the coal and plastics decreased over all the trials compared to the baseline.
Also, the alternative fuels did not possess excessive SO3 concentrations. Therefore, the source
of increase in the cement kiln dust was not determined.
The external laboratory reported significant increases in P2O5 for all trial burns. Slightly
increased P2O5 levels were also found in the cement kiln dust. In the trial burns, coal possessed
significantly elevated levels of P2O5 compared to the baseline’s coal level. The construction
202
demolition waste contained approximately 3 and 2 times the P2O5 content compared to the
woodchip and soybean seed trials, respectively. Though the construction and demolition waste
fuel possessed the highest P2O5 content for the alternative fuels tested, their contribution to the
overall P2O5 content of the clinker and cement was minimal. The combination of materials and
fuel led to the increased P2O5 levels found in the clinker and cement.
The statistical analysis performed on the clinker data and it showed that the majority of
results from the trial burns had significantly different means. However, because of the inherent
variability throughout portland cement production process, changes in cement chemistry are
difficult to link to the utilization of a particular fuel.
Additional objectives of this phase of the study were to evaluate if the utilization of the
trial fuels directly impacted the physical properties of the portland cement or the concrete that
was prepared with the trial burn cements. Overall, it was found that the trial burn cements had
minimally different effects on workability, setting time, strength, drying shrinkage, and
permeability compared to the baseline cement.
Another objective of this phase of the study was to assess the impact of alternative fuels
on emissions produced by the cement plant. The Nitrogen Oxides (NOx), sulfur dioxide (SO2),
and carbon monoxide (CO) emissions were within acceptable emission limits except for the
volatile organic compounds (VOC) produced during the baseline and soybean seed trial burns.
The production of volatile organic compounds is more dependent on system design and control
than the type of fuel used. The trial fuels utilized were not found to greatly affect the quantity of
emission produced.
The cement plant was successful in implementing alternative fuels to produce a
consistent, high-quality product that increased cement performance while reducing the
environmental footprint of the plant. The utilization of construction and demolition waste,
woodchips and soybean seeds proved to be viable replacements for traditional fuels. The future
use of these fuels depends on local availability, associated costs, and compatibility with a facility’s
production process.
6.3 RECOMMENDATIONS
A major factor limiting the effectiveness of this study was the fairly low substitution rate of the
alternative fuels. Coal accounted for 70 to 90 percent of the total energy consumed during
production. The alternative fuels tested during this study contributed only 5 to 16 percent of the
total energy used during the pyroprocess. Changes in cement chemistry could not be solely
attributed to the alternative fuels. This was due to observed cement physical changes paralleling
significant fluctuations in kiln feed or coal chemical compositions. Increasing the substitution rate
would allow the trial fuel’s effects to be more pronounced and thus provide a better understanding
of the interactions that occur between a utilized fuel and the performance of the portland cement.
203
If the minimum substitution rates were increased, as well as implementing a variable feed
approach similar to the woodchip trial performed in this study, an optimum replacement rate could
be established.
Although a thorough sampling plan was developed for each burn, determining the effects
of the alternative fuels on the cement chemistry and performance proved a difficult task. If the
sampling plan was expanded to include enough samples of kiln feed, coal, and cement kiln dust
to perform statistical analysis, a greater understanding of the consistency of these process inputs
throughout a trial burn could be achieved. Increasing the number of specimens tested could also
limit the number of inconsistent results between testing agencies. A sampling plan, however, is
often limited by available funding, personnel, and time.
There were several trends that could not be explained regarding the emissions produced
during the trial burns. Oxygen levels should be measured within the kiln. Knowing the oxygen
level present in the pyroprocess, which significantly effects the emissions formed, could be
beneficial in order to explain the fluctuations observed in the NOx, SO2, and CO emissions.
204
PART 3
Evaluate Gasification to Remove
Contaminants in Cement Production
205
CHAPTER 7
PART 3—INTRODUCTION
7.1 POULTRY LITTER
Poultry litter is a waste product of the poultry industry that comes from floor-raised birds (primarily
broilers) and consists of their manure, bedding material (usually wood shavings), waste feed, and
feathers. According to the USDA, over 8 billion broilers (47.7 billion pounds) were produced in the
US in 2009, and approximately half of all broiler production was from Alabama, Georgia,
Arkansas, and Mississippi alone (USDA 2010). Using an estimate of .52 lb litter/lb bird
recommended by Alabama Cooperative Extension System, that translates to 12.4 million tons of
litter produced annually (aces.edu 1996). The most common use for this litter is as a soil
amendment in farming (Kelleher 2002). However, due to high transportation costs most of the
litter is applied only to neighboring farmlands leading to nutrient buildup and runoff, most notably
of phosphorus, causing excess algae growth, disruption of local ecosystems, and drinking water
pollution (Kelleher 2002; Adams 2005; Bock 2004). Because of these harmful effects garnered
over time, there is much interest in finding other outlets for this waste product.
7.2 CEMENT KILN
One proposed alternative use for poultry litter is as a fuel. It has an average higher heating value
(HHV) of ~14 MJ/dry kg which is comparable to ~20 MJ/dry kg for wood and about half that of
coal (Kelleher 2002). A current major waste and alternative solid fuel consumer and potential
venue for poultry litter utilization is the cement production industry. Portland cement is
manufactured by heating limestone, primarily calcium carbonate (CaCO₃), to temperatures up to
1450˚C to form calcium oxide (CaO) as well as calcium silicates and aluminates in a process
called calcination (Kaantee et al., 2004). These temperatures are achieved by burning large
amounts of primarily non-renewable fossil fuels such coal, petroleum coke, gas, or oil in a
massive rotating kiln as shown in Figure 1-1.
It is in the cement producer’s interest both economically and environmentally to
supplement some energy needs with alternative, renewable fuels. Types of alternative fuels vary
depending on availability relative to plant location, but some examples include: waste oils, landfill
gas, bark, paper, tires, and plastics (Mokrzycki et al. 2003). A good alternative fuel will have
sustained availability and be economically beneficial to the cement producer, and in areas such
206
as the southeast and where plants are in close proximity to poultry farms, poultry litter fulfills
those requirements well. While these fuel selection requirements are not very discriminating,
some further process-specific limitations do exist. The alternative fuel introduced must not
adversely affect the kiln functionality or the quality of the cement product, and while the robust
nature of the process makes this a generally undemanding requirement, negative effects can be
garnered from excess heavy metal, alkali, sulfur, or chlorine content. Chlorides, sulfides, and
alkalis become circulating elements in the kiln, volatilizing in hotter portions while condensing in
cooler portions, leading to the formation of kiln ring build-ups and subsequent, costly shut-downs
(Mokrzycki et al. 2003; Folta 2010). Every cement manufacturing facility has its own unique
standards to determine the quantity of these deleterious components that is permissible, but the
high level of alkalis and chlorine found in poultry litter either prevents or severely limits its
substitution rate almost universally. Therefore, in order to gain the distinct economic and
environmental advantages presented by poultry litter use, an intermediate step of biomass
gasification is presented as a means to extract the chemical energy for use in the cement kiln
while limiting the throughput of undesirable elements.
7.3 GASIFICATION
Thermochemical gasification via partial oxidation is a relatively old technology; it has been in
existence for over 150 years (Beenackers et al. 1984). The overall goal is to convert the solid
biomass energy into a gaseous form with minimal loss, usually 10-30%, in order to gain the many
advantages which gas possesses over solid fuel (Reed 1981). A possible secondary goal is to
remove unwanted components from the fuel source, such as sulfur, as in coal gasification
(Beenackers et al. 1984). This is the feature of interest relevant to the implementation of poultry
litter energy in the cement kiln. There are many types of gasifiers, each typified by the oxidizer
employed; the orientation and flow of products relative to inputs; or the use of fluidized beds
versus static, packed fuel beds (Beenackers et al. 1984). A commercially available, relatively
simple, low-tar production option is a downdraft gasifier. This vertically-oriented setup draws both
the oxidizer (air in this case) and the feedstock in through the open top. The consumption of the
biomass then occurs along the throat of the gasifier, proceeding to the grate at the bottom where
the hot synthesis gas (syngas) exits, ready for use. The gasification process can be broken down
into several stages as it progresses from the entry to the exit of the gasifier: thermal
decomposition, or pyrolysis, in which the volatiles are driven off producing pyrolysis vapors and
tars; char oxidation, in which char remnants from the pyrolysis zone react with remaining oxygen
and other gases and are gasified in both endothermic and exothermic reactions; and char
reduction, in which remaining carbon content is consumed through primarily endothermic
reactions (Buekens et al. 1984; Gasification 2011). While the exact chemistry of this process is
207
highly complex, there are several principal reactions vital to the formation of the syngas products
that are well agreed upon and used commonly when mathematically modeling biomass
gasification (Buekens et al. 1984; Priyadarsan et al. 2004; Giltrap et al. 2003; Wang et al. 1993):
Heterogeneous Reactions (Solid and gas reactants)
C + ½O₂ CO ∆H = -110.6 kJ/mol
C + O₂ CO₂ ∆H = -393.8 kJ/mol
C + CO₂ 2CO ∆H = +172.6 kJ/mol
C + H₂O CO + H₂ ∆H = +131.4 kJ/mol
C + 2H₂ CH₄ ∆H = -74.9 kJ/mol
Homogeneous Reactions (Gas reactants)
CO + H₂O CO₂ + H₂ ∆H = -41.2 kJ/mol
CH₄ + H₂O CO + 3H₂ ∆H = +201.9 kJ/mol
The gas produced with the downdraft, air-oxidation gasifier is ‘low joule’ or ‘low energy’
gas, relative to other methods of gasification or pure pyrolysis, and is best employed in a ‘closely
coupled’ arrangement for immediate use to preserve efficiency (Beenackers et al. 1984; Reed
1981). This arrangement would be ideally suited in preparing potentially harmful fuels,
specifically poultry litter, for use in a cement kiln and, therefore, is the focus of the current study.
7.4 OBJECTIVE STATEMENT FOR PART THREE
In a previous study conducted at the Roberta Plant (Folta 2010), poultry litter was the only
alternative fuel where the direct burn substitution rate was limited due to fuel components that
would negatively impact kiln operation. Poultry litter has high levels of chlorine, sodium,
potassium, and phosphorus. For the Lafarge facility, which was the test facility for this project,
the limiting factor was the chlorine content of the poultry litter. Depending on the composition of
the limestone feedstock composition, any of these constituents could become the limiting factor
so the potential of gasification to capture each of these constituents is of interest.
Downdraft biomass gasification of pelletized poultry litter was a proposed solution to this
problem as a means to produce a clean, consistent product gas for injection into the kiln. In this
phase of the study, this process has been analyzed through experimentation on a pilot-scale 65
Nm³/hr (Normal m³/hr at 0˚C, 101.3 kPa) syngas production downdraft gasifier to determine its
effectiveness and consistency. The low ash fusion temperature and high alkali content of poultry
litter proved to be difficult obstacles to overcome as ash clinker formation is an issue.
Experiments with temperature depression via flue gas recirculation as well as experiments
employing an additive (limestone) to prevent fusion and aid in chlorine retention in the ash have
been carried out. Flue gas recirculation allowed the reduction of the gasifier secondary air
oxygen concentration by 40-45%, yielding an approximately 100˚C depression in average
208
temperature. Results have shown that the clinkering is temperature independent, at least within
the controllable temperature range. Limestone was found to have only a slight effect on the
fusion when used to coat poultry litter pellets. However, limestone addition did display some
promise in regards to chlorine capture, as ash analyses showed chlorine concentrations of more
than four times greater in the limestone infused ash as compared to raw poultry litter.
Experiments were also conducted to explore the effectiveness of mixing limestone with raw
poultry litter, the object being to coat more surface area and have a more even mixture. These
resulted in the most consistent experiments with no ash clinkering.
Once consistent gasification of raw poultry litter was achieved through a combination of
woodchip dilution (60% woodchips:40% poultry litter) and addition of limestone at 5% of the wet
poultry litter mass, experiments were performed to determine the capture rates of the
contaminants pertinent to cement kilns. Limestone percentage was varied to explore its effect on
chlorine retention at three different set points. It was found that limestone percentage, at least
within the tested range, had little effect on neither the retention of contaminants nor distribution of
contaminants through the gasifier system. On average, 89% of the chlorine was retained in the
gasifier char, as was 94% of both the potassium and sodium, and 100% of the phosphorus. A
contaminant concentration profile, developed from analyses of char samples from different
sections of the gasifier system, showed that 69.1% of the chlorine retained was captured past the
gasifier grate and 52.6% was captured in the significantly cooler filter box and heat exchanger
sections of the gasifier system. Additionally, peaks in concentration of sulfur and potassium were
observed in these same sections. From these results, it was concluded that cooling and filtering
the syngas in the range of 60-110˚C obtains the maximum removal of contaminants from the
syngas stream.
7.5 ABBREVIATIONS FOR THIS PART OF THE REPORT
Acronyms
CPC Community Power Corporation
HEX Heat Exchanger
HHV Higher Heating Value
LHV Lower Heating Value
LOI Loss on Ignition, % mass
MW Molecular Weight, g/mole
PL Poultry Litter
WAL Wyoming Analytical Labs

209
Symbols
Atomic Weight, g/mole
Uncertainty of i, same units as i
∆H Change in Enthalpy, kJ/mole
n Number of moles
Nm³/hr Normal cubic meters per hour, at 0˚C and 101.3 kPa (1 atm)
P Pressure, Pa
Universal Gas Constant, ∙
T Temperature, K
V Volume, m³
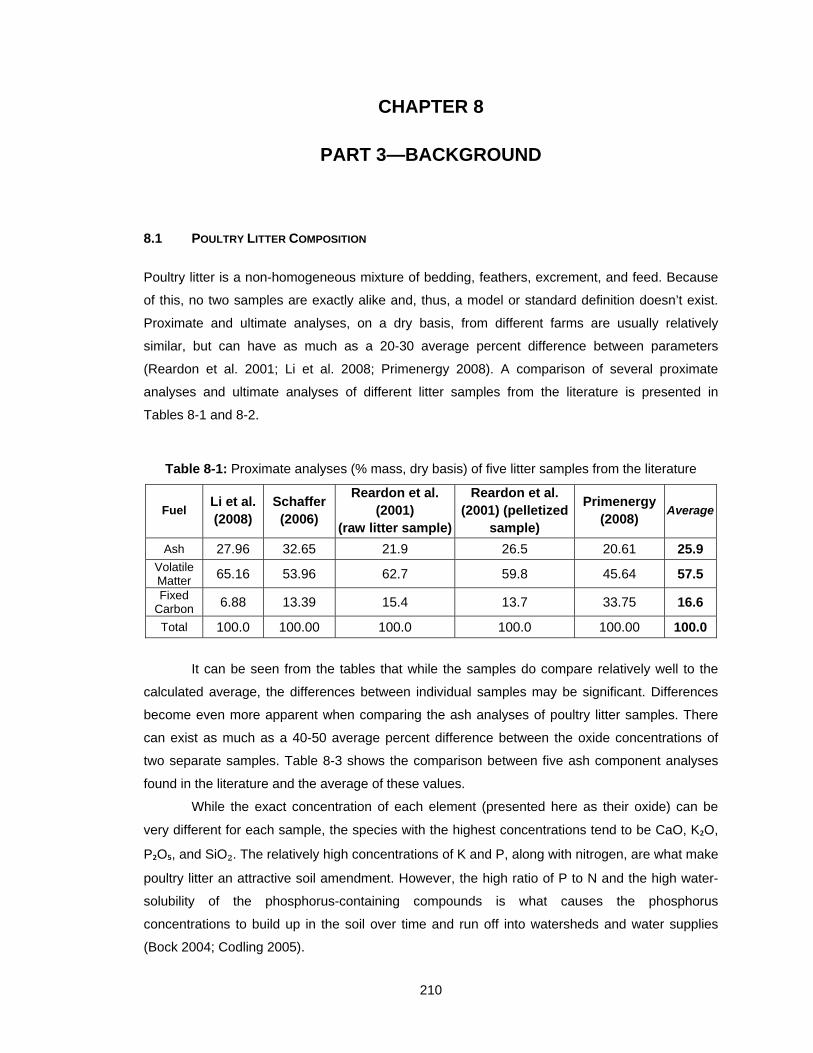
210
CHAPTER 8
PART 3—BACKGROUND
8.1 POULTRY LITTER COMPOSITION
Poultry litter is a non-homogeneous mixture of bedding, feathers, excrement, and feed. Because
of this, no two samples are exactly alike and, thus, a model or standard definition doesn’t exist.
Proximate and ultimate analyses, on a dry basis, from different farms are usually relatively
similar, but can have as much as a 20-30 average percent difference between parameters
(Reardon et al. 2001; Li et al. 2008; Primenergy 2008). A comparison of several proximate
analyses and ultimate analyses of different litter samples from the literature is presented in
Tables 8-1 and 8-2.
Table 8-1: Proximate analyses (% mass, dry basis) of five litter samples from the literature
Fuel Li et al. (2008)
Schaffer (2006)
Reardon et al. (2001)
(raw litter sample)
Reardon et al. (2001) (pelletized
sample)
Primenergy (2008)
Average
Ash 27.96 32.65 21.9 26.5 20.61 25.9 Volatile Matter 65.16 53.96 62.7 59.8 45.64 57.5
Fixed Carbon 6.88 13.39 15.4 13.7 33.75 16.6
Total 100.0 100.00 100.0 100.0 100.00 100.0
It can be seen from the tables that while the samples do compare relatively well to the
calculated average, the differences between individual samples may be significant. Differences
become even more apparent when comparing the ash analyses of poultry litter samples. There
can exist as much as a 40-50 average percent difference between the oxide concentrations of
two separate samples. Table 8-3 shows the comparison between five ash component analyses
found in the literature and the average of these values.
While the exact concentration of each element (presented here as their oxide) can be
very different for each sample, the species with the highest concentrations tend to be CaO, K₂O,
P₂O₅, and SiO₂. The relatively high concentrations of K and P, along with nitrogen, are what make
poultry litter an attractive soil amendment. However, the high ratio of P to N and the high water-
solubility of the phosphorus-containing compounds is what causes the phosphorus
concentrations to build up in the soil over time and run off into watersheds and water supplies
(Bock 2004; Codling 2005).
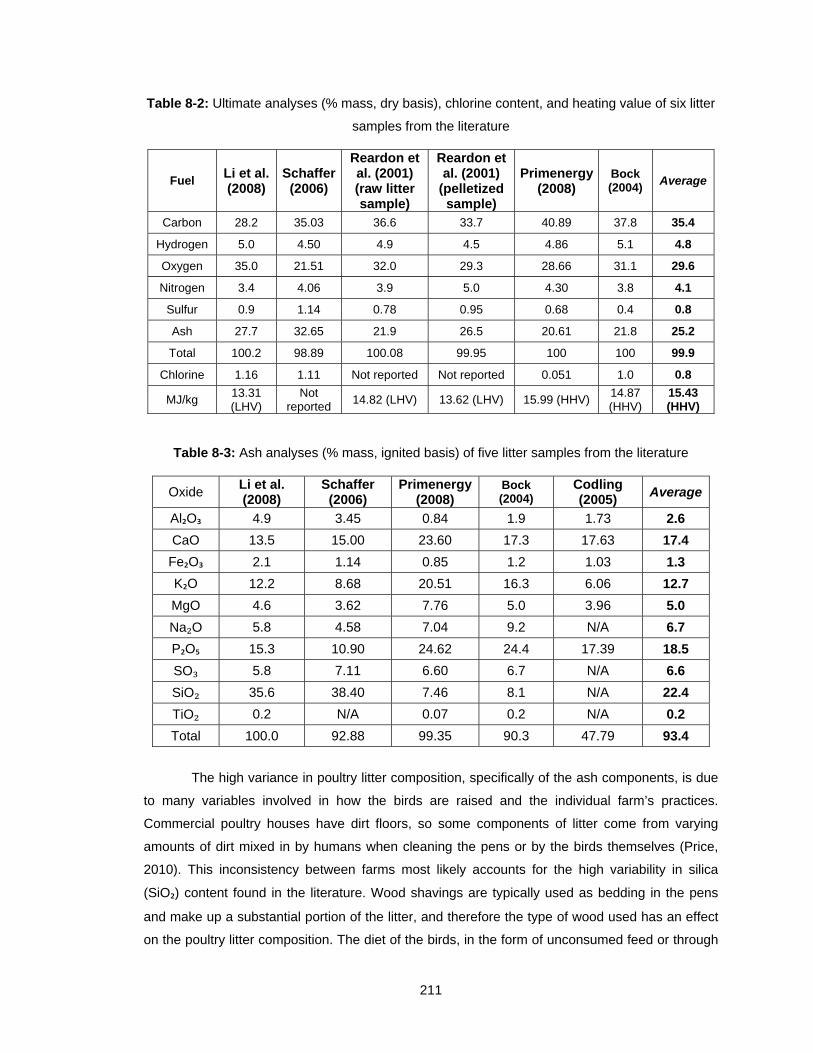
211
Table 8-2: Ultimate analyses (% mass, dry basis), chlorine content, and heating value of six litter
samples from the literature
Fuel Li et al. (2008)
Schaffer (2006)
Reardon et al. (2001) (raw litter sample)
Reardon et al. (2001)
(pelletized sample)
Primenergy (2008)
Bock (2004)
Average
Carbon 28.2 35.03 36.6 33.7 40.89 37.8 35.4
Hydrogen 5.0 4.50 4.9 4.5 4.86 5.1 4.8
Oxygen 35.0 21.51 32.0 29.3 28.66 31.1 29.6
Nitrogen 3.4 4.06 3.9 5.0 4.30 3.8 4.1
Sulfur 0.9 1.14 0.78 0.95 0.68 0.4 0.8
Ash 27.7 32.65 21.9 26.5 20.61 21.8 25.2
Total 100.2 98.89 100.08 99.95 100 100 99.9
Chlorine 1.16 1.11 Not reported Not reported 0.051 1.0 0.8
MJ/kg 13.31 (LHV)
Not reported
14.82 (LHV) 13.62 (LHV) 15.99 (HHV) 14.87 (HHV)
15.43 (HHV)
Table 8-3: Ash analyses (% mass, ignited basis) of five litter samples from the literature
Oxide Li et al. (2008)
Schaffer (2006)
Primenergy (2008)
Bock (2004)
Codling (2005)
Average
Al₂O₃ 4.9 3.45 0.84 1.9 1.73 2.6
CaO 13.5 15.00 23.60 17.3 17.63 17.4
Fe₂O₃ 2.1 1.14 0.85 1.2 1.03 1.3
K₂O 12.2 8.68 20.51 16.3 6.06 12.7
MgO 4.6 3.62 7.76 5.0 3.96 5.0
Na₂O 5.8 4.58 7.04 9.2 N/A 6.7
P₂O₅ 15.3 10.90 24.62 24.4 17.39 18.5
SO₃ 5.8 7.11 6.60 6.7 N/A 6.6
SiO₂ 35.6 38.40 7.46 8.1 N/A 22.4
TiO₂ 0.2 N/A 0.07 0.2 N/A 0.2
Total 100.0 92.88 99.35 90.3 47.79 93.4
The high variance in poultry litter composition, specifically of the ash components, is due
to many variables involved in how the birds are raised and the individual farm’s practices.
Commercial poultry houses have dirt floors, so some components of litter come from varying
amounts of dirt mixed in by humans when cleaning the pens or by the birds themselves (Price,
2010). This inconsistency between farms most likely accounts for the high variability in silica
(SiO₂) content found in the literature. Wood shavings are typically used as bedding in the pens
and make up a substantial portion of the litter, and therefore the type of wood used has an effect
on the poultry litter composition. The diet of the birds, in the form of unconsumed feed or through
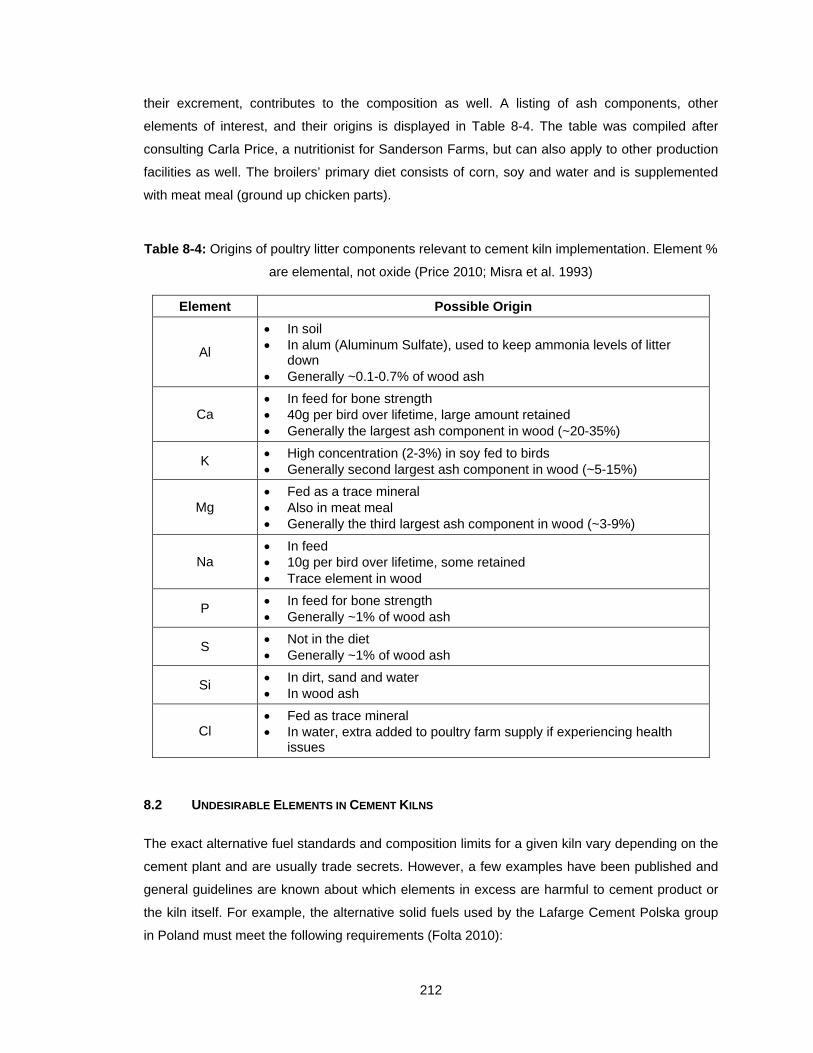
212
their excrement, contributes to the composition as well. A listing of ash components, other
elements of interest, and their origins is displayed in Table 8-4. The table was compiled after
consulting Carla Price, a nutritionist for Sanderson Farms, but can also apply to other production
facilities as well. The broilers’ primary diet consists of corn, soy and water and is supplemented
with meat meal (ground up chicken parts).
Table 8-4: Origins of poultry litter components relevant to cement kiln implementation. Element %
are elemental, not oxide (Price 2010; Misra et al. 1993)
Element Possible Origin
Al
In soil In alum (Aluminum Sulfate), used to keep ammonia levels of litter
down Generally ~0.1-0.7% of wood ash
Ca In feed for bone strength 40g per bird over lifetime, large amount retained Generally the largest ash component in wood (~20-35%)
K High concentration (2-3%) in soy fed to birds Generally second largest ash component in wood (~5-15%)
Mg Fed as a trace mineral Also in meat meal Generally the third largest ash component in wood (~3-9%)
Na In feed 10g per bird over lifetime, some retained Trace element in wood
P In feed for bone strength Generally ~1% of wood ash
S Not in the diet Generally ~1% of wood ash
Si In dirt, sand and water In wood ash
Cl Fed as trace mineral In water, extra added to poultry farm supply if experiencing health
issues
8.2 UNDESIRABLE ELEMENTS IN CEMENT KILNS
The exact alternative fuel standards and composition limits for a given kiln vary depending on the
cement plant and are usually trade secrets. However, a few examples have been published and
general guidelines are known about which elements in excess are harmful to cement product or
the kiln itself. For example, the alternative solid fuels used by the Lafarge Cement Polska group
in Poland must meet the following requirements (Folta 2010):
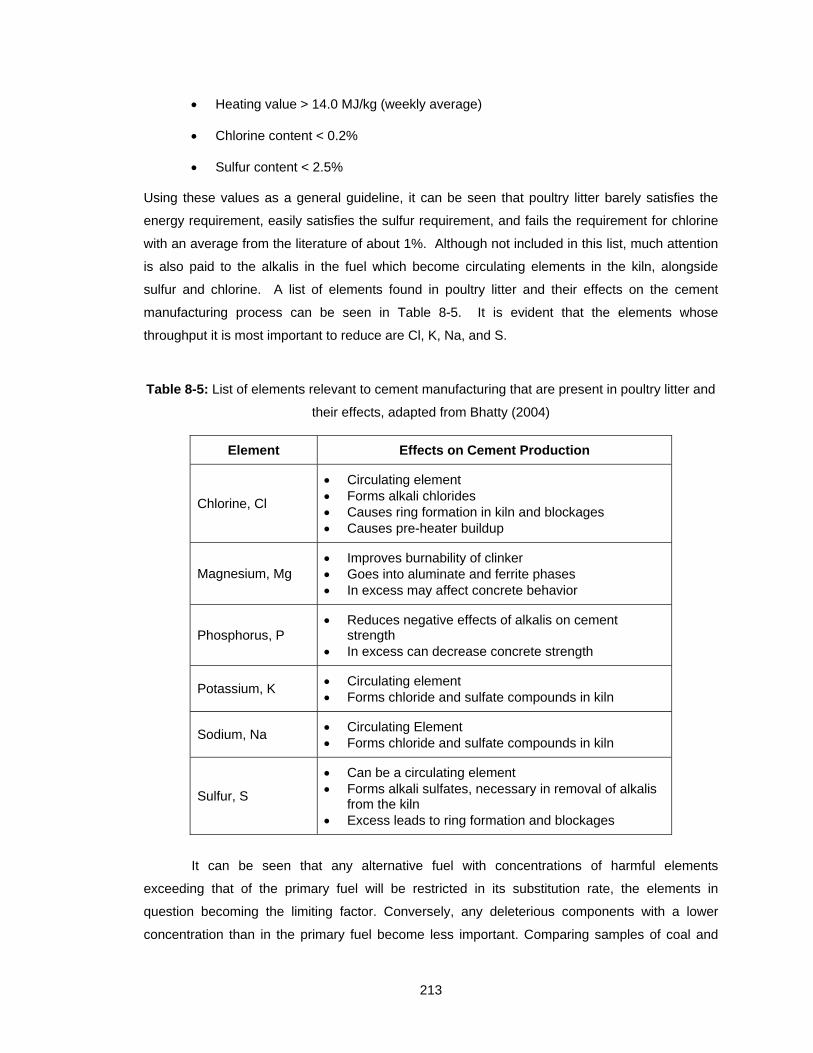
213
Heating value > 14.0 MJ/kg (weekly average)
Chlorine content < 0.2%
Sulfur content < 2.5%
Using these values as a general guideline, it can be seen that poultry litter barely satisfies the
energy requirement, easily satisfies the sulfur requirement, and fails the requirement for chlorine
with an average from the literature of about 1%. Although not included in this list, much attention
is also paid to the alkalis in the fuel which become circulating elements in the kiln, alongside
sulfur and chlorine. A list of elements found in poultry litter and their effects on the cement
manufacturing process can be seen in Table 8-5. It is evident that the elements whose
throughput it is most important to reduce are Cl, K, Na, and S.
Table 8-5: List of elements relevant to cement manufacturing that are present in poultry litter and
their effects, adapted from Bhatty (2004)
Element Effects on Cement Production
Chlorine, Cl
Circulating element Forms alkali chlorides Causes ring formation in kiln and blockages Causes pre-heater buildup
Magnesium, Mg Improves burnability of clinker Goes into aluminate and ferrite phases In excess may affect concrete behavior
Phosphorus, P Reduces negative effects of alkalis on cement
strength In excess can decrease concrete strength
Potassium, K Circulating element Forms chloride and sulfate compounds in kiln
Sodium, Na Circulating Element Forms chloride and sulfate compounds in kiln
Sulfur, S
Can be a circulating element Forms alkali sulfates, necessary in removal of alkalis
from the kiln Excess leads to ring formation and blockages
It can be seen that any alternative fuel with concentrations of harmful elements
exceeding that of the primary fuel will be restricted in its substitution rate, the elements in
question becoming the limiting factor. Conversely, any deleterious components with a lower
concentration than in the primary fuel become less important. Comparing samples of coal and
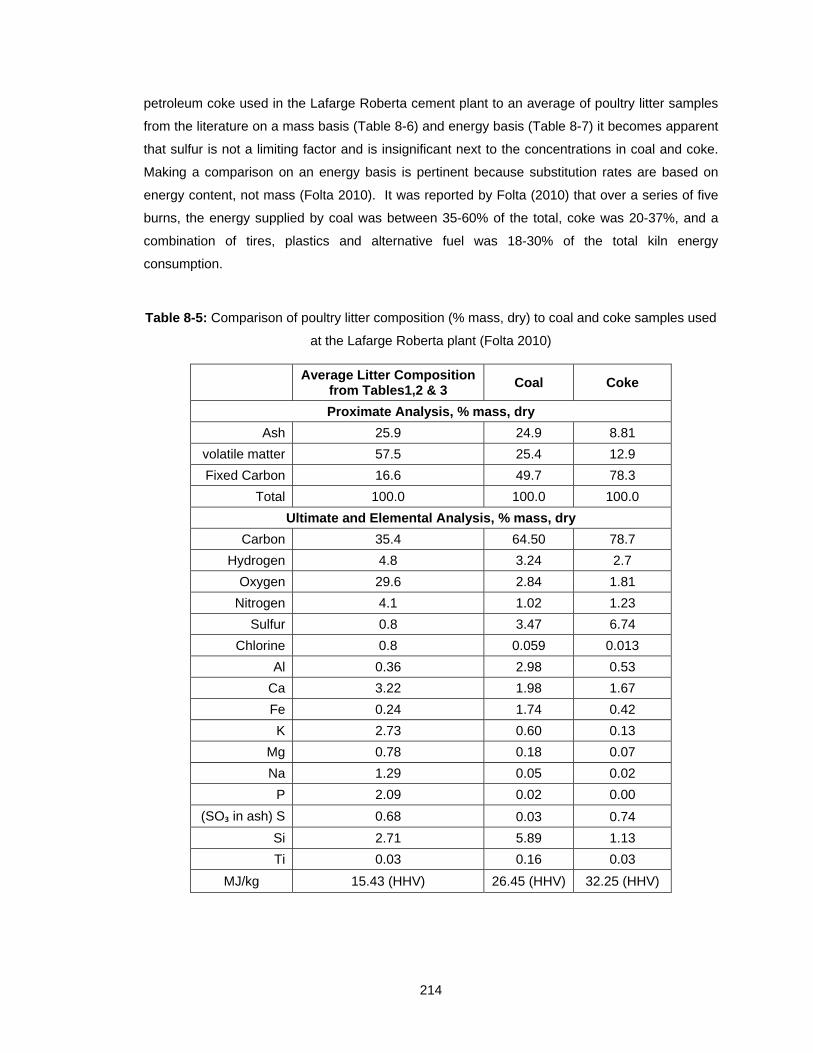
214
petroleum coke used in the Lafarge Roberta cement plant to an average of poultry litter samples
from the literature on a mass basis (Table 8-6) and energy basis (Table 8-7) it becomes apparent
that sulfur is not a limiting factor and is insignificant next to the concentrations in coal and coke.
Making a comparison on an energy basis is pertinent because substitution rates are based on
energy content, not mass (Folta 2010). It was reported by Folta (2010) that over a series of five
burns, the energy supplied by coal was between 35-60% of the total, coke was 20-37%, and a
combination of tires, plastics and alternative fuel was 18-30% of the total kiln energy
consumption.
Table 8-5: Comparison of poultry litter composition (% mass, dry) to coal and coke samples used
at the Lafarge Roberta plant (Folta 2010)
Average Litter Composition
from Tables1,2 & 3 Coal Coke
Proximate Analysis, % mass, dry
Ash 25.9 24.9 8.81
volatile matter 57.5 25.4 12.9
Fixed Carbon 16.6 49.7 78.3
Total 100.0 100.0 100.0
Ultimate and Elemental Analysis, % mass, dry
Carbon 35.4 64.50 78.7
Hydrogen 4.8 3.24 2.7
Oxygen 29.6 2.84 1.81
Nitrogen 4.1 1.02 1.23
Sulfur 0.8 3.47 6.74
Chlorine 0.8 0.059 0.013
Al 0.36 2.98 0.53
Ca 3.22 1.98 1.67
Fe 0.24 1.74 0.42
K 2.73 0.60 0.13
Mg 0.78 0.18 0.07
Na 1.29 0.05 0.02
P 2.09 0.02 0.00
(SO₃ in ash) S 0.68 0.03 0.74
Si 2.71 5.89 1.13
Ti 0.03 0.16 0.03
MJ/kg 15.43 (HHV) 26.45 (HHV) 32.25 (HHV)

215
Table 8-6: Comparison of poultry litter composition (g/MJ, dry) to coal and coke samples used at
the Lafarge Roberta plant (Folta 2010)
Average Litter Composition
from Tables1,2 & 3 Coal Coke
Proximate Analysis, g/MJ dry
Ash 16.79 9.41 2.73
volatile matter 37.27 9.60 4.00
Fixed Carbon 10.76 18.79 24.28
Total 64.81 37.81 31.01
Ultimate and Elemental Analysis, g/MJ dry
Carbon 22.94 24.39 24.40
Hydrogen 3.11 1.22 0.84
Oxygen 19.18 1.07 0.56
Nitrogen 2.66 0.39 0.38
Sulfur 0.52 1.31 2.09
Chlorine 0.52 0.022 0.004
Al 0.23 1.13 0.16
Ca 2.09 0.75 0.52
Fe 0.15 0.66 0.13
K 1.77 0.23 0.04
Mg 0.51 0.07 0.02
Na 0.83 0.02 0.01
P 1.36 0.01 0.00
(SO₃ in ash) S 0.44 0.01 0.23
Si 1.76 2.23 0.35
Ti 0.02 0.06 0.01
Having compared the composition of poultry litter to the standard fuels, observed an
example of limits, and examined the effects of certain elements on cement kilns, it becomes
evident that the most important components to limit introduction into the kiln are Chlorine,
Sodium, and Potassium. This study will focus on these elements, but attention will be paid to
other components previously mentioned as potentially harmful.
8.3 CHLORINE AND ALKALI RELEASE FROM BIOMASS UNDER GASIFICATION AND COMBUSTION
CONDITIONS
There is little documentation as to the study and quantification of the capture rates of the
unwanted constituents of interest to the cement manufacturing process by means of downdraft
gasification, especially with regards to poultry litter. However, some work has been done in
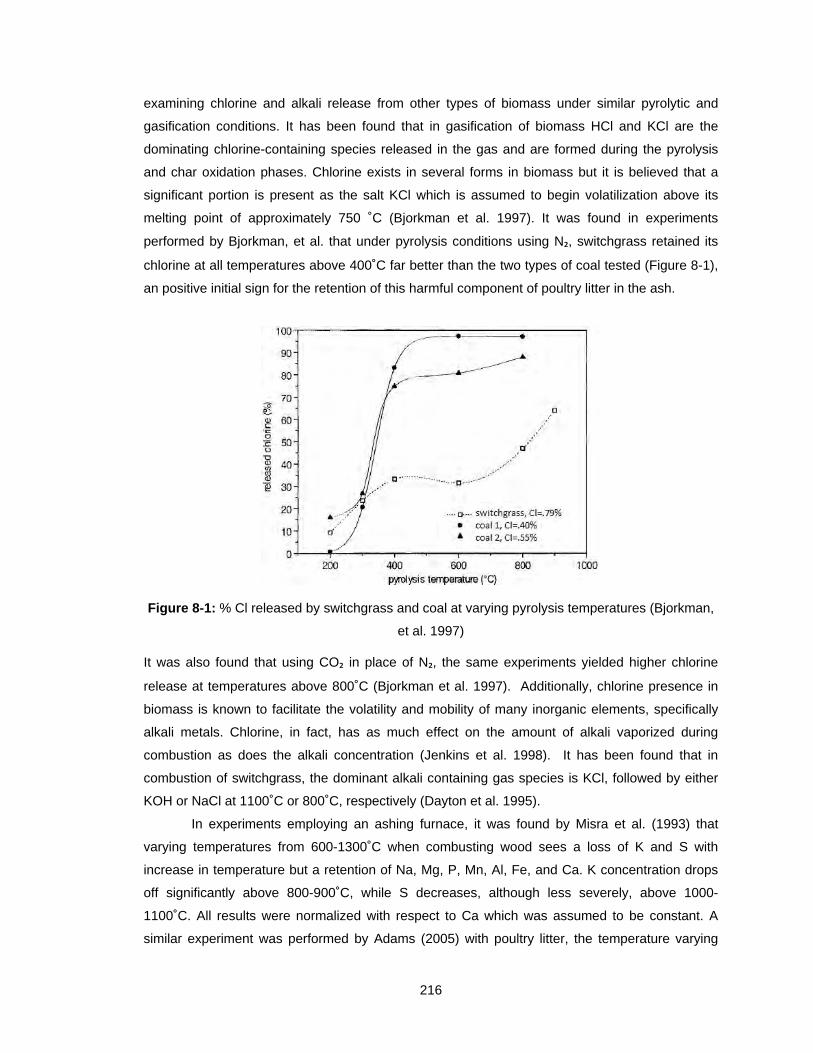
216
examining chlorine and alkali release from other types of biomass under similar pyrolytic and
gasification conditions. It has been found that in gasification of biomass HCl and KCl are the
dominating chlorine-containing species released in the gas and are formed during the pyrolysis
and char oxidation phases. Chlorine exists in several forms in biomass but it is believed that a
significant portion is present as the salt KCl which is assumed to begin volatilization above its
melting point of approximately 750 ˚C (Bjorkman et al. 1997). It was found in experiments
performed by Bjorkman, et al. that under pyrolysis conditions using N₂, switchgrass retained its
chlorine at all temperatures above 400˚C far better than the two types of coal tested (Figure 8-1),
an positive initial sign for the retention of this harmful component of poultry litter in the ash.
Figure 8-1: % Cl released by switchgrass and coal at varying pyrolysis temperatures (Bjorkman,
et al. 1997)
It was also found that using CO₂ in place of N₂, the same experiments yielded higher chlorine
release at temperatures above 800˚C (Bjorkman et al. 1997). Additionally, chlorine presence in
biomass is known to facilitate the volatility and mobility of many inorganic elements, specifically
alkali metals. Chlorine, in fact, has as much effect on the amount of alkali vaporized during
combustion as does the alkali concentration (Jenkins et al. 1998). It has been found that in
combustion of switchgrass, the dominant alkali containing gas species is KCl, followed by either
KOH or NaCl at 1100˚C or 800˚C, respectively (Dayton et al. 1995).
In experiments employing an ashing furnace, it was found by Misra et al. (1993) that
varying temperatures from 600-1300˚C when combusting wood sees a loss of K and S with
increase in temperature but a retention of Na, Mg, P, Mn, Al, Fe, and Ca. K concentration drops
off significantly above 800-900˚C, while S decreases, although less severely, above 1000-
1100˚C. All results were normalized with respect to Ca which was assumed to be constant. A
similar experiment was performed by Adams (2005) with poultry litter, the temperature varying
217
from 450-1000˚C. Sulfur was not analyzed and different results were found. K, Na, Mg, Al, Fe,
and Mn all decreased with increasing temperature, K the most severe. However, P and Ca were
still retained.
8.4 GASIFICATION OF POULTRY LITTER
In the literature, gasification trials using poultry litter have been run in both bench-scale and pilot-
scale arrangements with varying degrees of success. In all cases slagging or clinkering (fusion) of
the poultry litter during gasification was an issue that had to be addressed (Reardon et al. 2001;
Schaffer 2006; Priyadarsan et al. 2004). It was found by Community Power Corporation (CPC)
that using pelletized litter with reduced moisture and limiting the superficial velocity (volume flow
rate of gas produced/gasifier cross-sectional area, measured in m/s) of the gasifier provided the
best results in a bench-scale downdraft gasifier. This is said to control the temperature at the
pyrolysis front, and without these measures, clinker formation was an issue. A pilot scale trial
using 12.5% moisture pellets was run for 5 hours, producing 45 Nm³/hr (Normal m³/hr at 0˚C,
101.3 kPa) of syngas with a lower heating value of 4.79 MJ/Nm³. However, no mention was
made of the state of the gasifier char remaining upon completion of the run, as to whether fusion
occurred or not (Reardon et al. 2001). In another study, using a fixed-bed, counter-current updraft
gasifier, in which the fuel entry and syngas exit is at the top and oxidizer entry is at the bottom, it
was found that gasifying pure poultry litter resulted in a large agglomeration forming inside the
gasifier. However, mixing the poultry litter with a fuel less prone to slagging, cow manure, in a
50:50 weight ratio char fusion was negligible (Priyadarsan et al. 2004).
8.5 REASONS FOR CLINKER FORMATION AND POSSIBLE SOLUTIONS
The clinkering problems encountered when gasifying poultry litter are attributed the interaction
between the alkali metals, chlorine, and silica present in the fuel (Bjorkman et al. 1997; Jenkins et
al. 1998). The root of the problem is thought to be caused by either one or both of two reactions.
The first is the formation of alkali silicates from a reaction of alkali metals and silica. Alkali
silicates can soften or melt at temperatures as low as 700˚C depending on the composition, and
most poultry litter is high in both alkalis (K and Na) and silica (SiO₂). The second is the formation
of alkali sulfates from alkali and sulfur (Jenkins et al. 1998). As mentioned previously, chlorine
aids immensely in the volatilization and transport of alkalis, particularly potassium, conveying
them to surfaces where ash deposition occurs (Jenkins et al. 1998). Potential solutions to this
problem are co-gasification with other fuels, temperature reduction, and, as suggested by several
sources, addition of up to 5% limestone or dolomite (Bock 2004; Reardon et al. 2001; Coda et al.
2001).
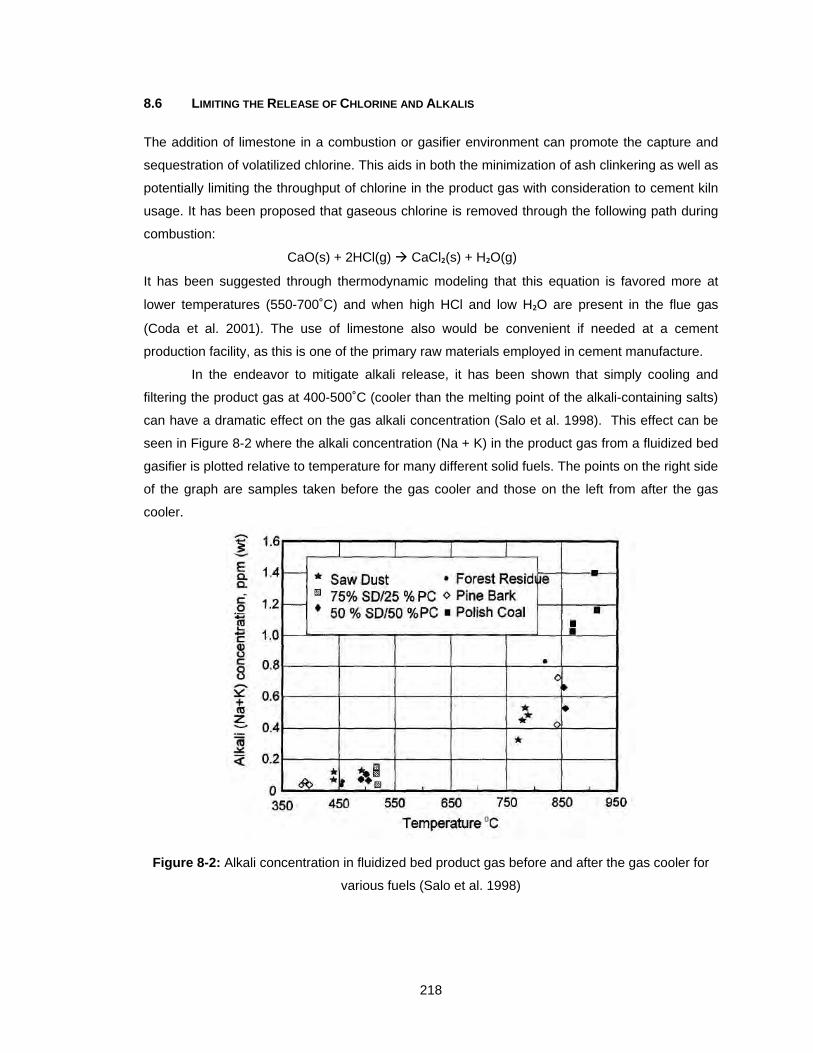
218
8.6 LIMITING THE RELEASE OF CHLORINE AND ALKALIS
The addition of limestone in a combustion or gasifier environment can promote the capture and
sequestration of volatilized chlorine. This aids in both the minimization of ash clinkering as well as
potentially limiting the throughput of chlorine in the product gas with consideration to cement kiln
usage. It has been proposed that gaseous chlorine is removed through the following path during
combustion:
CaO(s) + 2HCl(g) CaCl₂(s) + H₂O(g)
It has been suggested through thermodynamic modeling that this equation is favored more at
lower temperatures (550-700˚C) and when high HCl and low H₂O are present in the flue gas
(Coda et al. 2001). The use of limestone also would be convenient if needed at a cement
production facility, as this is one of the primary raw materials employed in cement manufacture.
In the endeavor to mitigate alkali release, it has been shown that simply cooling and
filtering the product gas at 400-500˚C (cooler than the melting point of the alkali-containing salts)
can have a dramatic effect on the gas alkali concentration (Salo et al. 1998). This effect can be
seen in Figure 8-2 where the alkali concentration (Na + K) in the product gas from a fluidized bed
gasifier is plotted relative to temperature for many different solid fuels. The points on the right side
of the graph are samples taken before the gas cooler and those on the left from after the gas
cooler.
Figure 8-2: Alkali concentration in fluidized bed product gas before and after the gas cooler for
various fuels (Salo et al. 1998)
219
In this study, various experiments were performed initially utilizing methods drawn from
the literature as well as methods devised based on known fuel characteristics in an attempt to
inhibit the fusion of the poultry litter during gasification in order to consistently gasify it (Sections
9.2.1 and 9.1). Specifically, trials were run experimenting with dilution of the fuel using non-
sintering material, attempting to lower the average gasifier temperature using flue gas
recirculation, and utilizing limestone as an anti-fusion and potential chlorine-capturing additive.
This was done with the end goal of quantifying the alkali, chlorine and other potentially interesting
elements released in the gasification of poultry litter, and as such, attention was paid to these
properties along the way.
The next set of experiments in this study were performed to actually quantify the
contaminant retention and sequestration garnered by the use of a gasifier while extracting the
chemical energy from poultry litter (Sections 9.2.2 and 10.2).
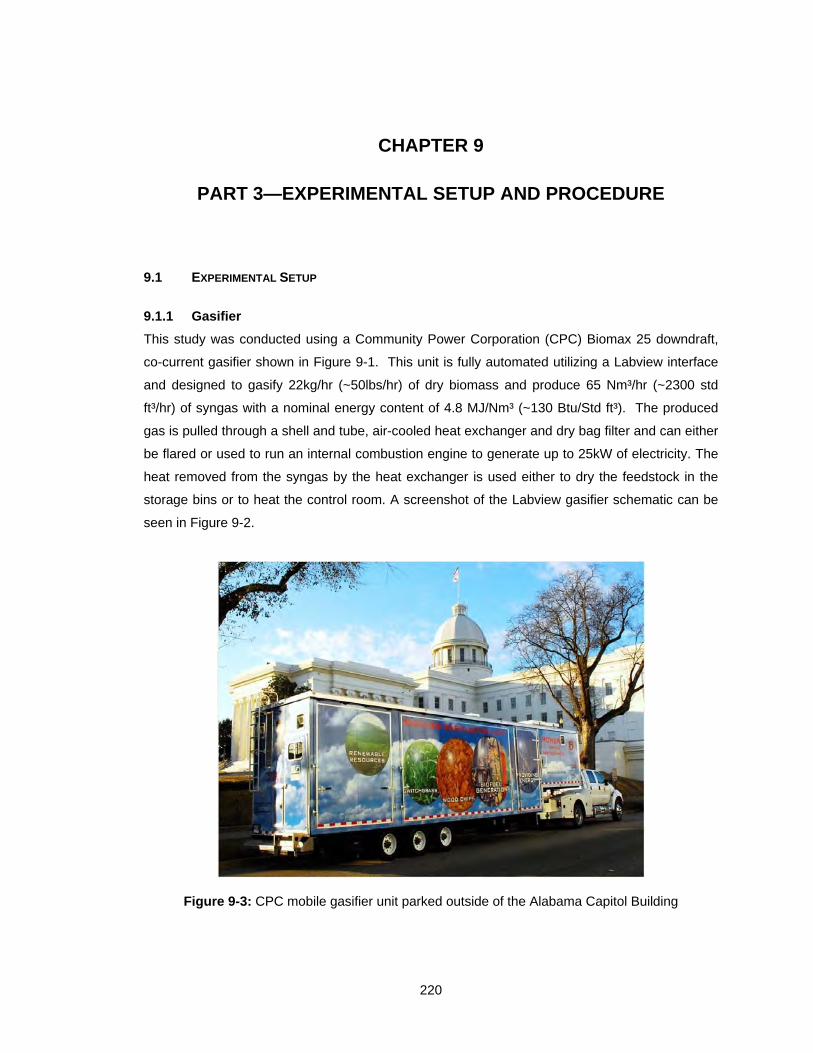
220
CHAPTER 9
PART 3—EXPERIMENTAL SETUP AND PROCEDURE
9.1 EXPERIMENTAL SETUP
9.1.1 Gasifier
This study was conducted using a Community Power Corporation (CPC) Biomax 25 downdraft,
co-current gasifier shown in Figure 9-1. This unit is fully automated utilizing a Labview interface
and designed to gasify 22kg/hr (~50lbs/hr) of dry biomass and produce 65 Nm³/hr (~2300 std
ft³/hr) of syngas with a nominal energy content of 4.8 MJ/Nm³ (~130 Btu/Std ft³). The produced
gas is pulled through a shell and tube, air-cooled heat exchanger and dry bag filter and can either
be flared or used to run an internal combustion engine to generate up to 25kW of electricity. The
heat removed from the syngas by the heat exchanger is used either to dry the feedstock in the
storage bins or to heat the control room. A screenshot of the Labview gasifier schematic can be
seen in Figure 9-2.
Figure 9-3: CPC mobile gasifier unit parked outside of the Alabama Capitol Building
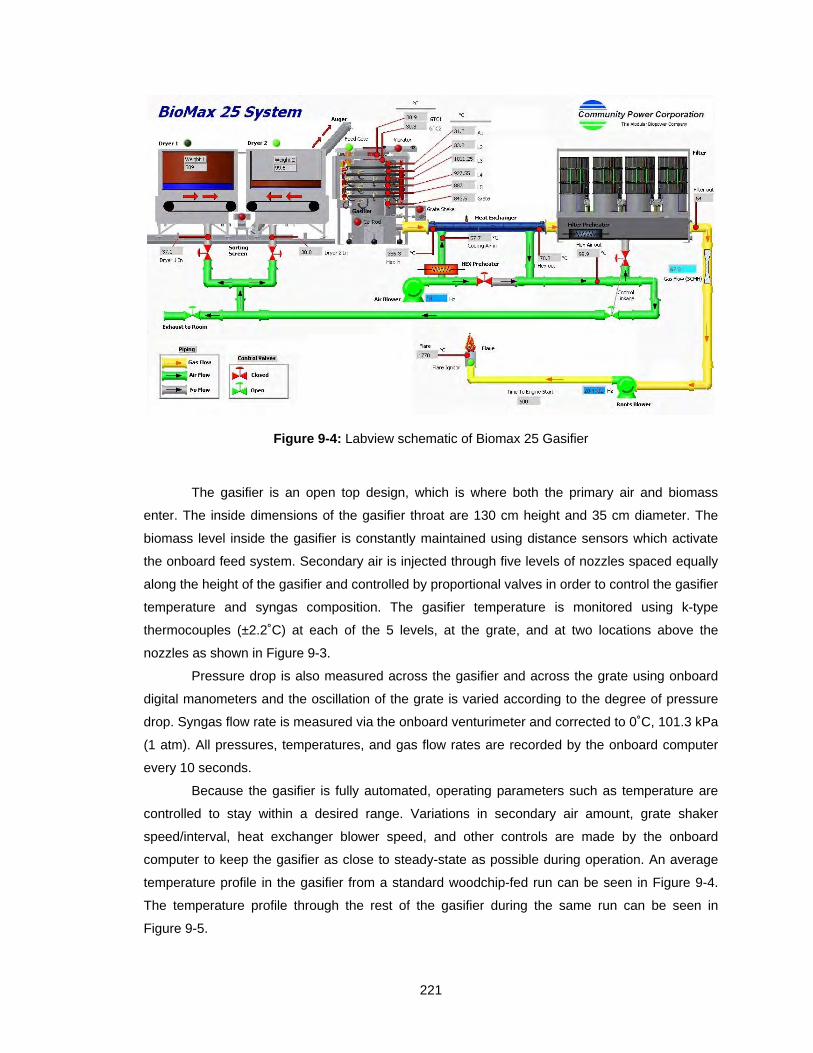
221
Figure 9-4: Labview schematic of Biomax 25 Gasifier
The gasifier is an open top design, which is where both the primary air and biomass
enter. The inside dimensions of the gasifier throat are 130 cm height and 35 cm diameter. The
biomass level inside the gasifier is constantly maintained using distance sensors which activate
the onboard feed system. Secondary air is injected through five levels of nozzles spaced equally
along the height of the gasifier and controlled by proportional valves in order to control the gasifier
temperature and syngas composition. The gasifier temperature is monitored using k-type
thermocouples (±2.2˚C) at each of the 5 levels, at the grate, and at two locations above the
nozzles as shown in Figure 9-3.
Pressure drop is also measured across the gasifier and across the grate using onboard
digital manometers and the oscillation of the grate is varied according to the degree of pressure
drop. Syngas flow rate is measured via the onboard venturimeter and corrected to 0˚C, 101.3 kPa
(1 atm). All pressures, temperatures, and gas flow rates are recorded by the onboard computer
every 10 seconds.
Because the gasifier is fully automated, operating parameters such as temperature are
controlled to stay within a desired range. Variations in secondary air amount, grate shaker
speed/interval, heat exchanger blower speed, and other controls are made by the onboard
computer to keep the gasifier as close to steady-state as possible during operation. An average
temperature profile in the gasifier from a standard woodchip-fed run can be seen in Figure 9-4.
The temperature profile through the rest of the gasifier during the same run can be seen in
Figure 9-5.
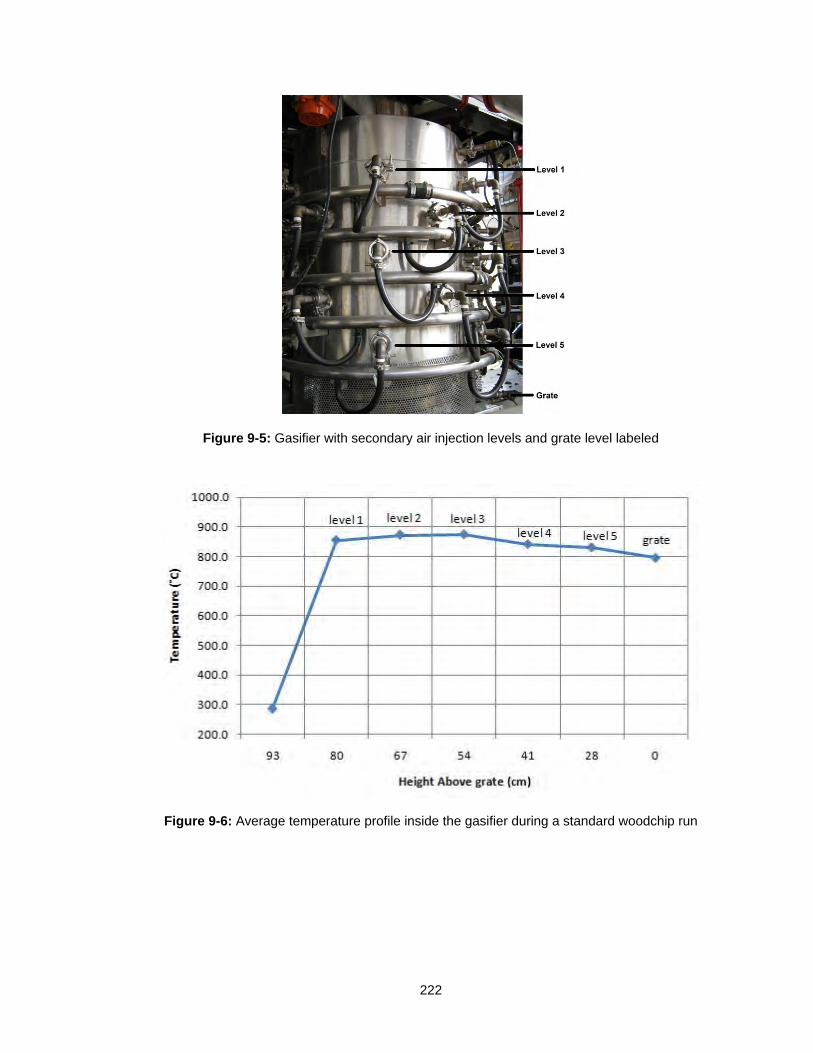
222
Figure 9-5: Gasifier with secondary air injection levels and grate level labeled
Figure 9-6: Average temperature profile inside the gasifier during a standard woodchip run
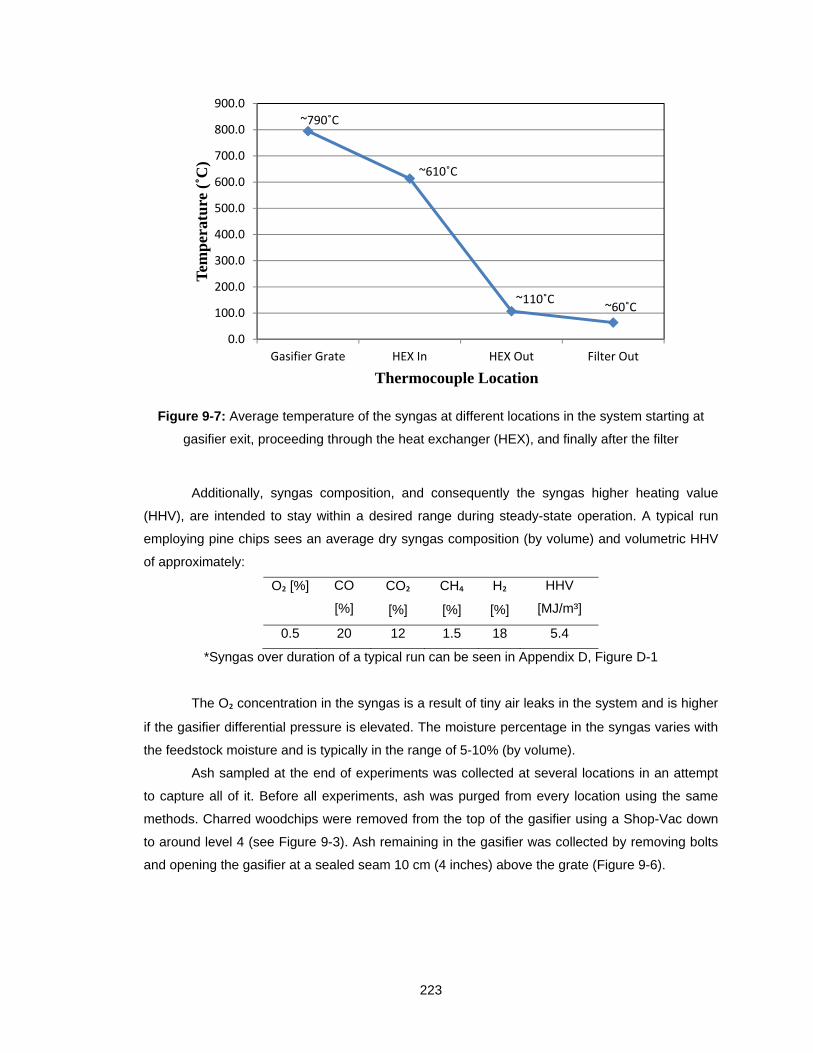
223
Figure 9-7: Average temperature of the syngas at different locations in the system starting at
gasifier exit, proceeding through the heat exchanger (HEX), and finally after the filter
Additionally, syngas composition, and consequently the syngas higher heating value
(HHV), are intended to stay within a desired range during steady-state operation. A typical run
employing pine chips sees an average dry syngas composition (by volume) and volumetric HHV
of approximately:
O₂ [%] CO
[%]
CO₂
[%]
CH₄
[%]
H₂
[%]
HHV
[MJ/m³]
0.5 20 12 1.5 18 5.4
*Syngas over duration of a typical run can be seen in Appendix D, Figure D-1
The O₂ concentration in the syngas is a result of tiny air leaks in the system and is higher
if the gasifier differential pressure is elevated. The moisture percentage in the syngas varies with
the feedstock moisture and is typically in the range of 5-10% (by volume).
Ash sampled at the end of experiments was collected at several locations in an attempt
to capture all of it. Before all experiments, ash was purged from every location using the same
methods. Charred woodchips were removed from the top of the gasifier using a Shop-Vac down
to around level 4 (see Figure 9-3). Ash remaining in the gasifier was collected by removing bolts
and opening the gasifier at a sealed seam 10 cm (4 inches) above the grate (Figure 9-6).
~790˚C
~610˚C
~110˚C~60˚C
0.0
100.0
200.0
300.0
400.0
500.0
600.0
700.0
800.0
900.0
Gasifier Grate HEX In HEX Out Filter Out
Tem
per
atu
re (
˚C)
Thermocouple Location
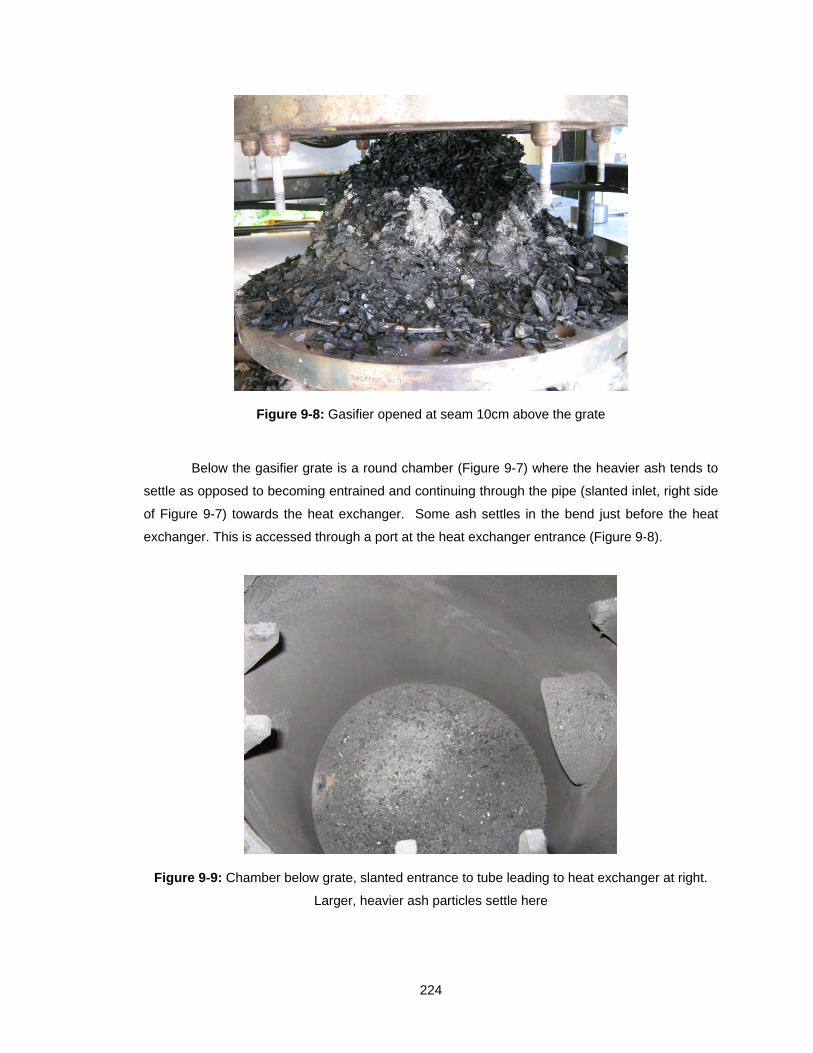
224
Figure 9-8: Gasifier opened at seam 10cm above the grate
Below the gasifier grate is a round chamber (Figure 9-7) where the heavier ash tends to
settle as opposed to becoming entrained and continuing through the pipe (slanted inlet, right side
of Figure 9-7) towards the heat exchanger. Some ash settles in the bend just before the heat
exchanger. This is accessed through a port at the heat exchanger entrance (Figure 9-8).
Figure 9-9: Chamber below grate, slanted entrance to tube leading to heat exchanger at right.
Larger, heavier ash particles settle here
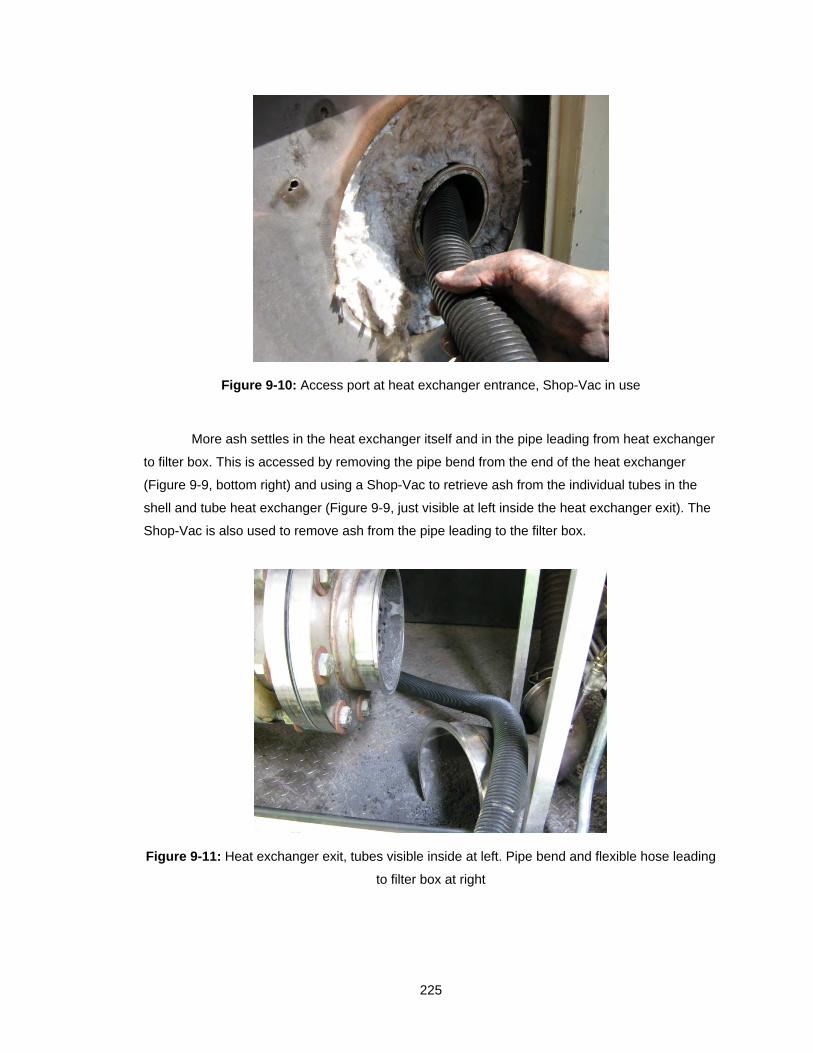
225
Figure 9-10: Access port at heat exchanger entrance, Shop-Vac in use
More ash settles in the heat exchanger itself and in the pipe leading from heat exchanger
to filter box. This is accessed by removing the pipe bend from the end of the heat exchanger
(Figure 9-9, bottom right) and using a Shop-Vac to retrieve ash from the individual tubes in the
shell and tube heat exchanger (Figure 9-9, just visible at left inside the heat exchanger exit). The
Shop-Vac is also used to remove ash from the pipe leading to the filter box.
Figure 9-11: Heat exchanger exit, tubes visible inside at left. Pipe bend and flexible hose leading
to filter box at right
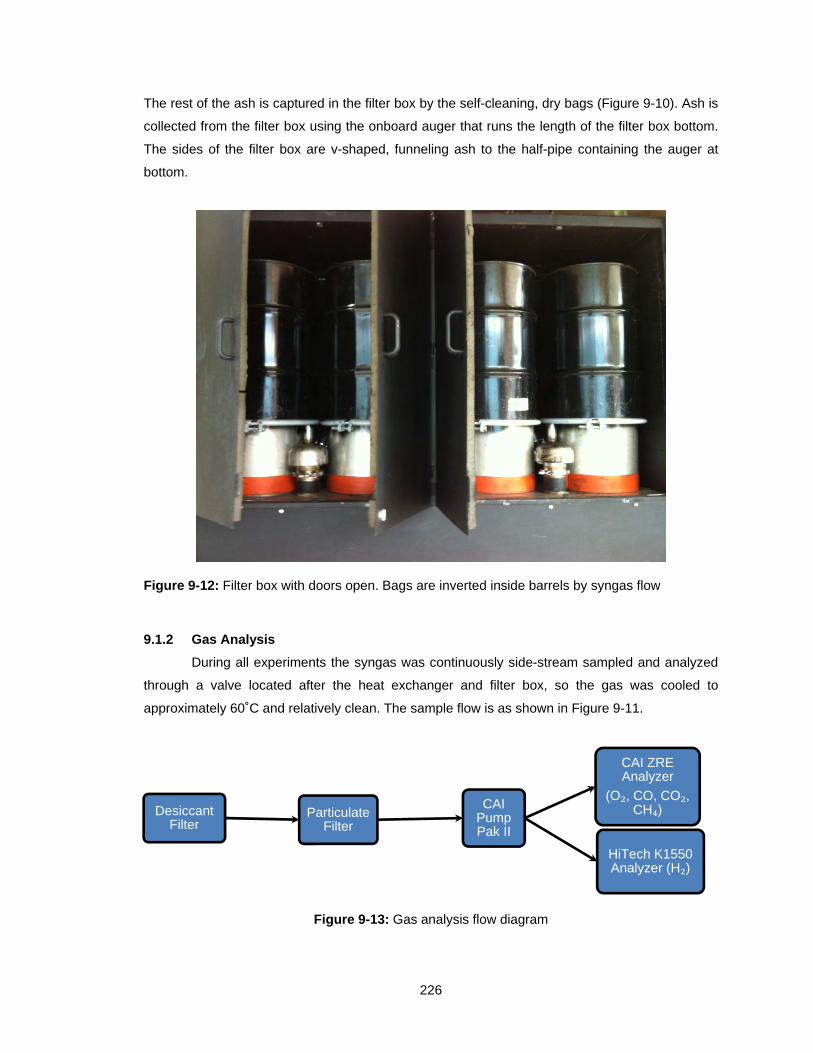
226
The rest of the ash is captured in the filter box by the self-cleaning, dry bags (Figure 9-10). Ash is
collected from the filter box using the onboard auger that runs the length of the filter box bottom.
The sides of the filter box are v-shaped, funneling ash to the half-pipe containing the auger at
bottom.
Figure 9-12: Filter box with doors open. Bags are inverted inside barrels by syngas flow
9.1.2 Gas Analysis
During all experiments the syngas was continuously side-stream sampled and analyzed
through a valve located after the heat exchanger and filter box, so the gas was cooled to
approximately 60˚C and relatively clean. The sample flow is as shown in Figure 9-11.
Figure 9-13: Gas analysis flow diagram
Desiccant Filter
Particulate Filter
CAI Pump Pak II
CAI ZRE Analyzer
(O₂, CO, CO₂, CH₄)
HiTech K1550 Analyzer (H₂)
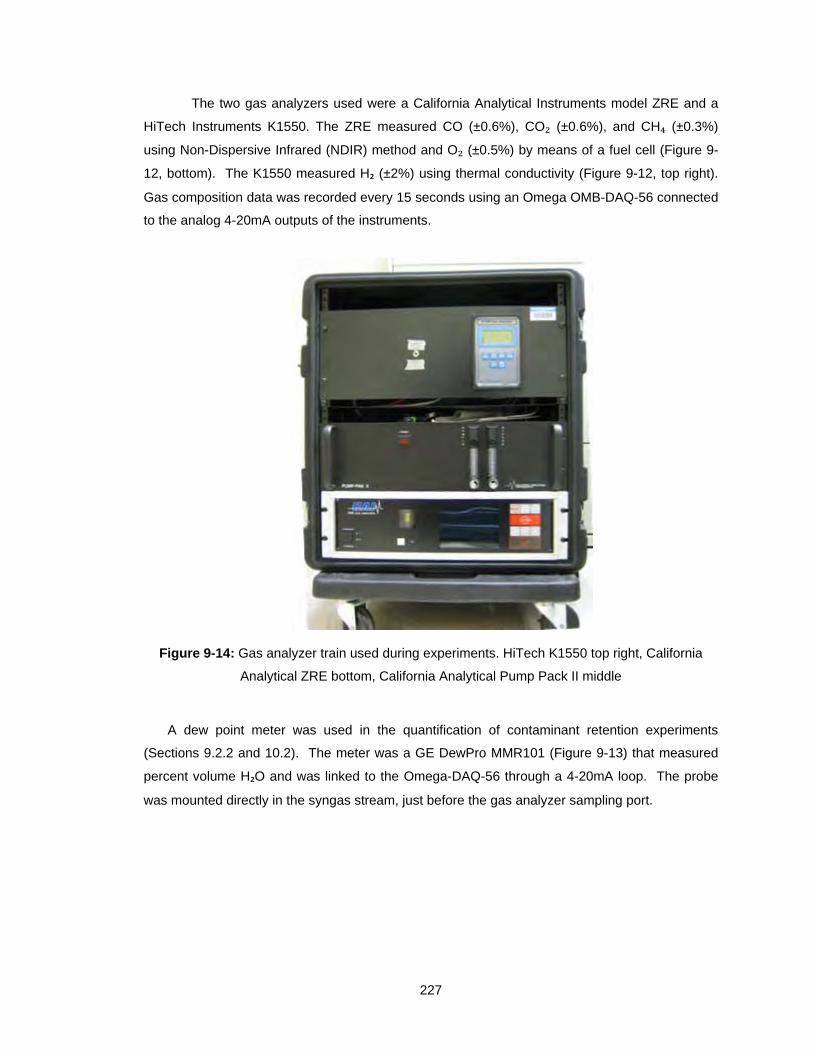
227
The two gas analyzers used were a California Analytical Instruments model ZRE and a
HiTech Instruments K1550. The ZRE measured CO (±0.6%), CO₂ (±0.6%), and CH₄ (±0.3%)
using Non-Dispersive Infrared (NDIR) method and O₂ (±0.5%) by means of a fuel cell (Figure 9-
12, bottom). The K1550 measured H₂ (±2%) using thermal conductivity (Figure 9-12, top right).
Gas composition data was recorded every 15 seconds using an Omega OMB-DAQ-56 connected
to the analog 4-20mA outputs of the instruments.
Figure 9-14: Gas analyzer train used during experiments. HiTech K1550 top right, California
Analytical ZRE bottom, California Analytical Pump Pack II middle
A dew point meter was used in the quantification of contaminant retention experiments
(Sections 9.2.2 and 10.2). The meter was a GE DewPro MMR101 (Figure 9-13) that measured
percent volume H₂O and was linked to the Omega-DAQ-56 through a 4-20mA loop. The probe
was mounted directly in the syngas stream, just before the gas analyzer sampling port.
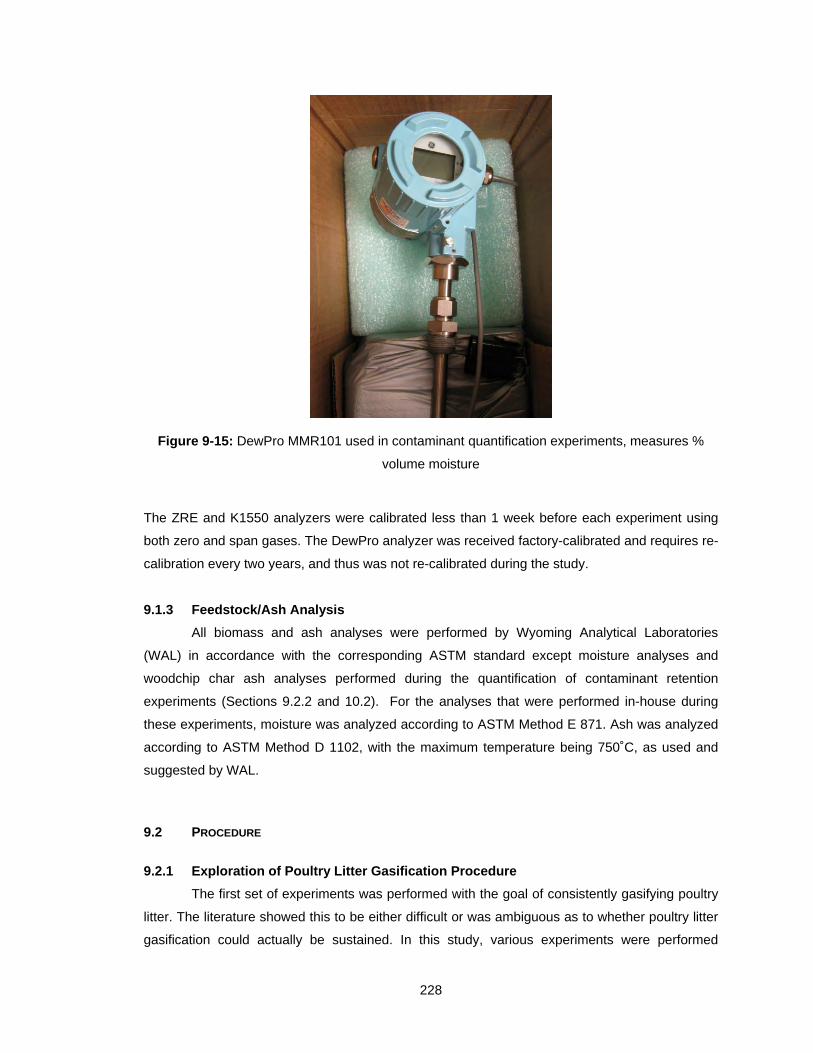
228
Figure 9-15: DewPro MMR101 used in contaminant quantification experiments, measures %
volume moisture
The ZRE and K1550 analyzers were calibrated less than 1 week before each experiment using
both zero and span gases. The DewPro analyzer was received factory-calibrated and requires re-
calibration every two years, and thus was not re-calibrated during the study.
9.1.3 Feedstock/Ash Analysis
All biomass and ash analyses were performed by Wyoming Analytical Laboratories
(WAL) in accordance with the corresponding ASTM standard except moisture analyses and
woodchip char ash analyses performed during the quantification of contaminant retention
experiments (Sections 9.2.2 and 10.2). For the analyses that were performed in-house during
these experiments, moisture was analyzed according to ASTM Method E 871. Ash was analyzed
according to ASTM Method D 1102, with the maximum temperature being 750˚C, as used and
suggested by WAL.
9.2 PROCEDURE
9.2.1 Exploration of Poultry Litter Gasification Procedure
The first set of experiments was performed with the goal of consistently gasifying poultry
litter. The literature showed this to be either difficult or was ambiguous as to whether poultry litter
gasification could actually be sustained. In this study, various experiments were performed
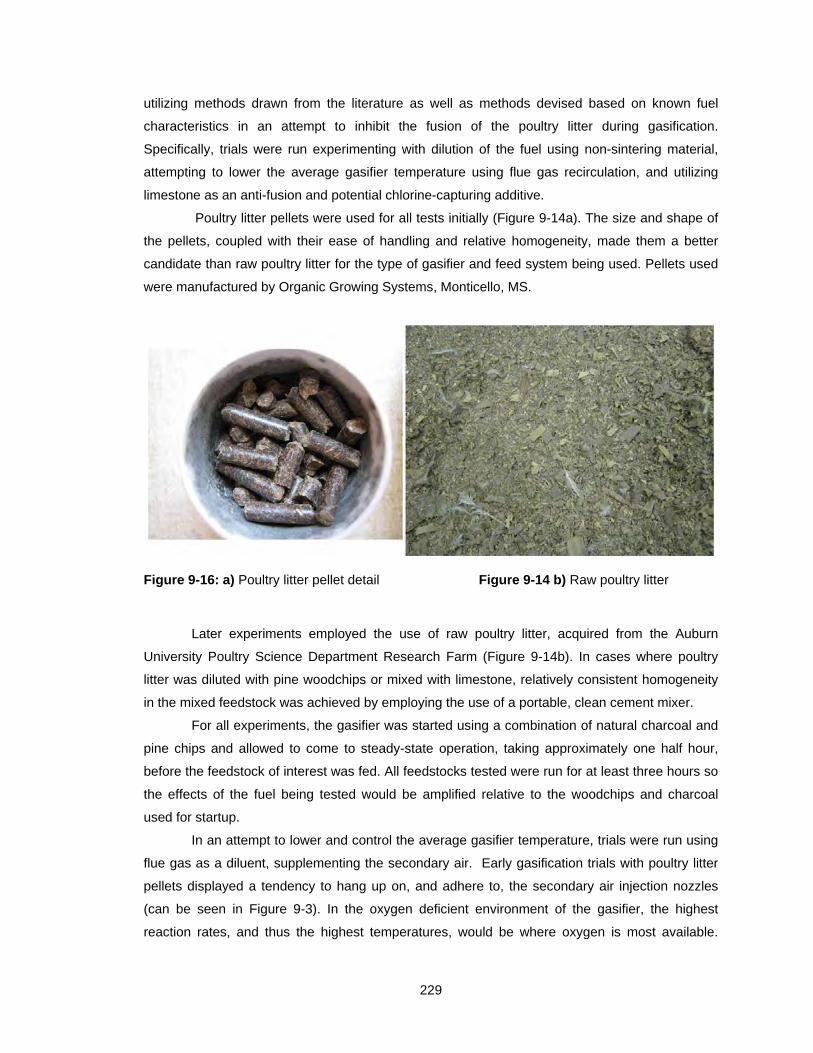
229
utilizing methods drawn from the literature as well as methods devised based on known fuel
characteristics in an attempt to inhibit the fusion of the poultry litter during gasification.
Specifically, trials were run experimenting with dilution of the fuel using non-sintering material,
attempting to lower the average gasifier temperature using flue gas recirculation, and utilizing
limestone as an anti-fusion and potential chlorine-capturing additive.
Poultry litter pellets were used for all tests initially (Figure 9-14a). The size and shape of
the pellets, coupled with their ease of handling and relative homogeneity, made them a better
candidate than raw poultry litter for the type of gasifier and feed system being used. Pellets used
were manufactured by Organic Growing Systems, Monticello, MS.
Figure 9-16: a) Poultry litter pellet detail Figure 9-14 b) Raw poultry litter
Later experiments employed the use of raw poultry litter, acquired from the Auburn
University Poultry Science Department Research Farm (Figure 9-14b). In cases where poultry
litter was diluted with pine woodchips or mixed with limestone, relatively consistent homogeneity
in the mixed feedstock was achieved by employing the use of a portable, clean cement mixer.
For all experiments, the gasifier was started using a combination of natural charcoal and
pine chips and allowed to come to steady-state operation, taking approximately one half hour,
before the feedstock of interest was fed. All feedstocks tested were run for at least three hours so
the effects of the fuel being tested would be amplified relative to the woodchips and charcoal
used for startup.
In an attempt to lower and control the average gasifier temperature, trials were run using
flue gas as a diluent, supplementing the secondary air. Early gasification trials with poultry litter
pellets displayed a tendency to hang up on, and adhere to, the secondary air injection nozzles
(can be seen in Figure 9-3). In the oxygen deficient environment of the gasifier, the highest
reaction rates, and thus the highest temperatures, would be where oxygen is most available.
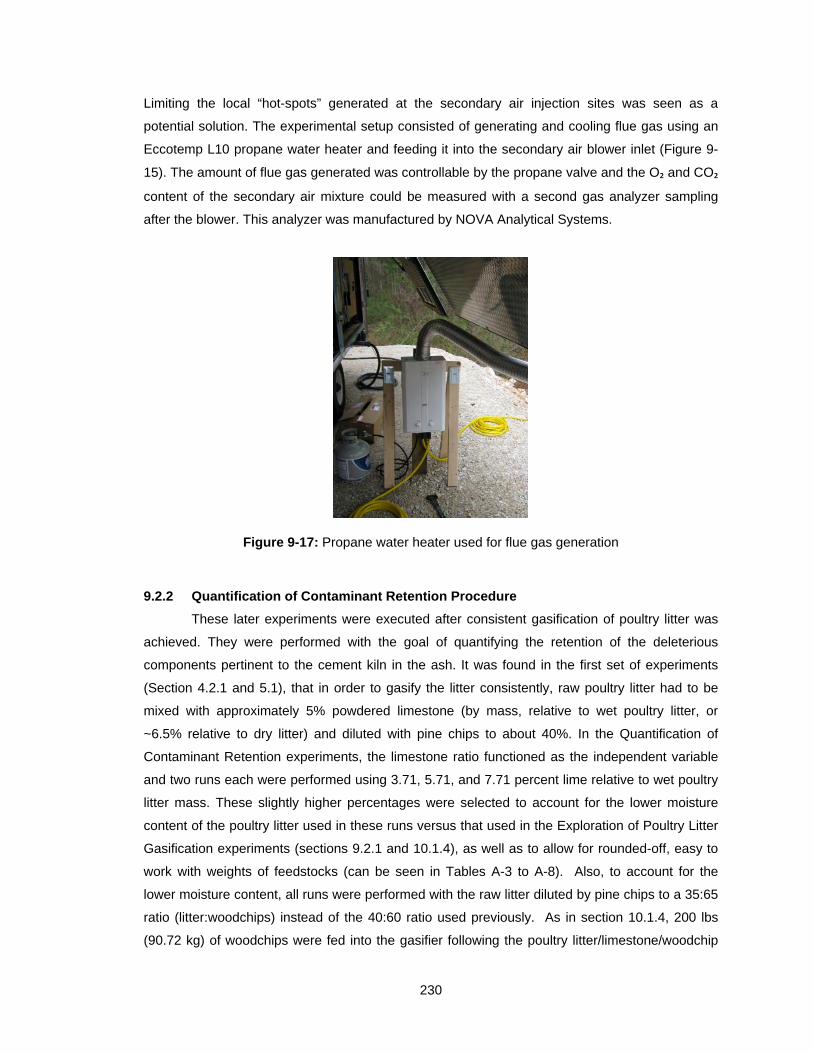
230
Limiting the local “hot-spots” generated at the secondary air injection sites was seen as a
potential solution. The experimental setup consisted of generating and cooling flue gas using an
Eccotemp L10 propane water heater and feeding it into the secondary air blower inlet (Figure 9-
15). The amount of flue gas generated was controllable by the propane valve and the O₂ and CO₂
content of the secondary air mixture could be measured with a second gas analyzer sampling
after the blower. This analyzer was manufactured by NOVA Analytical Systems.
Figure 9-17: Propane water heater used for flue gas generation
9.2.2 Quantification of Contaminant Retention Procedure
These later experiments were executed after consistent gasification of poultry litter was
achieved. They were performed with the goal of quantifying the retention of the deleterious
components pertinent to the cement kiln in the ash. It was found in the first set of experiments
(Section 4.2.1 and 5.1), that in order to gasify the litter consistently, raw poultry litter had to be
mixed with approximately 5% powdered limestone (by mass, relative to wet poultry litter, or
~6.5% relative to dry litter) and diluted with pine chips to about 40%. In the Quantification of
Contaminant Retention experiments, the limestone ratio functioned as the independent variable
and two runs each were performed using 3.71, 5.71, and 7.71 percent lime relative to wet poultry
litter mass. These slightly higher percentages were selected to account for the lower moisture
content of the poultry litter used in these runs versus that used in the Exploration of Poultry Litter
Gasification experiments (sections 9.2.1 and 10.1.4), as well as to allow for rounded-off, easy to
work with weights of feedstocks (can be seen in Tables A-3 to A-8). Also, to account for the
lower moisture content, all runs were performed with the raw litter diluted by pine chips to a 35:65
ratio (litter:woodchips) instead of the 40:60 ratio used previously. As in section 10.1.4, 200 lbs
(90.72 kg) of woodchips were fed into the gasifier following the poultry litter/limestone/woodchip
231
mixture to ensure complete gasification of the fuel of interest. Despite this excess biomass,
poultry litter would still be dominant source of the chlorine and alkali components in the resulting
gasifier char due to the low ash content of the woodchips. All char produced was collected,
sampled, and sent for analysis after every experiment. These analyses were then compared in a
mass balance to the composition of the incoming feedstocks to determine the retention rate of
contaminants pertinent to cement kilns. Additionally, char from three of the experiments was
sampled and analyzed by location from the heat exchanger, filter box, and below the gasifier
grate in order to examine the effects of temperature variation on char composition.
Preliminary preparation consisted of acquiring a large amount of raw poultry litter from
the Auburn Poultry Science Research Farm from the same pile and mixing well for batch
homogeneity. This batch would be used for all runs. A consistent, homogeneous batch of pine
woodchips was also delivered and used for all runs. Powdered limestone and natural charcoal
were purchased by the bag and are assumed to be consistent in composition from bag to bag.
Poultry litter, woodchip, and charcoal samples were taken and sent to Wyoming Analytical to
have proximate, ultimate, chlorine, Btu, and ash analyses performed. A sample of limestone was
sent to WAL to have an ash analysis performed.
The following setup was consistent between experiments, the only variable being
limestone percentage:
Prior to each experiment, the gasifier system was purged using a Shop-Vac and the
onboard auger, as shown in Section 9.1.1.
The feedstock mixture was prepared using a cement mixer, weights measured with an
electronic scale. First all the litter and lime were mixed separately, then added to the
woodchips in the following amounts:
o 130 lbs (58.97 kg) pine woodchips
o 70 lbs (31.75 kg) raw poultry litter
o 2.6/4/5.4 lbs (1.17/1.81/2.45 kg) powdered limestone
200 lbs (90.72 kg) of woodchips were weighed, to be fed after the poultry litter mixture in
order for the litter to fully gasify
The gasifier was filled to level 1 with charcoal from a bag, the weight taken before and
after, and the difference recorded as the charcoal weight
The gasifier was filled the rest of the way with woodchips, the weight recorded
o Woodchips were kept at ready to be fed as the gasifier warmed up until the
poultry litter mixture was fed

232
Representative samples were collected and analyzed for moisture content, according to
ASTM E 871:
o Charcoal
o Warm-up Woodchips
o Poultry Litter
o Woodchips mixed with poultry litter/Woodchips fed after poultry litter mix (same
batch used for both)
The following procedure was consistent between experiments:
The gasifier was started, buckets of woodchips weighed, recorded, and added to
maintain proper level in the gasifier until temperatures reached steady state
When the gasifier operation reached steady state (about one half hour after starting), the
poultry litter/limestone/woodchip mixture was started feeding (automatically, by the feed
system)
o The time was recorded when the first bit of the mixture dropped into the gasifier
o The time was recorded when the last bit of the mixture dropped into the gasifier
After the last of the mixture was fed, the 200 lbs of woodchips were started feeding using
the automatic feed system
o The woodchips and poultry litter chunks that (together with associated limestone
percentage) that were sorted by the sorting screen were separated and weighed
to be subtracted from the input amount
After the last of the 200 lbs of woodchips were fed, the flame front was allowed to
advance to the top, charring all the raw chips and consuming any remaining moisture. As
soon as this occurred, the gasifier was turned off, sealed and allowed to cool overnight.
o Woodchips that were sorted by the sorting screen were weighed and recorded to
be subtracted from the 200 lb total
The following data collection methods were consistent between experiments:
233
Syngas was side stream sampled, dried, analyzed, and recorded continuously from the
first steady-state before litter/limestone/woodchip addition until end of run for: O₂, CO,
CO₂, CH₄, and H₂
Moisture of syngas was probe monitored and recorded continuously
Gasifier performance data was recorded by the onboard computer continuously
At least 24 hours after every experiment (to allow cool-down), ash was collected from the
various collection points (Section 9.1.1), weighed, and sampled.
o The char from the 200 lbs of woodchips was collected from the top of the gasifier,
down to level 5, and labeled ‘Woodchip Char’
o The rest of the gasifier char was collected (Figure 9-6), sample labeled ‘Rest of
Gasifier’. The gray, amorphous poultry litter/limestone ash was separated by
hand for the first three runs, sample labeled ‘PL Ash’
o The char below the gasifier grate was collected (Figure 9-7) and combined with
the char collected from just before the heat exchanger entrance (Figure 9-8),
sample labeled ‘Below Grate’
o The char was collected from inside and at the exit of the heat exchanger using a
Shop-Vac (Figure 9-9), labeled ‘HEX’
o The char was collected from the filter box using the onboard auger, labeled
‘Filter’
Two experiments were run for each limestone percentage (3.71, 5.71, and 7.71 % limestone). In
one experiment for each set point, representative ash and char samples were taken from each of
the above locations for comparison of variation in ash composition through the gasifier. In the
other three experiments, ‘Rest of Gasifier’ and ‘PL Ash’ were combined and analyzed as one
sample labeled ‘Gasifier’. Also, ‘Filter’, ‘HEX’ and ‘Below Grate’ were combined and analyzed as
one sample labeled ‘After Grate’. For all experiments, a sample from the ‘Woodchip Char’ was
analyzed for Loss on Ignition (LOI), as dictated in Section 9.1.2.
9.2.3 Data Analysis
The data collected for each experiment was analyzed using various methods in order to
understand and interpret the results. Syngas volume percentage was used to calculate syngas
234
HHV and biomass and ash analyses were used to perform mass balances. In performing these
analyses, several assumptions were made:
Only species present in syngas are O₂, CO, CO₂, CH₄, H₂, N₂, and H₂O
All gases behave as ideal
All biomass and limestone is homogeneous in composition, on a dry basis
CO₂ in limestone is fully consumed during gasification
Limestone and poultry litter, after being mixed, travel together in the same wet
weight ratio as they were combined for each experiment (This assumption is
used to factor in sorted litter and residual litter in the storage bins)
The ash content of the ‘Woodchip Char’ has the same composition as the ash
content of the raw woodchips
When calculating composite syngas HHV, the HHV per unit mass (kJ/kg) of each of the
combustible components (CO, CH₄, and H₂) were referenced from Turns (2000) and Glassman
(2008). To get the volumetric heating value of each gas, the HHV’s of each gas were converted
to a molar basis and then multiplied by the molar density of an ideal gas at 0˚C, 1 atm (the
standard to which the gasifier flow is corrected to).
˚ , ∙
44.615 Equation9.1
P = 101,325 Pa
= 8.3145 ∙
T = 273.15 K
∙ ∙ 44.615
1000Equation9.2
The composite HHV at 0˚C, 1 atm is then just the molar fraction (or volume fraction as dictated by
the gas analyzers) of each gas multiplied by its corresponding volumetric HHV and summed up.
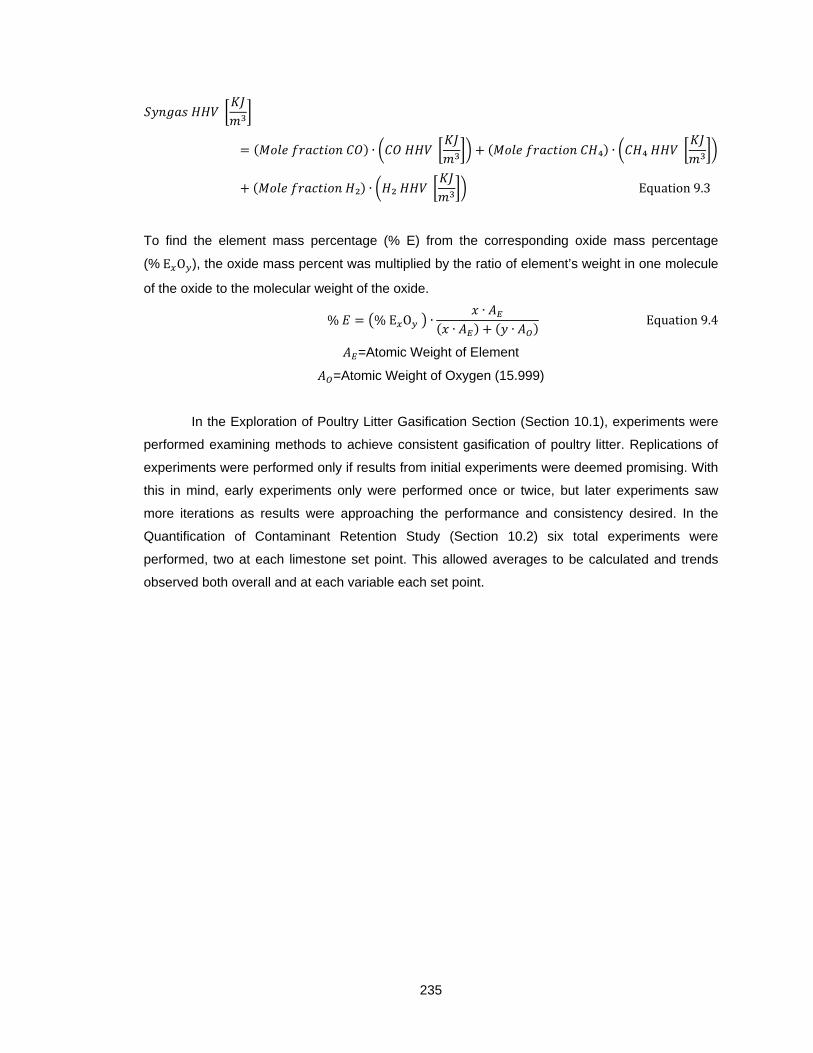
235
∙ ₄ ∙ ₄
₂ ∙ ₂ Equation9.3
To find the element mass percentage (% E) from the corresponding oxide mass percentage
(%E O ), the oxide mass percent was multiplied by the ratio of element’s weight in one molecule
of the oxide to the molecular weight of the oxide.
% %E O ∙∙
∙ ∙Equation9.4
=Atomic Weight of Element
=Atomic Weight of Oxygen (15.999)
In the Exploration of Poultry Litter Gasification Section (Section 10.1), experiments were
performed examining methods to achieve consistent gasification of poultry litter. Replications of
experiments were performed only if results from initial experiments were deemed promising. With
this in mind, early experiments only were performed once or twice, but later experiments saw
more iterations as results were approaching the performance and consistency desired. In the
Quantification of Contaminant Retention Study (Section 10.2) six total experiments were
performed, two at each limestone set point. This allowed averages to be calculated and trends
observed both overall and at each variable each set point.
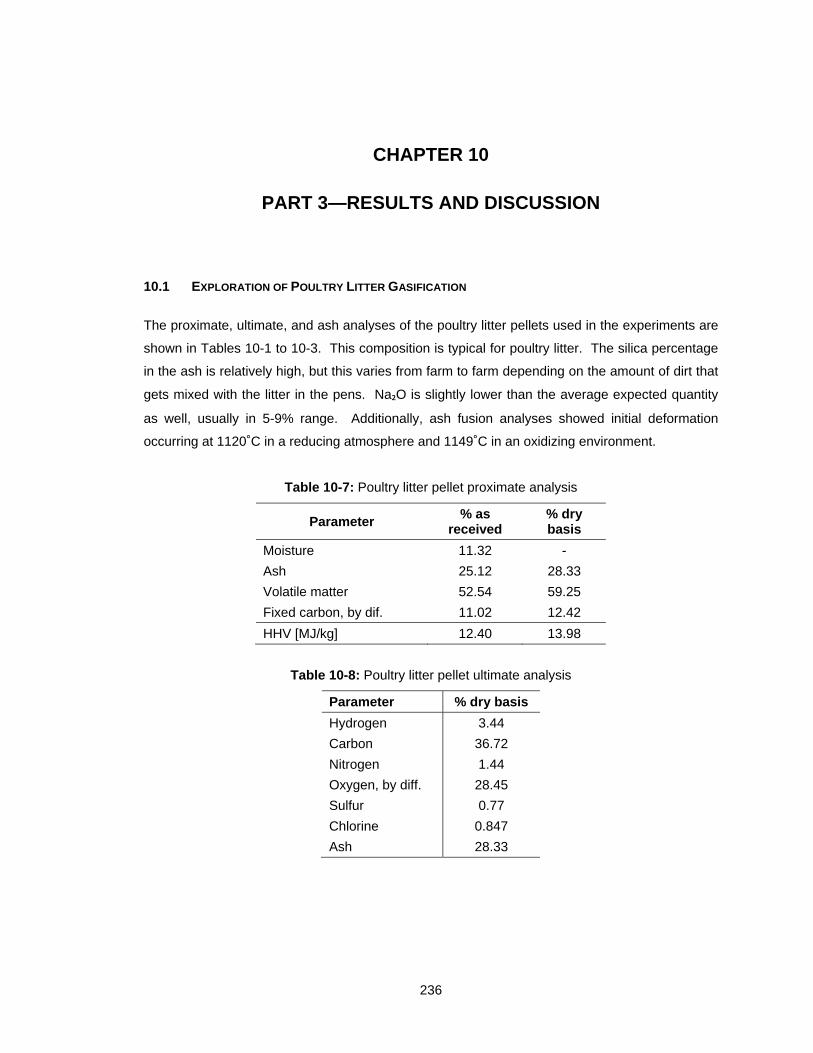
236
CHAPTER 10
PART 3—RESULTS AND DISCUSSION
10.1 EXPLORATION OF POULTRY LITTER GASIFICATION
The proximate, ultimate, and ash analyses of the poultry litter pellets used in the experiments are
shown in Tables 10-1 to 10-3. This composition is typical for poultry litter. The silica percentage
in the ash is relatively high, but this varies from farm to farm depending on the amount of dirt that
gets mixed with the litter in the pens. Na₂O is slightly lower than the average expected quantity
as well, usually in 5-9% range. Additionally, ash fusion analyses showed initial deformation
occurring at 1120˚C in a reducing atmosphere and 1149˚C in an oxidizing environment.
Table 10-7: Poultry litter pellet proximate analysis
Parameter % as
received % dry basis
Moisture 11.32 -
Ash 25.12 28.33
Volatile matter 52.54 59.25
Fixed carbon, by dif. 11.02 12.42
HHV [MJ/kg] 12.40 13.98
Table 10-8: Poultry litter pellet ultimate analysis
Parameter % dry basis
Hydrogen 3.44
Carbon 36.72
Nitrogen 1.44
Oxygen, by diff. 28.45
Sulfur 0.77
Chlorine 0.847
Ash 28.33
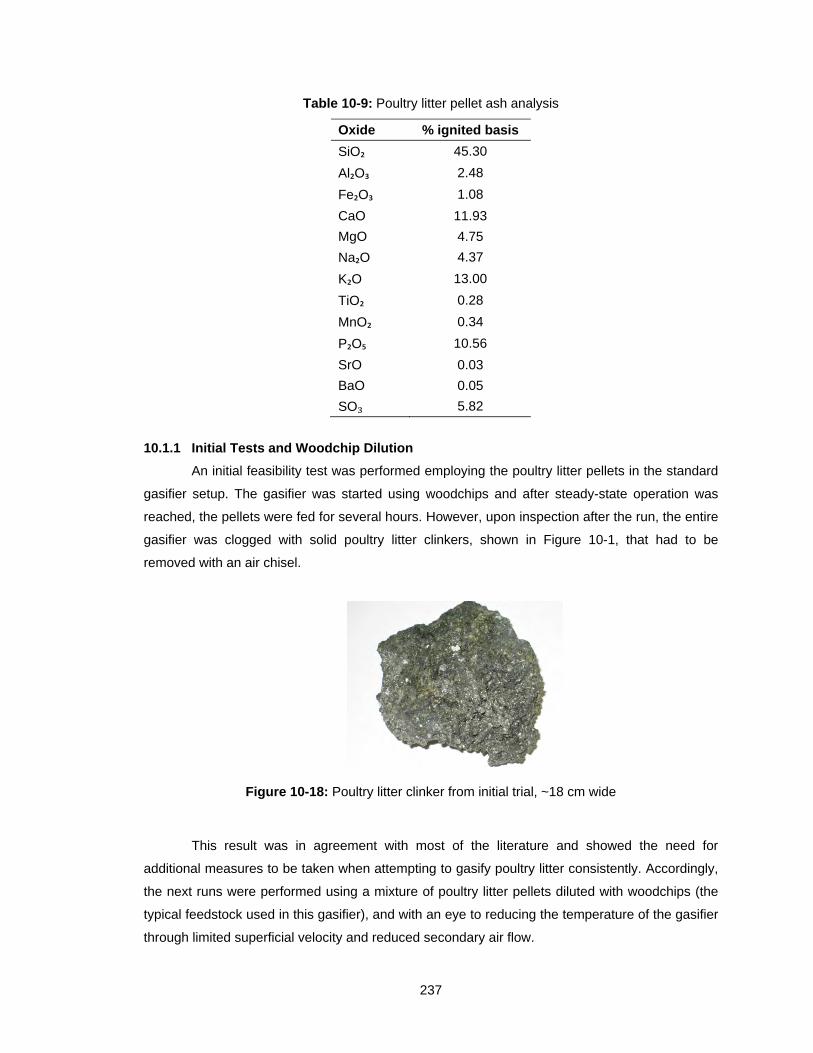
237
Table 10-9: Poultry litter pellet ash analysis
Oxide % ignited basis
SiO₂ 45.30
Al₂O₃ 2.48
Fe₂O₃ 1.08
CaO 11.93
MgO 4.75
Na₂O 4.37
K₂O 13.00
TiO₂ 0.28
MnO₂ 0.34
P₂O₅ 10.56
SrO 0.03
BaO 0.05
SO₃ 5.82
10.1.1 Initial Tests and Woodchip Dilution
An initial feasibility test was performed employing the poultry litter pellets in the standard
gasifier setup. The gasifier was started using woodchips and after steady-state operation was
reached, the pellets were fed for several hours. However, upon inspection after the run, the entire
gasifier was clogged with solid poultry litter clinkers, shown in Figure 10-1, that had to be
removed with an air chisel.
Figure 10-18: Poultry litter clinker from initial trial, ~18 cm wide
This result was in agreement with most of the literature and showed the need for
additional measures to be taken when attempting to gasify poultry litter consistently. Accordingly,
the next runs were performed using a mixture of poultry litter pellets diluted with woodchips (the
typical feedstock used in this gasifier), and with an eye to reducing the temperature of the gasifier
through limited superficial velocity and reduced secondary air flow.

238
The first of these runs was a test to explore exactly what level of control over the gasifier
temperature existed. The fusion of the pellets was most likely due to their low ash fusion
temperature, a contribution of the alkali metals, chlorine, and silica present in poultry litter.
Lowering the temperatures in the gasifier, especially the peak temperatures, was thought to
alleviate at least some of the clinkering. Several trials were conducted running only woodchips
and attempting to stabilize reduced temperatures.
The initial attempt consisted of simply reducing the set point temperatures in each stage
of air injection for the gasifier. Although the peak temperature was reduced with this technique,
the operation was not stable and the flame front rose to the top of the downdraft gasifier. This
occurred because as air injection is reduced at each level (to reduce the temperature in that
level), additional air was added at the uncontrolled gasifier inlet (top) to provide the total flow rate
of air required for the syngas production rate specified (65m3/hr).
In subsequent trials, to reduce the gasifier superficial velocity, the lower set point
temperatures were used in conjunction with lower syngas flow rates until the syngas flow rate
was reduced to 40m3/hr (the minimum allowed by the gasifier). The net reduction in average
reaction temperature was less than 50˚C using this technique.
The next runs were conducted to determine if the clinkering tendency of poultry litter
could be mitigated by diluting the poultry litter pellets with wood chips. Trials with 20 percent and
40 percent poultry litter (by weight) in wood chips were conducted. Initially the trial with 20
percent poultry litter appeared to be successful and produced no external operating anomalies
such as increased pressure drop across the gasifier. Consequently, without purging the existing
material, a trial using 40 percent poultry litter was conducted. During each of these trials a
suitable quality syngas was produced for the duration. However, as the 40% trial progressed, the
operating temperature profile and the gasifier pressure drop became unstable and the trial was
aborted. The gasifier was then cleaned and the ash was found to contain significant quantities of
clinkered poultry litter pellets (Figure 10-2).
Subsequent trials and analyses showed that clinkering was actually occurring with the 20
percent trial but the low concentration of poultry litter pellets and the long residence time in the
gasifier caused the problem to not be evident during the roughly 4-hour initial trial.
Additional tests were performed attempting to limit the gasifier temperature while feeding
poultry litter by adjusting set-points, depressing overall gas flow rate, using wet woodchips to
depress the flame front, and combinations of each. None of these options yielded either stable
operation or a reduction of the pellet clinkering.
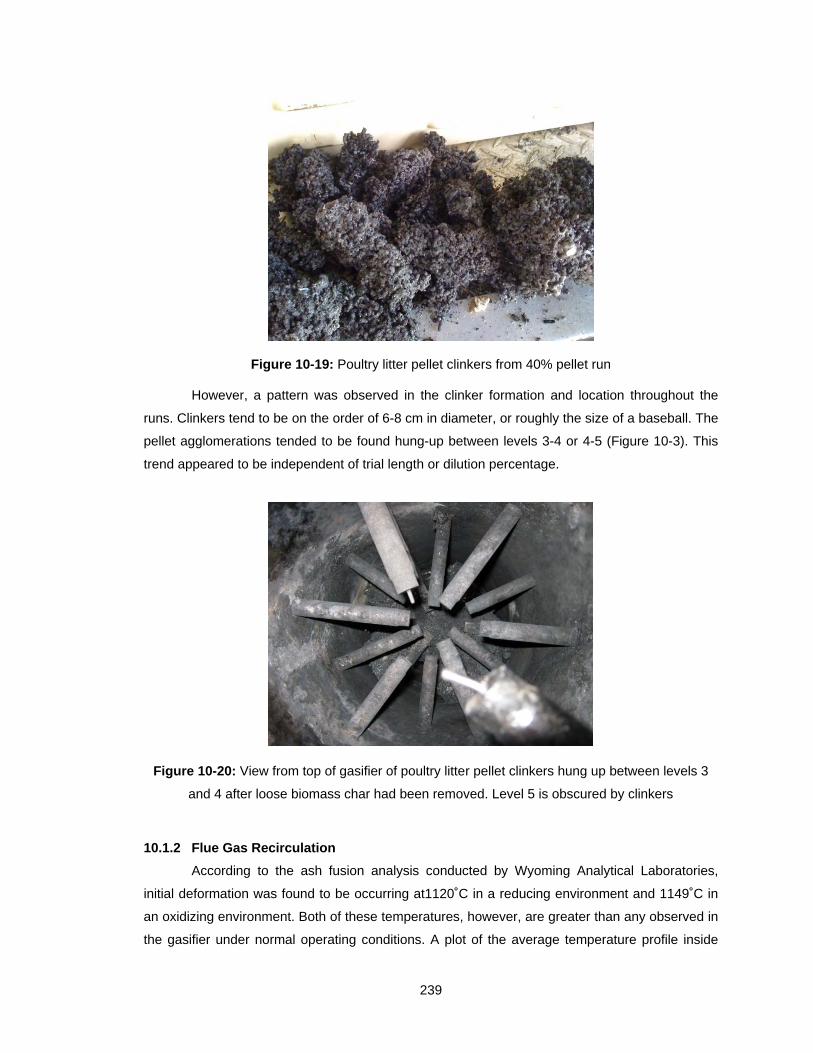
239
Figure 10-19: Poultry litter pellet clinkers from 40% pellet run
However, a pattern was observed in the clinker formation and location throughout the
runs. Clinkers tend to be on the order of 6-8 cm in diameter, or roughly the size of a baseball. The
pellet agglomerations tended to be found hung-up between levels 3-4 or 4-5 (Figure 10-3). This
trend appeared to be independent of trial length or dilution percentage.
Figure 10-20: View from top of gasifier of poultry litter pellet clinkers hung up between levels 3
and 4 after loose biomass char had been removed. Level 5 is obscured by clinkers
10.1.2 Flue Gas Recirculation
According to the ash fusion analysis conducted by Wyoming Analytical Laboratories,
initial deformation was found to be occurring at1120˚C in a reducing environment and 1149˚C in
an oxidizing environment. Both of these temperatures, however, are greater than any observed in
the gasifier under normal operating conditions. A plot of the average temperature profile inside
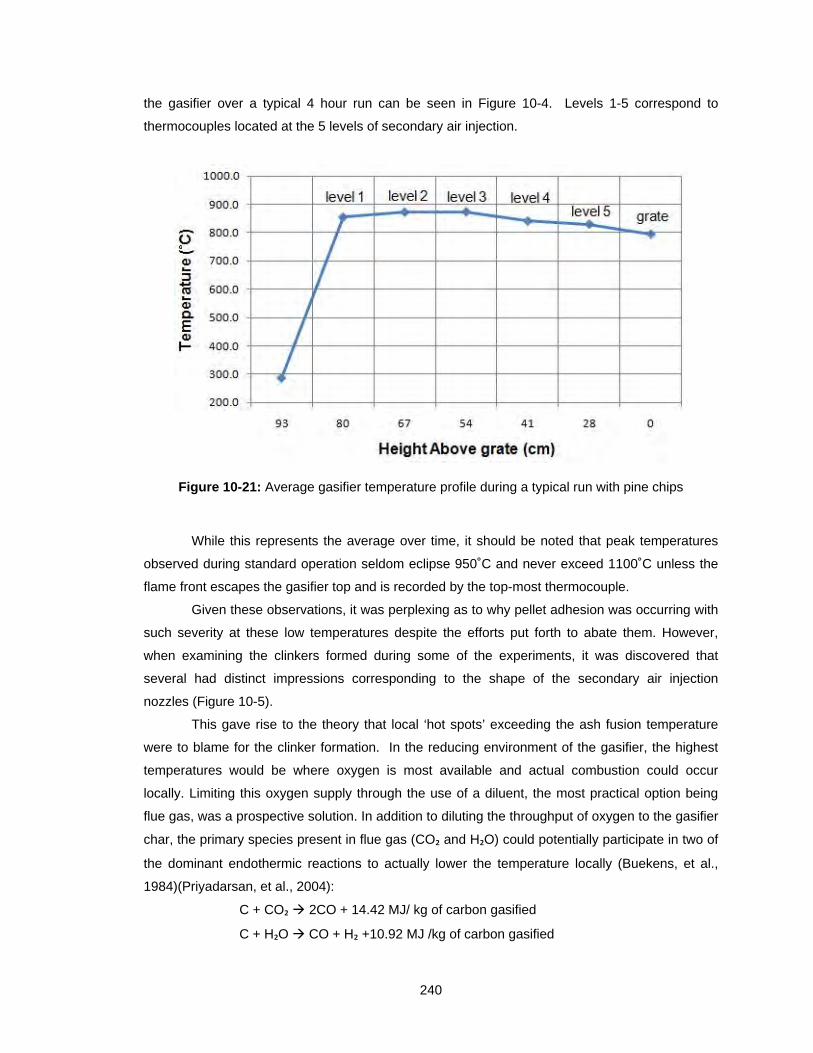
240
the gasifier over a typical 4 hour run can be seen in Figure 10-4. Levels 1-5 correspond to
thermocouples located at the 5 levels of secondary air injection.
Figure 10-21: Average gasifier temperature profile during a typical run with pine chips
While this represents the average over time, it should be noted that peak temperatures
observed during standard operation seldom eclipse 950˚C and never exceed 1100˚C unless the
flame front escapes the gasifier top and is recorded by the top-most thermocouple.
Given these observations, it was perplexing as to why pellet adhesion was occurring with
such severity at these low temperatures despite the efforts put forth to abate them. However,
when examining the clinkers formed during some of the experiments, it was discovered that
several had distinct impressions corresponding to the shape of the secondary air injection
nozzles (Figure 10-5).
This gave rise to the theory that local ‘hot spots’ exceeding the ash fusion temperature
were to blame for the clinker formation. In the reducing environment of the gasifier, the highest
temperatures would be where oxygen is most available and actual combustion could occur
locally. Limiting this oxygen supply through the use of a diluent, the most practical option being
flue gas, was a prospective solution. In addition to diluting the throughput of oxygen to the gasifier
char, the primary species present in flue gas (CO₂ and H₂O) could potentially participate in two of
the dominant endothermic reactions to actually lower the temperature locally (Buekens, et al.,
1984)(Priyadarsan, et al., 2004):
C + CO₂ 2CO + 14.42 MJ/ kg of carbon gasified
C + H₂O CO + H₂ +10.92 MJ /kg of carbon gasified
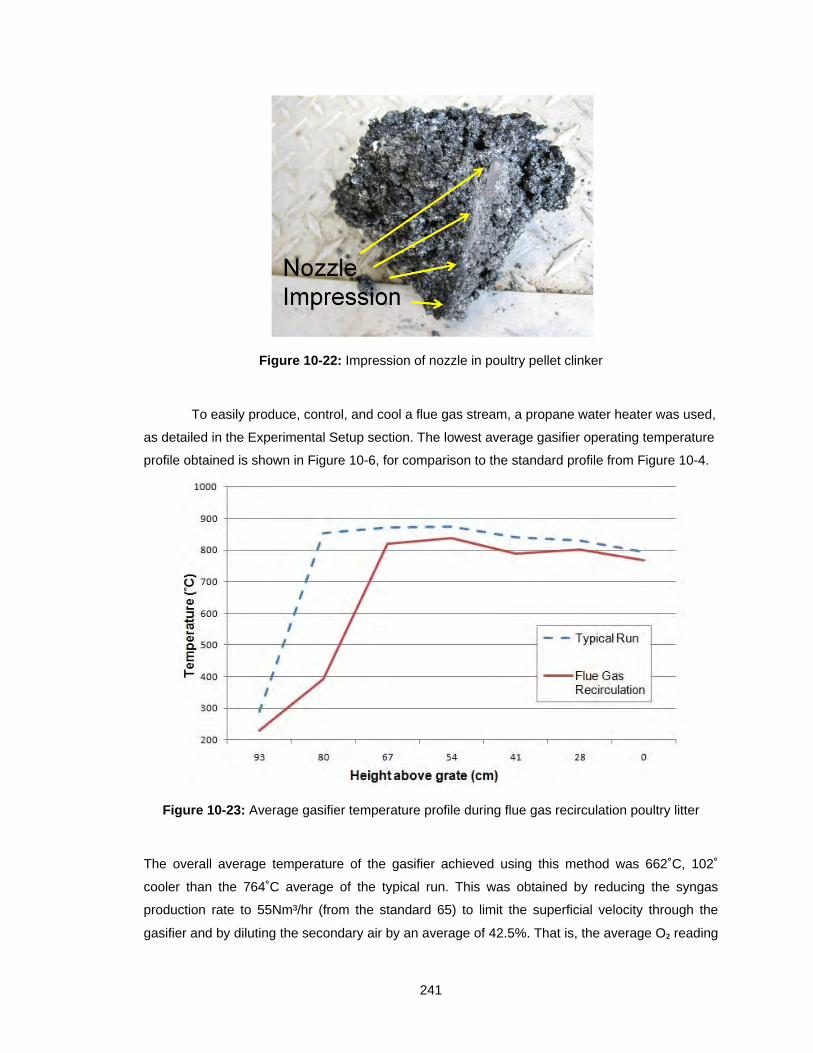
241
Figure 10-22: Impression of nozzle in poultry pellet clinker
To easily produce, control, and cool a flue gas stream, a propane water heater was used,
as detailed in the Experimental Setup section. The lowest average gasifier operating temperature
profile obtained is shown in Figure 10-6, for comparison to the standard profile from Figure 10-4.
Figure 10-23: Average gasifier temperature profile during flue gas recirculation poultry litter
The overall average temperature of the gasifier achieved using this method was 662˚C, 102˚
cooler than the 764˚C average of the typical run. This was obtained by reducing the syngas
production rate to 55Nm³/hr (from the standard 65) to limit the superficial velocity through the
gasifier and by diluting the secondary air by an average of 42.5%. That is, the average O₂ reading
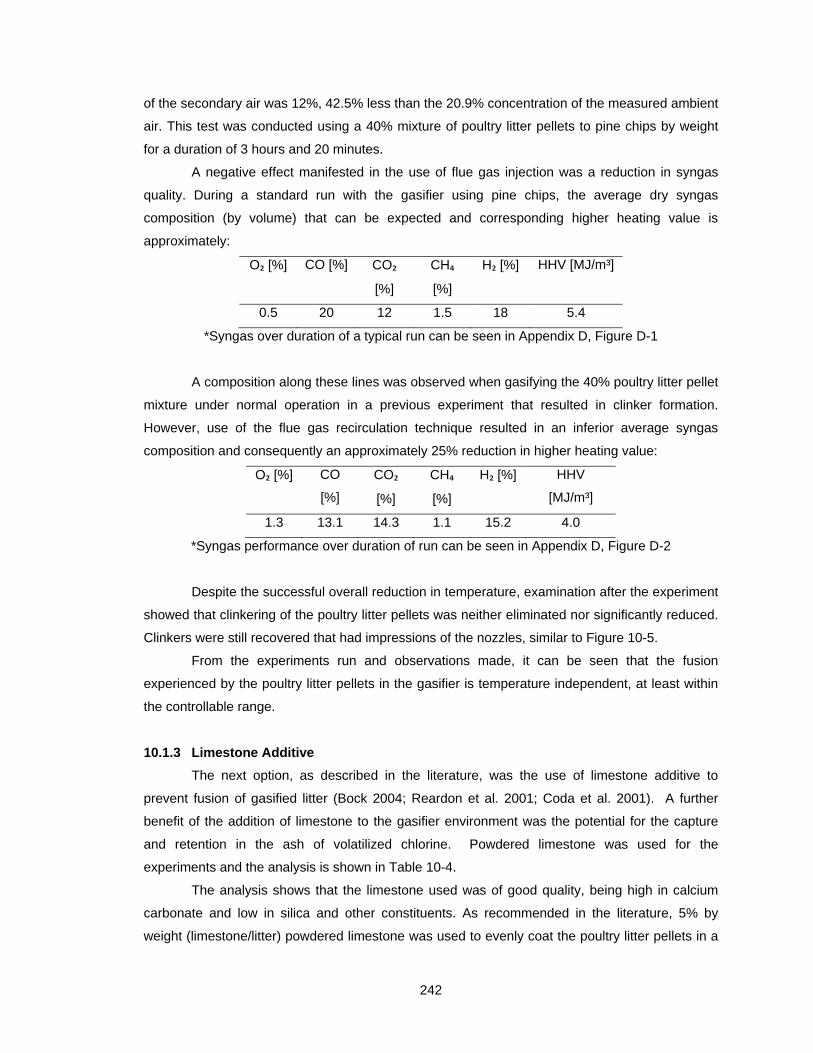
242
of the secondary air was 12%, 42.5% less than the 20.9% concentration of the measured ambient
air. This test was conducted using a 40% mixture of poultry litter pellets to pine chips by weight
for a duration of 3 hours and 20 minutes.
A negative effect manifested in the use of flue gas injection was a reduction in syngas
quality. During a standard run with the gasifier using pine chips, the average dry syngas
composition (by volume) that can be expected and corresponding higher heating value is
approximately:
O₂ [%] CO [%] CO₂
[%]
CH₄
[%]
H₂ [%] HHV [MJ/m³]
0.5 20 12 1.5 18 5.4
*Syngas over duration of a typical run can be seen in Appendix D, Figure D-1
A composition along these lines was observed when gasifying the 40% poultry litter pellet
mixture under normal operation in a previous experiment that resulted in clinker formation.
However, use of the flue gas recirculation technique resulted in an inferior average syngas
composition and consequently an approximately 25% reduction in higher heating value:
O₂ [%] CO
[%]
CO₂
[%]
CH₄
[%]
H₂ [%] HHV
[MJ/m³]
1.3 13.1 14.3 1.1 15.2 4.0
*Syngas performance over duration of run can be seen in Appendix D, Figure D-2
Despite the successful overall reduction in temperature, examination after the experiment
showed that clinkering of the poultry litter pellets was neither eliminated nor significantly reduced.
Clinkers were still recovered that had impressions of the nozzles, similar to Figure 10-5.
From the experiments run and observations made, it can be seen that the fusion
experienced by the poultry litter pellets in the gasifier is temperature independent, at least within
the controllable range.
10.1.3 Limestone Additive
The next option, as described in the literature, was the use of limestone additive to
prevent fusion of gasified litter (Bock 2004; Reardon et al. 2001; Coda et al. 2001). A further
benefit of the addition of limestone to the gasifier environment was the potential for the capture
and retention in the ash of volatilized chlorine. Powdered limestone was used for the
experiments and the analysis is shown in Table 10-4.
The analysis shows that the limestone used was of good quality, being high in calcium
carbonate and low in silica and other constituents. As recommended in the literature, 5% by
weight (limestone/litter) powdered limestone was used to evenly coat the poultry litter pellets in a
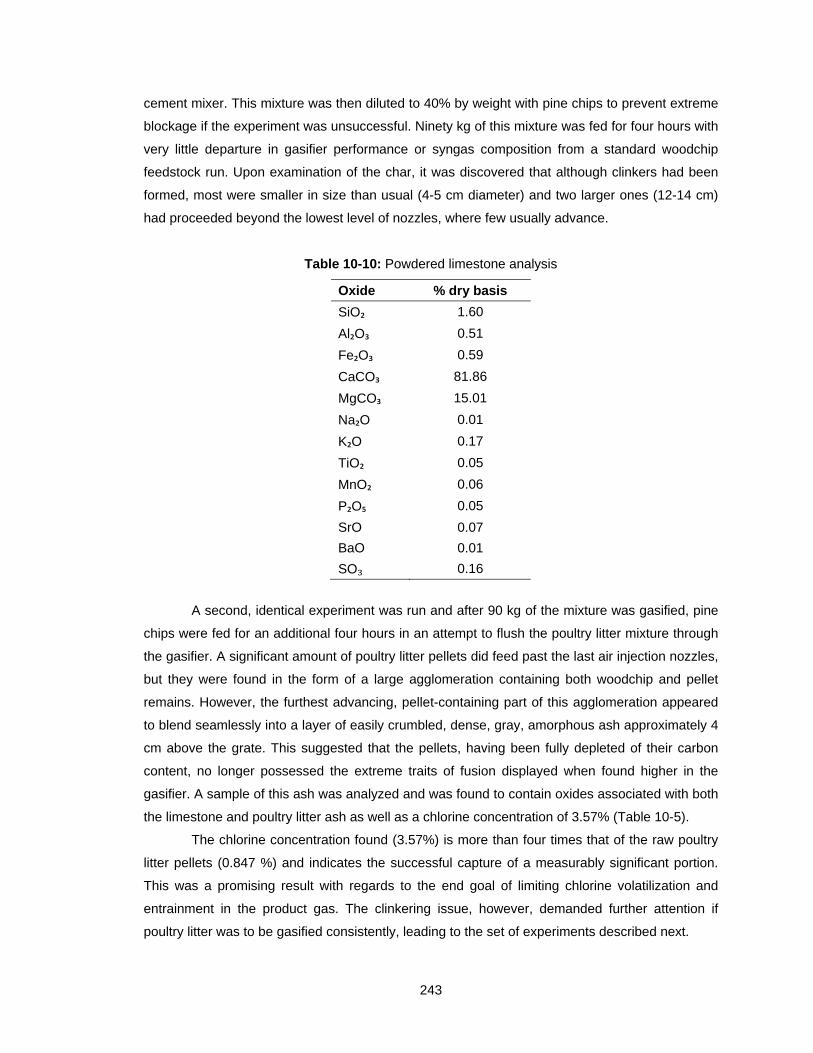
243
cement mixer. This mixture was then diluted to 40% by weight with pine chips to prevent extreme
blockage if the experiment was unsuccessful. Ninety kg of this mixture was fed for four hours with
very little departure in gasifier performance or syngas composition from a standard woodchip
feedstock run. Upon examination of the char, it was discovered that although clinkers had been
formed, most were smaller in size than usual (4-5 cm diameter) and two larger ones (12-14 cm)
had proceeded beyond the lowest level of nozzles, where few usually advance.
Table 10-10: Powdered limestone analysis
Oxide % dry basis
SiO₂ 1.60
Al₂O₃ 0.51
Fe₂O₃ 0.59
CaCO₃ 81.86
MgCO₃ 15.01
Na₂O 0.01
K₂O 0.17
TiO₂ 0.05
MnO₂ 0.06
P₂O₅ 0.05
SrO 0.07
BaO 0.01
SO₃ 0.16
A second, identical experiment was run and after 90 kg of the mixture was gasified, pine
chips were fed for an additional four hours in an attempt to flush the poultry litter mixture through
the gasifier. A significant amount of poultry litter pellets did feed past the last air injection nozzles,
but they were found in the form of a large agglomeration containing both woodchip and pellet
remains. However, the furthest advancing, pellet-containing part of this agglomeration appeared
to blend seamlessly into a layer of easily crumbled, dense, gray, amorphous ash approximately 4
cm above the grate. This suggested that the pellets, having been fully depleted of their carbon
content, no longer possessed the extreme traits of fusion displayed when found higher in the
gasifier. A sample of this ash was analyzed and was found to contain oxides associated with both
the limestone and poultry litter ash as well as a chlorine concentration of 3.57% (Table 10-5).
The chlorine concentration found (3.57%) is more than four times that of the raw poultry
litter pellets (0.847 %) and indicates the successful capture of a measurably significant portion.
This was a promising result with regards to the end goal of limiting chlorine volatilization and
entrainment in the product gas. The clinkering issue, however, demanded further attention if
poultry litter was to be gasified consistently, leading to the set of experiments described next.
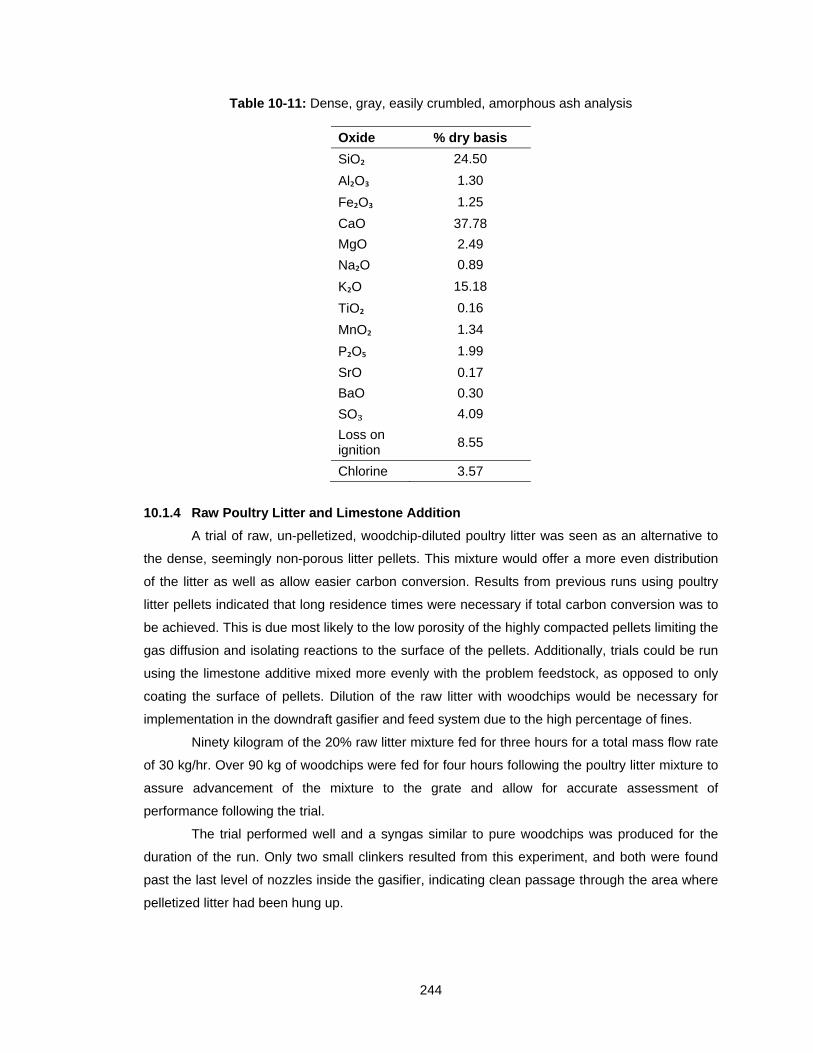
244
Table 10-11: Dense, gray, easily crumbled, amorphous ash analysis
Oxide % dry basis
SiO₂ 24.50
Al₂O₃ 1.30
Fe₂O₃ 1.25
CaO 37.78
MgO 2.49
Na₂O 0.89
K₂O 15.18
TiO₂ 0.16
MnO₂ 1.34
P₂O₅ 1.99
SrO 0.17
BaO 0.30
SO₃ 4.09
Loss on ignition
8.55
Chlorine 3.57
10.1.4 Raw Poultry Litter and Limestone Addition
A trial of raw, un-pelletized, woodchip-diluted poultry litter was seen as an alternative to
the dense, seemingly non-porous litter pellets. This mixture would offer a more even distribution
of the litter as well as allow easier carbon conversion. Results from previous runs using poultry
litter pellets indicated that long residence times were necessary if total carbon conversion was to
be achieved. This is due most likely to the low porosity of the highly compacted pellets limiting the
gas diffusion and isolating reactions to the surface of the pellets. Additionally, trials could be run
using the limestone additive mixed more evenly with the problem feedstock, as opposed to only
coating the surface of pellets. Dilution of the raw litter with woodchips would be necessary for
implementation in the downdraft gasifier and feed system due to the high percentage of fines.
Ninety kilogram of the 20% raw litter mixture fed for three hours for a total mass flow rate
of 30 kg/hr. Over 90 kg of woodchips were fed for four hours following the poultry litter mixture to
assure advancement of the mixture to the grate and allow for accurate assessment of
performance following the trial.
The trial performed well and a syngas similar to pure woodchips was produced for the
duration of the run. Only two small clinkers resulted from this experiment, and both were found
past the last level of nozzles inside the gasifier, indicating clean passage through the area where
pelletized litter had been hung up.
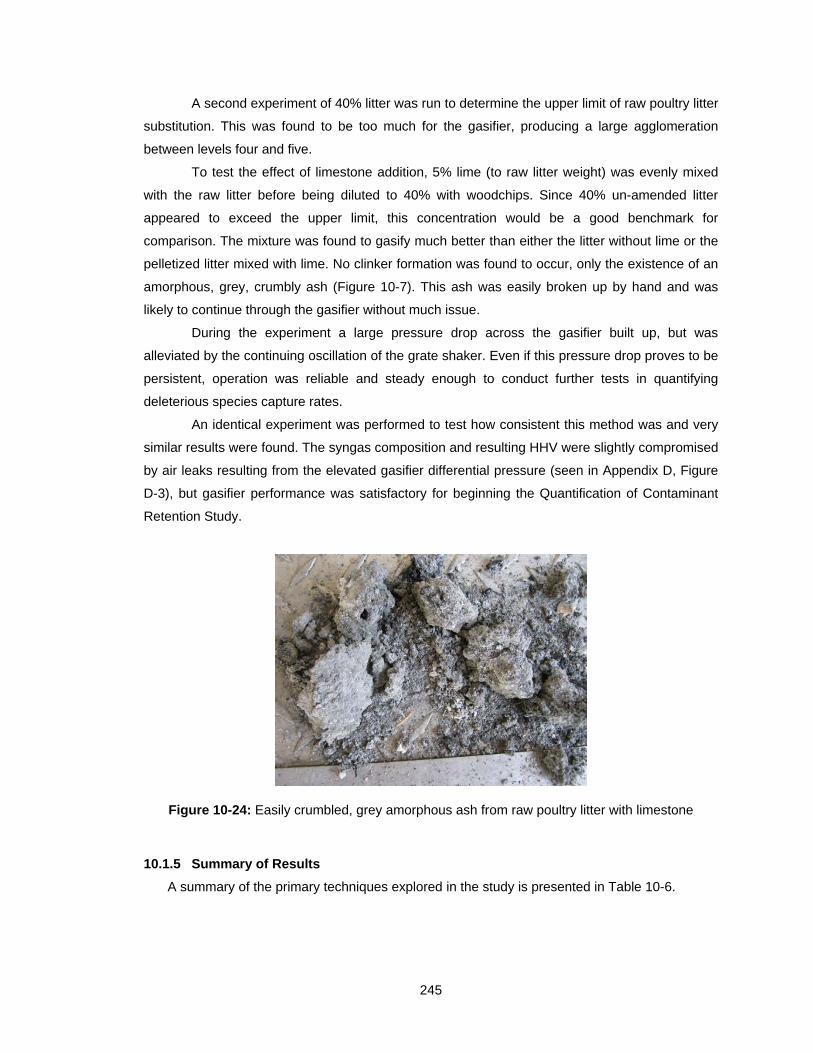
245
A second experiment of 40% litter was run to determine the upper limit of raw poultry litter
substitution. This was found to be too much for the gasifier, producing a large agglomeration
between levels four and five.
To test the effect of limestone addition, 5% lime (to raw litter weight) was evenly mixed
with the raw litter before being diluted to 40% with woodchips. Since 40% un-amended litter
appeared to exceed the upper limit, this concentration would be a good benchmark for
comparison. The mixture was found to gasify much better than either the litter without lime or the
pelletized litter mixed with lime. No clinker formation was found to occur, only the existence of an
amorphous, grey, crumbly ash (Figure 10-7). This ash was easily broken up by hand and was
likely to continue through the gasifier without much issue.
During the experiment a large pressure drop across the gasifier built up, but was
alleviated by the continuing oscillation of the grate shaker. Even if this pressure drop proves to be
persistent, operation was reliable and steady enough to conduct further tests in quantifying
deleterious species capture rates.
An identical experiment was performed to test how consistent this method was and very
similar results were found. The syngas composition and resulting HHV were slightly compromised
by air leaks resulting from the elevated gasifier differential pressure (seen in Appendix D, Figure
D-3), but gasifier performance was satisfactory for beginning the Quantification of Contaminant
Retention Study.
Figure 10-24: Easily crumbled, grey amorphous ash from raw poultry litter with limestone
10.1.5 Summary of Results
A summary of the primary techniques explored in the study is presented in Table 10-6.
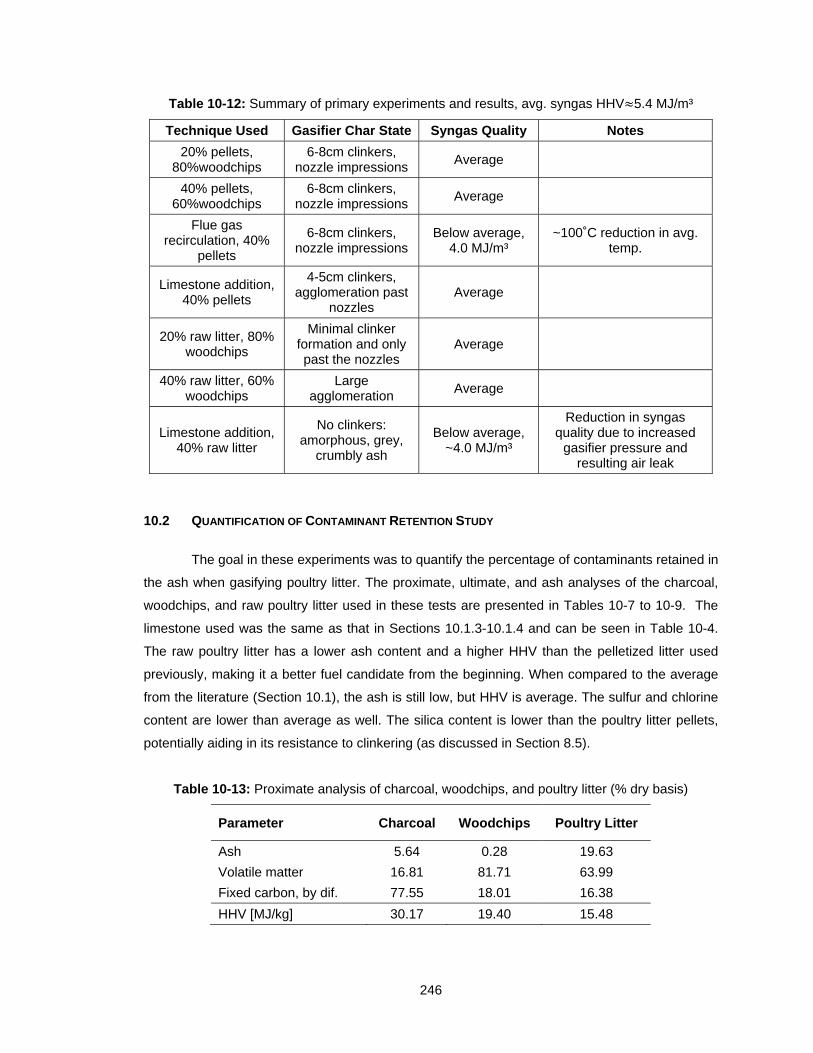
246
Table 10-12: Summary of primary experiments and results, avg. syngas HHV 5.4 MJ/m³
Technique Used Gasifier Char State Syngas Quality Notes
20% pellets, 80%woodchips
6-8cm clinkers, nozzle impressions
Average
40% pellets, 60%woodchips
6-8cm clinkers, nozzle impressions
Average
Flue gas recirculation, 40%
pellets
6-8cm clinkers, nozzle impressions
Below average, 4.0 MJ/m³
~100˚C reduction in avg. temp.
Limestone addition, 40% pellets
4-5cm clinkers, agglomeration past
nozzles Average
20% raw litter, 80% woodchips
Minimal clinker formation and only past the nozzles
Average
40% raw litter, 60% woodchips
Large agglomeration
Average
Limestone addition, 40% raw litter
No clinkers: amorphous, grey,
crumbly ash
Below average, ~4.0 MJ/m³
Reduction in syngas quality due to increased
gasifier pressure and resulting air leak
10.2 QUANTIFICATION OF CONTAMINANT RETENTION STUDY
The goal in these experiments was to quantify the percentage of contaminants retained in
the ash when gasifying poultry litter. The proximate, ultimate, and ash analyses of the charcoal,
woodchips, and raw poultry litter used in these tests are presented in Tables 10-7 to 10-9. The
limestone used was the same as that in Sections 10.1.3-10.1.4 and can be seen in Table 10-4.
The raw poultry litter has a lower ash content and a higher HHV than the pelletized litter used
previously, making it a better fuel candidate from the beginning. When compared to the average
from the literature (Section 10.1), the ash is still low, but HHV is average. The sulfur and chlorine
content are lower than average as well. The silica content is lower than the poultry litter pellets,
potentially aiding in its resistance to clinkering (as discussed in Section 8.5).
Table 10-13: Proximate analysis of charcoal, woodchips, and poultry litter (% dry basis)
Parameter Charcoal Woodchips Poultry Litter
Ash 5.64 0.28 19.63
Volatile matter 16.81 81.71 63.99
Fixed carbon, by dif. 77.55 18.01 16.38
HHV [MJ/kg] 30.17 19.40 15.48
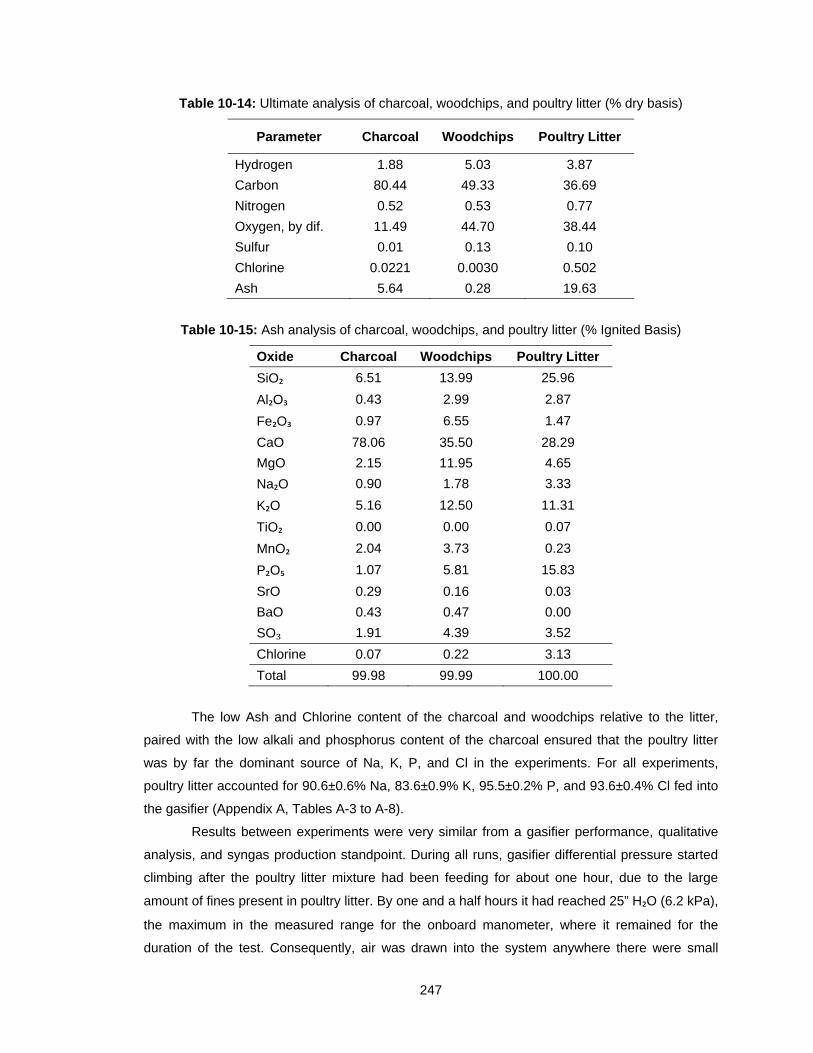
247
Table 10-14: Ultimate analysis of charcoal, woodchips, and poultry litter (% dry basis)
Parameter Charcoal Woodchips Poultry Litter
Hydrogen 1.88 5.03 3.87
Carbon 80.44 49.33 36.69
Nitrogen 0.52 0.53 0.77
Oxygen, by dif. 11.49 44.70 38.44
Sulfur 0.01 0.13 0.10
Chlorine 0.0221 0.0030 0.502
Ash 5.64 0.28 19.63
Table 10-15: Ash analysis of charcoal, woodchips, and poultry litter (% Ignited Basis)
Oxide Charcoal Woodchips Poultry Litter
SiO₂ 6.51 13.99 25.96
Al₂O₃ 0.43 2.99 2.87
Fe₂O₃ 0.97 6.55 1.47
CaO 78.06 35.50 28.29
MgO 2.15 11.95 4.65
Na₂O 0.90 1.78 3.33
K₂O 5.16 12.50 11.31
TiO₂ 0.00 0.00 0.07
MnO₂ 2.04 3.73 0.23
P₂O₅ 1.07 5.81 15.83
SrO 0.29 0.16 0.03
BaO 0.43 0.47 0.00
SO₃ 1.91 4.39 3.52
Chlorine 0.07 0.22 3.13
Total 99.98 99.99 100.00
The low Ash and Chlorine content of the charcoal and woodchips relative to the litter,
paired with the low alkali and phosphorus content of the charcoal ensured that the poultry litter
was by far the dominant source of Na, K, P, and Cl in the experiments. For all experiments,
poultry litter accounted for 90.6±0.6% Na, 83.6±0.9% K, 95.5±0.2% P, and 93.6±0.4% Cl fed into
the gasifier (Appendix A, Tables A-3 to A-8).
Results between experiments were very similar from a gasifier performance, qualitative
analysis, and syngas production standpoint. During all runs, gasifier differential pressure started
climbing after the poultry litter mixture had been feeding for about one hour, due to the large
amount of fines present in poultry litter. By one and a half hours it had reached 25” H₂O (6.2 kPa),
the maximum in the measured range for the onboard manometer, where it remained for the
duration of the test. Consequently, air was drawn into the system anywhere there were small
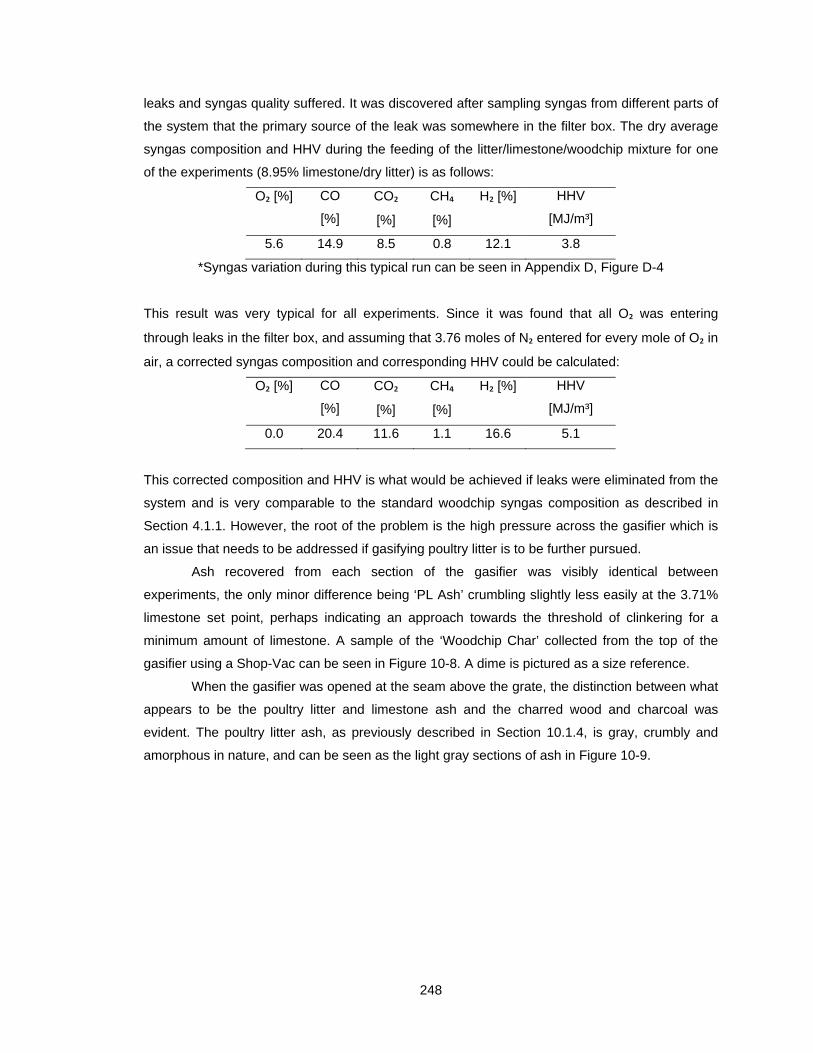
248
leaks and syngas quality suffered. It was discovered after sampling syngas from different parts of
the system that the primary source of the leak was somewhere in the filter box. The dry average
syngas composition and HHV during the feeding of the litter/limestone/woodchip mixture for one
of the experiments (8.95% limestone/dry litter) is as follows:
O₂ [%] CO
[%]
CO₂
[%]
CH₄
[%]
H₂ [%] HHV
[MJ/m³]
5.6 14.9 8.5 0.8 12.1 3.8
*Syngas variation during this typical run can be seen in Appendix D, Figure D-4
This result was very typical for all experiments. Since it was found that all O₂ was entering
through leaks in the filter box, and assuming that 3.76 moles of N₂ entered for every mole of O₂ in
air, a corrected syngas composition and corresponding HHV could be calculated:
O₂ [%] CO
[%]
CO₂
[%]
CH₄
[%]
H₂ [%] HHV
[MJ/m³]
0.0 20.4 11.6 1.1 16.6 5.1
This corrected composition and HHV is what would be achieved if leaks were eliminated from the
system and is very comparable to the standard woodchip syngas composition as described in
Section 4.1.1. However, the root of the problem is the high pressure across the gasifier which is
an issue that needs to be addressed if gasifying poultry litter is to be further pursued.
Ash recovered from each section of the gasifier was visibly identical between
experiments, the only minor difference being ‘PL Ash’ crumbling slightly less easily at the 3.71%
limestone set point, perhaps indicating an approach towards the threshold of clinkering for a
minimum amount of limestone. A sample of the ‘Woodchip Char’ collected from the top of the
gasifier using a Shop-Vac can be seen in Figure 10-8. A dime is pictured as a size reference.
When the gasifier was opened at the seam above the grate, the distinction between what
appears to be the poultry litter and limestone ash and the charred wood and charcoal was
evident. The poultry litter ash, as previously described in Section 10.1.4, is gray, crumbly and
amorphous in nature, and can be seen as the light gray sections of ash in Figure 10-9.

249
Figure 10-25: ‘Woodchip Char’ sample, collected from the top of the gasifier
Figure 10-26: Ash mound as seen when gasifier is opened at crack above grate. Poultry litter ash
is the light gray section in the middle of the mound
After being separated from the charcoal and wood char by hand and crumbled, the
poultry litter and limestone ash can be seen in Figure 10-10. This was separated, weighed, and
sent for analysis as ‘PL Ash’ in the first experiment for each of the three limestone set points
(3.71, 5.71, and 7.71 % Limestone/Wet Litter), but mixed with the rest of the gasifier char for the
second. The charcoal and wood char not included in the ‘PL Ash’ sample was labeled ‘Rest of
Gasifier’ and can be seen in Figure 10-11.
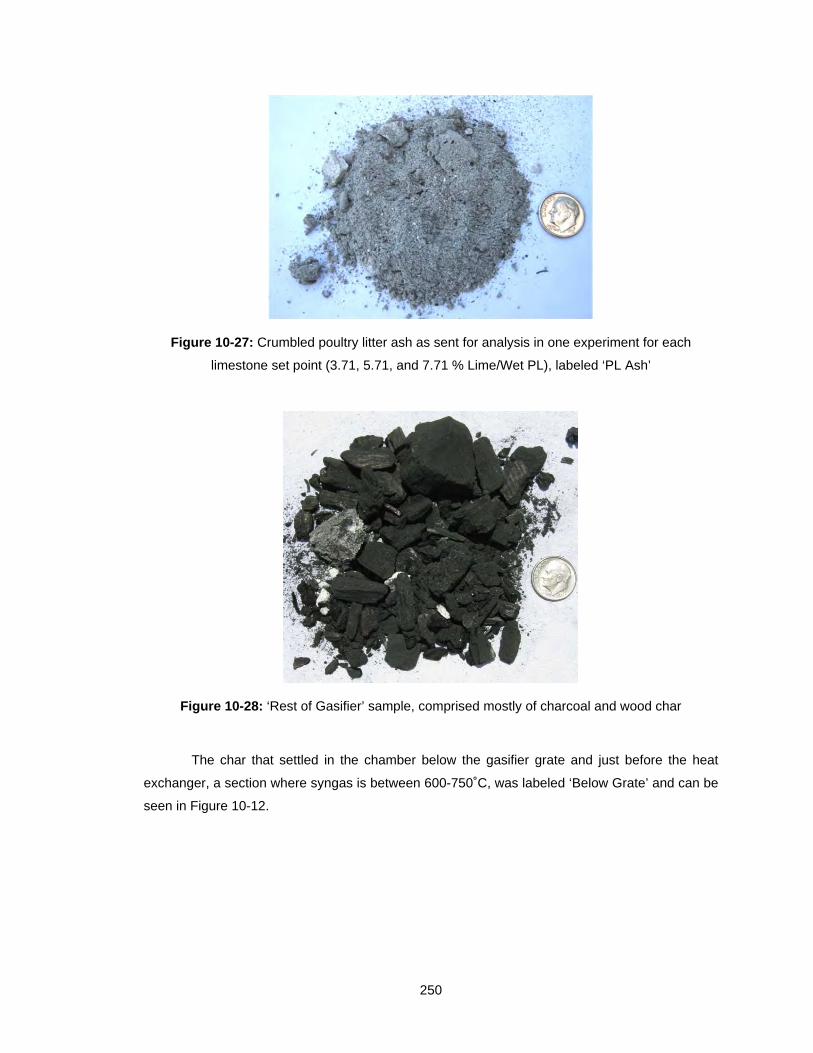
250
Figure 10-27: Crumbled poultry litter ash as sent for analysis in one experiment for each
limestone set point (3.71, 5.71, and 7.71 % Lime/Wet PL), labeled ‘PL Ash’
Figure 10-28: ‘Rest of Gasifier’ sample, comprised mostly of charcoal and wood char
The char that settled in the chamber below the gasifier grate and just before the heat
exchanger, a section where syngas is between 600-750˚C, was labeled ‘Below Grate’ and can be
seen in Figure 10-12.
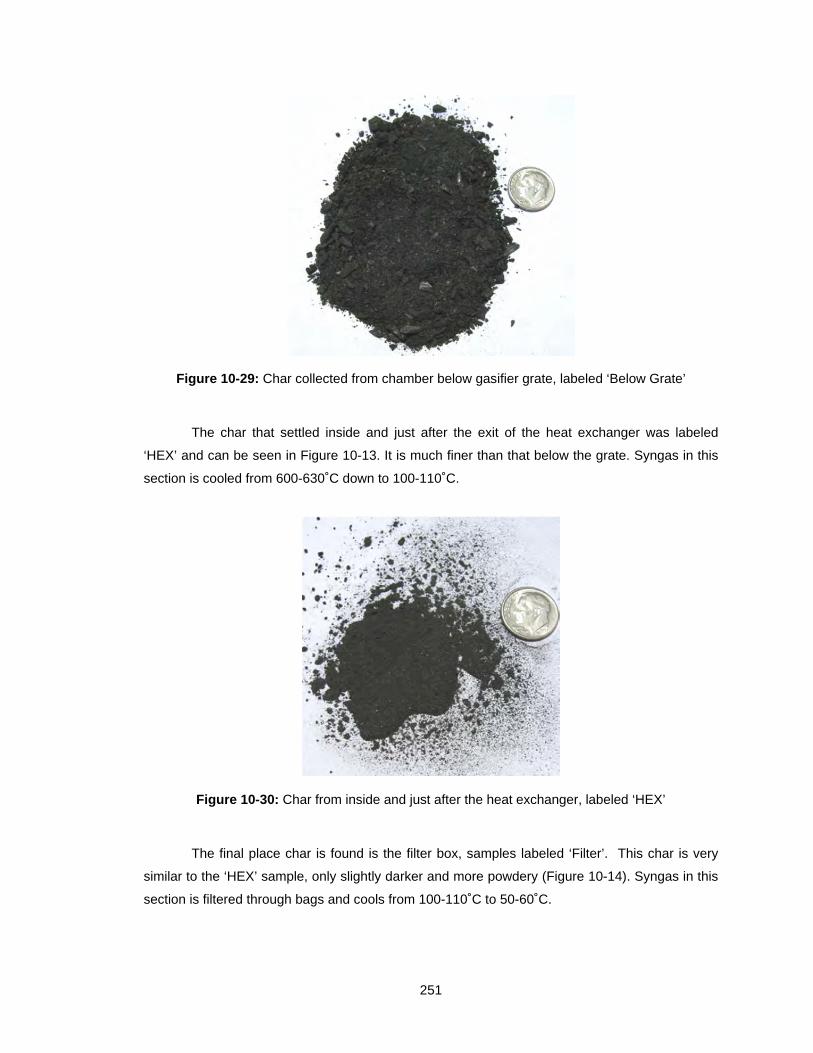
251
Figure 10-29: Char collected from chamber below gasifier grate, labeled ‘Below Grate’
The char that settled inside and just after the exit of the heat exchanger was labeled
‘HEX’ and can be seen in Figure 10-13. It is much finer than that below the grate. Syngas in this
section is cooled from 600-630˚C down to 100-110˚C.
Figure 10-30: Char from inside and just after the heat exchanger, labeled ‘HEX’
The final place char is found is the filter box, samples labeled ‘Filter’. This char is very
similar to the ‘HEX’ sample, only slightly darker and more powdery (Figure 10-14). Syngas in this
section is filtered through bags and cools from 100-110˚C to 50-60˚C.
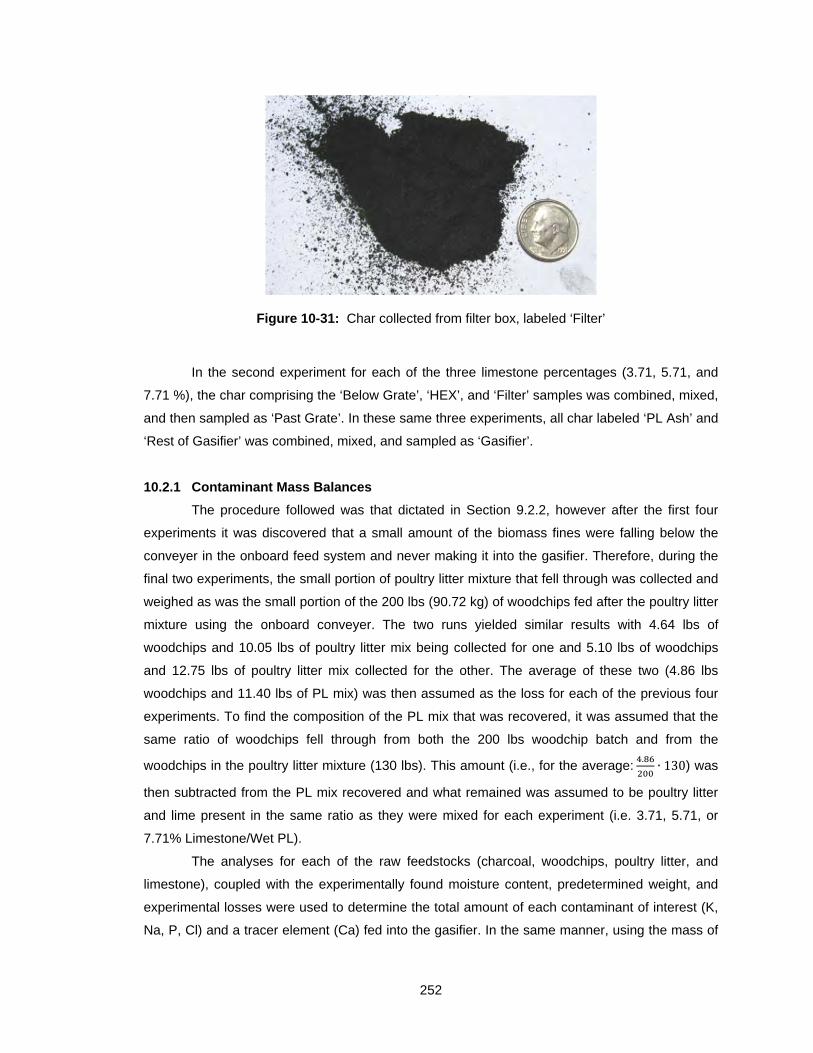
252
Figure 10-31: Char collected from filter box, labeled ‘Filter’
In the second experiment for each of the three limestone percentages (3.71, 5.71, and
7.71 %), the char comprising the ‘Below Grate’, ‘HEX’, and ‘Filter’ samples was combined, mixed,
and then sampled as ‘Past Grate’. In these same three experiments, all char labeled ‘PL Ash’ and
‘Rest of Gasifier’ was combined, mixed, and sampled as ‘Gasifier’.
10.2.1 Contaminant Mass Balances
The procedure followed was that dictated in Section 9.2.2, however after the first four
experiments it was discovered that a small amount of the biomass fines were falling below the
conveyer in the onboard feed system and never making it into the gasifier. Therefore, during the
final two experiments, the small portion of poultry litter mixture that fell through was collected and
weighed as was the small portion of the 200 lbs (90.72 kg) of woodchips fed after the poultry litter
mixture using the onboard conveyer. The two runs yielded similar results with 4.64 lbs of
woodchips and 10.05 lbs of poultry litter mix being collected for one and 5.10 lbs of woodchips
and 12.75 lbs of poultry litter mix collected for the other. The average of these two (4.86 lbs
woodchips and 11.40 lbs of PL mix) was then assumed as the loss for each of the previous four
experiments. To find the composition of the PL mix that was recovered, it was assumed that the
same ratio of woodchips fell through from both the 200 lbs woodchip batch and from the
woodchips in the poultry litter mixture (130 lbs). This amount (i.e., for the average:.∙ 130) was
then subtracted from the PL mix recovered and what remained was assumed to be poultry litter
and lime present in the same ratio as they were mixed for each experiment (i.e. 3.71, 5.71, or
7.71% Limestone/Wet PL).
The analyses for each of the raw feedstocks (charcoal, woodchips, poultry litter, and
limestone), coupled with the experimentally found moisture content, predetermined weight, and
experimental losses were used to determine the total amount of each contaminant of interest (K,
Na, P, Cl) and a tracer element (Ca) fed into the gasifier. In the same manner, using the mass of
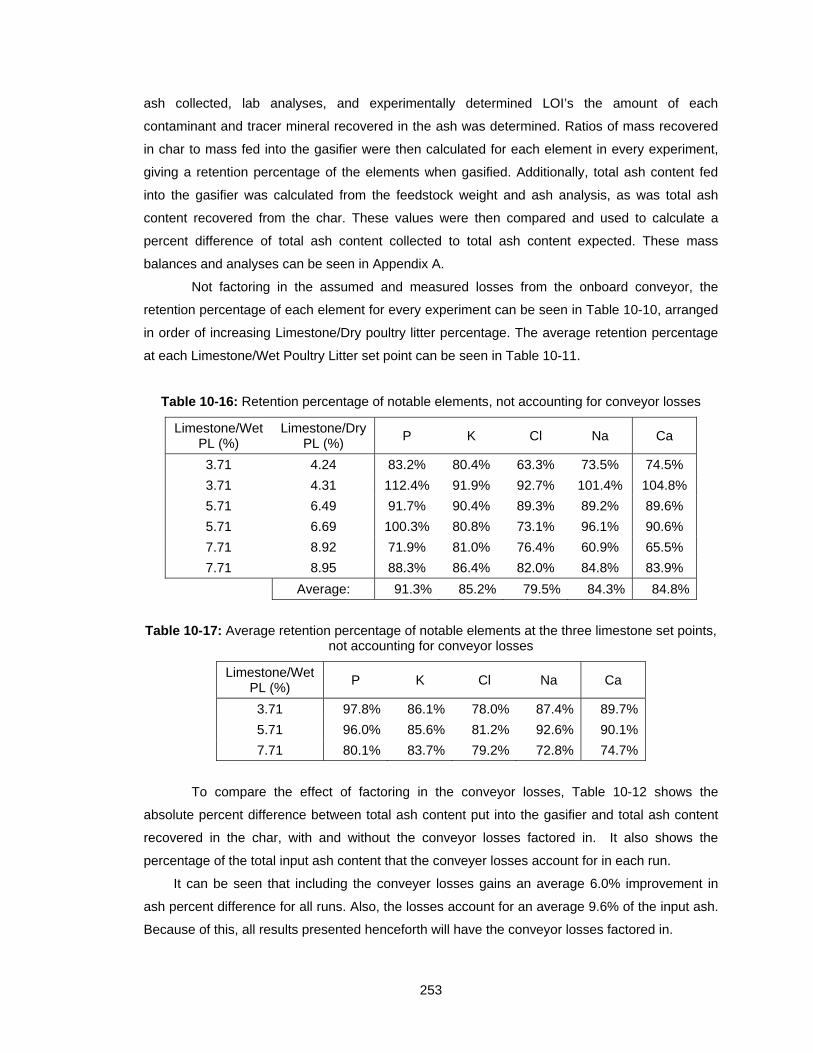
253
ash collected, lab analyses, and experimentally determined LOI’s the amount of each
contaminant and tracer mineral recovered in the ash was determined. Ratios of mass recovered
in char to mass fed into the gasifier were then calculated for each element in every experiment,
giving a retention percentage of the elements when gasified. Additionally, total ash content fed
into the gasifier was calculated from the feedstock weight and ash analysis, as was total ash
content recovered from the char. These values were then compared and used to calculate a
percent difference of total ash content collected to total ash content expected. These mass
balances and analyses can be seen in Appendix A.
Not factoring in the assumed and measured losses from the onboard conveyor, the
retention percentage of each element for every experiment can be seen in Table 10-10, arranged
in order of increasing Limestone/Dry poultry litter percentage. The average retention percentage
at each Limestone/Wet Poultry Litter set point can be seen in Table 10-11.
Table 10-16: Retention percentage of notable elements, not accounting for conveyor losses
Limestone/Wet PL (%)
Limestone/Dry PL (%)
P K Cl Na Ca
3.71 4.24 83.2% 80.4% 63.3% 73.5% 74.5%
3.71 4.31 112.4% 91.9% 92.7% 101.4% 104.8%
5.71 6.49 91.7% 90.4% 89.3% 89.2% 89.6%
5.71 6.69 100.3% 80.8% 73.1% 96.1% 90.6%
7.71 8.92 71.9% 81.0% 76.4% 60.9% 65.5%
7.71 8.95 88.3% 86.4% 82.0% 84.8% 83.9%
Average: 91.3% 85.2% 79.5% 84.3% 84.8%
Table 10-17: Average retention percentage of notable elements at the three limestone set points, not accounting for conveyor losses
Limestone/Wet PL (%)
P K Cl Na Ca
3.71 97.8% 86.1% 78.0% 87.4% 89.7%
5.71 96.0% 85.6% 81.2% 92.6% 90.1%
7.71 80.1% 83.7% 79.2% 72.8% 74.7%
To compare the effect of factoring in the conveyor losses, Table 10-12 shows the
absolute percent difference between total ash content put into the gasifier and total ash content
recovered in the char, with and without the conveyor losses factored in. It also shows the
percentage of the total input ash content that the conveyer losses account for in each run.
It can be seen that including the conveyer losses gains an average 6.0% improvement in
ash percent difference for all runs. Also, the losses account for an average 9.6% of the input ash.
Because of this, all results presented henceforth will have the conveyor losses factored in.
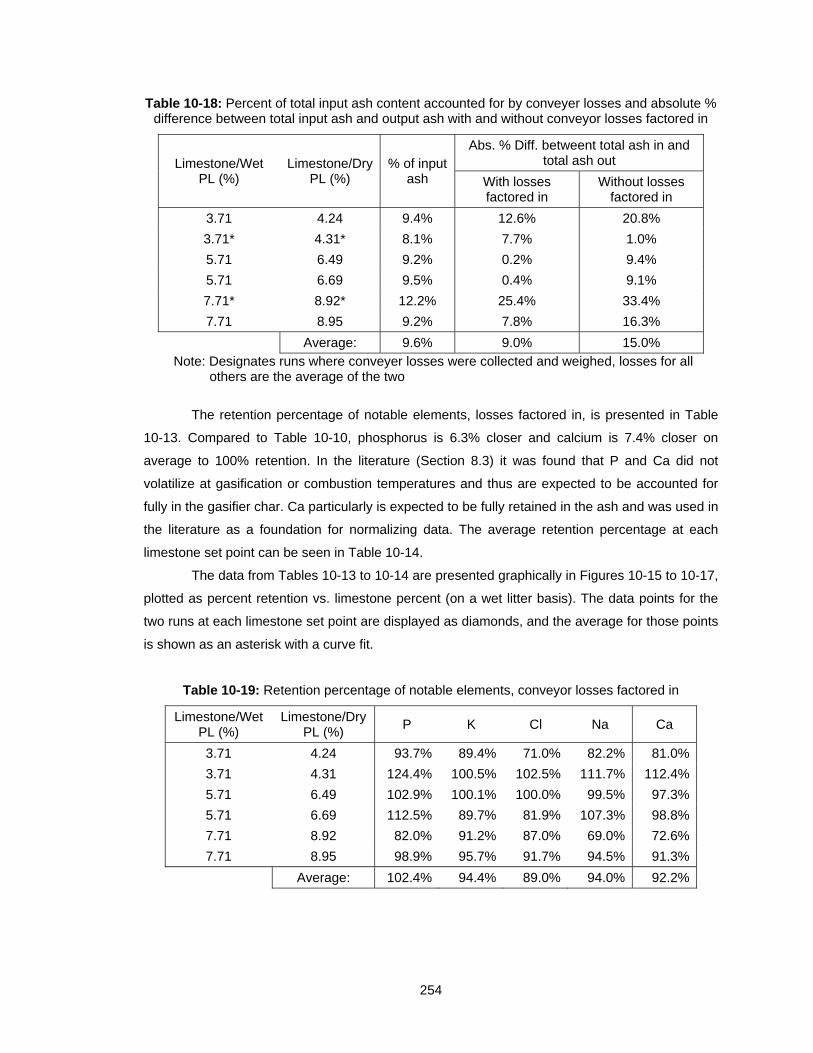
254
Table 10-18: Percent of total input ash content accounted for by conveyer losses and absolute % difference between total input ash and output ash with and without conveyor losses factored in
Limestone/Wet PL (%)
Limestone/Dry PL (%)
% of input ash
Abs. % Diff. betweent total ash in and total ash out
With losses factored in
Without losses factored in
3.71 4.24 9.4% 12.6% 20.8%
3.71* 4.31* 8.1% 7.7% 1.0%
5.71 6.49 9.2% 0.2% 9.4%
5.71 6.69 9.5% 0.4% 9.1%
7.71* 8.92* 12.2% 25.4% 33.4%
7.71 8.95 9.2% 7.8% 16.3%
Average: 9.6% 9.0% 15.0%
Note: Designates runs where conveyer losses were collected and weighed, losses for all others are the average of the two
The retention percentage of notable elements, losses factored in, is presented in Table
10-13. Compared to Table 10-10, phosphorus is 6.3% closer and calcium is 7.4% closer on
average to 100% retention. In the literature (Section 8.3) it was found that P and Ca did not
volatilize at gasification or combustion temperatures and thus are expected to be accounted for
fully in the gasifier char. Ca particularly is expected to be fully retained in the ash and was used in
the literature as a foundation for normalizing data. The average retention percentage at each
limestone set point can be seen in Table 10-14.
The data from Tables 10-13 to 10-14 are presented graphically in Figures 10-15 to 10-17,
plotted as percent retention vs. limestone percent (on a wet litter basis). The data points for the
two runs at each limestone set point are displayed as diamonds, and the average for those points
is shown as an asterisk with a curve fit.
Table 10-19: Retention percentage of notable elements, conveyor losses factored in
Limestone/Wet PL (%)
Limestone/Dry PL (%)
P K Cl Na Ca
3.71 4.24 93.7% 89.4% 71.0% 82.2% 81.0%
3.71 4.31 124.4% 100.5% 102.5% 111.7% 112.4%
5.71 6.49 102.9% 100.1% 100.0% 99.5% 97.3%
5.71 6.69 112.5% 89.7% 81.9% 107.3% 98.8%
7.71 8.92 82.0% 91.2% 87.0% 69.0% 72.6%
7.71 8.95 98.9% 95.7% 91.7% 94.5% 91.3%
Average: 102.4% 94.4% 89.0% 94.0% 92.2%

255
Table 10-20: Average retention percentage of notable elements, conveyor losses factored in
Limestone/Wet PL (%)
P K Cl Na Ca
3.71 109.0% 95.0% 86.8% 97.0% 96.7%
5.71 107.7% 94.9% 91.0% 103.4% 98.1%
7.71 90.5% 93.4% 89.3% 81.7% 81.9%
Figure 10-32: Chlorine Retention vs. Limestone Percentage
Chlorine is retained quite well, the average being 89.0%. The average at each set point
doesn’t vary much from the overall average, indicating little effect of limestone percentage on
chlorine retention, at least within the range tested. The average potassium retention appears
steady between limestone percentages, straying little from the overall average of 94.4%. The
trend lines for Na, P, and Ca, however, all decline quite substantially with increasing limestone
percentage. It may be possible for Ca that as more limestone is mixed with the raw poultry litter,
there is also more that is lost as dust while mixing or that falls through the conveyor while feeding.
However, phosphorus shows a similar decrease and the extremely low P content in limestone
(0.05% dry basis, Table 10-4.) prevents that theory for accounting for the losses of both of these
elements that were expected to be fully retained. Analyzing the numbers from Tables 10-13 and
10-12 it can be seen that the experiment contributing most to the low average of Na, P, and Ca at
7.71% limestone also has the largest percent difference between total ash in and out: 25.4%
even after including the conveyor losses. Additionally, it can be observed from Table 10-13 that
the calcium retention percentage for each experiment is very indicative of the percent retention of
the other elements for that run. For example, in an experiment when Ca is lower than the
0%
20%
40%
60%
80%
100%
120%
3.5% 4.5% 5.5% 6.5% 7.5% 8.5%
Per
cen
t R
eten
tion
Percent Limestone/Wet PL
Average
Data Points
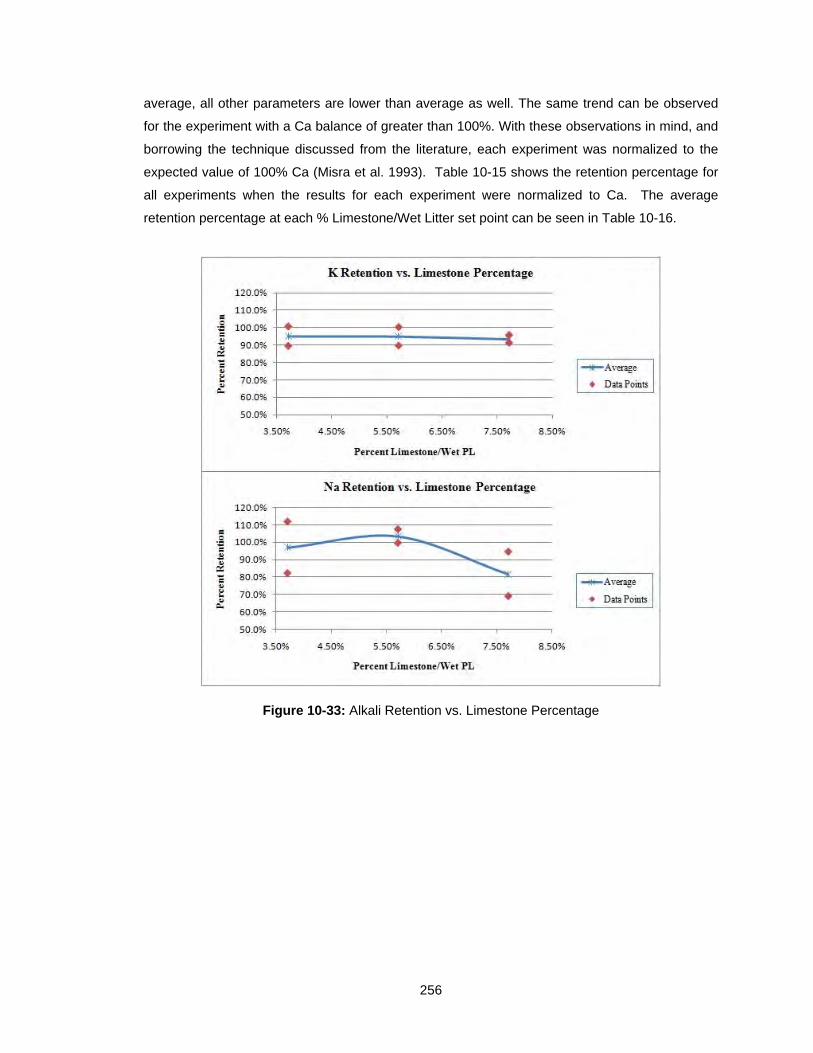
256
average, all other parameters are lower than average as well. The same trend can be observed
for the experiment with a Ca balance of greater than 100%. With these observations in mind, and
borrowing the technique discussed from the literature, each experiment was normalized to the
expected value of 100% Ca (Misra et al. 1993). Table 10-15 shows the retention percentage for
all experiments when the results for each experiment were normalized to Ca. The average
retention percentage at each % Limestone/Wet Litter set point can be seen in Table 10-16.
Figure 10-33: Alkali Retention vs. Limestone Percentage
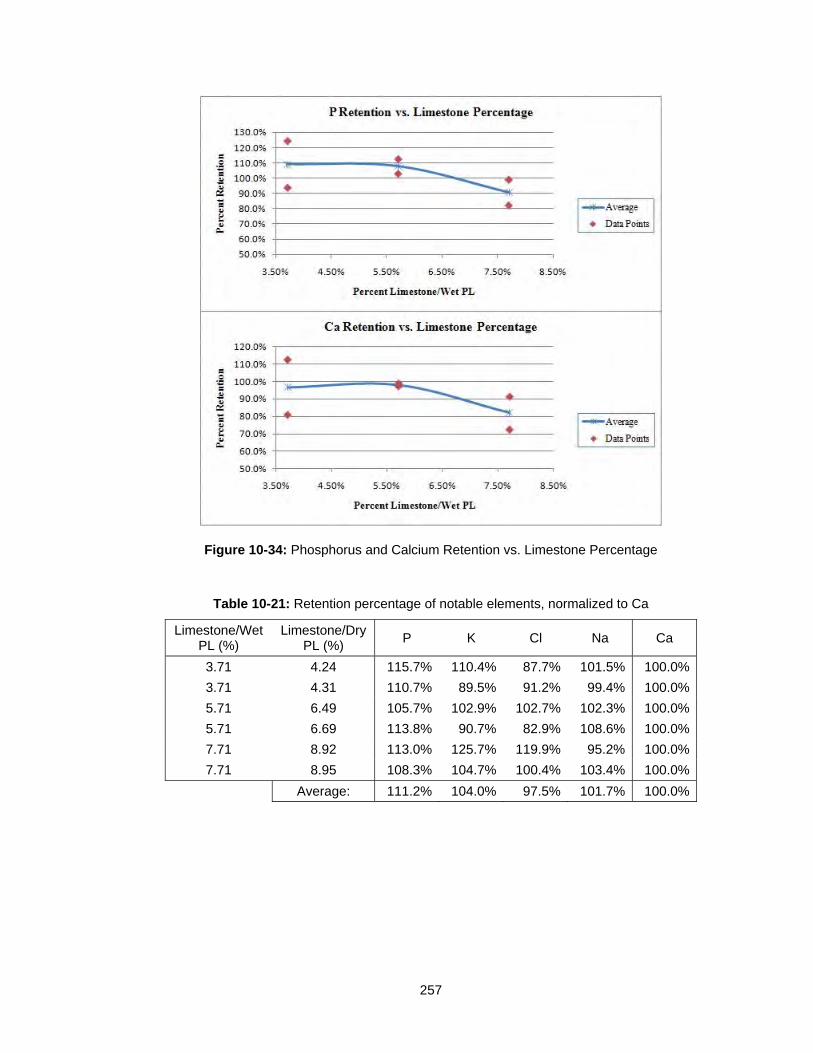
257
Figure 10-34: Phosphorus and Calcium Retention vs. Limestone Percentage
Table 10-21: Retention percentage of notable elements, normalized to Ca
Limestone/Wet PL (%)
Limestone/Dry PL (%)
P K Cl Na Ca
3.71 4.24 115.7% 110.4% 87.7% 101.5% 100.0%
3.71 4.31 110.7% 89.5% 91.2% 99.4% 100.0%
5.71 6.49 105.7% 102.9% 102.7% 102.3% 100.0%
5.71 6.69 113.8% 90.7% 82.9% 108.6% 100.0%
7.71 8.92 113.0% 125.7% 119.9% 95.2% 100.0%
7.71 8.95 108.3% 104.7% 100.4% 103.4% 100.0%
Average: 111.2% 104.0% 97.5% 101.7% 100.0%
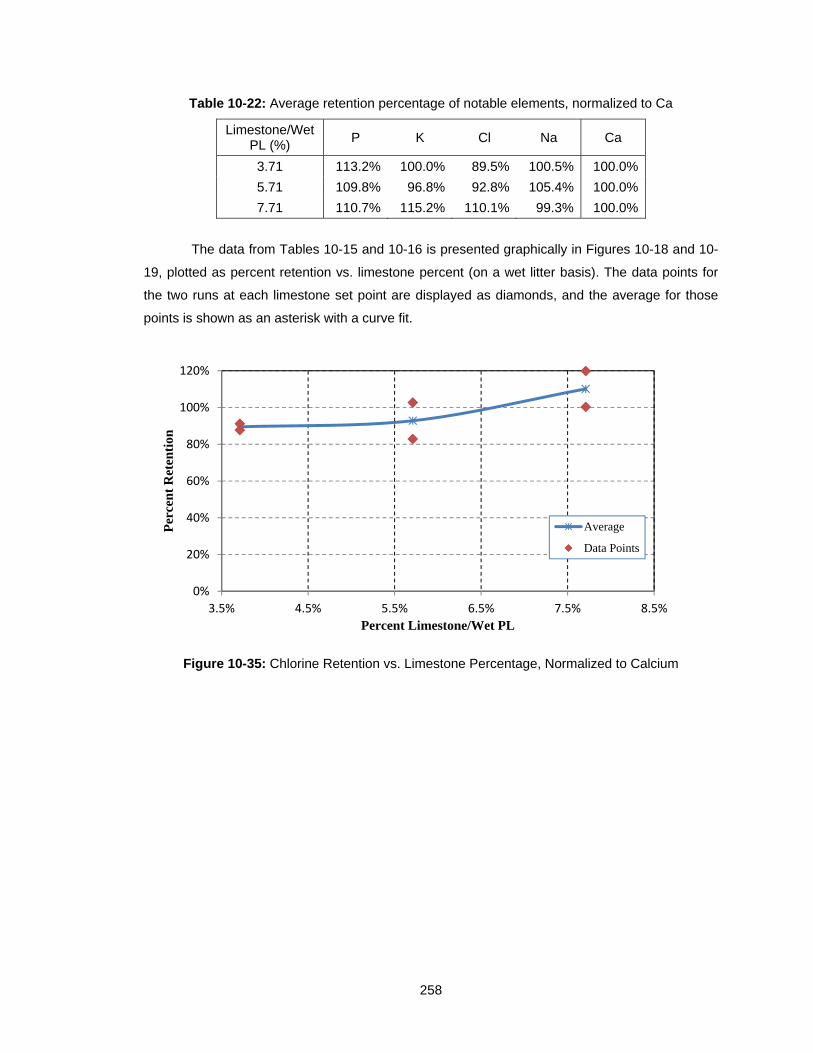
258
Table 10-22: Average retention percentage of notable elements, normalized to Ca
Limestone/Wet PL (%)
P K Cl Na Ca
3.71 113.2% 100.0% 89.5% 100.5% 100.0%
5.71 109.8% 96.8% 92.8% 105.4% 100.0%
7.71 110.7% 115.2% 110.1% 99.3% 100.0%
The data from Tables 10-15 and 10-16 is presented graphically in Figures 10-18 and 10-
19, plotted as percent retention vs. limestone percent (on a wet litter basis). The data points for
the two runs at each limestone set point are displayed as diamonds, and the average for those
points is shown as an asterisk with a curve fit.
Figure 10-35: Chlorine Retention vs. Limestone Percentage, Normalized to Calcium
0%
20%
40%
60%
80%
100%
120%
3.5% 4.5% 5.5% 6.5% 7.5% 8.5%
Per
cen
t R
eten
tion
Percent Limestone/Wet PL
Average
Data Points

259
Figure 10-36: Potassium, Sodium, and Phosphorus Retention vs. Limestone Percentage
Normalizing to calcium tightened up most of the data points. The span between the two
data points at each limestone percentage improved on average from 16.8% to 11.0% for every
element excluding Ca. The phosphorus trend line is now flattened out and the average retention
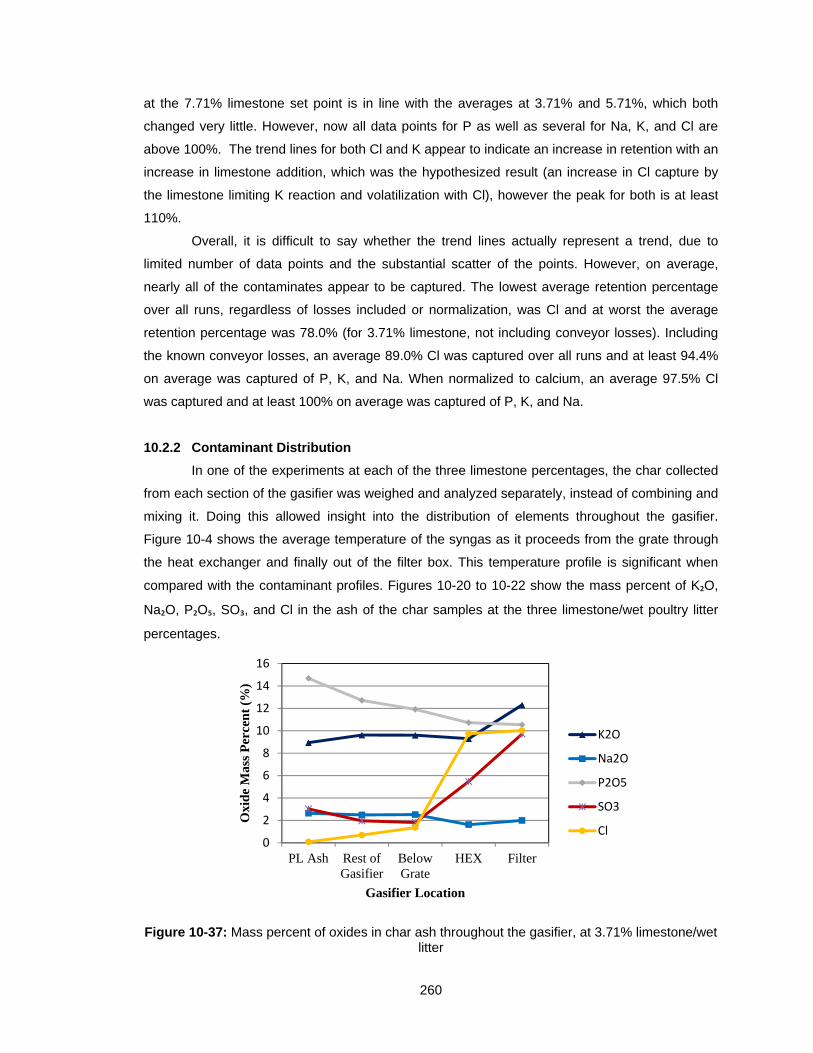
260
at the 7.71% limestone set point is in line with the averages at 3.71% and 5.71%, which both
changed very little. However, now all data points for P as well as several for Na, K, and Cl are
above 100%. The trend lines for both Cl and K appear to indicate an increase in retention with an
increase in limestone addition, which was the hypothesized result (an increase in Cl capture by
the limestone limiting K reaction and volatilization with Cl), however the peak for both is at least
110%.
Overall, it is difficult to say whether the trend lines actually represent a trend, due to
limited number of data points and the substantial scatter of the points. However, on average,
nearly all of the contaminates appear to be captured. The lowest average retention percentage
over all runs, regardless of losses included or normalization, was Cl and at worst the average
retention percentage was 78.0% (for 3.71% limestone, not including conveyor losses). Including
the known conveyor losses, an average 89.0% Cl was captured over all runs and at least 94.4%
on average was captured of P, K, and Na. When normalized to calcium, an average 97.5% Cl
was captured and at least 100% on average was captured of P, K, and Na.
10.2.2 Contaminant Distribution
In one of the experiments at each of the three limestone percentages, the char collected
from each section of the gasifier was weighed and analyzed separately, instead of combining and
mixing it. Doing this allowed insight into the distribution of elements throughout the gasifier.
Figure 10-4 shows the average temperature of the syngas as it proceeds from the grate through
the heat exchanger and finally out of the filter box. This temperature profile is significant when
compared with the contaminant profiles. Figures 10-20 to 10-22 show the mass percent of K₂O,
Na₂O, P₂O₅, SO₃, and Cl in the ash of the char samples at the three limestone/wet poultry litter
percentages.
Figure 10-37: Mass percent of oxides in char ash throughout the gasifier, at 3.71% limestone/wet litter
0
2
4
6
8
10
12
14
16
PL Ash Rest ofGasifier
BelowGrate
HEX Filter
Oxi
de
Mas
s P
erce
nt
(%)
Gasifier Location
K2O
Na2O
P2O5
SO3
Cl
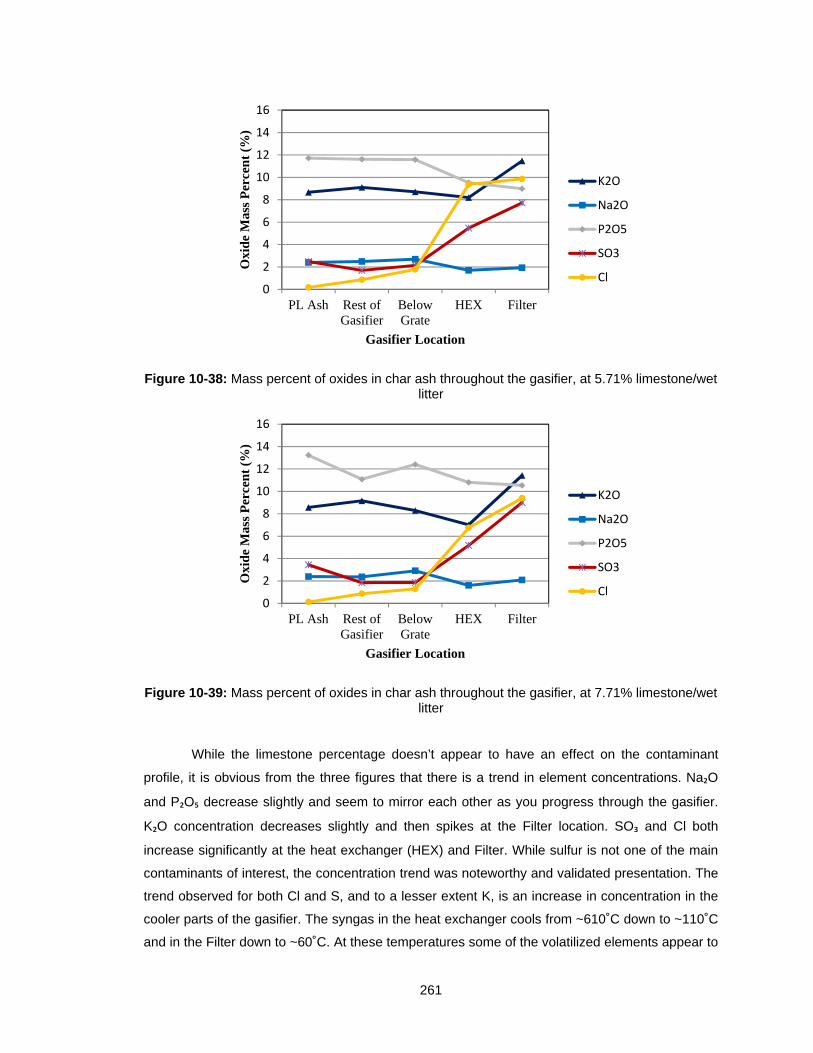
261
Figure 10-38: Mass percent of oxides in char ash throughout the gasifier, at 5.71% limestone/wet litter
Figure 10-39: Mass percent of oxides in char ash throughout the gasifier, at 7.71% limestone/wet litter
While the limestone percentage doesn’t appear to have an effect on the contaminant
profile, it is obvious from the three figures that there is a trend in element concentrations. Na₂O
and P₂O₅ decrease slightly and seem to mirror each other as you progress through the gasifier.
K₂O concentration decreases slightly and then spikes at the Filter location. SO₃ and Cl both
increase significantly at the heat exchanger (HEX) and Filter. While sulfur is not one of the main
contaminants of interest, the concentration trend was noteworthy and validated presentation. The
trend observed for both Cl and S, and to a lesser extent K, is an increase in concentration in the
cooler parts of the gasifier. The syngas in the heat exchanger cools from ~610˚C down to ~110˚C
and in the Filter down to ~60˚C. At these temperatures some of the volatilized elements appear to
0
2
4
6
8
10
12
14
16
PL Ash Rest ofGasifier
BelowGrate
HEX Filter
Oxi
de
Mas
s P
erce
nt
(%)
Gasifier Location
K2O
Na2O
P2O5
SO3
Cl
0
2
4
6
8
10
12
14
16
PL Ash Rest ofGasifier
BelowGrate
HEX Filter
Oxi
de
Mas
s P
erce
nt
(%)
Gasifier Location
K2O
Na2O
P2O5
SO3
Cl
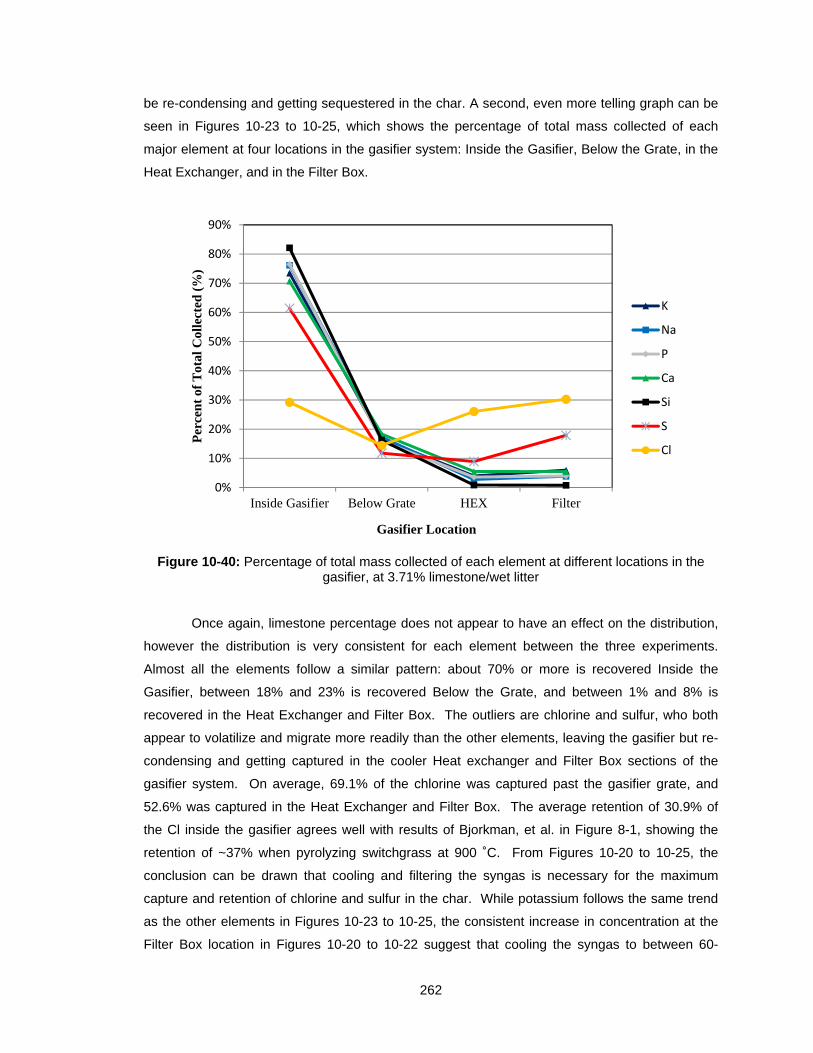
262
be re-condensing and getting sequestered in the char. A second, even more telling graph can be
seen in Figures 10-23 to 10-25, which shows the percentage of total mass collected of each
major element at four locations in the gasifier system: Inside the Gasifier, Below the Grate, in the
Heat Exchanger, and in the Filter Box.
Figure 10-40: Percentage of total mass collected of each element at different locations in the gasifier, at 3.71% limestone/wet litter
Once again, limestone percentage does not appear to have an effect on the distribution,
however the distribution is very consistent for each element between the three experiments.
Almost all the elements follow a similar pattern: about 70% or more is recovered Inside the
Gasifier, between 18% and 23% is recovered Below the Grate, and between 1% and 8% is
recovered in the Heat Exchanger and Filter Box. The outliers are chlorine and sulfur, who both
appear to volatilize and migrate more readily than the other elements, leaving the gasifier but re-
condensing and getting captured in the cooler Heat exchanger and Filter Box sections of the
gasifier system. On average, 69.1% of the chlorine was captured past the gasifier grate, and
52.6% was captured in the Heat Exchanger and Filter Box. The average retention of 30.9% of
the Cl inside the gasifier agrees well with results of Bjorkman, et al. in Figure 8-1, showing the
retention of ~37% when pyrolyzing switchgrass at 900 ˚C. From Figures 10-20 to 10-25, the
conclusion can be drawn that cooling and filtering the syngas is necessary for the maximum
capture and retention of chlorine and sulfur in the char. While potassium follows the same trend
as the other elements in Figures 10-23 to 10-25, the consistent increase in concentration at the
Filter Box location in Figures 10-20 to 10-22 suggest that cooling the syngas to between 60-
0%
10%
20%
30%
40%
50%
60%
70%
80%
90%
Inside Gasifier Below Grate HEX Filter
Per
cen
t of
Tot
al C
olle
cted
(%
)
Gasifier Location
K
Na
P
Ca
Si
S
Cl
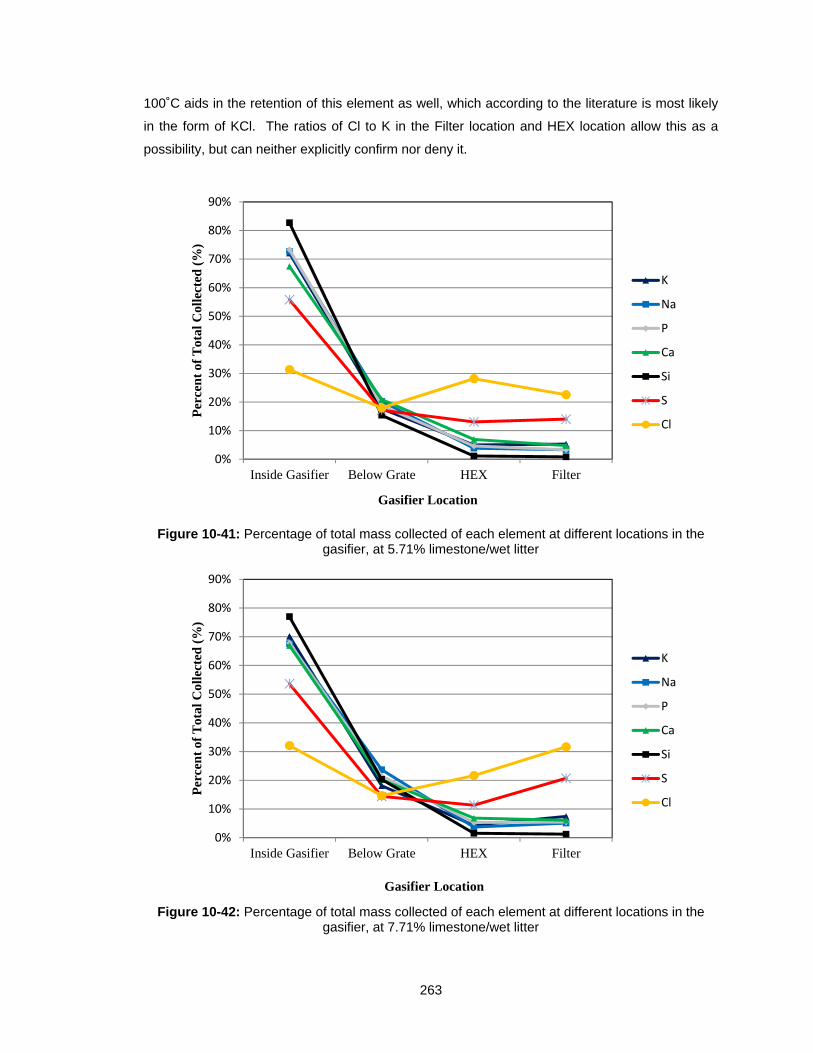
263
100˚C aids in the retention of this element as well, which according to the literature is most likely
in the form of KCl. The ratios of Cl to K in the Filter location and HEX location allow this as a
possibility, but can neither explicitly confirm nor deny it.
Figure 10-41: Percentage of total mass collected of each element at different locations in the gasifier, at 5.71% limestone/wet litter
Figure 10-42: Percentage of total mass collected of each element at different locations in the gasifier, at 7.71% limestone/wet litter
0%
10%
20%
30%
40%
50%
60%
70%
80%
90%
Inside Gasifier Below Grate HEX Filter
Per
cen
t of
Tot
al C
olle
cted
(%
)
Gasifier Location
K
Na
P
Ca
Si
S
Cl
0%
10%
20%
30%
40%
50%
60%
70%
80%
90%
Inside Gasifier Below Grate HEX Filter
Per
cen
t of
Tot
al C
olle
cted
(%
)
Gasifier Location
K
Na
P
Ca
Si
S
Cl
264
10.2.3 Conclusions, Recommendations, and Sources of Error
Through experimentation, it was shown that downdraft gasification is effective as a
means of sequestering contaminants harmful to the cement manufacturing process while
extracting the usable chemical energy from poultry litter in the form of syngas. Conservatively,
89% of the chlorine can be retained in the char, as well as 94% of the potassium and sodium,
along with 100% of the phosphorus. It does, however, appear to be necessary to cool and filter
the syngas in the range of 60-110˚C to obtain maximum removal of the contaminants, particularly
Cl and K, from the syngas stream. Although sulfur is not a contaminant of high interest when
compared to the coal and coke used in the cement kiln, results show that cooling and filtering the
syngas limits its throughput as well. Variation of limestone percentage did not appear to have a
large effect on the capture rates, at least within the range tested, although the low set point of
3.71% limestone to wet poultry litter (4.24-4.31% dry) seemed to approach the minimum
limestone percentage necessary to avoid clinkering. As a result, a limestone percentage in the
range of the middle set point (5.71% limestone to wet poultry litter, 6.5-6.7% dry) emerged as the
preferred amount, limiting the use of an extra additive while providing a factor of safety against
clinkering issues.
It is yet to be determined, however, the effectiveness of the techniques used in the
experiments towards gasifying poultry litter of higher ash or chlorine contents. The raw litter used
successfully in the experiments had an ash content of about 20% on a dry basis. As seen in the
literature as well as the litter pellets used for earlier tests, ash content can be as high as 33% on
a dry basis, with an average in the literature of 25.2%. With this in mind, the recommended ratio
of 6.5-6.7% limestone to dry litter found in the experiments would be about 33-34% limestone to
poultry litter ash. Additional considerations to explore are: methods of eliminating the high
pressure drop across the gasifier due the poultry litter fines; further experimentation with poultry
litter pellets, perhaps with limestone pre-mixed in; use of different gasifier types; and
measurement of the concentration of contaminants in the syngas itself to round out the mass
balance and verify retention in the char.
There were many potential sources of error encountered in the experiments. Due to the
large scale of experiments and small size of the biomass and char samples analyzed, much of
the accuracy depended on the mixing and sampling involved. While mixing or sampling fine char
such as that collected from the heat exchanger or filter box (seen in Figures 10-13 and 10-14)
probably resulted in an accurate representative sample, char such as that marked ‘Rest of
Gasifier’ was very non-homogeneous (as seen in Figure 10-11) and a given sample could vary
highly in its accuracy of representation. While the ash analyses didn’t vary greatly between
experiments, the LOI varied by as much as 20% in one case between similar samples. An
example of a problem encountered when mixing is the presence of white, 1.5” (3.8 cm) deposits
found inside the gasifier, circled in Figure 10-26).
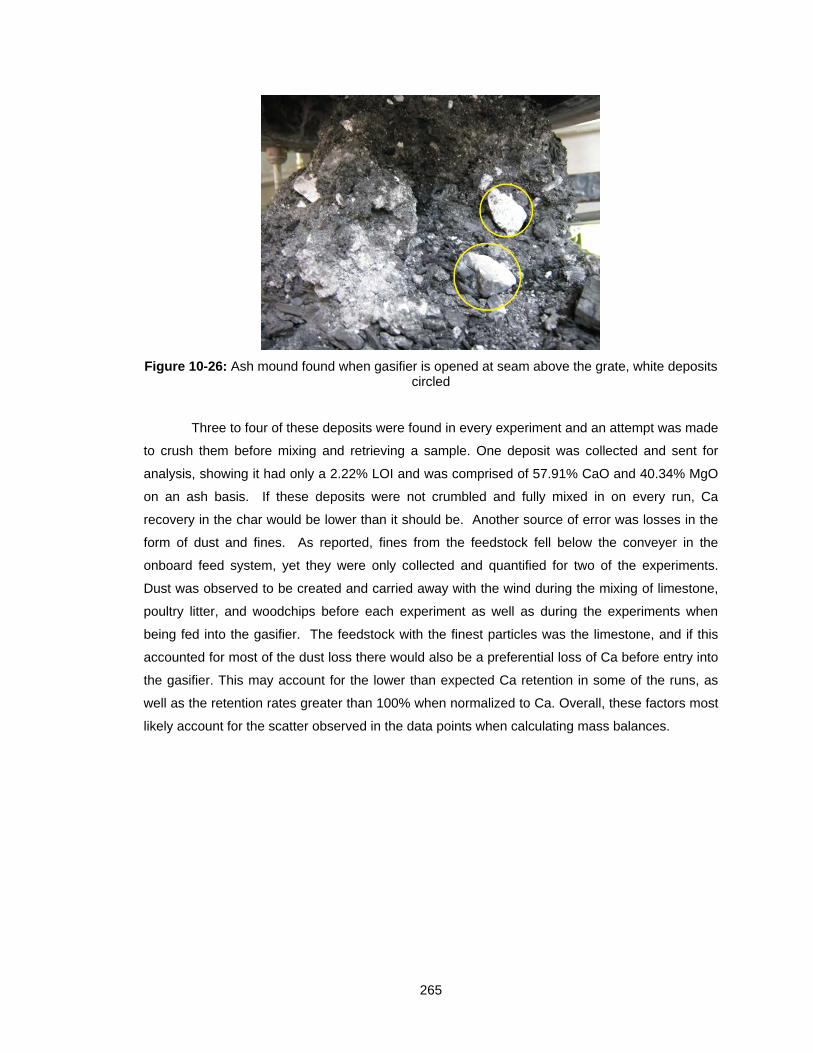
265
Figure 10-26: Ash mound found when gasifier is opened at seam above the grate, white deposits circled
Three to four of these deposits were found in every experiment and an attempt was made
to crush them before mixing and retrieving a sample. One deposit was collected and sent for
analysis, showing it had only a 2.22% LOI and was comprised of 57.91% CaO and 40.34% MgO
on an ash basis. If these deposits were not crumbled and fully mixed in on every run, Ca
recovery in the char would be lower than it should be. Another source of error was losses in the
form of dust and fines. As reported, fines from the feedstock fell below the conveyer in the
onboard feed system, yet they were only collected and quantified for two of the experiments.
Dust was observed to be created and carried away with the wind during the mixing of limestone,
poultry litter, and woodchips before each experiment as well as during the experiments when
being fed into the gasifier. The feedstock with the finest particles was the limestone, and if this
accounted for most of the dust loss there would also be a preferential loss of Ca before entry into
the gasifier. This may account for the lower than expected Ca retention in some of the runs, as
well as the retention rates greater than 100% when normalized to Ca. Overall, these factors most
likely account for the scatter observed in the data points when calculating mass balances.
266
CHAPTER 11
PART 3—CONCLUSIONS AND RECOMMENDATIONS
11.1 SUMMARY OF WORK AND CONCLUSIONS
Downdraft gasification has been explored as a means to extract chemical energy from poultry
litter while limiting the throughput of potentially deleterious components with regards to use in
firing a cement kiln. Experiments with temperature depression via flue gas recirculation,
feedstock dilution using woodchips, and experiments employing limestone as an additive to
prevent fusion and aid in chlorine retention in the ash have been carried out. Flue gas
recirculation allowed the reduction of the gasifier secondary air oxygen concentration by 40-45%,
yielding an approximately 100˚C depression in average temperature. Results have shown that the
clinkering is temperature independent, at least within the controllable temperature range.
Limestone also had only a slight effect on the fusion when used to coat the pellets. However,
limestone addition did display some promise in regards to chlorine capture, as ash analyses
showed chlorine concentrations of more than four times greater in the limestone infused ash as
compared to raw poultry litter. Experiments were conducted to explore the effectiveness of mixing
limestone with raw poultry litter, the object being to coat more surface area and have a more even
mixture. These resulted in the most consistent experiments with no ash clinkering.
Once consistent gasification of raw poultry litter was achieved through a combination of
woodchip dilution (60% woodchips:40% poultry litter) and addition of limestone at 5% of the wet
poultry litter mass (~6.5% Limestone/Dry Poultry Litter), experiments were performed to
determine the capture rates of the contaminants pertinent to cement kilns. Limestone percentage
was varied to explore its effect on chlorine retention at set points of 3.71, 5.71, and 7.71%
limestone to wet poultry litter, the middle quantity slightly inflated from the previously used 5% to
account for lower moisture of the litter used in these experiments. It was found that limestone
percentage, at least within the tested range, had little effect on neither the retention of
contaminants nor distribution of contaminants through the gasifier system. On average, 89% of
the chlorine was retained in the gasifier char, as was 94% of both the potassium and sodium, and
100% of the phosphorus. When data was normalized to 100% calcium retention (expected from
the literature), an average 100% of the Na, K, and P were shown to be retained, as well as 97.5%
of the Cl. The contaminant profile, developed from analyses of char samples from different
sections of the gasifier system, showed that 69.1% of the chlorine retained was captured past the
gasifier grate and 52.6% was captured in the significantly cooler Filter Box and Heat Exchanger
sections of the gasifier system. Additionally, peaks in concentration of sulfur and potassium were
267
observed in these same sections. From these results, it appears necessary to cool and filter the
syngas in the range of 60-110˚C to obtain maximum removal of Cl, as well as K and S, from the
syngas stream.
11.2 RECOMMENDATIONS FOR FUTURE RESEARCH
Before implementing poultry litter gasification, further research should be performed. Based on
the research in this report, the following recommendations can be made:
1. The high pressure drop across the gasifier when using raw poultry litter should be
examined and methods of alleviating this explored. One suggestion is making poultry
litter and limestone pellets, pre-mixed in the correct ratio.
2. Other methods of gasification should be explored to compare their effectiveness in
capturing contaminants as well as ease and consistency of operation using poultry litter.
Design of a specialized gasifier around the high ash content, easily-clinkering poultry litter
feedstock could be explored.
3. Ways of increasing the percentage of poultry litter fed into the gasifier while maintaining
stable performance should be explored.
4. A study measuring the concentration of contaminants in the syngas itself could be
performed to close in the mass balance and verify retention of contaminants in the char.
5. The degree to which the syngas needs to be cooled and filtered to remove the maximum
amount of contaminants should be examined.
11.3 RECOMMENDATIONS FOR IMPLEMENTATION
The following recommendations are made toward implementing gasification of poultry litter as a
cement kiln fuel supplement:
1. Using a downdraft gasifier, it is necessary to dilute raw poultry litter to 35-40% and add
6.5% limestone/dry litter weight to prevent clinker formation and consistent syngas
production.
2. Contaminant retention appeared to be independent of limestone percentage, so addition
of ~6.5% limestone/dry litter weight is the recommended ratio to limit the use of
unnecessary extra additive while providing a factor of safety against clinkering issues.
3. Conservative contaminant retention percentages to expect when using the methods in
this report are: 89% chlorine retention, 94% potassium and sodium retention, and 100%
phosphorus retention.
4. Cooling and filtering the syngas at 60-100˚C appears to be necessary in capturing the
maximum amount of contaminants.
268
PART 4
Develop Sampling Procedure to Estimate
Combustion Quality of Broiler Litter
269
CHAPTER 12
DEVELOP SAMPLING PROCEDURE TO ESTIMATE
COMBUSTION QUALITY OF BROILER LITTER
12.1 INTRODUCTION
Broiler litter is defined as the combination of bedding material (such as wood shavings), excreta,
feathers, wasted feed and wasted water. There are approximately 100,000 broiler houses in the
US. Each broiler house may contain flocks of 10,000 to 30,000 birds and produce 5 to 6 flocks
per year, with an average litter production of 1.25 tons per 1,000 birds. Building structures
commonly located on broiler farms are shown in Figure 12-1. The primary method of broiler litter
disposal is land application. With growing concerns of environmental thresholds in nutrient
management, other methods must be developed. Technologies exits that utilize animal waste
material for the production of heat and/or electricity. However, heterogeneity in the chemical
composition of broiler litter makes it difficult to optimize its use as a commercial combustion fuel.
Therefore, the objective of this task was to develop a reliable but convenient sampling procedure
to estimate the combustion quality of broiler litter, thus facilitating pricing the material according to
quality.
Pine shavings and coarse pine sawdust are currently the most popular bedding material.
As a result of the availability and expense of these materials, poultry producers have developed
new methods in the removal of litter. In particular, built-up litter management is the practice that
has become standard in the poultry industry. Initially, litter is place on the dirt floor at a depth of
about 6 inches. Between flocks, the top 2-inch layer of litter is scraped to remove “cake” which is
the excessively moist material around the drinkers and feeders. This type of litter management
results in de-caking the house of crusted litter, preheating and ventilating the house prior to each
flock to purge existing ammonia and top dress with 2 inches of fresh pine shavings. Complete
litter removal occurs only once per year.
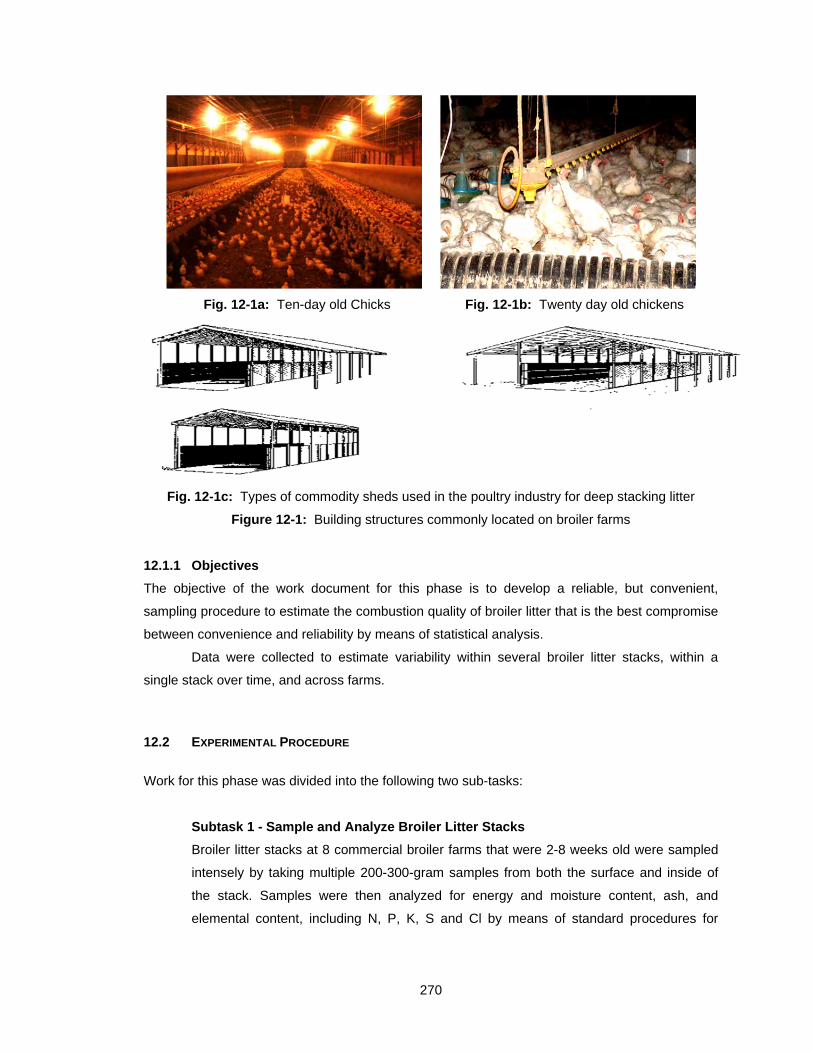
270
Fig. 12-1a: Ten-day old Chicks Fig. 12-1b: Twenty day old chickens
Fig. 12-1c: Types of commodity sheds used in the poultry industry for deep stacking litter
Figure 12-1: Building structures commonly located on broiler farms
12.1.1 Objectives
The objective of the work document for this phase is to develop a reliable, but convenient,
sampling procedure to estimate the combustion quality of broiler litter that is the best compromise
between convenience and reliability by means of statistical analysis.
Data were collected to estimate variability within several broiler litter stacks, within a
single stack over time, and across farms.
12.2 EXPERIMENTAL PROCEDURE
Work for this phase was divided into the following two sub-tasks:
Subtask 1 - Sample and Analyze Broiler Litter Stacks
Broiler litter stacks at 8 commercial broiler farms that were 2-8 weeks old were sampled
intensely by taking multiple 200-300-gram samples from both the surface and inside of
the stack. Samples were then analyzed for energy and moisture content, ash, and
elemental content, including N, P, K, S and Cl by means of standard procedures for
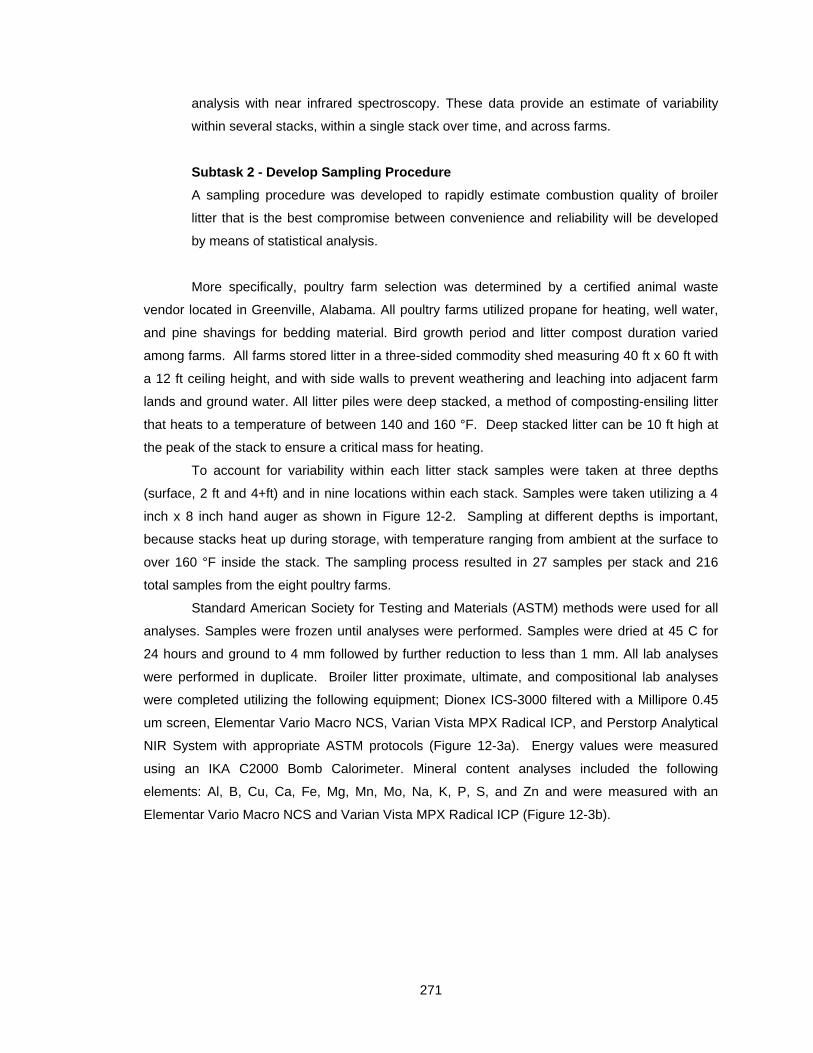
271
analysis with near infrared spectroscopy. These data provide an estimate of variability
within several stacks, within a single stack over time, and across farms.
Subtask 2 - Develop Sampling Procedure
A sampling procedure was developed to rapidly estimate combustion quality of broiler
litter that is the best compromise between convenience and reliability will be developed
by means of statistical analysis.
More specifically, poultry farm selection was determined by a certified animal waste
vendor located in Greenville, Alabama. All poultry farms utilized propane for heating, well water,
and pine shavings for bedding material. Bird growth period and litter compost duration varied
among farms. All farms stored litter in a three-sided commodity shed measuring 40 ft x 60 ft with
a 12 ft ceiling height, and with side walls to prevent weathering and leaching into adjacent farm
lands and ground water. All litter piles were deep stacked, a method of composting-ensiling litter
that heats to a temperature of between 140 and 160 °F. Deep stacked litter can be 10 ft high at
the peak of the stack to ensure a critical mass for heating.
To account for variability within each litter stack samples were taken at three depths
(surface, 2 ft and 4+ft) and in nine locations within each stack. Samples were taken utilizing a 4
inch x 8 inch hand auger as shown in Figure 12-2. Sampling at different depths is important,
because stacks heat up during storage, with temperature ranging from ambient at the surface to
over 160 °F inside the stack. The sampling process resulted in 27 samples per stack and 216
total samples from the eight poultry farms.
Standard American Society for Testing and Materials (ASTM) methods were used for all
analyses. Samples were frozen until analyses were performed. Samples were dried at 45 C for
24 hours and ground to 4 mm followed by further reduction to less than 1 mm. All lab analyses
were performed in duplicate. Broiler litter proximate, ultimate, and compositional lab analyses
were completed utilizing the following equipment; Dionex ICS-3000 filtered with a Millipore 0.45
um screen, Elementar Vario Macro NCS, Varian Vista MPX Radical ICP, and Perstorp Analytical
NIR System with appropriate ASTM protocols (Figure 12-3a). Energy values were measured
using an IKA C2000 Bomb Calorimeter. Mineral content analyses included the following
elements: Al, B, Cu, Ca, Fe, Mg, Mn, Mo, Na, K, P, S, and Zn and were measured with an
Elementar Vario Macro NCS and Varian Vista MPX Radical ICP (Figure 12-3b).
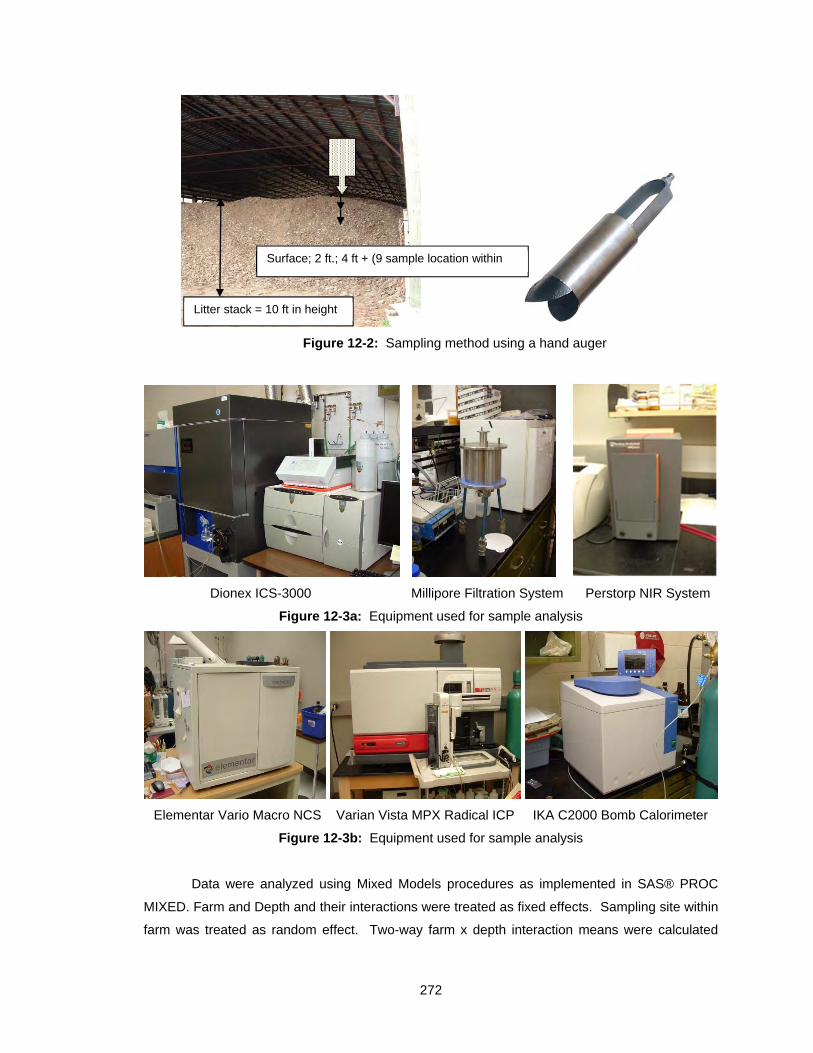
272
Figure 12-2: Sampling method using a hand auger
Dionex ICS-3000 Millipore Filtration System Perstorp NIR System
Figure 12-3a: Equipment used for sample analysis
Elementar Vario Macro NCS Varian Vista MPX Radical ICP IKA C2000 Bomb Calorimeter
Figure 12-3b: Equipment used for sample analysis
Data were analyzed using Mixed Models procedures as implemented in SAS® PROC
MIXED. Farm and Depth and their interactions were treated as fixed effects. Sampling site within
farm was treated as random effect. Two-way farm x depth interaction means were calculated
Litter stack = 10 ft in height
Surface; 2 ft.; 4 ft + (9 sample location within
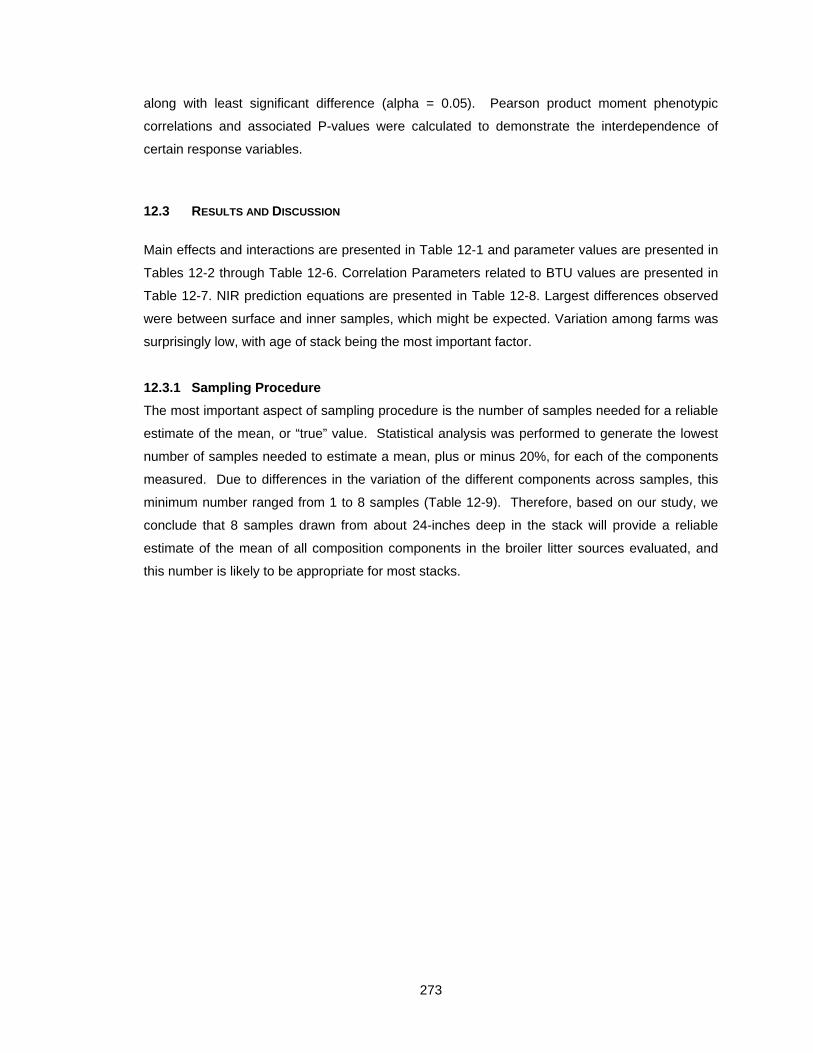
273
along with least significant difference (alpha = 0.05). Pearson product moment phenotypic
correlations and associated P-values were calculated to demonstrate the interdependence of
certain response variables.
12.3 RESULTS AND DISCUSSION
Main effects and interactions are presented in Table 12-1 and parameter values are presented in
Tables 12-2 through Table 12-6. Correlation Parameters related to BTU values are presented in
Table 12-7. NIR prediction equations are presented in Table 12-8. Largest differences observed
were between surface and inner samples, which might be expected. Variation among farms was
surprisingly low, with age of stack being the most important factor.
12.3.1 Sampling Procedure
The most important aspect of sampling procedure is the number of samples needed for a reliable
estimate of the mean, or “true” value. Statistical analysis was performed to generate the lowest
number of samples needed to estimate a mean, plus or minus 20%, for each of the components
measured. Due to differences in the variation of the different components across samples, this
minimum number ranged from 1 to 8 samples (Table 12-9). Therefore, based on our study, we
conclude that 8 samples drawn from about 24-inches deep in the stack will provide a reliable
estimate of the mean of all composition components in the broiler litter sources evaluated, and
this number is likely to be appropriate for most stacks.
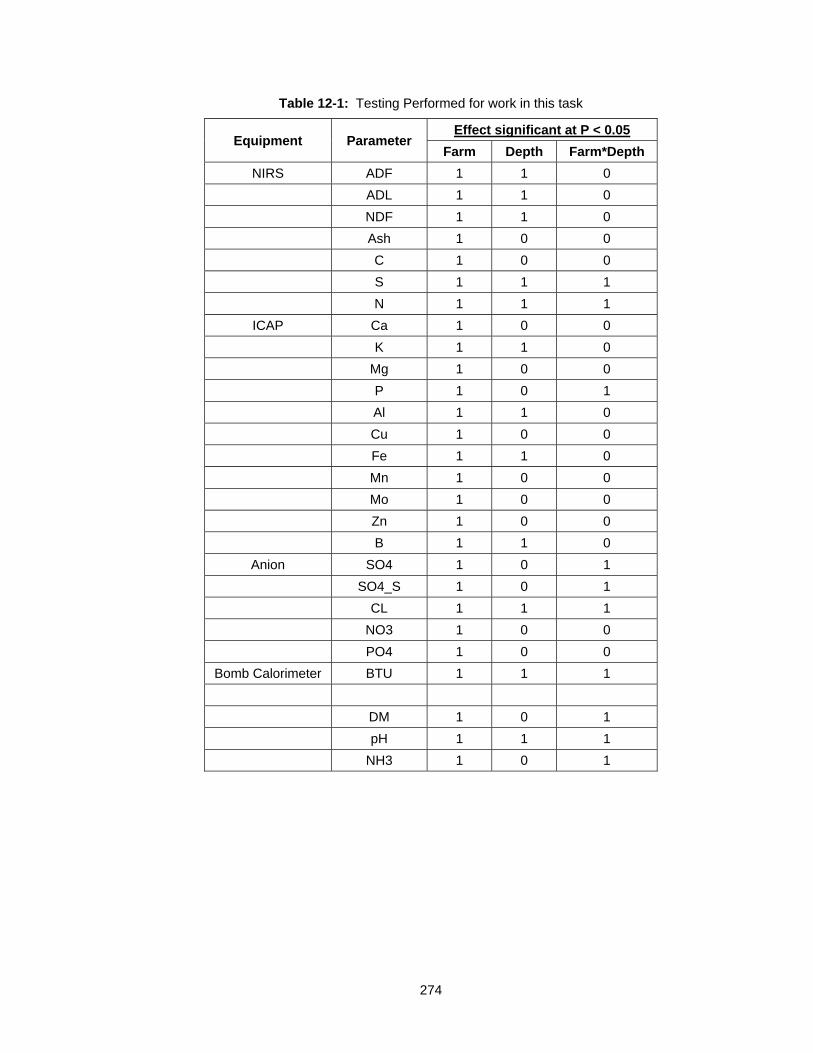
274
Table 12-1: Testing Performed for work in this task
Equipment Parameter Effect significant at P < 0.05
Farm Depth Farm*Depth
NIRS ADF 1 1 0
ADL 1 1 0
NDF 1 1 0
Ash 1 0 0
C 1 0 0
S 1 1 1
N 1 1 1
ICAP Ca 1 0 0
K 1 1 0
Mg 1 0 0
P 1 0 1
Al 1 1 0
Cu 1 0 0
Fe 1 1 0
Mn 1 0 0
Mo 1 0 0
Zn 1 0 0
B 1 1 0
Anion SO4 1 0 1
SO4_S 1 0 1
CL 1 1 1
NO3 1 0 0
PO4 1 0 0
Bomb Calorimeter BTU 1 1 1
DM 1 0 1
pH 1 1 1
NH3 1 0 1
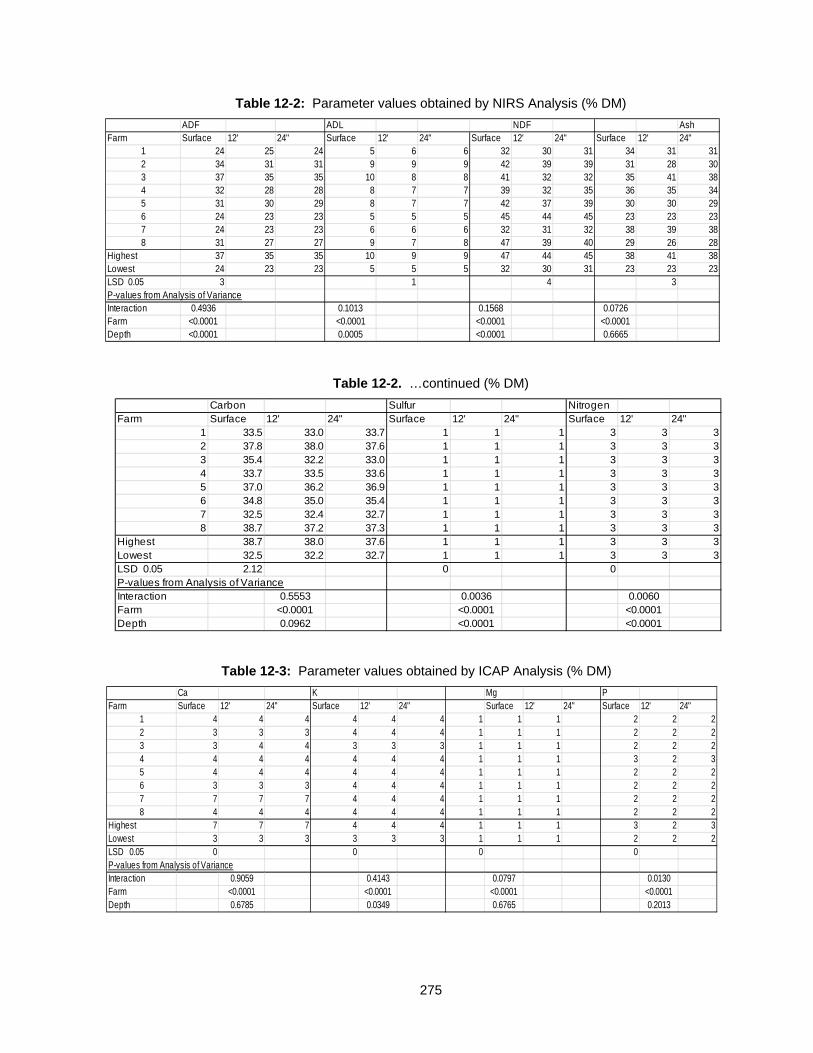
275
Table 12-2: Parameter values obtained by NIRS Analysis (% DM)
Table 12-2. …continued (% DM)
Table 12-3: Parameter values obtained by ICAP Analysis (% DM)
ADF ADL NDF AshFarm Surface 12' 24" Surface 12' 24" Surface 12' 24" Surface 12' 24"
1 24 25 24 5 6 6 32 30 31 34 31 312 34 31 31 9 9 9 42 39 39 31 28 303 37 35 35 10 8 8 41 32 32 35 41 384 32 28 28 8 7 7 39 32 35 36 35 345 31 30 29 8 7 7 42 37 39 30 30 296 24 23 23 5 5 5 45 44 45 23 23 237 24 23 23 6 6 6 32 31 32 38 39 388 31 27 27 9 7 8 47 39 40 29 26 28
Highest 37 35 35 10 9 9 47 44 45 38 41 38Lowest 24 23 23 5 5 5 32 30 31 23 23 23LSD 0.05 3 1 4 3P-values from Analysis of VarianceInteraction 0.4936 0.1013 0.1568 0.0726Farm <0.0001 <0.0001 <0.0001 <0.0001Depth <0.0001 0.0005 <0.0001 0.6665
Carbon Sulfur NitrogenFarm Surface 12' 24" Surface 12' 24" Surface 12' 24"
1 33.5 33.0 33.7 1 1 1 3 3 32 37.8 38.0 37.6 1 1 1 3 3 33 35.4 32.2 33.0 1 1 1 3 3 34 33.7 33.5 33.6 1 1 1 3 3 35 37.0 36.2 36.9 1 1 1 3 3 36 34.8 35.0 35.4 1 1 1 3 3 37 32.5 32.4 32.7 1 1 1 3 3 38 38.7 37.2 37.3 1 1 1 3 3 3
Highest 38.7 38.0 37.6 1 1 1 3 3 3Lowest 32.5 32.2 32.7 1 1 1 3 3 3LSD 0.05 2.12 0 0P-values from Analysis of VarianceInteraction 0.5553 0.0036 0.0060Farm <0.0001 <0.0001 <0.0001Depth 0.0962 <0.0001 <0.0001
Ca K Mg PFarm Surface 12' 24" Surface 12' 24" Surface 12' 24" Surface 12' 24"
1 4 4 4 4 4 4 1 1 1 2 2 22 3 3 3 4 4 4 1 1 1 2 2 23 3 4 4 3 3 3 1 1 1 2 2 24 4 4 4 4 4 4 1 1 1 3 2 35 4 4 4 4 4 4 1 1 1 2 2 26 3 3 3 4 4 4 1 1 1 2 2 27 7 7 7 4 4 4 1 1 1 2 2 28 4 4 4 4 4 4 1 1 1 2 2 2
Highest 7 7 7 4 4 4 1 1 1 3 2 3Lowest 3 3 3 3 3 3 1 1 1 2 2 2LSD 0.05 0 0 0 0P-values from Analysis of VarianceInteraction 0.9059 0.4143 0.0797 0.0130Farm <0.0001 <0.0001 <0.0001 <0.0001Depth 0.6785 0.0349 0.6765 0.2013

276
Table 12-4: Parameter values obtained by ICAP Analysis (ppm DM)
Table 12-4: … continued (ppm DM)
Table 12-5: Parameter values obtained by Anion Analysis (ppm as is basis)
Al B Cu FeFarm Surface 12' 24" Surface 12' 24" Surface 12' 24" Surface 12' 24"
1 4244 5016 4135 113 91 95 230 232 236 2732 2735 25262 3233 3034 2960 58 51 58 146 150 145 2735 2868 27413 3006 5058 3746 48 49 55 127 149 141 1875 2895 21334 2865 3341 2721 80 64 72 133 121 118 1710 2016 16565 2069 2640 2030 68 61 65 132 140 130 2272 2866 23726 579 576 457 89 63 67 218 225 221 801 879 7297 4092 4356 4077 106 85 96 233 218 223 2864 3082 29588 786 740 751 66 55 62 172 163 154 1197 1154 1148
Highest 4244 5058 4135 113 91 96 233 232 236 2864 3082 2958Lowest 579 576 457 48 49 55 127 121 118 801 879 729LSD 0.05 1009 11 29 537P-values from Analysis of VarianceInteraction 0.2044 0.1110 0.9210 0.6285Farm <0.0001 <0.0001 <0.0001 <0.0001Depth 0.0030 <0.0001 0.7031 0.0069
Mn Mo ZnFarm Surface 12' 24" Surface 12' 24" Surface 12' 24"
1 564 563 564 6 5 6 488 483 4862 535 553 547 6 6 7 460 465 4603 611 679 641 4 3 4 447 480 5054 692 715 689 5 5 4 660 614 6205 642 667 633 9 8 8 607 592 5766 566 508 557 9 7 8 590 558 5547 757 709 752 8 9 10 688 650 6748 633 602 679 8 7 10 628 580 604
Highest 757 715 752 9 9 10 688 650 674Lowest 535 508 547 4 3 4 447 465 460LSD 0.05 56 2 38P-values from Analysis of VarianceInteraction 0.2112 0.2332 0.0996Farm <0.0001 <0.0001 <0.0001Depth 0.7200 0.1719 0.0507
CL NO3 PO4 SO4_SFarm Surface 12' 24" Surface 12' 24" Surface 12' 24" Surface 12' 24"
1 7405 8294 7980 527 668 778 1792 2088 1908 2435 2847 25582 7542 7927 9024 595 474 669 3272 3359 3549 2460 2492 27933 5623 5315 6778 1227 1421 1308 2433 2470 2601 2590 2918 34454 6195 7137 7513 622 845 810 2584 2594 2740 2298 2745 28155 6874 5332 5521 758 344 330 1934 2206 1613 3225 2145 26646 7458 7074 7464 778 760 666 1245 1277 1280 2542 2409 25777 6399 6992 6406 1170 1125 1278 1546 1605 1476 2304 2471 22708 4836 6346 6003 588 453 489 1300 1408 1402 2089 2368 2425
Highest 7542 8294 9024 1227 1421 1308 3272 3359 3549 3225 2918 3445Lowest 4836 5315 5521 527 344 330 1245 1277 1280 2089 2145 2270LSD 0.05 1071 344 424 518P-values from Analysis of VarianceInteraction 0.0035 0.2206 0.8078 0.0029Farm <0.0001 <0.0001 <0.0001 0.0901Depth 0.0260 0.8686 0.4068 0.0854
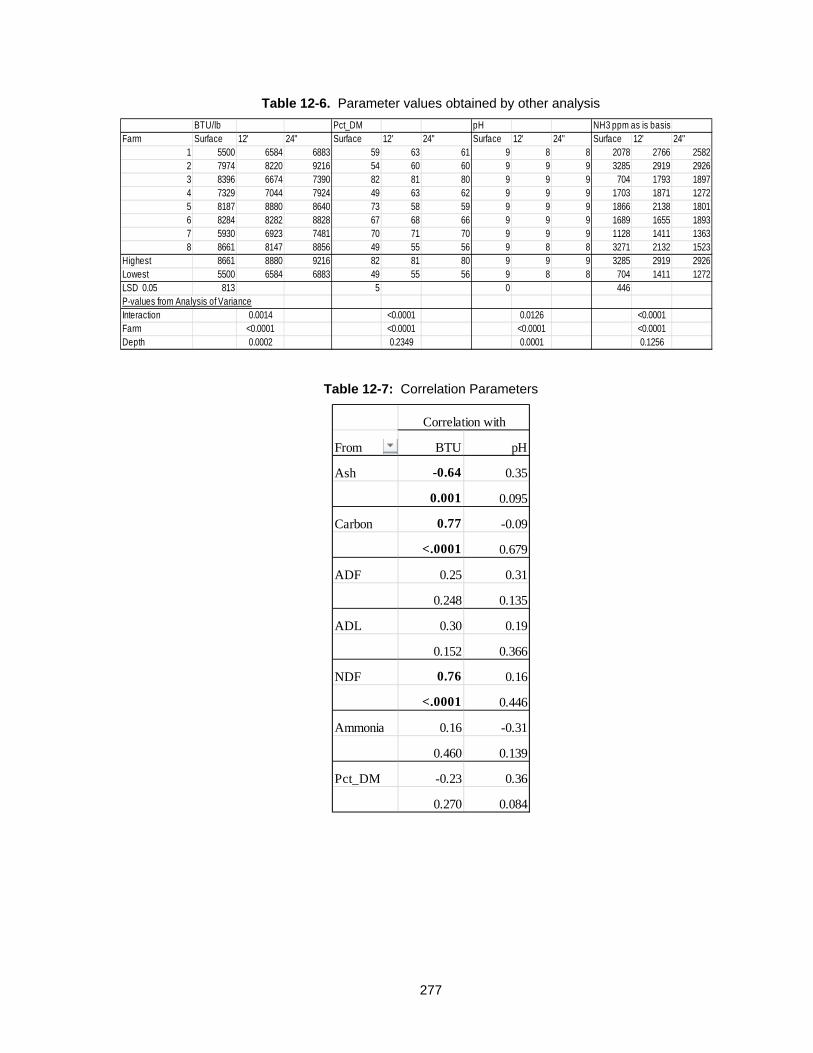
277
Table 12-6. Parameter values obtained by other analysis
Table 12-7: Correlation Parameters
BTU/lb Pct_DM pH NH3 ppm as is basisFarm Surface 12' 24" Surface 12' 24" Surface 12' 24" Surface 12' 24"
1 5500 6584 6883 59 63 61 9 8 8 2078 2766 25822 7974 8220 9216 54 60 60 9 9 9 3285 2919 29263 8396 6674 7390 82 81 80 9 9 9 704 1793 18974 7329 7044 7924 49 63 62 9 9 9 1703 1871 12725 8187 8880 8640 73 58 59 9 9 9 1866 2138 18016 8284 8282 8828 67 68 66 9 9 9 1689 1655 18937 5930 6923 7481 70 71 70 9 9 9 1128 1411 13638 8661 8147 8856 49 55 56 9 8 8 3271 2132 1523
Highest 8661 8880 9216 82 81 80 9 9 9 3285 2919 2926Lowest 5500 6584 6883 49 55 56 9 8 8 704 1411 1272LSD 0.05 813 5 0 446P-values from Analysis of VarianceInteraction 0.0014 <0.0001 0.0126 <0.0001Farm <0.0001 <0.0001 <0.0001 <0.0001Depth 0.0002 0.2349 0.0001 0.1256
From BTU pH
Ash -0.64 0.35
0.001 0.095
Carbon 0.77 -0.09
<.0001 0.679
ADF 0.25 0.31
0.248 0.135
ADL 0.30 0.19
0.152 0.366
NDF 0.76 0.16
<.0001 0.446
Ammonia 0.16 -0.31
0.460 0.139
Pct_DM -0.23 0.36
0.270 0.084
Correlation with
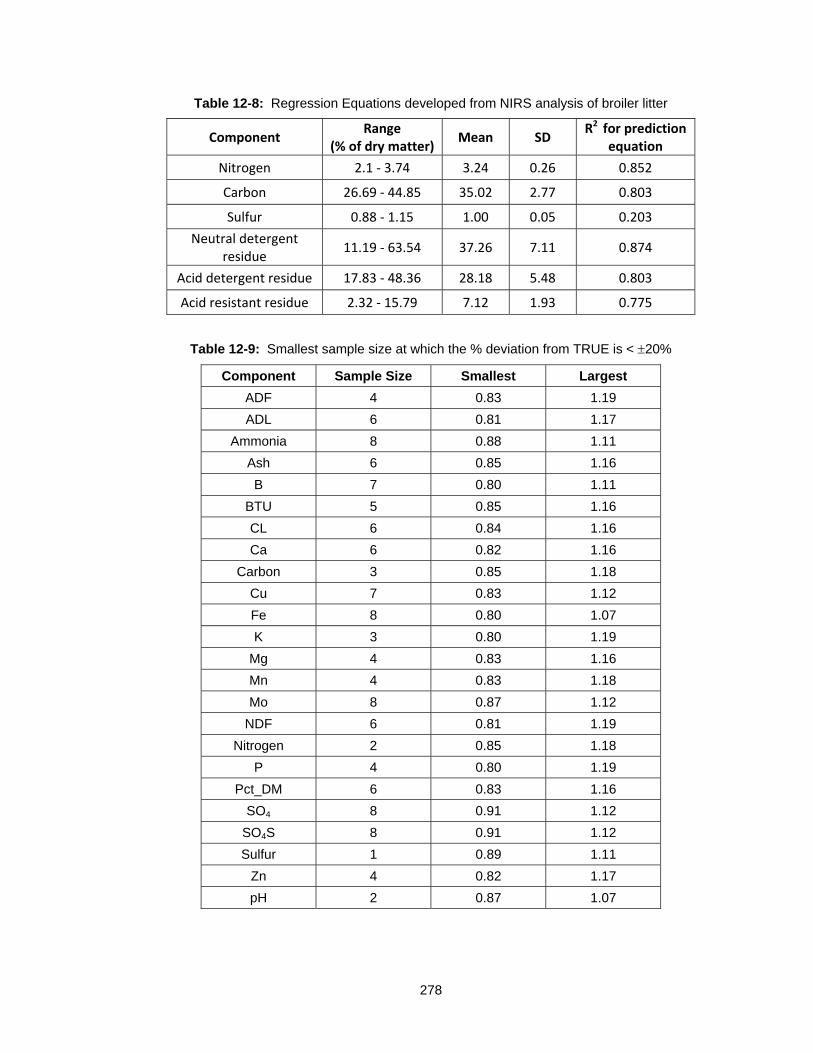
278
Table 12-8: Regression Equations developed from NIRS analysis of broiler litter
Component Range
(% of dry matter) Mean SD
R2 for prediction equation
Nitrogen 2.1 ‐ 3.74 3.24 0.26 0.852
Carbon 26.69 ‐ 44.85 35.02 2.77 0.803
Sulfur 0.88 ‐ 1.15 1.00 0.05 0.203
Neutral detergent residue
11.19 ‐ 63.54 37.26 7.11 0.874
Acid detergent residue 17.83 ‐ 48.36 28.18 5.48 0.803
Acid resistant residue 2.32 ‐ 15.79 7.12 1.93 0.775
Table 12-9: Smallest sample size at which the % deviation from TRUE is < 20%
Component Sample Size Smallest Largest
ADF 4 0.83 1.19
ADL 6 0.81 1.17
Ammonia 8 0.88 1.11
Ash 6 0.85 1.16
B 7 0.80 1.11
BTU 5 0.85 1.16
CL 6 0.84 1.16
Ca 6 0.82 1.16
Carbon 3 0.85 1.18
Cu 7 0.83 1.12
Fe 8 0.80 1.07
K 3 0.80 1.19
Mg 4 0.83 1.16
Mn 4 0.83 1.18
Mo 8 0.87 1.12
NDF 6 0.81 1.19
Nitrogen 2 0.85 1.18
P 4 0.80 1.19
Pct_DM 6 0.83 1.16
SO4 8 0.91 1.12
SO4S 8 0.91 1.12
Sulfur 1 0.89 1.11
Zn 4 0.82 1.17
pH 2 0.87 1.07
279
PART 5
Feasibility of Using Selected Alternate Fuels
in Portland Cement Production
280
CHAPTER 13
FEASIBILITY OF USING SELECTED ALTERNATE FUELS IN
PORTLAND CEMENT PRODUCTION
13.1 INTRODUCTION
The purpose of the work document in this part was to evaluate the feasibility of using alternative
fuels for cement production. The technical feasibility of producing cement with the required
properties at required rates was evaluated in other portions of the work. Thus, the effort
undertaken in task six has focused on determining factors that may drive the availability and cost
of alternative fuels relative to the availability and cost of the current fuel source, coal. The factors
include competitive uses (both current and potential), regional availability (long logistic lines can
significantly impact cost), current market cost, equipment modification required for utilization, and
impact on CO2 reduction. Impact on CO2 production may result in cost benefits depending on the
regulatory statutes with regard to CO2 production. In addition to the six primary alternative fuels
originally identified for evaluation at Lafarge several other potential alternative fuels were
examined as part of this effort.
13.1.1 Objectives
To provide information related to the economic viability of long term use of alternative fuels.
13.1.2 Research Approach
The work in this part consisted mainly of analyzing data previously collected. The approach was
to locate and review publically available data on the availability, alternative uses, and costs of
alternative fuels. A summary table was prepared which summarizes pertinent data related to
economic viability and technical challenges for several alternative fuels.
13.2 SUMMARY OF WORK
In total 13 potential alternative fuels were examined during the course of this work. Nine of these
materials have been tested at Lafarge. The fuel values range from ~4,000 to 14,500 BTU/lb.
The most common issue identified with the long term use is the moisture content of the fuel. This
issue can be overcome by careful raw material management (segregation, predrying, and
281
storage.) For many of the fuels competitive energy generation processes exist. These
competitive processes are likely to become more significant as energy cost rise.
13.2.1 Broiler Litter
Broiler / poultry litter is the material used as bedding, placed on the floor, in poultry farms to make
the collection and disposal of waste more manageable. The litter serves to adsorb the waste
products thereby making their collection and disposal easier. Some litter types have been shown
to improve the flock’s health by reducing the levels of ammonia exposure. There are several
types of material commonly used for broiler litter; wood shavings, sawdust, peanut hulls, sugar
cane, straw, etc. Regardless of the starting material used at the time of collection the litter
primarily consists of poultry manure, the original litter material, feathers, and dropped feed. The
five largest producers of poultry litter, broiler and turkey litter combined, are Arkansas, Georgia,
Alabama, Mississippi, and North Carolina. These states combined produce roughly 6.2 million
tons per year of poultry litter from broiler and turkey operations (Perera et al 2011). Recent
reports indicate that the amount of poultry litter produced from broiler production operations in the
south east range from ~1.2 million tons per year in Arkansas and Alabama (Perera et al 2011;
AEDC 2011), to less ~50,000 tons per year in Florida (Perera et al 2011).
There are several competitive uses for broiler litter. These include cattle feed, fertilizer
use, and fuel. As a cattle feed poultry litter is used as a cost-saving measure (Bagley and Evans
1995). The main issue with this use is related to the spread of bovine spongeform
encephalopathy (BSE), however as of the 2008 FDA regulations its use as a feed material had
not been banned. As a fertilizer poultry litter is less concentrated than chemical fertilizers, thus
transportation cost limits its use to dairy and beef farms near the poultry farm. In areas where
there are insufficient nearby agricultural uses of poultry litter excess litter is produced and its
disposal can become problematic.
The cost of transportation of the relatively low fertilizer and feed value poultry litter has
resulted in the development of the use of poultry litter as a fuel source, both in small scale
biomass systems for the production of heat for the poultry farm and larger direct burn systems for
the production of electricity. Potential conversion processes include anaerobic digestion, direct
combustion, co-firing, and gasification. There have been several studies on the anaerobic
digestion of poultry litter (Safley et al. 1987; Collins et al. 2000; and Kelleher et al. 2002). These
studies provide information on the design, cost, and feasibility of using anaerobic digestion to
extract energy from poultry litter. Direct combustion utilizes the heat generated during the
combustion of the fuel with excess air to produce steam used to drive turbine generators. There
are several examples of commercial scale direct fired systems used to produce electricity from
poultry waste, in conjunction with other biomass fuels, to produce electricity, including several in
the UK and two recently announced plants in the US both in North Carolina (Firbowatt 2011). Co-
282
fired systems involve the blending of a biomass source with a “traditional” fuel source such as
coal. Several studies have been performed evaluating the co-firing of biomass with coal, but
limited information exists on the use of poultry litter as a co-fired biomass material.
Poultry litter contains ~5,000 BTU/lb. There are several issues with the direct burning of
poultry litter in cement kilns The most important is the Chlorine content of this material. High
chlorine content affects the cement properties and as a result direct burn of poultry litter is not
feasible. As pointed out elsewhere in this report a gasification system could be used to extract
usefull energy from the litter and minimize the effect of chlorine content. In the gasification
process heat, steam, and pressure are used to extract hydrogen from the organic material. The
hydrogen is then collected and burned to produce energy. The main benefit of this process is
that the gas can be directly fired in a gas turbine for power generation. Gasification of poultry
litter at a small scale has been previously demonstrated (Flora and Riahi-Nezhad 2006). Despite
the nascent stage of utilization for this purpose, the extraction of energy from poultry litter is a
potentially significant competitor to its use a fuel source in cement kilns. A 2006 report to the
South Carolina Energy Office indicates that the value of poultry litter for the production of
electricity ranged from $30 to $57 / ton depending on the type of conversion process used.9
13.2.2 Post-Industrial Plastic Waste
Post-industrial plastic waste consists of trim scrap, off spec production, over production of
material at converting and assembly facilities and of post-industrial use plastic for example
packaging overwrap from large shipments. For example, automotive carpets are produced and
shipped as full width rolls to automotive production facilities. At these facilities, the carpet is cut
to size and installed in the vehicles. The trim pieces are scrap and cannot be used. Another
example is the production of plastic bottles by the extrusion blow molding process. The process
itself results trimmed material. Often this material can be recycled in house but if the color is
unusual or degradation has occurred the material is scrapped. The injection molding process
used to produce automotive bumpers and the extrusion process used to produce automotive fuel
tanks are another source of scrap material. The energy content of plastic depends on the type
with typical values in the range of 10,900 (PET) to 18,700 (HDPE) BTU/lb. In the existing study
post-industrial carpet scrap from the automotive industry was tested for fuel value and was found
to contain ~12,750 BTU/lb. The main issue with the use of post-industrial plastic waste is the
need to grind the material to achieve consistent feed rates. However, commercial scale grinders
are common and more than capable of grinding post-industrial plastics to a uniform size.
Given the relatively high fuel value of plastic waste and the relative ease of converting
this material to energy there is the potential for significant competition for the available supply. A
recent report by the American Plastics Council indicates that there are five main plastic to energy
conversion technologies currently being explored in the US not including the direct burn of these
283
materials; anaerobic digestion, thermal depolymerization, pyrolysis, pyrolysis/high temperature
gasification, and low temperature gasification (ACC 2011). There are currently 86 energy
recovery facilities in the US (ACC 2012). Combined these facilities can burn ~ 97,000 tons of
materials per day. However, this capacity is utilized for post-consumer waste in addition to post
industrial waste.
13.2.3 Tires
Roughly 280 million tires are scrapped each year in the US alone. The majority component of
tires is vulcanized rubbers and polyester or nylon based tire cord. The energy content of tire is
~14,000 BTU/lb. Current uses for this scrap includes energy conversion through processes
similar to those used for waste plastics and conversion of the tire to rubber powder that is used
for modification of plastics, asphalt, and portland cement. In addition, shredded tires are used as
subgrade fill and backfill for walls and bridge abutments as well as several other civil engineering
applications. The main issue with the use of tires in cement kilns is the tendency for scrap tires to
hold water during collection and storage due to their shape. This water must be dried prior to
introducing the material to the kiln. As a result much of the energy generated by direct burning is
used to volatize water and is not available to the process. Handling whole tires is problematic and
must be done manually at the facility were the evaluations were done. These issues can be
overcome by grinding, dewatering, and storing the shredded tires prior to burning. However,
these processes increase costs and storage during dewatering could consume significant land
area. One issue directly related to the use of tire scrap in cement kilns is the buildup of sulfur. A
report by Miller et. al. (2001) published by the Portland Cement Association, provides guidance to
cement kiln operators on the control and removal of sulfur compounds. However, many of these
control measures increase production cost. As a result, the direct burn of tire scrap will be limited
to relatively low rates of co-fire by sulfur issues even if issues with dewatering and storage can be
mitigated.
13.2.4 Wood Chips (forest trimmings) and Railroad Ties
Large scale harvesting of lumber results in a significant amount of trimmed material. Small
branches are trimmed and left on the forest floor. Over time these breakdown and are
reintegrated into the soil. However, there is the potential to collect this material, that collected in
municipalities, during storm clean up or regular maintenance for example, and the trim produced
during roadway and power line maintenance. The latter two sources of material are normally
made available as mulch for the local population. However, significantly more material is
produced that is used. Conversion of this material to energy is one potentially renewable source
of energy. The main issues with using this material at the cement plant were related to storage
and handling. Wood can contain ~ 50 moisture, drying and maintaining a low moisture level is
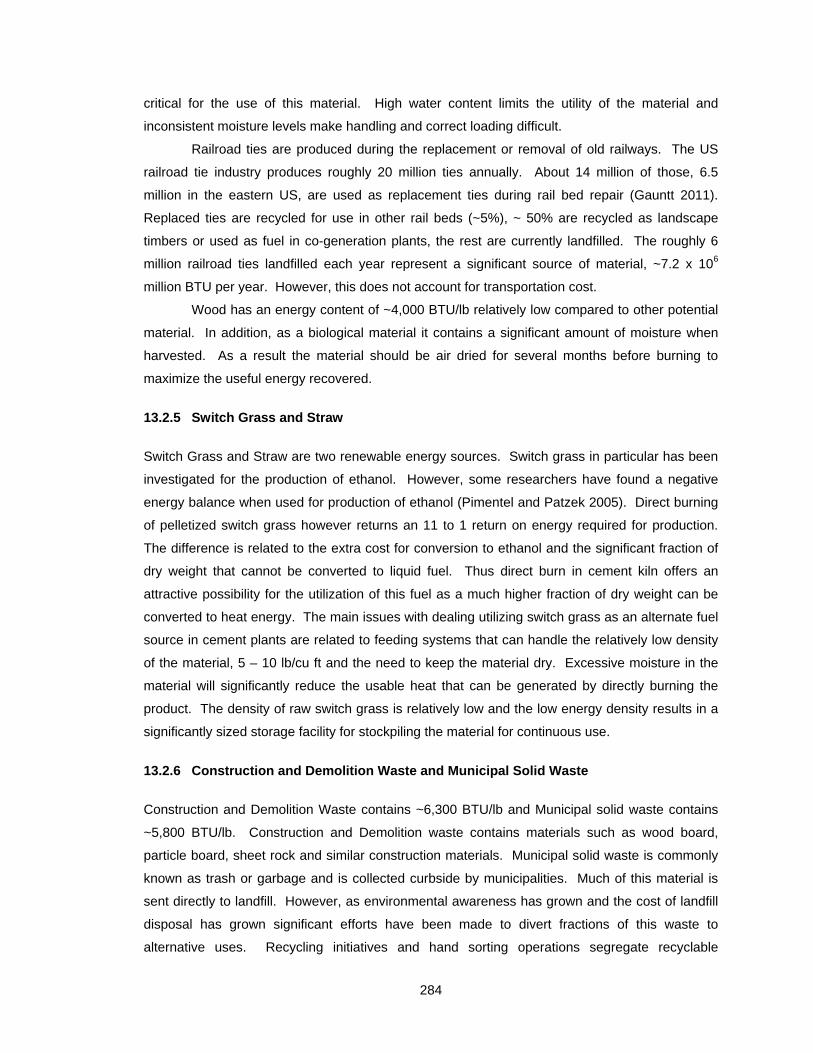
284
critical for the use of this material. High water content limits the utility of the material and
inconsistent moisture levels make handling and correct loading difficult.
Railroad ties are produced during the replacement or removal of old railways. The US
railroad tie industry produces roughly 20 million ties annually. About 14 million of those, 6.5
million in the eastern US, are used as replacement ties during rail bed repair (Gauntt 2011).
Replaced ties are recycled for use in other rail beds (~5%), ~ 50% are recycled as landscape
timbers or used as fuel in co-generation plants, the rest are currently landfilled. The roughly 6
million railroad ties landfilled each year represent a significant source of material, ~7.2 x 10⁶
million BTU per year. However, this does not account for transportation cost.
Wood has an energy content of ~4,000 BTU/lb relatively low compared to other potential
material. In addition, as a biological material it contains a significant amount of moisture when
harvested. As a result the material should be air dried for several months before burning to
maximize the useful energy recovered.
13.2.5 Switch Grass and Straw
Switch Grass and Straw are two renewable energy sources. Switch grass in particular has been
investigated for the production of ethanol. However, some researchers have found a negative
energy balance when used for production of ethanol (Pimentel and Patzek 2005). Direct burning
of pelletized switch grass however returns an 11 to 1 return on energy required for production.
The difference is related to the extra cost for conversion to ethanol and the significant fraction of
dry weight that cannot be converted to liquid fuel. Thus direct burn in cement kiln offers an
attractive possibility for the utilization of this fuel as a much higher fraction of dry weight can be
converted to heat energy. The main issues with dealing utilizing switch grass as an alternate fuel
source in cement plants are related to feeding systems that can handle the relatively low density
of the material, 5 – 10 lb/cu ft and the need to keep the material dry. Excessive moisture in the
material will significantly reduce the usable heat that can be generated by directly burning the
product. The density of raw switch grass is relatively low and the low energy density results in a
significantly sized storage facility for stockpiling the material for continuous use.
13.2.6 Construction and Demolition Waste and Municipal Solid Waste
Construction and Demolition Waste contains ~6,300 BTU/lb and Municipal solid waste contains
~5,800 BTU/lb. Construction and Demolition waste contains materials such as wood board,
particle board, sheet rock and similar construction materials. Municipal solid waste is commonly
known as trash or garbage and is collected curbside by municipalities. Much of this material is
sent directly to landfill. However, as environmental awareness has grown and the cost of landfill
disposal has grown significant efforts have been made to divert fractions of this waste to
alternative uses. Recycling initiatives and hand sorting operations segregate recyclable
285
polymers, metals, glass and paper. However, a significant fraction of material remains consisting
of food waste, currently non-recycled plastics, and other materials intermingled with food and
biological waste to the point that they cannot be efficiently recycled. This material is land filled or,
increasingly, used to generate energy. There are several methods to generate energy from
municipal solid waste such as pyrolysis, gasification, landfill gas capture, and direct burn.
Often this waste stream contains a significant fraction of moisture. Thus, it poses issues
similar to those described for tires and wood products above. In addition, these streams could
contain PVC based plastics. In the construction industry PVC is found in profiles such as the
window edging, it is also used in toys, credit cards and many other semi durable consumer goods
that may appear in municipal waste streams. This issue with PVC is the high chlorine content.
As municipal waste would be expected to be a highly variable material supplies with high PVC
fractions would need to be identified and rejected or blended with low PVC containing sources to
mitigate the potential for high levels of Chlorine. Finally, these sources will contain metals and a
system for removing the metal contaminates before introduction to the kiln would need to be
developed.
13.2.7 Liquid Waste Fuel
Liquid waste fuel consist of spent cooking oils and liquid waste by products from the food service
industries. These materials are primarily cooking oils and fats and contain ~7,700 BTU/lb of
material. In addition, they are relatively dense, ~78 lbs/ cu ft, and easy to handle. Currently
these materials are collected and either reprocessed or landfilled. As energy cost increase more
effort is made to reclaim energy from this waste product, either by direct burn or conversion to
biodiesel. This material was tested during the course of this study and no significant handling or
processing issues were identified. Cement quality is described elsewhere in this report.
13.3 CONCLUSIONS
The main issue with many of the potential alternative fuels is high moisture content. To mitigate
this issue at the plant appropriate processes will need to be developed that may include
dewatering, grinding, drying, storage, and blending to mitigate moisture issues. However, all the
identified alternative fuels have potential competitive uses and many of them are being explored
for commercial energy generation schemes, as direct fire for turbine boilers, in gasification
systems, or as raw material sources for biodiesel. As energy cost increase there will be an
increasing competitive demand for these materials. Mitigating this effect is the cost of
transporting many of the lower density materials to energy production facilities. As energy cost
increase, transportation cost increase. As a result cement kilns located nearer to the source of
the alternative fuel supply may have an advantage in the use of these alternative fuels.
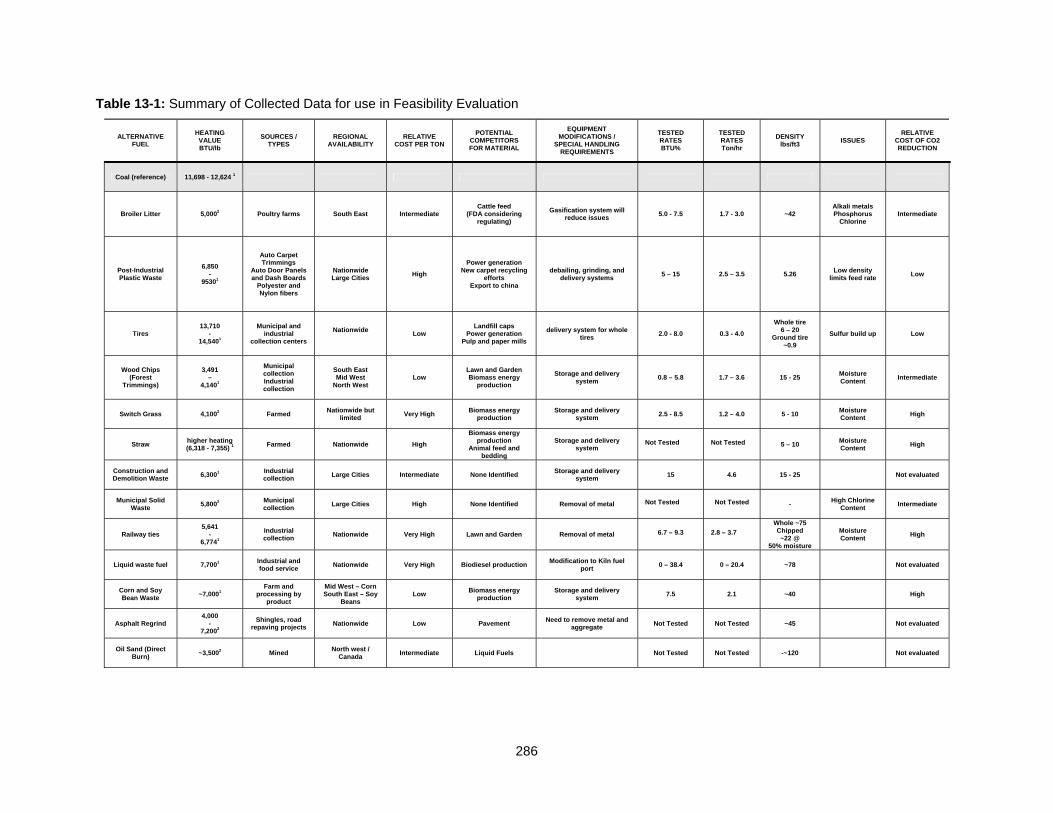
286
Table 13-1: Summary of Collected Data for use in Feasibility Evaluation
ALTERNATIVE FUEL
HEATING VALUE BTU/lb
SOURCES / TYPES
REGIONAL AVAILABILITY
RELATIVE COST PER TON
POTENTIAL COMPETITORS FOR MATERIAL
EQUIPMENT MODIFICATIONS /
SPECIAL HANDLING REQUIREMENTS
TESTED RATES BTU%
TESTED RATES Ton/hr
DENSITY lbs/ft3
ISSUES RELATIVE
COST OF CO2 REDUCTION
Coal (reference) 11,698 - 12,624 1
Broiler Litter 5,0002 Poultry farms South East Intermediate Cattle feed
(FDA considering regulating)
Gasification system will reduce issues
5.0 - 7.5 1.7 - 3.0 ~42 Alkali metals Phosphorus
Chlorine Intermediate
Post-Industrial Plastic Waste
6,850 -
95301
Auto Carpet Trimmings
Auto Door Panels and Dash Boards
Polyester and Nylon fibers
Nationwide Large Cities
High
Power generation New carpet recycling
efforts Export to china
debailing, grinding, and delivery systems
5 – 15 2.5 – 3.5 5.26 Low density
limits feed rate Low
Tires 13,710
- 14,5401
Municipal and industrial
collection centers
Nationwide
Low Landfill caps
Power generation Pulp and paper mills
delivery system for whole tires
2.0 - 8.0 0.3 - 4.0
Whole tire 6 – 20
Ground tire ~0.9
Sulfur build up Low
Wood Chips (Forest
Trimmings)
3,491 –
4,1401
Municipal collection Industrial collection
South East Mid West
North West Low
Lawn and Garden Biomass energy
production
Storage and delivery system
0.8 – 5.8 1.7 – 3.6 15 - 25 Moisture Content
Intermediate
Switch Grass 4,1002 Farmed Nationwide but
limited Very High
Biomass energy production
Storage and delivery system
2.5 - 8.5 1.2 – 4.0 5 - 10 Moisture Content
High
Straw higher heating (6,318 - 7,355) 1
Farmed Nationwide High
Biomass energy production
Animal feed and bedding
Storage and delivery system
Not Tested Not Tested 5 – 10 Moisture Content
High
Construction and Demolition Waste
6,3001 Industrial collection
Large Cities Intermediate None Identified Storage and delivery
system 15 4.6 15 - 25 Not evaluated
Municipal Solid Waste
5,8002 Municipal collection
Large Cities High None Identified Removal of metal Not Tested Not Tested - High Chlorine
Content Intermediate
Railway ties 5,641
- 6,7741
Industrial collection
Nationwide Very High Lawn and Garden Removal of metal 6.7 – 9.3 2.8 – 3.7
Whole ~75Chipped ~22 @
50% moisture
Moisture Content
High
Liquid waste fuel 7,7001 Industrial and food service
Nationwide Very High Biodiesel production Modification to Kiln fuel
port 0 – 38.4 0 – 20.4 ~78 Not evaluated
Corn and Soy Bean Waste
~7,0001 Farm and
processing by product
Mid West – Corn South East – Soy
Beans Low
Biomass energy production
Storage and delivery system
7.5 2.1 ~40 High
Asphalt Regrind 4,000
- 7,2002
Shingles, road repaving projects
Nationwide Low Pavement Need to remove metal and
aggregate Not Tested Not Tested ~45 Not evaluated
Oil Sand (Direct Burn)
~3,5002 Mined North west /
Canada Intermediate Liquid Fuels Not Tested Not Tested -~120 Not evaluated
287
CHAPTER 14
CONCLUSIONS AND RECOMMENDATIONS
14.1 CONCLUSIONS
Based on the work document in this report, the following conclusions can be drawn:
1. A drop tube furnace and visualization method were developed that show potential for
evaluating time- and space-resolved temperature distributions for fuel solid particles and
liquid droplets undergoing combustion in various combustion atmospheres.
2. The processing ability of the available equipment at a cement plant is a factor that limits
substitution rates. The construction and demolition waste and woodchip trial burns
conducted during this project did not cause any feed problems. Several cement plant
personnel experienced minor allergic reactions due to handling and de-dusting the
soybean seeds. This problem; however, was eliminated with the use of proper personal
protective equipment.
3. The energy values of the alternative fuels utilized during this study were less than those
of traditional fuels. The as-received energy values for each fuel utilized during this study
were as follows:
Coal: 10,820 to 12,090 with an average of 11,320 BTU/lb,
Plastics: 8,855 to 10,780 with an average of 10,130 BTU/lb,
Construction and Demolition waste: 3,370 to 8,180 with an average of 6,050 BTU/lb,
Woodchips: 3,355 to 6,996 with an average of 4,736 BTU/lb, and
Soybean seeds: 8,977 to 9,375 with an average of 9,150 BTU/lb.
4. When assessing the feasibility of the alternative fuel, the unit cost of the fuel is an
important parameter. Although some of the alternative fuels possess energy values that
are roughly half that of the traditional fuels, the price for traditional fuels is typically
significantly more than alternative fuels. Due to fuel cost data being proprietary
knowledge, the feasibility of the trial alternative fuels based on price could not be
evaluated or compared.
5. The utilization of each fuel remained fairly consistent over the burn periods. Coal
accounted for almost 90 percent of the required energy during the baseline burn, but was
reduced to 70 percent during the variable feed 15 percent trial burn. The plastic blend
accounted for roughly 15 percent of the required energy for all trial burns. Alternative
fuels accounted for 5, 5.4, 11.8, 16, and 7.5 percent of the total energy for the
288
construction and demolition waste, variable feed 5, 10, and 15 percent, and soybean
seed burns, respectively.
6. Another goal of this part of this study was to determine if the utilization of alternative fuels
had a direct impact on the chemical composition of the portland cement. The kiln feed
and the cement kiln dust results were compared to their respective baseline values and
found to be consistent over all trials with the exceptions of elevated SO3 and P2O5
concentrations.
7. Significant increases in P2O5 in the clinker and cement was obtained for all trial burns. In
the trial burns, coal possessed significantly elevated levels of P2O5 compared to the
baseline’s coal level. The construction demolition waste contained approximately 3 and 2
times the P2O5 content compared to the woodchip and soybean seed trials, respectively.
Though the construction and demolition waste fuel possessed the highest P2O5 content
for the alternative fuels tested, their contribution to the overall P2O5 content of the clinker
and cement was minimal. The combination of materials and fuel led to the increased
P2O5 levels found in the clinker and cement.
8. The statistical analysis performed on the clinker data and it showed that the majority of
results from the trial burns had significantly different means. However, because of the
inherent variability throughout portland cement production process, changes in cement
chemistry are difficult to link to the utilization of a particular fuel.
9. Additional objectives of this phase of the study were to evaluate if the utilization of the
trial fuels directly impacted the physical properties of the portland cement or the concrete
that was prepared with the trial burn cements. Overall, it was found that the trial burn
cements had minimally different effects on workability, setting time, strength, drying
shrinkage, and permeability compared to the baseline cement.
10. Another objective of this phase of the study was to assess the impact of alternative fuels
on emissions produced by the cement plant. The Nitrogen Oxides (NOx), sulfur dioxide
(SO2), and carbon monoxide (CO) emissions were within acceptable emission limits
except for the volatile organic compounds (VOC) produced during the baseline and
soybean seed trial burns. The production of volatile organic compounds is more
dependent on system design and control than the type of fuel used. The trial fuels
utilized were not found to greatly affect the quantity of emission produced.
11. The cement plant was successful in implementing alternative fuels to produce a
consistent, high-quality product that increased cement performance while reducing the
environmental footprint of the plant. The utilization of construction and demolition waste,
woodchips and soybean seeds proved to be viable replacements for traditional fuels.
The future use of these fuels depends on local availability, associated costs, and
compatibility with a facility’s production process.
289
12. Downdraft gasification has been explored as a means to extract chemical energy from
poultry litter while limiting the throughput of potentially deleterious components with
regards to use in firing a cement kiln. Flue gas recirculation allowed the reduction of the
gasifier secondary air oxygen concentration by 40-45%, yielding an approximately 100˚C
depression in average temperature. Results have shown that the clinkering is
temperature independent, at least within the controllable temperature range. Limestone
also had only a slight effect on the fusion when used to coat the pellets. However,
limestone addition did display some promise in regards to chlorine capture, as ash
analyses showed chlorine concentrations of more than four times greater in the limestone
infused ash as compared to raw poultry litter. Experiments were conducted to explore
the effectiveness of mixing limestone with raw poultry litter, the object being to coat more
surface area and have a more even mixture. These resulted in the most consistent
experiments with no ash clinkering.
13. The following recommendations are made toward implementing gasification of poultry
litter as a cement kiln fuel supplement. Using a downdraft gasifier, it is necessary to
dilute raw poultry litter to 35-40% and add 6.5% limestone/dry litter weight to prevent
clinker formation and consistent syngas production. Contaminant retention appeared to
be independent of limestone percentage, so addition of ~6.5% limestone/dry litter weight
is the recommended ratio to limit the use of unnecessary extra additive while providing a
factor of safety against clinkering issues. Conservative contaminant retention
percentages to expect when using the methods in this report are: 89% chlorine retention,
94% potassium and sodium retention, and 100% phosphorus retention. Cooling and
filtering the syngas at 60-100˚C appears to be necessary in capturing the maximum
amount of contaminants.
14. A reliable, but convenient, sampling procedure was developed to estimate the
combustion quality of broiler litter that is the best compromise between convenience and
reliability. Variation in broiler litter samples from various farms was surprisingly low, with
age of stack being the most important factor. It is concluded that 8 broiler litter samples
be drawn from about 24-inches deep in the stack to obtain a reliable estimate of the
mean of all composition components in the broiler litter sources evaluated, and this
number is likely to be appropriate for most stacks.
15. The main issue with many of the potential alternative fuels is high moisture content. To
mitigate this issue at the plant appropriate processes will need to be developed that may
include dewatering, grinding, drying, storage, and blending to mitigate moisture issues.
However, all the identified alternative fuels have potential competitive uses and many of
them are being explored for commercial energy generation schemes, as direct fire for
turbine boilers, in gasification systems, or as raw material sources for biodiesel. As
290
energy cost increase there will be an increasing competitive demand for these materials.
Mitigating this effect is the cost of transporting many of the lower density materials to
energy production facilities. As energy cost increase, transportation cost increase. As a
result cement kilns located nearer to the source of the alternative fuel supply may have
an advantage in the use of these alternative fuels.
14.2 RECOMMENDATIONS FOR FUTURE RESEARCH
Based on the work document in this report, the following conclusions can be drawn:
1. Continued development of a burn simulator to include effluent gas analysis is
recommended. Further improvement of visualization quality and inclusion of shape
correction for the image processing and analysis are needed.
2. A model needs to be developed to apply the temperature distributions from the burn
simulator to estimations of combustion rates for various fuel types in conditions that
mimic those in a cement plant.
3. A major factor limiting the effectiveness of this study was the fairly low substitution rate of
the alternative fuels. Coal accounted for 70 to 90 percent of the total energy consumed
during production. The alternative fuels tested during this study contributed only 5 to 16
percent of the total energy used during the pyroprocess. Changes in cement chemistry
could not be solely attributed to the alternative fuels. This was due to observed cement
physical changes paralleling significant fluctuations in kiln feed or coal chemical
compositions. Increasing the substitution rate would allow the trial fuel’s effects to be
more pronounced and thus provide a better understanding of the interactions that occur
between a utilized fuel and the performance of the portland cement. If the minimum
substitution rates were increased, as well as implementing a variable feed approach
similar to the woodchip trial performed in this study, an optimum replacement rate could
be established.
4. Although a thorough sampling plan was developed for each burn, determining the effects
of the alternative fuels on the cement chemistry and performance proved a difficult task.
If the sampling plan was expanded to include enough samples of kiln feed, coal, and
cement kiln dust to perform statistical analysis, a greater understanding of the
consistency of these process inputs throughout a trial burn could be achieved.
Increasing the number of specimens tested could also limit the number of inconsistent
results between testing agencies. A sampling plan, however, is often limited by available
funding, personnel, and time.
5. There were several trends that could not be explained regarding the emissions produced
during the trial burns. Oxygen levels should be measured within the kiln. Knowing the
291
oxygen level present in the pyroprocess, which significantly effects the emissions formed,
could be beneficial in order to explain the fluctuations observed in the NOx, SO2, and CO
emissions.
6. Before implementing poultry litter gasification, further research should be performed. The
high pressure drop across the gasifier when using raw poultry litter should be examined
and methods of alleviating this explored. One suggestion is making poultry litter and
limestone pellets, pre-mixed in the correct ratio. Other methods of gasification should be
explored to compare their effectiveness in capturing contaminants as well as ease and
consistency of operation using poultry litter. Design of a specialized gasifier around the
high ash content, easily-clinkering poultry litter feedstock could be explored. Ways of
increasing the percentage of poultry litter fed into the gasifier while maintaining stable
performance should be explored. A study measuring the concentration of contaminants
in the syngas itself could be performed to close in the mass balance and verify retention
of contaminants in the char. The degree to which the syngas needs to be cooled and
filtered to remove the maximum amount of contaminants should be examined.
292
REFERENCES
Abbas, T., P. G. Costen, and F. C. Lockwood. 1996. Solid Fuel Utilization: From Coal to
Biomass. Symposium (International) on Combustion 26, no. 2:3041-3058.
ACC. 2011. Conversion Technology: A Complement to Plastic Recycling.
http://plastics.americanchemistry.com/Plastics-to-Oil, American Chemistry Council (ACC),
cite accessed January 2012.
ACC. 2012. http://plastics.americanchemistry.com/Energy-Recovery-Issue-Brief. American
Chemistry Council (ACC), cite accessed January 2012.
ACI. 1992. State-of-the-Art Report on High-Strength Concrete. Farmington Hills, Michigan.
American Concrete Institute.
Adams, Z. 2005. Comparison of Broiler Litter, Broiler Litter Ash with Reagent Grade Materials as
Sources of Plant Nutrients. Auburn University Master's Thesis.
ADEM. 2007. Major Source Operating Permit. Alabama Department of Environmental
Management. Montgomery, AL. Issuance date: March 20, 2007.
Aïtcin, P. 2000. Cements of Yesterday and Today: Concrete of Tomorrow. Cement and
Concrete Research 30, no. 9:1349-1359.
Akkapeddi, S. 2008. Alternative Solid Fuels for the Production of Portland Cement, M.S. Thesis,
Auburn University, Alabama.
Akkapeddi, S., D.W. Swart, A.K. Schindler, S.R. Duke, and Stafford, D. 2008. Impact of Using
Alternative Fuels to Produce Portland Cement on Cement and Concrete Properties.
Proceedings of NRMCA’s Symposium on Focus on Sustainable Development. Denver, CO.
February 2008.
Al-Salem, S.M., P. Lettieri, and J. Baeyens. 2010. The Valorization of Plastic Solid Waste (PSW)
by Primary to Quaternary Routes: From Re-use to Energy and Chemicals. Progress in
Energy and Combustion Science 36, no. 1:103-129.
AEDC. 2011. http://arkansasenergy.org/solar-wind-bioenergy/bioenergy/biomass.aspx,
Arkansas Economic Development Commission, (accessed in 2011).
ASA. 2011. 2010 Soy Statistics. American Soybean Association.
http://www.soystats.com/2010/Default-frames.htm (accessed September 17, 2011)
ASA. 2011. 2011 Soy Statistics. American Soybean Association.
http://www.soystats.com/2011/page_29.htm (accessed September 17, 2011).
ASTM C 1202. 2007. Standard Test Method for Electrical Indication of Concrete’s Ability to
Resist Chloride Ion Penetration. ASTM International. West Conshohocken, PA.
ASTM C 150. 2007. Standard Specification for Portland Cement. ASTM International. West
Conshohocken, PA.
293
ASTM C 191. 2008. Standard Test Methods for Time of Setting of Hydraulic Cement by Vicat
Needle. ASTM International. West Conshohocken, PA.
ASTM C 403. 2008. Standard Test Method for Time of Setting of Concrete Mixtures by
Penetration Resistance. ASTM International. West Conshohocken, PA.
Bagley, C.P., and R.R. Evans. 1995. Broiler Litter as a Feed or Fertilizer in Livestock
Operations. Mississippi State University Cooperative Extension Service.
Bech, C, and A. Mishulovich. 2004. Preheaters and Precalciners. Chap. 3.2 in Innovations in
Portland Cement Manufacturing. Skokie, Illinois: Portland Cement Association.
Beckwith, T. and R. Marangoni. 1990. Mechanical Measurements, 4th ed. Addison-Wesley
Publishing Company, Inc.
Beenackers, A. and W. van Swaaij. 1984. Gasification of Biomass, A State of the Art Review,
Thermochemical Processing of Biomass, ed. Bridgwater. Butterworths.
Bhatty, J.I. 2004. Minor Elements in Cement Manufacturing. Chap. 3.6 in Innovations in
Portland Cement Manufacturing. Skokie, Illinois: Portland Cement Association.
Bjorkman, E. and B. Stromberg. 1997. Release of Chlorine from Biomass at Pyrolysis and
Gasification Conditions, Energy & Fuels. Vol. 11, 1026-1032.
Bock, B.R. 2004. Poultry Litter to Energy: Technical and Economic Feasability, brbock.com.
[Cited: August 5, 2010.] http://www.brbock.com/RefFiles/PoultryLitter_Energy.doc.
Bridge, P.D., S.S. Sawilowsky. 1999. Increasing Physicians’ Awareness of the Impact of
Statistics on Research Outcomes: Comparative Power of the t-test and Wilcoxin Rank-Sum
Test in Small Samples Applied Research. Journal of Clinical Epidemiology 52, no. 3:229-
235.
Buekens, A. and J. Schoeters. 1984. Mathematical Modelling in Gasification, Thermochemical
Processing of Biomass. Ed. Bridgwater. Butterworths.
Cembureau. 2010. World Cement Production 2010 by Region and Main Countries. The
European Cement Association. http://www.cembureau.be/about-cement/key-facts-figures
(accessed July 21, 2011)
Chatterjee, A.K. 2004. Raw Materials Selection. Chap. 2.1 in Innovations in Portland Cement
Manufacturing. Skokie, Illinois: Portland Cement Association.
Chen, I.A., and M.C.G. Juenger. 2009. Incorporation of Waste Materials into Portland Cement
Clinker Synthesized from Natural Raw Materials. Journal of Materials Science 44, no.
10:2617-2627.
Coda, B., et al. 2001. Behavior of Chlorine and Enrichment of Risky Elements in Bubbling
Fluidized Bed Combustion of Biomass and Waste Assisted by Additives, Energy & Fuels,
Vol. 15, 680-690.
Codling, E. 2005. Laboratory Characterization of Phosphorus in Poultry Litter and Poulrty Litter
Ash. Salt Lake City, UT: ASA-CSSA-SSSA International Annual Meetings.
294
Collins, A.R., J. Murphy, and D. Bainbridge. 2000. Optimal Loading Rates and Economic
Analysis for Anaerobic Digestion of Poultry Waste. Journal of the Air and Waste
Management Association, 50: p. 1037-1044.
Community Power Corporation. 2011. Gasification. http://www.gocpc.com/gasification.html,
(Cite accessed on January 6, 2011.)
Conesa, J.A. 2008. Organic and Inorganic Pollutants from Cement Kiln Stack Feeding
Alternative Fuels. Journal of Hazardous Materials 158, no. 2-3:585-592.
Cuiping, L., W. Chuangzhi, W. Yanyongjie, and H. Haitao, 2004. Chemical Elemental
Characteristics of Biomass Fuels In China. Journal of Biomass & Bioenergy 27 119-130.
Dayton, D., E. French, T. and Milne. 1996. Direct Observation of Alkali Vapor Release During
Biomass Gasification, Energy & Fuels, Vol. 10, 284-292.
Edmeades, R.M., and P.C. Hewlett. 1998. Cement Admixtures. Chap. 15 in Lea’s Chemistry of
Cement and Concrete. 4th ed. London: Arnold.
EPA. 1995. “Chapter 11.6, Portland Cement Manufacturing.” Compilation of Air Pollutant
Emission Factors, AP-42. Research Triangle Park, NC: U.S. Environmental Protection
Agency.
EPA. 2010. Greenhouse Gas Emissions. U.S. Environmental Protection Agency.
http://www.epa.gov/climatechange/emissions/index.html (accessed June 24, 2010).
EPA. 2011. Major Crops Grown in the United States. United States Environmental Protection
Agency. http://www.epa.gov/agriculture/ag101/cropmajor.html (accessed September 17,
2011)
Flora, J.R.V. and C. Riahi-Nezhad. 2006. Availability of Poultry Manure as a Potential Bio-Fuel
Feedstock for Energy Production, in South Carolina Energy Office.
Folta, A. 2010. Alternative Fuels and their Effects on Portland Cement, M.S. Thesis, Auburn
University, Alabama.
Gauntt, J. 2011. Chugging Along A Bumpy Road. Crossties, Sept./Oct.: p. 14-16.
Giltrap, D., R. McKibbin, and G. Barnes, G. 2003. A Steady State Model of Gas-Char Reactions
in a Downdraft Biomass Gasifier, Solar Energy, Vol. 74, 85-91.
Gingerich, P.D. 1995. Statistical Power of EDF Tests of Normality and the Sample Size
Required to Distinguish Geometric-Normal (Lognormal) from Arithmetic-Normal
Distributions of Low Variability. Journal of Theoretical Biology 173, no. 2:126-136.
Glassman, I. 2008. Combustion. Academic Press.
Greco, C., G. Picciotii, R.B. Greco, and G.M. Ferreira. 2004. Fuel Selection and Use. Chap. 2.5
in Innovations in Portland Cement Manufacturing. Skokie, Illinois: Portland Cement
Association.
Greer, W.L. 1986. SO2/NOx Control Compliance with Environmental Regulations. IEEE
Transactions on Industry Applications 25, no. 3:475-485.
295
Greer, W.L. 2004. A Qualitative Examination of the Control of Major Gaseous Pollutants
Generated in Portland Cement Kilns. (Proceedings of the A and WMA’s 97th Annual
Conference and Exhibition; Sustainable Development: Gearing up for the Challenge,
Indianapolis, IN, June 22-25).
Greer, W.L., G.J. Hawkins, and T.B. Carter. 2004. Air Emissions and Control Measures. Chap.
6.1 in Innovations in Portland Cement Manufacturing. Skokie, Illinois: Portland Cement
Association.
Hawkins, G.J., J.I. Bhatty, and A.T. O’Hare. 2004. Cement Kiln Dust Generation and
Management. Chap. 6.3 in Innovations in Portland Cement Manufacturing. Skokie, Illinois:
Portland Cement Association.
Hendrik, G.O., and A.C. Padovani. 2003. Cement Manufacture and the Environment, Part II:
Environmental Challenges and Opportunities. Journal of Industrial Ecology 7, no. 1:93-
126.
ICR. 2011. World Cement Overview. International Cement Review.
http://www.cembureau.be/about-cement/key-facts-figures (accessed July 21, 2011).
Jackson, P.J. 1998. Portland Cement: Classification and Manufacture. Chap. 2 in Lea’s
Chemistry of Cement and Concrete. 4th ed. London: Arnold.
Jenkins, B.M., et al. 1998. Combustion Properties of Biomass. Fuel Processing Technology,
Vol. 54, 17-46.
Kääntee, U., R. Zevenhoven, R. Backman, and M. Hupa. 2004. Cement Manufacturing Using
Alternative Fuels and the Advantages of Process Modeling. Fuel Processing Technology
85:293-301.
Karstensen, K.H. 2008. Formation, Release and Control of Dioxins in Cement Kilns.
Chemosphere 70, no. 4:543-560.
Kelleher, B.P., J.J. Leahy, A.M. Henihan, T.F. O'Dwyer, D. Sutton, and M.J. Leahy. 2002.
Advances in Poultry Litter Disposal Technology - A Review. Bioresource Technology, 83: p.
27-36.
Kikuchi, R., J. Kukacka, and R. Raschman. 2008. Grouping of Mixed Waste Plastics According
to Chlorine Content. Separation and Purification Technology 61, no. 1:75-81.
Kirk, L.B. 2000. Potential Dioxin Release Associated with Tire Derived Fuel use in a Cement
Kiln Gallatin County, Montana. Principles of Environmental Toxicology. University of
Idaho, December 2000.
Kosmatka, S.H., B. Kerkhoff, and W.C. Panarese. 2002. Design and Control of Concrete
Mixtures. 14th ed. Skokie, Illinois: Portland Cement Association.
Lechtenberg, D. 2009. The Use of Alternative Fuels in the Cement Industry of Developing
Countries – an opportunity to reduce production costs? Cement International 7, no. 2:66-
70.
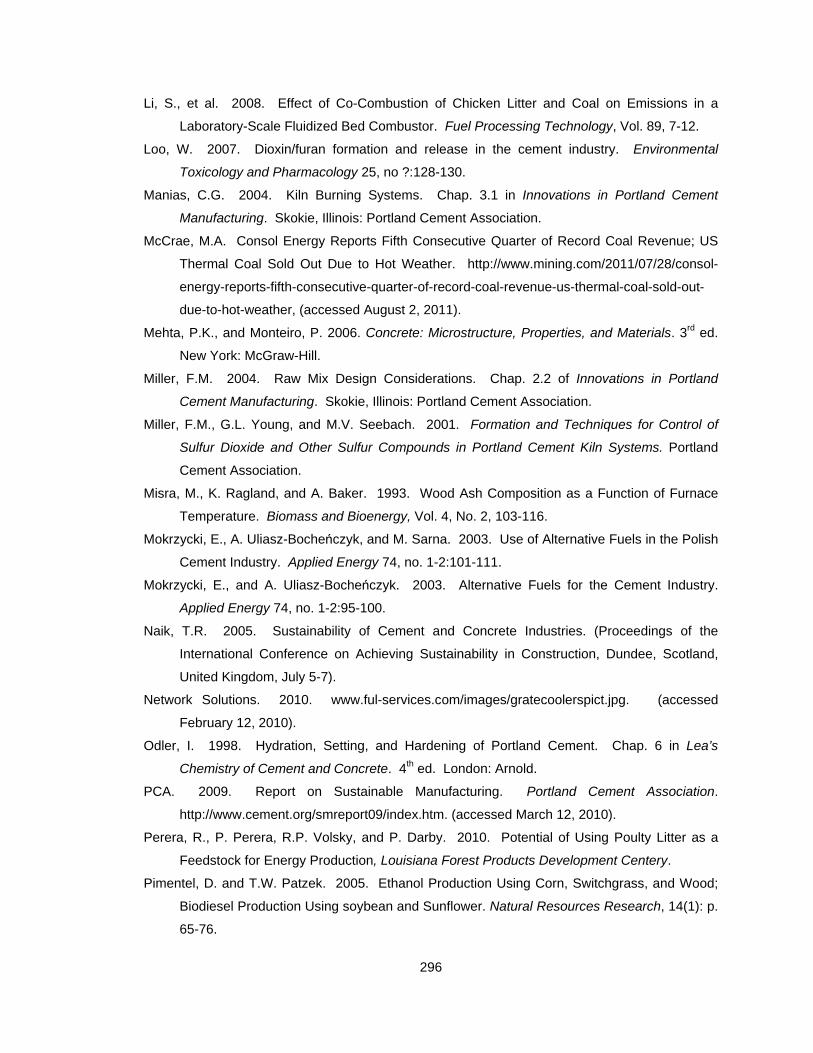
296
Li, S., et al. 2008. Effect of Co-Combustion of Chicken Litter and Coal on Emissions in a
Laboratory-Scale Fluidized Bed Combustor. Fuel Processing Technology, Vol. 89, 7-12.
Loo, W. 2007. Dioxin/furan formation and release in the cement industry. Environmental
Toxicology and Pharmacology 25, no ?:128-130.
Manias, C.G. 2004. Kiln Burning Systems. Chap. 3.1 in Innovations in Portland Cement
Manufacturing. Skokie, Illinois: Portland Cement Association.
McCrae, M.A. Consol Energy Reports Fifth Consecutive Quarter of Record Coal Revenue; US
Thermal Coal Sold Out Due to Hot Weather. http://www.mining.com/2011/07/28/consol-
energy-reports-fifth-consecutive-quarter-of-record-coal-revenue-us-thermal-coal-sold-out-
due-to-hot-weather, (accessed August 2, 2011).
Mehta, P.K., and Monteiro, P. 2006. Concrete: Microstructure, Properties, and Materials. 3rd ed.
New York: McGraw-Hill.
Miller, F.M. 2004. Raw Mix Design Considerations. Chap. 2.2 of Innovations in Portland
Cement Manufacturing. Skokie, Illinois: Portland Cement Association.
Miller, F.M., G.L. Young, and M.V. Seebach. 2001. Formation and Techniques for Control of
Sulfur Dioxide and Other Sulfur Compounds in Portland Cement Kiln Systems. Portland
Cement Association.
Misra, M., K. Ragland, and A. Baker. 1993. Wood Ash Composition as a Function of Furnace
Temperature. Biomass and Bioenergy, Vol. 4, No. 2, 103-116.
Mokrzycki, E., A. Uliasz-Bocheńczyk, and M. Sarna. 2003. Use of Alternative Fuels in the Polish
Cement Industry. Applied Energy 74, no. 1-2:101-111.
Mokrzycki, E., and A. Uliasz-Bocheńczyk. 2003. Alternative Fuels for the Cement Industry.
Applied Energy 74, no. 1-2:95-100.
Naik, T.R. 2005. Sustainability of Cement and Concrete Industries. (Proceedings of the
International Conference on Achieving Sustainability in Construction, Dundee, Scotland,
United Kingdom, July 5-7).
Network Solutions. 2010. www.ful-services.com/images/gratecoolerspict.jpg. (accessed
February 12, 2010).
Odler, I. 1998. Hydration, Setting, and Hardening of Portland Cement. Chap. 6 in Lea’s
Chemistry of Cement and Concrete. 4th ed. London: Arnold.
PCA. 2009. Report on Sustainable Manufacturing. Portland Cement Association.
http://www.cement.org/smreport09/index.htm. (accessed March 12, 2010).
Perera, R., P. Perera, R.P. Volsky, and P. Darby. 2010. Potential of Using Poulty Litter as a
Feedstock for Energy Production, Louisiana Forest Products Development Centery.
Pimentel, D. and T.W. Patzek. 2005. Ethanol Production Using Corn, Switchgrass, and Wood;
Biodiesel Production Using soybean and Sunflower. Natural Resources Research, 14(1): p.
65-76.
297
Price, C. 2010. Sanderson Farms. Phone Interview on December 17, 2010.
Primenergy. 2008. Gasification Feasibility Study for the Roberta Cement Plant. Primenergy,
L.L.C., Tulsa, OK.
Prisciandaro, M., G. Mazziotti, and F. Veglió. 2003. Effect of Burning Supplementary Waste Fuels
on the Pollutant Emissions by Cement Plants: A Statistical Analysis of Process Data.
Resources, Conservation and Recycling 39, no. 2:161-184.
Priyadarsan, S., et al. 2004. Fixed-Bed Gasification of Feedlot Manure and Poultry Litter
Biomass. Transactions of the ASAE, Vol. 47, 1689-1696.
Reardon, J., K. Browne, and K Beard. 2001. Demonstration of a Small Modular BioPower
System Using Poultry Litter. Littleton, CO: Community Power Corporation.
Reardon, J.P., A. Lilley, K. Browne, K. Beard, J. Wimberly, and J. Avens. 2001. Demonstration
of a Small Modular Biopower System Using Poultry Litter, in Final Report submitted to the
Department of Energy.
Reed, T.B. 1981. Executive Summary. In Biomass Gasification Principles and Technology. New
Jersey : Noyes Data Corporation.
Richards, J.R. 2004. Pariculate Matter Control. Chap. 6.2 in Innovations in Portland Cement
Manufacturing. Skokie, Illinois: Portland Cement Association.
Safley, Jr., L.M., R.L. Vetter, and L.D. Smith. 1987. Management and Operation af a Full-Scale
Poultry Waste Digester. Poultry Science, 66: p. 941-945.
Salo, K. and W. Mojtahedi. 1998. Fate of Alkali and Trace Metals in Biomass Gasification.
Biomass and Bioenergy, Vol. 15, No. 3, 263-267.
Schaffer, M. 2006. Advanced Slagging Gasifier for Biomass Wastes. Final Report. Epa.gov.
http://cfpub.epa.gov/ncer_abstracts/
index.cfm/fuseaction/display.abstractDetail/abstract/7968/report/F, (Accessed on
November, 12 2009)
Schuhmacher, M., J.L. Domingo, and J. Garreta. 2004. Pollutants Emitted by a Cement Plant:
Health Risks for the Population Living in the Neighborhood. Environmental Research 95,
no. 2:198-206.
Shafiee, S., and E. Topal. 2010. A Long-Term View of Worldwide Fossil Fuel Prices. Applied
Energy 87, no. 3:988-1000.
Siddique, R., J. Khatib, and I. Kaur. 2008. Use of Recycled Plastic in Concrete: A Review.
Waste Management 28, no. 10:1835-1852.
Steuch, H.E. 2004. Clinker Coolers. Chap. 3.8 in Innovations in Portland Cement
Manufacturing. Skokie, Illinois: Portland Cement Association.
Strohman, N.R. 2004. Finish Milling and Grinding. Chap. 4.1 in Innovations in Portland Cement
Manufacturing. Skokie, Illinois: Portland Cement Association.
298
Swart, D.W. 2007. The Utilization of Alternative Fuels in the Production of Portland Cement,
M.S. Thesis, Auburn University, Alabama.
Syverud, T. 1994. Utilization of Chipped Car Tyres for Reducing NOx Emissions in a Precalciner
Kiln. World Cement 25, no. 11:39-43.
Taniguchi, M. 2001. The Metamorphosis from Manufacturing to Ecofacturing of Cement
Industry. Kami pa gikyōshi 44, no. 4:68-77.
Taylor, H.F.W. 1997. Cement Chemistry. 2nd edition. Thomas Telford Publishing, London, U.K.
459 pages.
Tennis, P.D., S.H. Kosmatka. 2004. Cement Characteristics. Chap. 9.1 in Innovations in
Portland Cement Manufacturing. Skokie, Illinois: Portland Cement Association.
Turns, S. 2000. An Introduction to Combustion, 2nd ed. McGraw-Hill.
USDA. 2010. Poultry - Production and Value 2009 Summary.
http://usda.mannlib.cornell.edu/usda/current/PoulProdVa/PoulProdVa-04-29-2010.pdf,
(Accessed on January 3, 2011.)
Walters, L.J., Jr., M.S. May III, D.E. Johnson, R.S. Macmann, and W.A. Woodward. 1999. Time-
variability of NOx Emissions from Portland Cement Kilns. Environmental Science &
Technology 33, no. 5:700-704.
Wang, Y. and C. Kinoshita. 1993. Kinetic Model of Biomass Gasification. Solar Energy, Vol. 51,
19-25.
Weakley, R. 2009. Evaluation of Semi-Adiabatic Calorimetry to Quantify Concrete Setting, M.S.
Thesis, Auburn University, Alabama.
Willitsch, F.W., and G. Sturm. 2002. Processing and Handling Alternative Fuels in the Cement
Industry. ZKG International 55, no. 10:62-69.
Worrell, E., L. Price, N. Martin, C. Hendriks, and L. O. Meida. 2001. Carbon Dioxide Emissions
from the Global Cement Industry. Annu. Rev. Energy Environ. 26:303-329.
Young, G.L., and F.M. Miller. 2004. Kiln System Operations in Cement Manufacturing. Chap.
3.3 in Innovations in Portland Cement Manufacturing. Skokie, Illinois: Portland Cement
Association.

299
APPENDICES
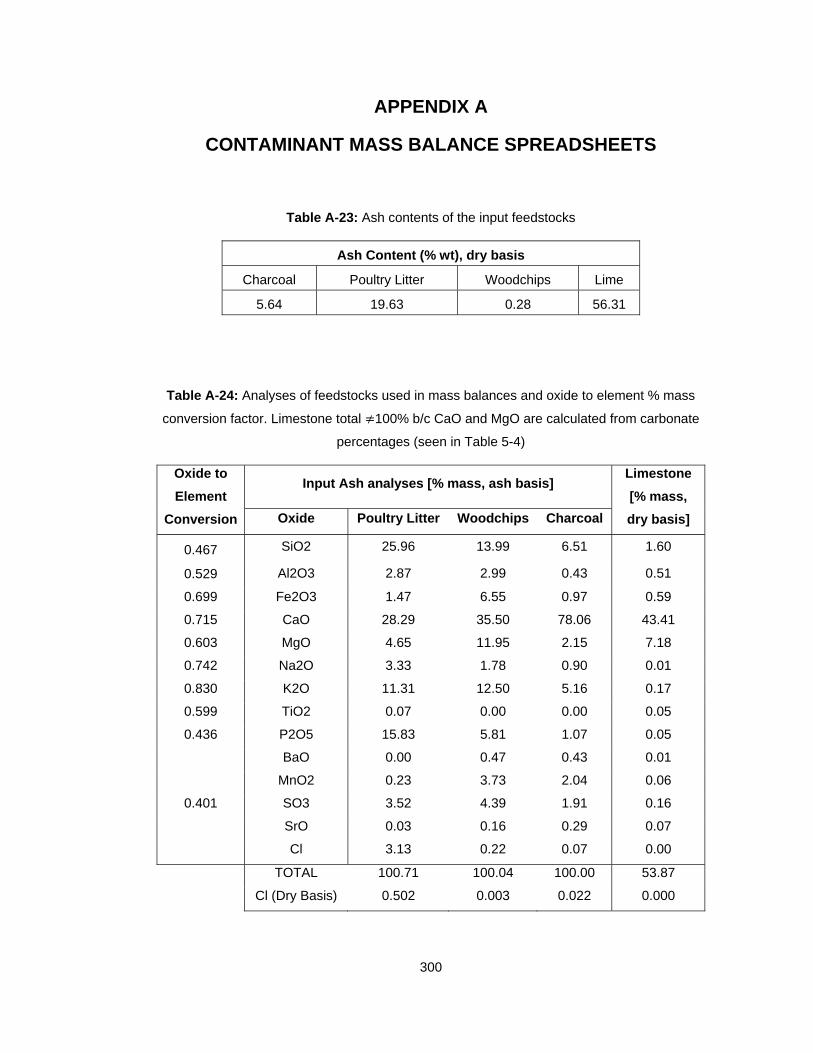
300
APPENDIX A
CONTAMINANT MASS BALANCE SPREADSHEETS
Table A-23: Ash contents of the input feedstocks
Ash Content (% wt), dry basis
Charcoal Poultry Litter Woodchips Lime
5.64 19.63 0.28 56.31
Table A-24: Analyses of feedstocks used in mass balances and oxide to element % mass
conversion factor. Limestone total 100% b/c CaO and MgO are calculated from carbonate
percentages (seen in Table 5-4)
Oxide to
Element
Conversion
Input Ash analyses [% mass, ash basis] Limestone
[% mass,
dry basis] Oxide Poultry Litter Woodchips Charcoal
0.467 SiO2 25.96 13.99 6.51 1.60
0.529 Al2O3 2.87 2.99 0.43 0.51
0.699 Fe2O3 1.47 6.55 0.97 0.59
0.715 CaO 28.29 35.50 78.06 43.41
0.603 MgO 4.65 11.95 2.15 7.18
0.742 Na2O 3.33 1.78 0.90 0.01
0.830 K2O 11.31 12.50 5.16 0.17
0.599 TiO2 0.07 0.00 0.00 0.05
0.436 P2O5 15.83 5.81 1.07 0.05
BaO 0.00 0.47 0.43 0.01
MnO2 0.23 3.73 2.04 0.06
0.401 SO3 3.52 4.39 1.91 0.16
SrO 0.03 0.16 0.29 0.07
Cl 3.13 0.22 0.07 0.00
TOTAL 100.71 100.04 100.00 53.87
Cl (Dry Basis) 0.502 0.003 0.022 0.000
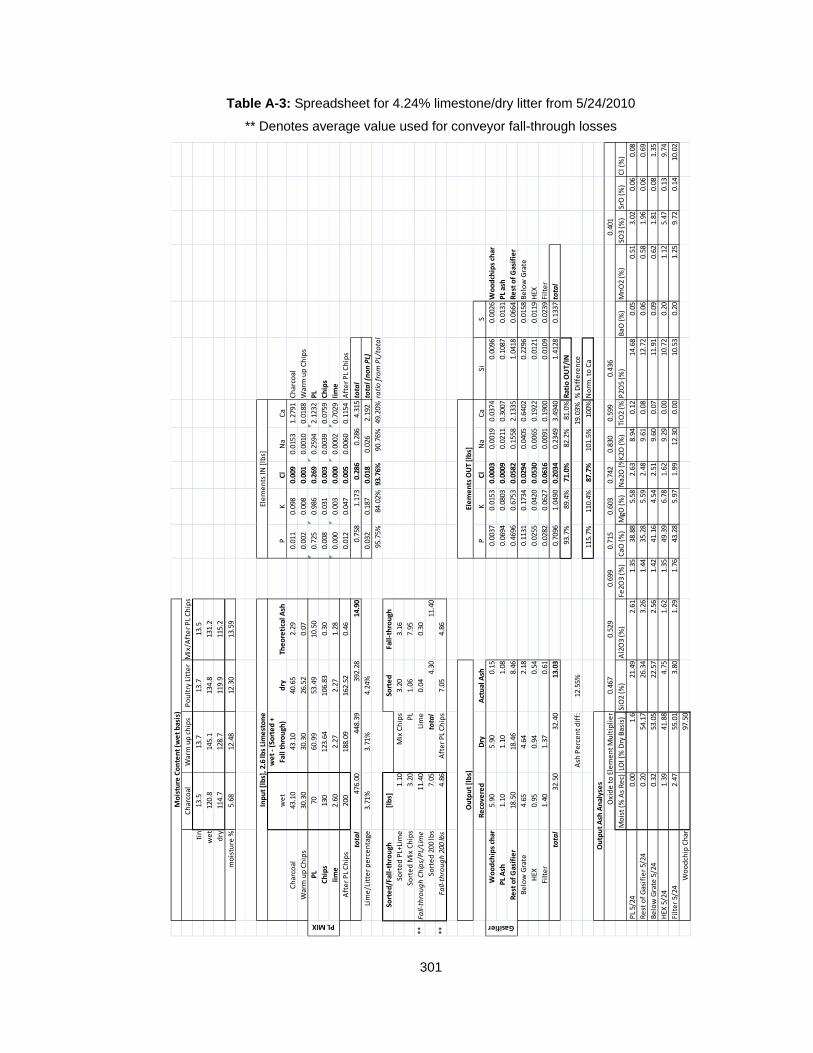
301
Table A-3: Spreadsheet for 4.24% limestone/dry litter from 5/24/2010
** Denotes average value used for conveyor fall-through losses
Charcoal
Warm up chips
Poultry LitterMix/After PL Chips
tin
13.5
13.7
13.7
13.5
wet
120.8
145.1
134.8
131.2
dry
114.7
128.7
119.9
115.2
moisture %
5.68
12.48
12.30
13.59
wet
wet ‐ (Sorted +
Fall through)
dry
Theoretical A
shP
KCl
Na
Ca
Charcoal
43.10
43.10
40.65
2.29
0.011
0.098
0.009
0.0153
1.2791
Charcoal
Warm up Chips
30.30
30.30
26.52
0.07
0.002
0.008
0.001
0.0010
0.0188
Warm up Chips
PL
7060.99
53.49
10.50
0.725
0.986
0.269
0.2594
2.1232
PL
Chips
130
123.64
106.83
0.30
0.008
0.031
0.003
0.0039
0.0759
Chips
lime
2.60
2.27
2.27
1.28
0.000
0.003
0.000
0.0002
0.7029
lime
After PL Chips
200
188.09
162.52
0.46
0.012
0.047
0.005
0.0060
0.1154
After PL Chips
total
476.00
448.39
392.28
14.90
0.758
1.173
0.286
0.286
4.315total
Lime/Litter percentage
3.71%
3.71%
4.24%
0.032
0.187
0.018
0.026
2.192
total (non PL)
95.75%
84.02%
93.76%
90.76%
49.20%
ratio from PL/total
Sorted/Fall‐through
[lbs]
Sorted
Fall‐through
Sorted PL+Lime
1.10
Mix Chips
3.20
3.16
Sorted Mix Chips
3.20
PL
1.06
7.95
**Fall‐through Chips/PL/Lime
11.40
Lime
0.04
0.30
Sorted 200 lbs
7.05
total
4.30
11.40
**Fall‐through 200 lbs
4.86
After PL Chips
7.05
4.86
Recovered
Dry
Actual Ash
PK
Cl
Na
Ca
SiS
Woodchips char
5.90
5.90
0.15
0.0037
0.0153
0.0003
0.0019
0.0374
0.0096
0.0026
Woodchips char
PL Ash
1.10
1.10
1.08
0.0694
0.0803
0.0009
0.0211
0.3007
0.1087
0.0131
PL ash
Rest of Gasifier
18.50
18.46
8.46
0.4696
0.6753
0.0582
0.1558
2.1335
1.0418
0.0664
Rest of Gasifier
Below Grate
4.65
4.64
2.18
0.1131
0.1734
0.0294
0.0405
0.6402
0.2296
0.0158
Below Grate
HEX
0.95
0.94
0.54
0.0255
0.0420
0.0530
0.0065
0.1922
0.0121
0.0119
HEX
Filter
1.40
1.37
0.61
0.0282
0.0627
0.0616
0.0091
0.1900
0.0109
0.0239
Filter
total
32.50
32.40
13.03
0.7096
1.0490
0.2034
0.2349
3.4940
1.4128
0.1337
total
93.7%
89.4%
71.0%
82.2%
81.0%
Ratio OUT/IN
Ash Percent diff:
12.55%
19.03%
% Difference
115.7%
110.4%
87.7%
101.5%
100%
Norm
. to Ca
0.467
0.529
0.699
0.715
0.603
0.742
0.830
0.599
0.436
0.401
Moist (%
As Rec)
LOI (% Dry Basis)
SiO2 (%
)Al2O3 (%
)Fe2O
3 (%
)CaO
(%)
MgO
(%)
Na2O (%K2O
(%)
TiO2 (%
)P2O
5 (%
)BaO
(%)
MnO2 (%
)SO
3 (%
)SrO (%)
Cl (%)
PL 5/24
0.00
1.6
21.49
2.61
1.35
38.88
5.58
2.63
8.94
0.12
14.68
0.05
0.51
3.02
0.06
0.08
Rest of Gasifier 5/24
0.20
54.17
26.34
3.26
1.44
35.28
5.59
2.48
9.61
0.08
12.72
0.06
0.58
1.96
0.06
0.69
Below Grate 5/24
0.32
53.05
22.57
2.56
1.42
41.16
4.54
2.51
9.60
0.07
11.91
0.09
0.62
1.81
0.08
1.35
HEX
5/24
1.39
41.88
4.75
1.62
1.35
49.39
6.78
1.62
9.29
0.00
10.72
0.20
1.12
5.47
0.13
9.74
Filter 5/24
2.47
55.01
3.80
1.29
1.76
43.28
5.97
1.99
12.30
0.00
10.53
0.20
1.25
9.72
0.14
10.02
Woodchip Char
97.50
Gasifier
Elements IN
[lbs]
Elements OUT [lbs]
Moisture Content (w
et basis)
PL MIX
Output Ash Analyses
Oxide to Element Multiplier
Output [lbs]
Input [lbs], 2.6 lbs Limestone
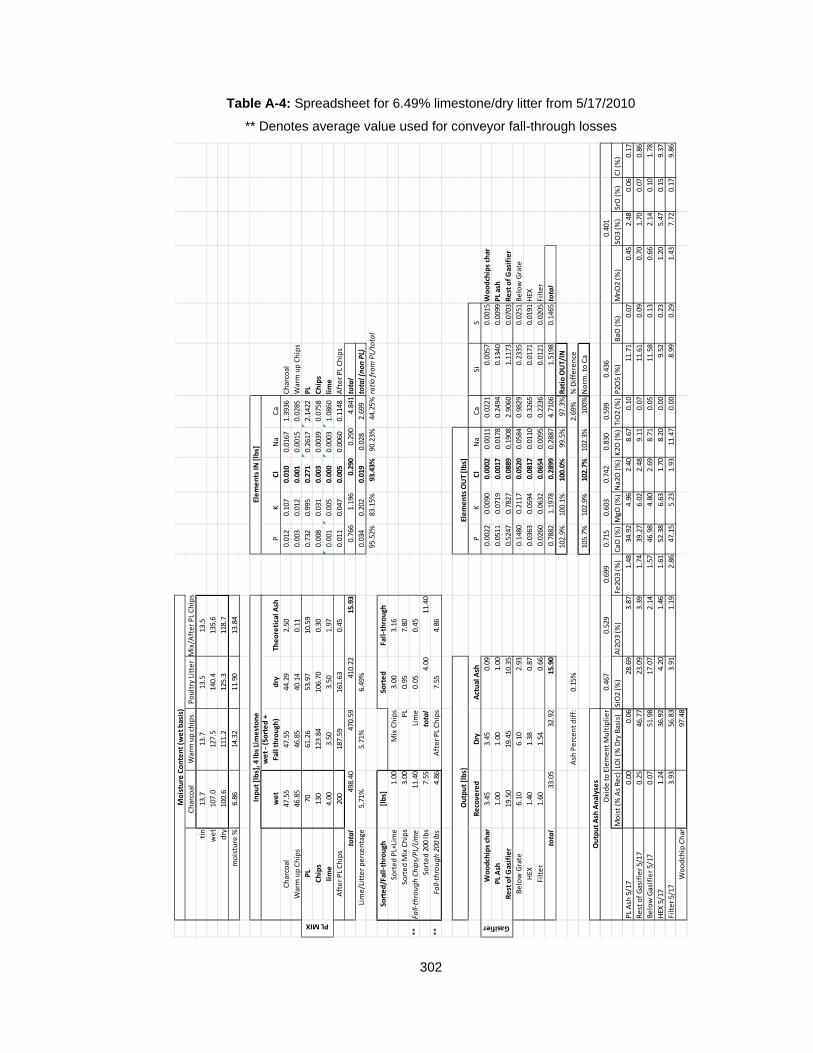
302
Table A-4: Spreadsheet for 6.49% limestone/dry litter from 5/17/2010
** Denotes average value used for conveyor fall-through losses
Charcoal
Warm up chips
Poultry LitterMix/After PL Chips
tin
13.7
13.7
13.5
13.5
wet
107.0
127.5
140.4
135.6
dry
100.6
111.2
125.3
118.7
moisture %
6.86
14.32
11.90
13.84
wet
wet ‐ (Sorted +
Fall through)
dry
Theoretical A
shP
KCl
Na
Ca
Charcoal
47.55
47.55
44.29
2.50
0.012
0.107
0.010
0.0167
1.3936
Charcoal
Warm up Chips
46.85
46.85
40.14
0.11
0.003
0.012
0.001
0.0015
0.0285
Warm up Chips
PL
7061.26
53.97
10.59
0.732
0.995
0.271
0.2617
2.1422
PL
Chips
130
123.84
106.70
0.30
0.008
0.031
0.003
0.0039
0.0758
Chips
lime
4.00
3.50
3.50
1.97
0.001
0.005
0.000
0.0003
1.0860
lime
After PL Chips
200
187.59
161.63
0.45
0.011
0.047
0.005
0.0060
0.1148
After PL Chips
total
498.40
470.59
410.22
15.93
0.766
1.196
0.290
0.290
4.841total
Lime/Litter percentage
5.71%
5.71%
6.49%
0.034
0.202
0.019
0.028
2.699
total (non PL)
95.52%
83.15%
93.43%
90.23%
44.25%
ratio from PL/total
Sorted/Fall‐through
[lbs]
Sorted
Fall‐through
Sor ted PL+Lime
1.00
Mix Chips
3.00
3.16
Sorted Mix Chips
3.00
PL
0.95
7.80
**Fall‐through Chips/PL/Lime
11.40
Lime
0.05
0.45
Sorted 200 lbs
7.55
total
4.00
11.40
**Fall‐through 200 lbs
4.86
After PL Chips
7.55
4.86
Recovered
Dry
Actual Ash
PK
Cl
Na
Ca
SiS
Woodchips char
3.45
3.45
0.09
0.0022
0.0090
0.0002
0.0011
0.0221
0.0057
0.0015
Woodchips char
PL Ash
1.00
1.00
1.00
0.0511
0.0719
0.0017
0.0178
0.2494
0.1340
0.0099
PL ash
Rest of Gasifier
19.50
19.45
10.35
0.5247
0.7827
0.0889
0.1908
2.9060
1.1173
0.0703
Rest of Gasifier
Below Grate
6.10
6.10
2.93
0.1480
0.2117
0.0520
0.0584
0.9829
0.2335
0.0251
Below Grate
HEX
1.40
1.38
0.87
0.0363
0.0594
0.0817
0.0110
0.3265
0.0171
0.0191
HEX
Filter
1.60
1.54
0.66
0.0260
0.0632
0.0654
0.0095
0.2236
0.0121
0.0205
Filter
total
33.05
32.92
15.90
0.7882
1.1978
0.2899
0.2887
4.7106
1.5198
0.1465
total
102.9%
100.1%
100.0%
99.5%
97.3%
Ratio OUT/IN
Ash Percent diff:
0.15%
2.69%
% Difference
105.7%
102.9%
102.7%
102.3%
100%
Norm
. to Ca
0.467
0.529
0.699
0.715
0.603
0.742
0.830
0.599
0.436
0.401
Moist (%
As Rec)
LOI (% Dry Basis)
SiO2 (%
)Al2O3 (%
)Fe2O
3 (%
)CaO
(%)MgO
(%)Na2O (%)K2O
(%)TiO2 (%
)P2O
5 (%
)BaO
(%)
MnO2 (%
)SO
3 (%
)SrO (%)
Cl (%)
PL Ash 5/17
0.00
0.06
28.69
3.87
1.48
34.92
4.96
2.40
8.67
0.10
11.71
0.07
0.45
2.48
0.06
0.17
Rest of Gasifier 5/17
0.25
46.77
23.09
3.39
1.74
39.27
6.02
2.48
9.11
0.07
11.61
0.09
0.70
1.70
0.07
0.86
Below Gasifier 5/17
0.07
51.98
17.07
2.14
1.57
46.98
4.80
2.69
8.71
0.05
11.58
0.13
0.66
2.14
0.10
1.78
HEX
5/17
1.24
36.92
4.20
1.46
1.61
52.38
6.63
1.70
8.20
0.00
9.52
0.23
1.20
5.47
0.15
9.37
Filter 5/17
3.93
56.83
3.91
1.19
2.86
47.15
5.23
1.93
11.47
0.00
8.99
0.29
1.43
7.72
0.17
9.86
Woodchip Char
97.48
Elements IN
[lbs]
Elements OUT [lbs]
Moisture Content (w
et basis)
PL MIX
Oxide to Element Multiplier
Output Ash Analyses
Output [lbs]
Gasifier
Input [lbs], 4 lbs Limestone
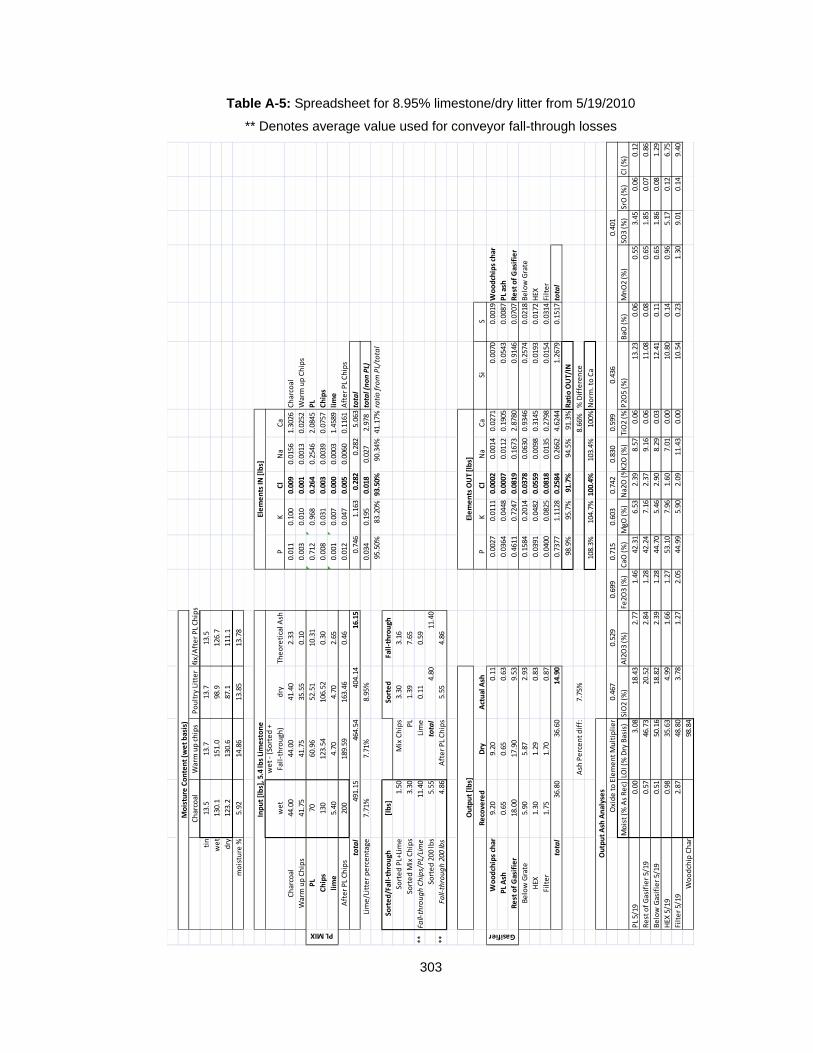
303
Table A-5: Spreadsheet for 8.95% limestone/dry litter from 5/19/2010
** Denotes average value used for conveyor fall-through losses
Charcoal
Warm up chips
Poultry LitterMix/After PL Chips
tin
13.5
13.7
13.7
13.5
wet
130.1
151.0
98.9
126.7
dry
123.2
130.6
87.1
111.1
moisture %
5.92
14.86
13.85
13.78
wet
wet ‐ (Sorted +
Fall‐through)
dry
Theoretical A
shP
KCl
Na
Ca
Charcoal
44.00
44.00
41.40
2.33
0.011
0.100
0.009
0.0156
1.3026
Charcoal
Warm up Chips
41.75
41.75
35.55
0.10
0.003
0.010
0.001
0.0013
0.0252
Warm up Chips
PL
7060.96
52.51
10.31
0.712
0.968
0.264
0.2546
2.0845
PL
Chips
130
123.54
106.52
0.30
0.008
0.031
0.003
0.0039
0.0757
Chips
lime
5.40
4.70
4.70
2.65
0.001
0.007
0.000
0.0003
1.4589
lime
After PL Chips
200
189.59
163.46
0.46
0.012
0.047
0.005
0.0060
0.1161
After PL Chips
total
491.15
464.54
404.14
16.15
0.746
1.163
0.282
0.282
5.063total
Lime/Litter percentage
7.71%
7.71%
8.95%
0.034
0.195
0.018
0.027
2.978
total (non PL)
95.50%
83.20%
93.50%
90.34%
41.17%
ratio from PL/total
Sorted/Fall‐through
[lbs]
Sorted
Fall‐through
Sorted PL+Lime
1.50
Mix Chips
3.30
3.16
Sorted Mi x Chips
3.30
PL
1.39
7.65
**Fall‐through Chips/PL/Lime
11.40
Lime
0.11
0.59
Sorted 200 lbs
5.55
total
4.80
11.40
**Fall‐through 200 lbs
4.86
After PL Chips
5.55
4.86
Recovered
Dry
Actual Ash
PK
Cl
Na
Ca
SiS
Woodchips char
9.20
9.20
0.11
0.0027
0.0111
0.0002
0.0014
0.0271
0.0070
0.0019
Woodchips char
PL Ash
0.65
0.65
0.63
0.0364
0.0448
0.0007
0.0112
0.1905
0.0543
0.0087
PL ash
Rest of Gasifier
18.00
17.90
9.53
0.4611
0.7247
0.0819
0.1673
2.8780
0.9146
0.0707
Rest of Gasifier
Below Grate
5.90
5.87
2.93
0.1584
0.2014
0.0378
0.0630
0.9346
0.2574
0.0218
Below Grate
HEX
1.30
1.29
0.83
0.0391
0.0482
0.0559
0.0098
0.3145
0.0193
0.0172
HEX
Filter
1.75
1.70
0.87
0.0400
0.0825
0.0818
0.0135
0.2798
0.0154
0.0314
Filter
total
36.80
36.60
14.90
0.7377
1.1128
0.2584
0.2662
4.6244
1.2679
0.1517
total
98.9%
95.7%
91.7%
94.5%
91.3%
Ratio OUT/IN
Ash Percent diff:
7.75%
8.66%
% Difference
108.3%
104.7%
100.4%
103.4%
100%
Norm
. to Ca
0.467
0.529
0.699
0.715
0.603
0.742
0.830
0.599
0.436
0.401
Moist (%
As Rec)
LOI (% Dry Basis)
SiO2 (%
)Al2O3 (%
)Fe2O
3 (%
)CaO
(%)
MgO
(%)
Na2O (%K2O
(%)
TiO2 (%
)P2O
5 (%
)BaO
(%)
MnO2 (%
)SO
3 (%
)SrO (%)
Cl (%)
PL 5/19
0.00
3.08
18.43
2.77
1.46
42.31
6.53
2.39
8.57
0.06
13.23
0.06
0.55
3.45
0.06
0.12
Rest of Gasifier 5/19
0.57
46.73
20.52
2.84
1.28
42.24
7.16
2.37
9.16
0.06
11.08
0.08
0.65
1.85
0.07
0.86
Below Gasifier 5/19
0.51
50.16
18.82
2.39
1.28
44.70
5.46
2.90
8.29
0.03
12.41
0.11
0.65
1.86
0.08
1.29
HEX
5/19
0.98
35.63
4.99
1.66
1.27
53.10
7.96
1.60
7.01
0.00
10.80
0.14
0.96
5.17
0.12
6.75
Filter 5/19
2.87
48.80
3.78
1.27
2.05
44.99
5.90
2.09
11.43
0.00
10.54
0.23
1.30
9.01
0.14
9.40
Woodchip Char
98.84
Gasifier
Moisture Content (w
et basis)
PL MIX
Input [lbs], 5.4 lbs Limestone
Elements IN
[lbs]
Output Ash Analyses
Oxide to Element Multiplier
Elements OUT [lbs]
Output [lbs]
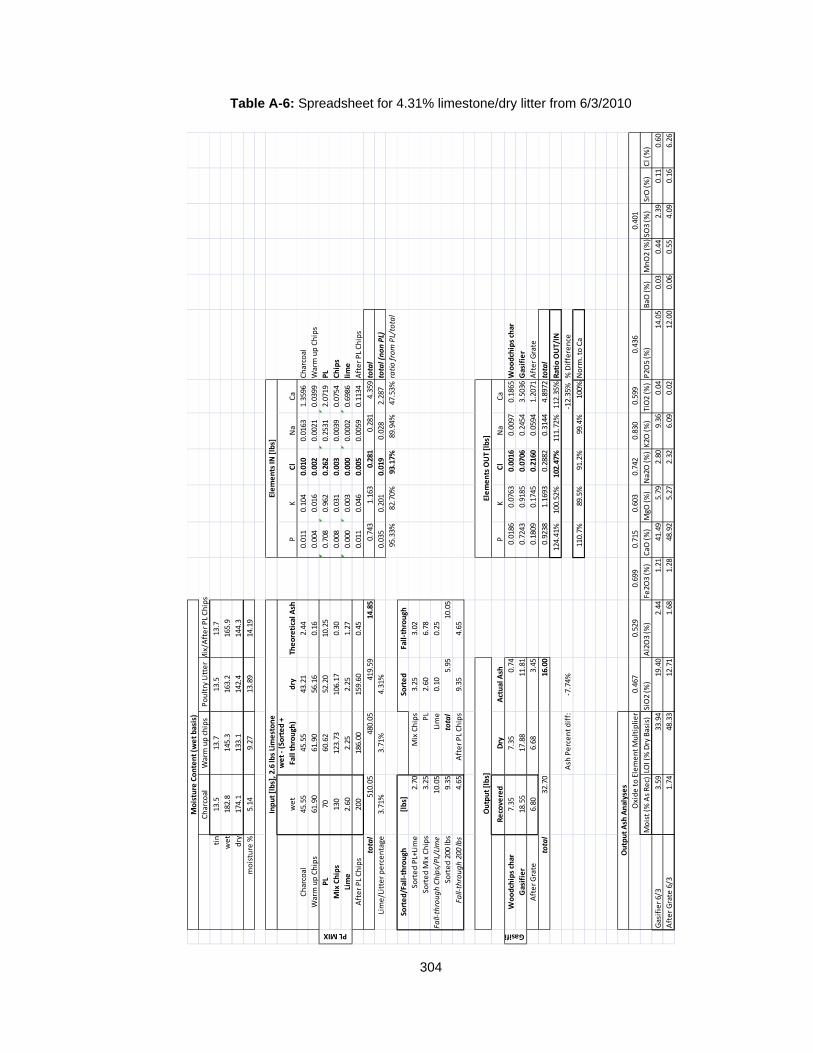
304
Table A-6: Spreadsheet for 4.31% limestone/dry litter from 6/3/2010
Charcoal
Warm up chips
Poultry LitterMix/After PL Chips
tin
13.5
13.7
13.5
13.7
wet
182.8
145.3
163.2
165.9
dry
174.1
133.1
142.4
144.3
moisture %
5.14
9.27
13.89
14.19
wet
wet ‐ (Sorted +
Fall through)
dry
Theoretical A
shP
KCl
Na
Ca
Charcoal
45.55
45.55
43.21
2.44
0.011
0.104
0.010
0.0163
1.3596
Charcoal
Warm up Chips
61.90
61.90
56.16
0.16
0.004
0.016
0.002
0.0021
0.0399
Warm up Chips
PL
7060.62
52.20
10.25
0.708
0.962
0.262
0.2531
2.0719
PL
Mix Chips
130
123.73
106.17
0.30
0.008
0.031
0.003
0.0039
0.0754
Chips
Lime
2.60
2.25
2.25
1.27
0.000
0.003
0.000
0.0002
0.6986
lime
After PL Chips
200
186.00
159.60
0.45
0.011
0.046
0.005
0.0059
0.1134
After PL Chips
total
510.05
480.05
419.59
14.85
0.743
1.163
0.281
0.281
4.359total
Lime/Litter percentage
3.71%
3.71%
4.31%
0.035
0.201
0.019
0.028
2.287
total (non PL)
95.33%
82.70%
93.17%
89.94%
47.53%
ratio from PL/total
Sorted/Fall‐through
[lbs]
Sorted
Fall‐through
Sorted PL+Lime
2.70
Mix Chips
3.25
3.02
Sorted Mix Chips
3.25
PL
2.60
6.78
Fall‐through Chips/PL/Lime
10.05
Lime
0.10
0.25
Sorted 200 lbs
9.35
total
5.95
10.05
Fall‐through 200 lbs
4.65
After PL Chips
9.35
4.65
Recovered
Dry
Actual Ash
PK
Cl
Na
Ca
Woodchips char
7.35
7.35
0.74
0.0186
0.0763
0.0016
0.0097
0.1865
Woodchips char
Gasifier
18.55
17.88
11.81
0.7243
0.9185
0.0706
0.2454
3.5036
Gasifier
After Grate
6.80
6.68
3.45
0.1809
0.1745
0.2160
0.0594
1.2071
After Grate
total
32.70
16.00
0.9238
1.1693
0.2882
0.3144
4.8972
total
124.41%
100.52%
102.47%
111.72%
112.35%
Ratio OUT/IN
Ash Percent diff:
‐7.74%
‐12.35%
% Difference
110.7%
89.5%
91.2%
99.4%
100%
Norm
. to Ca
0.467
0.529
0.699
0.715
0.603
0.742
0.830
0.599
0.436
0.401
Moist (%
As Rec)
LOI (% Dry Basis)
SiO2 (%
)Al2O3 (%
)Fe2O
3 (%
)CaO
(%)
MgO
(%)
Na2O (%)K2O
(%)
TiO2 (%
)P2O
5 (%
)BaO
(%)
MnO2 (%
)SO
3 (%
)SrO (%)
Cl (%)
Gasifier 6/3
3.59
33.94
19.40
2.44
1.21
41.49
5.79
2.80
9.36
0.04
14.05
0.03
0.44
2.39
0.11
0.60
After Grate 6/3
1.74
48.33
12.71
1.68
1.28
48.92
5.27
2.32
6.09
0.02
12.00
0.06
0.55
4.09
0.16
6.26
Moisture Content (w
et basis)
PL MIX
Output [lbs]
Input [lbs], 2.6 lbs Limestone
Elements IN
[lbs]
Elements OUT [lbs]
Output Ash Analyses
Oxide to Element Multiplier
Gasifi
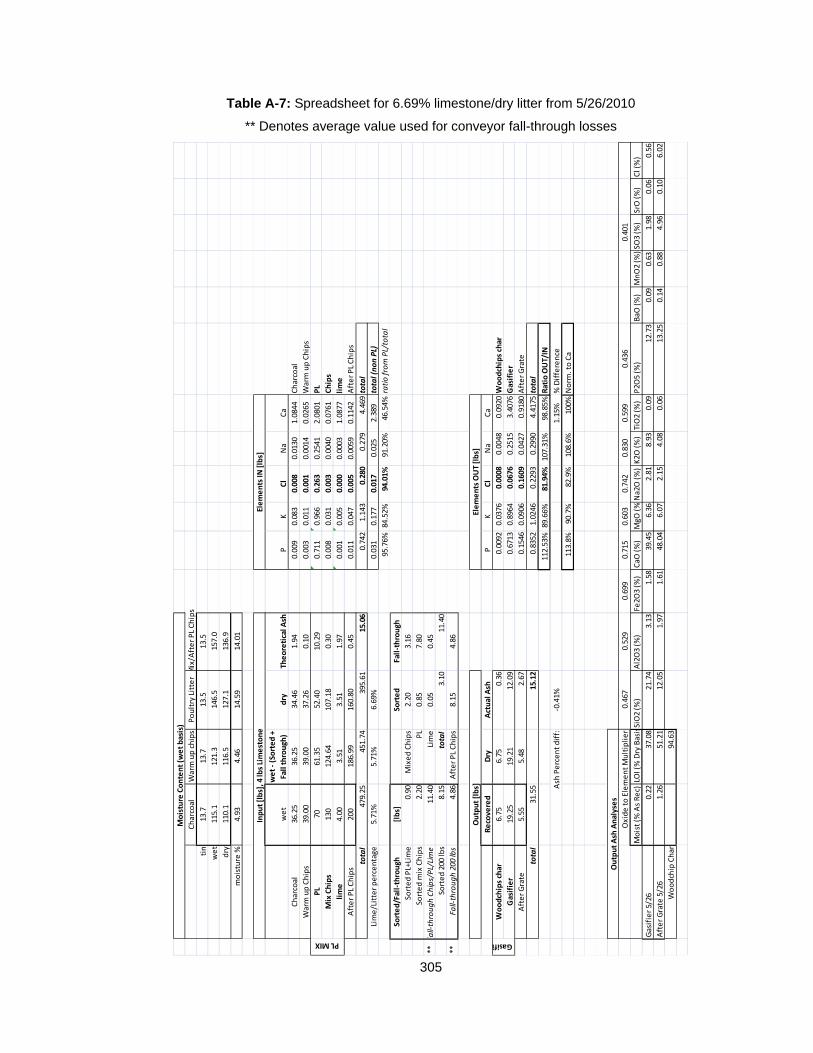
305
Table A-7: Spreadsheet for 6.69% limestone/dry litter from 5/26/2010
** Denotes average value used for conveyor fall-through losses
Charcoal
Warm up chips
Poultry LitterMix/After PL Chips
tin
13.7
13.7
13.5
13.5
wet
115.1
121.3
146.5
157.0
dry
110.1
116.5
127.1
136.9
moisture %
4.93
4.46
14.59
14.01
wet
wet ‐ (Sorted +
Fall through)
dry
Theoretical A
shP
KCl
Na
Ca
Charcoal
36.25
36.25
34.46
1.94
0.009
0.083
0.008
0.0130
1.0844
Charcoal
Warm up Chips
39.00
39.00
37.26
0.10
0.003
0.011
0.001
0.0014
0.0265
Warm up Chips
PL
7061.35
52.40
10.29
0.711
0.966
0.263
0.2541
2.0801
PL
Mix Chips
130
124.64
107.18
0.30
0.008
0.031
0.003
0.0040
0.0761
Chips
lime
4.00
3.51
3.51
1.97
0.001
0.005
0.000
0.0003
1.0877
lime
After PL Chips
200
186.99
160.80
0.45
0.011
0.047
0.005
0.0059
0.1142
After PL Chips
total
479.25
451.74
395.61
15.06
0.742
1.143
0.280
0.279
4.469total
Lime/Litter percentage
5.71%
5.71%
6.69%
0.031
0.177
0.017
0.025
2.389
total (non PL)
95.76%
84.52%
94.01%
91.20%
46.54%
ratio from PL/total
Sorted/Fall‐through
[lbs]
Sorted
Fall‐through
Sorted PL+Lime
0.90
Mixed Chips
2.20
3.16
Sorted mix Chips
2.20
PL
0.85
7.80
**Fall‐through Chips/PL/Lime
11.40
Lime
0.05
0.45
Sorted 200 lbs
8.15
total
3.10
11.40
**Fall‐through 200 lbs
4.86
After PL Chips
8.15
4.86
Recovered
Dry
Actual Ash
PK
Cl
Na
Ca
Woodchips char
6.75
6.75
0.36
0.0092
0.0376
0.0008
0.0048
0.0920
Woodchips char
Gasifier
19.25
19.21
12.09
0.6713
0.8964
0.0676
0.2515
3.4076
Gasifier
After Grate
5.55
5.48
2.67
0.1546
0.0906
0.1609
0.0427
0.9180
After Grate
total
31.55
15.12
0.8352
1.0246
0.2293
0.2990
4.4175
total
112.53%
89.66%
81.94%
107.31%
98.85%
Ratio OUT/IN
Ash Percent diff:
‐0.41%
1.15%
% Difference
113.8%
90.7%
82.9%
108.6%
100%
Norm
. to Ca
0.467
0.529
0.699
0.715
0.603
0.742
0.830
0.599
0.436
0.401
Moist (%
As Rec)
LOI (% Dry Basi sSiO2 (%
)Al2O3 (%
)Fe2O
3 (%
)CaO
(%)
MgO
(%Na2O (%)K2O
(%)
TiO2 (%
)P2O
5 (%
)BaO
(%)
MnO2 (%
)SO
3 (%
)SrO (%)
Cl (%)
Gasifier 5/26
0.22
37.08
21.74
3.13
1.58
39.45
6.36
2.81
8.93
0.09
12.73
0.09
0.63
1.98
0.06
0.56
After Grate 5/26
1.26
51.21
12.05
1.97
1.61
48.04
6.07
2.15
4.08
0.06
13.25
0.14
0.88
4.96
0.10
6.02
Woodchip Char
94.63
Output Ash Analyses
Oxide to Element Multiplier
Elements OUT [lbs]
Gasifi
Input [lbs], 4 lbs Limestone
Output [lbs]
Elements IN
[lbs]
Moisture Content (w
et basis)
PL MIX
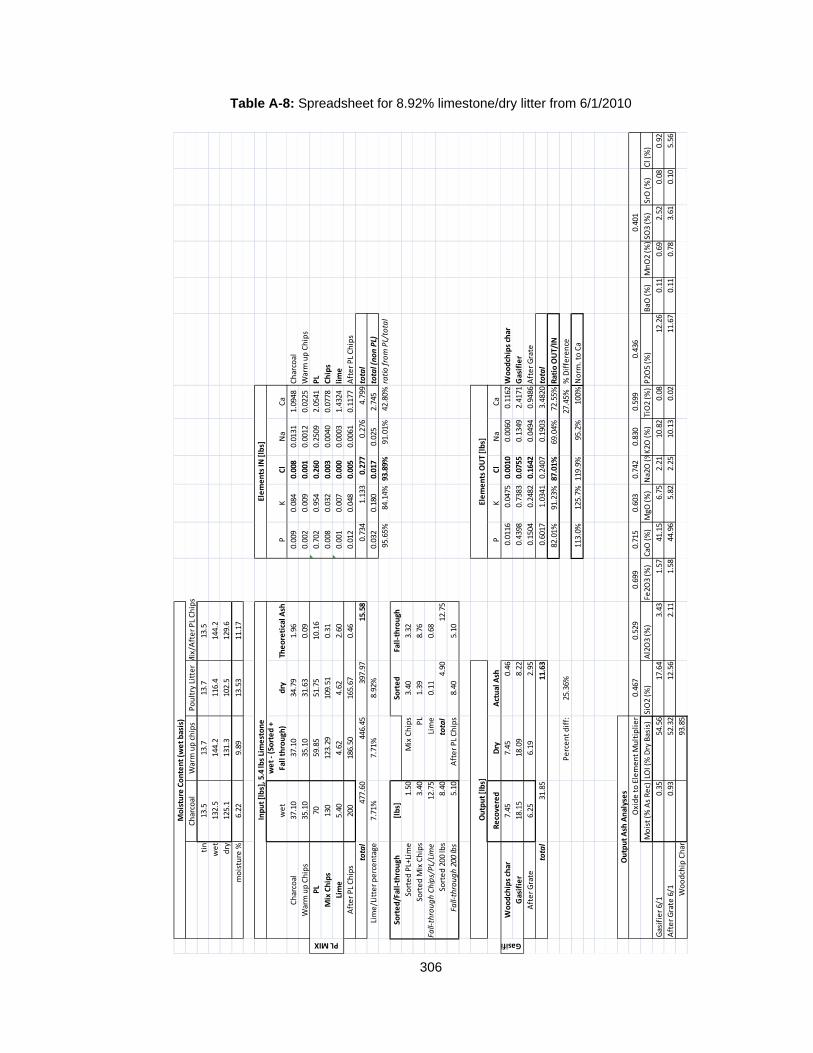
306
Table A-8: Spreadsheet for 8.92% limestone/dry litter from 6/1/2010
Charcoal
Warm up chips
Poultry LitterMix/After PL Chips
tin
13.5
13.7
13.7
13.5
wet
132.5
144.2
116.4
144.2
dry
125.1
131.3
102.5
129.6
moisture %
6.22
9.89
13.53
11.17
wet
wet ‐ (Sorted +
Fall through)
dry
Theoretical A
shP
KCl
Na
Ca
Charcoal
37.10
37.10
34.79
1.96
0.009
0.084
0.008
0.0131
1.0948
Charcoal
Warm up Chips
35.10
35.10
31.63
0.09
0.002
0.009
0.001
0.0012
0.0225
Warm up Chips
PL
7059.85
51.75
10.16
0.702
0.954
0.260
0.2509
2.0541
PL
Mix Chips
130
123.29
109.51
0.31
0.008
0.032
0.003
0.0040
0.0778
Chips
Lime
5.40
4.62
4.62
2.60
0.001
0.007
0.000
0.0003
1.4324
lime
After PL Chips
200
186.50
165.67
0.46
0.012
0.048
0.005
0.0061
0.1177
After PL Chips
total
477.60
446.45
397.97
15.58
0.734
1.133
0.277
0.276
4.799total
Lime/Litter percentage
7.71%
7.71%
8.92%
0.032
0.180
0.017
0.025
2.745
total (non PL)
95.65%
84.14%
93.89%
91.01%
42.80%
ratio from PL/total
Sorted/Fall‐through
[lbs]
Sorted
Fall‐through
Sorted PL+Lime
1.50
Mix Chips
3.40
3.32
Sorted Mix Chips
3.40
PL
1.39
8.76
Fall‐through Chips/PL/Lime
12.75
Lime
0.11
0.68
Sorted 200 lbs
8.40
total
4.90
12.75
Fall‐through 200 lbs
5.10
After PL Chips
8.40
5.10
Recovered
Dry
Actual Ash
PK
Cl
Na
Ca
Woodchips char
7.45
7.45
0.46
0.0116
0.0475
0.0010
0.0060
0.1162
Woodchips char
Gasifier
18.15
18.09
8.22
0.4398
0.7383
0.0755
0.1349
2.4171
Gasifier
After Grate
6.25
6.19
2.95
0.1504
0.2482
0.1642
0.0494
0.9486
After Grate
total
31.85
11.63
0.6017
1.0341
0.2407
0.1903
3.4820
total
82.01%
91.23%
87.01%
69.04%
72.55%
Ratio OUT/IN
Percent diff:
25.36%
27.45%
% Difference
113.0%
125.7%
119.9%
95.2%
100%
Norm
. to Ca
0.467
0.529
0.699
0.715
0.603
0.742
0.830
0.599
0.436
0.401
Moist (%
As Rec)
LOI (% Dry Basis)
SiO2 (%
)Al2O3 (%
)Fe2O
3 (%
)CaO
(%)
MgO
(%)
Na2O (%K2O
(%)
TiO2 (%
)P2O
5 (%
)BaO
(%)
MnO2 (%
)SO
3 (%
)SrO (%)
Cl (%)
Gasifier 6/1
0.35
54.56
17.64
3.43
1.57
41.15
6.75
2.21
10.82
0.08
12.26
0.11
0.69
2.52
0.08
0.92
After Grate 6/1
0.93
52.32
12.56
2.11
1.58
44.96
5.82
2.25
10.13
0.02
11.67
0.11
0.78
3.61
0.10
5.56
Woodchip Char
93.85
Output Ash Analyses
Oxide to Element Multiplier
Elements OUT [lbs]
Gasifi
Moisture Content (w
et basis)
PL MIX
Output [lbs]
Input [lbs], 5.4 lbs Limestone
Elements IN
[lbs]
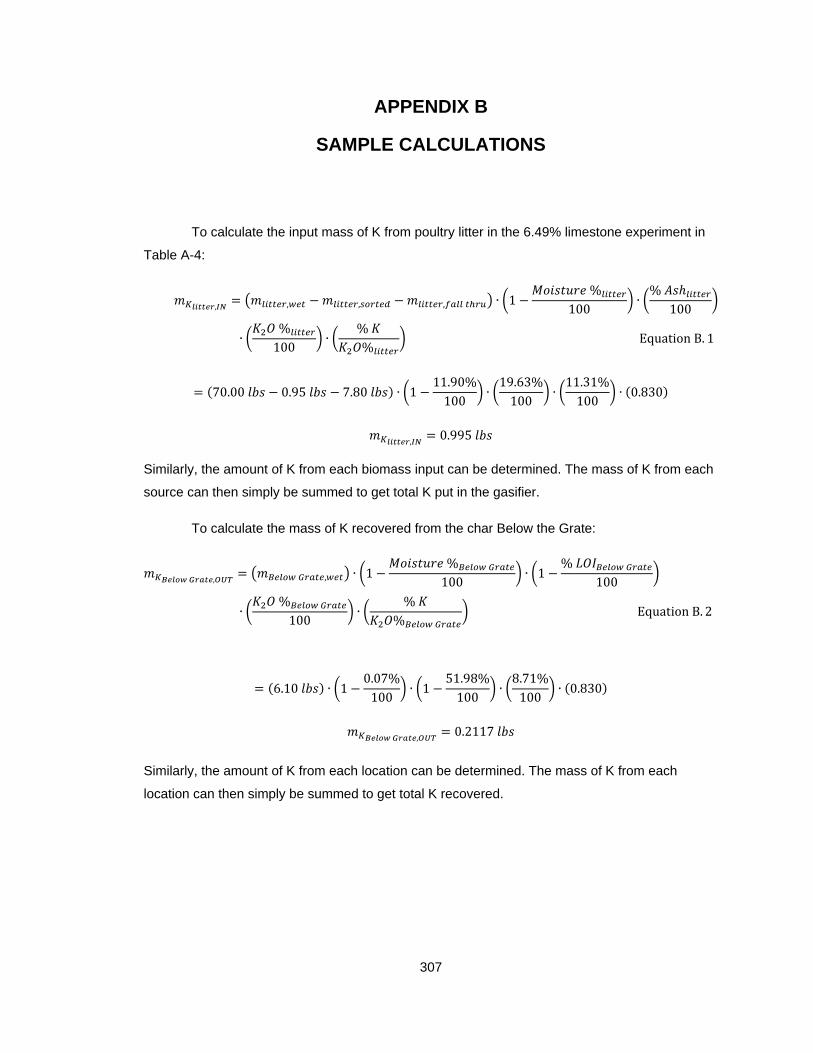
307
APPENDIX B
SAMPLE CALCULATIONS
To calculate the input mass of K from poultry litter in the 6.49% limestone experiment in
Table A-4:
, , , , ∙ 1%
100∙%
100
∙%100
∙%%
EquationB. 1
70.00 0.95 7.80 ∙ 111.90%100
∙19.63%100
∙11.31%100
∙ 0.830
,0.995
Similarly, the amount of K from each biomass input can be determined. The mass of K from each
source can then simply be summed to get total K put in the gasifier.
To calculate the mass of K recovered from the char Below the Grate:
, , ∙ 1%
100∙ 1
%
100
∙%
100∙
%%
EquationB. 2
6.10 ∙ 10.07%100
∙ 151.98%100
∙8.71%100
∙ 0.830
,0.2117
Similarly, the amount of K from each location can be determined. The mass of K from each
location can then simply be summed to get total K recovered.
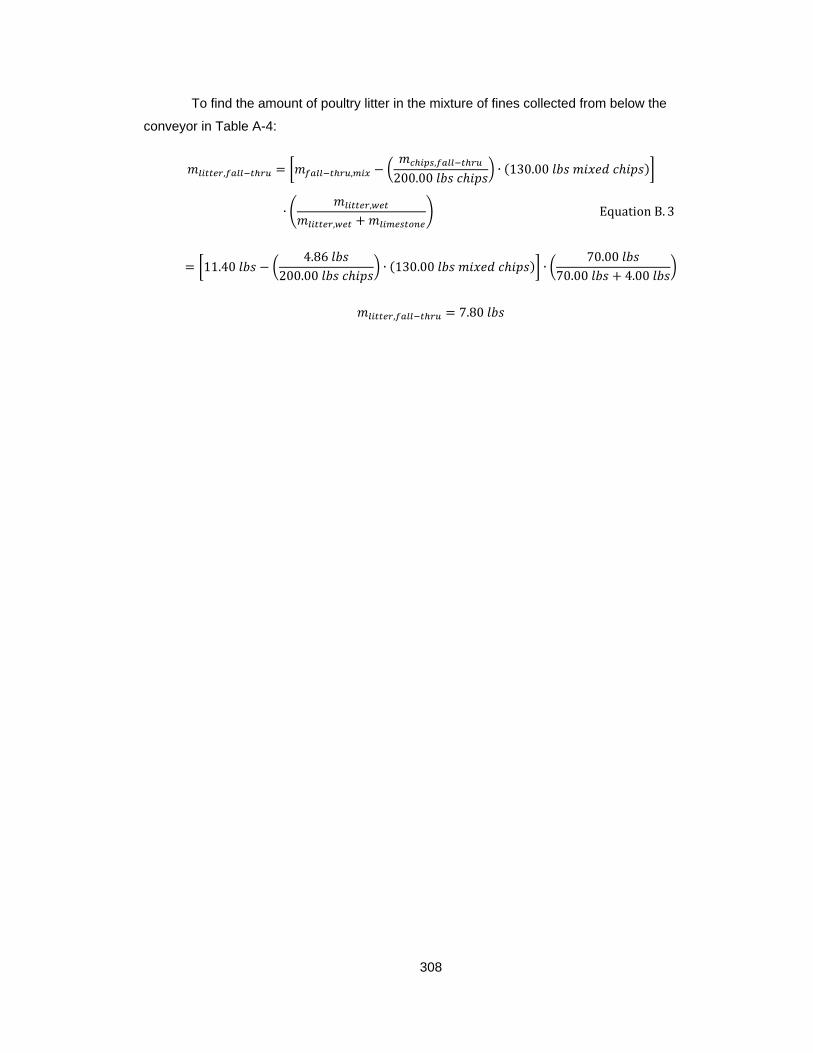
308
To find the amount of poultry litter in the mixture of fines collected from below the
conveyor in Table A-4:
, ,,
200.00 ∙ 130.00
∙ ,
,EquationB. 3
11.404.86
200.00 ∙ 130.00 ∙
70.0070.00 4.00
, 7.80
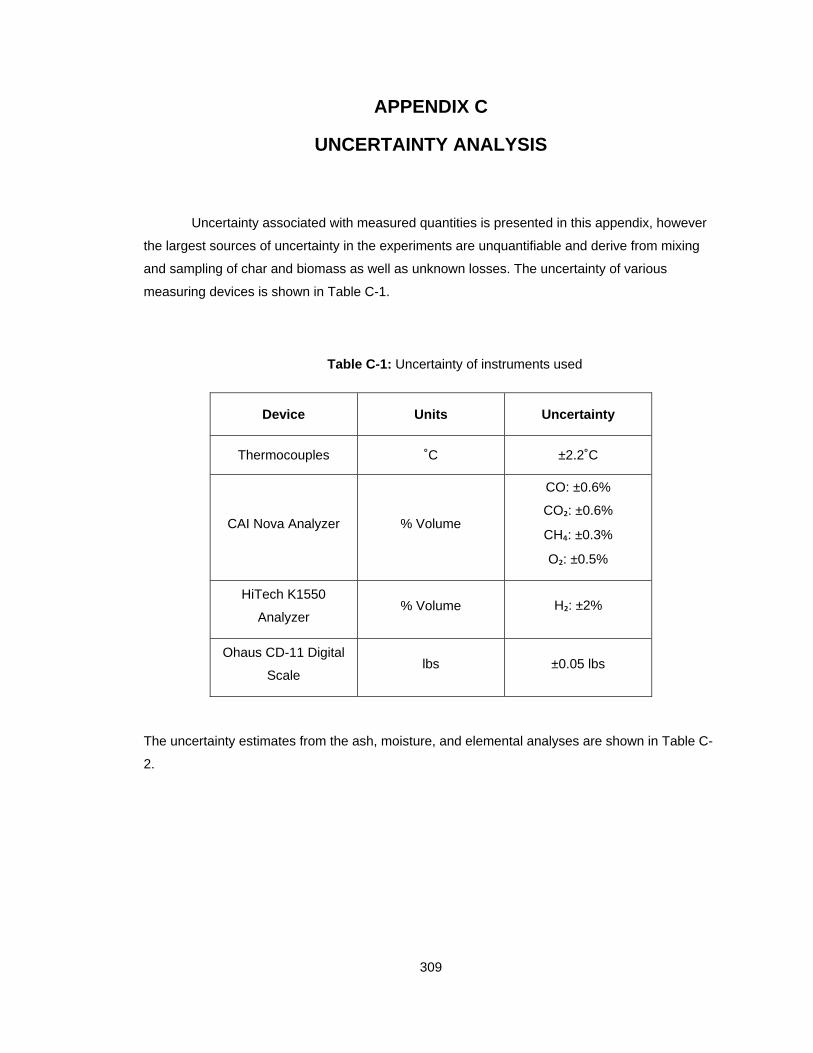
309
APPENDIX C
UNCERTAINTY ANALYSIS
Uncertainty associated with measured quantities is presented in this appendix, however
the largest sources of uncertainty in the experiments are unquantifiable and derive from mixing
and sampling of char and biomass as well as unknown losses. The uncertainty of various
measuring devices is shown in Table C-1.
Table C-1: Uncertainty of instruments used
Device Units Uncertainty
Thermocouples ˚C ±2.2˚C
CAI Nova Analyzer % Volume
CO: ±0.6%
CO₂: ±0.6%
CH₄: ±0.3%
O₂: ±0.5%
HiTech K1550
Analyzer % Volume H₂: ±2%
Ohaus CD-11 Digital
Scale lbs ±0.05 lbs
The uncertainty estimates from the ash, moisture, and elemental analyses are shown in Table C-
2.
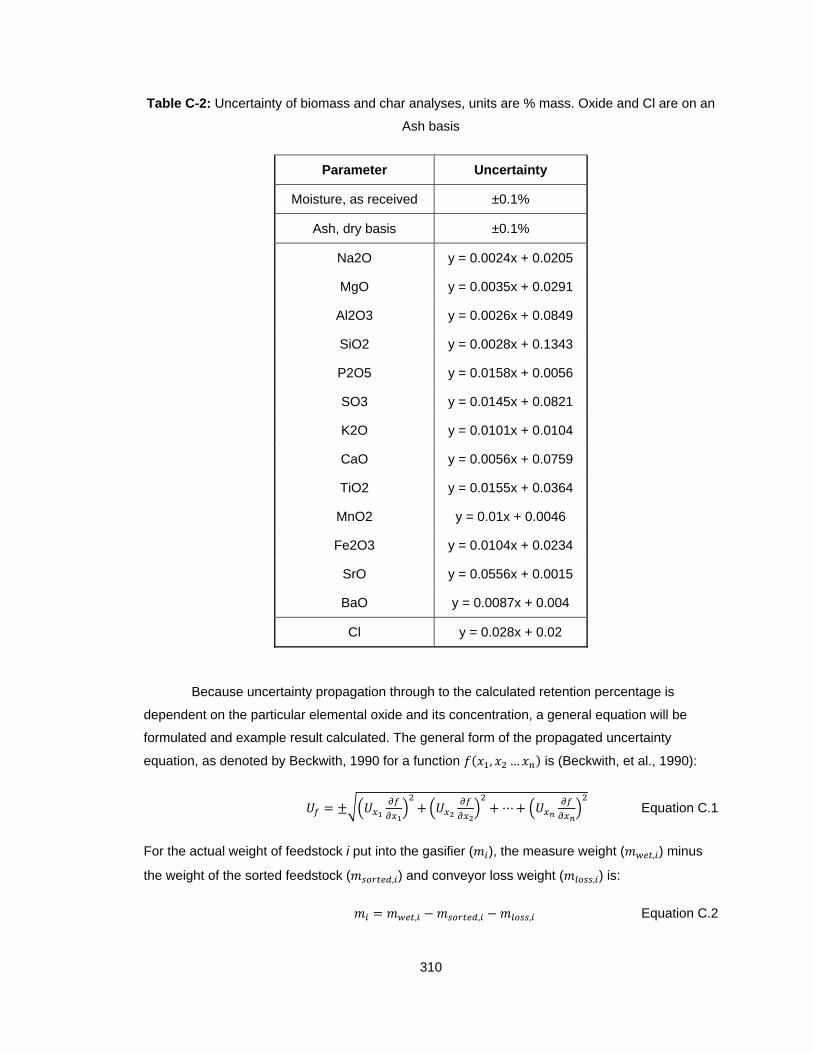
310
Table C-2: Uncertainty of biomass and char analyses, units are % mass. Oxide and Cl are on an
Ash basis
Parameter Uncertainty
Moisture, as received ±0.1%
Ash, dry basis ±0.1%
Na2O y = 0.0024x + 0.0205
MgO y = 0.0035x + 0.0291
Al2O3 y = 0.0026x + 0.0849
SiO2 y = 0.0028x + 0.1343
P2O5 y = 0.0158x + 0.0056
SO3 y = 0.0145x + 0.0821
K2O y = 0.0101x + 0.0104
CaO y = 0.0056x + 0.0759
TiO2 y = 0.0155x + 0.0364
MnO2 y = 0.01x + 0.0046
Fe2O3 y = 0.0104x + 0.0234
SrO y = 0.0556x + 0.0015
BaO y = 0.0087x + 0.004
Cl y = 0.028x + 0.02
Because uncertainty propagation through to the calculated retention percentage is
dependent on the particular elemental oxide and its concentration, a general equation will be
formulated and example result calculated. The general form of the propagated uncertainty
equation, as denoted by Beckwith, 1990 for a function , … is (Beckwith, et al., 1990):
⋯ Equation C.1
For the actual weight of feedstock i put into the gasifier ( ), the measure weight ( , ) minus
the weight of the sorted feedstock ( , ) and conveyor loss weight ( , ) is:
, , , Equation C.2
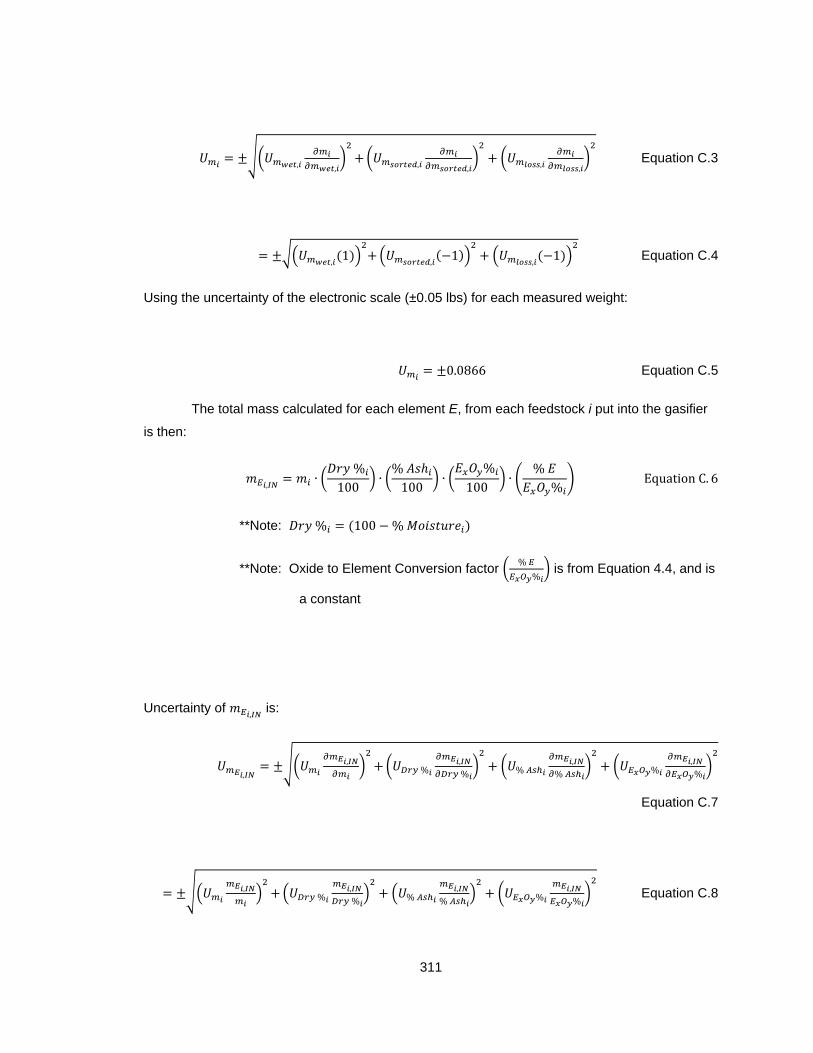
311
, , , , , , Equation C.3
,1
,1
,1 Equation C.4
Using the uncertainty of the electronic scale (±0.05 lbs) for each measured weight:
0.0866 Equation C.5
The total mass calculated for each element E, from each feedstock i put into the gasifier
is then:
,∙
%100
∙%100
∙%
100∙
%%
EquationC. 6
**Note: % 100 %
**Note: Oxide to Element Conversion factor %
% is from Equation 4.4, and is
a constant
Uncertainty of ,
is:
,
,%
,
% %,
% %,
%
Equation C.7
,%
,
% %,
% %,
% Equation C.8
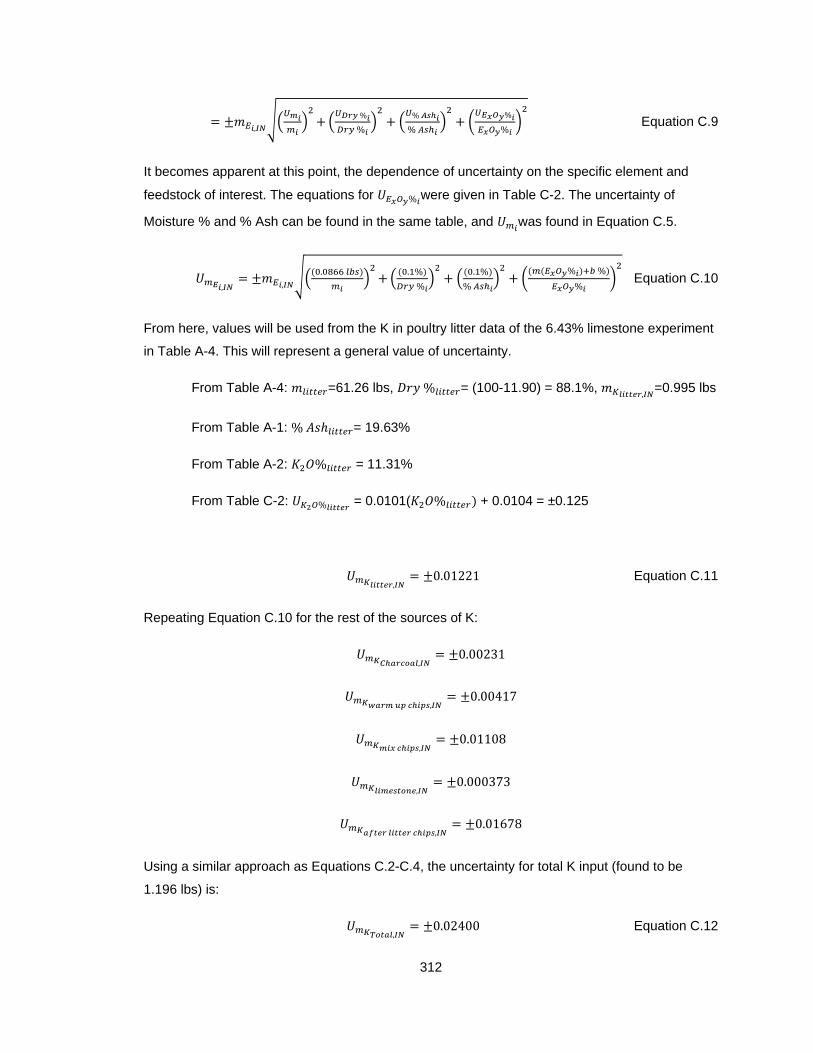
312
,
%
%
%
%
%
% Equation C.9
It becomes apparent at this point, the dependence of uncertainty on the specific element and
feedstock of interest. The equations for % were given in Table C-2. The uncertainty of
Moisture % and % Ash can be found in the same table, and was found in Equation C.5.
, ,
. . %
%
. %
%
% %
% Equation C.10
From here, values will be used from the K in poultry litter data of the 6.43% limestone experiment
in Table A-4. This will represent a general value of uncertainty.
From Table A-4: =61.26 lbs, % = (100-11.90) = 88.1%, ,
=0.995 lbs
From Table A-1: % = 19.63%
From Table A-2: % = 11.31%
From Table C-2: % = 0.0101( % + 0.0104 = ±0.125
,0.01221 Equation C.11
Repeating Equation C.10 for the rest of the sources of K:
,0.00231
,0.00417
,0.01108
,0.000373
,0.01678
Using a similar approach as Equations C.2-C.4, the uncertainty for total K input (found to be
1.196 lbs) is:
,0.02400 Equation C.12
313
Similarly, the uncertainty for the total K recovered in the char is:
,0.01078 Equation C.13
Therefore, uncertainty of the ratio ,
,, presented as “retention percent K” is:
% %, ,
Equation C.14
% 2.201%
Uncertainties for other retention percentages can be found similarly.
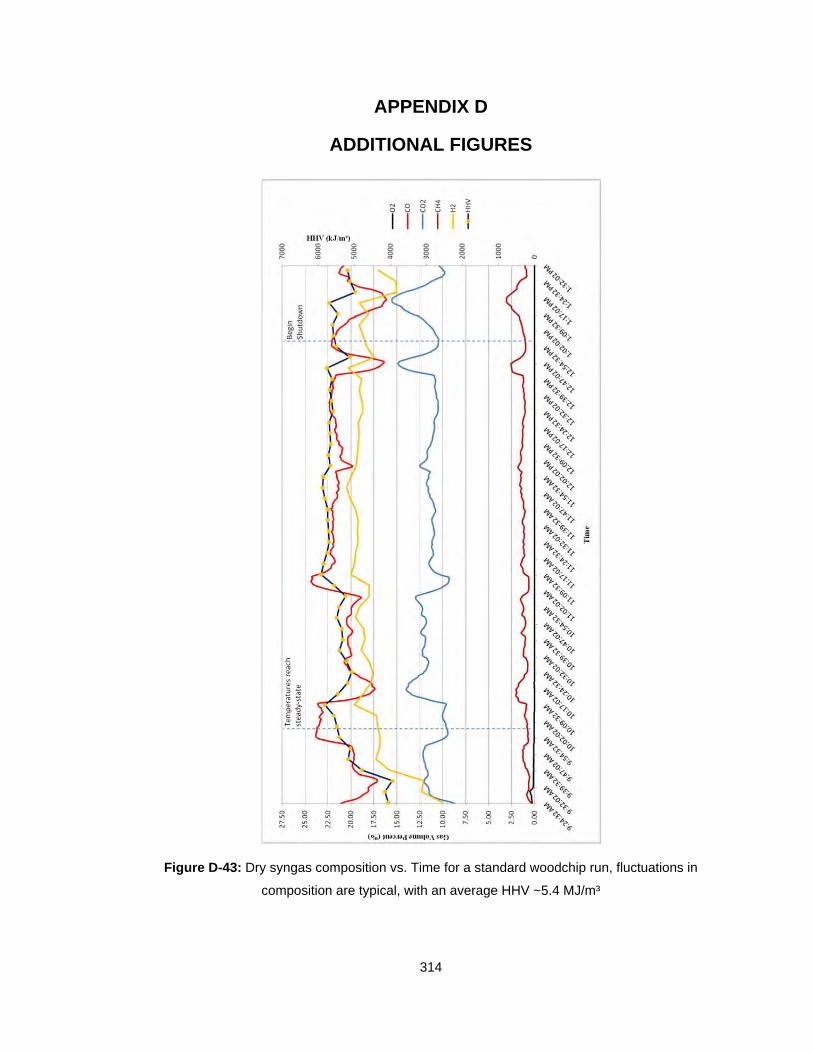
314
APPENDIX D
ADDITIONAL FIGURES
Figure D-43: Dry syngas composition vs. Time for a standard woodchip run, fluctuations in
composition are typical, with an average HHV ~5.4 MJ/m³
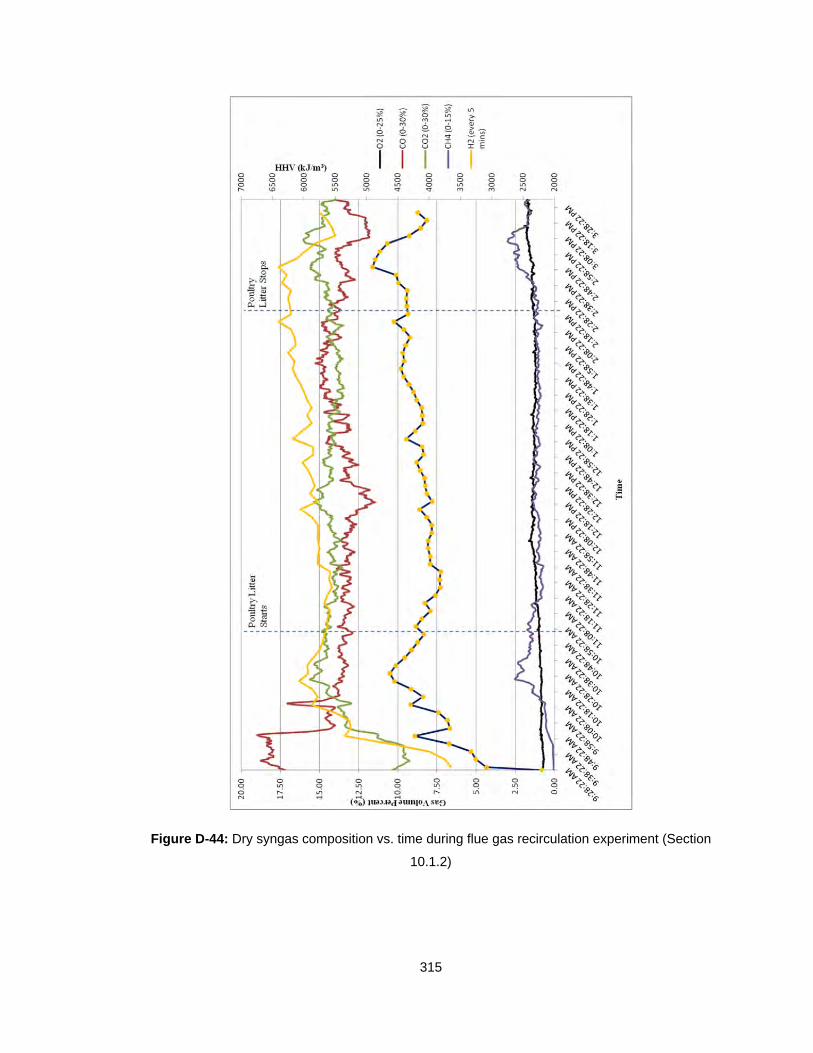
315
Figure D-44: Dry syngas composition vs. time during flue gas recirculation experiment (Section
10.1.2)
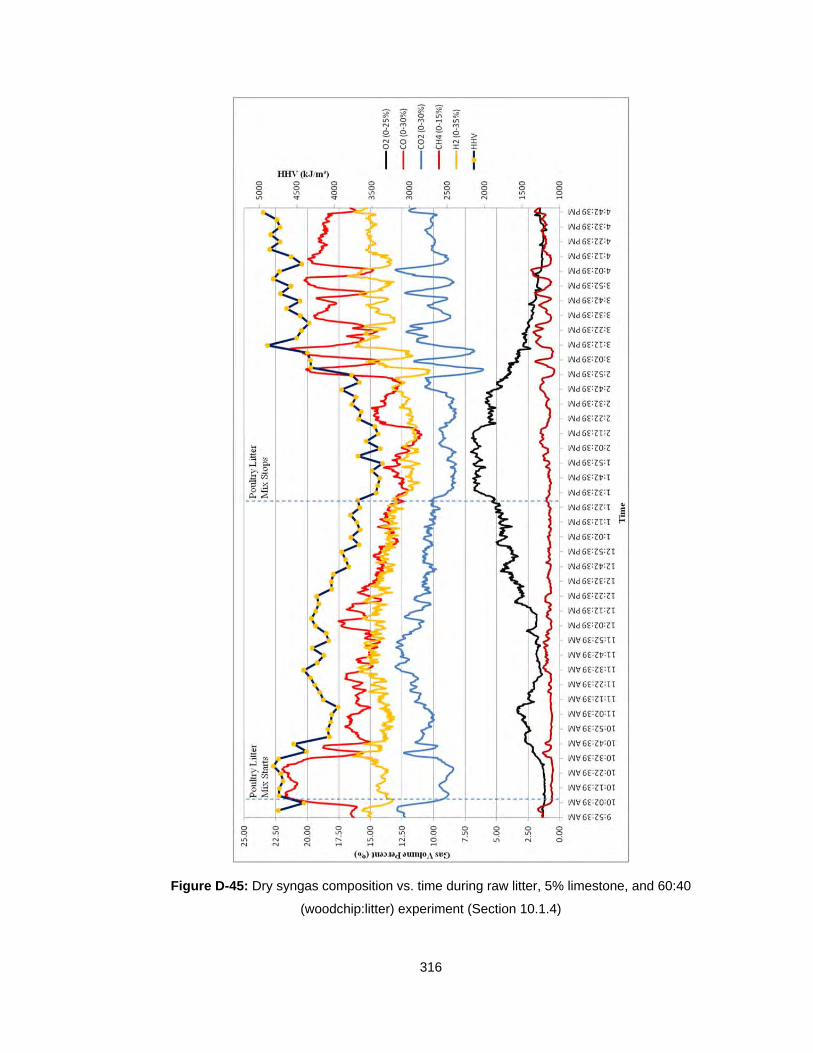
316
Figure D-45: Dry syngas composition vs. time during raw litter, 5% limestone, and 60:40
(woodchip:litter) experiment (Section 10.1.4)
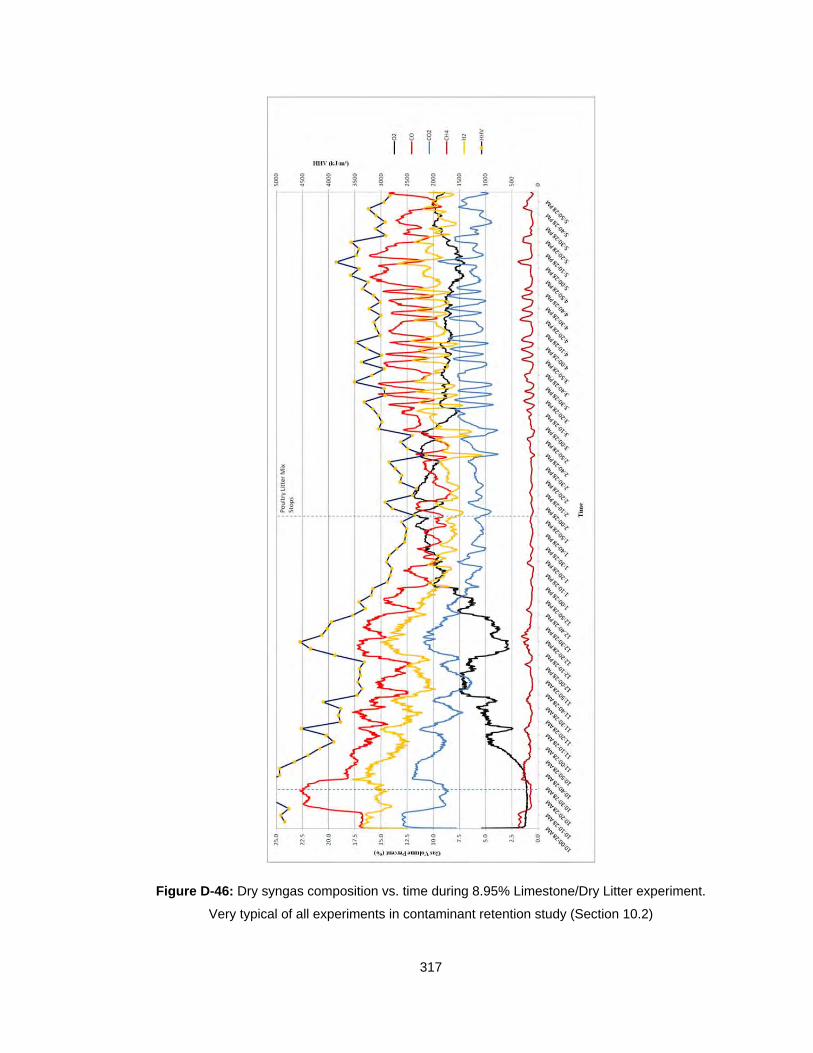
317
Figure D-46: Dry syngas composition vs. time during 8.95% Limestone/Dry Litter experiment.
Very typical of all experiments in contaminant retention study (Section 10.2)