Embed Size (px)
Citation preview
Alternative Sentencing in the Federal Criminal Justice System
UNITED STATES SENTENCING COMMISSION
United States Sentencing Commission
One Columbus Circle, N.E.
Washington, DC 20002www.ussc.gov
Ricardo H. Hinojosa
Acting Chair
Ruben Castillo
Vice Chair
William K. Sessions III
Vice Chair
William B. Carr, Jr.
Vice Chair
Beryl A. Howell
Commissioner
Dabney L. Friedrich
Commissioner
Edward F. Reilly, Jr.
Ex Officio
Jonathan J. Wroblewski
Ex Officio
Judith W. Sheon
Staff Director
Glenn R. Schmitt
Director
Office of Research and Data
Louis Reedt
Acting Deputy Director
Office of Research and Data
January 2009

Alternative Sentencing in the
Federal Criminal Justice System
Courtney Semisch, Ph.D.
Senior Research Associate
Office of Research and Data
During the past ten years, alternatives to incarceration1
have been
imposed for between 15 and 25 percent of federal offenders. The
true extent to which courts impose these alternatives is not
apparent in this trend, however, because of the unique
composition of the federal sentencing population. Specifically, a
large proportion of non-citizen federal offenders (who often are
ineligible for alternative sentences) are imprisoned. This paper
analyzes alternative sentences for federal offenders and,
specifically, United States citizens sentenced under various types
of alternatives. This analysis describes current federal sentencing
policy governing alternative sentences and examines offenders
with alternative sentences using the United States Sentencing
Commission’s data.2
An analysis of factors associated with
alternative sentences imposed for eligible offenders provides
insight into considerations made by federal sentencing courts in
determining whether to impose alternatives.
Background
A number of correctional issues that arose during the 1980s
increased interest in alternative sanctions in the criminal justice
system at both the federal and state level. Across the United
States, increased use of probation sentences for felony offenders
was burdening under-funded and under-staffed probation
departments.3
At the same time, more than half of the states were
under court order or facing court order to reduce prison crowding.4
Criticism of indeterminate sentences also was increasing.5
In
addition, mandatory penalties were changing the composition of
the incarcerated population by substantially increasing the number
of incarcerated low-level drug offenders.6
Increasingly, criminal justice professionals have argued that
dwindling prison space should be reserved for the most serious
and dangerous offenders, necessitating a reconsideration of
alternative sanctions for first-time and nonviolent offenders. The
appeal of alternatives to incarceration has continued to increase in
the wake of reports of the ever-growing prison population. As of
2008, more than one in every 100 adults are incarcerated in the
United States.7
That large, and still growing, population cost the
states more than $49 billion in 2007.8
In addition to the monetary
Increasingly, criminal
justice professionals have
argued that dwindling
prison space should be
reserved for the most
serious and dangerous
offenders, necessitating a
reconsideration of
alternative sanctions for
first-time and nonviolent
offenders.
2
United States Sentencing Commission
costs, social costs of imprisonment include the separation of
families, isolation from the community, and transitional difficulties
when offenders re-enter the community.
In response to both the increasing monetary and social costs of
incarceration, a growing number of states have begun
implementing money-saving, public safety-oriented solutions.9
These solutions include diverting low-risk offenders from prison,
implementing alternative sanctions, and shortening prison terms.
Federal criminal courts have used these tools over the years
primarily for fraud and white collar offenders and, most importantly,
for United States citizens.
Federal Sentencing Policy
Federal statutes and the United States sentencing guidelines
provide the foundation for federal sentencing. The Sentencing
Reform Act of 1984 (the “Act”)10
requires that the federal
sentencing guidelines “reflect the general appropriateness of
imposing a sentence other than imprisonment in cases in which
the defendant is a first offender who has not been convicted of a
crime of violence or an otherwise serious offense….” [Emphasis
added]11
The Act established probation as an actual sentencing
option, rather than an instrument used in suspending prison
sentences.12
Four years later, the Anti-Drug Abuse Amendment
Act of 198813
authorized the use of home detention and electronic
monitoring for offenders sentenced to probation and supervised
release.14
The Commission incorporated these policies into the
guidelines with other probation and intermediate confinement
options for less serious and first-time offenders.
Federal statutes and the sentencing guidelines both limit offender
eligibility for probation sentences.15
Defendants found guilty of a
federal offense are eligible for a term of probation unless (1) the
individual is convicted of a Class A or Class B felony,16
(2) probation has been expressly precluded for the offense, or (3)
the defendant is sentenced at the same time to a sentence of
imprisonment for any offense.
The Sentencing Reform Act of 1984 further excludes probation for
some offenders. Specifically, the Act directs that the guidelines
provide for substantial imprisonment terms for defendants with two
or more prior felonies, offenses that constitute a pattern of criminal
conduct, offenders who manage or supervise racketeering
conspiracies, offenders who commit a crime of violence while
under supervision, and drug offenses involving substantial
quantities.17
The conditions of probation, both mandatory18
and
discretionary,19
also are stipulated by federal statute and the
sentencing guidelines. Confinement conditions are among
discretionary special conditions of probation provided for by the
guidelines.20
These conditions include community confinement
(residence in a community treatment center, halfway house, or
similar facility), home detention, and intermittent confinement
(custody for specified intervals of time).
Determining a Guideline Sentence
The guidelines’ sentencing table (see Guidelines Manual, Chapter
Five, Part A) provides sentencing ranges based on an offender’s
The Sentencing Reform Act
of 1984 requires that the
federal sentencing
guidelines “reflect the
general appropriateness of
imposing a sentence other
than imprisonment in cases
in which the defendant is a
first offender who has not
been convicted of a crime
of violence or an otherwise
serious offense….”

3
Alternative Sentencing in the Federal Criminal Justice System
offense level and Criminal History Category.21
The sentencing
table is subdivided into four zones (A, B, C, and D) that determine
confinement options for each sentencing range.22
Sentencing
ranges in Zone A are from zero to six months of confinement. At
the sentencing court’s discretion, the zero-to-six month range may
consist of probation only (zero months of confinement), probation
with confinement, prison with community confinement, or
imprisonment.
Zone B sentences include confinement terms ranging from one to
12 months. Zone B allows probation terms to be substituted for
imprisonment, provided that the probation term includes
confinement conditions (community confinement, intermittent
confinement, or home detention).23
For Zone B offenders
sentenced to prison, however, a minimum of one month of the total
term imposed must be imprisonment. The remainder of the
sentence also may be imprisonment, or a substitution of probation
that includes community confinement. Any Zone B term of
probation without a term of confinement necessarily constitutes a
departure from the sentencing guidelines or a non-guideline
sentence.24
Zone C of the sentencing table provides ranges of a minimum of
eight to a maximum of 16 months. The guidelines require that
Zone C sentences include a term of imprisonment equivalent to at
least half of the minimum of the range. The remaining half of the
term requires supervised release with conditions of community
confinement.25
Alternatively, the court has the option of imposing a
full prison term for Zone C offenders. Any sentence with no term
of confinement for offenders in Zone C necessarily constitutes a
departure from the sentencing guidelines or a non-guideline
sentence.
Finally, sentences in Zone D of the sentencing table require a term
of imprisonment ranging from one year to life. Any sentence of
probation or community confinement for Zone D offenders
necessarily constitutes a departure from the sentencing guidelines
or a non-guideline sentence.
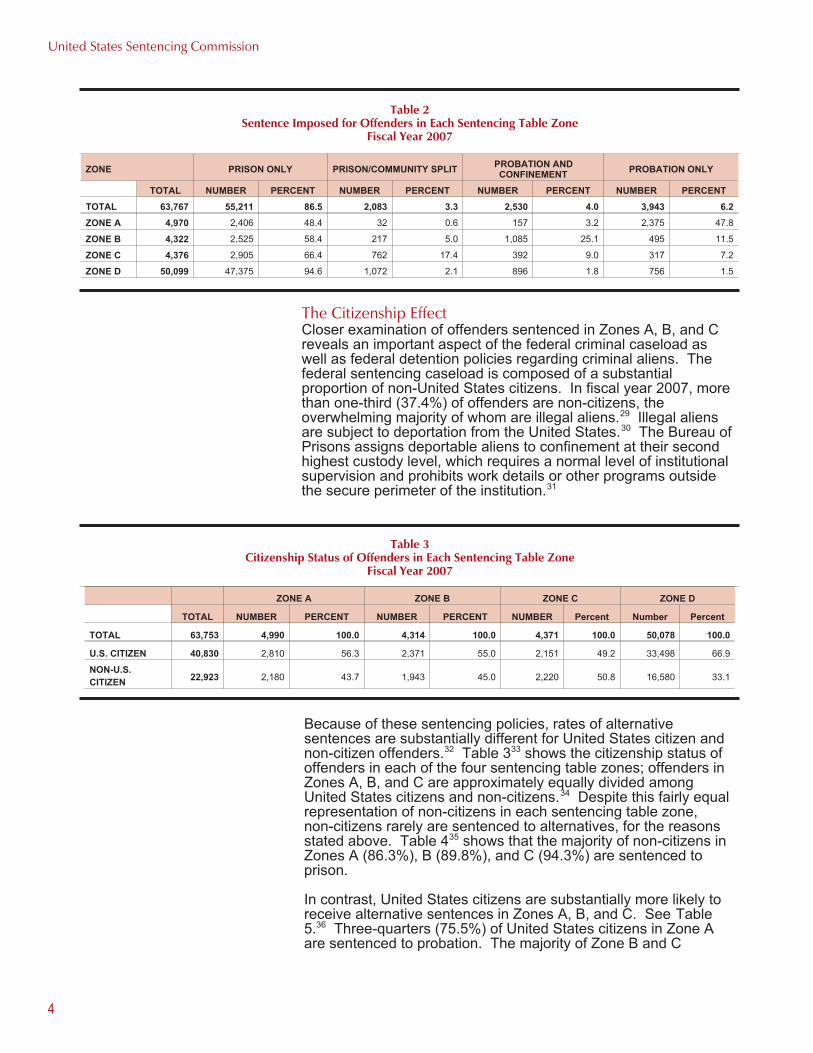
Table 126
shows the number of offenders sentenced in each of the
four sentencing table zones in fiscal year 2007.27
Only a small
proportion of federal offenders are sentenced in Zones A (7.9%)
and B (6.8%) and are eligible for non-prison sentences. Similarly,
a small proportion of offenders (6.8%) are in Zone C of the
sentencing table and eligible for a prison term followed by
community confinement. Most federal offenders (78.5%) are
sentenced in Zone D and are required to serve prison terms.
Despite the availability of alternative sentencing options for nearly
one-fourth of federal offenders, federal courts most often impose
prison for offenders in each of the sentencing table zones. As
shown in Table 2,28
nearly half (48.4%) of Zone A offenders are
sentenced to prison only, and more than one-half of both Zone B
(58.4%) and Zone C (66.4%) offenders are sentenced to prison
only. As would be expected, the overwhelming majority of Zone D
offenders (94.6%) are sentenced to prison.
ZONE NUMBER PERCENT
TOTAL 63,906 100.0
ZONE A 5,054 7.9
ZONE B 4,333 6.8
ZONE C 4,384 6.8
ZONE D 50,135 78.5
Table 1
Offenders in Each
Sentencing Table Zone
Fiscal Year 2007
Despite the availability of
alternative sentencing
options for nearly
one-fourth of federal
offenders, federal courts
most often impose prison
for offenders in each of the
sentencing table zones.
4
United States Sentencing Commission
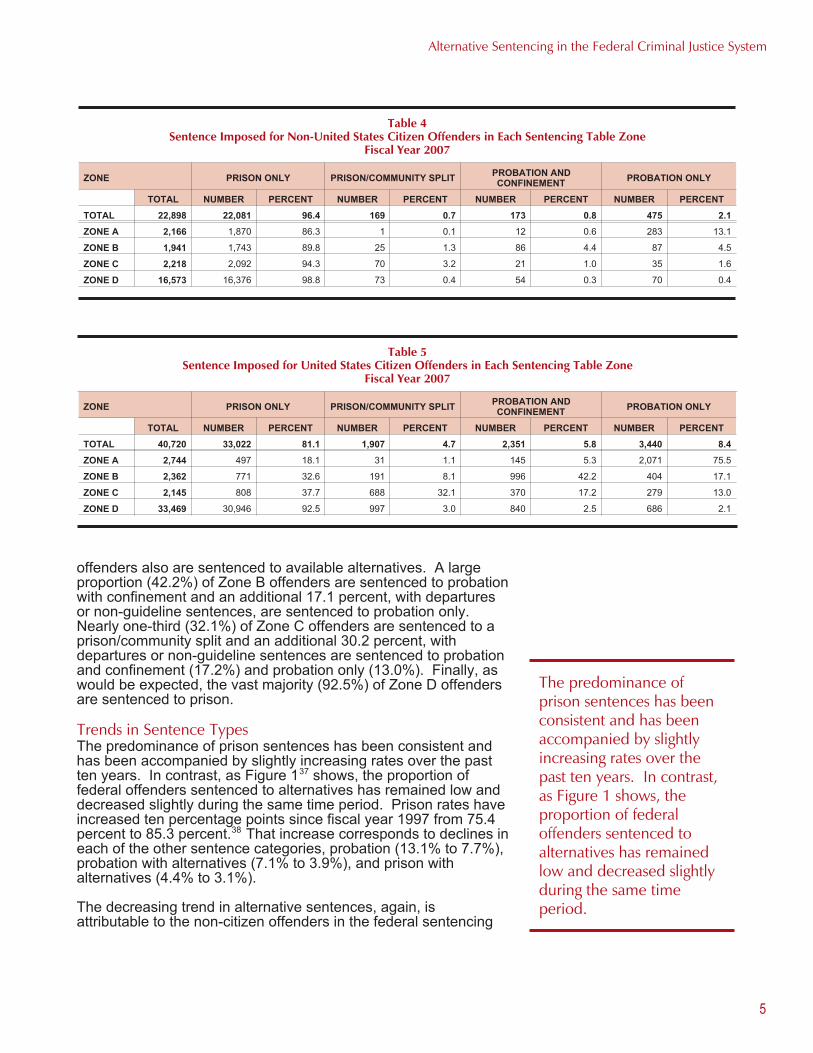
The Citizenship Effect
Closer examination of offenders sentenced in Zones A, B, and C
reveals an important aspect of the federal criminal caseload as
well as federal detention policies regarding criminal aliens. The
federal sentencing caseload is composed of a substantial
proportion of non-United States citizens. In fiscal year 2007, more
than one-third (37.4%) of offenders are non-citizens, the
overwhelming majority of whom are illegal aliens.29
Illegal aliens
are subject to deportation from the United States.30
The Bureau of
Prisons assigns deportable aliens to confinement at their second
highest custody level, which requires a normal level of institutional
supervision and prohibits work details or other programs outside
the secure perimeter of the institution.31
ZONE A ZONE B ZONE C ZONE D
TOTAL NUMBER PERCENT NUMBER PERCENT NUMBER Percent Number Percent
TOTAL 63,753 4,990 100.0 4,314 100.0 4,371 100.0 50,078 100.0
U.S. CITIZEN 40,830 2,810 56.3 2,371 55.0 2,151 49.2 33,498 66.9
NON-U.S.
CITIZEN22,923 2,180 43.7 1,943 45.0 2,220 50.8 16,580 33.1
Table 3
Citizenship Status of Offenders in Each Sentencing Table Zone
Fiscal Year 2007
Because of these sentencing policies, rates of alternative
sentences are substantially different for United States citizen and
non-citizen offenders.32
Table 333
shows the citizenship status of
offenders in each of the four sentencing table zones; offenders in
Zones A, B, and C are approximately equally divided among
United States citizens and non-citizens.34
Despite this fairly equal
representation of non-citizens in each sentencing table zone,
non-citizens rarely are sentenced to alternatives, for the reasons
stated above. Table 435
shows that the majority of non-citizens in
Zones A (86.3%), B (89.8%), and C (94.3%) are sentenced to
prison.
In contrast, United States citizens are substantially more likely to
receive alternative sentences in Zones A, B, and C. See Table
5.36
Three-quarters (75.5%) of United States citizens in Zone A
are sentenced to probation. The majority of Zone B and C
ZONE PRISON ONLY PRISON/COMMUNITY SPLITPROBATION AND
CONFINEMENTPROBATION ONLY
TOTAL NUMBER PERCENT NUMBER PERCENT NUMBER PERCENT NUMBER PERCENT
TOTAL 63,767 55,211 86.5 2,083 3.3 2,530 4.0 3,943 6.2
ZONE A 4,970 2,406 48.4 32 0.6 157 3.2 2,375 47.8
ZONE B 4,322 2,525 58.4 217 5.0 1,085 25.1 495 11.5
ZONE C 4,376 2,905 66.4 762 17.4 392 9.0 317 7.2
ZONE D 50,099 47,375 94.6 1,072 2.1 896 1.8 756 1.5
Table 2
Sentence Imposed for Offenders in Each Sentencing Table Zone
Fiscal Year 2007
5
Alternative Sentencing in the Federal Criminal Justice System
offenders also are sentenced to available alternatives. A large
proportion (42.2%) of Zone B offenders are sentenced to probation
with confinement and an additional 17.1 percent, with departures
or non-guideline sentences, are sentenced to probation only.
Nearly one-third (32.1%) of Zone C offenders are sentenced to a
prison/community split and an additional 30.2 percent, with
departures or non-guideline sentences are sentenced to probation
and confinement (17.2%) and probation only (13.0%). Finally, as
would be expected, the vast majority (92.5%) of Zone D offenders
are sentenced to prison.
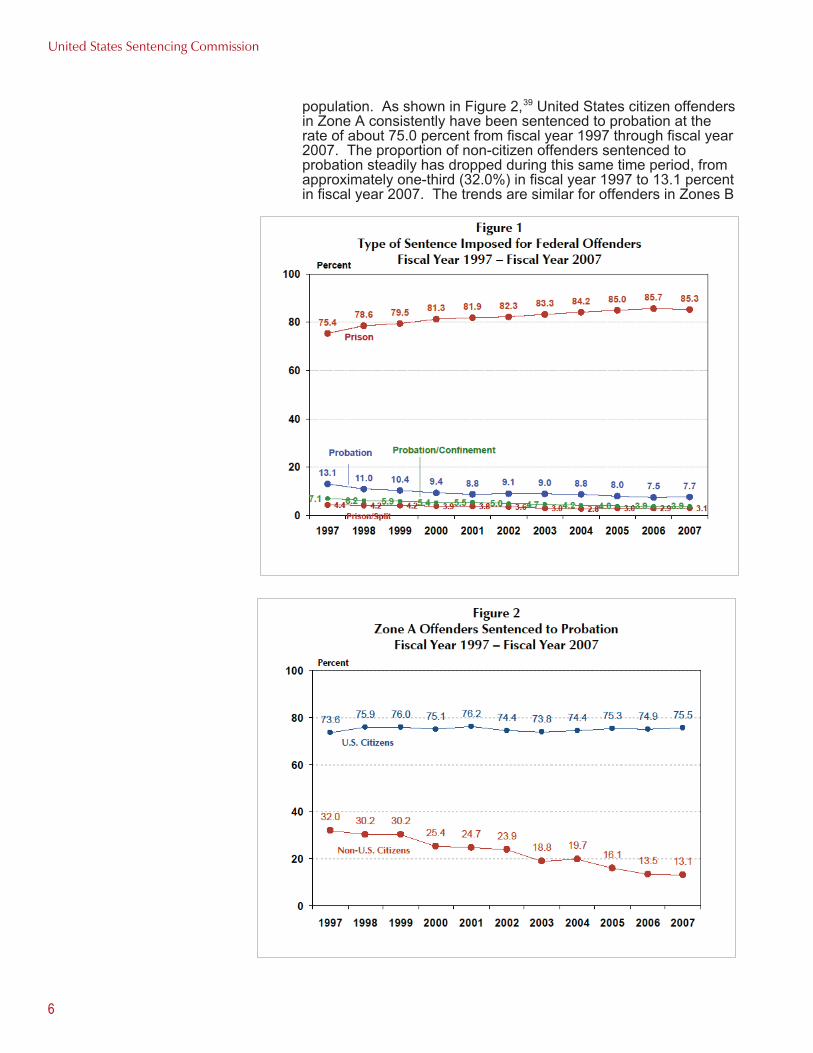
Trends in Sentence Types
The predominance of prison sentences has been consistent and
has been accompanied by slightly increasing rates over the past
ten years. In contrast, as Figure 137
shows, the proportion of
federal offenders sentenced to alternatives has remained low and
decreased slightly during the same time period. Prison rates have
increased ten percentage points since fiscal year 1997 from 75.4
percent to 85.3 percent.38
That increase corresponds to declines in
each of the other sentence categories, probation (13.1% to 7.7%),
probation with alternatives (7.1% to 3.9%), and prison with
alternatives (4.4% to 3.1%).
The decreasing trend in alternative sentences, again, is
attributable to the non-citizen offenders in the federal sentencing
ZONE PRISON ONLY PRISON/COMMUNITY SPLITPROBATION AND
CONFINEMENTPROBATION ONLY
TOTAL NUMBER PERCENT NUMBER PERCENT NUMBER PERCENT NUMBER PERCENT
TOTAL 22,898 22,081 96.4 169 0.7 173 0.8 475 2.1
ZONE A 2,166 1,870 86.3 1 0.1 12 0.6 283 13.1
ZONE B 1,941 1,743 89.8 25 1.3 86 4.4 87 4.5
ZONE C 2,218 2,092 94.3 70 3.2 21 1.0 35 1.6
ZONE D 16,573 16,376 98.8 73 0.4 54 0.3 70 0.4
Table 4
Sentence Imposed for Non-United States Citizen Offenders in Each Sentencing Table Zone
Fiscal Year 2007
ZONE PRISON ONLY PRISON/COMMUNITY SPLITPROBATION AND
CONFINEMENTPROBATION ONLY
TOTAL NUMBER PERCENT NUMBER PERCENT NUMBER PERCENT NUMBER PERCENT
TOTAL 40,720 33,022 81.1 1,907 4.7 2,351 5.8 3,440 8.4
ZONE A 2,744 497 18.1 31 1.1 145 5.3 2,071 75.5
ZONE B 2,362 771 32.6 191 8.1 996 42.2 404 17.1
ZONE C 2,145 808 37.7 688 32.1 370 17.2 279 13.0
ZONE D 33,469 30,946 92.5 997 3.0 840 2.5 686 2.1
Table 5
Sentence Imposed for United States Citizen Offenders in Each Sentencing Table Zone
Fiscal Year 2007
The predominance of
prison sentences has been
consistent and has been
accompanied by slightly
increasing rates over the
past ten years. In contrast,
as Figure 1 shows, the
proportion of federal
offenders sentenced to
alternatives has remained
low and decreased slightly
during the same time
period.
6
United States Sentencing Commission
population. As shown in Figure 2,39
United States citizen offenders
in Zone A consistently have been sentenced to probation at the
rate of about 75.0 percent from fiscal year 1997 through fiscal year
2007. The proportion of non-citizen offenders sentenced to
probation steadily has dropped during this same time period, from
approximately one-third (32.0%) in fiscal year 1997 to 13.1 percent
in fiscal year 2007. The trends are similar for offenders in Zones B

7
Alternative Sentencing in the Federal Criminal Justice System
and C of the sentencing table. Figure 340
shows that the rates of
probation with confinement options for United States citizens in
Zone B have remained somewhat constant, between 40 and 50
percent, and decreased slightly in recent years. Non-citizens in
Zone B, on the other hand, consistently have lower rates of
probation with confinement, and that rate notably has dropped
from 18.0 percent to 4.4 percent.
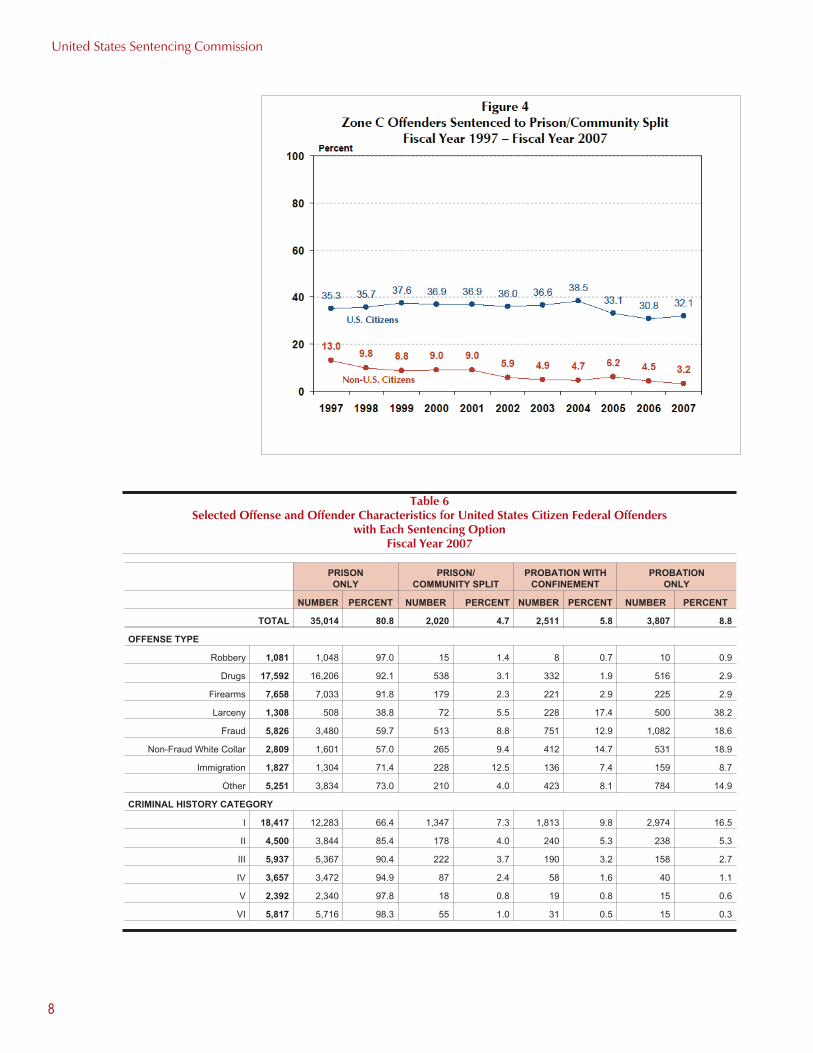
Figure 441
demonstrates the same trend, but with a narrower gap
between United States citizens and non-citizens in Zone C
sentenced to prison/community split. Between fiscal year 1997
and fiscal year 2007, consistently approximately one-third of
United States citizens have been sentenced to prison/community
split sentences. In contrast, the proportion of non-citizens in Zone
C with prison/community split sentences dropped from 13.0
percent in fiscal year 1997 to 3.2 percent in fiscal year 2007.42
Sentencing of United States Citizens
United States citizens are the focus of the remaining analyses
because they comprise the majority of federal offenders sentenced
to alternatives. The following sections examine and compare
United States citizen federal offenders sentenced to prison,
prison/community split, probation with confinement, and probation.
Offense Types
Offenders committing certain types of offenses more frequently
receive alternative sentences. Table 643
shows that larceny
offenders have the greatest likelihood of receiving alternative
sentences with nearly two-thirds (61.2%) sentenced to
prison/community split, probation with confinement, or probation.
Offenders convicted of fraud and other white collar offenses,44
while still primarily sentenced to prison, also more often are
Offenders committing
certain types of offenses
more frequently receive
alternative sentences.
8
United States Sentencing Commission
PRISON
ONLY
PRISON/
COMMUNITY SPLIT
PROBATION WITH
CONFINEMENT
PROBATION
ONLY
NUMBER PERCENT NUMBER PERCENT NUMBER PERCENT NUMBER PERCENT
TOTAL 35,014 80.8 2,020 4.7 2,511 5.8 3,807 8.8
OFFENSE TYPE
Robbery 1,081 1,048 97.0 15 1.4 8 0.7 10 0.9
Drugs 17,592 16,206 92.1 538 3.1 332 1.9 516 2.9
Firearms 7,658 7,033 91.8 179 2.3 221 2.9 225 2.9
Larceny 1,308 508 38.8 72 5.5 228 17.4 500 38.2
Fraud 5,826 3,480 59.7 513 8.8 751 12.9 1,082 18.6
Non-Fraud White Collar 2,809 1,601 57.0 265 9.4 412 14.7 531 18.9
Immigration 1,827 1,304 71.4 228 12.5 136 7.4 159 8.7
Other 5,251 3,834 73.0 210 4.0 423 8.1 784 14.9
CRIMINAL HISTORY CATEGORY
I 18,417 12,283 66.4 1,347 7.3 1,813 9.8 2,974 16.5
II 4,500 3,844 85.4 178 4.0 240 5.3 238 5.3
III 5,937 5,367 90.4 222 3.7 190 3.2 158 2.7
IV 3,657 3,472 94.9 87 2.4 58 1.6 40 1.1
V 2,392 2,340 97.8 18 0.8 19 0.8 15 0.6
VI 5,817 5,716 98.3 55 1.0 31 0.5 15 0.3
Table 6
Selected Offense and Offender Characteristics for United States Citizen Federal Offenders
with Each Sentencing Option
Fiscal Year 2007
9
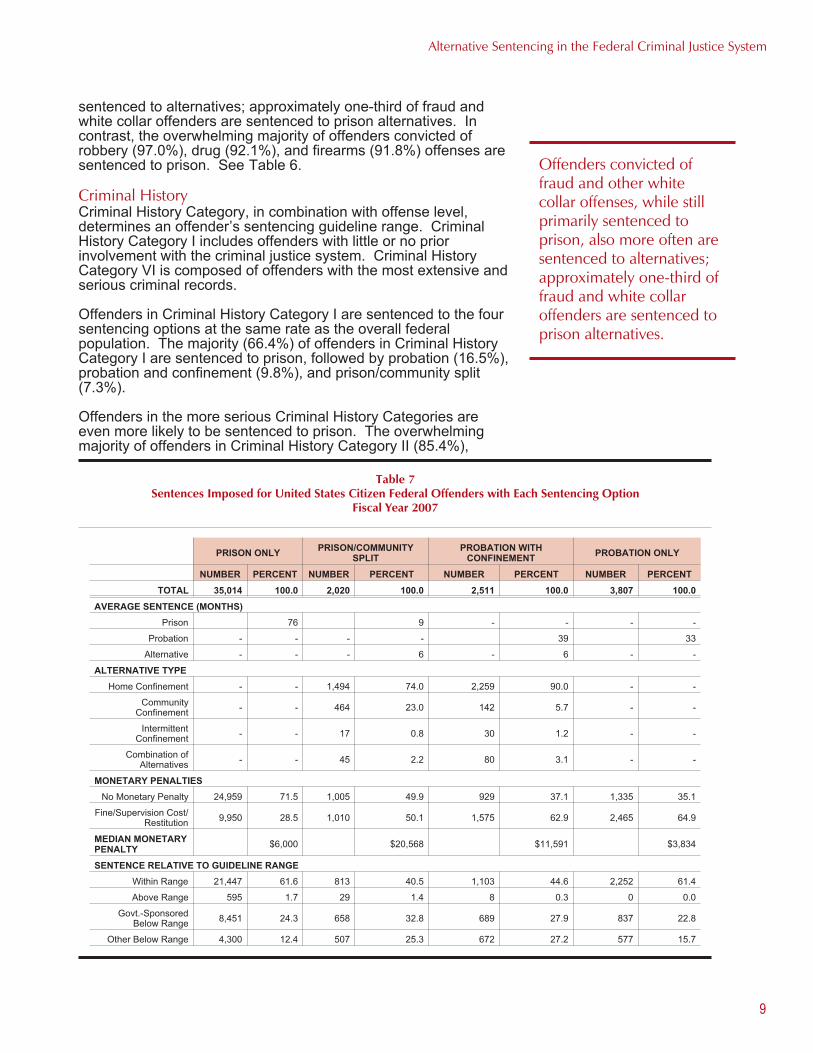
Alternative Sentencing in the Federal Criminal Justice System
sentenced to alternatives; approximately one-third of fraud and
white collar offenders are sentenced to prison alternatives. In
contrast, the overwhelming majority of offenders convicted of
robbery (97.0%), drug (92.1%), and firearms (91.8%) offenses are
sentenced to prison. See Table 6.
Criminal History
Criminal History Category, in combination with offense level,
determines an offender’s sentencing guideline range. Criminal
History Category I includes offenders with little or no prior
involvement with the criminal justice system. Criminal History
Category VI is composed of offenders with the most extensive and
serious criminal records.
Offenders in Criminal History Category I are sentenced to the four
sentencing options at the same rate as the overall federal
population. The majority (66.4%) of offenders in Criminal History
Category I are sentenced to prison, followed by probation (16.5%),
probation and confinement (9.8%), and prison/community split
(7.3%).
Offenders in the more serious Criminal History Categories are
even more likely to be sentenced to prison. The overwhelming
majority of offenders in Criminal History Category II (85.4%),
PRISON ONLYPRISON/COMMUNITY
SPLIT
PROBATION WITH
CONFINEMENTPROBATION ONLY
NUMBER PERCENT NUMBER PERCENT NUMBER PERCENT NUMBER PERCENT
TOTAL 35,014 100.0 2,020 100.0 2,511 100.0 3,807 100.0
AVERAGE SENTENCE (MONTHS)
Prison 76 9 - - - -
Probation - - - - 39 33
Alternative - - - 6 - 6 - -
ALTERNATIVE TYPE
Home Confinement - - 1,494 74.0 2,259 90.0 - -
Community
Confinement- - 464 23.0 142 5.7 - -
Intermittent
Confinement- - 17 0.8 30 1.2 - -
Combination of
Alternatives- - 45 2.2 80 3.1 - -
MONETARY PENALTIES
No Monetary Penalty 24,959 71.5 1,005 49.9 929 37.1 1,335 35.1
Fine/Supervision Cost/
Restitution9,950 28.5 1,010 50.1 1,575 62.9 2,465 64.9
MEDIAN MONETARY
PENALTY$6,000 $20,568 $11,591 $3,834
SENTENCE RELATIVE TO GUIDELINE RANGE
Within Range 21,447 61.6 813 40.5 1,103 44.6 2,252 61.4
Above Range 595 1.7 29 1.4 8 0.3 0 0.0
Govt.-Sponsored
Below Range8,451 24.3 658 32.8 689 27.9 837 22.8
Other Below Range 4,300 12.4 507 25.3 672 27.2 577 15.7
Table 7
Sentences Imposed for United States Citizen Federal Offenders with Each Sentencing Option
Fiscal Year 2007
Offenders convicted of
fraud and other white
collar offenses, while still
primarily sentenced to
prison, also more often are
sentenced to alternatives;
approximately one-third of
fraud and white collar
offenders are sentenced to
prison alternatives.

10
United States Sentencing Commission
III (90.4%), IV (94.9%), V (97.8%), and VI (98.3%) are sentenced to
prison.
Sentences Imposed
Prison sentences account for 81.1 percent of sentences imposed
for United States citizens in fiscal year 2007. See Table 5. The
remaining sentences are probation (8.4%), probation with
confinement (5.8%), and prison split with community confinement
(4.7%). For United States citizens, the average prison sentence is
76 months. The average prison sentence for offenders sentenced
to prison/community split is nine months. See Table 7.45
Average
sentence lengths for the two categories of offenders sentenced to
probation are about three years; the average term for offenders
sentenced to probation only is 33 months, and the average for
offenders sentenced to probation with confinement is 39 months.
Home confinement is the most commonly imposed alternative
sentence. Three-quarters (74.0%) of offenders sentenced to
prison/community split are sentenced to home confinement. A
substantial proportion (23.0%) also are sentenced to community
confinement (i.e., residence in a community treatment center,
halfway house, or similar facility). Prison/community split
sentences average nine months of prison and six months of
alternative confinement. Nearly all (90.0%) offenders sentenced to
probation with confinement received home confinement. Probation
and confinement sentences average six months confinement and
39 months of overall probation.
Overall, monetary penalties (fine, cost of supervision, and/or
restitution) are imposed for approximately one-third (34.7%) of
United States citizen offenders in fiscal year 2007 and are more
commonly imposed for offenders sentenced to alternatives.
Two-thirds of offenders sentenced to probation (64.9%) and
offenders sentenced to probation with confinement (62.9%) also
have monetary penalties imposed.46
Half (50.1%) of offenders
sentenced to prison/community split are ordered to pay monetary
penalties. In contrast, fewer than one-third (28.5%) of offenders
sentenced to prison also are ordered to pay monetary penalties.
The median47
monetary penalties (for those offenders ordered to
pay them) range from $3,834 for offenders sentenced to probation,
to $20,568 for offenders sentenced to prison/community split.
Sentences Relative to the Guideline Range
More than half (59.7%) of sentences imposed on United States
citizens in fiscal year 2007 are within the guideline range. These
rates reflect the within-range rates for United States citizen
offenders sentenced to prison (61.6%) and probation (61.4%).
Offenders sentenced to community confinement, however, have
substantially lower rates of within-range sentences. Fewer than
half of offenders sentenced to prison/community split (40.5%) and
probation with confinement (44.6%) are sentenced within the
guideline range. The higher rates of downward departures and
non-guideline sentences primarily are responsible for the
difference. Rates of non-government sponsored downward
departures and non-guideline sentences are greater for offenders
sentenced to prison/community split (25.3%) and probation and
confinement (27.2%) compared to those sentenced to probation
(15.7%) and prison (12.4%).
Prison sentences account
for 81.1 percent of
sentences imposed for
United States citizens in
fiscal year 2007. The
remaining sentences are
probation (8.4%), probation
with confinement (5.8%),
and prison split with
community confinement
(4.7%).
More than half (59.7%) of
sentences imposed on
United States citizens in
fiscal year 2007 are within
the guideline range.

11
Alternative Sentencing in the Federal Criminal Justice System
Despite the different rates of downward departures and
non-guideline sentences among United States citizen offenders
sentenced to each of the four options, the reasons cited by the
courts for the below-range sentences are the same, and most
often cite the factors established by Congress in the Sentencing
Reform Act of 1984 as those to be considered in imposing a
sentence.48
The three most commonly cited reasons for
non-government sponsored below-range sentences for each of
the four groups are— nature and circumstances of the offense
and the history and characteristics of the defendant; to reflect the
seriousness of the offense/to promote respect for the law/to
provide just punishment for the offense; and to afford adequate
deterrence to criminal conduct.
Additional sentencing factors identified by Congress round out the
most frequently cited reasons courts give for imposing
below-range sentences: to protect the public from further crimes
of the defendant; to avoid unwarranted sentence disparities
among defendants with similar records who have been found
guilty of similar conduct; to provide the defendant with needed
educational or vocational training, medical care, or other
correctional treatment in the most effective manner; and to provide
restitution to any victims of the offense.
Offender Characteristics
The demographic characteristics of individual offenders are
excluded for consideration at sentencing; but there is some
variation in the imposition of alternative sentences for some
groups.49
Nearly equal proportions of White (38.7%) and Black
(37.6%) United States citizen offenders are sentenced to prison.
White offenders comprise approximately half of those sentenced
to each of the alternative categories (ranging from 48.6% to
54.5%) while the proportion of Black offenders is approximately
one-fourth (ranging from 24.3% to 28.3%). Among United States
citizens, those with Hispanic backgrounds account for a smaller
proportion (19.3%) of offenders sentenced to prison, as well as
PRISON ONLYPRISON/COMMUNITY
SPLIT
PROBATION WITH
CONFINEMENTPROBATION ONLY
NUMBER PERCENT NUMBER PERCENT NUMBER PERCENT NUMBER PERCENT
TOTAL 35,014 100.0 2,020 100.0 2,511 100.0 3,807 100.0
RACE
White 13,520 38.7 982 48.6 1,290 51.5 2,047 54.5
Black 13,161 37.6 491 24.3 709 28.3 997 26.6
Hispanic 6,745 19.3 441 21.8 347 13.9 457 12.2
Other 1,551 4.4 105 5.2 158 6.3 253 6.7
GENDER
Male 30,684 87.6 1,397 69.2 1,642 65.4 2,361 62.1
Female 4,328 12.4 623 30.8 869 34.6 1,440 37.9
AVERAGE AGE
35 37 40 39
Table 8
United States Citizen Federal Offenders with Each Sentencing Option
Fiscal Year 2007
Nearly equal proportions of
White (38.7%) and Black
(37.6%) United States
citizen offenders are
sentenced to prison.
12
United States Sentencing Commission
those sentenced to each of the alternative categories (ranging from
12.2% to 21.8%). See Table 8.50
While male offenders make up the vast majority (87.6%) of
imprisoned offenders, men account for only two-thirds of offenders
sentenced to any of the three alternatives to prison (ranging from
62.1% of probation only to 69.2% of prison/community split).
Offenders sentenced to prison also are younger than offenders
sentenced to one of the three alternatives. The average age of
federal offenders sentenced to prison is 35 years, compared to 37
years for prison/community split, 40 years for probation with
confinement, and 39 years for probation.
Which Eligible Offenders are Sentenced to Alternatives?
Sentencing courts generally do not provide specific, written
reasons for imposing sentences within the guideline range.51
Because of this, the question of why courts impose alternative
sentences for some eligible offenders but not others cannot
definitively be answered. However, it is possible to identify which
eligible offenders receive alternatives, thereby suggesting factors
considered by sentencing courts when deciding whether to impose
alternatives to incarceration. This analysis identifies a number of
factors associated with offenders receiving alternatives,
distinguishing offenders who receive alternative sentences from
those who do not.
The analysis that follows demonstrates that sentencing zone
ultimately determines whether offenders are sentenced to
alternatives. Specifically, guideline offense level and Criminal
History Category, alone or in combination, are the principal factors
determining whether an offender receives an alternative sentence.
Some additional guideline and demographic characteristics also
are associated with offenders’ receipt of an alternative sentence;
however, these factors also are associated with one or both of the
zone determinants.
In fiscal year 2007, 5,378 United States citizens were sentenced
within the sentencing guideline range and were located in Zones A,
B, or C. Limiting analysis to within-range sentences allows a clear
comparison of offenders who are sentenced according to their
guideline calculation and eligible for an alternative sentence,
independent of a government motion or other departure or
variance. Because statutory mandatory minimum sentences
confound an offender’s eligibility for alternatives, offenders subject
to statutory mandatory minimums also were excluded for this
analysis.52
The following analysis compares offenders sentenced
to the non-incarceration (or reduced incarceration) alternatives
available in their respective zones to offenders with sentences of
confinement in excess of available alternatives.53
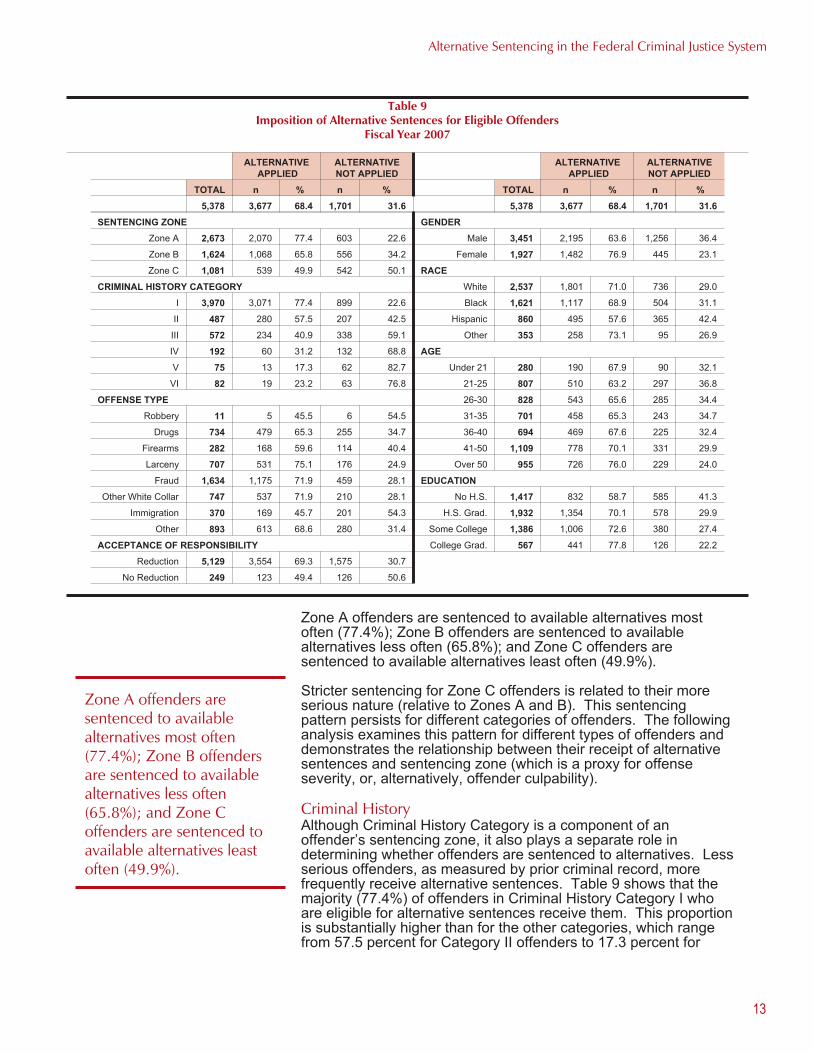
The Association of Sentencing Zone and Alternative Sentences54
As explained previously, guideline offense level and Criminal
History Category combine to determine an offender’s final
sentencing range and the zone on the sentencing table in which
that range is located. These factors also determine whether
eligible offenders receive alternative sentences. Table 955
shows
that offenders sentenced in the lower zones receive alternative
sentences more often than those in the higher sentencing zones.
The average age of federal
offenders sentenced to
prison is 35 years,
compared to 37 years for
prison/community split, 40
years for probation with
confinement, and 39 years
for probation.
Specifically, guideline
offense level and Criminal
History Category, alone or
in combination, are the
principal factors
determining whether an
offender receives an
alternative sentence.
Alternative Sentencing in the Federal Criminal Justice System
13
ALTERNATIVE
APPLIED
ALTERNATIVE
NOT APPLIED
ALTERNATIVE
APPLIED
ALTERNATIVE
NOT APPLIED
TOTAL n % n % TOTAL n % n %
5,378 3,677 68.4 1,701 31.6 5,378 3,677 68.4 1,701 31.6
SENTENCING ZONE GENDER
Zone A 2,673 2,070 77.4 603 22.6 Male 3,451 2,195 63.6 1,256 36.4
Zone B 1,624 1,068 65.8 556 34.2 Female 1,927 1,482 76.9 445 23.1
Zone C 1,081 539 49.9 542 50.1 RACE
CRIMINAL HISTORY CATEGORY White 2,537 1,801 71.0 736 29.0
I 3,970 3,071 77.4 899 22.6 Black 1,621 1,117 68.9 504 31.1
II 487 280 57.5 207 42.5 Hispanic 860 495 57.6 365 42.4
III 572 234 40.9 338 59.1 Other 353 258 73.1 95 26.9
IV 192 60 31.2 132 68.8 AGE
V 75 13 17.3 62 82.7 Under 21 280 190 67.9 90 32.1
VI 82 19 23.2 63 76.8 21-25 807 510 63.2 297 36.8
OFFENSE TYPE 26-30 828 543 65.6 285 34.4
Robbery 11 5 45.5 6 54.5 31-35 701 458 65.3 243 34.7
Drugs 734 479 65.3 255 34.7 36-40 694 469 67.6 225 32.4
Firearms 282 168 59.6 114 40.4 41-50 1,109 778 70.1 331 29.9
Larceny 707 531 75.1 176 24.9 Over 50 955 726 76.0 229 24.0
Fraud 1,634 1,175 71.9 459 28.1 EDUCATION
Other White Collar 747 537 71.9 210 28.1 No H.S. 1,417 832 58.7 585 41.3
Immigration 370 169 45.7 201 54.3 H.S. Grad. 1,932 1,354 70.1 578 29.9
Other 893 613 68.6 280 31.4 Some College 1,386 1,006 72.6 380 27.4
ACCEPTANCE OF RESPONSIBILITY College Grad. 567 441 77.8 126 22.2
Reduction 5,129 3,554 69.3 1,575 30.7
No Reduction 249 123 49.4 126 50.6
Table 9
Imposition of Alternative Sentences for Eligible Offenders
Fiscal Year 2007
Zone A offenders are sentenced to available alternatives most
often (77.4%); Zone B offenders are sentenced to available
alternatives less often (65.8%); and Zone C offenders are
sentenced to available alternatives least often (49.9%).
Stricter sentencing for Zone C offenders is related to their more
serious nature (relative to Zones A and B). This sentencing
pattern persists for different categories of offenders. The following
analysis examines this pattern for different types of offenders and
demonstrates the relationship between their receipt of alternative
sentences and sentencing zone (which is a proxy for offense
severity, or, alternatively, offender culpability).
Criminal History
Although Criminal History Category is a component of an
offender’s sentencing zone, it also plays a separate role in
determining whether offenders are sentenced to alternatives. Less
serious offenders, as measured by prior criminal record, more
frequently receive alternative sentences. Table 9 shows that the
majority (77.4%) of offenders in Criminal History Category I who
are eligible for alternative sentences receive them. This proportion
is substantially higher than for the other categories, which range
from 57.5 percent for Category II offenders to 17.3 percent for
Zone A offenders are
sentenced to available
alternatives most often
(77.4%); Zone B offenders
are sentenced to available
alternatives less often
(65.8%); and Zone C
offenders are sentenced to
available alternatives least
often (49.9%).
14
United States Sentencing Commission
Category V offenders. The tendency of sentencing courts to
impose alternatives sparingly for offenders with more extensive
criminal records is consistent with the guidelines’ statement at
USSG §5C1.1 Application Note 7 which states: “The use of
substitutes for imprisonment as provided in subsections (c) and (d)
is not recommended for most defendants with a criminal history
category of III or above. Generally, such defendants have failed to
reform despite the use of such alternatives.”
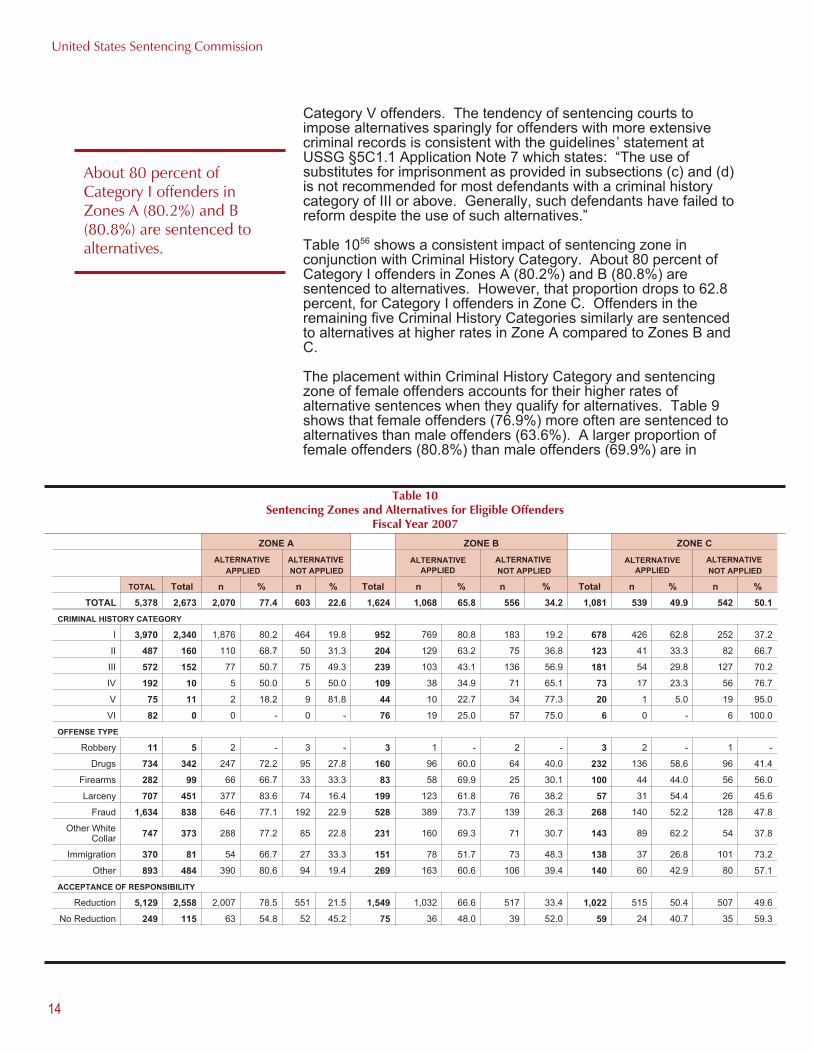
Table 1056
shows a consistent impact of sentencing zone in
conjunction with Criminal History Category. About 80 percent of
Category I offenders in Zones A (80.2%) and B (80.8%) are
sentenced to alternatives. However, that proportion drops to 62.8
percent, for Category I offenders in Zone C. Offenders in the
remaining five Criminal History Categories similarly are sentenced
to alternatives at higher rates in Zone A compared to Zones B and
C.
The placement within Criminal History Category and sentencing
zone of female offenders accounts for their higher rates of
alternative sentences when they qualify for alternatives. Table 9
shows that female offenders (76.9%) more often are sentenced to
alternatives than male offenders (63.6%). A larger proportion of
female offenders (80.8%) than male offenders (69.9%) are in
ZONE A ZONE B ZONE C
ALTERNATIVE
APPLIED
ALTERNATIVE
NOT APPLIED
ALTERNATIVE
APPLIED
ALTERNATIVE
NOT APPLIED
ALTERNATIVE
APPLIED
ALTERNATIVE
NOT APPLIED
TOTAL Total n % n % Total n % n % Total n % n %
TOTAL 5,378 2,673 2,070 77.4 603 22.6 1,624 1,068 65.8 556 34.2 1,081 539 49.9 542 50.1
CRIMINAL HISTORY CATEGORY
I 3,970 2,340 1,876 80.2 464 19.8 952 769 80.8 183 19.2 678 426 62.8 252 37.2
II 487 160 110 68.7 50 31.3 204 129 63.2 75 36.8 123 41 33.3 82 66.7
III 572 152 77 50.7 75 49.3 239 103 43.1 136 56.9 181 54 29.8 127 70.2
IV 192 10 5 50.0 5 50.0 109 38 34.9 71 65.1 73 17 23.3 56 76.7
V 75 11 2 18.2 9 81.8 44 10 22.7 34 77.3 20 1 5.0 19 95.0
VI 82 0 0 - 0 - 76 19 25.0 57 75.0 6 0 - 6 100.0
OFFENSE TYPE
Robbery 11 5 2 - 3 - 3 1 - 2 - 3 2 - 1 -
Drugs 734 342 247 72.2 95 27.8 160 96 60.0 64 40.0 232 136 58.6 96 41.4
Firearms 282 99 66 66.7 33 33.3 83 58 69.9 25 30.1 100 44 44.0 56 56.0
Larceny 707 451 377 83.6 74 16.4 199 123 61.8 76 38.2 57 31 54.4 26 45.6
Fraud 1,634 838 646 77.1 192 22.9 528 389 73.7 139 26.3 268 140 52.2 128 47.8
Other White
Collar747 373 288 77.2 85 22.8 231 160 69.3 71 30.7 143 89 62.2 54 37.8
Immigration 370 81 54 66.7 27 33.3 151 78 51.7 73 48.3 138 37 26.8 101 73.2
Other 893 484 390 80.6 94 19.4 269 163 60.6 106 39.4 140 60 42.9 80 57.1
ACCEPTANCE OF RESPONSIBILITY
Reduction 5,129 2,558 2,007 78.5 551 21.5 1,549 1,032 66.6 517 33.4 1,022 515 50.4 507 49.6
No Reduction 249 115 63 54.8 52 45.2 75 36 48.0 39 52.0 59 24 40.7 35 59.3
Table 10
Sentencing Zones and Alternatives for Eligible Offenders
Fiscal Year 2007
About 80 percent of
Category I offenders in
Zones A (80.2%) and B
(80.8%) are sentenced to
alternatives.
Alternative Sentencing in the Federal Criminal Justice System
15
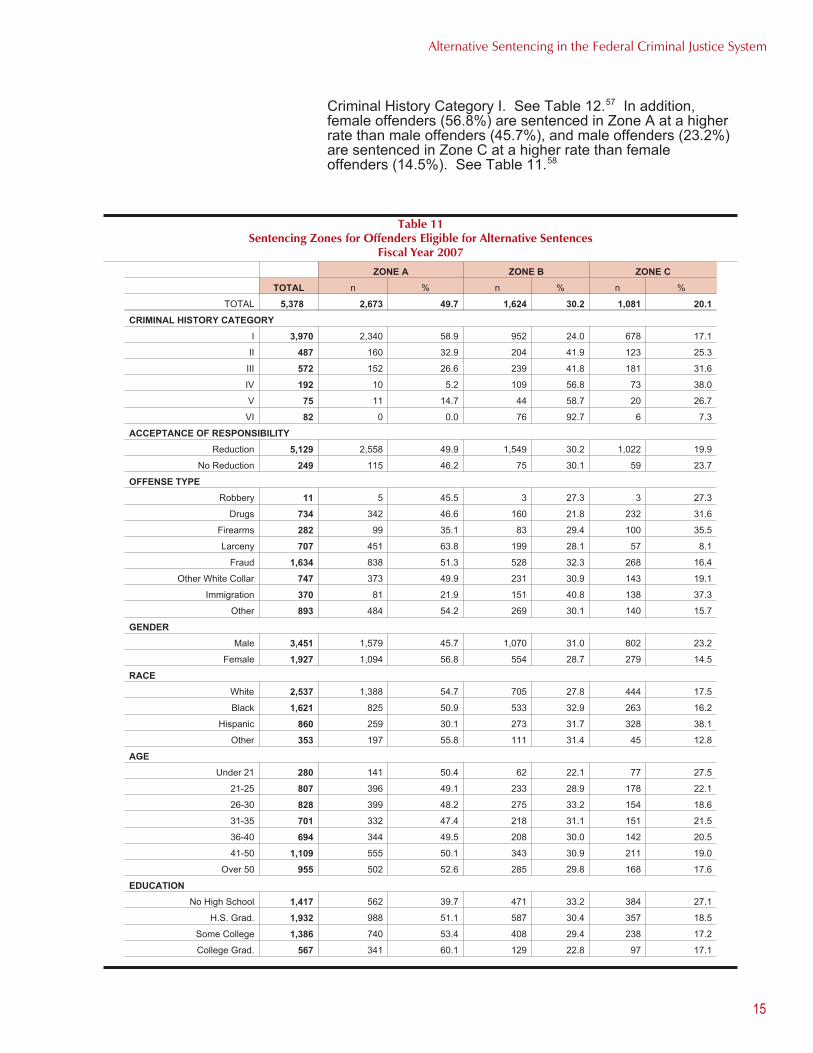
Criminal History Category I. See Table 12.57
In addition,
female offenders (56.8%) are sentenced in Zone A at a higher
rate than male offenders (45.7%), and male offenders (23.2%)
are sentenced in Zone C at a higher rate than female
offenders (14.5%). See Table 11.58
ZONE A ZONE B ZONE C
TOTAL n % n % n %
TOTAL 5,378 2,673 49.7 1,624 30.2 1,081 20.1
CRIMINAL HISTORY CATEGORY
I 3,970 2,340 58.9 952 24.0 678 17.1
II 487 160 32.9 204 41.9 123 25.3
III 572 152 26.6 239 41.8 181 31.6
IV 192 10 5.2 109 56.8 73 38.0
V 75 11 14.7 44 58.7 20 26.7
VI 82 0 0.0 76 92.7 6 7.3
ACCEPTANCE OF RESPONSIBILITY
Reduction 5,129 2,558 49.9 1,549 30.2 1,022 19.9
No Reduction 249 115 46.2 75 30.1 59 23.7
OFFENSE TYPE
Robbery 11 5 45.5 3 27.3 3 27.3
Drugs 734 342 46.6 160 21.8 232 31.6
Firearms 282 99 35.1 83 29.4 100 35.5
Larceny 707 451 63.8 199 28.1 57 8.1
Fraud 1,634 838 51.3 528 32.3 268 16.4
Other White Collar 747 373 49.9 231 30.9 143 19.1
Immigration 370 81 21.9 151 40.8 138 37.3
Other 893 484 54.2 269 30.1 140 15.7
GENDER
Male 3,451 1,579 45.7 1,070 31.0 802 23.2
Female 1,927 1,094 56.8 554 28.7 279 14.5
RACE
White 2,537 1,388 54.7 705 27.8 444 17.5
Black 1,621 825 50.9 533 32.9 263 16.2
Hispanic 860 259 30.1 273 31.7 328 38.1
Other 353 197 55.8 111 31.4 45 12.8
AGE
Under 21 280 141 50.4 62 22.1 77 27.5
21-25 807 396 49.1 233 28.9 178 22.1
26-30 828 399 48.2 275 33.2 154 18.6
31-35 701 332 47.4 218 31.1 151 21.5
36-40 694 344 49.5 208 30.0 142 20.5
41-50 1,109 555 50.1 343 30.9 211 19.0
Over 50 955 502 52.6 285 29.8 168 17.6
EDUCATION
No High School 1,417 562 39.7 471 33.2 384 27.1
H.S. Grad. 1,932 988 51.1 587 30.4 357 18.5
Some College 1,386 740 53.4 408 29.4 238 17.2
College Grad. 567 341 60.1 129 22.8 97 17.1
Table 11
Sentencing Zones for Offenders Eligible for Alternative Sentences
Fiscal Year 2007
16
United States Sentencing Commission
The importance of Criminal History Category also is demonstrated
in the differences between the imposition of alternative sentences
for White and Black offenders. There is virtually no difference
between the proportions of eligible White (76.8%) and Black
(77.9%) Zone A offenders sentenced to alternatives. See Table
13.59
There are differences, however, comparing alternative
sentences imposed for White and Black offenders sentenced in
Zones B and C. A larger proportion of White offenders in Zone B
(69.9%) and Zone C (54.5%) are sentenced to alternatives
compared to Black offenders in Zone B (64.5%) and Zone C
(49.4%). See Table 13.
The overwhelming majority of White (87.2%) and Black (85.9%)
offenders sentenced in Zone A, in which there is a similar rate of
alternative sentences, are in Criminal History Category I.
However, in Zones B and C, where rates of alternative sentences
CATEGORY I CATEGORY II CATEGORY III CATEGORY IV CATEGORY V CATEGORY VI
TOTAL n % n % n % n % n % n %
TOTAL 5,378 3,970 73.8 487 9.1 572 10.6 192 3.6 75 1.4 82 1.5
OFFENSE TYPE
Robbery 11 7 63.6 1 9.1 2 18.2 1 9.1 0 0.0 0 0.0
Drugs 734 553 75.3 59 8.0 81 11.0 21 2.9 11 1.5 9 1.2
Firearms 282 213 75.5 25 8.9 30 10.6 6 2.1 4 1.4 4 1.4
Larceny 707 527 74.5 57 8.1 67 9.5 25 3.5 14 2.0 17 2.4
Fraud 1,634 1,234 75.5 160 9.8 137 8.4 51 3.1 25 1.5 27 1.6
Other White Collar 747 566 75.8 62 8.3 78 10.4 30 4.0 7 0.9 4 0.5
Immigration 370 231 62.4 55 14.9 70 18.9 11 3.0 2 0.5 1 0.3
Other 893 639 71.6 68 7.6 107 12.0 47 5.3 12 1.3 20 2.2
GENDER
Male 3,451 2,413 69.9 329 9.5 424 12.3 153 4.4 63 1.8 69 2.0
Female 1,927 1,557 80.8 158 8.2 148 7.7 39 2.0 12 0.6 13 0.7
RACE
White 2,537 1,947 76.7 203 8.0 242 9.5 81 3.2 31 1.2 33 1.3
Black 1,621 1,095 67.6 177 10.9 207 12.8 66 4.1 39 2.4 37 2.3
Hispanic 860 631 73.4 81 9.4 101 11.7 33 3.8 5 0.6 9 1.1
Other 353 292 82.7 25 7.1 21 6.0 12 3.4 0 0.0 3 0.8
AGE
Under 21 280 221 78.9 21 7.5 30 10.7 8 2.9 0 0.0 0 0.0
21-25 807 585 72.5 80 9.9 105 13.0 24 3.0 7 0.9 6 0.7
26-30 828 539 65.1 97 11.7 118 14.3 35 4.2 21 2.5 18 2.2
31-35 701 482 68.8 67 9.6 75 10.7 38 5.4 19 2.7 20 2.8
36-40 694 490 70.6 77 11.1 72 10.4 27 3.9 10 1.4 18 2.6
41-50 1,109 832 75.0 85 7.7 119 10.7 44 4.0 13 1.2 16 1.4
Over 50 955 817 85.5 60 6.3 53 5.5 16 1.7 5 0.5 4 0.4
EDUCATION
No High School 1,417 877 61.9 163 11.5 238 16.8 83 5.9 27 1.9 29 2.1
H.S. Grad. 1,932 1,392 72.0 189 9.8 207 10.7 72 3.7 31 1.6 41 2.1
Some College 1,386 1,136 82.0 97 7.0 103 7.4 28 2.0 15 1.1 7 0.5
College Grad. 567 516 91.0 28 4.9 14 2.5 8 1.4 1 0.2 0 0.0
Table 12
Criminal History Categories for Offenders Eligible for Alternative Sentences
Fiscal Year 2007

17
Alternative Sentencing in the Federal Criminal Justice System
differ by race, larger proportions of White offenders are in Criminal
History Category I (61.4% in Zone B and 68.2% in Zone C),
compared to Black offenders, 46.3 percent in Zone B and 52.8
percent in Zone C.
Criminal History Category also is related to the varying rates of
alternative sentences for offenders with different levels of
education. Offenders with higher levels of education are more
likely than less educated offenders to be sentenced to alternatives.
Table 9 shows that more than three-quarters (77.8%) of offenders
with at least a college degree were sentenced to an alternative. In
contrast, less than two-thirds (58.7%) of offenders without a high
school diploma were sentenced to an alternative. These two
groups of offenders also differ substantially in their Criminal History
Categories. The overwhelming majority (91.0%) of college
graduates are in Criminal History I, compared to less than
two-thirds (61.9%) of high-school dropouts. See Table 12.
Criminal History Category has a lesser impact on the rates of
alternative sentences for offenders in different age groups.
Offenders older than 50 years are sentenced to alternatives
(76.0%) more often than offenders in the younger age groups.
Rates of alternative sentences for the younger age groups range
from 63.2 percent for offenders aged 21-25 years to 70.1 percent
for offenders aged 41-50 years. See Table 9. The overwhelming
ZONE A ZONE B ZONE C
ALTERNATIVE
APPLIED
ALTERNATIVE
NOT APPLIED
ALTERNATIVE
APPLIED
ALTERNATIVE
NOT APPLIED
ALTERNATIVE
APPLIED
ALTERNATIVE
NOT APPLIED
TOTAL Total n % n % Total n % n % Total n % n %
TOTAL 5,378 2,673 2,070 77.4 603 22.6 1,624 1,068 65.8 556 34.2 1,081 539 49.9 542 50.1
GENDER
Male 3,451 1,579 1,179 74.7 400 25.3 1,070 656 61.3 414 38.7 802 360 44.9 442 55.1
Female 1,927 1,094 891 81.4 203 18.6 554 412 74.4 142 25.6 279 179 64.2 100 35.8
RACE
White 2,537 1,388 1,066 76.8 322 23.2 705 493 69.9 212 30.1 444 242 54.5 202 45.5
Black 1,621 825 643 77.9 182 22.1 533 344 64.5 189 35.5 263 130 49.4 133 50.6
Hispanic 860 259 198 76.4 61 23.6 273 153 56.0 120 44.0 328 144 43.9 184 56.1
Other 353 197 159 80.7 38 19.3 111 77 69.4 34 30.6 45 22 48.9 23 51.1
AGE
Under 21 280 141 106 75.2 35 24.8 62 38 61.3 24 38.7 77 46 59.7 31 40.3
21-25 807 396 295 74.5 101 25.5 233 137 58.8 96 41.2 178 78 43.8 100 56.2
26-30 828 399 290 72.7 109 27.3 275 173 62.9 102 37.1 154 80 52.0 74 48.0
31-35 701 332 258 77.7 74 22.3 218 129 59.2 89 40.8 151 71 47.0 80 53.0
36-40 694 344 265 77.0 79 23.0 208 136 65.4 72 34.6 142 68 47.9 74 52.1
41-50 1,109 555 438 78.9 117 21.1 343 234 68.2 109 31.8 211 106 50.2 105 49.8
Over 50 955 502 415 82.7 87 17.3 285 221 77.5 64 22.5 168 90 53.6 78 46.4
EDUCATION
No High School 1,417 562 415 73.8 147 26.2 471 259 55.0 212 45.0 384 158 41.2 226 58.8
H.S. Grad. 1,932 988 775 78.4 213 21.6 587 393 67.0 194 33.0 357 186 52.1 171 47.9
Some College 1,386 740 575 77.7 165 22.3 408 296 72.5 112 27.5 238 135 56.7 103 43.3
College Grad. 567 341 273 80.1 68 19.9 129 108 83.7 21 16.3 97 60 61.9 37 38.1
Table 13
Sentencing Zones and Alternatives for Eligible Offenders
Fiscal Year 2007
Offenders with higher
levels of education are
more likely than less
educated offenders to be
sentenced to alternatives.
18
United States Sentencing Commission
majority of offenders older than 50 years (85.5%) is in Criminal
History Category I. Rates of younger offenders in Criminal History
Category I range from 65.1 percent for offenders age 26-30 years
to 78.9 percent for offenders under the age of 21 years. See Table
12. Sentencing zone is of less importance for rates of alternative
sentences for offenders of different ages. The rates of offenders
sentenced in Zone A are nearly equal for each offender age group;
approximately half of the offenders in each age group is sentenced
in this zone. However, offenders over 50 years do have the
smallest proportion of offenders sentenced in Zone C.
Offense Severity
Table 10 shows that, in general, the likelihood of an offender
receiving an alternative sentence decreases in the higher
sentencing zones regardless of offense type, as would be
expected with the confinement requirements for those zones.
However, firearms (59.6%) and immigration (45.7%) offenders are
less likely, overall, to receive alternative sentences. See Table 9.
The more serious conduct of firearms and immigration offenders,
as indicated by guideline factors, is associated with their lower
rates of alternative sentences.
Of the firearms offenders sentenced under USSG §2K2.1
(Unlawful Receipt, Possession, or Transportation of Firearms or
Ammunition; Prohibited Transactions Involving Firearms or
Ammunition),60
the majority (89.1%) have guideline base offense
levels of 12 or 14. These offenders’ guideline calculations,
therefore, originate in the two most serious Zones, C or D, of the
sentencing table. Despite the fact that the final offense levels for
firearms offenders ultimately leave them equally distributed among
Zones A (35.1%), B (29.4%), and C (35.5%) (Table 11), they are
sentenced to alternatives comparatively less often than other
offenders. The seriousness of firearms offenses in general, and as
measured by guideline base offense levels, are associated with
their lower rates of alternative sentences.61
Immigration offenders also are less likely to receive alternative
sentences compared to other offenders. Offense severity also is
relevant to sentences for immigration offenders (all of whom are
United States citizens). All of the offenders sentenced under the
immigration guideline (USSG §2L1.1, Smuggling, Transporting, or
Harboring an Unlawful Alien)62
and eligible for alternative
sentences have relatively serious (Zone C) guideline base offense
levels of 12. However, sentences for these offenders largely are
influenced by sentencing practices in a single district. The largest
proportion (48.4%) of immigration offenders sentenced under
USSG §2L1.1 is in the Southern District of Texas. Sentences for
immigration offenders in that district are particularly relevant
because (1) a larger proportion of immigration offenders in that
district (61.3%) are in Zone C compared to all other districts
(30.8%) and (2) a smaller proportion of immigration offenders in
that district (31.4%) are sentenced to alternatives compared to all
other districts (56.2%).
This sentencing pattern for immigration offenders also is reflected
in the rates of alternative sentences for Hispanic offenders.
Overall, White (71.0%) and Black (68.9%) offenders are sentenced
to alternatives at rates substantially higher than Hispanic offenders
Sentencing zone is of less
importance for rates of
alternative sentences for
offenders of different ages.
The rates of offenders
sentenced in Zone A are
nearly equal for each
offender age group;
approximately half of the
offenders in each age group
is sentenced in this zone.
However, offenders over
50 years do have the
smallest proportion of
offenders sentenced in
Zone C.
The more serious conduct
of firearms and immigration
offenders, as indicated by
guideline factors, is
associated with their lower
rates of alternative
sentences.
19
Alternative Sentencing in the Federal Criminal Justice System
(57.6%). See Table 9. Hispanic offenders account for more than
two-thirds (68.6%) of the immigration offenders described above.
The overrepresentation of Hispanic offenders among immigration
offenders accounts for their lower rates of alternative sentences
compared to White and Black offenders.
Offenders sentenced for offenses other than firearms and
immigration are more likely to receive alternative sentences.
Offenders sentenced for the financial crimes of larceny (75.1%),
fraud (71.9%), and other white collar offenses (71.9%) are most
often sentenced to alternatives (Table 9), and these offenders are
more likely to be sentenced in Zones A and B. See Table 11.
Offense severity also is relevant for sentences for these offenders.
Most of these financial offenders (83.5% of the larceny, fraud, and
other white collar offenses, combined) are sentenced under the
theft and fraud guideline (USSG §2B1.1) which has base offense
levels (six and seven) in Zone A. The majority (56.9%) of the
offenders sentenced under the theft and fraud guideline ultimately
are sentenced in Zone A. Aside from offense severity, financial
offenses may be more suited to alternative sentences because of
restitution. A substantial proportion of larceny (67.6%), fraud
(65.2%), and other white collar (58.9%) offenders were ordered to
pay restitution as part of their sentences. To the extent that these
offenders are sentenced to prison alternatives, they may be better
positioned to pay restitution.
Drug offenders eligible for alternative sentences also receive those
alternatives at a relatively high rate (65.3%). See Table 9. That
such a large proportion of drug offenders receive alternative
sentences is unexpected because so many (31.6%) (Table 11) are
sentenced in Zone C and offenders sentenced in Zone C are less
likely, overall, to receive alternative sentences compared to
offenders in Zones A and B.
Criminal History Category and drug type combine to reduce the
Zone C effect on alternative sentences for drug offenders. More
than half (54.6%) of the drug offenders are marijuana offenders.
Marijuana offenders account for an even larger proportion (64.7%)
of the drug offenders sentenced in Zone C. Nearly two-thirds
(65.3%) of marijuana offenders sentenced in Zone C are
sentenced to alternatives. Criminal History Category also is a
factor influencing alternative sentences for drug offenders. Nearly
all (92.0%) of the Zone C marijuana offenders are in Criminal
History Category I. The predominance of marijuana offenders with
little or no prior records contributes to the unusually high rate of
alternative sentences for Zone C drug offenders.
Another indicator of offender seriousness is the application of
Acceptance of Responsibility (USSG §3E1.1). This guideline
provision provides for a two- or three-level offense level decrease
for offenders who clearly accept responsibility for their offenses.63
Offenders who receive these offense level reductions are more
likely to receive alternative sentences. The overwhelming majority
(95.4%) of offenders eligible for alternative sentences receive
offense level decreases for acceptance and, among those, 69.3
percent are sentenced to available alternatives. Among the
minority of offenders (4.6%) who do not receive offense level
decreases for Acceptance of Responsibility, only half (49.4%) are
sentenced to available alternatives. See Table 9.
Drug offenders eligible for
alternative sentences
receive those alternatives at
a relatively high rate
(65.3%).
The overwhelming majority
(95.4%) of offenders
eligible for alternative
sentences receive offense
level decreases for
acceptance and, among
those, 69.3 percent are
sentenced to available
alternatives.
20
United States Sentencing Commission
Sentencing zone also is relevant in the relationship between
Acceptance of Responsibility and offenders receiving alternative
sentences. The overwhelming majority of offenders with offense
level decreases for Acceptance of Responsibility in Zones A
(78.5%) and B (66.6%) receive alternative sentences, compared to
one-half (50.4%) sentenced in Zone C. A similar pattern exists for
offenders without offense level decreases for Acceptance of
Responsibility, but the very small numbers of offenders in those
categories make the comparison less meaningful. See Table 10.
Conclusion
In the Sentencing Reform Act of 1984, Congress stated, in part,
that “The Commission shall insure that the guidelines reflect the
general appropriateness of imposing a sentence other than
imprisonment in cases in which the defendant is a first offender
who has not been convicted of a crime of violence or otherwise
serious offense.”64
In turn, the Commission incorporated a mix of
sentence types into the guidelines so that courts have the
necessary flexibility to sentence appropriately all types of
offenders.
Federal sentencing courts have used these tools over the years,
primarily for fraud and white collar offenses, and, most importantly,
for United States citizens. The issues regarding non-citizen
offenders, while beyond the scope of this monograph, are of legal
and social interest and consequence to the federal criminal justice
community. With respect to United States citizens, it is impossible
to discern from available data the exact reasons sentencing courts
have in mind when deciding whether to impose alternative
sentences. This analysis, however, suggests some factors that
are relevant to those decisions, particularly for less serious
offenders and offenders with little or no prior criminal history.
Effective alternative sanctions are important options for federal,
state, and local criminal justice systems. For the appropriate
offenders, alternatives to incarceration can provide a substitute for
costly incarceration. Ideally, alternatives also provide those
offenders opportunities by diverting them from prison (or reducing
time spent in prison) and into programs providing the life skills and
treatment necessary to become law-abiding and productive
members of society.
Effective alternative
sanctions are important
options for federal, state,
and local criminal justice
systems. For the
appropriate offenders,
alternatives to incarceration
can provide a substitute for
costly incarceration.
21
Alternative Sentencing in the Federal Criminal Justice System
1. For the purposes of this paper, alternative sentences are defined as those involving probation and
community confinement as described in the federal sentencing guidelines at USSG §5C1.1.
2. The United States Sentencing Commission is an independent agency in the judicial branch of government.
Established by the Sentencing Reform Act of 1984, its principal purposes are (1) to establish sentencing
policies and practices for the federal courts, including guidelines regarding the appropriate form and severity of
punishment for offenders convicted of federal crimes; (2) to advise and assist Congress, the federal judiciary,
and the executive branch in the development of effective and efficient crime policy; and (3) to collect, analyze,
research, and distribute a broad array of information on federal crime and sentencing issues. Data for the
analyses in this paper are from the United States Sentencing Commission's fiscal year datafiles.
3. Caputo, Gail A. 2004. Intermediate Sanctions in Corrections. University of North Texas Press.
4. Id.
5. Id.
6. Benda, Brent B. 2005. Introduction: Boot Camps Revisited: Issues, Problems, Prospects in Rehabilitation
Issues, Problems, and Prospects in Boot Camp. Ed. Brent B. Benda and Nathaniel J. Pallone. Hawthorne
Press.
7. The PEW Center on the States. 2008. One in 100: Behind Bars in America 2008.
8. Id.
9. Id.
10. Pub. L. No. 98–473.
11. See 28 U.S.C. § 994(j).
12. Probation terms are authorized for felony offenders for one to five years and for misdemeanor offenders for
no more than five years.
13. Pub. L. No. 100–690.
14. See 18 U.S.C. § 3563 and 18 U.S.C. § 3583.
15. See 18 U.S.C. § 3561 and USSG §5B1.1.
16. Class A felonies carry sentencing terms of life or death. Class B felonies carry sentences of 25 years or
more. See 18 U.S.C. § 3559.
17. See 28 U.S.C. § 994(i).
18. For example, mandatory conditions of probation prohibit probationers from committing a new crime and
unlawfully possessing and/or using controlled substances. See 18 U.S.C. § 3563. The law also requires that
offenders, as appropriate, attend domestic violence rehabilitation programs, provide DNA samples, submit to
drug testing, and/or adhere to fine payment schedules.
19. Discretionary conditions of probation at the court’s disposal include requiring the offender to provide family
support and/or restitution, maintain consistent employment, refrain from any substance use, and obtain
specified medical or psychiatric treatment. See 18 U.S.C. § 3563(b). Policy statements of both the United
States Sentencing Commission (at USSG §§5B1.3(c) and (d)) and the Judicial Conference of the United States
distinguish between standard and special discretionary conditions of probation.
20. See USSG §5B1.3(e).
21. The offense level is calculated using offense specific aggravating and mitigating factors prescribed by the
guidelines. The Criminal History Category is based on the recency and severity of an offender’s prior sentences
and supervision status. The sentencing range is determined by the intersection of the offense level and
Endnotes

22
U.S. Sentencing Commission
Criminal History Category on the sentencing table. For example, an offender at offense level nine and Criminal
History Category III faces a sentencing range of eight to 14 months. See USSG §1B1.1 for an overview of
guideline application, including offense level and Criminal History Category computations.
22. See USSG §5C1.1.
23. Although these options are conditions of probation, the guidelines allow them to be substituted for
incarceration in order to meet the conditions of 28 U.S.C. § 994(b)(2). In the Sentencing Reform Act of 1984,
Congress directed that the maximum of a sentencing range could not exceed the minimum by more than six
months or 25 percent of the minimum. The guidelines allow non-prison sentences for Zone B offenders,
creating sentencing ranges larger than six months because the minimum confinement term for a probation
sentence is zero months (the maximum terms in Zone B begin at seven months). The guidelines avoid
sentencing ranges greater than six months for Zone B offenders by requiring probation terms for these to
include intermediate confinement.
24. Non-guideline sentences are sentences imposed below the guideline range that only mention U.S. v.
Booker, 18 U.S.C. § 3553, or related factors as a reason for a below-range sentence, or do not provide
sufficient information to be classified as a departure. This category includes cases that cite departure reasons
that are not affirmatively and specifically identified in the provisions, policy statements, or commentary of the
federal Guidelines Manual and cases that do not provide any reason for the sentence below the guideline
range.
25. For example, a sentence range of eight to 14 months associated with a final offense level of 13 and
Criminal History Category of III is in Zone C of the sentencing table. If the court sentences the offender to the
minimum of eight months, it may impose a term of supervised release with conditions of community confinement
for up to four of the eight months.
26. Of the 72,865 cases sentenced in fiscal yesar 2007, 63,906 have complete sentencing guideline application
information and are included in the table.
27. This analysis is limited to information contained in the sentencing documents submitted to the Commission.
Courts are required to submit sentencing documentation for felonies and Class A misdemeanors. Sentences
for petty offenses are not included in the Commission’s datafile. In fiscal year 2007, the Administrative Office of
the United States Courts reported 67,759 convictions for petty offenses (See Judicial Business of the United
States Courts, 2007). Offenders convicted of petty offenses are more likely to be sentenced to alternatives to
prison compared to offenders convicted of felonies or Class A misdemeanors. In addition, drug possessing
offenders receiving special probation under 18 U.S.C. § 3607 do not have judgments of conviction and are not
included in the Commission’s datafile.
28. Of the 72,865 cases sentenced in fiscal year 2007, 63,906 have complete sentencing guideline application
information. Of the 63,906 cases, 96 have been excluded that were not sentenced to prison or probation. An
additional 43 cases have been excluded due to missing information on type of sentence imposed.
Prison/Community Split includes all cases in which offenders received prison and conditions of confinement as
defined in USSG §5C1.1.
29. Of the 72,865 offenders sentenced in fiscal year 2007, 3,346 were excluded from this calculation due to
missing citizenship status. Of the 26,016 non-citizen offenders, 80.3 percent are in the United States illegally.
30. See 8 U.S.C. § 1227.
31. Deportable alien status is one of a number of public safety factors considered in the assessment of an
inmate’s overall custody classification. Federal Bureau of Prisons. Inmate Security Designation and Custody
Classification Program Statement. 2006. http://www.bop.gov/policy/progstat/5100_008.pdf.
32. A total of 817 non-United States citizens were sentenced to non-prison sentences in fiscal year 2007.
Slightly more than half (58.1%) of these offenders were sentenced to probation only. Primarily, these offenders
were convicted of immigration (28.0%) and fraud (28.3%) offenses.
33. Of the 72,865 cases sentenced in fiscal year 2007, 63,906 have complete sentencing guideline application
information. Of these, 153 have been excluded due to missing information on citizenship status.
Endnotes
23
Alternative Sentencing in the Federal Criminal Justice System
34. The proportions of offenders in Zone D who are United States citizens (66.9%) and non-citizens (33.1%)
reflect more closely the proportion of each group in the overall federal offender population.
35. Of the 72,865 cases sentenced in fiscal year 2007, 63,906 have complete sentencing guideline application
information. Of these, 22,923 are non-United States citizens. Of the 22,923 non-citizens, 12 have been
excluded that were not sentenced to prison or probation. An additional 13 cases have been excluded due to
missing information on type of sentence imposed. Prison/Community Split includes all cases in which offenders
received prison and conditions of confinement as defined in USSG §5C1.1.
36. Of the 72,865 cases sentenced in fiscal year 2007, 63,906 have complete sentencing guideline application
information. Of these, 40,830 are United States citizens. Of the 40,830 cases, 80 have been excluded that
were not sentenced to prison or probation. An additional 30 cases have been excluded due to missing
information on type of sentencing imposed. Prison/Community Split includes all cases in which offenders
received prison and conditions of confinement as defined in USSG §5C1.1.
37. Of the 697,451 cases sentenced from fiscal year 1997 through fiscal year 2007, 5,416 have been excluded
that were not sentenced to prison or probation. An additional 3,772 cases have been excluded due to missing
information on sentence imposed.
38. The increased rate of imprisonment is, in part, attributable to the higher proportion of immigration offenders,
who are not eligible for alternative sentences, in the federal caseload. For example, immigration offenses
accounted for 13.7% of the federal caseload in 1997 (1997 Sourcebook of Federal Sentencing Statistics) and
nearly doubled to 24.3% in 2007 (2007 Sourcebook of Federal Sentencing Statistics).
39. Of the 697,451 cases sentenced from fiscal year 1997 through fiscal year 2007, 103,454 have been
excluded due to incomplete sentencing guideline application information. Of the remaining 593,997 cases, six
have been excluded due to missing information on sentencing zone. An additional 2,828 cases have been
excluded due to missing information on citizenship status. An additional 1,163 cases have been excluded that
were not sentenced to terms of prison or probation, and 943 cases have been excluded due to missing
information on type of sentence imposed. Of the remaining cases, the 50,115 sentenced in Zone A are
represented.
40. Of the 697,451 cases sentenced from fiscal year 1997 through fiscal year 2007, 103,454 have been
excluded due to incomplete sentencing guideline application information. Of the remaining 593,997 cases, six
have been excluded due to missing information on sentencing zone. An additional 2,828 cases have been
excluded due to missing information on citizenship status. An additional 1,163 cases have been excluded that
were not sentenced to terms of prison or probation, and 943 cases have been excluded due to missing
information on type of sentence imposed. Of the remaining cases, the 45,679 sentenced in Zone B are
represented.
41. Of the 697,451 cases sentenced from fiscal year 1997 through fiscal year 2007, 103,454 have been
excluded due to incomplete sentencing guideline application information. Of the remaining 593,997 cases, six
have been excluded due to missing information on sentencing zone. An additional 2,828 cases have been
excluded due to missing information on citizenship status. An additional 1,163 cases have been excluded that
were not sentenced to terms of prison or probation, and 943 cases have been excluded due to missing
information on type of sentence imposed. Of the remaining cases, the 36,892 sentenced in Zone C are
represented.
42. Criminal aliens are subject to deportation and therefore are ineligible for community-based sentences.
See 8 U.S.C. § 1227(a)(2).
43. Of the 43,503 cases sentenced in fiscal year 2007 involving United States citizens, 111 cases that were
not sentenced to prison or probation have been excluded. An additional 40 cases missing information on
sentence imposed have been excluded. The Drug category includes the following offense types: Trafficking,
Use of a Communication Facility, and Simple Possession. The Non-Fraud White-Collar category includes the
following offense types: Embezzlement, Forgery/Counterfeiting, Bribery, Money Laundering, and Tax. The
Other category includes a variety of offense types. See Appendix A of the 2007 Sourcebook of Federal
Sentencing Statistics. Of the 43,352 cases, 2,632 have been excluded due to missing sentencing guideline
application information.
Endnotes
24
U.S. Sentencing Commission
44. The Non-Fraud White Collar category includes the following offense types: Embezzlement,
Forgery/Counterfeiting, Bribery, Money Laundering, and Tax. See Appendix A in 2007 Sourcebook of Federal
Sentencing Statistics for definitions of offense type categories.
45. Of the 43,503 cases sentenced in fiscal year 2007 involving United States citizens, 111 cases that were not
sentenced to prison or probation have been excluded. An additional 40 cases missing information on sentence
imposed have been excluded. Cases missing information on length of sentence imposed have been excluded.
Calculations for average prison terms exclude 323 cases sentenced to life. The Combination of Alternatives
category includes cases with two or more alternative sentences imposed: home confinement, community
confinement, and/or intermittent confinement. Of the 42,352 cases, 124 have been excluded due to missing
information on monetary penalties. Monetary penalties include fine, cost of supervision, and/or restitution. Of
the 43,228 cases with monetary penalties imposed, 65 have been excluded due to missing information on
penalty amount. The median represents the midpoint, so that half of the cases have values below the median
and the remaining half have values above the median. Of the 43,352 cases, 414 have been excluded due to
missing information on sentence relative to the guideline range. The Above Range category includes both
departures and variances above the guideline range. The Government-Sponsored Below Range category
includes USSG §5K1.1 Substantial Assistance Departures, USSG §5K3.1 Early Disposition Program
Departures, and other government-sponsored downward departures. The Other Below Range category
includes both departures and variances below the guideline range.
46. See USSG §§5E1.1 and 5E1.2 for information on the imposition of restitution and fines.
47. The median represents the midpoint such that half of the monetary penalties are less than the median value
and the remaining half of monetary penalties are greater than the median value.
48. See 18 U.S.C. § 3553(a).
49. Congress, in 28 U.S.C. § 994(d), directs the Commission to “assure that the guidelines and policy
statements are entirely neutral as to the race, sex, national origin, creed, and socioeconomic status of
offenders.” The Commission considers certain offender characteristics such as age as “not ordinarily relevant in
determining whether a departure is warranted” but “[u]nless expressly stated, this does not mean that the
Commission views such circumstances as necessarily inappropriate to the determination of the sentence. . . .”
See USSG §5H.
50. Of the 43,503 cases sentenced in fiscal year 2007 involving United States citizens, 111 cases that were not
sentenced to prison or probation have been excluded. An additional 40 cases missing information on sentence
imposed have been excluded. Of the 43,352 cases, 98 have been excluded due to missing information on
offender race. Of the 43,352 cases, eight have been excluded due to missing information on offender gender.
Of the 43,352 cases, 41 have been excluded due to missing information on offender age.
51. See 18 U.S.C. § 3553(c) for instances requiring the sentencing court to provide reasons for a sentence.
52. United States Attorney’s offices in the federal judicial districts decline to prosecute cases for a number of
reasons. To the extent that (presumably) less serious offenses are not prosecuted, the proportion of offenders
eligible for alternative sentences in a district may be lowered. Finally, the data cannot account for the court’s
considerations of such crucial issues as availability of appropriate alternative resources in a district, or other
information that may be known to the court at the time of sentencing.
53. For this analysis, Zone A probation sentences are considered alternatives and any confinement sentence
for Zone A offenders is considered in excess of available alternatives. Zone B sentences of probation with
confinement conditions and split sentences that include imprisonment are considered alternatives; sentences of
only prison are considered in excess of the available alternatives. Zone C sentences that include any length of
community confinement substituted for imprisonment are considered alternatives; sentences of only prison are
considered in excess of the available alternatives.
54. A number of factors were included in this analysis. However, only those factors that demonstrated some
association with alternative sentences are reviewed here.
55. Of the 72,865 cases sentenced in fiscal year 2007, 5,378 are included in this table with complete
sentencing guideline application information. Only United States citizens are included. Offenders with complete
information on type of sentence imposed, sentenced in Zones A, B, or C in the Sentencing Table, and
Endnotes
25
Alternative Sentencing in the Federal Criminal Justice System
sentenced within the sentencing guideline range are included. Offenders subject to mandatory minimum
sentences have been excluded. Of the 603 Zone A offenders not sentenced to alternatives, 109 were
sentenced to time served. Of the 556 Zone B offenders not sentenced to alternatives, 104 were sentenced to
time served. Of the 542 Zone C offenders not sentenced to alternatives, 37 were sentenced to time served.
Definitions of offense type categories are in Appendix A of the 2007 Sourcebook of Federal Sentencing
Statistics.
56. Of the 72,865 cases sentenced in fiscal year 2007, 5,378 are included in this table with complete
sentencing guideline application information. Only United States citizens are included. Offenders with complete
information on type of sentence imposed, sentenced in Zones A, B, or C in the Sentencing Table, and
sentenced within the sentencing guideline range are included. Offenders subject to mandatory minimum
penalties have been excluded. Definitions of offense type categories are in Appendix A of the 2007 Sourcebook
of Federal Sentencing Statistics.
57. Id.
58. Id.
59. Id.
60. Of the 282 firearms offenders sentenced in fiscal year 2007, 248 (87.9%) were sentenced under USSG
§2K2.1 and included in this part of the analysis.
61. The firearms category contains a relatively small number of offenders. Because of the small numbers of
cases in each category, caution should be used in making generalizations or conclusions about these offenders.
62. Of the 370 immigration offenders sentenced in fiscal year 2007, 283 (76.5%) were sentenced under USSG
§2L1.1 and included in this part of the analysis.
63. See USSG §3E1.1 for requirements for the two- and three-level decreases.
64. See 28 U.S.C. § 994(j).
Endnotes