Embed Size (px)
Citation preview
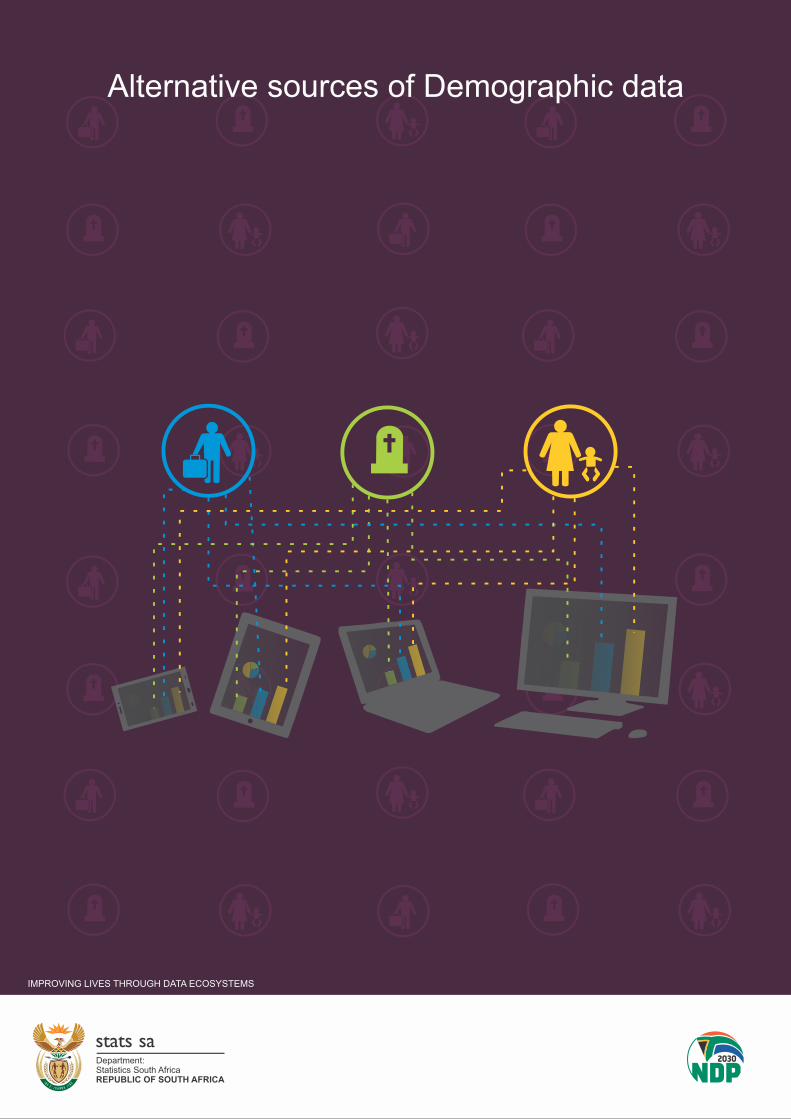
Alternative sources of Demographic data
IMPROVING LIVES THROUGH DATA ECOSYSTEMS

ALTERNATIVE SOURCES OF DEMOGRAPHIC DATA
Statistics South Africa
Risenga Maluleke Statistician General
Report No. 03-00-17
STATISTICS SOUTH AFRICA ii
Alternative Sources of Demographic Data (Report 03-00-17)
ALTERNATIVE SOURCES OF DEMOGRAPHIC DATA / Statistics South Africa Published by Statistics South Africa, Private Bag X44, Pretoria 0001 © Statistics South Africa, 2021 Users may apply or process this data, provided Statistics South Africa (Stats SA) is acknowledged as the original source of the data; that it is specified that the application and/or analysis is the result of the user's independent processing of the data; and that neither the basic data nor any reprocessed version or application thereof may be sold or offered for sale in any form whatsoever without prior permission from Stats SA. Stats SA Library Cataloguing-in-Publication (CIP) Data ALTERNATIVE SOURCES OF DEMOGRAPHIC DATA / Statistics South Africa. Pretoria: Statistics South Africa, 2021 Report no. 03-00-17 73 pp ISBN: 978-0-621-49251-4
A complete set of Stats SA publications is available at Stats SA Library and the following libraries:
National Library of South Africa, Pretoria Division National Library of South Africa, Cape Town Division Library of Parliament, Cape Town Bloemfontein Public Library Natal Society Library, Pietermaritzburg Johannesburg Public Library Eastern Cape Library Services, King William’s Town Central Regional Library, Polokwane Central Reference Library, Mbombela Central Reference Collection, Kimberley Central Reference Library, Mmabatho
This report is available on the Stats SA website: www.statssa.gov.za For technical enquiries please contact: Diego Iturralde Tel.: 012 310 8922 Email: [email protected]
STATISTICS SOUTH AFRICA iii
Alternative Sources of Demographic Data (Report 03-00-17)
Acknowledgements
Statistics South Africa would like to thank the following people for their contribution to this report: Diego
Iturralde, Itani Ntsieni, Lesego Olga Bodigelo, Princelle Dasappa-Venketsamy, Nyiko Tricia Maluleke, Leonard
Ahuejere.

STATISTICS SOUTH AFRICA iv
Alternative Sources of Demographic Data (Report 03-00-17)
Table of contents
Acknowledgements ......................................................................................................................................... iii
List of Tables ...................................................................................................................................................vii
Preface ............................................................................................................................................................viii
Executive summary .........................................................................................................................................ix
CHAPTER 1: FERTILITY ................................................................................................................................... 1
1. Introduction ..................................................................................................................................................... 2
2. Traditional sources of measuring fertility ........................................................................................................ 2
2.1 Censuses and surveys ................................................................................................................................. 2
2.2 Strengths and weaknesses .......................................................................................................................... 3
2.3 Quality of fertility data from census and survey ............................................................................................ 3
3. Alternative data sources of fertility .................................................................................................................. 3
3.1 Vital registration data .................................................................................................................................... 3
3.2 Strengths and weaknesses .......................................................................................................................... 4
3.3 Quality assurance and assessment .............................................................................................................. 5
3.3.1 Quality assessment in line with Statistics South Africa ............................................................................. 5
3.4 Some research papers of calculating fertility from incomplete vital registration data .................................. 5
4. South African Demographic Health Survey (SADHS) .................................................................................... 6
4.1 Strengths and weaknesses .......................................................................................................................... 6
4.2 Quality of the data ......................................................................................................................................... 7
4.3 Some fertility research papers on fertility using SADHS data ...................................................................... 7
5. The South African Population Research Infrastructure Network .................................................................... 7
5.1 Strengths and weaknesses .......................................................................................................................... 8
5.2 Quality of the data ......................................................................................................................................... 8
5.3 Some fertility research papers on fertility using DSSD data......................................................................... 9
6. Survey data ..................................................................................................................................................... 9
6.1 National Income Dynamic Study (NIDS) ...................................................................................................... 9
6.2 Strengths and weaknesses .......................................................................................................................... 9
6.3 Quality of the data .......................................................................................................................................10
6.4 Some fertility research papers on fertility using NIDS data ........................................................................10
7. Administrative records ..................................................................................................................................10
7.1 Antenatal care data (ANC records) ............................................................................................................10
7.2 Strengths and weaknesses ........................................................................................................................11
7.3 Quality of data based on previous studies .................................................................................................11
7.4 Some studies that use ANC fertility and health reproductive data .............................................................12
8. District Health Management Information System (DHMIS) ..........................................................................13
8.1 Overview .....................................................................................................................................................13
8.2 Strengths and weaknesses ........................................................................................................................13
8.3 Quality of data .............................................................................................................................................13
8.4 Some of the research studies that used DHMIS data ................................................................................14
9. Church registers ...........................................................................................................................................14
9.1 Weaknesses ...............................................................................................................................................14
STATISTICS SOUTH AFRICA v
Alternative Sources of Demographic Data (Report 03-00-17)
9.2 Research studies from parish registers ......................................................................................................15
10. Conclusion ..................................................................................................................................................15
References .......................................................................................................................................................16
CHAPTER 2: MORTALITY ..............................................................................................................................20
1. Introduction ...................................................................................................................................................21
1.1 Rationale .....................................................................................................................................................21
1.2 Data gaps ...................................................................................................................................................21
2. Traditional sources of data on mortality ........................................................................................................22
2.1 Civil registration and vital statistics system ................................................................................................22
2.2 Population census ......................................................................................................................................23
2.3 Community surveys ....................................................................................................................................24
2.4 South Africa Demographic and Health Surveys (DHS) ..............................................................................24
2.5 South African National HIV Prevalence, Incidence and Behaviour Surveys ..............................................25
2.6 National Income Dynamics Study (NIDS) panel data .................................................................................25
3. Alternative data sources and their potential contributions in complementing existing mortality sources .....26
3.1 Health and Demographic Surveillance System (HDSS) .............................................................................26
3.1.1 Agincourt HDSS .......................................................................................................................................26
3.1.2 Africa Health Research Institute Centre ..................................................................................................27
3.1.3 DIMAMO Population Health Research Centre ........................................................................................28
3.1.4 Child Health and Mortality Prevention Surveillance (CHAMPS) .............................................................28
3.2 National Population Register ......................................................................................................................29
3.3 Department of Health Management Information System (DHMIS) ............................................................29
3.4 Sample Registration System (SRS) ...........................................................................................................31
3.5 Mortality mobile phone surveys (MPS) .......................................................................................................31
3.6 Big data .......................................................................................................................................................32
3.6.1 Social media influence in the COVID-19 pandemic ................................................................................32
4. Conclusion ....................................................................................................................................................33
References .......................................................................................................................................................34
CHAPTER 3: MIGRATION...............................................................................................................................37
1. Introduction ...................................................................................................................................................38
1.1 Migration in South Africa ............................................................................................................................38
1.2 Purpose and objective ................................................................................................................................40
1.3 Rationale .....................................................................................................................................................40
1.4 The COVID-19 pandemic ...........................................................................................................................41
1.5 Data gaps ...................................................................................................................................................41
2. Traditional sources of data on migration ......................................................................................................42
2.1 Census ........................................................................................................................................................42
2.2 Community Survey .....................................................................................................................................43
2.3 The Quarterly Labour Force Survey ...........................................................................................................43
2.4 Administrative data .....................................................................................................................................44
2.5 Administrative registers ..............................................................................................................................44
2.6 Border data collection .................................................................................................................................45
2.7 Administrative sources................................................................................................................................45

STATISTICS SOUTH AFRICA vi
Alternative Sources of Demographic Data (Report 03-00-17)
2.8 Gauteng City-Region Observatory (GCRO) ...............................................................................................45
2.9 Health and Demographic Surveillance Sites ..............................................................................................46
2.10 National Income Dynamics Study .............................................................................................................47
2.11 Scalabrini ..................................................................................................................................................47
2.12 Migration data portal (Global) ...................................................................................................................47
3. Alternative data sources ...............................................................................................................................48
3.1 Innovative use of existing data ...................................................................................................................49
3.2 Using election registration data to measure internal-migration trends in South Africa ..............................49
3.3 Data on prohibition appeals ........................................................................................................................49
3.4 Migration Help Desk ...................................................................................................................................50
3.5 Big data .......................................................................................................................................................50
3.6 Social media ...............................................................................................................................................52
3.7 Case study: Botswana ................................................................................................................................52
3.8 Facebook as an alternate data source .......................................................................................................52
3.9 Cellphone records (mobility, movement peaks) .........................................................................................53
3.10 Remittance ................................................................................................................................................53
3.11 The Migration, Gender and Health Systems ............................................................................................53
3.12 Internet applications..................................................................................................................................54
3.13 Integreat ....................................................................................................................................................54
3.14 The Mohajer App (Iran, US, Canada and UK) ..........................................................................................54
3.15 Case study: Using email data to estimate international migration rates ..................................................55
4. Challenges ....................................................................................................................................................55
5. Data collaboratives .......................................................................................................................................56
5.1 Improved situational analysis .....................................................................................................................56
5.2 Better understanding of migration drivers...................................................................................................56
5.3 Enhanced prediction and forecasting .........................................................................................................56
5.4 More effective impact assessments and evaluation ...................................................................................57
6. Conclusion ....................................................................................................................................................57
References .......................................................................................................................................................58
CHAPTER 4: CURRENT LEGISLATIVE REVIEW AND APPLICATION OF STANDARDS TO ALTERNATIVE DATA SOURCES ...................................................................................................................60
1. Introduction ...................................................................................................................................................61
2. Role of South African Statistical Quality Assessment Framework (SASQAF) in non-traditional data sources .............................................................................................................................................................61
3. SASQAF lite ..................................................................................................................................................62
4. Application of standards to alternative data sources62
5. Conclusion ....................................................................................................................................................63
References .......................................................................................................................................................64

STATISTICS SOUTH AFRICA vii
Alternative Sources of Demographic Data (Report 03-00-17)
List of Tables
Table 1: Quality assessment of VRS data .......................................................................................................... 5

STATISTICS SOUTH AFRICA viii
Alternative Sources of Demographic Data (Report 03-00-17)
Preface
The amount of data that is being collated around various facets of our society is such that we need to be able
to have the ability to use it and the skills required to maximise it, in order to understand society better. In this
case, the need to understand demographic indicators that are robust and current is of concern to this report.
In this regard, integration with existing official statistics and an assessment of its quality is of importance. The
ability to capitalise on the 4th industrial revolution as well as the big data revolution relies on the development
of methods to understand alternative data sources whilst taking their strengths and weaknesses into account.
It requires an investment from the side of IT to be able to access, store and process data from different sources,
and most urgently, there needs to be a data-sharing framework for the acquisition of data – particularly from
the public sector. In this regard, such data producers need to be given the space to improve their data and
data systems; data needs to be availed in the form of a time series for periodic comparison, whether it be
annual, quarterly or otherwise, and the confidentiality of the subjects of the data needs to be protected at all
times.
This volume aims to look at possible sources of demographic data along with their strengths and weaknesses
with the view to being able to compute demographic indicators which would complement the existing official
data sources. The volume is also in part a commitment to an inter-connected statistical system which is one
of the strategic outcomes of Statistics South Africa's strategy for the 2020–2025 period.
Risenga Maluleke Statistician-General

STATISTICS SOUTH AFRICA ix
Alternative Sources of Demographic Data (Report 03-00-17)
Executive summary
National and international development frameworks such as the National Development Plan, the Medium Term
Strategic Framework, the Sustainable Development Goals and Agenda 63 have increased the need for good
quality and timeous data for the monitoring of targets over time. This report presents alternative data sources
that can be embraced to complement the well-known traditional sources of demographic data of fertility,
mortality and migration in South Africa.
In terms of fertility, the report identified the vital registration system and the national income dynamics study
as sources that can assist in the provision of fertility indicators since they collect information on age and births
of women; these variables remain critical in the computation of key fertility rates. It is revealed that the
alternative sources identified are still interdependent on the censuses since computation methods using these
data sources would still need the total population as the denominators, which information often comes from
censuses. The importance of the use of all the data sources together are shown when data quality assessment
is undertaken. Quality assessment requires the comparability of fertility indicators across all relevant data
sources.
The report presents alternative sources of mortality data such as the Health and Demographic Surveillance
Systems (HDSS), the National Population Register (NPR), the Department of Health Management Information
System (DHMIS), the Sample Registration System (SRS), mobile phone surveys and big data. Whilst sources
such as the DHMIS and HDSS are not representative of the South African population, they are representative
of particular characteristics. Their existence presents an opportunity to understand mortality using an in-depth
approach, especially in terms of indirect factors influencing the survival and mortality of children and adults.
The report highlights their usefulness by showing that the mortality indicators from these sources follow the
known patterns of mortality in South Africa.
Looking into migration, the report notes that data producers can first be innovative with the existing sources;
for instance, by inclusion of questions most necessary for the disaggregation of migration in data collection of
censuses and a wide range of surveys. Despite their shortcomings, the election registration data, the
Department of Home Affairs prohibition appeals, the migration helpdesk, the migration, gender and health
systems and other components of big data – from social media applications to systems for sending remittances
across the nation – offer unique data to help understand the components of migration in South Africa. Whilst
they do not offer the best solutions to current data challenges on migration, they are worth consideration when
tabulating migration components in South Africa.

CHAPTER 1: FERTILITY

STATISTICS SOUTH AFRICA 2
Alternative Sources of Demographic Data (Report 03-00-17)
1. Introduction
It has been established that the Census and household surveys are some of the main sources for producing
fertility indicators. They are part of an integrated programme of statistical data collection and compilation that
provide a comprehensive source of information for policy formulation, development planning, administrative
purposes, research, commercial products and other uses (Suharto, 2001).
Statistics South Africa (Stats SA) has undertaken three population censuses since 1994 as per the Statistics
Act (Act No. 6 of 1999). These have generated diverse demographic and socio-economic information at
grassroots level that have guided the formulation of policies and interventions aimed at further development
of the South African society. The demand for data at lower geographic levels continues to increase and in light
of this, the Community Survey (CS) was initiated to bridge the gap between censuses in providing data at
lower geographic levels in the country (Stats SA, 2016). These sources have provided the country the
opportunity to explore fertility behaviour amongst South African women.
The sources, like any others, have their own advantages and disadvantages. For instance, the main
advantages of the traditional approach are in providing a snapshot of the entire population at a specified period
and the potential availability of multivariate data for relatively small areas and population sub-groups for all
variables, including fertility. On the other hand, the size and complexity of the exercise means that the content
and quality control efforts may be limited (UN, 2015).
Therefore, in the absence of this traditional data collected by Stats SA, the issue of use of alternative data for
fertility analysis presents a gap, and as such, is a concern in the country. In line with these understandings,
Seeskin et al. (2001) wrote that alternative data sources beyond surveys and censuses are increasingly seen
as a potential resource for health statistics and policy analysis. However, experience has shown that these
non-traditional data sources have their benefits and concerns, and must therefore be well scrutinized and
carefully utilized to ensure standard and fit for use (ibid). Based on these contexts, this chapter will highlight
the attributes of alternative data sources available for fertility analysis in South Africa. In doing so, it will reveal
their strengths, potential and the possibility of being used as alternative sources of data for demographic
analysis in South Africa.
2. Traditional sources of measuring fertility
2.1 Censuses and surveys
Statistics South Africa uses censuses and community survey fertility data to produce fertility rates using these
techniques. The techniques are developed with the objective of transforming information on fertility indicators
into conventional measures of these variables, such as age-specific birth rates and crude birth rates. In
addition, indirect techniques are developed with the objective of adjusting and correcting the data derived from
surveys and censuses. The most common methods that have been used by Statistics South Africa to produce
fertility estimates are the Gompertz Relational and Feeney variant method. The methods are based on several
hypotheses and assumptions as well as on mathematical and demographic models (Moultrie et al., 2013). In
the absence of accurate and timely data, indirect estimates have provided the most important information
available in many developing countries.

STATISTICS SOUTH AFRICA 3
Alternative Sources of Demographic Data (Report 03-00-17)
2.2 Strengths and weaknesses
The census provides an important sampling frame for subsequent surveys and studies. It serves as a useful
tool for nation-building by involving the entire population. Census data avoids the sampling errors that can
occur with sample data. It also provides data for small areas such as districts and provinces, which is vital for
the planning of services.
On the other hand, the size and complexity of the exercise means that the content and quality control efforts
may be limited. The cost of carrying out a census means that most countries can pursue an enumeration every
ten years only. In developing countries, where the technology lacks behind, there is usually a significant delay
between when the data is collected and the results released. Typically, this delay is between eighteen months
to two years, which means that the census only offers a snapshot of the population at some point in the past.
Censuses are easily politicised, either by groups who feel that they might be systematically undercounted by
the exercise or by parties with a vested interest in seeking to ensure that their population is found to be larger
than that of other groups (UN, 2004).
With regards to household surveys, they collect information for a relatively small but scientifically designed
samples of household. The small sample size makes surveys less expensive and more flexible than population
censuses and based on that, they are the best method of collecting data on topics of current interest. The
surveys are the most appropriate method for obtaining detailed data on condition influencing fertility. The main
limitation of surveys is that they are less able to provide detailed information on small geographic areas (UN,
1984).
2.3 Quality of fertility data from census and survey
Fertility questions that are often asked in censuses and surveys provide information on current births and
lifetime fertility. In the 1960s, Brass and colleagues observed that this data is typically affected by a number of
common errors. The most common error is the omission of births in lifetime fertility which occurs when women
tend to forget some of their children – particularly those who are living in other households and who are no
longer alive (Moultrie et al., 2013). Despite these errors, there are demographic techniques and methods that
can correct the errors and provide the estimates of fertility.
3. Alternative data sources of fertility
3.1 Vital registration data
Birth registration is defined as a compulsory, continuous, permanent and universal recording of the occurrence
and characteristics of births in accordance with the legal requirements of the United Nations (UNICEF, 2013).
In South Africa, the right to birth registration is enshrined in the Births and Deaths Registration Act 1992 (Act
No. 51 of 1992), amended as the Birth and Deaths Registration Amendment Act, 2010 (Act No. 18 of 2010).
STATISTICS SOUTH AFRICA 4
Alternative Sources of Demographic Data (Report 03-00-17)
Statistics South Africa uses vital registration data to present information on the births that occurred in a specific
year and that were registered at the Department of Home Affairs, and to show a historical patterns of birth
occurrence and registration (Stats SA, 2019). However, the number of births alone does not convey information
about levels of fertility because they reflect the size of the population and the length of the period of
observation; for instance, more births are expected in China than in Monaco because there are more persons;
therefore, more births are expected during a 10-year period than during a single year (UN, 2004).
Fertility variables provided by the data include the year and month of birth occurrence, age of the mother, sex
of the child, mother's age and foreign-born mother. From these, indicators such as total fertility rate (TFR),
age-specific fertility rate (ASFR) and sex ratio at birth, teenage pregnancy and migrant's fertility can be
measured.
3.2 Strengths and weaknesses
The principle of continuity is critical to the collection and compilation of vital statistics, as data needs to reflect
short-term as well as longer-term fertility trends. The main limitation experienced by many developing countries
is the incompleteness of fertility data (UN, 2014). For instance, Statistics South Africa used to receive data on
foreign birth registrations; however, the births were subsequently excluded from annual birth data with effect
from 2015, due to technical problems encountered in retrieving the data, and as such, the number of births in
the 2019 statistical release is incomplete (Stats SA, 2019).
Complete and accurate civil registration will provide data on births that may be utilized without adjustment or
estimation in the calculation of rates and summary measures. In South Africa, the overall completeness of
birth registration is estimated at 88,6% for the inter-censual period 2011–2016 (Stats SA, 2019). This implies
that data cannot be used without adjustment. In this case, the registered number of births, together with
supplementary information from the population census, is used to estimate the true number of births. The true
number of births will then be used for calculation of rates and summary measures (UN, 2004).
Even when civil registration is well established and well maintained, these other sources of fertility data are
useful in providing independent estimates of fertility parameters, which can be used for evaluating the level of
completeness of civil registration and vital statistics, or as complementary sources of demographic data.
Likewise, population censuses are essential in providing the necessary denominators for calculating vital rates
and ratios in combination with civil registration data (numerators). In particular, the utilization of population
census data to obtain denominators is crucial when the civil registration system is not accompanied by a
population register (UN, 2014). On the basis of these, censuses will still be needed to adjust fertility data from
VRS in order to estimate fertility measures.
STATISTICS SOUTH AFRICA 5
Alternative Sources of Demographic Data (Report 03-00-17)
3.3 Quality assurance and assessment
Quality assurance and assessment refer to strategies and procedures for ensuring the quality of vital statistics.
Quality assurance occurs at each operational stage within the vital statistics system. Assessment of statistics
usually involves studies with specific objectives such as coverage of birth statistics, identification of
unregistered vital events and evaluation of the competency of cause-of-death coders. The quality of vital
statistics is measured by their completeness, correctness or accuracy, availability and timeliness. Whether
confidentiality procedures and protocols are followed, the VRS system should also be evaluated and measured
against international standards (UN, 2014).
Recording the correct age of the mother at the time of registration is a critical component in calculating both
total and age-specific fertility rates (ASFRs) from vital statistics data. The percentage of births with unspecified
age of mother is an indicator of poor quality data. The quality of the reporting of age of mother can be assessed
from the plausibility of age-specific fertility rates (ASFRs). In populations with mid to high fertility generally,
total fertility rate (TFR) is > 3; ASFRs tend to peak at age 20–24 or 25–29. In countries where TFR is 4 or
greater, they remain high in both these age groups. In countries with low fertility rates (TFR ≤ 2), ASFRs often
peak in the 30–34-year age range. A deviation from these patterns may suggest poor data quality. In South
Africa for instance, ASFR begins to show a rising trajectory trend among women aged 25–29 (Stats, SA, 2015).
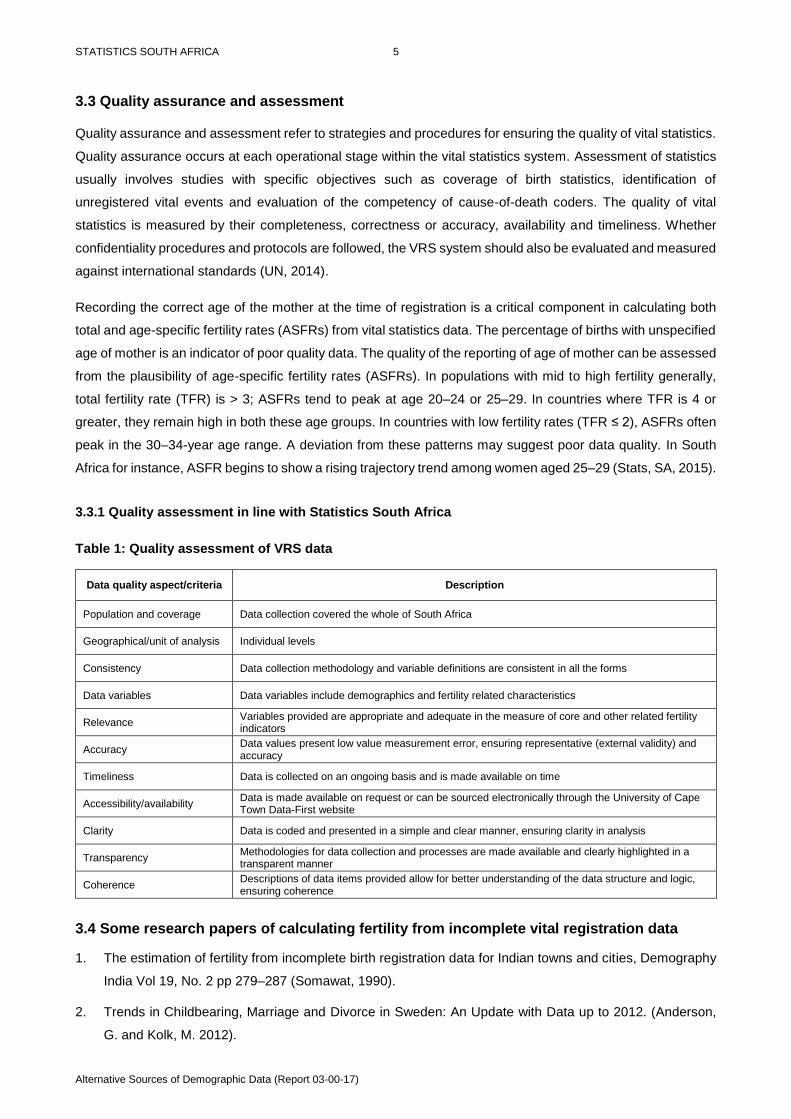
3.3.1 Quality assessment in line with Statistics South Africa
Table 1: Quality assessment of VRS data
Data quality aspect/criteria Description
Population and coverage Data collection covered the whole of South Africa
Geographical/unit of analysis Individual levels
Consistency Data collection methodology and variable definitions are consistent in all the forms
Data variables Data variables include demographics and fertility related characteristics
Relevance Variables provided are appropriate and adequate in the measure of core and other related fertility indicators
Accuracy Data values present low value measurement error, ensuring representative (external validity) and accuracy
Timeliness Data is collected on an ongoing basis and is made available on time
Accessibility/availability Data is made available on request or can be sourced electronically through the University of Cape Town Data-First website
Clarity Data is coded and presented in a simple and clear manner, ensuring clarity in analysis
Transparency Methodologies for data collection and processes are made available and clearly highlighted in a transparent manner
Coherence Descriptions of data items provided allow for better understanding of the data structure and logic, ensuring coherence
3.4 Some research papers of calculating fertility from incomplete vital registration data
1. The estimation of fertility from incomplete birth registration data for Indian towns and cities, Demography
India Vol 19, No. 2 pp 279–287 (Somawat, 1990).
2. Trends in Childbearing, Marriage and Divorce in Sweden: An Update with Data up to 2012. (Anderson,
G. and Kolk, M. 2012).

STATISTICS SOUTH AFRICA 6
Alternative Sources of Demographic Data (Report 03-00-17)
4. South African Demographic Health Survey (SADHS)
The South African Demographic and Health Survey (SADHS) is a data collection exercise, designed with the
intention of providing data for monitoring the population and health situation in South Africa (NDoH/Stats
SA/SAMRC/ICF, 2018). In doing so, it provides an understanding of population dynamics in the country at all
levels (Stats SA, 2016). It is collected by Statistics South Africa (Stats SA) in collaboration with the worldwide
Demographic and Health Survey Program (ibid). The SADHS data was collected in South Africa in 1998, 2003
and 2016, and can easily be accessed through the DHS website upon registration. Being the third SADHS
dataset to be collected in the country, the SADHS (2016) data had a nationally representative sample of 8 514
women (aged 15–49) in all selected households and 3 618 men (aged 15–59) in half of the selected
households taking part in the survey (NDoH/Stats SA/SAMRC/ICF, 2018). The data sample design provides
estimates at national and provincial levels and by rural-urban areas (ibid).
Among others, the objective of the survey includes the provision of reliable data that can be used in the
estimation of fertility, contraceptives, pregnancy and other related dynamics in the country. The data therefore
captures the full birth histories of women and as such provides variables that can be used in obtaining both
current and completed fertility patterns of women of reproductive age in the country. During the interviews,
women were requested to provide information on the total number of sons and daughters they had given birth
to, that were still living with them or elsewhere, and the number who had died. These details on each live birth
were obtained separately, according to the month and year of birth, sex and survival status (Stats SA, 2016).
Therefore, fertility variables in the data include variables such as ever given birth, total number of children born
(CEB), living with the respondent or elsewhere, number of children born but who have since died, etc.
Contraceptives and pregnancy related variables in the data also include current contraceptive method,
contraceptive use and intention, duration of pregnancy, year/month of pregnancy, etc. (ibid). These variables
can be used to derive fertility indicators (i.e. summary measures) such as age and sex ratio patterns,
proportions of pregnancy/contraceptive use, average parity, crude birth rate, general fertility rate (GFR), total
fertility rate (TFR) and age-specific fertility rates (ASFR), etc. at the national and sub-group differentials levels
(NDoH/Stats SA/SAMRC/ICF, 2017). The SADHS data can be used in the application of both direct and
indirect estimation methods (ibid).
4.1 Strengths and weaknesses
The SADHS data is user-friendly and has the advantage of providing a variety of variables covering a wide
range of issues. The data sample is big and evenly spread across the country; therefore, findings using the
data can be very representative and generalised. The data is also useful in providing independent estimates
of fertility parameters, in addition to having the advantage of being used to provide up-to-date estimates of
basic demographic and health indicators. Data is processed and is made available based on the experience
accumulated over many years, and as such presents highly reliable estimates. According to the report, "the
DHS program is an important source of demographic and health data in low and middle-income countries"
(Stats SA, 2016:1); therefore, it is comparable across countries. This is achieved through the application of
standardised questionnaires, methodologies and training before the data collection exercise (Stats SA, 2016).
STATISTICS SOUTH AFRICA 7
Alternative Sources of Demographic Data (Report 03-00-17)
Specifically, it also has the ability of measuring and revealing fertility dynamics, including the structure and
changes in the living conditions and well-being of households and household members in the country (Stats
SA, 2016). The data is available up to 2016 and as such, appropriate in the study of trends and patterns,
including comparative studies of fertility. It also has the provision of being calibrated and as such is adjusted
to Stats SA boundary changes. The "DHS has the flexibility to allow exclusion or inclusion of questions in the
model questionnaires to suit countries' contexts" (Stats SA, 2016:1). Weakness are that the data has the
challenge of variable names which are not conventionally named as per the Demographic and Health Survey
(DHS) standards, therefore not allowing the use of the DHS user forum and other available documents for
reference (ibid). The educational variable also has erroneous categories. Therefore, caution is recommended
in using the variable for disaggregation (Stats SA, 2016).
4.2 Quality of the data
A closer observation suggests that the SADHS data adheres to the standard principle of consistency,
transparency, accuracy and timeliness. For example, a critical review of the data indicates that the reporting
of total children ever born is consistent with age of the women, therefore adhering to the principle of
consistency. Also, the data values present low value measurement error, ensuring representative (external
validity) and data accuracy. In further assurance of quality, a standard data collection methodology is laid down
and strictly followed during data collection. Also, in processing and producing the tables, many steps designed
to ensure that the data properly reflect the situation they intend to describe are followed (Stats SA, 2016; Croft
et al., 2018). These steps include "editing the data for consistency, imputation of key dates of events, weighting
the sample results, considering such factors as the sample design and response rates, calculating the wealth
index, and constructing accurate summary variables" (Croft et al., 2018:18). The procedures involved in these
steps are straightforward and quite familiar with demographers in a further effort of increasing data confidence
and quality (Croft et al., 2018). Also, procedures needing special attention are developed on the basis of
experience accumulated over many years, regarding the preferred way of calculating certain indicators in terms
of what to guard against, what not to forget, etc. (ibid).
4.3 Some fertility research papers on fertility using SADHS data
1. Fertility Trend and Pattern in a Rural Area of South Africa in the Context of HIV/AIDS. (Camlin, C.S. et
al., 2004).
2. Patterns of fertility in contemporary South Africa: Prevalence and associated factors (Biney, E. et al.,
2021).
5. The South African Population Research Infrastructure Network
The South African Population Research Infrastructure Network (SAPRIN) is an umbrella of data from three
current study sites known as the Health and Demographic Surveillance System (HDSS). These are the
MRC/Wits University Agincourt HDSS (Bushbuckridge District), the DIMAMO HDSS (Capricorn District) and
the Africa Health Research Institute HDSS (uMkhayakude district) (SAPRIN, 2017).
STATISTICS SOUTH AFRICA 8
Alternative Sources of Demographic Data (Report 03-00-17)
The Health and Demographic Surveillance System (HDSS) can provide invaluable field data on longitudinal
fertility patterns (Ngoma, P. et al., 2001). Typical demographic surveillance systems monitor births, deaths,
causes of death, migration, and other health and socio-economic indicators within a defined population over
time. The demographic surveillance system is not a replacement for civil registration systems. Rather, it should
serve as a short- to medium-term means of obtaining data for health and population planning at regional level,
with possible extrapolation to national level, given that the sites are carefully selected so as to be nationally
representative (Wamukoya, Ezeh et al., 2012).
The sites provide data on vital events, the sampling frame and base population for community-based research
in countries where vital registration systems are non-existent or weak (Berhane et al., 1999). The process
starts with a baseline census followed by regular updates of key demographic events (birth, death, and
migration) and health events through systematic data collection procedures at set intervals (INDEPTH
Network, 2002).
The DSSD maternity questionnaire includes the birth history of all the children to the women in the household.
From the data item one would be able to calculate fertility indicators such as ASFR and TFR
(https://www.agincourt.co.za/wp-content/uploads/2018).
5.1 Strengths and weaknesses
HDSS sites is a platform for research and research capacity-building and it provides evidence-based
interventions for health development, including fertility (Binka, F.N. et al., 2007). It has also been speculated
that HDSS sites may have better health indicators compared to populations not under surveillance because
the repeated data collection and measurement could function as a passive intervention resulting in behaviour
change (Wamukoya et al., 2012).
Surveillance data is easy to understand, the system is flexible; hence, new diseases or conditions can be
added and extended to additional population groups (Thacker et al., 1988). Acceptability of the indicators
depends on perceived public health importance of the event under surveillance and time required for reports
(ibid). The main limitation of the data is that it collects and monitors the demographic and health characteristics
of a population living in a well-defined geographic area.
Disadvantages are that findings from the data are only applicable to the area of surveillance (Bushbuckridge,
Dikgale and Umkhayakude districts), and the population size of the study areas is considered to be
insignificant; therefore, findings from the data cannot be generalised (SAPRIN, 2017).
5.2 Quality of the data
Despite rigorous training and thorough fieldwork operations and quality control measures, it is difficult to
comprehensively evaluate the completeness and accuracy of HDSS data, given the absence of a gold
standard against which to measure findings. However, useful insights can be derived from comparing key
findings with national data sources. Comparisons between Agincourt surveillance data and national data
indicate that trends and the direction of change or vital events follow the same patterns (declining fertility)
despite some variation in levels (Kahn et al., 2007).

STATISTICS SOUTH AFRICA 9
Alternative Sources of Demographic Data (Report 03-00-17)
The correlation between Agincourt and national fertility rates, based on 1996 and 2001 census data, is high
with the trend in general fertility rate virtually identical from the mid-1990s (Garrenne, M. et al., 2007). Further,
the total fertility rates derived from two rural HDSS sources, Agincourt and the Africa Centre in Hlabisa district
of northern KwaZulu-Natal, are clearly consistent (Camlin, Garenne and Moultrie, 2007).
5.3 Some fertility research papers on fertility using DSSD data
1. Social patterns and differentials in the fertility transition in the context of HIV/AIDS: evidence from
population surveillance, rural South Africa, 1993 – 2013 (Kabudula, C. et al., 2016).
2. Convergence in fertility of South Africans and Mozambicans in rural South Africa, 1993–2009 (Williams
et al., 2013).
6. Survey data
6.1 National Income Dynamic Study (NIDS)
The National Income Dynamic Study (NIDS) is a national representative panel survey data, collected every
two years (biannually) in South Africa. It is a face-to-face longitudinal survey of sampled individuals living in
South African households. The NIDS project is an initiative of the Department of Planning, Monitoring and
Evaluation (DPME), designed to track and understand the shifting face of poverty by the South African
government, implemented by the Southern Africa Labour and Development Research Unit (SALDRU), based
at the University of Cape Town's School of Economics. The project provides information on how individuals
and households cope with negative and positive dynamics in the socio-economic space of South Africa
(SALDRU, 2017).
The NIDS data provides variables appropriate in the measuring of basic demographics such as age and sex
structure of the population, fertility and other birth related history of a woman in South Africa (Brophy et al.,
2018; Moultrie and Dorrington, 2009). These include variables such as ever given birth, total number of children
born, living with the respondent or elsewhere, number of children born but who have since died (Moultrie and
Dorrington, 2009). These variables can be used to derive fertility indicators (i.e. summary measures) such as
age and sex ratio patterns, average parity, crude birth rate, general fertility rate (GFR), total fertility rate (TFR)
and age-specific fertility rates (ASFR) and their differentials (ibid). Indirect methods applicable include the
reverse-survival method (RSM), Gompertz Relational method, Feeney variant method and other techniques
with data items in NIDS.
6.2 Strengths and weaknesses
The NIDS project has the benefit of addressing (measuring) the issue of social stability and exclusions
(Woolard et al., 2010). It also has the ability of revealing fertility dynamics, including the structure and changes
in the living conditions and well-being of households and household members in the country (ibid). The data
is current and available up to 2017 and as such, appropriate for comparative fertility studies and in the study
with regard to trends and patterns. It also has the provision of being calibrated and adjusted to Stats SA
(Census 2011) boundary changes. As a panel study, the NIDS data is particularly important for monitoring and

STATISTICS SOUTH AFRICA 10
Alternative Sources of Demographic Data (Report 03-00-17)
evaluation purposes, in addition to providing some scope for dealing with unobserved heterogeneity
(Wooldridge, 2002; Woolard et al., 2010).
Disadvantages are that the data may have sampling design issues and that wave one has a non-response
rate of 31%, which may introduce some level of biasedness and quality concerns. Analysis of the NIDS data
at provincial level is not recommended due to sampling issues, i.e. non-representative of samples at the
provincial levels (Woolard et al., 2010).
6.3 Quality of the data
Data quality issues that arose were mitigated in the data collection process; for instance, individual-level non-
response call backs were conducted by SALDRU in an attempt to contact all individual-level refusals to confirm
this refusal and attempt to overturn it; where refusal was overturned these would be returned to the field
company for re-interview.
For item non-response, the use of CAPI radically reduces the instances of interviewer-induced item non-
response because CAPI automates the skip pattern for the interviewer and prompts them if a question in each
section of the questionnaire has been left blank. Since this was the first trial run with CAPI, a cautious approach
was taken and data was accepted from the field if all sections were more than 50% complete. Any instruments
submitted as finished from the field that had more than 50% of data missing were returned to the field for
completion. With regard to CAPI consistency checks, the CAPI system had a range of questionnaire
consistency checks such as feasible height-weight ratios, birth rates, age versus date of birth, etc. In addition,
cross questionnaire checks were also built in such as cross checks between the roster data and individual
questionnaires (for example consistency between children on the roster and the birth details given by a mother.
For further reading, refer to NIDS, 2013).
6.4 Some fertility research papers on fertility using NIDS data
1. Teenage Childbearing and Educational Attainment in South Africa (Moultrie and Timaeus, 2015).
2. The fertility transition in South Africa: A retrospective panel data analysis (Burger and Rossouw, 2012).
3. A dynamic analysis of maternal fertility choices and child health in South Africa (Abieyuwa et al., 2020).
7. Administrative records
7.1 Antenatal care data (ANC records)
Basic antenatal care (BANC) is an approach that is used in the public health institutions of South Africa to
provide healthcare services to pregnant women according to the National Department of Health (NDoH). The
BANC approach was introduced as a quality improvement strategy based on the belief that good quality
antenatal care (ANC) could reduce maternal and perinatal mortalities and improve maternal health aiming to
achieve Millennium Development Goals 4 and 5
(www.open.edu/openlearnworks/mod/oucontent/view.php).

STATISTICS SOUTH AFRICA 11
Alternative Sources of Demographic Data (Report 03-00-17)
In 2010, the South African Department of Health introduced the new standardised maternity case record as
one of the key interventions to improve the care of pregnant women. It is meant to provide a comprehensive
record that will be used uniformly and fill the gaps that were evident in the previously used documents
(Department of Health, 2010).
All pregnant women that present to a healthcare facility, public or private, should have, or should receive, a
maternity case record (MCR). This standardised national document is the principal record of the pregnancy
and it must be completed at each antenatal clinic visit and retained by the mother until delivery, after which it
will be kept at the place of confinement or final referral (Department of Health, 2015).
The questions that establish the past obstetric history of a woman are as follows:
How many times have you been pregnant? Ask specifically about miscarriages and ectopic pregnancies.
How many children do you have? This can bring to light the fact that she has had twins.
How many children do you have who are still alive? If a child has died, one needs to know approximately
at what age the child died, and the cause of death.
From the second and third questions, one can be able to estimate ASFR, crude birth rates and total children
ever born (TCEB). The questionnaire includes some socio-economic indicators that will also measure the
interrelationship between social behaviour and the outcome of the pregnancy.
7.2 Strengths and weaknesses
The statistics compiled from various administrative processes can be very valuable to the overall national
statistical system. Many social statistics are produced as a by-product of these administrative processes; for
example, education statistics from periodic reports by the ministry of education, health statistics from periodic
reports based on hospital records, employment statistics compiled from employment extension services, and
so forth.
Some of the disadvantages of administrative records are that they are often limited in content and their uses
are restricted for legal or administrative purposes. Similarly, they do not usually have the adaptability of
household surveys or censuses from the standpoint of concepts or subject detail. Sources of this kind are often
incomplete, inconsistent or limited in their coverage, and in many fields, such as health conditions, nutrition or
household expenditures, appropriate administrative records are not available. Also, administrative records
often focus on the individual and do not provide any information on the household or family, limiting the
analytical usefulness of the data (Sam Suharto, 2008).
7.3 Quality of data based on previous studies
An appraisal of the MCR in improving the quality of antenatal care was conducted in eThekwini District,
KwaZulu-Natal (Sibiya et al., 2015). Its aim was to assess the use of maternity case records in improving the
quality of the antenatal care. The objectives were to describe the midwife's documentation and the use of the
new MCR and to explore the views of the midwives with regard to the new maternity case record cards.
STATISTICS SOUTH AFRICA 12
Alternative Sources of Demographic Data (Report 03-00-17)
The main conclusion of the findings was that the records were not user-friendly. About 99% of the midwives
believed that many mistakes and mismagement of the ANC clients emamante from the structure and the
design of the form. They aluded that the card was complex with too many small boxes to complete and that
caused confusion, inaccurate and incomplete information. Regardless of the gap to be filled in, communication
between managers, doctors, supervisors and midwives is a call for concern to improve the quality of data.
The study of evidence with regard to the application of basic antenatal care principles of good care and
guidelines in pregnant women's antenatal care records (Ngxongo et al., 2016) indicated incomplete application
of the BANC principles of good care and guidelines in pregnant women's antenatal care records, which
indicated that the BANC approach was not being successfully implemented. The aim of the study was to
analyse pregnant women's ANC records for evidence suggesting that the BANC principles of good care and
guidelines were being applied.
The other study which explored the the reliability of hand-written and computerised records of birth data
collected at Baragwanath Hospital in Soweto established data from hand-written documents was almost similar
to that of captured data in the computer, that records of birth data within different sections of the obstetric and
neonatal files were often incomplete, and occasionally unreliable. Substantial under-recording of information
is probably inevitable within the huge obstetric files currently used at Baragwanath Hospital (Ellison et al.,
2007). Medical staff tend to become frustrated and demotivated with hospital files that are too detailed and
over-ambitious, losing confidence in the clinical utility of the data they collect (Essén et al.,1994), with a sense
that data-collection is "a task imposed by others for often unspecified reasons (MacIntyre, 1978). This
demotivation creates a vicious circle whereby data falls into disuse because of incompleteness and inaccuracy,
and once the potential users have lost confidence, little investment is made in trying to keep standards up
(Cleary et al., 1994).
7.4 Some studies that use ANC fertility and health reproductive data
1. Attendance at antenatal clinics in inner-city Johannesburg, South Africa and its associations with birth
outcomes: analysis of data from birth registers at three facilities (Gumede, S., Black, V., Naidoo, N. et
al., 2017).
2. Determinants of late antenatal care presentation in rural and peri-urban communities in South Africa: A
cross-sectional study (Ebonwu et al., 2018).

STATISTICS SOUTH AFRICA 13
Alternative Sources of Demographic Data (Report 03-00-17)
8. District Health Management Information System (DHMIS)
8.1 Overview
Established in 1996/97 and extended in 2001, the District Health Management Information System (DHMIS)
is a comprehensive national health information system designed to generate essential data for health service
planning, monitoring and reporting (Williamson et al., 2001; Garrib et al., 2008; DHMIS, 2011). It is a system
designed to combine health statistics from various sources and track health service delivery at sub-district,
district, provincial and national levels (ibid). The DHMIS is a project designed with the aim of building on
existing data quality, improve standards, and add to health infrastructure in South Africa (Williamson et al.,
2001; DHMIS, 2011).
8.2 Strengths and weaknesses
The DHMIS data is collected and updated on a continuous and systematic basis over the years, and as such
it provides reliable and real-time data used for planning, monitoring and evaluation at all levels of health and
reproductive sectors in the country.
Weaknesses of the data include issues such as compromised data quality, data flow bottlenecks, little analysis,
interpretation and sub-optimal use of available data and information, i.e. low data utilisation (Garrib et al., 2008;
DHMIS, 2011). Other challenges include lack of standardisation, limited alignment between the goals and
objectives of the health sector, inadequate involvement of competent programme managers at district,
provincial and national levels in data validation, analysis, reporting, feedbacks, etc., leading to unreliability of
data and indicators (ibid). There is also a lack of high-level technical expertise needed in providing public
health intelligence information and to systematically evaluate and assess the impact of the project on health
service delivery in the country (Garrib et al., 2008).
8.3 Quality of data
The development and implementation of essential datasets and standardisation of data collection procedures
and practices across regional and district levels does not necessarily guarantee the output of quality indicators
for measuring health system performance (Abouzahr et al., 2007; Mate et al., 2009). Effective monitoring and
evaluation of healthcare outcomes depends on complete, accurate and reliable data submitted timeously
between the various reporting levels in the healthcare system.
Despite the availability of data validation and verification mechanisms within the DHIS software to ensure
internal data quality and integrity, poor data quality has been consistently reported by users of routine health
information in South Africa (Williamson and Stoops, 2001; Garrieb et al., 2008; Mate et al., 2009). Lippeveld
et al. (2000) described four dimensions of assessing data quality in relation to routine health information
systems: relevance, completeness, timeliness, and accuracy. The assessment of data extracted from the DHIS
revealed significant failures in meeting one or more of these dimensions (RHINO, 2003; Chaulagai et al., 2005;
Mate et al., 2009; Rohde et al., 2008).

STATISTICS SOUTH AFRICA 14
Alternative Sources of Demographic Data (Report 03-00-17)
The data included variables around the number of pregnancies and visits made by patients, and the number
of deliveries (births) that had been conducted (Van den Bergh, 2009). Therefore, these variables can be used
to generate fertility related indicators such as birth and pregnancy related rates.
8.4 Some of the research studies that used DHMIS data
1. Using Health Management Information Systems Data to Contextualize Survey-based Estimates of
Fertility, Mortality (Mallick et al., 2020).
2. Developing a District Health Information System in South Africa: a social process or technical solution
(Williamson, L., Stoops, N. and Heywood, A.B., 2001).
9. Church registers
A noteworthy but rarely used additional option for collecting more accurate data on individual level concerning
births, marriages, deaths and migration is offered by parish registers of the African Christian churches. From
the point of view of historical demography, the most important group of records is composed of parish registers
which are often located in African local parishes. Despite the fact that possibilities offered by parish registers
for historical demography in Africa have become well known, there has been no rush to the parish register.
Currently, the use of parish registers as a source of data in Africa is quite exceptional due to its weaknesses
(Siiskonen et al., 2005). In South Africa, there are some churches that still have the parish register and which
can be accessed from the various websites; for instance, the Anglican Church of Southern Africa has a
database from 1801 to 2004 (https://FamilySearch.org).
Data items in the baptismal records include the following:
Date and place of baptism
Child's name and gender
Child's date and place of birth
Parents' names and their residence
Occupation of father
Names of the witnesses
By whom the baptism was performed
According to Riikka et al. (2005), fertility variables from parish registers can produce age-specific fertility
rates (ASFR), marital age-specific fertility rates (MASFR), and total marital fertility rates (TMFR). In South
Africa the data items provided on the baptism form will only permit to compute ASFRs.
9.1 Weaknesses
In South Africa, there is no central archive or registry for the recording of baptisms; each church has its own
repository of data on baptisms, and not all the denominations in the census data keep the records of baptism.
The study by Thestrup on methodological problems of family reconstitution in a Danish rural parish before
1800 outlined the following issues of parish data as follows:

STATISTICS SOUTH AFRICA 15
Alternative Sources of Demographic Data (Report 03-00-17)
1. Under-registration, which means that some of the information about births and deaths in the selected
families is missing. Consequently, fertility and mortality will be computed too low. Under-registration will,
for instance, occur if any of the offspring born to the families studied is not entered in the parish registers.
If children die before having been baptised in the church or presented there after baptism at home, a
traditional demographic study would count them among the deaths but not among the births.
2. Inadequate sampling due to families proving impossible to trace occurs when not all those families which
it is desired to include in the study can be brought into it because some of the data required for
computation is not available for all families. Also, since the samples are not obtained in a manner
conforming to the rules of random sampling, it is impossible to estimate the margin of error due to the
extrapolation of results from the sample to the parish as a whole.
9.2 Research studies from parish registers
1. Fertility decline in North-Central Namibia: An assessment of fertility in the period 1960-2000 based on
parish registers (Shemeikka et al., 2002).
10. Conclusion
From the study, it is apparent that in the absence of census fertility data, VRS, NIDS are the only sources of
data that can produce all conventional rates of fertility since they have all the data items required for the
computation of these rates.
Even though the organisation is moving to big data and supporting its vision of informing the nation through
the data ecosystem, the calculation of fertility rates from other data sources requires data from censuses or
surveys. Fertility rates using VRS data would need survey or census data as the denominator. Further, the
methods that are employed to measure completeness of birth registration use both VRS data and census data.
One other notable point is that for fertility data assessment, one source should be compared with another
source; therefore, all data sources are important for the measurement of fertility. The process of identifying
households for the Health and Demographic Surveillance System (HDSS) starts with a baseline.

STATISTICS SOUTH AFRICA 16
Alternative Sources of Demographic Data (Report 03-00-17)
References
Abieyuwa, Ohonba, Nicholas Ngepah, and Beatrice D Simo-Kengne (2020). "A dynamic analysis of maternal
fertility choices and child health in South Africa." The Journal of Developing Areas 54, no. 3 (2020).
AbouZahr C, Adjei S, Kanchanachitra C. (2007). "From data to policy: good practices and cautionary tales".
Lancet. 2007; 369(9566):1039–46
Anderson and Kolk (2012). "Trends in Childbearing, Marriage and Divorce in Sweden: An Update with Data
up to 2012". Stockholm University Demography Unit, Sweden Stockholm University SIMSAM Node for
Demographic Research, Sweden.
Berhane Y., Wall, S. et al. (1999). "Establishing an epidemiological field laboratory in rural areas—potentials
for public health research and interventions". The Butajira Rural Health Programme 1987–99. Ethiopian
Journal of Health Development 13 (special issue):1–47.
Binka et al. (2007). "Rapid achievement of the child survival millennium development goal: evidence from the
Navrongo experiment in Northern Ghana". Tropical Medicine and International Health. Volume 12 no 5 pp 57
8–583 may 2007.
Biney, E. et al. (2021). Patterns of fertility in contemporary South Africa: Prevalence and associated factors,
Cogent Social Sciences, 7:1.
Brophy, T., Branson, N., Daniels, R.C., Leibbrandt, M., Mlatsheni, C., & Woolard, I., (2018). "National Income
Dynamics Study panel user manual". Release 2018. Version 1. Cape Town: Southern Africa Labour and
Development Research Unit, 2018.
Burger, R. P and Rossouw, L. (2012). "The fertility transition in South Africa: A retrospective panel data
analysis". Development Southern Africa, 29, 738–755
Camlin, Garenne and Moultrie (2004). "Fertility Trend and Pattern in a Rural Area of South Africa in the Context
of HIV/AIDS". African Journal of Reproductive Health 8(2):38-54. DOI: 10.2307/3583176.
Cleary, R., Beard, R.W., Coles, J., Devlin, E.L.E., Hopkins, A., Roberts. S., Schumacher, D., Wickings, H.I.
(1994). “The quality of routinely collected maternity data”. British Journal of Obstetrics and Gynaecology. 1994;
101:1042–1047.
Croft, Trevor N., Aileen M. J. Marshall, Courtney K. Allen, et al. (2018). "Guide to DHS Statistics". Rockville,
Maryland, USA: ICF.
Department of health (2015). “Guideline for maternity care in South Africa, A manual for clinics, community
health centres and district hospitals”. National Department of Health, Republic of South Africa. Fourth edition,
2015.
Department of Health (2010). Maternity Case Record Guidelines. Pretoria: Department of Health
District Health Management Information System (DHMIS) (2011). "A Long and Healthy Life for all South
Africans". District Health Management Information System (DHMIS) Policy. Department of Health, 2011.
STATISTICS SOUTH AFRICA 17
Alternative Sources of Demographic Data (Report 03-00-17)
Ebonwu, J., Mumbauer, A., Uys, M., Wainberg. M.L., Medina-Marino, A. (2018). "Determinants of late
antenatal carepresentation in rural and peri-urban communities in South Africa: A cross-sectional study".
Public Library of Science (PLoS One). 2018; 13(3):1–16.
Ellison, G.T., Richter, L.M., de Wet, T., et al. (1997). “The reliability of hand-written and computerised records
of birth data collected at Baragwanath hospital in Soweto”. Curationis. 1997 Mar;20(1):36-40.
Essén, B., Laurell, L., Peña, R., Östergeren, P., Liljestrand, J. (1994). “Antenatal cards - What should they
contain”. Journal of Tropical Paediatrics. 1994; 40:130–132.
Garrib, A., Stoops, N., McKenzie, A., Dlamini, L., Govender, T., et al. (2008). "An evaluation of the District
Health Information System in rural South Africa". South Africa Medical Journal Jul;98(7): 549–52.
Gumede, S., Black, V., Naidoo, N. et al. (2017). "Attendance at antenatal clinics in inner-city Johannesburg,
South Africa and its associations with birth outcomes: analysis of data from birth registers at three facilities".
BMC Public Health 17, 443 (2017). https://doi.org/10.1186/s12889-017-4347-z
International Network for the continuous Demographic Evaluation of Populations and their Health (INDEPTH
Network) (2002). "Population and health in developing countries". Volume 1. Population, health, and survival
at INDEPTH sites.
Kahn, K., Tollman, S.M., Collinson, M.A., Clark, S.J., Twine, R., Clark B.D., Shabangu M. Mez-Olive, F.X.,
Mokoena, O. and Garrene, M. (2007). “Research into health, population and social transitions in rural South
Africa: Data and methods of the Agincourt Health and Demographic Surveillance System1”. Scandinavian
Journal of Public Health, 2007; 35(Suppl 69): 8–20
Kabudula, C.W., Houle, B., Collinson, M.A. et al. (2017). "Progression of the epidemiological transition in a
rural South African setting: findings from population surveillance in Agincourt, 1993–2013". BMC Public Health
17, 424 (2017). https://doi.org/10.1186/s12889-017-4312-x
Lippeveld, T., Sauerborn, R., Bodart, C. (eds). (2000). "Design and implementation of health information
systems. Geneva": World Health Organization, 2000.
Mallick Lindsay, Gheda Temsah, Sorrel Namaste, Trinadh Dontamsetti, and Wenjuan Wang (2020). "Using
Health Management Information Systems Data to Contextualize Survey-based Estimates of Fertility, Mortality,
and Wasting". DHS Occasional Paper No. 12. Rockville, Maryland, USA: ICF.
Mate, K.S., Bennett, B., Mphatswe, W., Barker, P., Rollins, N. (2009). "Challenges for Routine Health System
Data Management in a Large Public Programme to Prevent Mother-to-Child HIV Transmission in South Africa".
Public Library of Science (PLoS One). 4(5): e5483. https://doi.org/10.1371/journal.pone.000548.
Moultrie, T. and Dorrington, R. (2009). “Demography: Analysis of the NIDS Wave 1 Dataset. Discussion Paper
No. 9". National Income Dynamic Study (NIDS). Cape Town, South Africa.
Moultrie, T., Dorrington, R.E., Hill, A., Hill, K., Timaeus, I. and Zaba, B. (eds). (2013). "Tools for Demographic
Estimation. Paris": International Union for the Scientific Study of Population.

STATISTICS SOUTH AFRICA 18
Alternative Sources of Demographic Data (Report 03-00-17)
Moultrie, T.A. and Timaeus, I.M. (2015). "Teenage Childbearing and Educational Attainment in South Africa".
Study of Family Planning 2015 Jun; 46(2):143-60. doi: 10.1111/j.1728-4465.2015.00021. x.
National Department of Health (NDoH), Statistics South Africa (Stats SA), South African Medical Research
Council (SAMRC), and ICF. (2018). South Africa Demographic and Health Survey 2016: Key findings. Pretoria,
South Africa, and Rockville, Maryland, USA: NDoH, Stats SA, SAMRC, and ICF.
Ngom, P., Binka, F.N., Phillips, J.F., Pence, B., Macleod, B. (2001). “Demographic surveillance and health
equity in sub-Saharan Africa”. “Health Policy Plan” 2001; 16: 337-44
Ngxongo et al. (2016). "Experiences and views of the pregnant women regarding the Basic Antenatal Care
approach to health care services provision in eThekwini district, KwaZulu-Natal". Journal of Nursing Health
Science. Volume 3, Issue 1, March, 2017
Republic of South Africa (1992). “Births and Deaths Registration Act (Act No. 51 of 1992)”. Pretoria.
Government of South Africa.
Republic of South Africa (2010). “Births and Deaths Registration Amendment Act (Act No. 18 of 2010)”.
Pretoria: Government of South Africa.
Republic of South Africa (2010). “Births and Deaths Registration Act (Act No. 18 of 2010)”. Pretoria.
Government of South Africa.
SAPRIN (2017). South African Population Research Infrastructure Network (SAPRIN). MRC/Wits-Agincourt
Unit. Rural Public Health and Health Transition Research Unit. Sourced from RESEARCH & EVALUATION –
MRC/Wits Agincourt Unit
Seeskin et al. (2018). "Uses of Alternative Data Sources for Public Health Statistics and Policy making:
Challenges and Opportunities". NORC at the University of Chicago, 55 E. Monroe Street, 31st Floor, Chicago,
IL 60603.
Shemeikka, R., Notkola, V. and Siiskonen, H. (2005). "Fertility decline in North-Central Namibia: an
assessment of fertility in the period 1960-2000 based on parish registers". Demographic Research. Vol. 13
(July – December, 2005), pp. 83-116 (36 pages)
Sibiya, M.N., Cele, N.H., & Sokhela, D.G. (2015). "Experiences of homosexual patients' access to primary
health care services in Umlazi, KwaZulu-Natal", Curationis 38(2), Art. #1522, 9 pages.
Siiskonen Harri, Anssi Taskinen, Veijo Notkola (2005). "Parish Registers: A Challenger for African Historical
Demography." History in Africa, 32. In Print.
Somawat, G.S. (1990). "The estimation of fertility from incomplete birth registration data for Indian towns and
cities". Demography India, Vol 19, No. 2 (1990), pp. 219-281.
Southern Africa Labour and Development Research Unit (SALDRU). (2014/15). "National Income Dynamics
Study Wave 4 2014/2015 Adult (15+) Questionnaire", (2014/15.
Southern Africa Labour and Development Research Unit (SALDRU). (2017). "National Income Dynamics
Study 2017, Wave 5 data". Version 1.0.0 Pretoria: Department of Planning, Monitoring and Evaluation.

STATISTICS SOUTH AFRICA 19
Alternative Sources of Demographic Data (Report 03-00-17)
South African Population Research Infrastructure Network (SAPRIN). (2017). "MRC/Wits-Agincourt Unit. Rural
Public Health and Health Transition Research Unit". Sourced from Research & Evaluation – MRC/Wits
Agincourt Unit
Statistics South Africa (Stats SA) (2016). "South Africa demographic and health survey 2016: key indicator
report". Pretoria: National Department of Health; 2016.
Statistics South Africa (2019). “Recorded live births”, Statistical release P0305. Republic of South Africa
Statistics South Africa (2016). "Community Survey 2016”, Statistical release P0301 / Statistics South Africa.
Pretoria: Statistics South Africa, 2016.
Suharto S, (2001). "Complementary Sources of Demographic and Social Statistics", Conference of European
Statisticians Recommendations for the 2020 Censuses of Population and Housing. United Nations of
Economic Commission for Europe, New York and Geneva, 2015.
Thestrup, P. (1972). “Methodological problems of a family reconstitution study in a Danish rural parish before
1800”, Scandinavian Economic History Review, 20:1, 1-26.
United Nations (2014). “Principles and Recommendations for a Vital Statistics System Department of
Economic and Social Affairs Statistics Division Statistical Papers”, Series M No. 19/Rev.3
United Nations (2015). “Recommendations for the 2020 Censuses of Population and Housing, Conference of
the European Statisticians”. United Nations Economic Commission for Europe. New York, Geneva.
United Nations (2004). “Handbook on collection of fertility and mortality data”, Department of Econom ic and
Social Affairs Statistic Division. New York, Geneva.
United Nations Children' Fund (2013). “Every Child's Birth Right: Inequalities and trends in Birth Registration”.
UNICEF, New York.
United Nations (1984). “Handbook of Household Surveys”. Department of International Economic and Social
Affairs. Series F, no. 31. New York, Geneva.
Van den Bergh, C. (2009). "The district health information system (DHIS) as the support mechanism for
strengthening the health care system", University of South Africa, Pretoria,
Wamukoya, M., Ezeh, A. Ye, Y., et al. (2012). "Health and demographic surveillance systems: a step towards
full civil registration and vital statistics system in sub-Sahara Africa?" BMC Public Health 12, 741 (2012).
Williamson, L., Stoops, N. and Heywood, A.B. (2001). "Developing a District Health Information System in
South Africa: a social process or technical solution?" Studies in Health Technology and Informatics 84(Pt
1):773-7.
Woolard, I., Leibbrandt, M. & De Villiers, L., (2010). "The South African national income dynamics study:
Design and methodological issues". Journal for the Study of Economics and Econometrics 34(3), 7–24. Dec.,
2010.
Wooldridge J.M. (2002). "Econometric Analysis of Cross Section and Panel Data". MIT Press, Cambridge, MA.

CHAPTER 2: MORTALITY
STATISTICS SOUTH AFRICA 21
Alternative Sources of Demographic Data (Report 03-00-17)
1. Introduction
The adoption of the 2030 Agenda for Sustainable Development and its call to 'leave no one behind' are creating
an unprecedented demand for good quality, comparable and timely data on a broad range of policy fields.
According to Boerma (2018), the "final assessment of country-level progress in global health achieved between
2000 and 2015 were often based on sparse or outdated data, leading to misplaced confidence in the results".
Reliance on outdated data leads to biasness in conclusions made and less relevant policy interventions.
Therefore, data producers and data sources are faced with the challenge of providing relevant data for effective
development planning. This chapter therefore looks at the alternative sources available that can be used to
provide statistics on overall mortality, morbidity and health status. The chapter is based on the premise that
these less often used sources are valuable to complement and triangulate the most traditional sources of
mortality to provide current statistics on mortality for monitoring progress on development targets and health
planning in South Africa.
1.1 Rationale
Statistics South Africa is the main government department responsible for collecting official national data on
mortality through censuses, surveys and administrative records. Mortality is an important component of
demographic change and a critical measure of a population's health and public health systems (McKerrow and
Mulaudzi, 2010; Mathers and Boerma, 2010; Stats SA, 2015); reliable mortality statistics are the cornerstone
of national health information systems, and are necessary for population health assessment, health policy and
service planning; and programme evaluation. They are essential for studying the occurrence and distribution
of health-related events, their determinants and management of related health problems. Mortality data is
particularly critical for monitoring the National Development Plan, Sustainable Development Goals (SDGs) and
Agenda 2063, which share the same goal for a high standard of living and quality of life, sound health and
well-being for all and at all ages (African Union Commission, 2015; United Nations, 2017). Mortality statistics
are also required for assessing the impact of emerging infectious diseases such as COVID 19. The report is
critical as it provides traditional and alternative sources of mortality data that can be useful in the estimation of
the levels and patterns of mortality in South Africa.
1.2 Data gaps
Data gaps across the African continent threaten the achievement of the Sustainable Development Goals and
the African Union's Agenda 2063 – this is according to the Mo Ibrahim Foundation's Africa Governance Report
for 2019. The report found that almost half of the 255 targets of the AU's agenda are not directly quantifiable.
In South Africa, due to challenges around completeness, it is often difficult to produce mortality indicators at
lower levels of geography and to disaggregate indicators by some socio-economic variables, given their
complexities. The use of mobile phones and geospatial information also has shown promising signs that these
technologies can help to bridge data gaps, according to the report. But to really harness this, "the production
of data needs to be more agile and adaptable to user needs".

STATISTICS SOUTH AFRICA 22
Alternative Sources of Demographic Data (Report 03-00-17)
2. Traditional sources of data on mortality
2.1 Civil registration and vital statistics system
Civil registration is defined as the continuous, permanent, compulsory, universal recording of the occurrence
and characteristics of vital events pertaining to the population, as provided through decree or regulation in
accordance with the legal requirements in each country, with full respect for the rules regulating the protection
and privacy of individual information (United Nations, 2018). South Africa has had an inclusive vital registration
of mortality data from 1997 and the collection of this information is continuous (Stats SA, 2015). The continuous
production of mortality statistics is made possible through provision of registered administrative death records
from the efficient, high-coverage civil registration system (Stats SA, 2017). The Department of Home Affairs
(DHA) is the overseer of the civil registration system, inclusive of administrative records. The registered deaths
and administrative records from DHA are the exclusive data sources used for the production of statistics on
mortality and causes of death in South Africa. In the process of compiling the report on causes of death, all
death notification forms are collected by Statistics South Africa (Stats SA) from DHA bi-weekly for capturing,
processing, assessment, analysis and dissemination of the statistical reports and datasets on mortality and
causes of death.
Stats SA is mandated by the Statistics Act (Act No. 6 of 1999) to provide reliable information on the levels and
causes of mortality through the application of appropriate quality criteria and standards, classifications and
procedures for vital statistics (Republic of South Africa, 1999). Although still not complete – a feature in most
developing countries – South Africa's vital registration data has a relatively high coverage. If deaths were
complete, then direct estimation of mortality would be used. However, for sub-Saharan Africa, with the
exception of South Africa, there is a long way to go in order to achieve complete or at least usable CRVS data
(UNECA, 2017). Ninety per cent is considered complete (UN, 2014) and for the purposes of the SDG, the
target is 80 per cent completeness for deaths by 2030. For demographers, mortality data that is at least 60 per
cent complete is usable, applying an adjustment factor for the missing data (Preston, 1984). In the 2015
statistical release (Stats SA, 2017), an estimated 96% of total adult deaths (15 years and older) completeness
level was reported for the 2011–2016 intercensal/survey period. Male adults had a completeness level of 97%,
which was higher than the adult female completeness level of 95%. Estimates for the 2017 deaths
completeness level remained the same, and a revised estimate will be provided when new population data is
available (Stats SA, 2017).

STATISTICS SOUTH AFRICA 23
Alternative Sources of Demographic Data (Report 03-00-17)
2.2 Population census
A population census, as defined by the United Nations principles and recommendations for official statistics,
is "the total process of collecting, compiling, evaluating, analysing and publishing and disseminating
demographic, economic and social data pertaining, at a specified time, to all persons in a country or a well-
defined part of the country". In South Africa, Statistics South Africa, as mandated by the Stats Act of 1999,
conducts a census. Historically, the census took place at a 5-year interval (1996 and 2001), but this has been
extended to a 10-year interval. The next census will be conducted in 2021 and this will be through digital data
collection methods.
The censuses of 2001 and 2011 collected mortality data using the main questionnaire (household
questionnaire mortality module) administered to the household proxy. Questions included age and sex of the
deceased, whether death is natural or non-natural and, for women of reproductive age, whether the respective
death was pregnancy-related (deceased died during pregnancy, while giving birth or within six weeks of giving
birth). These questions are used to calculate age-specific deaths in general and to allow estimation of mortality
for specific indicators: Infant mortality rate, under-5 mortality rate, life expectancies at birth and at age 60 years,
probabilities of dying in adulthood, and maternal mortality. Population censuses have also proven to be a more
useful source of infant and under-5 mortality estimates based on the Brass questions of children ever born
alive and surviving (Reniers et al., 2016 in Stats SA, 2015). The 1996, 2001 and 2011 censuses included
questions on the survival status of parents for all members of the household. These questions were used in
the estimation of adult mortality and orphanhood in the country.
Census data in South Africa has been used for estimating childhood and adult mortality (Johnson et al., 2017;
Stanton, Hobcraft et al., 2001; Udjo and Lalthapersad-Pillay, 2014; Stats SA, 2015; Stats SA, 2018). Sampling
or other random errors that are inherent with sample surveys are eliminated or greatly reduced with a census
(Stanton, Hobcraft et al., 2001). Although the mainly quinquennial or decennial census adequately capture
trends (Stanton, Hobcraft et al., 2001), they may not be adequate for regular monitoring required for global
and national agendas. Censuses also do not provide cause of death and, if at all, these are only classified into
natural and non-natural causes (Stats SA, 2018).
There are also data problems regarding censuses as detailed by Dorrington, Moultrie et al. (2004) and
Statistics South Africa (2014; 2015). These emanate in part from difficulties in identifying the appropriate
respondent to report adult deaths. This is in contrast to child deaths where respondents are mainly mothers or
caregivers. This is because households are likely to be dissolved at the death of an adult household member,
in particular, the head of the household, largely because of the challenge to the continued economic viability
of these households (UN, 2004). The other limitation is that because mortality in general is a rare event, and
therefore located in a small fraction of households, fieldworkers may in the process stop asking the questions,
thereby potentially omitting deaths (Blacker, 1977; Timaeus, 1991). There is also the problem of the reference
period – where individuals who died before the reference period can be erroneously included or those who
died earlier in the reference period are excluded, but the two can potentially null each other. Due to validations
in-built in CAPI, these challenges maybe eliminated in the upcoming digital census for 2021.
STATISTICS SOUTH AFRICA 24
Alternative Sources of Demographic Data (Report 03-00-17)
2.3 Community surveys
The Community Survey (CS) is a large-scale household survey conducted by Statistics South Africa to bridge
the gap between censuses. Statistics South Africa conducted its first Community Survey in 2007 and the last
Community Survey was conducted in 2016. This time around, the data was collected electronically using the
Computer-assisted Personal Interviewing (CAPI) system as opposed to the paper collection method used in
CS 2007. The main objective of the CS is to provide population and household statistics at municipal level to
government and the private sector, to support planning and decision-making.
The Community Survey asked the same questions regarding deaths in the household as the 2001 and 2011
census questionnaire. The 2007 CS included the summary birth history questions. Initial attempts to produce
infant and child mortality rates from this data produced implausible results (showing an upward trend when
other data had indicated that mortality was falling, and higher rates for girls than boys). However, after
removing the responses of women from whom the data on numbers of births and deaths was inconsistent (i.e.
the total not equalling the sum of the parts), it was possible to produce more sensible results at provincial and
national levels (Darikwa and Dorrington, 2011).
An analysis by Udjo (2017) titled "Evaluating and estimating demographic indicators from the 2016 South
African community survey" indicates that the demographic indicators of childhood mortality based on reports
of children dead of children ever born underestimate the level of childhood mortality in the South African
population. Combining children dead of children ever born with orphanhood reports from the survey did not
produce plausible estimates of childhood mortality either. Estimated completeness of reporting of deaths in
households ranged between 55,7% for males, and 49,3% for females (Udjo, 2019).
2.4 South Africa Demographic and Health Surveys (DHS)
Demographic and Health Surveys (DHS) are nationally representative household surveys that provide data for
a wide range of monitoring and impact evaluation indicators in the areas of population, health, and nutrition
(https://dhsprogram.com/Methodology/Survey-Types/DHS.cfm Accessed 16/11/2020). DHS in South Africa
include the 1998 and 2016 SA Demographic and Health Survey (DHS). The 2003 DHS is not in the public
domain because of issues of quality raised with some indicators (Department of Health, MRC et al., 2007). On
mortality, the woman's questionnaire was used to collect information from all eligible women aged 15 years
and older in all households. Eligible women aged 15–49 were asked questions on topics such as birth history,
child mortality, and adult and pregnancy-related mortality. Information on infant and child mortality was
collected as part of a retrospective birth history in which female respondents listed all the children to whom
they had given birth along with each child's date of birth, survivorship status, and current age or age at death.
The quality of mortality estimates calculated from birth histories depends on the mother's ability to recall all the
children she has given birth to, as well as their birth dates and age at death.

STATISTICS SOUTH AFRICA 25
Alternative Sources of Demographic Data (Report 03-00-17)
Potential data quality problems on infant and child mortality include:
The selective omission from birth histories of those births that did not survive, which can result in
underestimation of childhood mortality.
The displacement of birth dates, which may distort mortality trends. This can occur if an interviewer
knowingly records a birth as occurring in a different year than the one in which it occurred. This may happen
if an interviewer is trying to cut down on his or her overall workload, because live births occurring during
the 5 years before the interview are the subject of a lengthy set of additional questions.
The quality of reporting of age at death. Misreporting the child's age at death may distort the age pattern of
mortality, especially if the net effect of the age misreporting is to transfer deaths from one age bracket to
another.
Any method of measuring childhood mortality that relies on the mothers' reports (e.g. birth histories)
assumes that female adult mortality is not high or, if it is high, that there is little or no correlation between
the mortality of the mother and that of her children. These assumptions may not hold in countries such as
South Africa with severe HIV epidemics (see Chapter 13 of the South Africa Demographic and Health
Surveys, 2016 report), and the resulting childhood mortality rates will be underreported to some degree,
particularly for the period 10–15 years prior to the survey, before the large-scale roll-out of antiretroviral
treatment.
Two methods are generally used to estimate maternal mortality in developing countries from household
surveys: the indirect sisterhood method (Graham et al., 1989) and a direct variant of the sisterhood method
(Rutenberg and Sullivan, 1991; Stanton et al., 1997). In the SADHS 2016, the direct variant of the sisterhood
method was employed to estimate both adult and maternal mortality from the reports of adult women on the
survival status of their siblings.
2.5 South African National HIV Prevalence, Incidence and Behaviour Surveys
The Human Science Research Council (HSRC) has also included sibling histories and parental survivorship
questions in its panel of the cross-sectional South African National HIV, Behaviour and Health Surveys.
Findings indicate that the prevalence of orphanhood among children has been exacerbated by deaths
associated with AIDS and TB, especially in countries like South Africa, which has a high prevalence of both
diseases (HSRC, 2019). The largest subgroup of orphans were paternal orphans, which is consistent with
census and survey data.
2.6 National Income Dynamics Study (NIDS) panel data
The NIDS programme commenced in 2008 with ongoing surveys conducted biannually; this is the country's
first nationally representative panel survey. The National Income Dynamics Study (NIDS) collects information
on household deaths in the last 24 months. Although large adult mortality from NIDS data meets expectations
(Moultrie and Dorrington, 2009), there is the problem of attrition, which is characteristic of panel data and has
the potential to deplete the sample which needs to be continually addressed. Furthermore, the sampling
strategy and study design was not designed for subnational level estimations (Woolard, Leibbrandt et al.,
2010). The limitation regarding the limited coverage and exclusion of other sections of society highlighted
earlier also applies to these surveys.
STATISTICS SOUTH AFRICA 26
Alternative Sources of Demographic Data (Report 03-00-17)
3. Alternative data sources and their potential contributions in complementing existing mortality sources
The global demand for more and better data and statistics has increased greatly, with international agreements
like the 2030 Agenda for Sustainable Development placing a demand on countries to collect, analyse and
produce data on more than 230 indicators. The 2030 Agenda's 17 Sustainable Development Goals (SDGs)
and its ambitious promise to "leave no one behind" requires concerted and sustained actions to overcome the
existing data and capacity gaps. A growing demand for data and statistics and a rapidly expanding landscape
of data producers and users call for a redefined understanding of capacity development for data (Cázarez-
Gragedaa, 2019). This section presents additional data sources that statistics South Africa can make use of
to support the collection and/or estimation of statistics on mortality.
3.1 Health and Demographic Surveillance System (HDSS)
The Health and Demographic Surveillance System is a longitudinal data collection process that captures vital
demographic events of birth, death, migration and socio-economic characteristics of households, population
health, pregnancy outcomes and disease outbreaks within a geographically defined population. Many HDSS
constitute an element of specific disease surveillance, which is necessary for health intervention and mortality
reduction in high mortality countries (Cunningham et al., 2019; Dowell et al., 2019). Amongst others,
continuous observation of the population assists in identifying the needs, including health needs of people
under surveillance and programmes suitable to meet their needs. As Ye and others (2012) allude, well located
DHSS in both rural and urban regions can be used to give a better picture of the state of the health and
demographic dynamics of a country.
In South Africa, there are three well established Health and Demographic Surveillance System (HDSS) sites:
The Africa Centre HDSS in KwaZulu-Natal, Agincourt HDSS in Mpumalanga and DIMAMO HDSS in Limpopo.
Two more HDSS have recently been set up, namely Gauteng Research Triangle Initiative for the Study of
Population, Infrastructure and Regional Economic Development (GRT-INSPIRED) in Hillbrow, Johannesburg,
and Atteridgeville and Melusi, Tshwane in Gauteng, and Cape Town Surveillance through Healthcare Action
Research Project (C-SHARP) in Nomzamo and Bishop Lavis, Cape Town in the Western Cape.
These HDSS sites are part of the INDEPTH global network that conduct regular censuses and collect
information on vital events of individuals within the confines of the demographic surveillance sites.
3.1.1 Agincourt HDSS
Agincourt had its first baseline census in 1992 with only four enumerations between 1992 and 1998, but has
been conducting annual updates from 1999 to date. Similar to other projects, enumeration involves the
collection of vital events of birth, death, migration (in and out), resident status, household relationships,
educational characteristics, and antenatal and delivery health-seeking behaviours. In the case of a death,
verbal autopsies are conducted within a period of 1 to 11 months with the closest person to the deceased at
the time of death (Kabudula et al., 2017). Two medical doctors independently assign the most probable cause

STATISTICS SOUTH AFRICA 27
Alternative Sources of Demographic Data (Report 03-00-17)
of death. When conclusions differ and the doctors fail to reach consensus on the cause of death, a third
physician is brought to perform a blind assessment. In terms of quality, a repeat enumeration of a random
sample of households is done as a quality control measure, fieldwork self-checks, cross checks and supervisor
random checks are done, after which forms are reviewed by a dedicated quality checker before data can be
captured (Kahn, 2012).
Whilst conclusions from the data are not generalisable, the site gives invaluable information about mortality
dynamics of rural settings. An analysis for the period between 2001 and 2013 that looked at inequalities in
mortality in the era of antiretroviral therapy observed that life expectancy, under-5 mortality, and adult mortality
outcomes were inversely associated with household socio-economic status, with higher levels of mortality at
the lower socio-economic continuum. The same observation holds when looking at combined mortality from
HIV/AIDS and tuberculosis. Further findings reveal that, coupled with the decline in mortality from HIV/Aids, is
the emergence of high prevalence of mortality from non-communicable diseases (Kahn, 2012; Sartorius et al.,
2013), although they are found to have no relationship with the socio-economic status of individuals (Kabudula
et al., 2017).
Data from Agincourt concurs with findings reported by Statistics South Africa (2020), which show that diabetes
mellitus and cerebrovascular diseases were the second and third leading causes of mortality in 2005–2017.
In addition, the overall trend in mortality from the study followed the historical patterns of mortality reported by
Statistics South Africa, where mortality levels were highest around the period 2004 to 2007, and gradually
dropped thereafter.
3.1.2 Africa Health Research Institute Centre
The Africa Health Research Institute Centre is located near Mtubatuba, and was founded in 1997 with the aim
of observing the rapidly progressing HIV epidemic at the time and evaluating interventions to mitigate the
demographic, social and health impact (Tanser et al., 2008). Key units of observation are physical structures
(homesteads, clinics and schools), households and individuals. The University of KwaZulu-Natal granted
ethical approval for the collection of all data. Household data collection is done every six months with a
questionnaire administered to a key informant in the household. On the other hand, the HIV survey is
conducted on an annual basis to eligible individuals. Whilst the participation rate by households is greater than
99%, the HIV survey has seen a decrease in the percentage of individuals who consent to an HIV test.
However, multiple approaches are done to correct the selection bias (Tanser et al., 2008). Amongst other
outcomes observed by the DHSS is parental survival indicator of orphanhood (Mejia-Pailles et al., 2020). In
the period between 2000 and 2005, orphanhood doubled because of HIV/AIDS. For instance, paternal,
maternal and double orphans increased from 9% to 12%, from 3% to 6% and from 1% to 4%, respectively
(Tanser et al., 2008).

STATISTICS SOUTH AFRICA 28
Alternative Sources of Demographic Data (Report 03-00-17)
3.1.3 DIMAMO Population Health Research Centre
The DIMAMO Population Health Research Centre is located in Polokwane, Limpopo, and is a project that was
conceived in 1996 to monitor the changing exposure risk factors to various non-communicable diseases (NCD)
and the associated risk factors which are rapidly increasing as lifestyles change in rural South Africa. Like
other HDSS sites, DIMAMO collects vital demographic events and population health data. In addition to socio-
economic and health care utilisation information collected occasionally, DIMAMO has been able to give an
analysis of mortality and has revealed that the site population was equally affected by HIV/Aids as the rest of
South Africa – especially in the analysis periods of 1996 and 2003. In addition to showing how the population
was impacted by HIV/Aids, the HDSS has presented a high prevalence of cardiovascular diseases, an
observation similar to one found in urban areas (Alberts et al., 2015).
3.1.4 Child Health and Mortality Prevention Surveillance (CHAMPS)
The Child Health and Mortality Prevention Surveillance (CHAMPS) is a surveillance system that was
established as a way of responding to the growing need for good quality data on mortality and morbidity of
children over time, and also as an initial approach towards getting better insights into preventable causes of
death among children under 5 years and towards preventing them (Cunningham et al., 2019; Dowell et al.,
2019; Blau et al., 2019). CHAMPS is a multi-country project and has a site in Thembelihle, Northern Cape and
in Soweto, Gauteng. The core priority of CHAMPS HDSS is to collect demographic information – especially
age and sex and demographic events of births, deaths and migration.
In determining the final cause of death that must be documented for each death case, a combination of
approaches is taken which include a review of the clinical history from the verbal autopsy, relevant clinical
records of those who were hospitalised are accessed and analysed and most essentially, post-mortem
laboratory testing is done to all cases with a secured consent from relevant parties (Dowell et al., 2019). A
verbal autopsy is an interview with a family member about conditions and symptoms related to a death of an
individual. Analysis of this information is done using computer-based algorithms and physician adjudication
panels. To improve the cause of death assignment in high mortality regions and to be as close as an autopsy,
the minimum invasive tissue sampling (MITS) method is being adopted in surveillance sites including South
Africa which presented a high acceptance by parents who lost their infants (Dowell et al., 2019).
Using data on age and sex and person-years lived, the CHAMPS project calculates infant mortality rates,
under-5 mortality rates and stillbirth rates. Secondary to the provision of age, sex and demographic events
data, HDSS provides additional data on their environments, which can determine the health and survival of
children. Such additional data includes socio-economic characteristics of mothers, households and
homesteads and access to healthcare and utilisation. This assists in determining the household and
community context in which mortality occurs and the opportunities for intervention (Cunningham et al., 2019).

STATISTICS SOUTH AFRICA 29
Alternative Sources of Demographic Data (Report 03-00-17)
3.2 National Population Register
The United Nations defines a population register as an individualised data system that is a mechanism of
continuous recording, and/or of coordinated linkage, of selected information pertaining to each member of the
resident population of a country in such a way to provide the possibility of determining up-to-date information
concerning the size and characteristics of that population at selected time intervals (United Nations, 2014).
General characteristics found in the population register include date and place of birth, sex, data and place of
death, date of arrival or departure, citizenship information and marital status (United Nations, 2014). Vital
information recorded in different administrative systems is linked to the population register on a timely and
continuous basis to give the updated information of each individual at each point in time. The linking process
and accuracy of information recorded becomes a critical element of the overall quality of the population register
system. The population register has the capability to produce reliable indicators of life expectancy, amongst
other demographic indicators, if data on the population register and data from civil registration system for
example are fully and successfully matched.
The Medical Research Council (MRC) publishes the Rapid Mortality Surveillance (RMS) report which provides
empirical estimates of the mortality-based high-level indicators for monitoring health and the performance of
the Department of Health since 2012 (MRC, 2019). It provides information to track Outputs 1 and 2 of the
health-related targets of the Negotiated Service Delivery Agreement (NSDA) and health-related targets of the
Medium Term Strategic Framework (MTSF). Deaths registered on the National Population Register by the
Department of Home Affairs are the main data source for the most recent estimates, while earlier estimates of
the maternal mortality ratio and non-communicable disease premature mortality rates are based on adjusted
data from cause-of-death data from Stats SA up to 2016 (being the most recent year for which vital registration
data has been released). The Neonatal Mortality Rate is based on adjusted data from the District Health
Information System (DHIS) up to 2018.
In the context of the emerging COVID-19 pandemic, it has become essential to track the weekly number of
deaths that occur. The MRC uses deaths recorded on the National Population Register, which are provided
by Home Affairs on a weekly basis. These have been scaled up to estimate the actual number of deaths by
accounting for the people who are not on the population register and the under-registration of deaths. The
estimated numbers are compared with the number that would be expected based on the historical data from
2018 and 2019. The number of deaths of persons aged 1 year and older are reported because birth registration
was put on hold during lockdown stage 5, affecting the number of infant deaths recorded on this system.
3.3 Department of Health Management Information System (DHMIS)
The DHMIS is a "system of deriving a combination of health statistics from various sources, mainly from routine
information systems used in the public sector to track health service delivery in sub-districts, districts, provinces
and nationally", including at the health establishment level (DHMIS Policy, 2011: 9).
STATISTICS SOUTH AFRICA 30
Alternative Sources of Demographic Data (Report 03-00-17)
Data from health, complemented by data from censuses and surveys, is an important component of the many
national and sub-national programmes that seek to improve universal healthcare and intervention in morbidity
amongst individuals of all ages (Maïga et al., 2019). Similar to other DHIS in other countries, the system
provides critical routine indicators on causes of death and morbidity patterns in the population using the
healthcare system (Maïga et al., 2019). Maternal health indicators, child health and nutrition, infectious disease
control, and non-communicable diseases case fatality rate are amongst the indicators made available from the
DHMIS.
The District Health Barometer report is making great use of data from the District Health Information System
(DHIS) with the purpose of presenting progress on health and assisting the health system at the lower level to
make informed decisions to improve access and other health elements. The report presents indicators,
amongst others, on neonatal healthcare utilisation, maternal mortality ratio, and neonatal death rate, especially
at the facility level. For instance, 80,8% in antenatal 1st visit coverage was observed in the 2018/19 following
a recent low of 74,8% in 2015/16. This indicator is critical in terms of maternal healthcare; improvements over
time are necessary if South Africa needs to achieve the Sustainable Development Goals. Maternal mortality
in facility ratio as a great indicator of antenatal, intrapartum and postnatal care is shown to be at a decrease
from a high of 144,9 in 2011/12 to 105,9 in 2018/19. At the same time, the neonatal death in facility rate is
declining gradually; it was observed at 12,1 in the 2018/19 period. In terms of infectious diseases, statistics
from DHMIS reveals that the death rate from TB is decreasing and this is due to an increase in treatment
success rate, which stood at 58% in 2016. Whilst TB was the number one leading cause of death over the
period of 2015 to 2017 according to Statistics South Africa (2020), the number of deaths to TB are gradually
declining (Maayn et al., 2020).
Despite the fact that there are many positive aspects of the system, some researchers have looked into the
quality and use of the data by components of the health sector for health service improvement. A baseline
assessment into data quality of 287 Gauteng healthcare facilities and 7 hospitals found that overall, the
facilities are capturing the data as required. However, challenges were documented in terms of over-reporting,
under-reporting, and poor record-keeping and missing data amongst a few of the facilities. Nonetheless,
improvement strategies have yielded positive results in some instances. For example, the initiative to
rationalise the health indicator registers in the facilities produced immediate good results thereafter. Following
the initiative, data was more accurate and complete than the previous months before the rollout (Gauteng
Department of Health, 2015). The study by Garrib and others conducted in 2008 evaluated the district health
information system in 10 facilities of rural KwaZulu-Natal and established that a strong support structure
existed for the system and data was collected timely with high reliability at the facility level. Existing challenges
noted in different sources call for awareness on the usefulness of the data, capacity building in terms of DHMIS,
data analysis and interpretation as one step towards improving data quality at the facility level and use at all
spheres of government (Garrib et al., 2008; Nicol et al., 2017; Farnham, 2020; Maïga et al., 2019).

STATISTICS SOUTH AFRICA 31
Alternative Sources of Demographic Data (Report 03-00-17)
3.4 Sample Registration System (SRS)
The Sample Registration System (SRS) is less prevalent in Africa; it differs from the well-known HDSS in that
the continuous observation is focused not on one specific geographic area but on a nationally representative
sample of population units widespread geographically. The strength of SRS is that it provides birth, death and
infant mortality rates at the lower and higher geographic level and for both rural and urban regions all at once.
India has a well-established SRS that dates back from the 1960s as an interim measure of good quality data.
Today the SRS continues to provide updates of demographic events occurring at the national level.
In India, for instance, a dual recording system is adopted for quality assurance, and recall bias in the whole
process of surveillance is minimised. First an enumerator who is a resident of the sampled population keeps
record of all vital birth, death and migration events happening all year round at the sampled population by
visiting the sampled units every month in urban areas and once per quarter in rural units. In addition, close
contact is maintained between the enumerator, the community and the health centres under the observation
units to assist in the identification of events and change in characteristics as they happen.
A second round of formal data collection happens mid-year (done by a skilled individual) and captures all vital
events, changes in household characteristics, pregnancy status and outcomes and other health information
which occurred within half of the year. The gathering of data using the two modes is independent and therefore
warrants matching of data items gathered in the two processes. Unmatched data is investigated by visiting the
relevant household units for a third time to resolve the record of events and characteristics. Like HDSS, verbal
autopsies are done to all confirmed deaths happening in the population (Sorchik et al., 2019).
Since the data collection approach is believed to limit the possibility of missing vital demographic events, the
SRS in India remains a key data source that provides annual estimates of population composition, mortality,
fertility and medical services rendered at the time of birth and death events. Under-5 mortality rate, adult
mortality and life expectancy is additionally disaggregated by urban/rural regions. Nonetheless, there has been
growing concern over the completeness of data since recent estimates of completeness have not been
undertaken in recent years (Bhat, 2002) as well as precision challenges due to the small sample size (Rao
and Gupta, 2020).
3.5 Mortality mobile phone surveys (MPS)
The recent rise of mobile phone networks and inexpensive telephone handsets has opened new possibilities.
Based on a combination of baseline data from a traditional household survey and subsequent interviews of
selected respondents using mobile phones, a growing number of initiatives are now using mobile phone
technology to facilitate welfare monitoring and opinion polling almost in real time (World Bank Group, 2016).
Mobile phone surveys should not and cannot replace face-to-face household surveys in developing countries.
However, in specific circumstances and for specific data needs, mobile phone surveys offer substantial
benefits. The benefit of mobile phone surveys often becomes most evident in situations where face-to-face
data collection would be extremely difficult or simply not feasible. For example, when the West Africa Ebola

STATISTICS SOUTH AFRICA 32
Alternative Sources of Demographic Data (Report 03-00-17)
virus outbreak in 2014 limited the movement of people and goods in the three most affected countries (Guinea,
Liberia, and Sierra Leone), mobile phone surveys were used to collect data to monitor the Ebola crisis and its
effects on food security and to provide estimates of its socio-economic toll (Himelein 2014; WFP, 2015). These
examples illustrate how mobile phone surveys are used to obtain information from populations that would
otherwise be difficult or impossible to reach.
Monitoring mortality is an essential component of an effective response to the COVID-19 pandemic. COVID-
19 surveillance systems around the world count primarily deaths occurring in hospitals to individuals who
tested positive to SARS-CoV-2, although some countries now also include deaths among suspected COVID-
19 cases or that have occurred outside of hospitals. In low- and lower-middle income countries, data from civil
registration systems does not allow monitoring excess mortality during the COVID-19 pandemic. Rapid mobile
phone surveys aimed at measuring mortality trends on a monthly basis are a realistic and safe option for filling
this data gap. The data generated by mobile phone surveys can play a key role in better targeting areas or
population groups most affected by the pandemic. They can also help monitor the impact of interventions and
programmes, and rapidly identify what works in mitigating the impact of COVID-19.
3.6 Big data
The world is in the midst of a data revolution. The data ecosystem is a component of this and can be defined
as a group of multiple data communities that interact with one another by sharing data, knowledge to improve
data processes and data use, and other data-related activities along the data value chain. Members of these
data communities can be stakeholders from official statistical agencies, line ministries, central banks, civil
society organisations, academia and the private sector (Cázarez-Grageda, 2019). In the past two years alone,
90% of the data in the world has been created, with thousands of new sources – from remote sensing to text
analysis – from multitudes of new actors coming online every day.
3.6.1 Social media influence in the COVID-19 pandemic
Social media platforms are amongst the most widely used sources of information in the world; the easy and
inexpensive access to the internet and a large number of registered users in these platforms make them one
of the easiest and most effective ways to disseminate information. During major events, the overall response
is usually a greater search for information – be it a sports event, a disease, or a natural disaster. A good
example can be seen with the peak of searches for information on the internet and social media platforms in
China preceding the peak of incidence in COVID-19 cases by 10 to 14 days, with which internet and social
media networks searches have demonstrated a correlation with the incidence of disease. A study done in
Poland during COVID 19 has revealed that social media data may be useful in assessing health threats and
help to understand how people respond to them. As the outbreak of the novel coronavirus disease (COVID-
19) is a global pandemic, real-time social media monitoring is needed to know the scale of this phenomenon.
In South Africa for example, the Minister of Health releases media statements to update the population on
recent statistics on COVID 19 by provinces. The NICD also releases regular updates of their epidemiological
reports on COVID-19.

STATISTICS SOUTH AFRICA 33
Alternative Sources of Demographic Data (Report 03-00-17)
4. Conclusion
Censuses, vital registration and vital statistics system, health and demographic surveys and other data sources
conducted by other institutions other than Statistics South Africa have been providing invaluable statistics on
mortality for an extended period. The highlighted weaknesses of some of these sources have been mitigated
by the use of indirect methods of estimating mortality statistics. Development frameworks such as the
Sustainable Development Goals have brought awareness for the need of correct and continuous data to
monitor progress on health related statistics, including mortality statistics. This chapter has demonstrated that
there are several alternative data sources apart from the traditional sources of data that can be used to derive
and complement mortality data in South Africa. The use of these unique data sources such as the Health and
Demographic Surveillance System, Sample Registration Systems, National Population Register, Department
of Health Management Information System, mobile phone surveys and big data presents an opportunity to
understand mortality using a very in-depth and complementary approach. The chapter has shown that statistics
from these alternative sources follow the known mortality schedule of South Africa, also in terms of causes of
death. The sources discussed are able to complement mortality statistics for development monitoring
purposes. Further investment in these sources to have a wider representation of the South African population
will reduce the need for a costly census every 10 years.

STATISTICS SOUTH AFRICA 34
Alternative Sources of Demographic Data (Report 03-00-17)
References
Alberts, M., Dikotope, S.A., Choma, S.R., Masemola, M.L., Modjadji, S.E.P., Mashinya, F., Burger, S., Cook,
I., Brits, S.J., Byass, P., 2015. Health & Demographic Surveillance System Profile: The Dikgale Health and
Demographic Surveillance System. Int J Epidemiol 44, 1565–1571.
Bhat, P.N.M., 2002. Completeness of India's Sample Registration System: An Assessment Using the General
Growth Balance Method. Population Studies 56, 119–134.
Blau, D.M., Caneer, J.P., Philipsborn, R.P., Madhi, S.A., Bassat, Q., Varo, R., Mandomando, I., Igunza, K.A.,
Kotloff, K.L., Tapia, M.D., Johnstone, S., Chawana, R., Rahman, A., El Arifeen, S., Onyango, D., Kaiser, R.,
Seale, A.C., Assefa, N., Morris, T., Raghunathan, P.L., Breiman, R.F., 2019. Overview and Development of
the Child Health and Mortality Prevention Surveillance Determination of Cause of Death (DeCoDe) Process
and DeCoDe Diagnosis Standards. Clin Infect Dis 69, S333–S341.
Boerma, T., Victora, C., Abouzahr, C., 2018. Monitoring country progress and achievements by making global
predictions: is the tail wagging the dog? Lancet 392, 607–609.
Boerma, Ties, Jennifer Requejo, Cesar G. Victora, Agbessi Amouzou, Asha George, Irene Agyepong, Carmen
Barroso, et al. 2018. Countdown to 2030: Tracking Progress Towards Universal Coverage for Reproductive,
Maternal, Newborn, and Child Health. The Lancet 391, no. 10129
Cunningham, S.A., Shaikh, N.I., Nhacolo, A., Raghunathan, P.L., Kotloff, K., Naser, A.M., Mengesha, M.M.,
Adedini, S.A., Misore, T., Onuwchekwa, U.U., Worrell, M.C., El Arifeen, S., Assefa, N., Chowdhury, A.I., Kaiser,
R., Madhi, S.A., Mehta, A., Obor, D., Sacoor, C., Sow, S.O., Tapia, M.D., Wilkinson, A.L., Breiman, R.F., Child
Health and Mortality Prevention Surveillance (CHAMPS) Methods Consortium, Agaya, J., Aol, G., Liech, S.,
Oyuga, L., Akelo, V., Barr, B.A.T., Zielinski-Gutierrez, E., Bari, S., Rahman, Q.S., Rashid, Md.M., Hossain, T.,
Bassat, Q., Bassat, Q., Filimone, P., Hunguana, A., Jamisse, E., Matsena, T., Mandomando, I., Malheia, A.,
Mandomando, I., Onyango, D., Sello, M., Thaele, D., Jambai, A., 2019. Health and Demographic Surveillance
Systems Within the Child Health and Mortality Prevention Surveillance Network. Clinical Infectious Diseases
69, S274–S279.
Department of Health, 2015. Towards high-quality, well-understood, auditable data in Gauteng's primary
healthcare facilities: Data Quality Baseline Assessment Report. Department of Health, Gauteng.
Department of Health, 2011. District Health Management Information System (DHMIS) Policy.
Department of Health, Medical Research Council, and OrcMacro. 2007. South Africa Demographic and Health
Survey 2003. Pretoria.
Dorrington, RE, Bradshaw, D., Laubscher, R, and Nannan, N. 2019 Rapid Mortality Surveillance Report 2017.
Cape Town: South African Medical Research Council.
Dorrington, R, Moultrie, TA, and Timæus, I M. 2004. Estimation of Mortality Using the South African Census
2001 Data. In Care Monograph No.11. Cape Town University of Cape Town Centre for Actuarial Research.
Dowell, S.F., Zaidi, A., Heaton, P., 2019. Why Child Health and Mortality Prevention Surveillance? Clinical
Infectious Diseases 69, S260–S261.
STATISTICS SOUTH AFRICA 35
Alternative Sources of Demographic Data (Report 03-00-17)
Farnham, A., Utzinger, J., Kulinkina, A.V., Winkler, M.S., 2020. Using district health information to monitor
sustainable development. Bulletin of the World Health Organization 98, 69–71.
Garrib, A., Stoops, N., McKenzie, A., Dlamini, L., Govender, T., Rohde, J., Herbst, K., 2008. An evaluation of
the District Health Information System in rural South Africa 98, 4.
Houle, B., Clark, S.J., Kahn, K., Tollman, S., Yamin, A.E., 2015. The impacts of maternal mortality and cause
of death on children's risk of dying in rural South Africa: evidence from a population based surveillance study
(1992-2013). Reproductive Health 12, S7.
Hill, K., Johnson, P., Singh, K., Amuzu-Pharin, A and Kharki, Y. 2018. Using Census Data to Measure Maternal
Mortality: A Review of Recent Experience. Demographic Research 39, no. 11: 337-64.
Johnson, L.F., May, M.T., Dorrington, R.E. Cornell, M., Boulle, A., Egger, M. and Davies, M. 2017. Estimating
the Impact of Antiretroviral Treatment on Adult Mortality Trends in South Africa: A mathematical modelling
study. PLOS Medicine 14, 12.
Kabudula, C.W., Houle, B., Collinson, M.A., Kahn, K., Gómez-Olivé, F.X., Tollman, S., Clark, S.J., 2017.
Socioeconomic differences in mortality in the antiretroviral therapy era in Agincourt, rural South Africa, 2001–
13: a population surveillance analysis. The Lancet Global Health 5, e924–e935.
Kahn, K., Collinson, M.A., Gómez-Olivé, F.X., Mokoena, O., Twine, R., Mee, P., Afolabi, S.A., Clark, B.D.,
Kabudula, C.W., Khosa, A., Khoza, S., Shabangu, M.G., Silaule, B., Tibane, J.B., Wagner, R.G., Garenne,
M.L., Clark, S.J., Tollman, S.M., 2012. Profile: Agincourt Health and Socio-demographic Surveillance System.
Int J Epidemiol 41, 988–1001.
Maïga, A., Jiwani, S.S., Mutua, M.K., Porth, T.A., Taylor, C.M., Asiki, G., Melesse, D.Y., Day, C., Strong, K.L.,
Faye, C.M., Viswanathan, K., O'Neill, K.P., Amouzou, A., Pond, B.S., Boerma, T., 2019. Generating statistics
from health facility data: the state of routine health information systems in Eastern and Southern Africa. BMJ
Glob Health 4, e001849.
Massyn N, Barron P, Day C, Ndlovu N, Padarath A, editors, 2020. District Health Barometer 2018/2020. Health
Systems Trust, Durban.
Mejia-Pailles, G., Berrington, A., McGrath, N., Hosegood, V., n.d. 2020. Trends in the prevalence and
incidence of orphanhood in children and adolescents <20 years in rural KwaZulu-Natal South Africa, 2000-
2014. PLOS ONE 17.
Moultrie, T, and Dorrington, R. 2009. Demography: Analysis of the Nids Wave 1 Dataset - Discussion Paper
No. 9. In National Income Dynamics Survey (NIDS). University of Cape Town, 2009.
Nicol, E., Bradshaw, D., Uwimana-Nicol, J., Dudley, L., 2017. Perceptions about data-informed decisions: an
assessment of information-use in high HIV-prevalence settings in South Africa. BMC Health Serv Res 17, 765.
Rao, C., Gupta, M., 2020. The civil registration system is a potentially viable data source for reliable subnational
mortality measurement in India. BMJ Global Health 5, e002586.
Republic of South Africa. National Development Plan 2030 Our Future-Make It Work. South Africa

STATISTICS SOUTH AFRICA 36
Alternative Sources of Demographic Data (Report 03-00-17)
Reniers, G, Wamukoya, M., Urassa, M. Nyaguara, A. Nakiyingi-Miiro, J. Lutalo, T. Hosegood, V et al. 2016.
Data Resource Profile: Network for Analysing Longitudinal Population-Based HIV/Aids Data on Africa (Alpha
Network). International Journal of Epidemiology 45, no. 1: 83-93.
Sartorius, B., Kahn, K., Collinson, M.A., Sartorius, K., Tollman, S.M., 2013. Dying in their prime: determinants
and space-time risk of adult mortality in rural South Africa. Geospat Health 7, 237–249.
Sorchik R, Kosen S, Mahapatra P, Yin P, Zhou M. 2019. The past, present and future of three sample
registration systems in Asia. CRVS analyses and evaluations. Australia: Boomberg Philanthropies Data
Initiative for Health Initiative, Civil Registration and Vital Statistics Improvement, University of Melbourne,
Melbourne, Australia.
Statistics South Africa. 2020. Mortality and causes of death in South Africa, 2017: findings from death
notification form (P0309.3). Statistics South Africa, Pretoria, South Africa.
Statistics South Africa. 2017 Mortality and Causes of Death in South Africa, 2016: Findings from Death
Notification. Pretoria.
Statistics South Africa. 2018. Mortality and Causes of Death in South Africa, 2016: Findings from Death
Notification. Pretoria.
Statistics South Africa. 2015. Census 2011: Estimation of Mortality in South Africa. Pretoria.
Tanser, F., Hosegood, V., Bärnighausen, T., Herbst, K., Nyirenda, M., Muhwava, W., Newell, C., Viljoen, J.,
Mutevedzi, T., Newell, M.L., 2008. Cohort Profile: Africa Centre Demographic Information System (ACDIS)
and population-based HIV survey. Int J Epidemiol 37, 956–962.
Timaeus, I. M. 1991. Measurement of Adult Mortality in Less Developed Countries: A Comparative Review.
Popul Index 57, no. 4: 552-68.
Udjo, E. O., and Lalthapersad-Pillay, P. 2014. Estimating Maternal Mortality and Causes in South Africa:
National and Provincial Levels. Midwifery 30, no. 5: 512-8.
Udjo E.O. 2017. Evaluating the demographic aspects and estimating demographic indicators from the 2016
South Africa Community. Bureau of Market Research. Report 486. South Africa.
United Nations, 2014. Principles and recommendations for a vital statistics system: Revision 3, Statistical
Papers (Ser. M). UN.
United Nations. 2004 The Impact of Aids. United Nations.
Ye, Y., Wamukoya, M., Ezeh, A., Emina, J.B.O., Sankoh, O., 2012. Health and demographic surveillance
systems: a step towards full civil registration and vital statistics system in sub-Sahara Africa? BMC Public
Health 12, 741.

CHAPTER 3: MIGRATION

STATISTICS SOUTH AFRICA 38
Alternative Sources of Demographic Data (Report 03-00-17)
1. Introduction
In today's globalised world, migration is a progressively important policy issue. Economic hardship and
geopolitical crises are resulting in growing and diverse migratory movements. Migration is increasingly being
recognised as a significant global challenge and opportunity,1 and is an important phenomenon shaping the
demographic profile of countries.2 Development and expansion of transportation routes, methods and networks
have made it easier, cheaper and faster for people to move in search of jobs, opportunity, education and better
quality of life. At the same time, conflict, poverty, inequality and a lack of sustainable livelihoods compel people
to leave their homes to seek a better future for themselves and their families abroad. The number of people
living outside their country of birth is now increasing faster than world population growth.3 As such, there is a
growing need for data on movement and migration in South Africa, the region, the African continent and
globally. The data is needed to be timeous, accurate, as well as measure a range of indicators directly and
indirectly related to migration. In addition to the global indicators, such as the Sustainable Development Goals
(SDGs) and the Global Compact for Migration (GCM), there are domestic indicators, such as the National
Development Plan (NDP), and continental indicators, such as the African Union Migration Policy Framework.
1.1 Migration in South Africa
Regarding internal migration, during apartheid, migration in South Africa was associated with labour migration,
which helped shape the country's economy, urban settlement and spatial patterns, and primary livelihood
strategies.4 The policies of the apartheid government served to monitor and limit the movement of non-white
population groups when they were in urban areas, and ensured a labour reserve in the homeland states. As a
result, black African men in particular, moved to mines and other urban areas for employment while leaving
their families at their place of origin.5 Migration in South Africa has been rooted in racially discriminatory policies
that resulted in internal migration in the country taking on a circular pattern whereby individuals migrate back
and forth between their rural homes and urban places of employment.6
The traditional pattern of migration within and from Africa, which has been male-dominated, is increasingly
becoming feminised. African women move independently within and outside their countries, for economic
reasons, education, professional development, marriage and protection. The increasing feminisation of
migration is a result of the shifting demands for types of skills, such as in the service industries, especially for
domestic workers, nurses, teachers, care workers and other typically female dominated professions. The
feminisation of migration serves to contribute to gender equality, as women become economically empowered,
gain new skills and take on different roles in countries of origin, transit and destination. The migration of men
may also positively affect gender roles, as women who stay behind take on greater responsibility in the
1 United Nations Department of Economic and Social Affairs. 2017. International Migration Report 2017. New York: United Nations 2 De Brauw, A. & Carletto, C. 2012. Improving the measurement and policy relevance of migration information in multi-topic household surveys. Washington DC: World Bank. 3 De Brauw, A. & Carletto, C. 2012. Improving the measurement and policy relevance of migration information in multi-topic household surveys. Washington DC: World Bank. 4 Segatti, A. 2011. Migration to South Africa: Regional Challenges versus National Instruments and Interests. In: A. Segatti & L.B. Loren, eds. Contemporary Migration to South Africa: a Regional Development Issue. Washington DC: The International Bank for Reconstruction and Development / The World Bank, pp. 9-29 5 Statistics South Africa. 2015. Census 2011: Migration Dynamics in South Africa. Pretoria: Statistics South Africa. 6 6 Landau, L.B. & Gindrey, B. 2008. Migration and population trends in Gauteng province 1996-2055. University of Witwatersrand, Volume 42.

STATISTICS SOUTH AFRICA 39
Alternative Sources of Demographic Data (Report 03-00-17)
household and have increased decision-making power.7 The feminisation of migration has been a
phenomenon that has transpired over the last few decades, globally, as well as in South Africa.
Child migration is a global reality. As of 2015, thirty-one million children were living outside their country of
birth. While most of them moved in a regular fashion to relocate in a different country with their families, this
number also includes ten million child refugees and one million asylum-seekers who fled armed conflict,
violence and persecution (UNICEF, 2018). There are some distinctive aspects to children's migration that
contribute to the high and rising numbers of children moving on their own. Many young migrants set out to find
opportunities for work or education, or to escape unwanted child marriage or gender-based violence (UNICEF,
2017). Some children migrate when their families break down or their parents die. Others move to join family
members who made the journey ahead of them. In some cases, children migrate on their own because their
chances of success are deemed greater than those of older family members.
It is important to collect, process and report on data on older persons in the migration context to improve
policymaking and planning. These endeavours will also support the achievement of ageing-related SDGs, such
as protecting the human rights of all people of all ages by "leaving no one behind" (IOM, 2019). Older persons
in migration contexts are at risk of being overlooked, which might perpetuate vulnerabilities and inequalities.
Consideration of migration in this cohort is integral, as development plans, such as the Sustainable
Development Goals, put the emphasis on the elderly and migration. This cohort represents a specific category
of migrants whose unique needs, rights and challenges are not being adequately addressed by the larger
migration policy debate.
South Africa is a country which is a recipient of mixed migration flows. Largely a recipient of economic migrants,
the country also receives asylum-seekers, undocumented migrants, those who are victims of traffickers, and
those who were smuggled, child migrants, amongst others. The mixed migration flow therefore has a
consequence for the types of data needed to measure the different migration stock, flow and associated
dynamics. Migration patterns are complex and involve diverse social groups and a combination of permanent
and temporary migrants.8 The narrative surrounding migration in South Africa is shrouded with undocumented
migrants who move from elsewhere in the continent, to "steal" jobs from South Africans, as a source of cheap
labour.9 Discourse on illegal border crossings, and bribing of border officials is rampant. South Africa has also
had a repeated history of xenophobia, which has led to some of the foreign-born population living in South
Africa to not identify themselves during surveys, as well as during special dispensation permit applications.
Looking at migration in perspective of the continent, South Africa has the largest and most diversified economy
in the region. South Africa shares a continent with countries that are poor and prone to conflict.10 As postulated
by the neo-classical migration theory and push-and-pull factors, this has created flows of migrants from the
continent and the global south. The neo-classical migration theory is premised on the principle of demand and
supply of labour, mainly across international boundaries, due to differences of income in source and destination
7 African Union (2017). The Revised Migration Policy Framework for Africa and Plan of Action (2018 – 2027) 8 National Planning Commission. 2012. National Development Plan 2030: Our future – make it work. Pretoria: National Planning Commission 9 Landau, L.B. 2011. Introducing the Demons. In: L.B. Landau, ed. Exorcising the demons within: xenophobia, violence and statecraft in contemporary South Africa. Johannesburg: Tokyo: Wits University Press, pp. 1-26. 10 Mapuva, J. & Muyengwa-Mapuva, L. 2014. The SADC regional bloc: What challenges and prospects for regional integration? Law, Democracy and Development, Volume 18, pp. 22-36. National Planning Commission. 2012. National Development Plan 2030: Our future – make it work. Pretoria: National Planning Commission

STATISTICS SOUTH AFRICA 40
Alternative Sources of Demographic Data (Report 03-00-17)
areas. Migration therefore takes place to equalise wages across countries with low labour supply and high
wages with countries with high labour supply and low wages.11 The collapse of Zimbabwe's economy has
added a "crisis-driven quality" to the regional movement of people.12 Given the major disparities in economic
development and opportunity between South Africa and the rest of the region, it is inevitable that some people
will move to South Africa by any means they can.1314
1.2 Purpose and objective
The purpose of the report is to provide alternative data sources for the measurement of migration data. The
report addresses the following objectives:
1. Provide an overview of existing data sources
2. Identify the advantages and gaps of the existing data sources
3. Provide alternative data sources for the measurement of migration data
1.3 Rationale
Why consider alternative data sources for the measurement of migration in South Africa? Migration issues
have gained prominence in the international and domestic agendas of many countries. Quality data on internal
and international migration, together with fertility and mortality, are essential to prepare accurate population
estimates which are required for planning purposes, to allocate resources, and to determine migration
policies.15 In consideration of the mixed migration flows, as well as the data needs to report on domestic,
regional and international goals, traditional data sources are insufficient to keep up with growing data demand.
The 2030 Agenda for Sustainable Development and its Sustainable Development Goals (SDGs), provides a
roadmap for development that is sustainable and leaves no one behind.16 Migration is one of the defining
features of the status quo and contributes significantly to all aspects of social and economic development, and
as such is integral to the achievement of the global development agenda. Development is above all about
increasing social and economic inclusion and ensuring all people have secure livelihoods, enabling them to
live a life in dignity, out of poverty. Sustainable Development Goal 17.18 highlights the need for the availability
of "timely and reliable data disaggregated by income, gender, age, race, ethnicity, migratory status, disability,
geographic location and other characteristics relevant in national contexts". Hence, migration is considered an
integral developmental issue. The inclusion of migration in the new global development framework poses
several new challenges for national-level statistical systems. Better use of existing data sources, as well as
developing new methods to collect data on migration will be required.17 The use of alternative migration data
sources presents advantages to avoid common problems and shortfalls with data emanating from a census,
11 Massey, D.S. & Espinosa, K.E. 1997. What's driving Mexico-US migration? A theoretical, empirical, and policy analysis. American Journal of Sociology, 102(4), pp. 939-999 12 Mapuva, J. & Muyengwa-Mapuva, L. 2014. The SADC regional bloc: What challenges and prospects for regional integration? Law, Democracy and Development, Volume 18, pp. 22-36. National Planning Commission. 2012. National Development Plan 2030: Our future – make it work. Pretoria: National Planning Commission 13 Rodríguez-Pose, A. & Tijmstra, S. 2005. Local Economic Development as an alternative approach to economic development in Sub-Saharan Africa. Washington Dc: The World Bank. 14 Mapuva, J. & Muyengwa-Mapuva, L. 2014. The SADC regional bloc: What challenges and prospects for regional integration? Law, Democracy and Development, Volume 18, pp. 22-36. National Planning Commission. 2012. National Development Plan 2030: Our future – make it work. Pretoria: National Planning Commission 15 UNFPA. 2019. Measuring Migration in a Census. https://www.unfpa.org/sites/default/files/resource-pdf/measuring-migration.pdf 16 United Nations Women. 2019. Women and the Sustainable Development Goals (SDGs). 17 International Organization for Migration. 2020. Migration data sources. https://migrationdataportal.org/themes/migration-data-sources
STATISTICS SOUTH AFRICA 41
Alternative Sources of Demographic Data (Report 03-00-17)
such as providing data at custom spatial levels, and importantly, targeting and capturing populations that are
classified as hard-to-count.
1.4 The COVID-19 pandemic
The COVID-19 pandemic has had a profound impact worldwide. The pandemic reached South Africa later
than most of the world, but despite the delay, it has still had a wide-reaching impact on all South Africans. The
COVID-19 pandemic has left not only the world as large in shock, but also the data community. Many countries
have had to move the 2020 Round of Censuses, postpone or cancel other surveys as well as change their
fieldwork and data collection strategies. The pandemic has revealed flaws in data systems and shown the
gaps existing. This has caused demographers globally to re-think data strategies. Migration and migrants at
large were affected. During a pandemic, livelihoods are affected and income-generating activities are reduced.
As migrants are already a vulnerable group, therefore the COVID-19 lockdown could further impede migrants.
This impact is far-reaching and goes beyond simply disrupting migrants' earnings. It would also have a negative
impact on the families and communities who depend on migrants' support through remittances. Remittances
are very often an important source of income for sending families, and any changes in the amount of
remittances they receive will have a direct impact on the food security status, health and wellbeing of families
in the countries of origin. The lockdown has, however, limited the amount of money migrants can remit while
also preventing the sending of physical goods across borders due to the closure of the country's borders. 18
While the COVID-19 pandemic is having a far-reaching impact on the health of individuals, the national
lockdown is also affecting the economy and the labour market. The impact of the pandemic on the economy
and the labour market is likely to continue for some time into the future. South Africa was already in a technical
recession before the national lockdown and the lockdown will lead to further contraction and job losses. While
many businesses were, and remain closed, some had to cut back on their hours of operation leading to layoffs
and a reduction of working hours and wages for many individuals. By contrast, some individuals continue to
work as usual, either physically or remotely. This has extreme consequences of migrants, as the pull factor in
South Africa in employment. The COVID-19 pandemic further revealed the urgent need for data in the socio-
economic, demographic spheres of migrants.
1.5 Data gaps
Comprehensive migration data, of good quality and made available timeously is essential for countries to
effectively manage migration and ensure that migrants are not left behind. Despite this, substantial data gaps
exist on a myriad of migration and development related indicators. The migration data landscape has changed
dramatically over recent years. Hence there is a need for innovative methods to study mobility and migration.
Alternative data sources pose a challenge, especially to marry it with official data. However, these data sources
are an important issue and cannot be ignored. Depending on the source, various strengths and limitations can
present when analysing available data sources for migration. Looking at the data revolution, migration data
has to embrace innovative methods. This does not mean replacing traditional statistical methods, but rather
18 Statistics South Africa. 2020. Social impact of COVID-19 (Wave 3): Mobility, Migration, and Education. Pretoria: Statistics South Africa
STATISTICS SOUTH AFRICA 42
Alternative Sources of Demographic Data (Report 03-00-17)
complimentary data sources and a use of a combination of methods. Some of the data gaps identified in
migration data are:19
1. Data is not collected or accessible, or incomplete
a. Trafficking, smuggling, remittances, migrant integration, return migration, unaccompanied minors
2. Data is scattered across various sources
3. Organisations work in silos with limited data sharing
4. Data is not disaggregated
5. Data is not comparable amongst countries
6. Lack of standard definitions.
2. Traditional sources of data on migration
Traditional sources of data can be described as data that has been used by National Statistics Offices (NSOs)
to collect data for official statistics. Migration data for official use has been largely from censuses, household
and labour force surveys, which has been collected by the Department, Statistics South Africa, and
administrative data, which is collected by the Department of Home Affairs, which are the principal sources for
measuring migration. Other government departments, non-governmental organisations and academic
institutions may also collect data on migration. The Gauteng City-Region Observatory Project collects data
from its provincial survey. The Migration Help Desk is a project also run also by the Gauteng Provincial
Department. The Demographic Surveillance Sites in South Africa is a project funded by the Department of
Science and Innovation. The Surveillance Sites measures migration and movement within the sites. The
National Income Dynamics Study (NIDS) is a survey conducted by SALDRU at the University of Cape Town
on behalf of the DPME and measures migration in its survey. Scalibrini is a non-governmental organisation in
Cape Town that works with migrants in South Africa. They keep a record of all cases that pass through their
doors. This section looks at traditional data sources and provides the advantages and disadvantages of each
as it relates to migration.
2.1 Census
A population census is the process of collecting, compiling, evaluating, analysing and disseminating
demographic, economic and social data pertaining, at a specified time, to all persons in a country.20 A
population and housing census collects migration data for the creation of official statistics. In regards to
international migration, population censuses may be the most comprehensive source of internationally
comparable statistics.21 In South Africa, the National Statistics Office, which is Statistics South Africa, conducts
a census. There have been three censuses in democratic South Africa to date, namely Census 1996, Census
2001 and Census 2011. The next census will be conducted in 2021. As the basis of official statistics, the
census has many advantages such as producing indicators at the lowest level of geography, as well as
producing indicators that are internationally comparable. Censuses will need to provide more disaggregated
data by migratory status in order to ensure "no migrant is left behind", the 2030 Agenda's guiding principle.
19 International Organization for Migration. 2017. Global data gaps. www.migrationdataportal.org 20 OECD. 2001. Glossary of statistical terms. https://stats.oecd.org/glossary/detail.asp?ID=2082 21 UNFPA. 2019. Measuring Migration in a Census. https://www.unfpa.org/sites/default/files/resource-pdf/measuring-migration.pdf

STATISTICS SOUTH AFRICA 43
Alternative Sources of Demographic Data (Report 03-00-17)
Indicators produced from the census include internal and international migration, internal migration corridors,
period and lifetime migration, emigration, reason for migration, demographic and socio-economic migrant
profiles, and migrant stock. However, a census takes place every ten years in South Africa. It is an expensive
event and as such conducted infrequently. Regarding migration, due to the length of the census questionnaire,
all necessary migration questions cannot be included. For example, South Africa will not be including questions
on second-generation migrants. Some immigrants, such as undocumented migrants, may conceal their
migrant status to fieldworkers and not answer questions correctly, leading to an under-estimation of migration.
In the event that individuals have multiple movements, the focus is only on the last move. Questions on
emigration may not be covered adequately, as when entire households move, there will be no one left from
the household to complete the questionnaire.
2.2 Community Survey
Statistics South Africa conducted its first Community Survey (CS) in 2007, and the second in 2016. The CS is
the largest survey undertaken by Statistics South Africa. At a geographic level, the survey remains one of the
main data sources that provide indicators at national, provincial and municipal levels for planning and
monitoring the performance of specific development programmes and indicators.22 The CS 2016 questionnaire
is similar to the Census 2011 questionnaire, with the addition of reason for migration, and questions on
emigration. It is important to note that the migration patterns emanating from CS 2016 need further
investigation as they do not conform to expected outcomes.23 The advantage of the CS is that as it is a large
sample survey, migration data is available at lower geographic levels than other surveys. Similar to the census,
indicators on internal migration, immigration, migration corridors, demographic and socio-economic profiles
can be analysed. The disadvantage, however, is that due to the survey sampling, migrants may not be
adequately sampled. Migration is a rare event and migrants may live in clusters. Hence, migrants may not be
adequately represented in a survey. There may be a need for migration-specific weights in a survey, due to
the spatial nature of migration. Despite Stats SA not applying migration-specific weights in its surveys to date,
there is benefit in the analysis on timely migration data from the surveys. The suggestion of a South African,
African or World Migration Survey would be optimal as focus would be on identifying highly clustered migrant
localities. A specialised survey such as a migration-specific survey constitutes the best data collection system
to gather the information needed to carry out the proper examination of international migration in South Africa.
The survey would enumerate the population born outside South Africa, and the schedule of questions would
be specific to this phenomenon. The survey design, the sampling and weighting would be different to other
household surveys
2.3 The Quarterly Labour Force Survey
The Quarterly Labour Force Survey (QLFS) is a household-based, sample survey conducted by Stats SA. It
collects data on the labour market activities of individuals aged 15 years and older who live in South Africa.
Stats SA included questions on migration in the QLFS for the first time in the third quarter of 2012. The data
22 Statistics South Africa. 2016. Community Survey 2016. Pretoria: Statistics South Africa 23 Statistics South Africa. 2016. Community Survey 2016. Pretoria: Statistics South Africa

STATISTICS SOUTH AFRICA 44
Alternative Sources of Demographic Data (Report 03-00-17)
on the second module was collected in the third quarter of 2017.24 The volume of migration is often estimated
directly from two questions in censuses and surveys, namely:
i. Where (province, country) were you born? This provides a measure of lifetime migration.
ii. Were you living here five years ago? This provides a measure of recent (period) migration.
The advantage of the data series is that it fills the gap in migration data collection in the intercensal period.
Apart from the Community Survey, the QLFS currently is the only household survey that collects data on
migration in Stats SA. There are many variables available and analysis can be conducted on a range of labour
force variables. The disadvantage however, is that the migration module is only included every 5 years in the
QLFS. Due to the length of the questionnaire, and to avoid respondent fatigue, the module has not been
included more often. However, due to the urgency in the requirement of migration data, the migration module
may be included more often. Another disadvantage of the QLFS is that as it is a sample survey, at a geographic
level, the data only goes down to metro/non-metro level, which does not allow for analysis of lower level data.
In addition to this, the specific country of birth is not asked of the foreign born population, so disaggregated
data in this regard is not possible. Whilst data on migration is best received from a census or a migration
survey, there is large value in determining the patterns and trends presented in the QLFS. Despite Stats SA
not applying migration-specific weights in its surveys to date, there is benefit in the analysis on timely migration
data from the QLFS. Trends from QLFS are congruent with other results reported by Stats SA on migration.25
2.4 Administrative data
Administrative sources, such as the Department of Home Affairs, collect data for purposes other than gathering
information on migration, but it may be useful in the collection of specific migration indicators. Statistics derived
from data in these sources usually refer to administrative records rather than people. The Department of Home
Affairs' core immigration services duties are administering admissions into the country, determining the
residency status of foreigners and issuing permits thereof and the custodianship of refugee affairs.
2.5 Administrative registers
Administrative registers that can potentially produce information on certain groups of persons who change
their country of usual residence and thus qualify as international migrants. Registries are another source of
data for migration. Registries include population registers, employment registers, and other administrative
records.26 Registers can be useful sources to complement census data. South Africa, through the Department
of Home Affairs (DHA), maintains an electronic National Population Register (NPR) from the civil registration
system. However, one of the main disadvantages of using registers for migration data collection is that most
registers have not been specifically designed to obtain information on migration, and those which have, are
typically limited to collect the facts needed for specific administrative purposes. Moreover, migrants leaving
the country may not have to inform the registry if they are leaving for less than a specified period of time, and
they may not be required to inform officials of their return.27
24 Statistics South Africa. 2018. Labour Market Dynamics in South Africa 2017. Pretoria: Statistics South Africa 25 Statistics South Africa. 2019. Labour market outcomes of migrant populations in South Africa, 2012 and 2017. Pretoria: Statistics South Africa 26 International Organization for Migration. 2020. Migration data sources. https://migrationdataportal.org/themes/migration-data-sources 27 UNFPA. 2019. Measuring Migration in a Census. https://www.unfpa.org/sites/default/files/resource-pdf/measuring-migration.pdf

STATISTICS SOUTH AFRICA 45
Alternative Sources of Demographic Data (Report 03-00-17)
2.6 Border data collection
Border data collection systems produce statistics on flows of nationals and non-nationals entering and leaving
through official border posts. Border collection includes the entry and exit statistics collected at all points of
entry or departure in a country. Points of entry are not necessarily situated at the border, as they also include
airports and seaports. Given that border collection data only contain arrival and departure information, this
method cannot be used to calculate the number or characteristics of migrants living in a country at a given
point in time. However, border collection may represent the only feasible method of migration data collection
in places where registers are not sufficiently developed or accurate to provide information on migrant flows
and where field inquiries cannot be conducted frequently enough to produce significant estimates.28 Stats SA
processes immigrant forms collected at the border posts by DHA of documented immigrants and self-declared
emigrants publishes a report on the net gain/loss to the population of South Africa. The report also contains
some information on migrants, such as age, occupation and mode of travel. For documented immigrants there
is additional information on country of previous permanent residence, country of birth, country of citizenship
and for self-declared emigrants there is additional information on destination country and occupation.29
2.7 Administrative sources
Visas, residence permits, and/or work permits that produce statistics on migrant flows and stocks, drivers and
impact of migration, and socio-economic characteristics. Most countries have administrative procedures to
register foreigners or to grant permits to stay in the country. Examples include special dispensation permits,
asylum seeker documentation, visas (tourist, work, study) tourist visas, work visas and study permits. Although
still not fully recognized as a source of migration statistics in many countries, these civil registration records
can, to some extent, identify and analyse migrant stocks and flows. Administrative sources can provide detailed
and continuous data on small groups. However, visas, residence permits and work permits, while continuous
and comprehensive, lack comparable definitions, coverage and availability between countries or ministries
within the same country.30 However they may not cover naturalized citizens or undocumented residents who
overstay their visas. It is also important to note that, for example, if a person receives more than one residence
permit in a year, or if the permit granted to the head of the family covers his or her dependents, data may not
reflect the total number of migrants in the country of residence.
2.8 Gauteng City-Region Observatory (GCRO)
The Gauteng City-Region Observatory (GCRO) is a partnership between the University of Johannesburg, the
University of the Witwatersrand, the Gauteng Provincial Government and the local government in Gauteng
(SALGA: Gauteng). The GCRO conducts an integrated Quality of Life/Customer Satisfaction Survey in the
Gauteng City-Region (GCR) which collects data in the Gauteng province, and publishes data relevant to
migration. Migration-specific indicators are available on internal and international migrants, age, sex,
population group, education, employment and housing. The Quality of Life Survey also includes questions on
attitudes toward migrants. The Survey, which first started in 2009, takes place every two years. The last survey
28 UNFPA. 2019. Measuring Migration in a Census. https://www.unfpa.org/sites/default/files/resource-pdf/measuring-migration.pdf 29 Statistics South Africa. 2005. Documented migration 2003. Pretoria: Statistics South Africa 30 International Organization for Migration. 2020. Migration data sources. https://migrationdataportal.org/themes/migration-data-sources

STATISTICS SOUTH AFRICA 46
Alternative Sources of Demographic Data (Report 03-00-17)
was conducted in 2017/18, and currently the 202/2021 is underway. The migration-specific questions included
in the questionnaire include Country of birth, period internal migration and year of movement to Gauteng.
Indicators can be disaggregated by migrant status. The advantage of the GCRO Quality of Life Survey is that
it is conducted every two years and included just under 25 000 respondents, representing every ward in
Gauteng. The sample size enables multiple approaches to analysis, mapping and modelling, and provides all
spheres of government with critical, local-level data needed to ensure the effectiveness of their programmes.
The survey is specific to Gauteng, which is the province in South Africa with the highest number and proportion
of migrants. The weights used are based on gender, population group, and ward size.
2.9 Health and Demographic Surveillance Sites
The South African Population Research Infrastructure Network (SAPRIN) is a national research infrastructure
that has harmonised the core data from all three of South Africa's Health and Demographic Surveillance
Systems (HDSS) and is developing new interconnected HDSS nodes in multiple urban settings. An HDSS
gathers longitudinal health and demographic data for a dynamic cohort of the total population in a specified
geographic area. An HDSS monitors births, deaths, causes of death, migration, and other health and socio-
economic indicators within a defined population over time. An HDSS consists of monitoring demographic and
health characteristics of a population living in a well-defined geographic area. The process starts with a
baseline census followed by regular update of key demographic events (birth, death and migration) and heath
events.31 Migration data is currently available from three surveillance sites:
1. Agincourt HDSS in Bushbuckridge District, Mpumalanga. It has a population of 115 000.
2. DIMAMO HDSS in Capricorn District, Limpopo. It has a population of 105 894.
3. Africa Health Research Institute HDSS in uMkhanyakude District, KwaZulu-Natal. It has a population of
165 000.
HDSSs provide complementary and in some cases intermediate data to the other well-known methods, such
as national censuses, and demographic and health surveys (DHS). The main difference is that whereas
HDSSs collect data longitudinally and in a specific area, censuses and DHSs collect data on a cross-sectional
basis at generally long intervals (10 years for the census and 3–5 years for DHS) on either the whole population
or on large nationally representative samples. The complementarity of HDSS data lies in the fact that the
platform can be used to evaluate the population impact of health interventions at a community level and
produce health and population indicators for the periods between two censuses or DHSs.32 Migration-specific
data is available for all three sites and covers age and sex of in and out-migration. HDSSs should not be seen
as a replacement for civil registration systems. Rather, as already indicated, they should serve as a short- to
medium-term measure to provide data for health and population planning at regional levels with possible
extrapolation to national levels. An HDSS is able to track population changes through fertility and migration
rates. HDSSs can also provide useful lessons for countries that intend to set up nationally representative
sample vital registration systems in the long term.33 The HDSS records information about non‐resident
31 Ye, Y., Wamukoya, M., Ezeh, A. et al. Health and demographic surveillance systems: a step towards full civil registration and vital statistics system in sub-Sahara Africa?. BMC Public Health 12, 741 (2012). https://doi.org/10.1186/1471-2458-12-741 32 Ye, Y., Wamukoya, M., Ezeh, A. et al. Health and demographic surveillance systems: a step towards full civil registration and vital statistics system in sub-Sahara Africa?. BMC Public Health 12, 741 (2012). https://doi.org/10.1186/1471-2458-12-741 33 Ye, Y., Wamukoya, M., Ezeh, A. et al. Health and demographic surveillance systems: a step towards full civil registration and vital statistics system in sub-Sahara Africa?. BMC Public Health 12, 741 (2012). https://doi.org/10.1186/1471-2458-12-741
STATISTICS SOUTH AFRICA 47
Alternative Sources of Demographic Data (Report 03-00-17)
household members. The limitation however is that HDSSs are not national samples means that results cannot
be generalised to the whole population, and that those who leave the site are lost to the panel, a major
constraint for migration analysis.34
2.10 National Income Dynamics Study
The National Income Dynamics Study (NIDS) was South Africa's first nationally representative panel survey.
It was initiated by the Presidency of South Africa, and is conducted by the Southern African Labour and
Development Research Unit (SALDRU) at the University of Cape Town. There have been five waves of the
survey, with the first in 2008. NIDS offers solutions to the limitations of the other surveys, making it an ideal
data source for analysing migration in South Africa. It is a nationally representative, longitudinal panel study
which follows all the originally sampled respondents even if the household splits or members move. This allows
for analysis of the characteristics of sending and receiving households. It records the GPS coordinates of all
respondents' households in each round, allowing for accurate mapping of spatial migration patterns. It uses
both a broad and narrow definition of household, and captures limited demographic information on non‐
resident household members, although unfortunately non‐resident household members in the baseline wave
are not treated as part of the panel, and so cannot be followed through the waves.
2.11 Scalabrini
The Scalabrini Centre of Cape Town (Scalibrini) offers specialised services to migrants, refugees and South
Africans. Scalabrini's services focus in four key areas including para-legal advice, advocacy and research,
development and integration and well-being and welfare. Scalabrini's mandate is to advocate for human rights
and achieves this through a holistic approach that considers all basic needs. Scalibrini keeps records of all
migrants who use their facilities. These records are able to provide insight into trends of migrants and migration.
The advantage is that on a provincial scale, Scalabrini is able to provide information collected directly from
migrants. They are able to report on sensitive issues, such as exploitation and xenophobia. As they assist
migrants with documentation, they are also able to provide insight into undocumented migrants. The
disadvantage however, is that as the Scalabrini Centre is based in Cape Town, data is only available on
migrants who are/were in Cape Town. Data is also only limited to those who presented themselves for
assistance at Scalabrini.
2.12 Migration data portal (Global)
This data portal from the International Organization for Migration provides the most recent data on migration
worldwide, bringing together more than 70 migration data indicators from over 20 international data sources.
Individuals can view migration patterns by country, sub-region, and region, for any year between (1990–2019).
Additionally, users can navigate between indicators in categories such as immigration and emigration, migrant
flow, vulnerability of populations, development, migration policy, and public opinion. The portal curates a series
of guides on migration data sources and their strengths and weaknesses, organized by theme (e.g.
vulnerability, development, policy) and written in collaboration with related experts. Coupled with the thematic
34 Hall, K. (2016). Maternal and child migration in post-apartheid South Africa: Evidence from the NIDS panel study. Cape Town: SALDRU, University of Cape Town. SALDRU Working Paper Number 178/ NIDS Discussion Paper 2016/5
STATISTICS SOUTH AFRICA 48
Alternative Sources of Demographic Data (Report 03-00-17)
guides are a database of tools and resources for improving migration data, searchable by migration theme,
data source, and region of focus; migration governance snapshots; and a variety of accessible blogs and
videos with leading data experts. The advantages of using new data sources for the analysis of migration-
related aspects are linked to their potential to fill some of the gaps in traditional data sources and methods.
While acknowledging the progress made by national governments and the international community on
migration statistics, traditional data sources have inherent limitations: national population censuses are costly
and infrequent, migrants may be hard to sample in household surveys, and they may be undercounted in
administrative records if they are not able to access services in the host country.
3. Alternative data sources
The demands for migration data arising from the global, regional and domestic development agenda have
prompted the demography community to review the use of traditional sources for migration data, such as
population and housing censuses, household surveys and administrative records. This has led to an increased
interest in looking for alternative sources to enhance the collection and analysis of migration data.35 How do
we define alternative data sources? Alternative data sources look beyond administrative data, surveys and
census. It looks beyond traditional sources. As indicated in the previous section, there are data gaps related
to timeliness of data (10 years in the case of a census), the cost of running a census or large scale survey,
sampling issues when using a household survey to measure migration, the length of a questionnaire and
competing questions, undocumented crossings of borders, amongst others. In addition to this, is the scope of
migration within the development agenda. Demographers and governments alike were initially concerned with
quantifying the situation. However, now there is much more interest in the socio-economic, health, vulnerability
and overall context of the phenomenon. Hence the need for complimentary data sources to further understand
migrants and the migrant landscape. Data innovation needs to be explored and existing data harnessed. As
we move into the Fourth Industrial Revolution, we need to take advantage and tap into existing mode of
information and data. Information about migration can come from a variety of data sources that have strengths
and limitations and can be used to produce different migration statistics. Driven by swift technological
advancement, an increasing amount of migration-related information is now available from the private sector.
An extraordinary amount of data, commonly known as "big data", have been generated through the use of
digital devices such as mobile phones, internet-based platforms such as social media, and online payment
services. A growing body of research attempts to present the various ways in which the use and analysis of
big data can help elucidate forced displacement, transnational networks, human trafficking or estimate
remittance flows.36
35 International Organization for Migration. 2020. Migration data sources. https://migrationdataportal.org/themes/migration-data-sources 36 International Organization for Migration. 2020. Migration data sources. https://migrationdataportal.org/themes/migration-data-sources

STATISTICS SOUTH AFRICA 49
Alternative Sources of Demographic Data (Report 03-00-17)
3.1 Innovative use of existing data
In addition to utilising innovative methods, is the innovative use of existing data sources. This data may have
been collected for other uses, but there is value in the data from a demographic purpose. Alternatively, the
data does exist, but is not being used for purpose of analysis. Examples of this is using election registration
data to measure migration trends in South Africa, Data on Prohibition Appeals and the Migrant Help Desk.
3.2 Using election registration data to measure internal-migration trends in South Africa
The Independent Electoral Commission (IEC) is South Africa's independent election management body. One
of its responsibility is to maintain the voters' roll. Primary data sources on migration remain the Census and
data collected by Stats SA. However, the national census is conducted in 10 year intervals essentially
incapable of capturing and accounting for mid-10-year interval immigration trends for local municipal planning
which is short term in nature spanning periods of 5 years or less, case in point being Integrated Development
Plans. Municipalities are concerned with inter-census data accounting for settlement changes characteristic of
urban areas. Election data obtainable in Voter Registration Data sources has been considered an alternative
migration data sources capable of giving data that will suffice in explaining migration patterns to some extent.
However, this data source is in itself insufficient in mapping migration patterns as it is limited to majority age
groups. It is necessary to engage with the IEC with a view to explore voter registration data as a migration
data option. The four-digit birth year, as obtained from the Department of Home Affairs (where available) to be
used as a check and anonymised person identifier, which is a unique number for every person in the dataset.
The data will be available in 5-year periods, when an election takes place. The voting district where the person
was registered in 1999, 2000, 2004, 2006, 2009 and 2011 (if registered) is used. The advantage of the IEC
data is that it gives a long term view of voters' migration histories. It is also free from recall errors. There are
no coding errors and has benefits of getting the correct age. Using voter registration data shows registered
voters and does not include those who are permitted to vote. The disadvantage is that it does not include those
who are entitled to vote like children under 18 and foreigners. The IEC data does not represent the entire
population, as it does not include people who don't vote and register.
3.3 Data on prohibition appeals
Data on undocumented migrants is scarce and almost non-existent. However, the Department of Home Affairs
deal with prohibition appeals. An immigrant may apply or may make an appeal after being found in possession
of fraudulent visas or fraudulent permanent resident permit, who have submitted fraudulent document, foreign
nationals who were deported, individuals who are appealing deportation or order to depart from Republic of
South Africa. These records are maintained by the Department of Home Affairs. Analysis of this will provide
information of undocumented migrants in South Africa. There is a need to recognise that due to limited
resources, the number of undocumented from which appeals may come is reduced and limited by the
resources to identify them.

STATISTICS SOUTH AFRICA 50
Alternative Sources of Demographic Data (Report 03-00-17)
3.4 Migration Help Desk
The City of Johannesburg (CoJ) is situated in the urban region in Gauteng and accounts for about one-third of
the provincial population. As of the 1996 Census, the population of Johannesburg was about 2,6 million
(Migration and Access Housing in CoJ, 2002). The city has been a recipient of immigration and internal-
migration during the last decades owing to its economic opportunities. Due to socio-economic and other
pressures within the society, xenophobic attacks reached its peak in 2008. In order to address a myriad of
socio-economic and political challenges occasioned by migration, the Executive Mayor, Amos Masondo
created a Migration Help Desk in 2007 as part of the Migrants Policy and Strategy as a necessary platform to
service and confront migrant associated issues proactively. Regarding data relevant to migration, CoJ used
reception and tracking of new arrivals of migrants, the Migration Help Desk and the Information Management
System to collect data on migrants. The collection is on-going. The advantage of the Migrant Help Desk is that
it provides multiple services to internal migrants and immigrants (both documented and undocumented
migrants). Users of the Migrant Help Desk come from about 25 countries, including Zimbabwe, Malawi,
Zambia, Lesotho, Mozambique, Botswana, Swaziland, and various countries in Asia. The disadvantage of the
Migration Help Desk, is that the data is based on visitors to the Help Desk. Unless and until a level of trust and
rapport has been developed including assurances for security a limited number of migrants will come forward
to the Desk notwithstanding their need for help. This is especially so with undocumented migrants fearing that
they might be apprehended by authorities and eventually deported. The Migration Help Desk is a powerful tool
to be utilised, as the Centre has direct contact with migrants. This is useful to track issues of xenophobia and
exploitation, which may be difficult to capture in a survey. Analysis of the issues reported by migrants and year
on year trends can be established to lend a view of the overall situation faced by migrants.
3.5 Big data
Big data is different from normal household surveys as sampling of individuals is not done but data is extracted
from the total population using mobile phones or internet based platforms. This data is accessible in real time.
Big data also differs from old-style data because of the specific technical and analytical methods required to
extract meaningful insights from them and transform these data into value. The use this produced information
is important for decision-making. Over a period of time a number of projects and applications have proved to
have potential of using different types of big data sources such as mobile phones, social platforms and artificial
intelligence (used to predict movement of individuals) to improve the understanding of issues related to global
migration and human movement. Big data uses call records or mobile money transfers, social media or use of
search engines and earth observation data to collect migration data.
STATISTICS SOUTH AFRICA 51
Alternative Sources of Demographic Data (Report 03-00-17)
Big data sources that have so far been used in migration-related studies can be grouped under three broad
categories (Global Migration Group, 2017):
1. Mobile-phone-based (call records or mobile money transfers)
2. Internet-based (social media or use of search engines)
3. Sensor-based (Earth Observation Data (satellite imagery)).
Big data refers to data that is generated by users of mobile devices, internet-based platforms, or by digital
sensors and meters, like satellite imagery. Such data is stored in real time in large databases, usually owned
by private companies. However, big data is not only "big" because of its volume; the speed ("velocity") at which
it is generated and the complexity ("variety") of the information are also considered as distinguishing features
of this kind of data (Hilbert, 2013). There are about 5,16 billion unique mobile users, and around 4,57 billion
active internet users around the world (as indicated in the Border Security report) and it provides an opportunity
to source out migration data and also improve knowledge of various aspects of migration. This is relevant in
light of the current data gaps and the need to monitor progress towards the migration-related targets in the
Sustainable Development Goals (SDGs). The potential of these sources comes with significant challenges.
Big data is different from normal household surveys as sampling of individuals is not done but data is extracted
from the total population using mobile phones or internet-based platforms. This data is accessible in real time.
Big data also differs from old-style data because of the specific technical and analytical methods required to
extract meaningful insights from it and transform this data into value. The use this produced information is
important for decision-making. The advantage of big data is that big data sources are timely and provide real-
time data. They also have broad coverage and are automatically collected. Another advantage of big data is
that it will overcome resource scarcity, in that the data is already in existence, and one does not have to pay
for it to be collected. It will also allow for more frequent and timely reporting, and be able to generate data on
phenomenon that is difficult to capture with traditional data sources and administrative sources.37 Some
limitations to these sources are that they can be biased and there are privacy and ethical issues with the
collection and use of this data. Other challenges are the lack of use of statistical standard concepts, definitions
and classifications that lead to questions on data quality, comparability and reliability.38 There may be technical,
analytical and legal challenges due to difficulties in accessing data that is in the hands of private or state actors.
Data may also pose to be problematic when trying to use the data for research purposes. There may also be
methodological difficulties in extracting meaning from huge, complex and "noisy" volumes of data.
37 United Nations Statistics Division. 2019. Overview of non-traditional data sources for the SDGs and ensuring data quality. Vienna: UNSTATS 38 United Nations Statistics Division. 2019. Overview of non-traditional data sources for the SDGs and ensuring data quality. Vienna: UNSTATS
STATISTICS SOUTH AFRICA 52
Alternative Sources of Demographic Data (Report 03-00-17)
3.6 Social media
Social media is any digital tool that allows users to quickly create and share content with the public. Social
media encompasses a wide range of websites and apps such as Facebook, Twitter, WhatsApp and Instagram,
LinkedIn, YouTube.39 Mobile phones, online tools and platforms, such as social media or online payment
services, have become a potentially useful source for migration data. Big data sources, such as social media
and call detail records can produce statistics on migrant flows, drivers and impact of migration, and internal
migration. Information produced by innovative sources includes migrant flows, drivers and impact of migration,
internal migration, public opinion on migration, among others. Geo-located social media activity, such as on
Twitter and Facebook has been used to infer international migration flows and stocks, also disaggregated by
age, sex as well as skill levels or sector of occupation, based on user self-reported information. Social media
data can be used for providing information as in a "real-time census" at the national or global level at a certain
point in time. Repeated logins to the same website and IP addresses from e-mail sending activity have been
used to estimate international mobility patterns and users' likelihood to move to another country.
3.7 Case study: Botswana
A case study of Botswana shows how the country was able to gain a better understanding of service delivery.
UNDP and the Data-Pop Alliance supported Botswana to use non-traditional data sources in dealing with
service delivery concerns. Using Facebook as the main data source due to its popularity and accessibility
among the public in Botswana, an algorithm was developed to collect frequently used words on Facebook to
map trending concerns among citizens. The more a word was used, the larger the visualisation of the word,
enabling quick data collection of major challenges across services. The initiative showed that the public was
more responsive to social media than to traditional methods in terms of providing feedback on public services,
and helped generate a more comprehensive picture of the state of service delivery in Botswana.40 Similarly,
this can be applied with migrants and migration, where issues of xenophobia, smuggling and trafficking can
be raised, and tracked.
3.8 Facebook as an alternate data source
Social media such as Facebook offers an alternative data source. Anonymised Facebook data, which is
collected regularly for advertisers, provides precise demographic data on the genders and ages of migrating
users. This enables us not only to track how many people moved following, e.g. a disaster, but also whether
as many men as women emigrated and their ages at that time. Even compared to other unconventional
sources such as passenger lists and mobile phone data, this is an additional benefit. The benefit of this is that
Facebook provides precise demographic data on the genders and ages of migrating users, it is comparatively
efficient and cheap. This data is accessible in real time.
This social network is mainly used by younger people, whereas older people are underrepresented in relation
to their share of the total population.
39 Hudson, M. 2020. What is social media? www.thebalancesmb.com/what-is-social-media 40 United Nations Development Programme. 2020. Guide to data innovation for development.

STATISTICS SOUTH AFRICA 53
Alternative Sources of Demographic Data (Report 03-00-17)
3.9 Cellphone records (mobility, movement peaks)
Mobile phone call detail records (CDRs) have been used to track internal displacement following natural
disasters.
3.10 Remittance
Remittances are money or goods that migrants send back to their family and friends in their country of origin.
Remittances are the most direct link between migration and development.41 Data on remittances may not
include money sent via small money transfer operators, the post office, mobile phones, informal traders, or
with other family members or friends. However, data may be obtained from money transfer agencies, such as
Money transfer, Mukuru.com, Hello Paisa, Mama Money, and World Remit. Data may not be composite or
complete on the picture of remittances, but it is able to provide overall trends. For example, during the corona
virus pandemic and the ensuing national lockdowns, did remittances decrease? This data will be available
from national money transfer agencies.
3.11 The Migration, Gender and Health Systems
A growing body of research attempts to present the various ways in which the use and analysis of big data
can help expose forced displacement, transnational networks, human trafficking or estimate remittance flows
and health-related experiences of international and internal migrants. There is a recent research project that
aims to explore the use of a mobile technology as a tool for researching the health-related experiences of
international and internal migrants in 'real-time'. The Migration, Gender and Health Systems (MiGHS) is a
collaboration between the Universities of the Witwatersrand (Wits) and Cape Town (UCT), the London School
of Hygiene and Tropical Medicine (LSHTM) and the South African National Department of Health (NDoH). It
has been reported that the use of WhatsApp provides the opportunity to gather real-time data from participants
over a period of time. Data that, in this case, will hopefully go some way to improving our understandings of
the ways in which migrant and mobile individuals move; their health experiences and interactions with the
healthcare system; and the ways in which their movement and healthcare seeking in South Africa is mitigated
or complicated by their gender identity.
41 International Migration for Organization. 2017. Remittances. Migration Data Portal. https://migrationdataportal.org/themes/remittances

STATISTICS SOUTH AFRICA 54
Alternative Sources of Demographic Data (Report 03-00-17)
3.12 Internet applications
Several international non-governmental organisations have created internet applications that provide refugees
and migrant's information sources that may be more reliable than social media.
The International Organization for Migration created the MigApp, which offers comprehensive information
on the risks of migration, visa regulations and government policies, as well as access to migration services
and programmes.
The International Rescue Committee created Refugee.Info to provide refugees and migrants with credible,
up-to-date, relevant information in six different languages on needs such as legal rights, transportation and
medical services.
The Red Cross and Red Crescent societies created Trace the Face, an internet platform that makes it
possible for refugees and migrants to find missing relatives and friends.
These tailor-made digital tools enable access to valuable information and services, but research shows
refugees and migrants tend to be reluctant to turn to NGOs for migration-related information. For example, the
Mixed Migration Monitoring Mechanism initiative (4Mi) data reported that information provided by authorities
or by NGOs is hardly ever the first source of information for people in mixed migration flows.
3.13 Integreat
"Integreat" is an information application and website tailored to the specific needs of both newcomers as the
users of the application and municipal administrations as the content providers in Germany. It's a mobile guide
for newcomers. Multilingual. Offline. Free. The aim was to provide the people arriving in a city with all relevant
information in their native language as quickly as possible, even without internet access and without confusing
red tape. The result is an application called Integreat which passes on all relevant information in multiple
languages to the newcomers. It is a holistic service ecosystem for cities, districts and organisations for the
integration of people with a flight or migration background.
An app/website such as Integreat, whilst assisting the new migrant in the country of destination, also provides
information on the migrant which when anonymised, can be used for trend analysis. A disadvantage however,
is that the choice is on the migrant to use the app.
3.14 The Mohajer App (Iran, US, Canada and UK)
"The Mohajer App" was created with the support of Afghan communities inside Iran to address their needs.
The app was completed with a group of paid and voluntary refugee-rights attorneys, advocates and
technologists. Mohajer has two features: The "Get Informed" section provides information for users concerning
Iran's immigration policy, the rights of Afghans in Iran, and resources that are available for concerns such as
health, education, combatting from discrimination and more; the list continues to expand as users share their
needs. The section also provides a list of support groups that our team has verified directly. The "Submit
Report" feature enables users to share their everyday experiences as Afghans in Iran and support the larger
community in addressing challenges by sharing information on events and experiences. The information on
the app is also accessible offline, so as to support those without regular internet access.
STATISTICS SOUTH AFRICA 55
Alternative Sources of Demographic Data (Report 03-00-17)
3.15 Case study: Using email data to estimate international migration rates42
The authors estimated age and gender-specific migration rates using data extracted from a large sample of
Yahoo! e-mail messages. Age and gender of anonymous e-mail users were linked to the geographic locations
(derived from IP addresses) from where users sent e-mail messages over time (2009-2011). Country of
residence over time was inferred as the one from where most e-mail messages were sent. The estimates of
age profiles of migration were consistent with existing administrative data sources and the approach allowed
comparison in a reliable way. The findings recommend that e-mail data may complement existing migration
data, resolve inconsistencies arising from different definitions of migration, and provide new and rich
information on mobility patterns and social networks of migrants.
4. Challenges
While prioritising data innovation, one needs to be cognisant of the reality of the methodological challenges.
National statistics offices have a role to play in the provision of official statistics to the government, and are
bound by certain quality assessment frameworks, and principals. Whilst being innovative, there is a need to
ensure the quality of reporting and products. Some challenges identified are:
a. Data access, continuity and independence
Data collection may be ad hoc, limited or of poor quality
b. Confidentiality
With data-sharing initiatives, especially when vulnerable populations are represented in the data, there
are very real privacy concerns to take into account. The need for data responsibility in the field is
increasingly recognized
c. Security/ethical issues
Ethical issues are to be considered in the tracking of people. Organisations must ensure it is used in a
responsible manner
d. Methodology (selection bias)
Dialogue needed with private sector and service providers to understand what is being measured
e. Reliability
Ensure the reliability of the data being collected
f. Definitions
Different vocabulary and definitions are utilised amongst organisation. This poses a challenge as to what
is being collected and measured. Definitions change over time, and needs to constantly be updated.
Definitions also differ between organisations
g. Fragmentation of applications
Data is owned by various companies in the private sector, and is not collated. There is a need for an integration
of data and for leadership in this regards. There is a need to promote responsible data leadership in more
sustainable, systematic and responsible ways.
42 Zagheni, E., Weber, I. G. In: Association for Computing Machinery, ACM (Ed.): Proceedings of ACM WebSci 2012, June 22-24, 2012, Evanston, Illinois,
USA, 497–506 New York, NY, ACM (2012)

STATISTICS SOUTH AFRICA 56
Alternative Sources of Demographic Data (Report 03-00-17)
5. Data collaboratives
Data is central to meeting migration challenges and to enabling public policy innovation in a variety of ways.
Yet, for all of data's potential to address public challenges, the truth remains that most data generated today
are in fact collected by the private sector. This data contains tremendous possible insights and avenues for
innovation in how we solve public problems. But because of access restrictions, privacy concerns and often
limited data science capacity, their vast potential often goes untapped.43 Data collaboratives are an emerging
form of partnership, typically between the private and public sectors, but often also involving civil society groups
and the education sector. The benefits of data collaboratives in the migration field are as follows:44
5.1 Improved situational analysis
Understanding migrant and refugee flows is one of the challenges affecting governments in efforts to effectually
manage migration, and alleviate the hardship of refugees and other migrants in vulnerable situations.
DigitalGlobe, a satellite imagery company, has been working with UNHCR to provide data on Sudanese
refugees. The GovLab is working with UNICEF and the Harvard Humanitarian Initiative to leverage satellite
data towards similar goals in Somalia. In these cases, data are allowing stakeholders to better visualise, and
therefore respond more effectively, to migrant flows.
5.2 Better understanding of migration drivers
Migrant and refugee flows are dynamic. According to migration theory, there are certain push and pull factors,
however these may change depending on the economic, political and environmental situation. To better
understand drivers of migration, approaches such as the Data Challenge on Integration of Migrants in Cities,
have been used in the EU to better understand migrant behaviour in cities across eight countries. The Data
for Integration (D4I) dataset is a mapping tool and has been obtained through a spatial disaggregation of
statistics of the 2011 Census, collected from National Statistical Offices. The results of the spatial processing
of the original data is a uniform grid showing the concentration of migrants in cells of 100 by 100 m in all cities
of eight European countries (France, Germany, Ireland, Italy, Netherlands, Portugal, Spain, the United
Kingdom).
5.3 Enhanced prediction and forecasting
The ability to predict migrant flows will allow for sufficient planning and targeting of policies and spatial planning.
Recent works have shown that census-derived migration data provides a good proxy for internal connectivity,
in terms of relative strengths of movement between administrative units, across temporal scales. Research
undertaken by Sorichetta et al. (2016)45 describes the construction of an open access archive of estimated
internal migration flows in malaria endemic countries built through pooling of census microdata.
43 Verhulst SG and Young A. 2018. 4 reasons why Data Collaboratives are key to addressing migration. 44 Verhulst SG and Young A. 2018. 4 reasons why Data Collaboratives are key to addressing migration 45 Sorichetta, A., Bird, T., Ruktanonchai, N. et al. Mapping internal connectivity through human migration in malaria endemic countries. Sci Data 3, 160066 (2016). https://doi.org/10.1038/sdata.2016.66

STATISTICS SOUTH AFRICA 57
Alternative Sources of Demographic Data (Report 03-00-17)
5.4 More effective impact assessments and evaluation
Impact assessment and evaluation is an often under-appreciated part of any effort to address migrant flows.
But understanding what works, and under what conditions, is critical to addressing large movements of
migrants and refugees and better manage migration now and in the future.46 The SoBigDataProject estimates
flows and stocks from available data in real time, by building models that map observed measures extracted
from unconventional data sources to official data between Italy and Senegal.
6. Conclusion
Comprehensive migration data, which is of good quality and made available timeously, is essential for
countries to effectively manage migration and ensure that migrants are not left behind. Despite this, substantial
data gaps exist on a myriad of migration and development related indicators. The inclusion of migration in the
domestic, regional and global development framework poses several new challenges for national-level
statistical systems. Better use of existing data sources, as well as developing new methods to collect data on
migration will be required. Censuses will need to provide more disaggregated data by migratory status in order
to ensure "no migrant is left behind" – the 2030 Agenda's guiding principle. The compilation and analysis of
administrative data from national sources will need to better indicate global migration flows and policy
responses. The addition of migration questions to surveys will be required in order to collect more
comprehensive national and international migration data. The use of alternative migration data sources
presents advantages to avoid common problems and shortfalls with data emanating from a census, such as
providing data at custom spatial levels, and importantly, targeting and capturing populations that are classified
as hard-to-count. Innovative data sources, such as big data sources, will have to be better monitored and
implemented in order to track migration flows and ensure all migrants are recorded. A challenge, however, is
that alternative data sources do not prescribe to data quality assessment frameworks such as SASQAF, and
UN Quality Principals. Accessing and utilising non-traditional methods for statistical purposes potentially may
affect the confidentiality and privacy of individuals, households and businesses at risk. There is the concern of
bias, as data sources from social media, mobile phones, money transfers, are not representative of the entire
population. Data on pertinent migration issues such as environmental migration, forced displacement,
internally displaced persons, smuggling and trafficking, amongst others, is critically but still highly inaccessible.
46 Verhulst SG and Young A. 2018. 4 reasons why Data Collaboratives are key to addressing migration.
STATISTICS SOUTH AFRICA 58
Alternative Sources of Demographic Data (Report 03-00-17)
References
African Union. 2017. The Revised Migration Policy Framework for Africa and Plan of Action (2018 – 2027)
De Brauw, A. and Carletto, C. 2012. Improving the measurement and policy relevance of migration information
in multi-topic household surveys. Washington DC: World Bank.
Hall, K.2016. Maternal and child migration in post-apartheid South Africa: Evidence from the NIDS panel study.
Cape Town: SALDRU, University of Cape Town. SALDRU Working Paper Number 178/ NIDS Discussion
Paper 2016/5
Hudson, M. 2020. What is social media? www.thebalancesmb.com/what-is-social-media
International Migration for Organization. 2017. Remittances. Migration Data Portal.
https://migrationdataportal.org/themes/remittances
International Organization for Migration. 2017. Global data gaps. www.migrationdataportal.org
International Organization for Migration. 2020. Migration data sources.
https://migrationdataportal.org/themes/migration-data-sources
Landau, L.B. & Gindrey, B. 2008. Migration and population trends in Gauteng province 1996-2055. University
of Witwatersrand, Volume 42.
Landau, L.B. 2011. Introducing the Demons. In: L.B. Landau, ed. Exorcising the demons within: xenophobia,
violence and statecraft in contemporary South Africa. Johannesburg: Tokyo: Wits University Press, pp. 1-26.
Mapuva, J. & Muyengwa-Mapuva, L. 2014. The SADC regional bloc: What challenges and prospects for
regional integration? Law, Democracy and Development, Volume 18, pp. 22-36. National Planning
Commission. 2012. National Development Plan 2030: Our future – make it work. Pretoria: National Planning
Commission
Massey, D.S. & Espinosa, K.E. 1997. What's driving Mexico-US migration? A theoretical, empirical, and policy
analysis. American Journal of Sociology, 102(4), pp. 939-999
National Planning Commission. 2012. National Development Plan 2030: Our future – make it work. Pretoria:
National Planning Commission
OECD. 2001. Glossary of statistical terms. https://stats.oecd.org/glossary/detail.asp?ID=2082
Rodríguez-Pose, A. & Tijmstra, S. 2005. Local Economic Development as an alternative approach to economic
development in Sub-Saharan Africa. Washington Dc: The World Bank.
Segatti, A. 2011. Migration to South Africa: Regional Challenges versus National Instruments and Interests.
In: A. Segatti & L.B. Loren, eds. Contemporary Migration to South Africa: a Regional Development Issue.
Washington DC: The International Bank for Reconstruction and Development / The World Bank, pp. 9-29

STATISTICS SOUTH AFRICA 59
Alternative Sources of Demographic Data (Report 03-00-17)
Sorichetta, A., Bird, T., Ruktanonchai, N. et al. Mapping internal connectivity through human migration in
malaria endemic countries. Sci Data 3, 160066 (2016). https://doi.org/10.1038/sdata.2016.66
Statistics South Africa. 2005. Documented migration 2003. Pretoria: Statistics South Africa
Statistics South Africa. 2015. Census 2011: Migration Dynamics in South Africa. Pretoria: Statistics South
Africa.
Statistics South Africa. 2016. Community Survey 2016. Pretoria: Statistics South Africa
Statistics South Africa. 2016. Community Survey 2016. Pretoria: Statistics South Africa
Statistics South Africa. 2018. Labour Market Dynamics in South Africa 2017. Pretoria: Statistics South Africa
Statistics South Africa. 2019. Labour market outcomes of migrant populations in South Africa, 2012 and 2017.
Pretoria: Statistics South Africa
Statistics South Africa. 2020. Social impact of COVID-19 (Wave 3): Mobility, Migration, and Education.
Pretoria: Statistics South Africa
UNFPA. 2019. Measuring Migration in a Census. https://www.unfpa.org/sites/default/files/resource-
pdf/measuring-migration.pdf
United Nations Department of Economic and Social Affairs. 2017. International Migration Report 2017. New
York: United Nations
United Nations Development Programme. 2020. Guide to data innovation for development.
United Nations Statistics Division. 2019. Overview of non-traditional data sources for the SDGs and ensuring
data quality. Vienna: UNSTATS
United Nations Women (2019). Women and the Sustainable Development Goals (SDGs).
Verhulst SG and Young A. 2018. 4 reasons why Data Collaboratives are key to addressing migration
Ye, Y., Wamukoya, M., Ezeh, A. et al. Health and demographic surveillance systems: a step towards full civil
registration and vital statistics system in sub-Sahara Africa? BMC Public Health 12, 741 (2012).
https://doi.org/10.1186/1471-2458-12-741

STATISTICS SOUTH AFRICA 60
Alternative Sources of Demographic Data (Report 03-00-17)
CHAPTER 4: CURRENT LEGISLATIVE REVIEW AND APPLICATION OF STANDARDS TO ALTERNATIVE DATA SOURCES
STATISTICS SOUTH AFRICA 61
Alternative Sources of Demographic Data (Report 03-00-17)
1. Introduction
New needs are often multi-domain issues which cannot be answered by traditional model of production only.
Stats SA needs to be agile and conduct in-depth analysis in order to be responsive to answer the new needs
which will include among other things combining data from different sources and reusing of administrative data
for statistical purposes (Stats SA, 2020). Without high quality data, providing the right information on the right
things at the right time, designing, monitoring and evaluating effective policies becomes almost impossible
(UN, 2014).
One of the statutory mandates allocated to Stats SA under the Statistics Act is that Statistics should be
assessed in terms of their quality and fitness for required purpose. Although there has been some progress
in implementing the mandate, the national statistics was still characterised by gaps such as information gap,
quality gap and capacity gap. As such, Stats SA used its statutory mandate for statistical leadership to develop
various strategies aimed at closing these gaps that were observed. The organization created National Statistics
System (NSS) to align the use and production of statistics, particularly those collected within the various
institutions and organisations of national, provincial and local government, and other organs of state (Stats
SA, 2010a).
This report is advocating for the use of alternative sources of demographic data which are mostly produced by
National departments and private sector. The statistics produced from these sources will have an influence on
the development of government policy, or on the measurement and monitoring of government programmes.
Therefore, they must be evaluated within the framework of the NSS using the South African Statistical Quality
Framework (SASQAF). This initiative was also guided by international standards, such as the Data Quality
Assessment Framework (DQAF) of the International Monetary Fund (IMF) and the Fundamental Principles of
Official Statistics, provided by the United Nations' Statistics Division.
2. Role of South African Statistical Quality Assessment Framework (SASQAF) in non-traditional data sources
The challenge of Stats SA remains to build trust in official statistics. Central to this challenge is the improvement
of the quality of the data produced in Stats SA and all organs of state. The first process of assessment of these
sources is that they must comply with the following criteria:
The producing agency should be a member of the NSS.
The statistics need to meet user needs beyond those specific and internal to the producing agency
The statistics produced should be part of the sustainable series, not a once off collection
On meeting these criteria, data is assessed using Data Quality Assessment Team (DQAT) standards. These
standards are, quality statistics, acceptable statistics, questionable statistics or poor statistics.
Within Stats SA and the NSS entities, the South African Statistical Quality Assessment Framework (SASQAF)
provides a universal framework for assessing the quality of statistics. Its main purpose is to provide a flexible
structure for the assessment of statistical products. The framework has been considered too narrow as it
focuses mainly in the assessment of census and survey data, however there are initiatives underway to make
STATISTICS SOUTH AFRICA 62
Alternative Sources of Demographic Data (Report 03-00-17)
it more targeted for new demands for administrative and big data sources. The definition of data quality in
terms of fitness for use is further defined in terms of the prerequisites and the eight dimensions of quality
namely, relevance, accuracy, timeliness, accessibility, interpretability, coherence methodological soundness
and integrity. The demographic data from alternative sources must comply with these dimensions to be
declared fit for use. For further reading, refer to SASQAF, 2nd edition, 2010.
3. SASQAF lite
SASQAF lite assessment is also the foundation phase of the SASQAF assessment. SASQAF lite comprises
five SASQAF quality dimensions, namely:
accuracy
comparability
coherence
methodological soundness and
integrity
This data assessment gives a glimpse of the state of quality of a particular statistical product in a short period
of time as opposed to the full SASQAF assessment. This method of data assessment will enable the agency
producing the statistics to identify the measures that need to be put in place in order to address accuracy,
comparability and coherence. The agency producing the statistics will then see if the data can be benchmarked
or interrogated using alternative data sources. The SASQAF lite assessment also shows that the methodology
adopted (or adapted) is scientifically sound. With regard to integrity, the SASQAF lite assessment will identify
whether the institutional arrangements may have a significant influence on the effectiveness and credibility of
the agency producing the statistics, and on the quality of statistics in general. For example, the statistical
information may be manipulated by other stakeholders such as political principals to achieve their own agendas
(Stats SA, 2015).
Statistics South Africa has established the South African National Statistics System (SANNS) to lead the
coordination of the statistical system in South Africa. It also facilitates information sharing amongst SANSS
partners and other data producing agencies. The process of accessing external data none other than Stats
SA’s is through data sharing protocols which are in place and signing of a Memorandum of Understanding
(MoUs) or through Service Level Agreements (SLAs) which constitutes the entire agreement between the
parties. All information acquired are also required to be stored and distributed in a manner that does not
compromise confidentiality as per the Stats Act.
4. Application of standards to alternative data sources
Statistics South Africa (Stats SA), as the state agency in charge of producing official statistics, has the
responsibility to inform users of the concepts and methodologies used in collecting, processing and analysing
its data, the accuracy of the data it produces, and any other features that may affect their quality or "fitness for
use. The organization must place quality measures on all disseminated data to assist users to interpret the
data and to inform users on the nature, magnitude and significance of the major quality features of the data
disseminated (Stats SA, 2006).

STATISTICS SOUTH AFRICA 63
Alternative Sources of Demographic Data (Report 03-00-17)
The development of efficient processes for production of statistics by different survey areas requires
development of standards on content describing the precise nature of statistics being produced, and the way
that this content is accessed by other producers, and users of the statistical products. Concepts and Definitions
for Statistics South Africa contains a comprehensive set of definitions that describe the statistics, and
processes used in the compilation by Stats SA survey areas. Without agreement on common terminology and
definitions, there is a risk that different survey areas in the organisation will not be able to share data and users
will not be able to interpret the data correctly. In other words, data sharing, interpretation and comparability
can only be meaningful if it is based on common concepts and definitions (Stats SA, 2010b).
5. Conclusion
In conclusion, the statistics system in South Africa is not fully responding to the country’s diverse needs. The
digital economy is flooding stakeholders with information produced by other producers in the data ecosystem.
The organization must therefore seek opportunities and partnerships that will capitalise in diverse data sources
as a solution to the information gap. The content of these non-traditional sources should adhere to relevant
standards and the SASQAF so that the institution sustains the quality of national indicators to inform evidence
based decisions and bringing new insight to the users.

STATISTICS SOUTH AFRICA 64
Alternative Sources of Demographic Data (Report 03-00-17)
References
Stats SA, 2020. Strategic Plan 2020/2021 – 2024/2025, Pretoria
Stats SA 2015, Statistics of the non-profit sector for South Africa, 2012. Discussion No.D0407.2, Pretoria
Stats SA 2006, Data Quality Policy 001: Policy on Informing Users of Data Quality, Pretoria
Stats SA, 2010 (a). South African Statistical Quality Assessment Framework (SASQAF), Second edition,
Pretoria.
Stats SA, 2010 (b) Concepts and Definitions for Statistics South Africa 2010 Version 3, Pretoria
Stats SA, 2020, Annual Report 2019/2020 (Book 1), Pretoria
United Nations, 2014. A world that count: Mobilising The Data Revolution for Sustainable Development. New
York, Geneva.