Embed Size (px)
Citation preview

Report to the
Global CCS Institute
Cooling Alternatives Evaluation for a New Pulverized Coal Power Plant with
Carbon Capture
August 2011

DISCLAIMER
This Report and the contents hereof (collectively, this “Report”) are being provided pursuant to and in accordance with that certain Funding Agreement by and between the Global Carbon Capture and Storage Institute Ltd. and Tenaska, Inc. (the “Funding Agreement”). Except as otherwise explicitly stated in the Funding Agreement, the provisions of the Funding Agreement are for the sole protection and legal benefit of the parties thereto, and their permitted successors and assigns, and no other person or entity shall be a direct or indirect beneficiary of, or have any direct or indirect cause of action or claim against, any party arising from the Funding Agreement or the publication, disclosure or distribution of this Report.
This Report does not constitute the provision of engineering or design services or advice and should not be utilized or relied on by any person or entity as engineering or design services or advice. For the avoidance of doubt, neither Tenaska, Inc., Tenaska Trailblazer Partners LLC, nor their affiliates shall be liable to any third party for any harm or loss associated with utilization of or reliance on this Report.

Abstract
The Tenaska Trailblazer Energy Center is a nominal 760 megawatt supercritical pulverized coal electric generating station under development in Nolan County, Texas, United States, approximately nine miles east of Sweetwater, Texas.
Trailblazer is expected to be one of the first new-build coal plant in the United States to incorporate a commercial-scale carbon dioxide capture plant into the initial design. The Project will be designed to capture 85 to 90 percent of the carbon dioxide that otherwise would be emitted into the atmosphere.
This report describes the process used to determine the best alternative for the Project’s cooling systems.
This is the ninth in a series of knowledge sharing reports on carbon capture and storage developed by Tenaska for the Global CCS Institute. A report issued in December 2010 titled The Management of Public Engagement at the Local, State and Federal Levels for the Tenaska Trailblazer Energy Center Project provides additional background related to the Project’s water supply efforts.

Cooling Alternatives Evaluation for a New PC Power Plant with Carbon Capture
August 2011
Table of Contents
1.0 INTRODUCTION .................................................................................................. 1
2.0 PURPOSE AND GOALS ....................................................................................... 3
3.0 EXECUTIVE SUMMARY ........................................................................................ 4 3.1 Overview ........................................................................................................................... 4
3.2 Evaluation Results .......................................................................................................... 4
4.0 PLANT COOLING OPTIONS – DETAILED DESCRIPTION ........................................... 7 4.1 Evaluation Cases ............................................................................................................. 7
4.2 Technical Evaluation ....................................................................................................... 8 4.2.1 Case 1 – 100 Percent Water Cooled ................................................................................... 8
4.2.2 Case 2 – 100 Percent Air Cooled ........................................................................................ 8
4.2.3 Case 3 – Hybrid Cooling ..................................................................................................... 9
5.0 WATER AND WASTEWATER TREATMENT DESIGN CONFIGURATION DETERMINATION ...................................................................................................................... 11 5.1 Pretreatment .................................................................................................................. 11
5.2 Demineralization ............................................................................................................ 13
5.3 Wastewater Treatment .................................................................................................. 14 5.3.1 Water Cooling Scenario .................................................................................................... 15
5.3.2 Dry Cooling Scenario ........................................................................................................ 15
5.3.3 Hybrid Cooling Scenario .................................................................................................... 16
6.0 COOLING OPTIONS COMPARISON ..................................................................... 18 6.1 Cost and Performance Summary ................................................................................. 18
6.1.1 Capital Cost ....................................................................................................................... 18
6.1.2 Operating and Maintenance Costs .................................................................................... 19
6.1.3 Performance and Water Use Summary ............................................................................. 20
6.2 Assumptions .................................................................................................................. 22 6.2.1 Cooling Options Assumptions ........................................................................................... 22
6.2.2 Water Analysis .................................................................................................................. 22
6.2.3 Water Treatment Costs ..................................................................................................... 22
6.3 Water Cost Sensitivity Analysis ................................................................................... 22

7.0 LESSONS LEARNED ......................................................................................... 26
8.0 RELEVANCE TO CARBON CAPTURE AND STORAGE ............................................ 27
9.0 CONCLUSIONS ................................................................................................. 28 9.1 Cooling Options ............................................................................................................. 28
9.2 Water Treatment ............................................................................................................ 28 9.2.1 Pretreatment ..................................................................................................................... 28
9.2.2 Demineralization ............................................................................................................... 28
9.2.3 Wastewater ....................................................................................................................... 28
10.0 ACRONYMS AND CITATIONS ........................................................................... 29

-1-
1.0 Introduction The Tenaska Trailblazer Energy Center (Trailblazer or Project) is expected to be the first new-build coal plant in the United States (US) to incorporate a commercial-scale carbon dioxide (CO2) capture plant into the initial design. The Project will be designed to capture 85 to 90 percent of the CO2 that otherwise would be emitted into the atmosphere. CO2 from the Project will be sold into the Permian Basin CO2 market in West Texas, where it will be used in Enhanced Oil Recovery (EOR) and ultimately stored permanently underground.
Trailblazer will consist of both a state-of-the-art pulverized coal facility (PC Plant) and a carbon capture facility (CC Plant). References to Trailblazer or the Project refer to the combined PC Plant and CC Plant.
The Project is located in a semi-arid area, with annual rainfall averaging about 22 inches (56 centimeters). As such, very early in the Project’s development (prior to Fluor’s involvement and prior to the PC and CC Plant Front-End Engineering and Design studies), Tenaska explored several cooling options, including:
1. air cooling, 2. full wet cooling, and 3. partial wet cooling (hybrid cooling).
Through this high-level analysis and due to water rights restrictions and for other strategic reasons, Tenaska made the base case assumption that Trailblazer would need to employ air cooling in order to reduce the PC Plant’s water usage. The terms air cooling and dry cooling are used interchangeably through this report.
Subsequent to this high-level analysis, during the PC Plant Front-End Engineering and Design (FEED) study but still prior to the CC Plant FEED study, Fluor and Tenaska conducted a more in-depth engineering evaluation to determine the best cooling option for the systems and processes of the Project including both the PC and CC plants. Fluor completed that study in February 2010. This report primarily summarizes the findings from the February 2010 PC Plant FEED study, which confirmed air cooling as the best choice for the Project.
In August 2010, Tenaska commissioned Fluor to conduct the CC Plant FEED study. The CC Plant FEED study, which drew upon the results from the earlier cooling study, yielded additional findings related to CC Plant cooling. Section 7.0 of this report, “Further Findings,” discusses the additional findings from the CC Plant FEED study.
The studies did not include all conceivable design configurations and conditions. Further studies for optimization of water use may be done in the future when the Project’s economics are more certain.
Some of the benefits and challenges of using air cooling on Trailblazer include:
• Reduces Trailblazer’s water needs by more than 90 percent – from an average of

-2-
more than 11.7 million gallons per day (mgd) to an average of about 1 mgd;
• Reduces net generation by nominally 2.5 megawatts (MW) and increases the heat rate by nominally 50 British thermal unit (Btu)u/kilowatt hour (kWhr) (higher heating value basis) for the average ambient condition of 64°F dry bulb and 55°F (18°C and 13°C, respectively) temperatures. These impacts increase to nominally 44.5 MW and 1,000 Btu/kWhr for the maximum ambient condition of 99.6°F dry bulb and 72°F wet bulb (38°C and 22°C, respectively) temperature.
• Increases the overall capital cost by more than US Dollars (USD)$100 million (2009) vs. wet cooling.
• Reduces Operating and Maintenance (O&M) costs by nominally USD$13million/yr (2009).
Considering these impacts, along with Project economic evaluation factors and the assumed cost of water, the study’s economic analysis shows that air cooling had the lowest total evaluated cost. Furthermore, the lack of a source to provide the 11.7 mgd (44,289 m3/d) of water led the Project to select air cooling as its base case. This conclusion is unique to Trailblazer, and could be different for a different project located in a different part of the country.
With regard to the air cooling option, Tenaska established separate and distinct ambient design temperatures for the PC and CC Plants, respectively. Tenaska set the PC plant design temperature at 99.6°F (37.6°C) which is near the max ambient temperature for the site. However, Tenaska set the CC Plant design temperature at 82°F (27.8°C), where approximately 15 percent of the annual hours are higher than this temperature. When the ambient temperature exceeds the design temperature, the CO2 capture rate of the CC Plant is expected to decrease slightly from the 90 percent capture design point (down to approximately 88 percent at 99.6°F ambient dry bulb temperature). Tenaska preferred the slight capture rate degradation at high ambient temperatures over the alternative of a 99.6°F (37.6°C) design temperature which would have vastly increased the number of air coolers (to maintain the process operating conditions) and associated capital cost. The small CO2 capture degradation is deemed acceptable because Tenaska’s stated goal is to achieve between 85 and 90 percent CO2 capture. If continuous 90 percent capture is required in the future, this could be accomplished through the addition of more air coolers. PC Plant power generation and thermal efficiency are much more sensitive to high ambient temperatures (due to the impact of small increases in steam turbine backpressure) and, thus, Tenaska retained a high ambient design temperature for this portion of the Project.

-3-
2.0 Purpose and Goals As discussed in the report, The Management of Public Engagement at the Local, State and Federal Levels for the Tenaska Trailblazer Energy Center Project, water is a significant issue in semi-arid West Texas. The purpose of this report is to discuss the way in which the Project developers, knowing that obtaining water would be an emotional as well as technical issue, assessed the various options available to address the Project’s water requirements. The report also discusses the ways in which the addition of a CC Plant to a PC plant affects water needs.

-4-
3.0 Executive Summary 3.1 Overview Tenaska realized early in the development of Trailblazer that using water for an industrial purpose like the Project was an emotional as well as a technical issue in semi-arid West Texas. As a result, even early economic evaluations included the assumption that air cooling would be required to reduce the Project’s water consumption.
During the FEED for the PC Plant, a more in-depth analysis was conducted to understand both the technical and economic aspects of three potential cooling configurations: wet cooling; hybrid cooling; and air (or dry) cooling. This report primarily summarizes the findings from the PC Plant FEED study.
Subsequent to the PC Plant FEED study, Tenaska commissioned Fluor to complete the CC Plant FEED study. The CC Plant FEED study drew upon the results from the earlier cooling study, and yielded additional findings related to CC Plant cooling. Section 7.0, “Further Findings,” contains a discussion of these additional findings from the CC Plant FEED study.
The studies did not include all conceivable design configurations and conditions. Further study for optimization may be done in the future when economic evaluation factors are more certain.
3.2 Evaluation Results Tenaska, Fluor (as both the Technology Licensor and presumptive EPC contractor), and Burns & McDonnell (as Tenaska’a owners engineer) determined that all three cooling options (wet, dry, and hybrid) were technically feasible.
Air-cooled condensers commonly are used in power plants located in the semi-arid southwestern United States. For the CC Plant, the selection of a design temperature is a key decision for air cooling, as a high design temperature will result in high capital costs (requiring more air coolers) while a lower design temperature will reduce performance efficiency when the actual temperature exceeds the design temperature. Furthermore, Fluor has previous commercial-scale design and operating experience with dry cooling of the Econamine FG+ technology at the Bellingham natural gas combined cycle power plant. (Refer to Attachment 5)
With regard to the air cooling option, Tenaska established separate and distinct ambient design temperatures for the PC and CC Plants, respectively. Tenaska set the PC plant design temperature at 99.6°F (37.6°C) which is near the maximum ambient temperature for the site. However, Tenaska set the CC Plant design temperature at 82°F (27.8°C), where only approximately 15 percent of the annual hours are higher than this temperature. When the ambient temperature exceeds the design temperature, the CO2 capture rate of the CC Plant is expected to decrease slightly from the 90 percent capture design point (falling to approximately 88 percent at 99.6°F). Tenaska preferred the slight capture rate degradation at high ambient temperatures over the alternative of a 99.6°F (37.6°C) design temperature which would have vastly increased the number of air coolers

-5-
(to maintain the process operating conditions) and the associated capital cost. The small CO2 capture degradation was deemed acceptable because Tenaska’s stated goal is to achieve between 85 and 90 percent CO2 capture. If continuous 90 percent capture is required in the future, this could be accomplished through the addition of more air coolers. PC Plant thermal efficiency is much more sensitive to high ambient temperatures and, thus, Tenaska retained a high ambient design temperature. From a capital cost standpoint, air cooling was the most expensive, followed by hybrid cooling. Wet cooling was significantly less expensive from a capital cost perspective. The capital cost impact is greater than USD$100 million ($2009) for dry cooling vs. wet cooling. Qualitatively, the nature of this cost impact can be validated by observing the large area required for air coolers on the simplified plot plan (see Attachment 4).
From an Operating and Maintenance (O&M) standpoint, however, the rankings were exactly reversed, with air cooling being the least expensive at nominally USD$1.5 million/yr, followed by hybrid cooling at nominally USD$7.0 million/yr, and wet cooling at nominally USD$14.5 million/yr. This is due primarily to costs associated with the quantities of make-up water and wastewater treatment required; air cooling reduces the amount of water consumed to an average of 1 mgd (3,785 m3/d), compared to approximately 5 mgd (18,927 m3/d) for hybrid cooling and 11.7 mgd (44,289 m3/d) for wet cooling.
In all cases, Zero Liquid Discharge (ZLD) was a less expensive option than evaporation ponds for wastewater treatment.
The performance debit for dry cooling (vs. wet cooling) ranges from -2.5MW / +50 Btu/KWhr (Higher Heating Value basis) at the annual average conditions of 64°F dry bulb and 56°F wet bulb temperatures (18°C and 13°C, respectively) up to nominally -44.5 MW / +1,000 Btu/KWhr at the maximum ambient conditions of 99.6°F dry bulb and 72°F wet bulb temperatures (38°C and 22°C, respectively).
All together, using the Project economic evaluation factors and an assumed water price of USD$3.75 per thousand gallons, dry cooling has the lowest total evaluated cost. This conclusion is valid for dry cooling down to a water price of USD$2.71 per thousand gallons.
In addition to the economic evaluation, the lack of a source to provide the 11.7 mgd (44,289 m3/d) of water for the wet cooling case or even the 5 mgd (18,927 m3/d) for the hybrid case led the Project to reaffirm air cooling as its base case. This conclusion is unique to Trailblazer and its location in semi-arid West Texas.
3.3 Summary of Lessons Learned • Dry cooling of the Fluor Econamine FG+ technology is feasible for the
Trailblazer site in West Texas. However, the cost of air coolers is high and increases with the design temperature. Tenaska elected to accept an air cooler design temperature less than the maximum ambient temperature (along with slight reduction in CO2 capture rate at high ambient temperatures) to minimize this cost. The sensitivity of capture rate, capital cost, and emissions is site-, technology-,

-6-
and project-specific.
• Despite the high capital costs, air cooling appears to have the lowest total evaluated cost due to the anticipated high cost of water and the project-specific economic evaluation factors.
• Wet cooling of the large, supercritical Trailblazer PC Plant has a large water demand of nominally 11.7 mgd (44,289 m3/d) for the average ambient condition and 15 mgd (56,781 m3/d) for the maximum ambient condition.
• Dry cooling substantially increases the CC Plant footprint. For Trailblazer, 710 air cooler fans are required, with the majority needing to be located in a separate field. This field nominally doubles the footprint of the CC Plant. See Attachment 4.
• Although the installation of CO2 capture consumes thermal energy (in the form of condensing low-pressure steam extracted from the PC Plant), it increases the overall cooling duty of the combined plant in total. If the CC Plant is wet cooled, it increases the cooling water demand by 25-40 percent depending on the ambient condition. However, if the CC Plant is dry cooled, it reduces the combined water demand because the inlet cooling of the flue gas to the CC Plant absorber condenses a portion of the water vapor which can be used to offset water demand in the PC Plant.
• In addition to air cooling, Tenaska is further minimizing water demand by designing the remaining water systems for 10 cycles of concentration (associated with titanium metallurgy) and the inclusion of the ZLD unit which provides a water recycle stream. The study determined that ZLD is more cost effective than evaporation ponds.
• Due to uncertainty surrounding the future of carbon legislation and the accompanying uncertainty regarding the economics of the Project, Tenaska has elected not to spend the money and resources required to fully evaluate, optimize, and make final cooling design decisions at this time.

-7-
4.0 Plant Cooling Options – Detailed Description 4.1 Evaluation Cases Three primary options were evaluated as alternative methods to provide cooling to the steam cycle and auxiliary equipment:
Case 1: 100 percent Water Cooled.
All plant cooling would be performed with evaporative mechanical draft cooling towers. The PC Plant and the CC Plant would be cooled with separate cooling towers. The design wet bulb temperature for these towers was 72.1°F (22°C). The main cycle condenser and heat exchangers at the CC and PC Plants are priced with titanium tubes to allow the cooling towers to be operated at 10 cycles of concentration. This was done to reduce total water usage, reduce wastewater treatment capital and operating costs, and reduce the risk of corrosion to materials. Equipment suppliers provided budget quotes for the cooling towers and the condenser. Case 2: 100 percent Air Cooled – PC Plant Main Cycle and CC Plant with minor water cooling for auxiliary equipment cooling duty. The PC Plant main cycle would be cooled by an air-cooled condenser designed for the maximum dry bulb temperature of 99.6°F (38°C). The CC Plant would be cooled by air-cooled heat exchangers designed for a dry bulb temperature of 82°F (28°C), which degrades the CO2 capture rate of the CC Plant by approximately 2 percent when operating at the maximum dry bulb temperature. The magnitude of this impact is a function of the specific CO2 capture technology and its operating conditions. Small wet cooling towers would be provided at the PC (~150 MMBtu/hr (158.3 GJ/hr)) and CC Plants (~20 MMBtu/hr (21.1 GJ/hr)) because air coolers would not be able to provide a sufficiently low temperature for some equipment (primarily lube oil coolers associated with major rotating machinery) at high ambient temperature conditions. These cooling towers are operated at 10 cycles of concentration to reduce water usage. Case 3: Hybrid Cooling – Combination of water and air cooling at the PC Plant and 100 percent air cooling at CC Plant.
The power plant would be cooled with a parallel cooling system which includes an air-cooled condenser, a steam surface condenser and a wet cooling tower. This system was designed for the maximum ambient condition of 99.6°F (38°C) dry bulb and 72.1°F (22°C) wet bulb temperatures. The main cycle condenser is priced with titanium tubes to allow the wet tower to be operated at 10 cycles of concentration. The cycles of concentration were limited to 10 based on water quality, corresponding corrosion factors and potential permitting requirements.
The hybrid cooling system design point was also based on maximum raw water usage of 2,500 gallons per minute (gpm) (158 liters per second (lps)) in the cooling tower. This water usage rate was selected to keep total plant water usage below 5 mgd (18,927 m3/d)

-8-
at summer design with carbon capture off-line. Tenaska established the 5 mgd (18,927 m3/d) limit by assessing the quantity of water that could be obtainable with reasonable probability from among the combination of potential sources.
The CC Plant process is cooled with air-cooled heat exchangers designed for a dry bulb temperature of 82°F (28°C). Like for the dry cooling case, a small wet cooling tower provides auxiliary cooling at the CC Plant.
Fluor modeled each of these three cases at the following three ambient conditions:
Figure 4.1-1 - Ambient temperatures at the Trailblazer site
Condition Name Dry Bulb Temperature (°F / °C)
Wet Bulb Temperature (°F / °C)
Average Ambient 64 / 18 56 / 13
Linear Midpoint* 82 / 28 72.1 / 22
Maximum Ambient 99.6 / 38 72.1 / 22
*Although this is the linear mid-point between the average and maximum ambient dry bulb temperatures, only nominally 15 percent of the annual hours are warmer. See Attachments 1 and 2 for historical site temperature data.
For each case and ambient condition, condensing and cooling equipment was sized for full steam flow with the CC Plant off line, maximum turbine backpressure and boiler steam flow with summer ambient design conditions. This represented the maximum water usage required by the Project.
4.2 Technical Evaluation
4.2.1 Case 1 – 100 Percent Water Cooled The 100 percent water-cooled case provides the highest net plant power output at nominally 630 MW for average ambient condition and 622 MW for both the “linear mid-point” and high ambient conditions. It also provides the lowest net plant heat rate at nominally 12,389 Btu/kWhr (higher heating value basis) for the average ambient condition and 12,550 Btu/kWhr for both the “linear mid-point” and high ambient conditions. The performance at the “linear mid-point” and high-ambient conditions are the same because the coincident wet bulb temperature of 72°F (22°C) is the same for both cases and it is the wet bulb temperature which drives the cooling water temperature in wet cooling systems.
The water use for this case would be the highest of the three cases. Raw water consumption at average ambient conditions, with the CC Plant online and a ZLD plant, would be approximately 11.7 mgd (44,289 m3/d). At the high ambient conditions, it would increase up to 15.1 mgd (57,159 m3/d).
4.2.2 Case 2 – 100 Percent Air Cooled The 100 percent air-cooled case provides the lowest net plant output of nominally 627 MW for average ambient condition, 617 MW for the “linear mid-point” condition,

-9-
and 578 MW for the high ambient condition. This is due to the higher auxiliary loads and higher turbine back pressure at high ambient conditions. This option also provides the highest net plant heat rates of nominally 12,442 Btu/kWhr (higher heating value basis) for the average ambient condition, 12,462 Btu/kWhr for the “linear mid-point” condition, and 13,510 Btu/kWhr for high ambient conditions. This option would clearly use minimal water for cooling.
The only cooling water would be associated with small auxiliary cooling towers (serving primarily the lube oil coolers in the pulverized coal plant associated with major rotating machinery). The raw water consumption at average ambient conditions, with the CC Plant online and a ZLD plant would be less than 1 mgd (3,785 m3/d).
In addition, the study determined that the CO2 capture rate of the CC Plant designed for an ambient dry bulb temperature of 82°F (27.8°C) would only decrease by approximately 2 percent when operating at the maximum ambient dry bulb temperatures. Since the ambient dry bulb temperature only exceeds the “linear mid-point” dry bulb temperature for approximately 15 percent of the annual hours, the total amount of CO2 capture that is lost due to this design choice is very small. Furthermore, there is the potential to capture greater than 90 percent CO2 while operating at ambient temperatures less than 82°F. Overall, this profile of CO2 capture performance was deemed acceptable because Tenaska’s stated goal is to achieve between an 85 to 90 percent CO2 capture rate.
4.2.3 Case 3 – Hybrid Cooling The hybrid cooling case falls between the first two cases in terms of performance. For the average ambient condition, the net output and heat rate are nominally 629 MW and 12,400 Btu/kWhr. For the “linear mid-point” ambient condition, the net output and heat rate are nominally 620 MW and 12,590 Btu/kWhr. Lastly, for the high ambient condition, the net output and heat rate are nominally 592 MW and 13,200 Btu/kWhr.
This system would offer the most flexibility in terms of both power and water use and plant output. The condensing and cooling equipment would be sized for the full condensing load of the turbine when the CC Plant is off line. The cooling tower for the hybrid case would be sized to keep the raw water consumption with a ZLD plant at 5 mgd (18,927 m3/d). The rate of 5 mgd (18,927 m3/d) was chosen for this evaluation based on a probabilistic range of potential supplies available at the time of the study.
4.2.4 Summary Despite the PC Plant power generation and thermal efficiency penalties at high ambient temperatures, Tenaska preferred the “100 Percent Dry Cooling” option at this point due to a range of factors including:
• Low likelihood of sufficient water availability for the other cooling options
• Determination of air cooling feasibility for the CC Plant
• Discovery of low CO2 capture reduction associated with the “linear mid-point” design temperature when operating at the maximum ambient temperature.
These findings, and this preference, were reaffirmed through the economic analysis

-10-
described in Section 6.0.
4.3 Environmental Evaluation For the cooling studies, Fluor and Tenaska established the assumption that the CC plant amine air emissions would be within the volatile organic compounds (VOCs) emission rates established under the Texas Commission on Environmental Quality (TCEQ) air permits (#’s 8417, PSDTX1123, and HAP13) for the Project for all cases. Tenaska’s confidence and satisfaction with this assumption was based on Fluor’s experience and expected performance guarantee. If air emissions requirements change in the future, additional technical solutions will need to be considered. A table of the permitted emission rates is listed below. The air permit is publicly available. Figure 4.3 – Permitted Air Emissions
Pollutant Performance Standard Compliance Averaging Period
NOx 0.070 lb/MMBtu (0.033 kg/GJ) 0.060 lb/MMBtu (0.028 kg/GJ) 0.050 lb/MMBtu (0.023 kg/GJ)
24-hour average 30-day rolling
12-month rolling
SO2 0.06 lb/MMBtu (0.028 kg/GJ) 30-day and 12-month rolling CO 0.10 lb/MMBtu (0.047 kg/GJ) 30-day and 12-month rolling Hg 1.7x10⁻⁶ lb/MMBtu (8.0x10⁻⁶ kg/GJ) 12-month rolling
NH3 10 ppm 3-hour average Filterable PM/PM10 0.012 lb/MMBtu (0.006 kg/GJ) Annual
PM/PM10 Total 0.025 lb/MMBtu (0.012 kg/GJ) Annual VOC 0.0036 lb/MMBtu (0.0017 kg/GJ) Annual
H2SO4 0.0037 lb/MMBtu (0.0017 kg/GJ) Annual HCl 0.00063 lb/MMBtu (0.00030 kg/GJ) Annual HF 0.00050 lb/MMBtu (0.00023 kg/GJ) Annual Pb 0.00003 lb/MMBtu (0.00002 kg/GJ) Annual
-11-
5.0 Water and Wastewater Treatment Design Configuration Determination
Prior to completing the full capital and operating cost estimation and associated economic analysis for the three cooling options, evaluation and selection of the configuration for the water and wastewater treatment systems was required. This section decribes the process used to determine the design configuration for these system components, which include pretreatment, demineralization and wastewater treatment. These components represent a portion of the total O&M costs for the wet, dry, and hybrid cooling options which are summarized in Section 6.
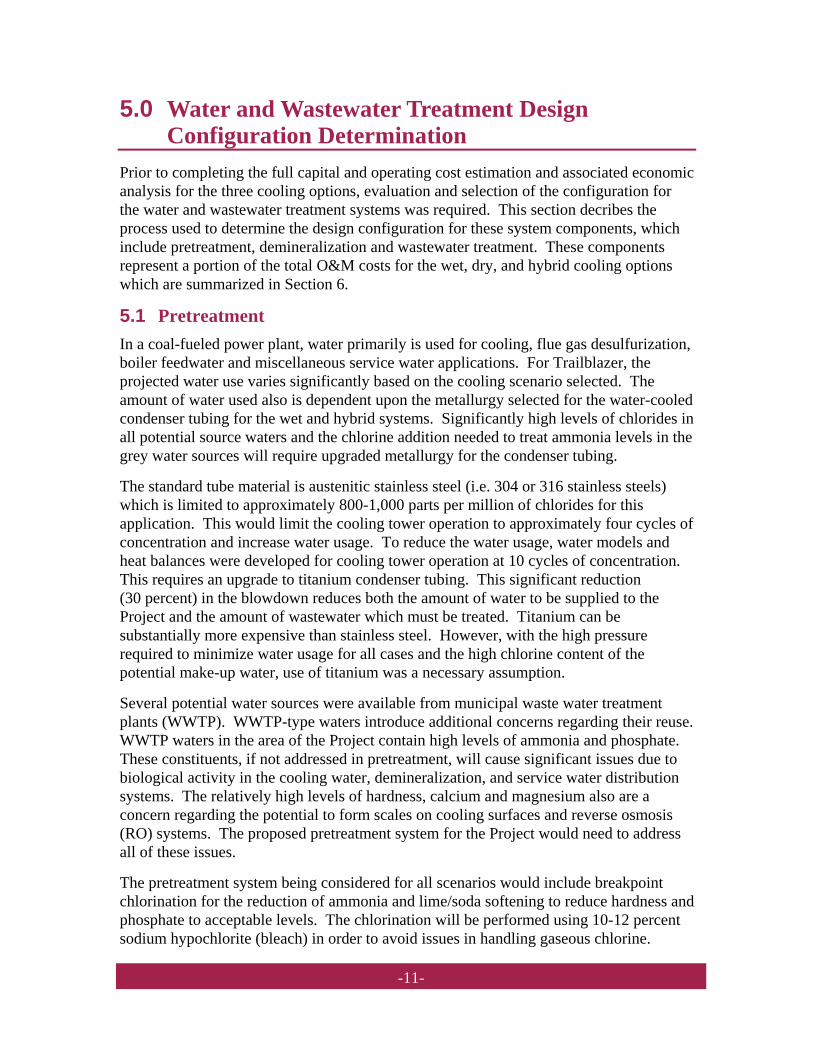
5.1 Pretreatment In a coal-fueled power plant, water primarily is used for cooling, flue gas desulfurization, boiler feedwater and miscellaneous service water applications. For Trailblazer, the projected water use varies significantly based on the cooling scenario selected. The amount of water used also is dependent upon the metallurgy selected for the water-cooled condenser tubing for the wet and hybrid systems. Significantly high levels of chlorides in all potential source waters and the chlorine addition needed to treat ammonia levels in the grey water sources will require upgraded metallurgy for the condenser tubing.
The standard tube material is austenitic stainless steel (i.e. 304 or 316 stainless steels) which is limited to approximately 800-1,000 parts per million of chlorides for this application. This would limit the cooling tower operation to approximately four cycles of concentration and increase water usage. To reduce the water usage, water models and heat balances were developed for cooling tower operation at 10 cycles of concentration. This requires an upgrade to titanium condenser tubing. This significant reduction (30 percent) in the blowdown reduces both the amount of water to be supplied to the Project and the amount of wastewater which must be treated. Titanium can be substantially more expensive than stainless steel. However, with the high pressure required to minimize water usage for all cases and the high chlorine content of the potential make-up water, use of titanium was a necessary assumption.
Several potential water sources were available from municipal waste water treatment plants (WWTP). WWTP-type waters introduce additional concerns regarding their reuse. WWTP waters in the area of the Project contain high levels of ammonia and phosphate. These constituents, if not addressed in pretreatment, will cause significant issues due to biological activity in the cooling water, demineralization, and service water distribution systems. The relatively high levels of hardness, calcium and magnesium also are a concern regarding the potential to form scales on cooling surfaces and reverse osmosis (RO) systems. The proposed pretreatment system for the Project would need to address all of these issues.
The pretreatment system being considered for all scenarios would include breakpoint chlorination for the reduction of ammonia and lime/soda softening to reduce hardness and phosphate to acceptable levels. The chlorination will be performed using 10-12 percent sodium hypochlorite (bleach) in order to avoid issues in handling gaseous chlorine.

-12-
Large quantities (e.g. 1,500 gallons per day based on nearby WWTP source water, CC Plant on, and hybrid cooling) of hypochlorite are required, so other treatments may need to be investigated to determine if there may be a better way to address this contaminant. The lime/soda softening process also produces a solid waste, proportionate to the amount of source water coming onto the site, which will need to be disposed. This sludge is generally considered non-hazardous. Water modeling assumes disposal at the site landfill.
Design of the pretreatment system, in a dry-cooling scenario, will need to consider operation with CC Plant off. Under this scenario, excess Direct Contact Cooler (DCC) water is no longer available for reuse, so the raw water requirements increase significantly (e.g. 600-1,000 gpm (38-63 lps)).
In a hybrid cooling design, the flow is not sensitive to the CC Plant being on or off. The pretreatment system would produce the maximum amount of water available and the cooling load would be shifted from wet cooling to dry cooling as needed to control water usage. Figure 5.1 below shows the estimated pretreatment system costs for nearby WWTP and surface water sources.
For the hybrid cooling scenario, this issue does not exist as it is assumed the pretreatment system will be operated continuously at maximum flow (5 mgd (18,927 m3/d)). The cooling loads will be shifted between the wet and dry systems in order to control water usage.
Pretreatment for a wet cooling scenario increases with the CC Plant online due to the high cooling system load. FIGURE 5.1 – Estimated Pretreatment System Costs
Estimated Pretreatment System Costs*
Cooling Scenario
Wastewater Disposition
Equipment, USD$MM
Installation, USD$MM
Total Installed Cost,
USD$MM
Operations / Maintenance, USD$MM/yr
WWTP Hybrid
Evap. Pond 4.8 3.6 8.4 6.8 ZLD 4.9 3.7 8.6 6.8
Dry Evap. Pond 3.7 2.8 6.5 1.0
ZLD 3.7 2.8 6.5 0.8
Surface Water
Hybrid Evap. Pond 4.8 3.6 8.4 6.3
ZLD 4.9 3.7 8.6 6.3
Dry Evap. Pond 3.7 2.8 6.5 1.0
ZLD 3.7 2.8 6.5 0.8 * “MM” = million
Notes: Pretreatment System Costs
A. Equipment costs are projected based upon equipment quotes received from multiple suppliers for various source water flow rates.
B. Budgetary installation costs are estimated using a factor of 75 percent of the equipment. Building

-13-
and infrastructure costs not included but expected to be the same for all options.
C. All pretreatment systems quoted included some form of lime/soda softening system, bleach feed, ferric salt feed (to aid in phosphate reduction), filtration, and dewatering equipment.
D. Operational costs assume source water cost of USD$2.25/kgal, salaries of USD$50/hour, and 6 hours per day for monitoring/operating pretreatment systems. Treated service water cost is approximately USD$3.75/kgal. Maintenance costs are estimated at approximately USD$0.1million per year for each system.
E. Pretreatment system costs for an all wet cooling solution was approximately USD$8 million. Since this is not a likely scenario, installation and operating costs were not estimated.
5.2 Demineralization Power plants require the use of demineralized water to operate the steam cycle. For Trailblazer, the quantity of demineralized water required is approximately 135 gpm (8.5 lps) when the CC Plant is operating and 40 gpm (2.5 lps) when the CC Plant is not operating. Three options of demineralization systems were evaluated for the Project.
• The most commonly used system, which includes RO and on-site regenerated mixed bed demineralizers (MBDI);
• RO and Electrodeionization (EDI),
• RO (in 2 variants – 1-pass and 2-pass) along with off-site regenerated MBDI (also called “bottle” deionized water in that it is trucked to and from site).
All systems consider some form of filtration (e.g. multimedia filters, ultrafiltration), RO, and demineralization as a final purification process. Common levels of redundancy are assumed for pumps (generally 2x100 percent), RO (2x100 percent), and chemical feed systems. Redundancy was not included for systems that are unlikely to fail (e.g. tanks) or are used only periodically (e.g. clean in place skid).
The difference in the systems being considered concerns the use of MBDI and EDI for the final purification step. MBDI is a traditional system and well proven in industrial water purification systems. Ion exchange resin performs the purification process. The resin becomes exhausted and must be regenerated with acid and caustic. When the regeneration is performed on site, the acid, caustic, and associated neutralization systems increase the capital costs. When the regeneration is performed off site, the regeneration equipment and chemicals are eliminated. Spare demineralizers, however, should be kept onsite to avoid potential delays in transportation.
EDI is a newer technology which is becoming more popular in industrial water purification. This system uses a small amount of electricity to keep ion exchange resin continuously regenerated. By using electricity, the need for bulk acid and caustic onsite storage, feed systems, regeneration systems, and neutralization is eliminated.
The quantity of demineralized water was estimated to be approximately 135 gpm (8.5 lps) with the CC Plant in operation. The estimate assumes a 75 percent recovery RO system and 90 percent efficiency for both the MBDI and EDI. The 10 percent wastage for the MBDI is due to regeneration and will be handled by the site wastewater system.
-14-
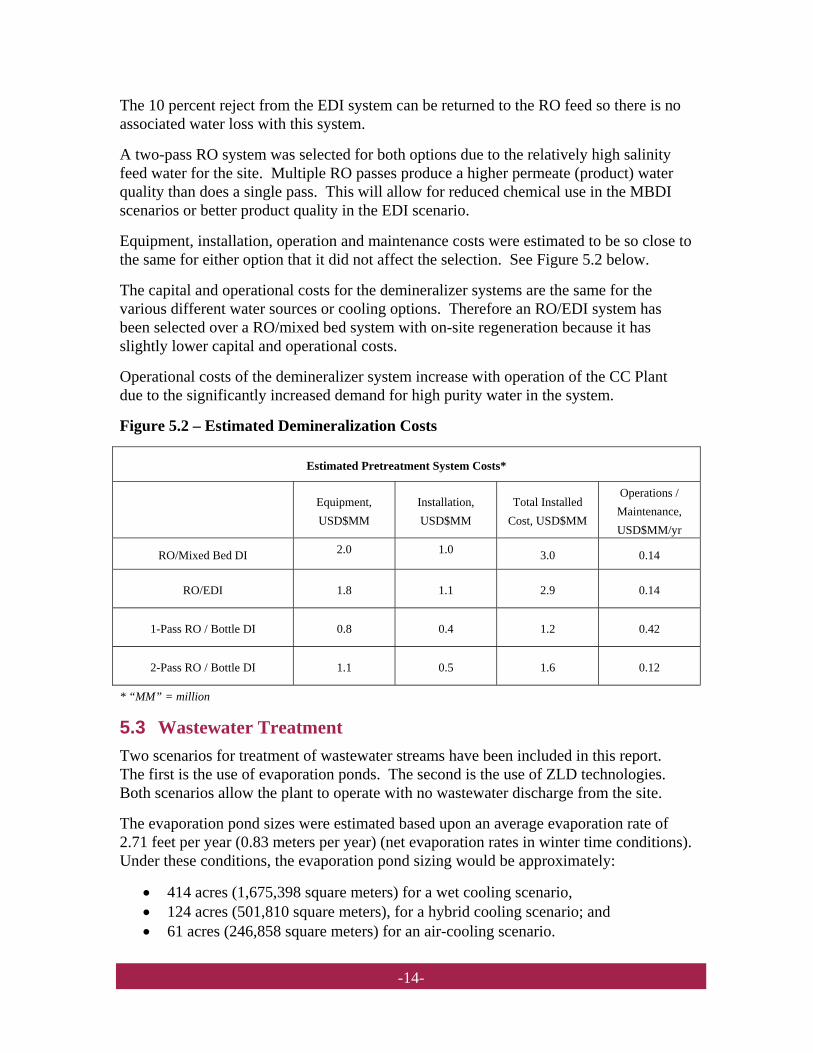
The 10 percent reject from the EDI system can be returned to the RO feed so there is no associated water loss with this system.
A two-pass RO system was selected for both options due to the relatively high salinity feed water for the site. Multiple RO passes produce a higher permeate (product) water quality than does a single pass. This will allow for reduced chemical use in the MBDI scenarios or better product quality in the EDI scenario.
Equipment, installation, operation and maintenance costs were estimated to be so close to the same for either option that it did not affect the selection. See Figure 5.2 below.
The capital and operational costs for the demineralizer systems are the same for the various different water sources or cooling options. Therefore an RO/EDI system has been selected over a RO/mixed bed system with on-site regeneration because it has slightly lower capital and operational costs.
Operational costs of the demineralizer system increase with operation of the CC Plant due to the significantly increased demand for high purity water in the system.
Figure 5.2 – Estimated Demineralization Costs
Estimated Pretreatment System Costs*
Equipment, USD$MM
Installation, USD$MM
Total Installed Cost, USD$MM
Operations / Maintenance, USD$MM/yr
RO/Mixed Bed DI 2.0 1.0 3.0 0.14
RO/EDI 1.8 1.1 2.9 0.14
1-Pass RO / Bottle DI 0.8 0.4 1.2 0.42
2-Pass RO / Bottle DI 1.1 0.5 1.6 0.12
* “MM” = million
5.3 Wastewater Treatment Two scenarios for treatment of wastewater streams have been included in this report. The first is the use of evaporation ponds. The second is the use of ZLD technologies. Both scenarios allow the plant to operate with no wastewater discharge from the site.
The evaporation pond sizes were estimated based upon an average evaporation rate of 2.71 feet per year (0.83 meters per year) (net evaporation rates in winter time conditions). Under these conditions, the evaporation pond sizing would be approximately:
• 414 acres (1,675,398 square meters) for a wet cooling scenario, • 124 acres (501,810 square meters), for a hybrid cooling scenario; and • 61 acres (246,858 square meters) for an air-cooling scenario.

-15-
Wastewater treatment system sizes currently consider the flow from the oil water separator going to either evaporation or ZLD. Further investigation will be required to determine if this water can be recycled back into the process to reduce the capacity of the wastewater treatment process system.
The ZLD systems are based upon the concept of continuously concentrating the wastewater until all the solids have precipitated and are separated from the water through filtration. These systems may include softening systems, RO pre-concentration, thermal brine concentration and thermal crystallization. The RO, brine concentrator and crystallizer systems all produce high-quality water which would be reused in the plant. These plants are expensive to build and operate. These costs may be offset by the ability to return a large percentage of high-quality water back to the plant for reuse. Current estimates indicate a ZLD system would return between 150-250 gpm (9.5-15.5 lps) of high-quality water with hybrid cooling (10 cycles of concentration). Figure 5.3 shows the comparative costs for the wastewater treatment systems studied.
Both the capital and operational costs of wastewater treatment are dependent on the cooling method used and the choice of demineralization and condensate polishing technologies.
FIGURE 5.3 – Estimated Wastewater Treatment Costs
Estimated Wastewater Treatment Costs*
Cooling Scenario
Wastewater Disposition
Equipment Cost, USD$MM
Installation Cost,
USD$MM
Total Installed Cost,
USD$MM
Operations / Maintenance, USD$MM/yr
WWTP Hybrid Evaporation Pond 0.5 21.8 22.3 ZLD 6.8 5.1 11.9 0.4
Dry Evaporation Pond 0.5 10.7 11.2 ZLD 5.3 4.0 9.3 0.2
Surface Water
Hybrid Evaporation Pond 0.5 21.8 22.3 ZLD 6.8 5.1 11.9 0.4
Dry Evaporation Pond 0.5 10.7 11.2 ZLD 5.3 4.0 9.3 0.2
* “MM” = million
5.3.1 Wet Cooling Scenario No water treatment options were evaluated for the wet cooling scenario. This scenario was deemed highly unlikely based on the potential quantity of water available at the time of the study.
5.3.2 Dry Cooling Scenario The air cooling scenario produces wastewater from the oily water separators, RO reject and a cooling water blowdown stream from a small auxiliary cooling tower. The cooling

-16-
tower blowdown and RO reject will be reused as partial makeup to the wet flue gas desulfurization (FGD). Current models indicate the treated oily water is being sent to wastewater treatment. This water may be reused if it is processed through the water pretreatment system. This reuse concept will need to be verified by a water treatment technology supplier.
The models currently show small flows from the demineralization and condensate polishers which represent regeneration waste streams from these systems. With the use of EDI technology and powdered condensate polishing technology, these streams will be eliminated. EDI reject will be returned to the RO system for reprocessing and the powdered condensate polisher backwash may be reprocessed through the water pretreatment system.
With the planned use of EDI, powdered condensate polishing and the reuse of the treated oily water, wastewater treatment may not be necessary.
The FGD blowdown water also will have high solids content. This waste stream is assumed to be disposed of in the ash pile at the landfill and is not included in wastewater treatment system sizing calculations.
5.3.3 Hybrid Cooling Scenario In the hybrid cooling scenario, a wastewater treatment system will be needed, as more cooling water blowdown will be generated than can be utilized in the FGD system. Reuse of the treated oily water and powdered condensate polisher backwash is still a possibility pending agreement by the water treatment technology supplier.
Two options were considered for wastewater treatment – evaporation ponds and ZLD. Even though a ZLD system has relatively high installation and operational costs, this option continues to be less expensive using present cost analysis due to the very high installation cost for the evaporation ponds.
Notes: Wastewater Treatment System Costs
A. Only scenarios regarding the hybrid and all dry cooling have been evaluated as the use of an all wet cooling scenario is considered unlikely at this time. The cost of the evaporation pond for an all wet scenario would be approximately USD$73 million. The cost (equipment only) for a ZLD system for the all wet cooling scenario is approximately USD$50 million. Operational costs for the all wet cooling ZLD scenario have not been estimated.
B. No operational costs for the evaporation pond scenarios are included as only monitoring would be anticipated. Maintenance costs for a ZLD system have been estimated at approximately USD$0.1 million per year.
C. ZLD system equipment costs assume RO pre-concentration systems and a crystallizer. Some of the quotes received also included lime/soda softening and potentially a brine concentrator. All the brine concentrators and crystallizers assumed mechanical vapor recompression technology to supply the thermal energy required for the process. A minimal amount of startup steam would be required which would be serviced from the auxiliary steam system. A small cooling load is also required, but has not been included in any of the models to date, and would be serviced by the PC plant auxiliary cooling system. Building and infrastructure costs are not included but expected to be the same for all options.

-17-
D. Operational costs consider salaries for 6 hours per day at USD$50/hour. Energy costs, which are the significant cost for a ZLD system, are estimated at an assumed plant cost of USD$0.038/kWhr.
E. Calculations indicate the use of ZLD technology would likely be financially justified based upon the comparative costs for evaporation ponds. ZLD systems would also provide additional high quality water for reuse that would not be available from an evaporation pond system.
-18-
6.0 Cooling Options Comparison 6.1 Cost and Performance Summary
6.1.1 Capital Cost Major cooling system components were priced and installed costs estimated to provide a basis to compare options. Equipment suppliers provided budget quotes for water and wastewater treatment systems, condensing equipment and cooling towers. Historical pricing was used for pumps, circulating water piping and electrical equipment. Costs for foundations, interconnecting piping, controls and instrumentation were not estimated or included, since the overall differential cost impact was considered to be small and also due to time constraints for the study. All costs are shown in USD.
Figure 6.1.1 combines estimated capital costs for plant cooling, water treatment and wastewater treatment for three types of cooling equipment options (air, hybrid, wet). The figure shows a $107 million higher capital cost for the dry cooling option. This value translates to an impact of $171/kW net at the average ambient net output. The bulk of this incremental cost is for the air cooled heat exchangers for the CC Plant.
Some observations and notes for Figure 6.1.1 include:
• An estimate of costs for evaporation ponds are included for the options at the end of this table for comparison and as an alternative to the ZLD option for wastewater treatment in the overall cost comparison. Thus, these costs are not additive to the other line items.
• The $0.5 million wet cooling tower cost for the PC plant under the dry cooling case provides ~150 MMBtu/hr (158 GJ/hr) heat rejection for lube oil coolers associated with major rotating machinery.
• For the Hybrid case, the hybrid wet / dry cooling tower system price is shown under the “Air Cooled Condenser” line item.
• The costs of cooling piping, pumps, and wastewater treatment are a function of the water usage rates for each of the cases. Therefore, these items are most expensive for the wet cooling case.
• There are no “air cooled heat exchangers” in the PC plant (other than the air cooled condenser). Hence, this category is not applicable (n/a) for all cases.
• Balance of Plant (BOP) and installation costs are embedded with the other line items for all cases.
• The dry cooling case includes 710 air fans for the CC Plant and 84 Air-Cooled Condenser fans for the PC Plant. As much as possible, the CC Plant air-cooled heat exchangers are mounted on the top of pipe racks. However, even after doing so, a separate field of air-cooled exchangers is required. The plot space of this field nominally doubles the plot space for the CC Plant.

-19-
FIGURE 6.1.1 – Capital Cost Estimates for Cooling Options (USD$)
$USD(capex) / kWnet impact (at average ambient) $470/kW $434/kW $299/kW
* “MM” = million
6.1.2 Operating and Maintenance Costs The overall O&M cost is highest for the water-cooled option and lowest for the air-cooled option. The majority of the cost difference is associated with water and wastewater treatment.
The O&M cost for the pretreatment system increases with the amount of total plant raw water usage. The air-cooled option uses the least water and has the lowest cost.
The demineralization system costs are not impacted by the various cooling options or water sources. The CC Plant requires more than two times the treated water flow of the PC Plant, due to the water needs of the absorber and direct contact cooler. The carbon capture system uses a direct contact cooler with water sprays to cool the flue gas for processing. The absorber uses water for washing and cooling.
Wastewater system costs are significantly higher for the water-cooled and hybrid options. Two options were fully evaluated and priced: ZLD and evaporation ponds. The ZLD system will return high-quality water to the PC Plant for reuse and reduce the raw water required. The evaporation ponds are simply large permitted ponds which store the wastewater and allow the water to evaporate into the atmosphere. The ponds must be sized with enough surface area (for each case) to accomplish the amount of evaporation equal to or greater than the wastewater production rate at the site ambient conditions. The study assumed a net evaporation rate of 2.71 feet per year based on wintertime conditions.
The wastewater flow in the air-cooled option comes primarily from the oil water separator, with a small amount from condensate polisher backwash. There is the
Capital Costs, $ 2009, 4QPulverized Coal PlantCosts in $MM Dry Hybrid WetWet cooling tower Installed 0.5$ w/ACC 11.0$ Surface condenser n/a w/ACC 10.0$ Circulating cooling piping & pumps 2.0$ 4.0$ 16.0$ Air cooled condenser 72.0$ 54.0$ n/aAir cooled heat exchangers n/a n/a n/aBOP & installation cost adder for heat rejection system 40.0$ 30.0$ 10.0$ Pre-treatment Installed 6.5$ 8.6$ 14.3$ Demin. plant Installed 2.9$ 2.9$ 2.9$ Wastewater treatment / ZLD plant Installed 9.3$ 11.9$ 50.0$ BOP & installation cost adder for treatment systems above above aboveSub-total 133.2$ 111.4$ 114.2$ Carbon Capture Plant - Cooling EquipmentHeat exchangers in CC process factored installed cost 162.0$ 162.0$ 50.0$ Wet cooling tower Installed n/a n/a 8.0$ Circulating cooling piping & pumps n/a n/a 14.0$ Installation. pipe, pumps n/a n/a 2.0$ Sub-total 162.0$ 162.0$ 74.0$ Total CC and PC plants 295.2$ 273.4$ 188.2$
Evaporation Pond (no ZLD) Assumed 2.71 ft/yr net evap 11.2$ 22.3$ 72.9$
Costs in $MM

-20-
potential to eliminate the wastewater treatment facility for the air-cooled option. This could be achieved if the treated water from the oil/water separator and the condensate polisher backwash water were sent through the site pretreatment system. This concept would require agreement from the water treatment system supplier. This reuse concept, along with the use of EDI technology and reuse of cooling tower blowdown and first-pass RO reject as partial FGD makeup, potentially eliminates the wastewater stream.
Operating costs have been estimated for the ZLD system for an air-cooled and hybrid- cooled plant. Operating costs for evaporation ponds are assumed to be significantly lower than a ZLD system.
Figure 6.1.2 summarizes the total annual O&M costs associated with the three cooling options. The water use is based on average ambient conditions with the CC Plant online and includes a ZLD wastewater system. These costs do not include the value of differing energy consumption and the impact on plant performance. In addition, note that the costs are listed in 2009 USD. During the 30-year life of the project, the O&M costs will escalate year-on-year as a function of wage rate and price indices (as with any project). Thus, the overall impact of these costs on the financial performance of the Project is higher than depicted in this table.
FIGURE 6.1.2 – O&M Costs for Cooling Options (USD)
* “MM” = million
6.1.3 Performance and Water Use Summary Figure 6.1.3 compares the performance and water use for each of the three cooling options at the each of the three ambient conditions, both with the CC Plant on and off, and assuming a ZLD wastewater treatment system.
The study also assumed that the CC Plant was designed for 90 percent CO2 capture at the “linear mid-point” ambient condition (82°F) when using air cooling. As such, the dry cooling cases show a slight gain in CO2 capture rate when the dry bulb temperature is less than 82°F and slight loss of CO2 capture rate when greater than 82°F (28°C); for example, CO2 capture is predicted to be ~88 percent at 99.6°F(38°C).
The present value cost of water is based on annual water use at USD$3.75 per thousand gallons (USD$2.25 per thousand gallons plus USD$1.50 per thousand gallons for
O&M Costs, $ 2009/year
Cooling system, water and wastewater treatment, CC online Dry Hybrid WetRaw Water 0.3$ 4.1$ 9.6$ Operations 0.6$ 2.4$ 4.1$ Maintenance 0.6$ 0.6$ 0.8$ Total 1.5$ 7.0$ 14.5$
Costs in $MM

-21-
pretreatment), 8.5 percent interest rate and a 30 year plant life.1 This value was only calculated for the average ambient case which should represent the average annual water demand.
FIGURE 6.1.3 – Performance Summary for Cooling Options
Ambient
Condition Parameter Units
Cooling Method; CO2 capture ‘ON’ or ‘OFF’
Dry Hybrid Wet
OFF ON OFF ON OFF ON
Average
Gross Generation (MW) 930.8 806.1 931.9 806.1 932.0 799.9
Auxiliary Power (MW) 67.8 178.8 68.3 176.8 70.4 169.9
Net Generation (MW) 863.0 627.3 863.6 629.2 861.6 629.9
Net Heat Rate (Btu/kWh) 9,044 12,442 9,038 12,404 9,058 12,389
CO2 Recovery Rate (percent) n/a 90.5 n/a 90.5 n/a 90.5
Water Consumption (Mgd) 1.8 0.4 5.0 5.0 9.1 11.7
Water Cost Present Value* ($MM) 26.8 5.2 73.5 73.5 133.4 172.5
Mid-Point
Gross Generation (MW) 906.9 800.6 914.2 802.3 913.1 797.5
Auxiliary Power (MW) 69.8 183.2 69.7 182.2 71.6 175.6
Net Generation (MW) 837.2 617.4 844.5 620.1 841.5 621.9
Net Heat Rate (Btu/kWh) 9,324 12,642 9,243 12,588 9,274 12,550
CO2 Recovery Rate (percent) n/a 90 n/a 90 n/a 90
Water Consumption (Mgd) 1.9 0.4 5.0 5.0 9.8 12.1
High
Gross Generation (MW) 869.5 774.7 870.0 789.0 914.0 798.5
Auxiliary Power (MW) 71.8 196.9 69.2 196.8 72.2 176.2
Net Generation (MW) 797.7 577.8 800.8 592.2 841.8 622.2
Net Heat Rate (Btu/kWh) 9,785 13,510 9,747 13,181 9,271 12,541
CO2 Recovery Rate (percent) n/a 88.3 n/a 88.3 n/a 90
Water Consumption (Mgd) 1.9 1.1 5.0 5.0 10.9 15.1
* “MM” = million
The data shows that the thermal performance of all three cooling options is relatively similar at the average ambient condition. While the performance associated with all cooling options degrades with warmer ambient conditions, the dry cooling option degrades the most, losing 50 MW of net generation and gaining nominally 1,000 Btu/kWh from the average to the max ambient conditions with the CC Plant on.
At the same time, the water use for dry cooling only increases from 0.4 to 1.1 mgd (1,514 and 4,164 m3/d, respectively) (while the wet cooling case increases from 11.7 to 15.1 mgd (44,289 and 57,160 m3/d, respectively). (Note the hybrid case was modeled differently being constrained to 5 mgd for all cases).
Operating the CC Plant increases the water consumption for the wet cooling cases by nominally 25 – 40 percent which equals 2.3 – 4.2 mgd (8,706 – 15,899 m3/d). However,
1 It should be noted that this analysis was done well before any actual negotiations for water purchases took place. Tenaska used a conservative estimate of the potential cost of water based on what it considered to be the high end of the spectrum for what water for the Project might cost.

-22-
this trend reverses for the dry cooling cases – operating the CC Plant decreases water consumption by 40 – 80 percent which equals 0.8 to 1.4 mgd (3,028 – 5,300 m3/d) depending on the ambient condition. This is because the CC Plant includes an upfront cooling step that condenses combustion water vapor which is re-used in the PC Plant.
6.2 Assumptions
6.2.1 Cooling Options Assumptions Thermal performance data is based on full PC Plant capacity.
The total raw water usage was limited to 5 mgd (18,927 m3/d) for the hybrid cooling option. This limits the cooling tower capability when the full steam flow is sent to the condenser (CC Plant off line). Cooling water is only supplied to the PC Plant. The CC Plant is air cooled in the hybrid option.
Fluor has determined that it is feasible to air cool the CC Plant Econamine FG+ technology and achieve the desired CO2 capture rate at the Trailblazer site ambient conditions.
The amine emissions for all cases are within the permitted VOC emission rates.
6.2.2 Water Analysis A limited amount of information was available regarding the water quality of different potential source waters. Source waters considered in the study were limited to surface water or treated wastewater from surface water sources. As a result, some variability in the water quality is anticipated. The water use and treatment systems are currently modeled (i.e. including: softening, silica/phosphate/ammonia reduction, use of chloride resistant metallurgy in wet condenser tubes) to address water quality variability.
Water balance models were run to simulate the various water source and cooling scenarios studied.
6.2.3 Water Treatment Costs Suppliers were requested to provide costs for each of the systems based upon a range of conditions. Costs were then estimated based upon varying factors (different flow rates, various water qualities). System costs were based on the average of the quotes from multiple suppliers.
System installation costs were estimated to be 50 percent of the equipment costs for systems that are mainly skid mounted and 75 percent of the equipment costs for systems requiring significant field assembly (makeup water treatment, ZLD).
6.3 Water Cost Sensitivity Analysis The cost analysis includes the total capital cost along with the O&M costs and the value associated with differences in thermal performance at the average ambient temperatures. The CC Plant online is weighted at 95 percent and off line is weighted at 5 percent. Tenaska made this assumption because CO2-based revenue is important to the overall Project economics and is needed to pay back the capital investment in the CC Plant.

-23-
There is not a strategic linkage between this assumption and the use of the 82°F CC Plant design temperature.
The sensitivity analysis includes the present value of the annual water use. The present value is determined using 8.5 percent interest rate over the 30-year plant life. The water cost basis is USD$3.75 per thousand gallons (USD$2.25 per thousand gallons plus USD$1.50 per thousand gallons for pretreatment).
Since the cost of water and the associated water treatment costs (ZLD or evaporation ponds) impact the Project economics strongly, the sensitivity analysis was done by varying the water costs to find the breakeven point. Wet cooling reaches economic parity with dry cooling at a water cost of $2.71/kgal while hybrid cooling requires $1.84/kgal.
Figure 6.3.1 below is a sensitivity analysis of the economic evaluation factors and sensitivity of water cost. In these cases, the Project is assumed to operate with the CC Plant on line 95 percent of the time. The upper half of this chart provides a summary of the economic analysis using the base case assumptions for water costs. The second half of this chart varies the water cost (orange colored cells) to equalize the total evaluated cost for the dry and hybrid systems.
(Remainder of page intentionally left blank to accommodate Figure 6.3)

-24-
FIGURE 6.3 – Sensitivity Analysis for Cooling Options
SENSITIVITY ANALYSIS OF ECONOMIC EVALUATION FACTORS
CC ON-LINE
Penalty Weighted Percentage
Adjusted Economic Evaluation Factors Wet Dry Hybrid
TOTAL INSTALLED COST (CC & PC) ($) 188,200,000$ 295,200,000$ 273,400,000$ 30 YR WATER COST PV WET VS. DRY ($) 95.0% 3.75$ 163,901,246$ 4,950,240$ NA30 YR WATER COST PV HYBRID VS. DRY ($) 95.0% 3.75$ NA 4,950,240$ 69,826,559$ NET POWER PENALTY WET VS. DRY (MW) 95.0% $1,900.00 (4,898,200)$ BASE NAHEAT RATE PENALTY WET VS. DRY (Btu/kWh) 95.0% $133,000.00 (7,049,000)$ BASE NANET POWER PENALTY HYBRID VS. DRY (MW) 95.0% $1,900.00 NA BASE (3,583,400)$ HEAT RATE PENALTY HYBRID VS. DRY (Btu/kWh) 95.0% $133,000.00 NA BASE (5,054,000)$ CC ON-LINE EVALUATED COST ($) 340,154,046$ 300,150,240$ NACC ON-LINE EVALUATED COST ($) NA 300,150,240$ 334,589,159$
CC OFF-LINE 30 YR WATER COST PV WET VS. DRY ($) 5.0% 3.75$ 6,672,339$ 1,340,822$ NA30 YR WATER COST PV HYBRID VS. DRY ($) 5.0% 3.75$ NA 1,340,822$ 3,675,082$ NET POWER PENALTY WET VS. DRY (MW) 5.0% $100.00 143,200$ BASE NAHEAT RATE PENALTY WET VS. DRY (Btu/kWh) 5.0% $7,000.00 98,000$ BASE NANET POWER PENALTY HYBRID VS. DRY (MW) 5.0% $100.00 NA BASE (61,200)$ HEAT RATE PENALTY HYBRID VS. DRY (Btu/kWh) 5.0% $7,000.00 NA BASE (42,000)$ CC OFF-LINE EVALUATED COST ADJUSTMENT ($) 6,913,539$ 1,340,822$ NACC OFF-LINE EVALUATED COST ADJUSTMENT ($) NA 1,340,822$ 3,571,882$ TOTAL EVALUATED COST ($) 347,067,585$ 301,491,063$ NATOTAL EVALUATED COST ($) NA 301,491,063$ 338,161,041$ SENSITIVITY ANALYSIS OF WATER COST
CC ON-LINE
Penalty Weighted Percentage
Adjusted Economic Evaluation Factors Wet Dry Hybrid
TOTAL INSTALLED COST (CC & PC) ($) 188,200,000$ 295,200,000$ 273,400,000$ 30 YR WATER COST PV WET VS. DRY ($) 95.0% 2.71$ 118,430,500$ 3,576,906$ NA30 YR WATER COST PV HYBRID VS. DRY ($) 95.0% 1.84$ NA 4,950,240$ 34,342,782$ NET POWER PENALTY WET VS. DRY (MW) 95.0% $1,900.00 (4,898,200)$ BASE NAHEAT RATE PENALTY WET VS. DRY (Btu/kWh) 95.0% $133,000.00 (7,049,000)$ BASE NANET POWER PENALTY HYBRID VS. DRY (MW) 95.0% $1,900.00 NA BASE (3,583,400)$ HEAT RATE PENALTY HYBRID VS. DRY (Btu/kWh) 95.0% $133,000.00 NA BASE (5,054,000)$ CC ON-LINE EVALUATED COST ($) 294,683,300$ 298,776,906$ NACC ON-LINE EVALUATED COST ($) NA 300,150,240$ 299,105,382$
CC OFF-LINE 30 YR WATER COST PV WET VS. DRY ($) 5.0% 2.71$ 4,821,247$ 968,841$ NA30 YR WATER COST PV HYBRID VS. DRY ($) 5.0% 1.84$ NA 659,456$ 1,807,515$ NET POWER PENALTY WET VS. DRY (MW) 5.0% $100.00 143,200$ BASE NAHEAT RATE PENALTY WET VS. DRY (Btu/kWh) 5.0% $7,000.00 98,000$ BASE NANET POWER PENALTY HYBRID VS. DRY (MW) 5.0% $100.00 NA BASE (61,200)$ HEAT RATE PENALTY HYBRID VS. DRY (Btu/kWh) 5.0% $7,000.00 NA BASE (42,000)$ CC OFF-LINE EVALUATED COST ADJUSTMENT ($) 5,062,447$ 968,841$ NACC OFF-LINE EVALUATED COST ADJUSTMENT ($) NA 659,456$ 1,704,315$ TOTAL EVALUATED COST ($) 299,745,748$ 299,745,748$ NATOTAL EVALUATED COST ($) NA 300,809,697$ 300,809,697$

-25-
7.0 Further Findings As previously described, this report primarily summarizes the findings from an in-depth engineering evaluation to determine the best cooling option for the Project completed by Fluor in February 2010.
Later, from August 2010 through June 2011, Tenaska commissioned Fluor to complete the CC Plant FEED Study. The CC Plant FEED study drew upon the results from the earlier cooling study. Doing so yielded a few additional findings related to CC Plant cooling. This section lists those additional findings.
• During the CC Plant FEED study, Fluor developed the engineering specifications, issued requests for quotation, and received bids from CO2 compressor manufacturers. The Fluor specification was based on an ambient dry bulb design temperature of 82°F. Through dialogue with the prospective manufacturers, it was determined that both the CO2 intercoolers and the lube oil coolers feasibly could be air cooled (for the latter, note that a synthetic lube oil is required). In addition, it was also determined that an air-cooled machine with a design temperature of 82°F would be able to handle the entire CO2 flow rate when operating at the maximum ambient dry bulb temperature albeit with nominally 1.5MW higher power consumption.
• During the CC Plant FEED study, Fluor worked closely with prospective vendors to select the air cooler mechanical design and develop the layout. The result of the competitive bidding process for the air coolers was higher costs than were previously estimated. In addition, the final design included raising the height of the air coolers and including a lower design air velocity with an increased fin spacing. A 20 percent spare heat transfer surface area was included in the design basis but variable frequency drives or two-speed fans were not considered. Had these impacts been known at the point in time when the cooling study was completed, the hybrid cooling option may have provided the lower evaluated cost (although its cost may have been affected somewhat similarly). Even so, with the lack of water available for the Project in semi-arid West Texas, there is a high probability that dry cooling still would be a necessity. Air cooler vendor selection, design requirements, fabrication location and transportation costs are factors which can substantially affect the economic comparison between dry and hybrid cooling systems. The amount of water available for the hybrid comparison is also a key assumption.
• The results of the competitive bidding process were negatively affected by a lack of vendor cooperation and responsiveness resulting from project uncertainty. This may have also contributed to higher costs.
• Computational Fluid Dynamics modeling should be considered for optimization efforts with air cooler layout and final design.

-26-
8.0 Lessons Learned • Dry cooling of the Fluor Econamine FG+ technology is feasible for the
Trailblazer West Texas site. However the cost of air coolers is high and increases with the design temperature. Tenaska elected to accept an air cooler design temperature less than the maximum ambient temperature (along with slight reduction in CO2 capture rate at high ambient temperatures) to minimize this cost. The sensitivity of capture rate, capital cost, and emissions is site-, technology-, and Project-specific.
• Despite the high capital costs, air cooling appears to have the lowest total evaluated cost due to the anticipated high cost of water and the Project-specific economic evaluation factors.
• Wet cooling of the large, supercritical Trailblazer PC Plant has a large water demand of nominally 11.7 mgd (44,289 m3/d) for the average ambient condition and 15 mgd (56,781 m3/d) for the maximum ambient condition.
• Dry cooling substantially increases the CC Plant footprint. For Trailblazer, 710 air cooler fans are required, with the majority needing to be located in a separate field. This field nominally doubles the footprint of the CC Plant. See Attachment 4.
• Although the installation of CO2 capture consumes thermal energy (in the form of condensing low-pressure steam extracted from the PC Plant), it increases the overall cooling duty of the combined plant in total. If the CC Plant is wet cooled, it increases the cooling water demand by 25-40 percent depending on the ambient condition. However, if the CC Plant is dry cooled, it reduces the combined water demand because the inlet cooling of the flue gas to the CC Plant absorber condenses a portion of the water vapor which can be used to offset water demand in the PC Plant.
• In addition to air cooling, Tenaska is further minimizing water demand by designing the remaining water systems for 10 cycles of concentration (associated with titanium metallurgy) and the inclusion of the ZLD unit which provides a water recycle stream. The study determined that ZLD is more cost effective than evaporation ponds.
• Due to uncertainty surrounding the future of carbon legislation and the accompanying uncertainty regarding the economics of the Project, Tenaska has elected not to spend the money and resources required to fully evaluate, optimize, and make final design decisions among all options at this time.

-27-
9.0 Relevance to Carbon Capture and Storage Use of water for power plants (and other industrial purposes) can become an issue whether carbon capture and storage is proposed or not. It is highly likely that others developing carbon capture and storage projects, not just in the United States, but throughout the world, will need to assess whether hybrid or air-cooled systems would make sense for their projects. At sites with very high ambient temperatures, air-cooling will be a challenge because the performance of CO2 capture processes, both in terms of energy consumption and emission rates, may degrade. The nature of this degradation is expected to be technology – specific.

-28-
10.0 Conclusions 10.1 Cooling Options The 100 percent air-cooling case is the recommended cooling option for Trailblazer. This option is recommended based on the minimal water usage and the amount of water available. This option has the highest total installed cost (by USD$107 million compared to wet cooling); however, it eliminates most of the water use (and cost) associated with the cooling systems. This is offset by my much lower O&M costs (by USD$13 million/yr).
Overall, the total evaluated cost differential between the hybrid and air-cooled options is small and within an accuracy range of the study. The thermal performance of the air-cooled system is slightly lower at the average conditions with the CC Plant online when compared to the hybrid and wet systems. This penalty is minor and is overcome by the significantly higher present value cost of water for the wet and hybrid systems.
10.2 Water Treatment
10.2.1 Pretreatment The selection and basis for the water pretreatment system consists of cold lime softening, with an emphasis on silica, ammonia and phosphate reduction. This system will allow each of the source waters to be used and can be easily adjusted to address potential variability in the source waters.
10.2.2 Demineralization It is recommended that the demineralized water system include a two-pass RO system with EDI. The two-pass RO will reduce the operating cost of the EDI system. The EDI is regenerated without producing a high salinity regeneration waste stream and reduces overall plant water use.
10.2.3 Wastewater Selection of the air cooling technology may also eliminate the need for a wastewater treatment system, but would require agreement by the water treatment technology supplier.
If a wastewater treatment system is required, ZLD is recommended. This system offers the lowest net present cost when compared to evaporation ponds. The ZLD system will also generate a reusable water stream which would reduce the overall Project water demand.

-29-
11.0 Acronyms and Citations
Acronym Definition BOP Btu
Balance of Plant British Thermal Unit
CC Plant Carbon capture portion of the Trailblazer Energy Center CCS Carbon Capture and Storage CO2 Carbon Dioxide DCC Direct Contact Cooler EDI EPC
Electrodeionization Engineer, Procure, Construct
EOR Enhanced Oil Recovery FEED Front End Engineering Design FGD Flue Gas Desulfurization Gpm GJ kWh kgal
Gallons per minute Giga Joule Kilowatt-hour Thousand Gallons
Lb Lps MW MMBtu
Pound Liters per second Mega Watt Million British Thermal Units
MBDI Mixed Bed Demineralizers Mgd Million gallons per day O&M Operating and Maintenance PC Plant Pulverized coal plant portion of the Trailblazer Energy Center Project Tenaska Trailblazer Energy Center RO Reverse Osmosis Trailblazer Tenaska Trailblazer Energy Center USD United States Dollars WWTP Waste Water Treatment Plants ZLD Zero liquid discharge

ATTACHMENT 1
Site Temperature Histogram

100
150
200
250
Ann
ual
Hou
rsAttachment 1 ‐‐ Abilene Texas Ambient Temperature Histogram
0
50
100
0 8 16 24 32 40 48 56 64 72 80 88 96 104Ambient Dry Bulb Temperature (F)
CC Plant Design Temperature = 82F

ATTACHMENT 2
Cumulative Annual
Site Temperatures

100
Attachment 2 ‐‐ Abilene Texas Cumulative Annual Hours at Temperature
80
90
rs (%
)
60
70
Ann
ual H
our
40
50
ercentage of A
20
30
umulative Pe
CC Plant Design Temperature = 82F
0
10
20Cu
0
0 8 16 24 32 40 48 56 64 72 80 88 96 104
Ambient Dry Bulb Temperature (F)

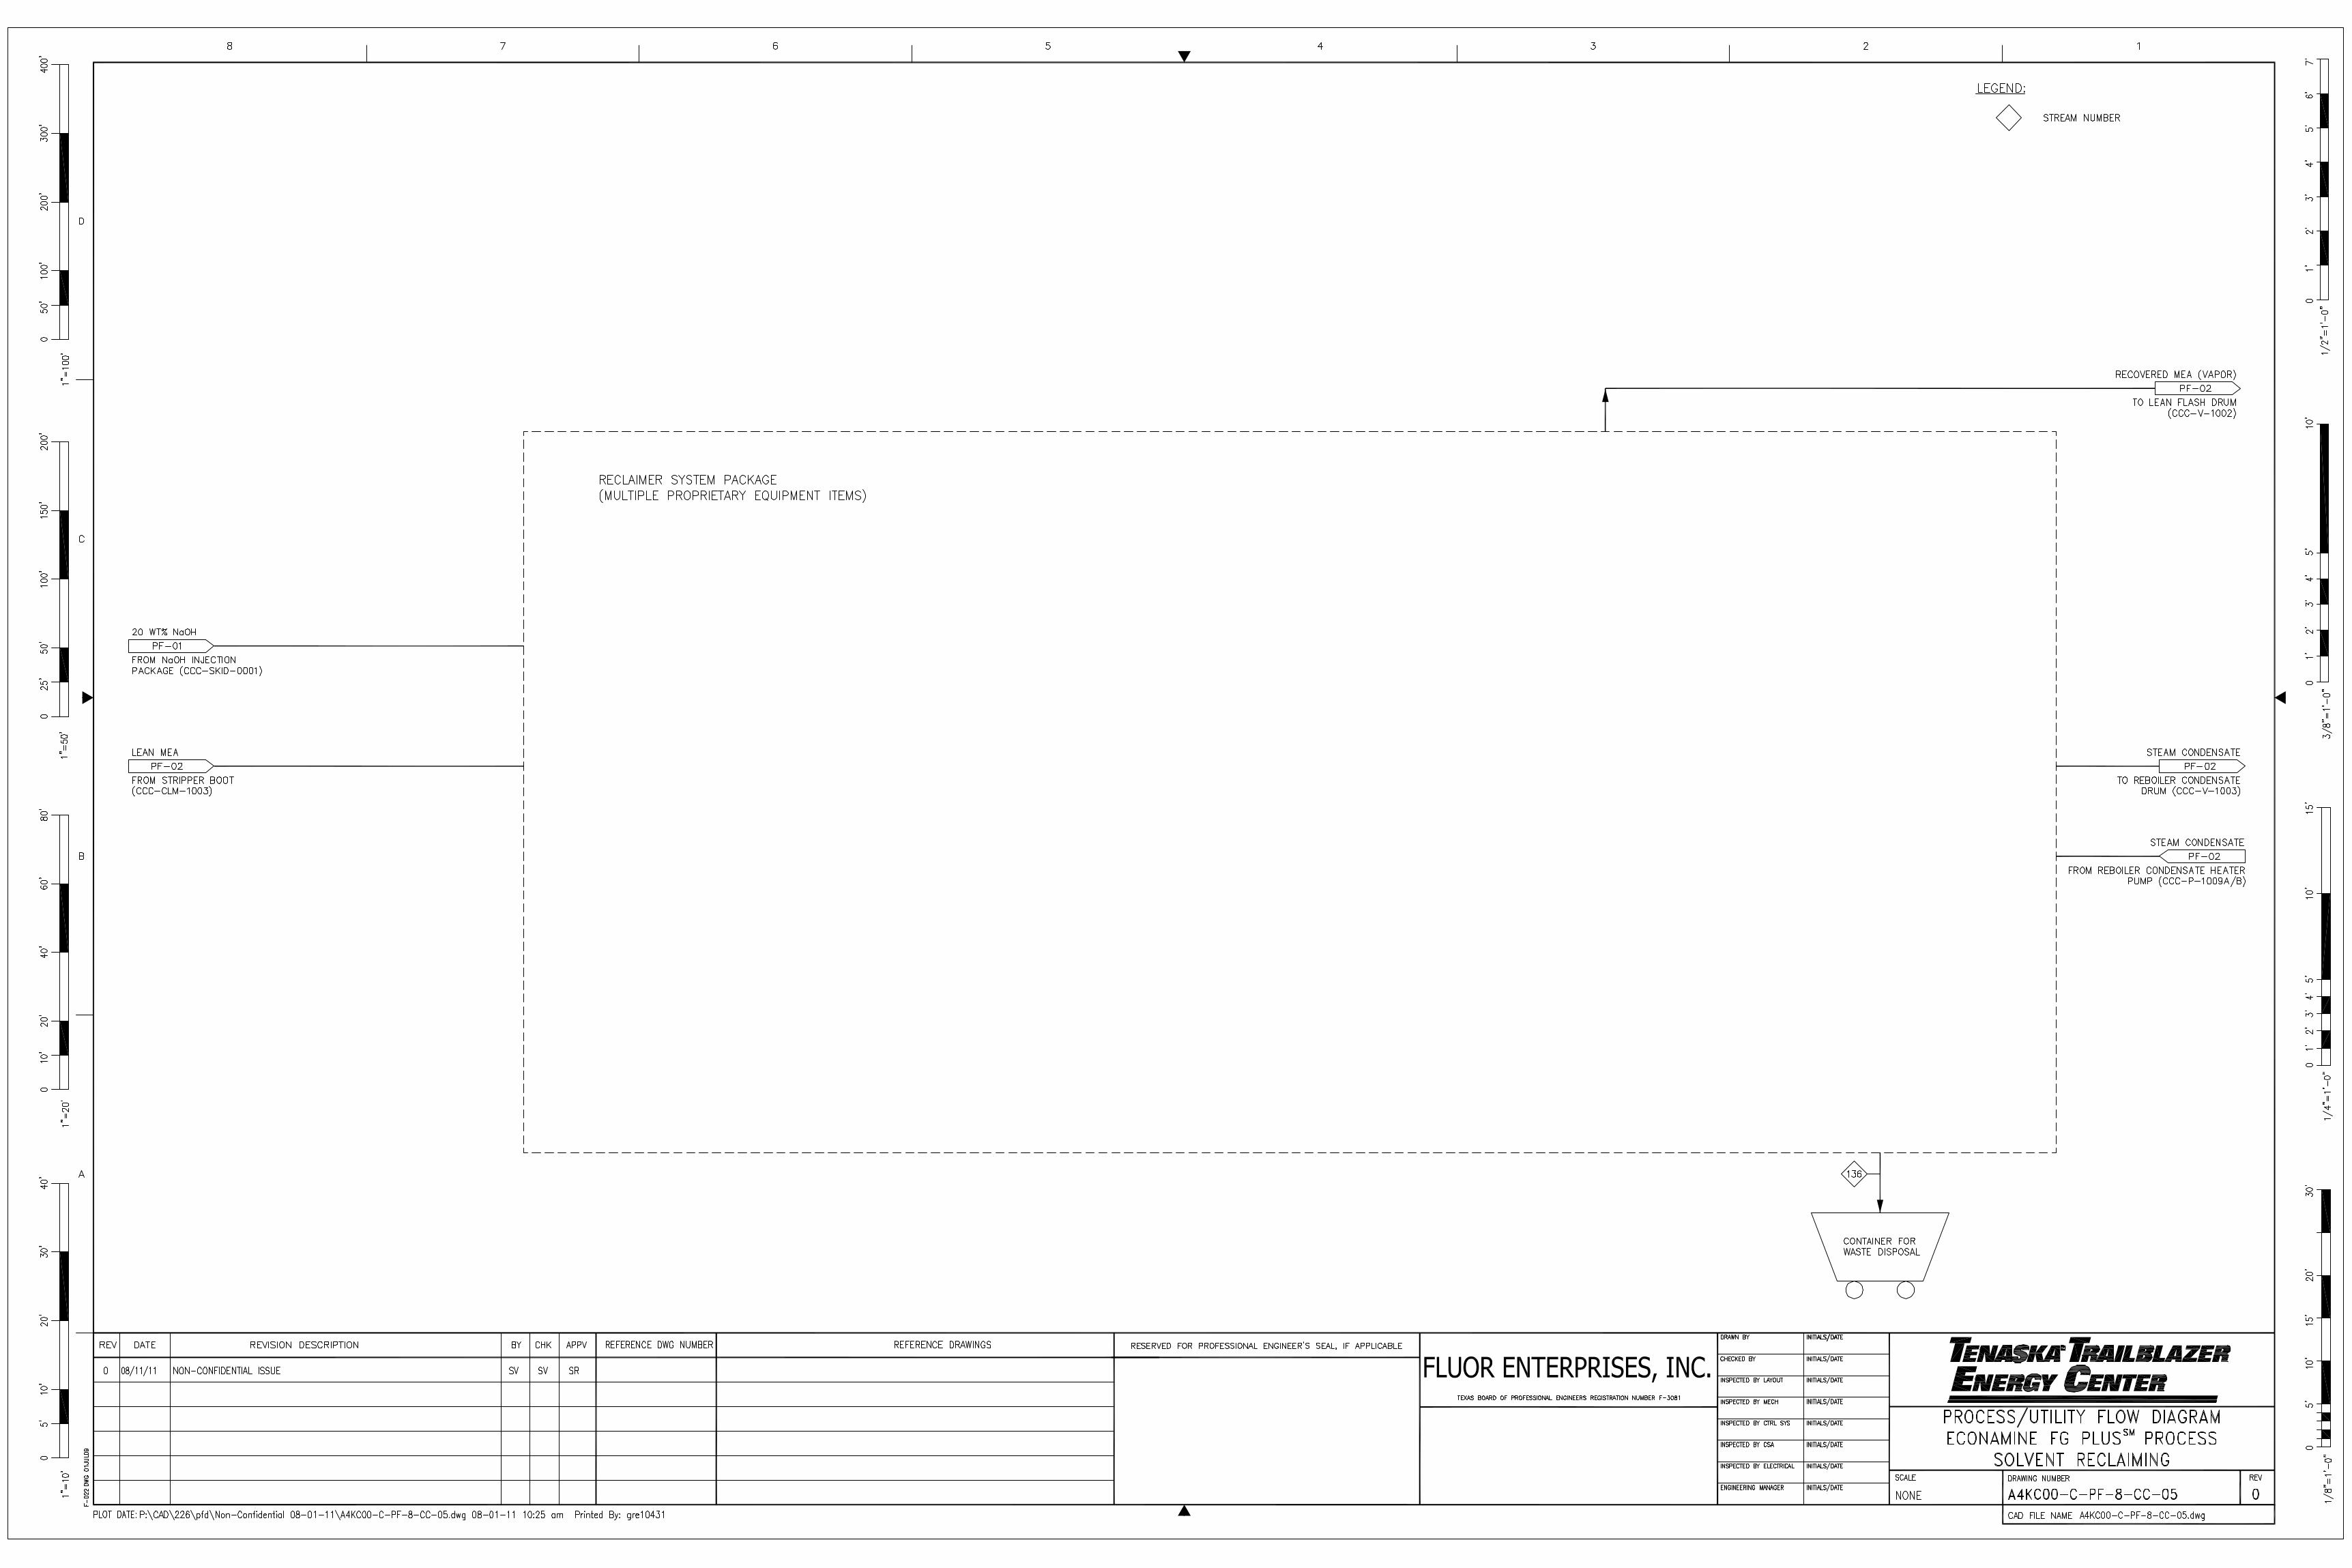
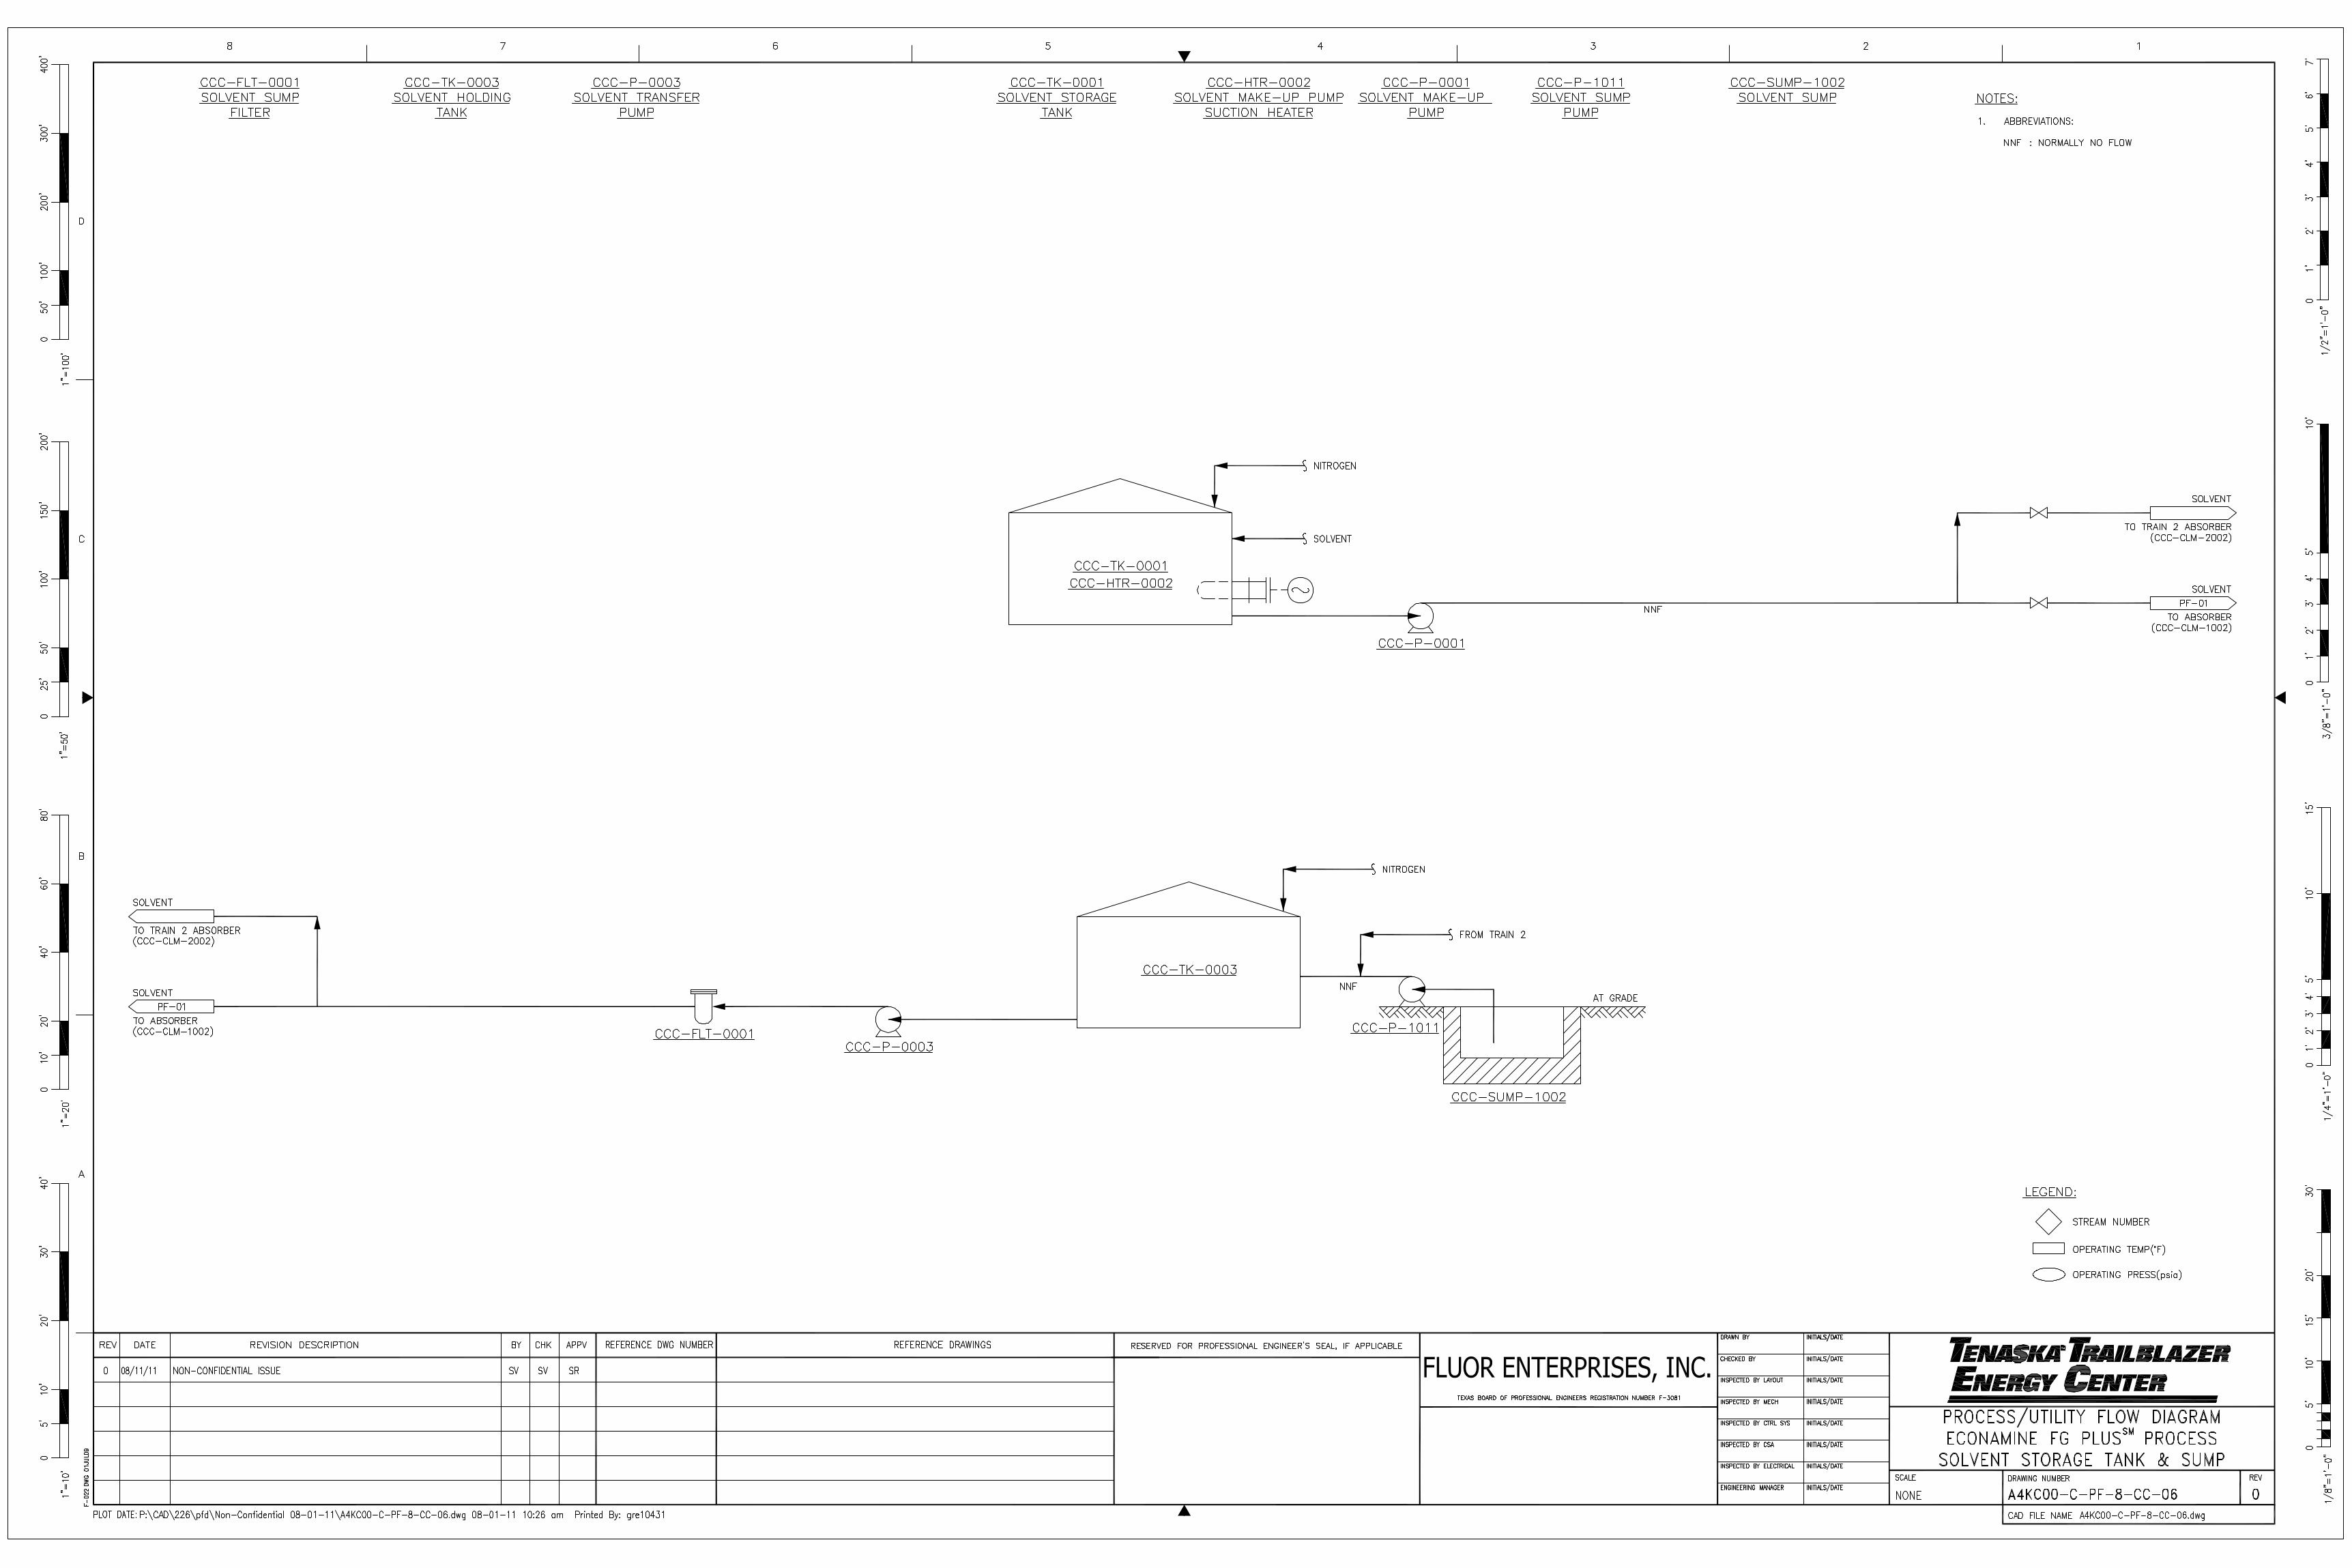
ATTACHMENT 3
Process Flow Diagrams


ATTACHMENT 4
Plot Plan


ATTACHMENT 5
Fluor Technology Paper with Bellingham Plant Information

Fluor’s Econamine FG PlusSM Technology For CO2 Capture at Coal-fired Power Plants
Satish Reddy Dennis Johnson John Gilmartin
Presented At: Power Plant Air Pollutant Control “Mega” Symposium
August 25-28, 2008 Baltimore
The Econamine FGSM and Econamine FG PlusSM technologies are Fluor proprietary amine-based carbon dioxide removal processes. All of the Econamine FGSM and Econamine FG PlusSM technology described in this paper is protected by existing or pending patents owned by Fluor.

FLUOR’S ECONAMINE FG PLUSSM
TECHNOLOGY FOR CO2 CAPTURE AT COAL-FIRED POWER PLANTS August, 2008
Page 2 of 17
Econamine FGSM Process Technology Background
Econamine FGSM (EFG) is a Fluor proprietary amine-based technology for large scale post-combustion CO2 capture. The EFG technology is the first and the most widely applied process that has extensive proven operating experience in the removal of carbon dioxide from high oxygen content flue gases (up to 15 vol.%). Carbon dioxide capture can be used for the following applications:
• CO2 sequestration • Enhanced oil recovery (EOR) • Merchant CO2 sales • Chemical feedstock production
Monoethanoloamine (MEA) is the basic ingredient of the EFG solvent. However, the solvent formulation is specially designed to recover CO2 from low pressure, oxygen-containing streams, such as boiler and reformer stack gas and gas turbine flue gas streams. Most amine systems cannot operate in such an environment, because the amine will rapidly degrade in the presence of oxygen. The EFG+ flowsheet is similar to a generic gas treating process, which has been practiced for many years. Simple, reliable equipment that is well-known to gas treating operating personnel is used. A typical flowsheet is presented in Figure 1, for reference. Fluor has experience putting the EFG process on a pressure sensitive source, such as a gas turbine exhaust, boilers or steam-methane reformer (SMR) flue gas line without any adverse effects. At one facility located in the United States, the EFG plant is located on the exhaust duct of a gas turbine in a power plant, where neither a backpressure nor pressure fluctuation can be tolerated. The technology is also located on steam-methane reformer flue gas lines in Brazil and Singapore. These plants consistently remove the carbon dioxide from the flue gas without disturbing the upstream pressure. The EFG+ technology has also been demonstrated on a plant that receives flue gas from a heavy fuel oil fired power plant boiler. The flue gas from this source is much dirtier than flue gases from coal-fired power stations that are fitted with FGD units and contained high levels of NOx, SOx, ash and metals including vanadium. In order to make the source of the flue gas a non-issue for the solvent, the pollutants and ash/metals were scrubbed to an insignificant level in a pretreatment unit located upstream of the EFG+ unit. Benefits of the EFG+ technology include the following:
• The process is specially designed for removing carbon dioxide from low-pressure, oxygen-containing flue gas streams.

FLUOR’S ECONAMINE FG PLUSSM
TECHNOLOGY FOR CO2 CAPTURE AT COAL-FIRED POWER PLANTS August, 2008
Page 3 of 17
• EFG technology does not require a custom-manufactured or expensive solvent. The main ingredient of the solvent is MEA, which is readily available and inexpensive. MEA is produced by solvent manufacturers worldwide.
• The technology has been successfully demonstrated in 25 commercial installations that were licensed over the past 20 years.
A typical EFG process flowsheet is given in Figure 1
CW
CW
CW
DEMIN WATER MAKEUP
FLUE GASFEED
EXCESSWATER
CW
LPSTEAM
PRODUCT CO2
ABSORBER VENT
MAKEUPSOLVENT
LPSTEAM
WASTE TODISPOSAL
SODA ASH
Figure 1: Typical Econamine FGSM Flowsheet
Commercial Plant Experience Fluor has mastered the art of removing carbon dioxide from dilute sources. In one of the 25 licensed plants, owned by Florida Power and Light, 365 short tons per day of CO2 is recovered from the exhaust of a natural gas fired power plant located in Bellingham, MA,

FLUOR’S ECONAMINE FG PLUSSM
TECHNOLOGY FOR CO2 CAPTURE AT COAL-FIRED POWER PLANTS August, 2008
Page 4 of 17
USA. This Econamine FGSM plant was designed and constructed by Fluor, and maintained continuous operation from 1991-2005. Due to increased natural gas prices in 2004/2005, the power plant began operating during peak hours only, rendering the Econamine FGSM plant uneconomical. This facility is the only commercial-scale CO2 recovery unit in the world that has operated on gas turbine flue gas. This is notable for three reasons:
1) Low CO2 concentration in flue gas – 3.1 vol% 2) High oxygen concentration in the flue gas – 13 vol% 3) Pressure sensitive source where neither backpressure nor a pressure fluctuation in
the flue gas line can be tolerated Bellingham is also an air-cooled plant, demonstrating the option of using air coolers with this technology. Figure 2 shows an aerial view of the Bellingham Econamine FGSM plant. The area shown in the picture also includes the CO2 liquefaction, storage, and truck loading facilities. Figure 3 shows a ground level view of the absorber and stripper at the Bellingham facility. The experience gained from the design, construction and 14 years of operation at the Bellingham facility is continually being used to further advance the Econamine FGSM technology. Fluor has developed innovative strategies to prevent amine degradation and corrosion. No other vendor can match the long term commercial operating experience with CO2 recovery from flue gas with a very high oxygen concentration. This translates into a more reliable and cost effective design and operation of future Econamine FGSM plants.
Figure 2: Bellingham Plant Aerial View

FLUOR’S ECONAMINE FG PLUSSM
TECHNOLOGY FOR CO2 CAPTURE AT COAL-FIRED POWER PLANTS August, 2008
Page 5 of 17
.
Figure 3: Bellingham Econamine FGSM Plant Ground View
Fluor has developed an advanced simulator to account for mass transfer, heat transfer and reaction kinetics. The simulator has been calibrated to performance test data from the Bellingham facility. This allows Fluor to test new flowsheet configurations in order to further improve the EFG process. Application to Coal fired Power Plants As concern for environment has grown over the last four decades, a greater control of pollutants in the flue gas from fossil fuel fired power plants has been mandated. Greenhouse gas emissions (carbon dioxide, nitrous oxide, methane, HCF, hydrogen sulfide, and PFC) are also the subject of intense political discussion.

FLUOR’S ECONAMINE FG PLUSSM
TECHNOLOGY FOR CO2 CAPTURE AT COAL-FIRED POWER PLANTS August, 2008
Page 6 of 17
Today, technologies are available for the capture of most pollutants released from coal-based power plants. Proven processes are routinely used today to remove sulfur dioxide (SO2), nitrogen oxides (NOx), Hydrogen Chloride (HCl), Hydrogen Fluoride (HF), particulates and mercury. For the removal of SO2, HCl and HF from flue gas, two commonly systems used are dry lime scrubbing (commonly referred to as “Dry Scrubbing”) and wet lime or limestone scrubbing (commonly referred to as Wet Flue Gas Desulfurization or WFGD). The design for the WFGD systems, even for high sulfur fuels, is approaching or exceeding 99% SO2 removal efficiency without the use of additives. The use of various additives can enhance the removal process for limestone. Even with the deployment of high efficiency pollutant removal technologies, there are still residual quantities of SO2 and H2SO4, ammonia, particulates, and other trace constituents that remain in the flue gas entering the carbon capture system. However, the CO2 absorption solvent will remove the majority of these pollutants. Although there is a significant reduction in power plant emissions, the pollutants in the flue gas increases the complexity and operating cost of the CO2 capture process regardless of the technology. Impurities in the flue gas, particularly SOx, NOx HCl and HF will lead to the formation of Heat Stable Salts (HSS) in any amine system. HSS are the product of acid-base reactions between amines and different acidic species in the flue gas. The HSS must be converted back into amine through a reclaiming process. In order to avoid excessive HSS build-up rates, the flue gas impurities must be reduced to a very low level upstream of the EFG+ absorber. Fluor has assessed that it is more cost-effective to remove HSS precursors before the flue gas encounters the solvent. The pre-treatment step to remove HSS forming precursors is a part Fluor’s process design strategy for coal-fired power plants. Figure 4, below, shows a schematic of a modern power plant. In this example, an SCR is used to control NOx. First ammonia is vaporized, mixed with air, and injected upstream of the SCR where NOx, primarily in the form of NO is converted to nitrogen gas. The next step might be sorbent injection for control of SO3 gas. The sorbent can be injected in any of a number of locations, such as just before the air preheater (APH), but almost always upstream of the particulate control device. Activated Carbon Injection (ACI) is one method of removing mercury from gas streams. This will also occur upstream of the particulate control device which will usually consist of a dry electrostatic precipitator (DESP) and/or a fabric filter (FF).

FLUOR’S ECONAMINE FG PLUSSM
TECHNOLOGY FOR CO2 CAPTURE AT COAL-FIRED POWER PLANTS August, 2008
Page 7 of 17
APH
SAH
FGD
Stack
NH3Mixer
NH3
SCR Reactor
Boiler
Economizer
Sorbent
FDF
ESP and/or
Fabric Filter
IDF
Notes:
SCR: Selective Catalytic Reduction
APH: Air Pre-heaterSAH: Steam Air HeaterFDF: Forced Draft FanIDF: Induced Draft FanESP: Electrostatic PrecipitatorFGD: Flue Gas Desulphurization
Activated Carbon
Figure 4: Power Plant without CO2 Capture Figure 4 also shows the path to a wet flue gas desulfurization (FGD) unit. However, many plants use dry FGDs, especially those with low sulfur fuel such as PRB. The dry FGD would be located upstream of the particulate control device. Regardless of whether SO2 is removed by wet or dry FGD, the carbon dioxide capture plant will be located downstream of the air quality control system. The flue gas will still have small quantities of particulate, SO2, ammonia, and other pollutant species that will need to be identified, quantified and considered in the design of the CO2 Capture unit. Ammonia based SO2 capture processes will also require a wet ESP to remove aerosols produced by ammonia the ammonia scrubbing process. Figure 5, below shows a modern power plant that is retrofitted with a CO2 Capture Unit.

FLUOR’S ECONAMINE FG PLUSSM
TECHNOLOGY FOR CO2 CAPTURE AT COAL-FIRED POWER PLANTS August, 2008
Page 8 of 17
APH
SAH
FGD
Stack
NH3Mixer
NH
3 Injection
NH3
Sorbent Injection
Acti vated C
a rbon Inje ction
SCR Reactor
Boiler
Economizer
Sorbent
FDF
Activated Carbon
ESP and/or
Fabric Filter
IDF
Notes:
SCR: Selective Catalytic Reduction
APH: Air Pre-heaterDCC: Direct Contact CoolerSAH: Steam Air HeaterFDF: Forced Draft FanIDF: Induced Draft FanESP: Electrostatic PrecipitatorFGD: Flue Gas Desulphurization
CO2Absorber
PolishingFGD/DCC Blower
Econamine FG PlusSM
Figure 5: Power Plant with CO2 Capture The new equipment added in the flue gas path for carbon capture include a polishing FGD or Direct Contact Cooler (DCC) with a scrubbing capability, a blower and a CO2 absorber. There are three polishing FGD concepts: .
• Adding a polishing section within an existing FGD: For this alternate, some of the FGD internals can be removed and replaced with new internals required to implement a polishing reagent circuit. These modifications would probably be less expensive than adding a new polishing scrubber. However, the FGD modifications would normally require a longer outage than is required for routine maintenance for a FGD system. Any work of this nature would require careful construction planning and coordination. In many cases, there might not be sufficient room to install the new internals that are required for polishing scrubbing.
• Adding a new (secondary) polishing scrubber: This option could have a higher
capital cost but does not require a lengthy shutdown of the power plant. • Adding scrubbing capability into the DCC: As the temperature of the flue gas
entering the absorber is decreased, the efficiency of the EFG+ process increases. The DCC is included in the EFG+ flowsheet to sub-cool the flue gas to a temperature below the adiabatic saturation temperature. The DCC can be designed
FLUOR’S ECONAMINE FG PLUSSM
TECHNOLOGY FOR CO2 CAPTURE AT COAL-FIRED POWER PLANTS August, 2008
Page 9 of 17
to achieve SOx removal in addition to flue gas cooling. A polishing scrubber can be added to the DCC to further reduce SOx to very low levels.
For power plants in countries or locations where the pollution control legislation is weak or non-existent, the following capital intensive items need to be considered for retrofitting of a CO2 capture unit:
• Adding a SCR which requires major construction downstream of the boiler • Adding an ESP • ID fan replacement or revamp • Adding a wet FGD • Installing facilities for reagents storage and spent reagent product handling • Adding new chimneys to handle wet flue gas conditions
Enhancements to Econamine FG SM Technology Fluor has been continuously improving its EFG process through solvent and flowsheet enhancements to lower both the energy consumption and solvent loss. Since the design of the Bellingham Plant, Fluor has developed an improved EFG process to incorporate the process enhancements. The enhanced process, called Econamine FG PlusSM (EFG+) is now being commercially offered. Advanced features of the EFG+ technology include the following:
• Improved solvent formulation • Absorber intercooling • Lean vapor compression configuration • Advanced reclaiming technologies • Heat integration with the power plant
The above list serves as a menu of options from which a customized plant design can be developed. Each CO2 removal application has unique site requirements, flue gas conditions and operating parameters. Based on the given CO2 removal application, it may be beneficial to implement only some of the enhancement features listed above. In this way, every plant will be optimized for its specific CO2 removal application. Improved Solvent Formulation Generic MEA based plants operate at low concentrations of approximately 18-20 wt%. Fluor’s standard Econamine FGSM plants are based on an MEA concentration of 30 wt%. The latest EFG+ plants are designed with MEA concentrations greater than 30 wt%.
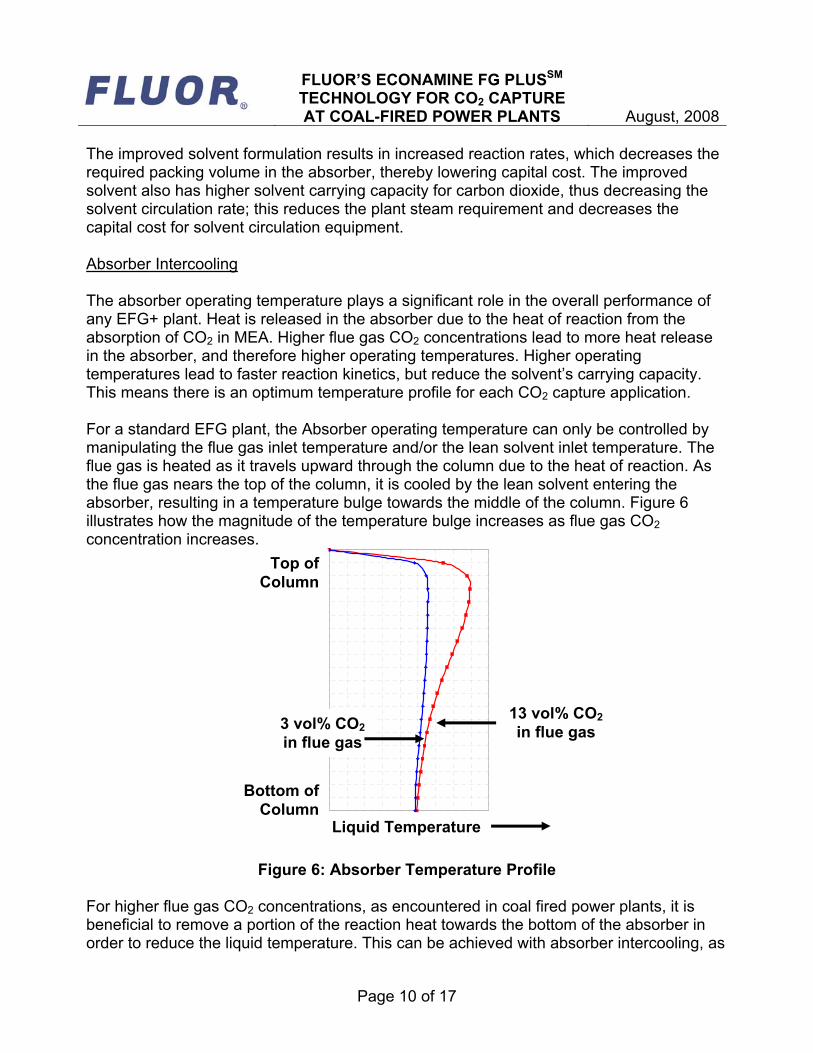
FLUOR’S ECONAMINE FG PLUSSM
TECHNOLOGY FOR CO2 CAPTURE AT COAL-FIRED POWER PLANTS August, 2008
Page 10 of 17
The improved solvent formulation results in increased reaction rates, which decreases the required packing volume in the absorber, thereby lowering capital cost. The improved solvent also has higher solvent carrying capacity for carbon dioxide, thus decreasing the solvent circulation rate; this reduces the plant steam requirement and decreases the capital cost for solvent circulation equipment. Absorber Intercooling The absorber operating temperature plays a significant role in the overall performance of any EFG+ plant. Heat is released in the absorber due to the heat of reaction from the absorption of CO2 in MEA. Higher flue gas CO2 concentrations lead to more heat release in the absorber, and therefore higher operating temperatures. Higher operating temperatures lead to faster reaction kinetics, but reduce the solvent’s carrying capacity. This means there is an optimum temperature profile for each CO2 capture application. For a standard EFG plant, the Absorber operating temperature can only be controlled by manipulating the flue gas inlet temperature and/or the lean solvent inlet temperature. The flue gas is heated as it travels upward through the column due to the heat of reaction. As the flue gas nears the top of the column, it is cooled by the lean solvent entering the absorber, resulting in a temperature bulge towards the middle of the column. Figure 6 illustrates how the magnitude of the temperature bulge increases as flue gas CO2 concentration increases.
Figure 6: Absorber Temperature Profile For higher flue gas CO2 concentrations, as encountered in coal fired power plants, it is beneficial to remove a portion of the reaction heat towards the bottom of the absorber in order to reduce the liquid temperature. This can be achieved with absorber intercooling, as
Top of Column
Liquid Temperature
Bottom of Column
3 vol% CO2 in flue gas
13 vol% CO2 in flue gas

FLUOR’S ECONAMINE FG PLUSSM
TECHNOLOGY FOR CO2 CAPTURE AT COAL-FIRED POWER PLANTS August, 2008
Page 11 of 17
shown in Figure 7. Absorber intercooling is achieved by extracting the semi-rich solvent between two of the absorption beds, cooling this solvent, and returning it just below the extraction point.
INTERCOOLING SYSTEM
Flue Gas
Vent
Gas
Wash Water
CWS CWR
Lean Solvent
Rich Solvent
Semi-Rich Solvent
CWS CWR
ABSORBER
Figure 7: Absorber Intercooling Configuration Reducing the liquid temperature increases the solvent carrying capacity, which reduces the solvent circulation rate, thereby reducing both the plant steam requirements and the capital cost of the solvent circulation equipment. In addition, the lower operating temperature results in a lower volumetric gas flow through the column, and therefore a smaller diameter. Figure 8 compares the absorber temperature profile for both an intercooled configuration against the temperature profile for a standard configuration based on the same 13 vol% flue gas shown in Figure 6 above. Figure 8 shows that by locating the intercooler in lower section of the absorber, the bottom portion of the column operates significantly cooler, while the top portion of the column operates only slightly cooler. This is advantageous since the reaction kinetics is only slightly hindered at the top of the column, while the solvent carrying capacity is maximized near the rich outlet at the bottom of the column.

FLUOR’S ECONAMINE FG PLUSSM
TECHNOLOGY FOR CO2 CAPTURE AT COAL-FIRED POWER PLANTS August, 2008
Page 12 of 17
Figure 8: Effect of Intercooling on Absorber Temperature Profile
Since the amount of heat released in the absorber is smaller for flue gases with low CO2 concentrations, the magnitude of the temperature bulge is reduced and the column will operate at a lower overall temperature. The lower operating temperature hinders the reaction kinetics and the benefits of intercooling are not realized. Lean Vapor Compression Configuration In a standard Econamine FGSM plant, the lean solvent from the Stripper, containing a low loading of carbon dioxide, is cooled and routed to the Absorber. Fluor now offers a lean vapor flash configuration (patent pending) in which the hot lean solvent from the Stripper is flashed at low-pressure in a flash drum. The resulting flashed vapor consists mostly of steam with small amounts of carbon dioxide and solvent. The flashed vapor is compressed
Liquid Temperature
Bottom of Column
13 vol% CO2 in flue gas with Intercooling
13 vol% CO2 in flue gas without Intercooling
Top of Column
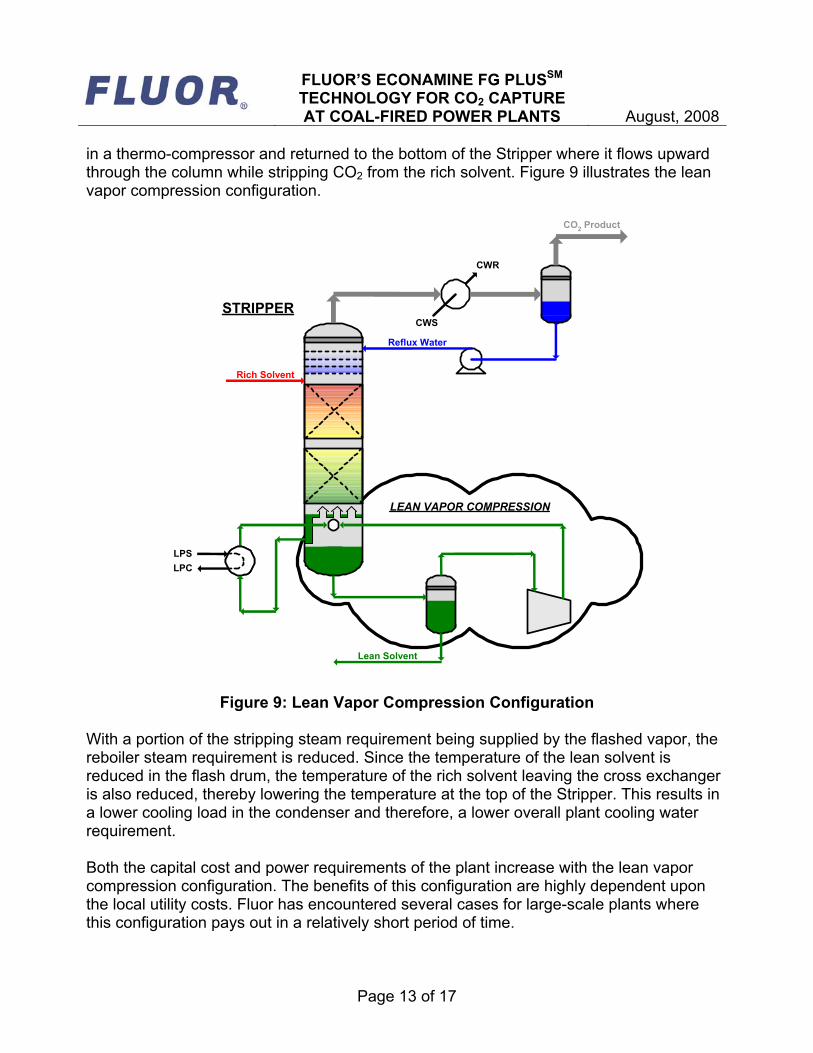
FLUOR’S ECONAMINE FG PLUSSM
TECHNOLOGY FOR CO2 CAPTURE AT COAL-FIRED POWER PLANTS August, 2008
Page 13 of 17
in a thermo-compressor and returned to the bottom of the Stripper where it flows upward through the column while stripping CO2 from the rich solvent. Figure 9 illustrates the lean vapor compression configuration.
LEAN VAPOR COMPRESSION
Rich Solvent
CWS
CWR
CO2 Product
Lean Solvent
LPSLPC
Reflux Water
STRIPPER
Figure 9: Lean Vapor Compression Configuration
With a portion of the stripping steam requirement being supplied by the flashed vapor, the reboiler steam requirement is reduced. Since the temperature of the lean solvent is reduced in the flash drum, the temperature of the rich solvent leaving the cross exchanger is also reduced, thereby lowering the temperature at the top of the Stripper. This results in a lower cooling load in the condenser and therefore, a lower overall plant cooling water requirement. Both the capital cost and power requirements of the plant increase with the lean vapor compression configuration. The benefits of this configuration are highly dependent upon the local utility costs. Fluor has encountered several cases for large-scale plants where this configuration pays out in a relatively short period of time.

FLUOR’S ECONAMINE FG PLUSSM
TECHNOLOGY FOR CO2 CAPTURE AT COAL-FIRED POWER PLANTS August, 2008
Page 14 of 17
Advanced Reclaiming Technologies In the past, Econamine FGSM plants were designed with thermal reclaimers. At the operating temperature and residence time of the thermal reclaimer, a considerable amount of degradation products were created during the reclaiming campaign. Recently, Fluor has developed new processes for low temperature MEA reclaiming that dramatically reduce solvent losses. One of these technologies is based on ion-exchange reclaiming. Ion-exchange reclaiming efficiently regenerates the solvent from heat stable salts with a very low solvent losses. However, there is a small amount of degradation product generated in the Econamine FG PlusSM process that cannot be removed with the ion-exchange process. Fluor has also developed a new atmospheric reclaiming process to remove these degradation products. Depending on the CO2 capture application, an Econamine FG PlusSM plant can be configured to incorporate both of these reclaiming processes to minimize solvent losses and significantly improve the environmental signature of the facility. Environmental Signature The Econamine FG PlusSM process produces the following emissions/effluents:
• Absorber stack emissions • Reclaimer wastewater • Excess water from flue gas cooling
Absorber stack emissions Typically, the absorber stack emission is essentially the same as the source stack except for the absorbed CO2, SOX and a portion on the NOx. In addition, due to vapor pressure loss and mechanical carryover, a trace quantity of MEA is emitted from the absorber. In addition, a small amount of ammonia is formed by the oxidation of MEA due to the oxygen present in the flue gas. The ammonia is stripped from the liquid phase by the flue gas as it flows through the absorber and is vented to the atmosphere. Fluor has aggressively pursued strategies for minimizing ammonia formation and reducing the loss of MEA in the vent by washing the treated flue gas in advanced column internals. Reclaimer waste/wastewater Fluor has developed an advanced low-temperature reclaiming technology that has significantly reduced the quantity of reclaimer waste.
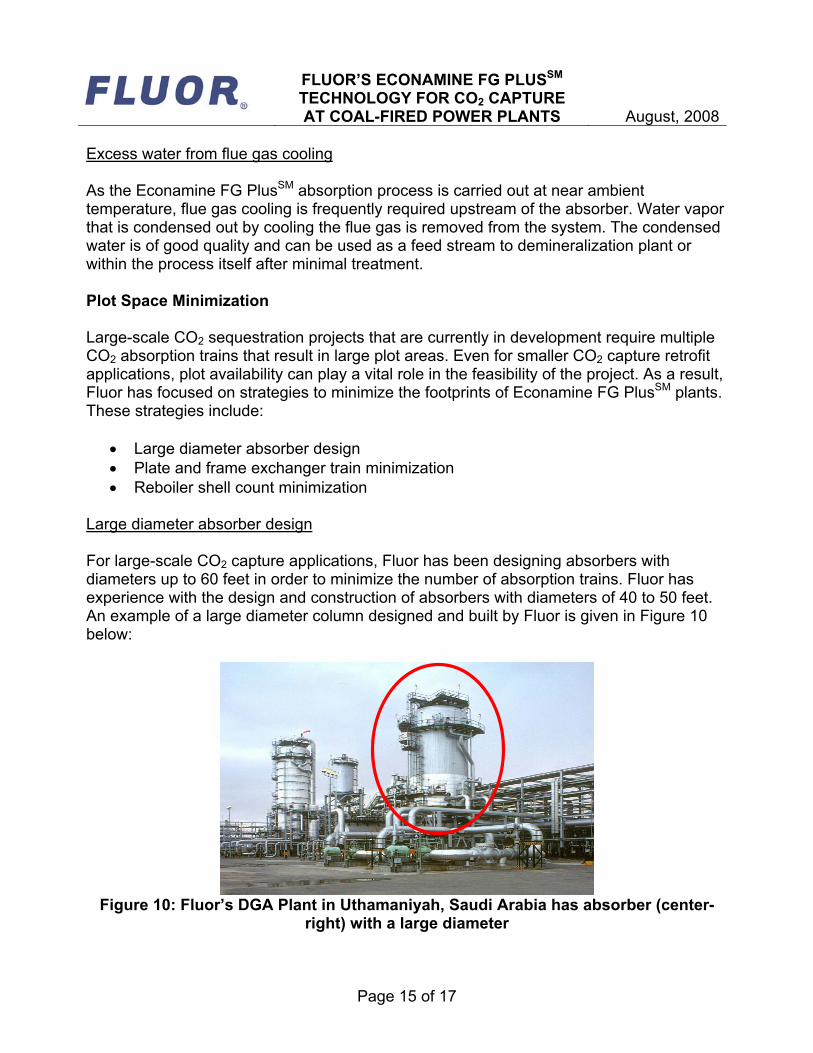
FLUOR’S ECONAMINE FG PLUSSM
TECHNOLOGY FOR CO2 CAPTURE AT COAL-FIRED POWER PLANTS August, 2008
Page 15 of 17
Excess water from flue gas cooling As the Econamine FG PlusSM absorption process is carried out at near ambient temperature, flue gas cooling is frequently required upstream of the absorber. Water vapor that is condensed out by cooling the flue gas is removed from the system. The condensed water is of good quality and can be used as a feed stream to demineralization plant or within the process itself after minimal treatment. Plot Space Minimization Large-scale CO2 sequestration projects that are currently in development require multiple CO2 absorption trains that result in large plot areas. Even for smaller CO2 capture retrofit applications, plot availability can play a vital role in the feasibility of the project. As a result, Fluor has focused on strategies to minimize the footprints of Econamine FG PlusSM plants. These strategies include:
• Large diameter absorber design • Plate and frame exchanger train minimization • Reboiler shell count minimization
Large diameter absorber design For large-scale CO2 capture applications, Fluor has been designing absorbers with diameters up to 60 feet in order to minimize the number of absorption trains. Fluor has experience with the design and construction of absorbers with diameters of 40 to 50 feet. An example of a large diameter column designed and built by Fluor is given in Figure 10 below:
Figure 10: Fluor’s DGA Plant in Uthamaniyah, Saudi Arabia has absorber (center-
right) with a large diameter

FLUOR’S ECONAMINE FG PLUSSM
TECHNOLOGY FOR CO2 CAPTURE AT COAL-FIRED POWER PLANTS August, 2008
Page 16 of 17
There are four major issues in the design of large diameter columns:
• Gas distribution • Liquid distribution • Support structure • Materials of construction
Gas distribution Vapor distribution in a column is most critical above vapor inlet ducts. Two primary considerations must be taken into account in the absorber design with regards to vapor distribution: the kinetic energy of the incoming gas and the vertical clearance between the vapor inlet and the bottom packed bed. Over the years, Fluor has developed design rules to ensure proper vapor distribution in column. These design rules have been validated through computational fluid dynamic (CFD) modeling of the column and the successful operation of the Bellingham plant. The CFD model’s domain comprised of the Blower discharge (rotational effects), the flue gas duct from the blower to the column, the vapor space below the bottom bed and the bed itself. Liquid distribution Packed columns are sensitive to proper liquid distribution throughout each bed. Mal-distribution results in loss of efficiency and therefore loss of performance. As such, the design of the liquid distributors and redistributors above each packed bed are critical to the successful operation of the column. The successful experience in selecting and designing column internals for the Bellingham plant is the basis of designing future large absorbers. Support structure for column internals A major challenge in design large diameter columns is simply handling the overall sheer size and weight. The internal infrastructure must be design to support the massive static loads of the column internals from both a mechanical and structural point of view. Fluor is implementing a novel design concept which consists of a hub ring type structure to support the column internals. Fluor has successfully implemented this support system in refinery columns of 45 to 55 feet diameter. Plate and frame exchanger train minimization Fluor has selected plate exchangers for thermal efficiency and plot size minimization. However, for large CO2 capture units, plate exchangers are usually applied in multiple trains and require a considerable plot space.

FLUOR’S ECONAMINE FG PLUSSM
TECHNOLOGY FOR CO2 CAPTURE AT COAL-FIRED POWER PLANTS August, 2008
Page 17 of 17
Fluor has been working with plate exchanger vendors to minimize the number of parallel exchanger trains. The number of parallel trains for a service can be reduced by increasing the plate size and/or improving the plate efficiency. By design, exchanger plates are very thin. As the plate size increases, the plate becomes more flexible making it more difficult for plate-pack re-assemble after routine cleaning. Vendors are making their best efforts to supply the largest plates possible. Reboiler shell count minimization For large-scale applications, Fluor has developed a unique reboiler design to minimize the number of shells. Not only does minimizing the number of shells reduce the plot space requirements, but it also simplifies the complexity of the system from both a design and operating point of view. The number of reboiler feed lines, return lines, nozzles and associated piping, instrumentation, and controls increase proportionally with the number of shells. The draw tray design becomes more complex, requiring balanced solvent flow to more shells. Balancing the steam flow to each shell of the reboiler becomes more complicated as well. Fluor has built and commissioned reboilers (in refinery service) similar in size to those required for CO2 capture in 1000 MW coal fired power plants. Summary Fluor’s proprietary Econamine FGSM technology is a proven, cost-effective process for the removal of CO2 from low-pressure, oxygen containing flue gas streams. The performance of the process has been successfully demonstrated on a commercial scale over the past 20 years. Through rigorous laboratory and field tests, Fluor has made added several enhancement features to further reduce the process energy consumption. In conjunction with the Econamine FGSM technology, these enhancement features are now available at the improved Econamine FG PlusSM technology. Any combination of these enhancement features can be assembled in a custom-fit solution to optimize each and every CO2 capture application. Furthermore, the Econamine FG PlusSM process offers an improved environmental signature and can be configured around tight area requirements. Fluor has developed a pre-treatment process for applying EFG+ technology to coal fired power plants. The strategy consists of three options for polishing scrubbing and incorporates Fluor’s experience in large FGD projects.