Embed Size (px)
Citation preview
Master Thesis
Comparison of quay wall designs in concrete, steel, wood and composites
with regard to the CO2‐emission and the Life Cycle Analysis
Graduation Committee: Prof. Drs. Ir. J.K. Vrijling TU Delft
Dr. Ir. J.G. de Gijt TU Delft / Public Works Rotterdam Ir. D. Dudok van Heel Public Works Rotterdam Prof. Dr. Ir. E.M. Haas TU Delft M.Sc. Thesis G.P. Maas, 1227858 Faculty of Civil Engineering and Geosciences Delft University of Technology Section Hydraulic Structures January 2011

Master Thesis G.P. Maas Comparison of quay wall designs with regard to the CO2‐emission and the Life Cycle Analysis 1227858
ii

Master Thesis G.P. Maas Comparison of quay wall designs with regard to the CO2‐emission and the Life Cycle Analysis 1227858
iii
Preface This thesis is the result of the Master Hydraulic Engineering, specialization Hydraulic Structures at the faculty of Civil Engineering and Geosciences at Delft University of Technology. This research has been carried out under the guidance of Public Works Rotterdam and TU Delft. The subject of this thesis is to compare the life cycle and CO2 emission of quay walls with different construction materials. The basis for this research and comparison has been the Euromax Terminal in the Port of Rotterdam.
First of all I would like to thank my graduation committee for their guidance, advices and critics. Especially Dr. Ir. J.G. de Gijt and Ir. D. Dudok van Heel.
I also would like to thank everybody at Public Works Rotterdam who helped me, special thanks to Leon Dijk, William Schutte and Mozafar Said.
From TU Delft I would like to thank Ir. P.A. de Vries who advised me on wood structures.
Furthermore I would like to thank Dennis Grotegoed, Jahwah Liang, Job Kool, Paolo Gatta and Axel Booij for their discussions.
Finally I want to thank my family and friends and especially my boyfriend Hugo for their support.
Rotterdam, january 2011 Trude Maas

Master Thesis G.P. Maas Comparison of quay wall designs with regard to the CO2‐emission and the Life Cycle Analysis 1227858
iv
Master Thesis G.P. Maas Comparison of quay wall designs with regard to the CO2‐emission and the Life Cycle Analysis 1227858
v
Contents 1 ..................................................................................................... 1 Introduction1.1 ............................................................................................................................. 1 Introduction1.2 .................................................................................................................. 2 Problem statement1.3 ......................................................................................................................................... 2 Goal1.3.1 ................................................................... 2 Designs of quay walls in different materials1.3.2 ........................................................................... 2 CO calculation and Life Cycle Analysis2
1.4 .................................................................................................................. 3 Structure of report
2 ............................................................................................ 5 Euromax Terminal2.1 .................................................................................................................................. 5 Situation2.1.1 ........................................................................................................... 5 Port of Rotterdam2.1.2 ....................................................................................................................... 5 Quay walls2.1.3 ........................................................................................................... 6 Euromax Terminal
2.2 ............................................................................................................................... 7 References
3 .............................. 9 Requirements and Boundary Conditions Euromax Terminal3.1 ............................................................................................................................. 9 Introduction3.2 ............................................................................................................... 9 Boundary conditions3.2.1 ................................................................................. 9 Geotechnical boundary conditions3.2.2 ....................................................................................... 9 Hydraulic boundary conditions
3.3 .......................................................................................................................... 9 Requirements3.3.1 ................................................................................................... 9 Technical requirements3.3.2 ................................................................................................................................ 9 Loads3.3.3 ................................................................................................. 10 Retaining requirements3.3.4 ................................................................................................... 10 Nautical requirements3.3.5 ........................................................................................................... 10 Berthing facilities3.3.6 .................................................................................................................. 10 Crane details3.3.7 .................................................................................................................... 10 Crane loads3.3.8 ............................................................................................................ 11 Scour protection
3.4 ............................................................................................................................. 11 References
4 ..................................................................................... 13 Modeling of the loads4.1 ........................................................................................................................... 13 Introduction4.2 ...................................................................................................................................... 13 Loads4.2.1 .................................................................................................................... 13 Water level4.2.2 ........................................................................................................... 13 Distributed loads
4.3 ................................................................................................................ 15 Load combinations4.4 ............................................................................................................................. 16 References
5 ......................................................................................................... 17 Concrete5.1 ........................................................................................................................... 17 Introduction5.2 .................................................................................................................................... 17 Design5.3 ............................................................................................................... 18 Construction stages5.4 ..................................................................................... 19 Material properties and dimensions5.4.1 .............................................................................................................. 19 Diaphragm wall5.4.2 ......................................................................................................... 19 Relieving structure5.4.3 ......................................................................................................................... 20 MV‐piles5.4.4 ...................................................................................................................... 20 Vibro piles
5.5 ............................................................................................................................. 20 References

Master Thesis G.P. Maas Comparison of quay wall designs with regard to the CO2‐emission and the Life Cycle Analysis 1227858
vi
6 ............................................................................................................... 21 Steel6.1 ........................................................................................................................... 21 Introduction6.2 .................................................................................................................................... 21 Design6.3 ............................................................................................................... 22 Construction stages6.4 ..................................................................................... 22 Material properties and dimensions6.4.1 ..................................................................................................................... 22 Combi wall6.4.2 ......................................................................................................... 22 Relieving structure6.4.3 ......................................................................................................................... 22 MV‐piles6.4.4 ...................................................................................................................... 22 Vibro piles
6.5 ............................................................................................................................. 22 References
7 ............................................................................................................. 23 Wood7.1 ........................................................................................................................... 23 Introduction7.2 ........................................................................................................... 23 Literature study wood7.2.1 ................................................................................................................... 23 Introduction7.2.2 ....................................................................................................................... 23 Durability7.2.3 ................................................................................................................. 26 Sustainability7.2.4 .................................................................................................................. 28 Wood specie
7.3 .................................................................................................................. 32 Design properties7.3.1 ............................................................................................................ 32 Strength grading7.3.2 ........................................................................................................... 32 Moisture content7.3.3 ............................................................................................................ 32 Duration of load7.3.4 ...................................................................................................... 32 Modification factors7.3.5 ..................................................................................................... 33 Modulus of elasticity7.3.6 ...................................................................................... 34 Overview of design properties
7.4 ........................................................................................................................... 34 Alternatives7.4.1 .......................................................................................................................... 34 General7.4.2 ......................................................................................... 36 Suitable structures for wood7.4.3 ................................................................................................................. 38 Wooden wall7.4.4 ............................................................................................................................... 49 Jetty
7.5 .......................................................................................................... 56 Comparison of designs7.5.1 ................................................................................................................... 56 Introduction7.5.2 ........................................................................................................................... 56 Criteria7.5.3 ................................................................................................................. 57 Wooden wall7.5.4 ............................................................................................................................... 59 Jetty7.5.5 ..................................................................................................................... 60 Conclusion
7.6 ............................................................................................................................. 61 References
8 ............................................................................... 63 Fiber Reinforced Polymer8.1 ........................................................................................................................... 63 Introduction8.2 ..................................................................................................................... 63 Literature study8.2.1 .............................................................................................. 63 Fiber Reinforced Polymer8.2.2 ............................................................................................................ 66 Sandwich panels8.2.3 .......................................................................................................... 67 Pultruded Shapes8.2.4 ............................................................................................................................... 69 Piles8.2.5 ..................................................................................................................... 70 Conclusion
8.3 .................................................................................................................. 71 Design properties8.3.1 ....................................................................................................... 71 Stiffness properties8.3.2 ................................................................................................................. 73 Safety factors
8.4 ........................................................................................................................... 74 Alternatives8.4.1 .......................................................................................................................... 74 General8.4.2 ......................................................................................................................... 78 FRP wall8.4.3 ....................................................................................................................... 89 Block wall

Master Thesis G.P. Maas Comparison of quay wall designs with regard to the CO2‐emission and the Life Cycle Analysis 1227858
vii
8.5 .......................................................................................................... 90 Comparison of designs8.5.1 ................................................................................................................... 90 Introduction8.5.2 ...................................................................................................... 91 Quantity of material8.5.3 ..................................................................................................................... 91 Conclusion
8.6 ............................................................................................................................. 92 References
9 ..................................................... 93 Overview Material Properties and Designs9.1 ............................................................................................................... 93 Material properties9.2 .................................................................................. 93 Impressions of four quay wall designs
10 .............................................................................................. 99 Cost estimation10.1 ........................................................................................................................... 99 Introduction10.2 ...................................................................................................................................... 99 Costs10.3 ........................................................................................................................... 102 Conclusion
11 ........................................................................... 103 CO and Life Cycle Analysis2
11.1 ......................................................................................................................... 103 Introduction11.2 ................................................................................................................... 103 Literature study11.2.1 ................................................................................................................. 103 Introduction11.2.2 ....................................................................................................... 103 Climate scenario’s11.2.3 .............................................. 104 What are global warming and the greenhouse effect?11.2.4 ........................................................................................................ 105 Life Cycle Analysis11.2.5 ................................................................................................... 107 People, planet, profit11.2.6 .......................................................................................................... 108 Scientific papers11.2.7 .................................................................................................................... 109 Databases11.2.8 ...................................................................................................................... 110 Software11.2.9 ................................................................................................................... 111 Conclusion
11.3 ................................................................................................................ 111 Life Cycle Analysis11.3.1 ......................................................................... 111 Goal, scope and definition of the LCA11.3.2 ................................................................ 112 Inventory analysis with help of a flowchart11.3.3 ...................................................................................................... 112 Impact assessment11.3.4 .................................................................................................................... 119 Evaluation
11.4 ........................................................................................................................... 122 References
12 ................................................................. 123 Conclusions & Recommendations12.1 ......................................................................................................................... 123 Introduction12.2 .......................................................................................................................... 123 Conclusions12.2.1 ........................................................................................................................... 123 Wood12.2.2 .......................................................................................... 123 Fiber Reinforced Polymers12.2.3 ............................................................................................................................ 124 Costs12.2.4 ....................................................................... 124 Carbon Footprint & Life Cycle Analysis
12.3 .............................................................................................................. 125 Recommendations12.3.1 ........................................................................................................................... 125 Wood12.3.2 .......................................................................................... 125 Fiber Reinforced Polymers12.3.3 ....................................................................... 125 Carbon Footprint & Life Cycle Analysis
Appendix A: Soil Profile Appendix B: Configuration of Loads Appendix C: Calculations wooden wall Appendix D: Calculations wooden jetty Appendix E: Cross‐section: FRP sandwich panel Appendix F: CO2 and Life Cycle Analysis

Master Thesis G.P. Maas Comparison of quay wall designs with regard to the CO2‐emission and the Life Cycle Analysis 1227858
viii
Master Thesis G.P. Maas Comparison of quay wall designs with regard to the CO2‐emission and the Life Cycle Analysis 1227858
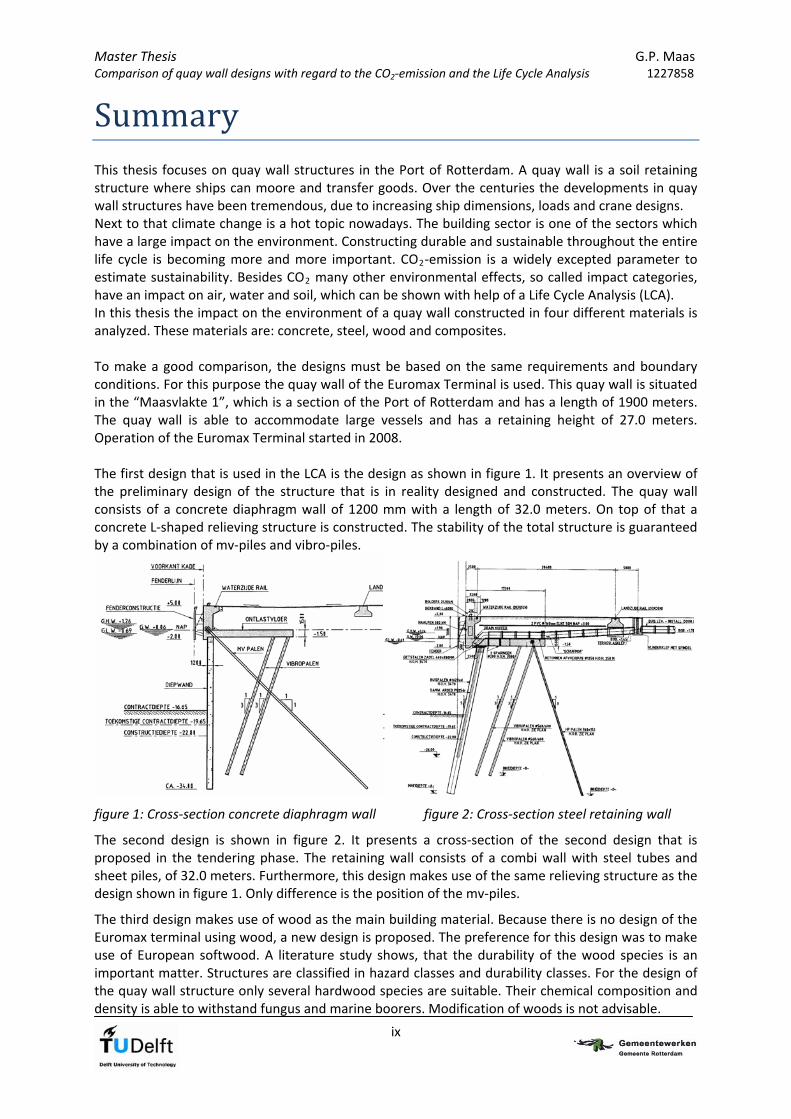
Summary This thesis focuses on quay wall structures in the Port of Rotterdam. A quay wall is a soil retaining structure where ships can moore and transfer goods. Over the centuries the developments in quay wall structures have been tremendous, due to increasing ship dimensions, loads and crane designs. Next to that climate change is a hot topic nowadays. The building sector is one of the sectors which have a large impact on the environment. Constructing durable and sustainable throughout the entire life cycle is becoming more and more important. CO2‐emission is a widely excepted parameter to estimate sustainability. Besides CO2 many other environmental effects, so called impact categories, have an impact on air, water and soil, which can be shown with help of a Life Cycle Analysis (LCA). In this thesis the impact on the environment of a quay wall constructed in four different materials is analyzed. These materials are: concrete, steel, wood and composites. To make a good comparison, the designs must be based on the same requirements and boundary conditions. For this purpose the quay wall of the Euromax Terminal is used. This quay wall is situated in the “Maasvlakte 1”, which is a section of the Port of Rotterdam and has a length of 1900 meters. The quay wall is able to accommodate large vessels and has a retaining height of 27.0 meters. Operation of the Euromax Terminal started in 2008. The first design that is used in the LCA is the design as shown in figure 1. It presents an overview of the preliminary design of the structure that is in reality designed and constructed. The quay wall consists of a concrete diaphragm wall of 1200 mm with a length of 32.0 meters. On top of that a concrete L‐shaped relieving structure is constructed. The stability of the total structure is guaranteed by a combination of mv‐piles and vibro‐piles.
figure 1: Cross‐section concrete diaphragm wall figure 2: Cross‐section steel retaining wall
The second design is shown in figure 2. It presents a cross‐section of the second design that is proposed in the tendering phase. The retaining wall consists of a combi wall with steel tubes and sheet piles, of 32.0 meters. Furthermore, this design makes use of the same relieving structure as the design shown in figure 1. Only difference is the position of the mv‐piles.
The third design makes use of wood as the main building material. Because there is no design of the Euromax terminal using wood, a new design is proposed. The preference for this design was to make use of European softwood. A literature study shows, that the durability of the wood species is an important matter. Structures are classified in hazard classes and durability classes. For the design of the quay wall structure only several hardwood species are suitable. Their chemical composition and density is able to withstand fungus and marine boorers. Modification of woods is not advisable.
ix

Master Thesis G.P. Maas Comparison of quay wall designs with regard to the CO2‐emission and the Life Cycle Analysis 1227858
Next to that, sustainability is important in this thesis as well. Forestry is considered sustainable when the ecosystem of the forest is being preserved on the long time, according to The Forest Stewardship Council (FSC) certification system. Taking these aspects into account, it is decided to make use of Azobé for the design of the quay wall. Several types of quay walls have been discussed and compared. The wooden wall appears to be the best design. Mainly because the wooden wall with the relieving structure uses less material than the other designs. A cross‐section of the wooden wall is shown in figure 3. The wooden wall has a thickness of 1400 mm and the concrete relieving structure has the same dimensions as shown in figure 1.
figure 3: Cross‐ section wooden wall figure 4: Cross‐section FRP sandwich panel
The fourth design is made of composites, resulting in the use of Fiber Reinforced Polymers (FRP). Because this is a new material in hydraulic structures, again a new design was proposed. Because all three foregoing designs make use of the relieving structure combined with a retaining wall, decided was to design a FRP sandwich panel, which shall function as the retaining wall. A vinyl ester resin reinforced with glass fibers has the best mechanical properties in relation to the costs. The maximum allowable strain in the outer fibers was normative for the design of the sandwich panel. This resulted in a total thickness of 2.08 meters. A cross section of this design is shown in figure 4. A cost comparison of these four designs shows that traditional building materials like concrete and steel result in the lowest costs. Wood is circa twice as expensive. The costs for a FRP sandwich panel are circa 8 – 10 times higher than a concrete diaphragm wall. Finally the CO2‐emission of each structure was calculated. The main excepted idea is that global warming is induced by the green house effect, although sceptics do not agree with this opinion. The CO2‐emission during the entire lifetime of the structure, from production of the materials to demolition has been determined. First this is done with data of IVAM in combination with the BAM Carbon Calculator. Next the Carbon Footprint is determined with the NIBE material database. These two Carbon Footprints give similar results: FRP creates the biggest Carbon Footprint and wood the smallest. Furthermore the emissions of several other impact categories have been determined. They represent emissions due to pollution to air, water and soil, depletion and land use. These emissions have been determined with the NIBE material database. Using monetization as a weighing factor, the so called “shadow prices” of each structure can be calculated. This cost represents the costs for the preventive measures that must be taken to reduce the emissions to a sustainable level. From this it can be concluded that the steel retaining wall results in the lowest shadow costs, closely followed by concrete. The shadow costs for the wooden wall are slightly higher and for the FRP wall they are much higher. FRP structures reach the same level of sustainability compared to a reinforced concrete structure, when they can be designed 23 times lighter. Furthermore it is recommended to investigate the influence of the end‐of‐life scenarios on the LCA outcomes, which could not be taken into account in this thesis. It is questionable if the concrete and steel structures than still show the best results.
x

Master Thesis G.P. Maas Comparison of quay wall designs with regard to the CO2‐emission and the Life Cycle Analysis 1227858
List of Symbols A Surface area [mm2] E0;ser;rep Modulus of elasticity (parallel) [N/mm ] 2
E90;ser;rep Modulus of elasticity (normal) [N/mm ] 2
EI Bending stiffness [Nmm2] fm;0;rep Bending strength [N/mm2] ft;0;rep Tensile strength (parallel) [N/mm2] ft;90;rep Tensile strength (normal) [N/mm2] fc;0;rep Compression strength (parallel) [N/mm2] ft;90;rep Compression strength (normal) [N/mm2] fv;0;rep Shear strength [N/mm2] FE Buckling force by Euler [kN] Fr;max;tip Maximum bearing capacity of pile tip [kN] Fr;max;shaft Maximum shaft friction of pile [kN] Gser;rep Shear modulus [N/mm2] i Radius of gyration [m] I Moment of inertia [mm4] kc Decrease in strength due to slenderness [‐] kdef Factor for creep deformation wood [‐] kmod Modification factor wood [‐] lbuc Buckling length [m] Kser Shear modulus [N/mm2] Lsys Length of system, c.t.c distance between piles [m] Md Bending moment [kNm] Nd Normal force [kN] s factor dependent on shape of pile [‐] si Distance between bolts [mm] S First moment of inertia [mm3] u Displacement [mm] V Shear force [kN] W Elastic section modulus [mm3] qc Cone resistance [MPa]
p Pile class factor [‐]
factor dependent on shape of pile tip [‐]
m Material factor [‐]
c Conversion factor [‐]
i Effectivity of connection [‐]
Slenderness ratio [‐] Density [kg/m3]
dc, Compression stress [N/mm2]
dm, Bending stress [N/mm2]
0 Reinforcement percentage [‐]
xi

Master Thesis G.P. Maas Comparison of quay wall designs with regard to the CO2‐emission and the Life Cycle Analysis 1227858
xii

Master Thesis Comparison of quay wall designs with rega
G.P. Maas rd to the CO2‐emission and the Life Cycle Analysis 1227858
1
1 Introduction
1.1 Introduction In the last decades, the developments in the Port of Rotterdam have been tremendous. The main goals of the Port of Rotterdam are the transhipment of goods and to a lesser extend people. To facilitate these activities in an efficient way an advanced structural system is needed. Therefore, this port is an area where many building activities take place to keep up with the ongoing development of world wide merchant. The port structures this thesis is focussing on are quay walls. A quay wall is a soil retaining structure where ships can moore and transfer goods. The first quay walls in Rotterdam were constructed in the 17th century. In that time it was not possible to create a retaining height of more than 2.5 meters. The ships, which had a draught of circa 5.0 meters, were moored against piles at a certain distance from the quay wall and a connection was made with help of wooden boards. Ship dimensions, loads and crane designs have changed rapidly over the years. To keep up with this expansion quay walls have become large, robust structures. Building materials like wood have been replaced by concrete and steel due to the development of techniques in materials and construction over the last centuries. They are today the most common construction materials for hydraulic structures. Relatively new in civil engineering are composites, which results in the use of fiber reinforced polymers (FRP). In this sector they are so far mainly applied in bridge decks. It is a material which can have a variety of material properties depending on its composition. Next to that, climate change is a hot topic nowadays. Many theories about the influence or absence of human activities are presented over the last years. The building sector is one of the sectors that have a large impact on the environment, due to the use of raw materials and energy coming from non renewable sources. Furthermore the functions of structures are changing and constructing for eternity seems to vanish. When the life time of a structure is over several options are possible. Demolishing demands a lot of energy and creates waste. A solution is to reuse parts for a new purpose. It can be said that constructing durable and sustainable throughout the whole lifecycle of the structure is becoming more and more important. Durability means for a quay wall that is must be able to withstand all the increasing loads of ships, cranes, weather and surroundings. The structure must suffice during its entire lifetime. A definition of sustainability is given by the World Commission on Environment and Development in 1987: “Sustainable development is development that meets the needs for the present without compromising the ability of future generations to meet their own needs”. A popular parameter to estimate sustainability is the CO2‐emission. It is widely accepted that global warming is induced by the green house effect, although critics do not share that opinion. In the Kyoto Protocol (1997) several countries have agreed to reduce their CO2‐emission. Many companies are calculating the CO2‐emission of their products or processes, resulting in a Carbon Footprint. Besides CO2 several other environmental effects, so called impact categories, have an impact on pollution of air, water and soil, depletion and land use. These impacts can be shown with help of a Life Cycle Analysis.

Master Thesis G.P. Maas Comparison of quay wall designs with regard to the CO2‐emission and the Life Cycle Analysis 1227858
2
1.2 Problem statement For this master thesis the emission of CO2 and several other impact categories will be determined for quay walls in different materials. These materials will be concrete and steel, which are the mostly used materials for this type of structures in the last decades. Furthermore wood, which is nowadays not used anymore for constructing very large retaining structures. The last material are composites (FRP). Their application in large hydraulic structures is new and will be researched in this thesis. The problem statement for this thesis will be:
“Comparison of quay wall designs in concrete, steel, wood and composites with regard to the CO2‐emission and the Life Cycle Analysis.”
1.3 Goal
1.3.1 Designs of quay walls in different materials
The aim of this thesis is to propose designs of quay walls constructed in four different materials: concrete, steel, wood and composites. Next the CO2‐emission and the life cycle shall be determined. To be able to make a good comparison the designs must be based on the same requirements and boundary conditions. For this purpose the quay wall of the Euromax terminal will be used. This quay wall is able to accommodate very large vessels and has a retaining height of 27.0 meters. The Euromax Terminal started to operate in 2008 and is situated in the “Maasvlakte 1” which is a section of the Port of Rotterdam. Several designs have been made for this quay wall, including a design with a steel combi wall and one with a concrete diaphragm wall. This last design is realized and has a length of circa 1900 meters. The information necessary for the life cycle analysis of these two designs shall be obtained through a literature study. One of the first quay walls have been constructed with wooden piles. Today dimensions of ships have increased significantly and so has the retaining height. Due to the material properties of concrete and steel, wood is not being used for modern structures with such a large retaining height. For this thesis a new design of a wooden quay wall will be determined. This will be done for the same requirements and boundary conditions as the Euromax Terminal. A precondition for this design is that European softwood shall be used, because a lot of tropical hardwood is being logged in an irresponsible way resulting in the loss of tropical rainforest, which has an enormous impact on the environment. The fourth quay wall shall be made with composites. Composites are an expression for materials composed of several materials. In this thesis they will result in the use of Fiber Reinforced Polymers. This is a relatively new material which is still in development and their applications are being extended. Several bridges for cyclists are build and some experiments with bridges for heavy trucks are executed. Applications of FRP in large hydraulic structures are absent, so for this material a new design has to be made too.
1.3.2 CO2 calculation and Life Cycle Analysis
The second part of this master thesis includes the calculation of the CO2‐emission of each quay wall design. Since several other impact categories also have an effect on air, water and soil, a life cycle analysis will be done to determine these. With a life cycle analysis the so called “shadow prices” of the structures can be obtained. This means that the environmental impacts are expressed in costs. These costs will differ from the real costs. Therefore it can be questioned, if structures which are cost efficient in real prices, are also efficient with respect to the environment.

Master Thesis G.P. Maas Comparison of quay wall designs with regard to the CO2‐emission and the Life Cycle Analysis 1227858
3
1.4 Structure of report First an introduction to the Port of Rotterdam and the Euromax Terminal will be presented. Next an overview of the requirements and boundary conditions of the Euromax terminal is given. From these requirements the loads acting on the structure can be modeled. In chapter 5 and 6 an overview of the designs of the Euromax quay wall with a steel combi wall and a concrete diaphragm wall are given, based on a literature study. In chapter 7 and 8 the quay walls in wood and composites are presented in separate chapters. These chapters will start with a literature study regarding the material properties and applications. An overview of all material properties used, is given in chapter 9 and in chapter 10 a cost estimation is done. Subsequently the CO2 calculation per design will be executed and the life cycle analysis will be performed, presented in chapter 11. The results will be compared with each other. Finally the conclusions of this thesis will be presented and recommendations will be given. Calculations that have been made are presented in the appendices and the references are given at the end of each chapter.

Master Thesis G.P. Maas Comparison of quay wall designs with regard to the CO2‐emission and the Life Cycle Analysis 1227858
4

Ma er Thesis Com arison of quay wall designs with regard to the CO2‐em
st G.P. Maas p ission and the Life Cycle Analysis 1227858
2 Euromax Terminal
2.1 Situation
2.1.1 Port of Rotterdam
The Port of Rotterdam is the biggest seaport of Europe. It is a gateway to the European market with more than 500 million consumers. Rotterdam’s entire port and industrial complex covers 10.500 hectares and is 40 kilometres in length. It is situated from the city to the “Maasvlakte” along the “Nieuwe Waterweg” canal. In figure 5 an overview of the total Port of Rotterdam is given. The oldest part of the harbour is dated in the 17th century. The newest reclamation of land is the creation of the “Maasvlakte 2”. It will consists of almost 2000 hectares, of which 1000 hectares for industrial purposes. In 2008 construction of the “Maasvlakte 2” has started and the first part will be ready for use in 2013.
figure 5: Overview of the Port of Rotterdam
2.1.2 Quay walls
Quay walls are soil retaining structures where ships can moore and transfer goods. The first quay walls in Rotterdam were constructed in the 17th century. In that time it was not possible to create a retaining height of more than 2.5 m. The ships, which had a draught of about 5 m, were moored against piles at a certain distance from the quay walls and a connection was made with help of wooden boards as shown in the left part of figure 6 [2.1]. Over the years the draught of ships increased significantly, therefore more robust structures were constructed. Nowadays a retaining height of more than 20 m is necessary to facilitate accommodation for modern ships, which can be seen in the right part of figure 6.
5

Master Thesis G.P. Maas Comparison of quay wall designs with regard to the CO2‐emission and the Life Cycle Analysis 1227858
figure 6: Quay wall 17th century Increase in draught of ships
2.1.3 Euromax Terminal
The Euromax Terminal is located at the “Maasvlakte 1” in the port of Rotterdam. The Maasvlakte 1 area is developed in the period of 1963 to 1975 by reclaiming land from the sea with help of dredging. The original level of the see bottom was NAP ‐6.0m. The current average level of the surface is NAP +5.0m [2.2].
figure 7: Future Maasvlakte 2 with Euromax terminal
The Euromax Terminal is situated in the north‐westerly part of the Maasvlakte 1 (right of red dashed line), adjacent to the Maasvlakte Olie Terminal, crude oil terminal as shown in figure 7. In September 2008 operations began in the Euromax terminal on the current Maasvlakte 1. The quay wall has a length of 1900m and is located at the Yangtze harbour, which will be the future entrance to the
6

Master Thesis G.P. Maas Comparison of quay wall designs with regard to the CO2‐emission and the Life Cycle Analysis 1227858
7
Maasvlakte 2. With a maximum depth of 19.6m, the terminal is able to handle the largest container vessels. The terminal has a capacity of 5 million TEU (Twenty‐foot equivalent unit, standardized dimensions of container). Goal of the Euromax Terminal is to be capable of handling ultra large vessels 24 hours a day and without any restriction. The expansion of the terminals on Maasvlakte 2 will take place after the first phase is realised and the Yangtze harbour is extended (red dashed line). The Euromax quay wall will be extended to be in total 3600m. The future Maasvlakte 2 is shown in the left side of figure 7 [2.3].
Commissioned by the Port of Rotterdam the new terminal has been build in favour of P&O/Nedlloyd‐ECT. Public Works Rotterdam made a feasibility study for various alternatives. Subsequently the Euromax quay wall was set in the market as a Design & Construct project. The design of BAM, a Dutch contractor, was chosen and the quay wall is constructed with a diaphragm wall [2.4].
2.2 References [2.1] CUR 211, “Handboek kademuren”, 2003. [2.2] www.maasvlakte2.com , 06‐2010 [2.3] www.ect.nl, 06‐2010 [2.4] Gemeentewerken Rotterdam, “Variantenstudie Euromax Terminal”, 2002.

Master Thesis G.P. Maas Comparison of quay wall designs with regard to the CO2‐emission and the Life Cycle Analysis 1227858
8

Ma er Thesis Com arison of quay wall designs with regard to the CO2‐emission and the Life Cycle An
st G.P. Maas p alysis 1227858
9
3 Requirements and Boundary Conditions Euromax Terminal
3.1 Introduction Under the Authority of the Port of Rotterdam a list of requirements and boundary conditions is composed. It shows an overview of all aspects which have to be taken into account for the engineering of the quay wall in the Euromax Terminal. It involves boundary conditions which are imposed by the surroundings and requirements from the Port of Rotterdam. The overview presented in this chapter is composed with help of the List of Requirements by Public Works Rotterdam [3.1].
3.2 Boundary conditions
3.2.1 Geotechnical boundary conditions Geotechnical research is executed by the engineering department of Public Works of Rotterdam, IGWR (Ingenieursbureau Gemeentewerken Rotterdam). For orientation 51 cone penetration tests have been done at the location of the future quay wall. The centre‐to‐centre (c.t.c.) distance of the tests were approximately 100 m. Several reports with soil interpretations are available, but they all show different results. IGWR used an average soil profile [3.2] in their preliminary designs which is unfavourable compared to the soil profiles that BAM used in their final design. They used many different soil profiles, because the quay wall has a length of 1900 m. Out of this, an average soil profile will be determined which will be used for the design of the quay walls in this master thesis. Appendix A shows an overview of the soil profile.
3.2.2 Hydraulic boundary conditions Water levels are not given in the report with the List of Requirements [3.1]. They have to be determined by the contractor that designs and builds the quay wall. Lowering of the water level due to passing ships is negligible for this type of structure.
3.3 Requirements
3.3.1 Technical requirements
Technical lifetime: 50 years
Concrete cover: 50 mm 100 mm for concrete constructed in the soil
Front of quay wall must be a vertical, flat wall from NAP +5.00 m to NAP ‐2.00 m. Over the length it may vary with jumps in favour of fender structures.
3.3.2 Loads Between front of quay wall and crane rail on landside: 40 kN/m2
Outside waterfront cargo handling area behind crane rail: 60 kN/m2
Traffic loads: Traffic class 60
Mooring loads: 2400 kN per bollard horizontal and normal to the quay wall. Bollard couples c.t.c distance 15.00 m, c.t.c distance bollards 2,70 m

Master Thesis G.P. Maas Comparison of quay wall designs with regard to the CO2‐emission and the Life Cycle Analysis 1227858
10
Toggles c.t.c 15.0 m. at NAP +1.90 m: 300 kN per toggle
Heavily loaded part of quay wall: Load: 100 kN/m2 Surface: 15x15 m2 Length quay wall: 15 m
Location is within the first 100 m west of point 1 directly at the waterfront. This load will not be taken into account in this master thesis, since the life cycle analysis will be done for an average cross section of the Euromax quay wall.
3.3.3 Retaining requirements
Total length quay wall: 1900 m
Contract depth: NAP ‐16.65 m
Future contract depth: NAP ‐19.65 m
Construction depth: NAP ‐22.00 m
Top of structure: NAP +5.0 m
3.3.4 Nautical requirements
Sea vessel: Southampton ++ class 12.500 TEU Length (overall): 382.0 m Width: 57.0 m Draught: 17.0 m Water displacement: 215.000 metric tons Mooring angle: 5° Mooring velocity: 0.15 m/s
Inland vessel: Length: 220.0 m Mooring angle: 15° Mooring velocity: 0.25 m/s
3.3.5 Berthing facilities Fenders maximum centre to centre distance: 15.0 m
Safety factor mooring energy: 1.5
3.3.6 Crane details Container crane on 2.5 m from the waterside.
C.t.c. distance of crane tracks: 100 foot = 30.48 m
C.t.c. wheelbases: 17.25 m
8 wheels per leg, c.t.c 1.05 m, so crane loads acts on 7x1.05 = 7.35 m
Distance between buffer: 27.20 m
Average operational wind speed: 25 m/s
3.3.7 Crane loads Per wheel [kN] Load on corner [kN] Load per m [kN/m]
Landside in operation 2.500 20.000 2.721
Waterside in operation 2.000 16.000 2.177
Landside during storm 2.000 16.000 2.177
Waterside during storm 1.400 11.200 1.524
Tie‐down load during storm 1.700 per lash
table 1: Representative loads, vertical

Master Thesis G.P. Maas Comparison of quay wall designs with regard to the CO2‐emission and the Life Cycle Analysis 1227858
11
Per wheel [kN] Load on corner [kN] Load per m [kN/m]
Landside in operation 45 350 48
Waterside in operation 45 350 48
Landside during storm 170 1350 184
Waterside during storm 170 1350 184
table 2: Representative loads horizontal, normal to the crane rail
Per wheel [kN] Load on corner [kN] Load per m [kN/m]
Landside in operation 35 280 38
Waterside in operation 50 400 54
Landside during storm 187.5 1500 204
Waterside during storm 187.5 1500 204
table 3: Representative loads horizontal, parallel tot the crane rail
3.3.8 Scour protection The design of bottom protection will not differ much per design of each material, this means that its contribution to the life cycle comparison will not be relevant. Therefore the scour protection of the structure will not be taken into account in this master thesis.
3.4 References [3.1] Public Works Rotterdam, Projectcode HH1169, “Programma van Eisen”, Version as‐built, 2007. [3.2] Public Works Rotterdam, “Variantenstudie Euromax Terminal”, 2002.

Master Thesis G.P. Maas Comparison of quay wall designs with regard to the CO2‐emission and the Life Cycle Analysis 1227858
12

Ma er Thesis Com arison of quay wall designs with regard to the CO2‐emission
st G.P. Maas p and the Life Cycle Analysis 1227858
13
4 Modeling of the loads
4.1 Introduction The list of requirements gave an overview of all the loads that the quay wall structure should be able to resist. In this chapter these loads will be specified to be used in the calculations of the two new quay wall designs in wood and composites.
4.2 Loads
4.2.1 Water level
A distinction is made between the ground water level (GWL) at the side of the construction and the water level of the sea (SWL). In the calculation reports from BAM (Delta Marine Consultants) several water levels are used [4.1]. They are summarized in table 4.
Type Water level (NAP)
1 G.W.L +0.52
2 G.W.L ‐1.12
3 G.W.L ‐1.38
4 S.W.L +1.92
5 S.W.L +1.67
6 S.W.L ‐1.12
7 S.W.L ‐1.38
table 4: groundwater levels
4.2.2 Distributed loads The other loads are specified in field loads, crane loads (vertical, horizontal normal and horizontal parallel to the crane track) and loads due to ships [4.2], [4.3].
Name Description Load
Field loads q1 Field loads behind crane track 60 kN/m2
q2 Field loads between crane tracks 40 kN/m2
Or
q3 Traffic class 60 Field load of 4 kN/m2 and Axle load of 200 kN
Crane loads landside in operation
q4 Vertical crane load 8 wheels c.t.c 1.05 m, 7x1.05 = 7.35 m. 2721 kN/m over 7.35 m
q5 Horizontal crane load (normal to crane track) 48 kN/m
q6 Horizontal crane load (parallel to crane track) 38 kN/m
Crane loads waterside in operation
q7 Vertical crane load 8 wheels c.t.c 1.05 m, 7x1.05 = 7.35 m. 2177 kN/m over 7.35 m
q8 Horizontal crane load (normal to crane track) 48 kN/m
q9 Horizontal crane load (parallel to crane track) 54 kN/m
Master Thesis G.P. Maas Comparison of quay wall designs with regard to the CO2‐emission and the Life Cycle Analysis 1227858
Crane loads landside, storm
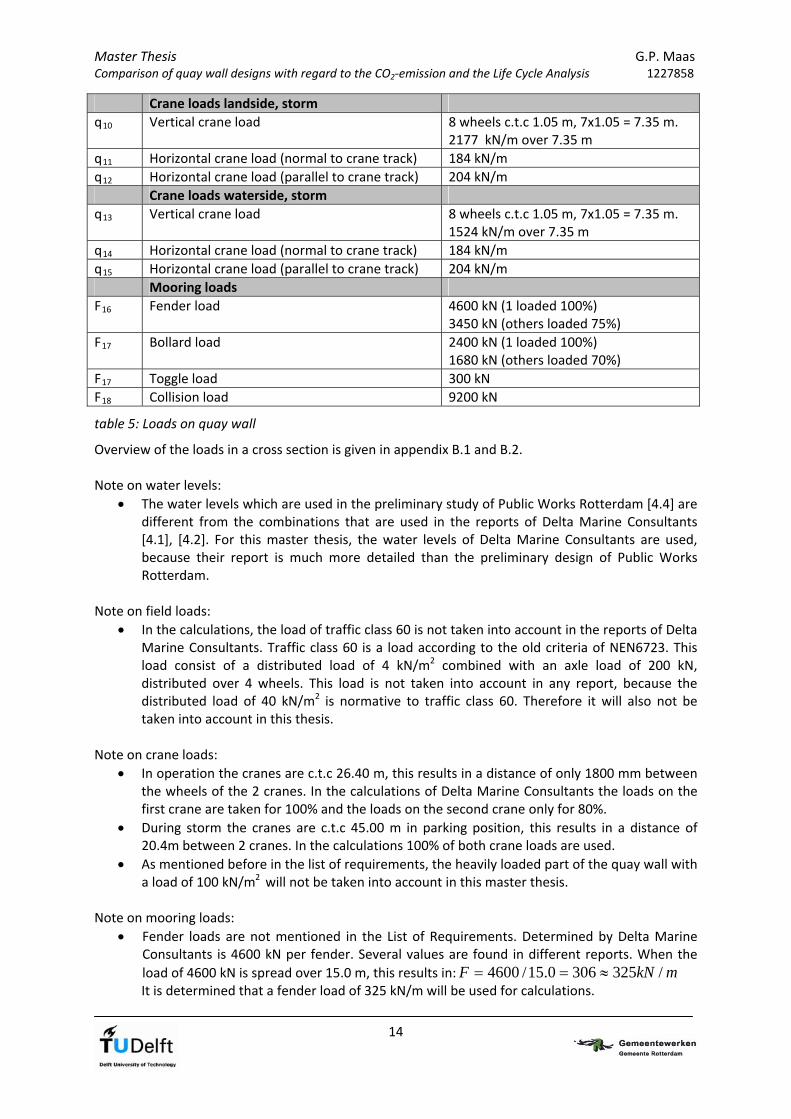
q10 Vertical crane load 8 wheels c.t.c 1.05 m, 7x1.05 = 7.35 m. 2177 kN/m over 7.35 m
q11 Horizontal crane load (normal to crane track) 184 kN/m
q12 Horizontal crane load (parallel to crane track) 204 kN/m
Crane loads waterside, storm
q13 Vertical crane load 8 wheels c.t.c 1.05 m, 7x1.05 = 7.35 m. 1524 kN/m over 7.35 m
q14 Horizontal crane load (normal to crane track) 184 kN/m
q15 Horizontal crane load (parallel to crane track) 204 kN/m
Mooring loads
F16 Fender load 4600 kN (1 loaded 100%) 3450 kN (others loaded 75%)
F17 Bollard load 2400 kN (1 loaded 100%) 1680 kN (others loaded 70%)
F17 Toggle load 300 kN
F18 Collision load 9200 kN
table 5: Loads on quay wall
Overview of the loads in a cross section is given in appendix B.1 and B.2. Note on water levels:
The water levels which are used in the preliminary study of Public Works Rotterdam [4.4] are different from the combinations that are used in the reports of Delta Marine Consultants [4.1], [4.2]. For this master thesis, the water levels of Delta Marine Consultants are used, because their report is much more detailed than the preliminary design of Public Works Rotterdam.
Note on field loads:
In the calculations, the load of traffic class 60 is not taken into account in the reports of Delta Marine Consultants. Traffic class 60 is a load according to the old criteria of NEN6723. This load consist of a distributed load of 4 kN/m2 combined with an axle load of 200 kN, distributed over 4 wheels. This load is not taken into account in any report, because the distributed load of 40 kN/m2 is normative to traffic class 60. Therefore it will also not be taken into account in this thesis.
Note on crane loads:
In operation the cranes are c.t.c 26.40 m, this results in a distance of only 1800 mm between the wheels of the 2 cranes. In the calculations of Delta Marine Consultants the loads on the first crane are taken for 100% and the loads on the second crane only for 80%.
During storm the cranes are c.t.c 45.00 m in parking position, this results in a distance of 20.4m between 2 cranes. In the calculations 100% of both crane loads are used.
As mentioned before in the list of requirements, the heavily loaded part of the quay wall with a load of 100 kN/m2 will not be taken into account in this master thesis.
Note on mooring loads:
Fender loads are not mentioned in the List of Requirements. Determined by Delta Marine Consultants is 4600 kN per fender. Several values are found in different reports. When the
load of 4600 kN is spread over 15.0 m, this results in: mkNF /3253060.15/4600 It is determined that a fender load of 325 kN/m will be used for calculations.
14
Master Thesis G.P. Maas Comparison of quay wall designs with regard to the CO2‐emission and the Life Cycle Analysis 1227858
15
In the report of Delta Marine Consultants [4.1] the bollards are positioned in couples c.t.c 2700 mm. The couples are positioned c.t.c 15.00 m.
The toggle loads of 300 kN are not present in the calculations, assumed is, that this is because the bollard and fender loads are normative.
Loads due to collisions are determined to be twice the nominal fender load. It will act on the structure at the position of the fenders, normal to the quay wall.
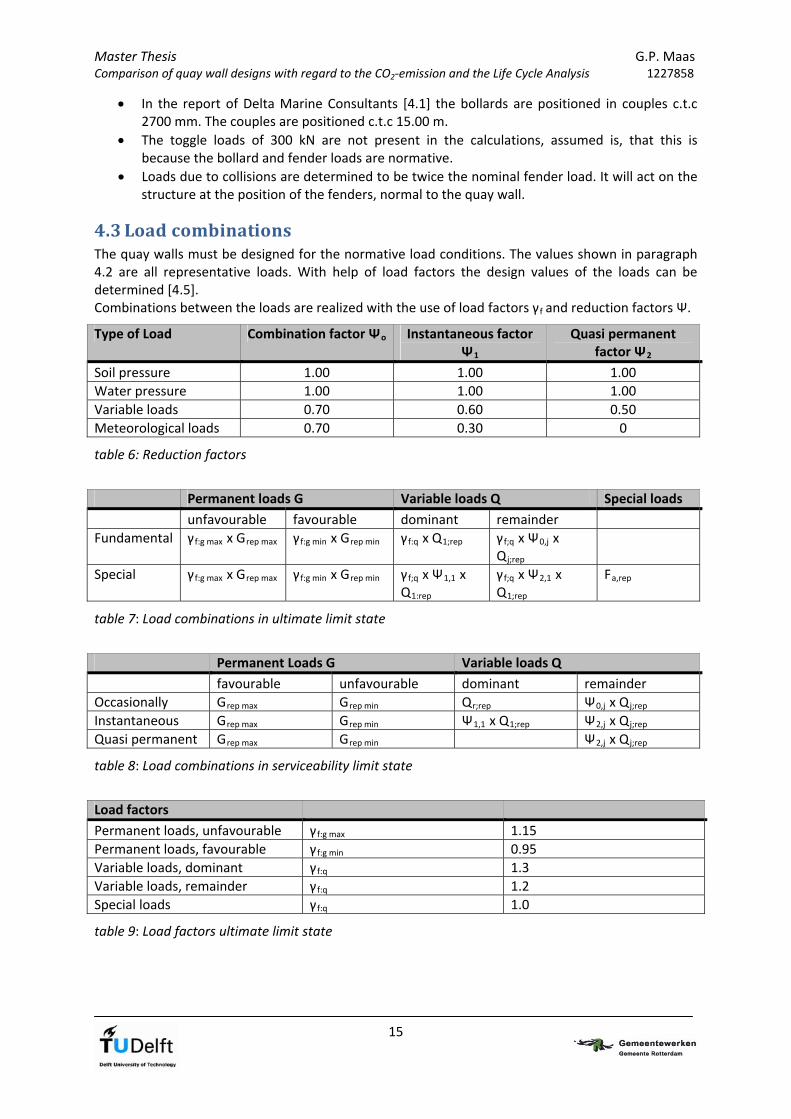
4.3 Load combinations The quay walls must be designed for the normative load conditions. The values shown in paragraph 4.2 are all representative loads. With help of load factors the design values of the loads can be determined [4.5]. Combinations between the loads are realized with the use of load factors γf and reduction factors Ψ.
Type of Load Combination factor Ψo Instantaneous factor Ψ1
Quasi permanent factor Ψ2
Soil pressure 1.00 1.00 1.00
Water pressure 1.00 1.00 1.00
Variable loads 0.70 0.60 0.50
Meteorological loads 0.70 0.30 0
table 6: Reduction factors
Permanent loads G Variable loads Q Special loads
unfavourable favourable dominant remainder
Fundamental γf:g max x Grep max γf:g min x Grep min γf:q x Q1;rep γf;q x Ψ0,j x Qj;rep
Special γf:g max x Grep max γf:g min x Grep min γf;q x Ψ1,1 x Q1:rep
γf;q x Ψ2,1 x Q1;rep
Fa,rep
table 7: Load combinations in ultimate limit state
Permanent Loads G Variable loads Q
favourable unfavourable dominant remainder
Occasionally Grep max Grep min Qr;rep Ψ0,j x Qj;rep
Instantaneous Grep max Grep min Ψ1,1 x Q1;rep Ψ2,j x Qj;rep
Quasi permanent Grep max Grep min Ψ2,j x Qj;rep
table 8: Load combinations in serviceability limit state
Load factors
Permanent loads, unfavourable γf:g max 1.15
Permanent loads, favourable γf:g min 0.95
Variable loads, dominant γf:q 1.3
Variable loads, remainder γf:q 1.2
Special loads γf:q 1.0
table 9: Load factors ultimate limit state

Master Thesis G.P. Maas Comparison of quay wall designs with regard to the CO2‐emission and the Life Cycle Analysis 1227858
16
4.4 References [4.1] Delta Marine Consultants, “O‐R‐013 Ontwerpbasis kadeconstructie rev. B”, 2005. [4.2] Delta Marine Consultants, “O‐R‐21 005001 Betonberekening bovenbouw rev. C”, 2005. [4.3] Public Works Rotterdam, Projectcode HH1169, “Programma van Eisen”, Versie as‐built, 2007. [4.4] Public Works Rotterdam, “Variantenstudie Euromax Terminal”, 2002. [4.5] CUR 211, “Handboek kademuren”, 2003.

Ma er Thesis Com arison of quay wall designs
st G.P. Maas p with regard to the CO2‐emission and the Life Cycle Analysis 1227858
5 Concrete
5.1 Introduction In the port of Rotterdam a deep sea container terminal is realized in the North‐West corner of the Maasvlakte. The task for the realisation of this 1900 m quay wall and the foundation of the crane track is performed by BAM Civil with a Design and Construct contract. The tender design is done by Delta Marine Consultants and consists of a diaphragm wall and a relieving floor. This is the first design that will be used in the life cycle analysis later on in this thesis.
5.2 Design BAM Civil designed and constructed the quay wall structure [5.1]. They engineered the preliminary design which resulted in the structure shown in figure 8.
figure 8: cross‐section quay wall
The quay wall consists of a diaphragm wall with a thickness of 1200 mm from NAP ‐34.00 m to NAP ‐2.00 m. At NAP ‐2.00 m it is connected to a relieving structure. The goal of this structure is to relieve ground pressure which is loading the diaphragm wall. The stability of the total structure is guaranteed by a combination of mv‐piles and vibro‐piles. The piles are connected to the relieving structure.
17
Master Thesis G.P. Maas Comparison of quay wall designs with regard to the CO2‐emission and the Life Cycle Analysis 1227858
5.3 Construction stages The construction of the quay wall is executed in different phases:
Installations for ground‐water lowering are installed and the ground level is lowered to NAP +2.00 m. Guiding walls for the construction of the diaphragm wall are realized.
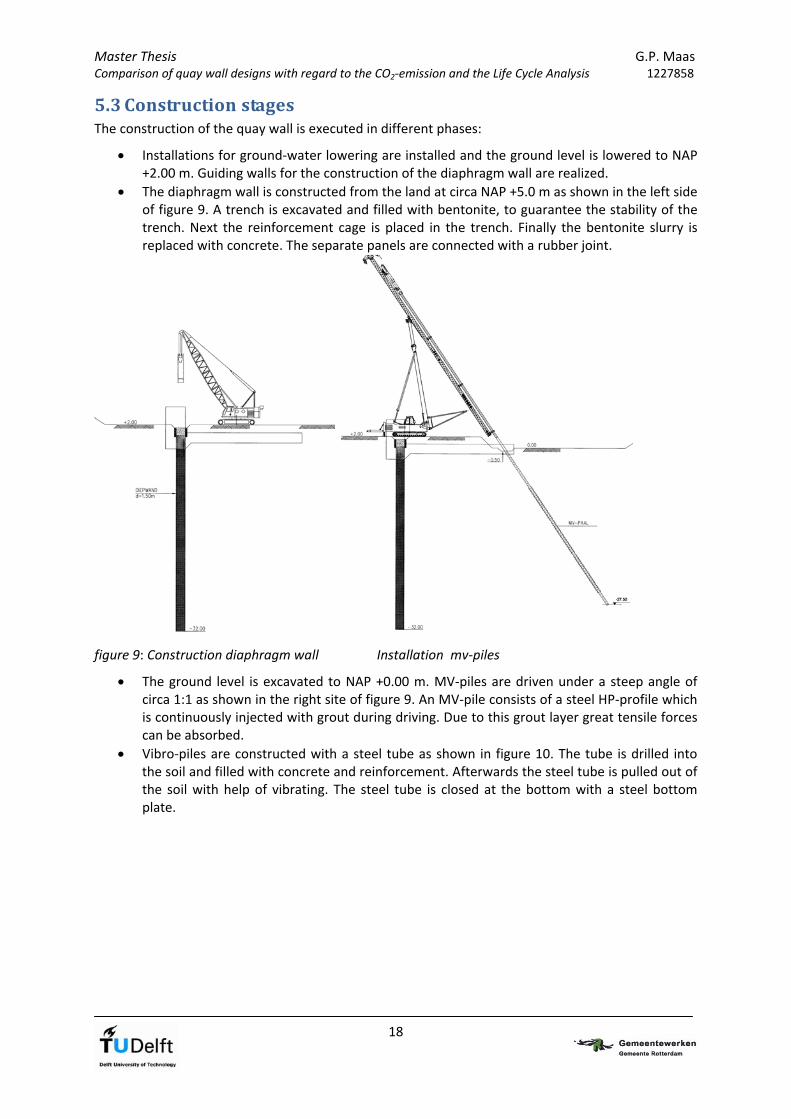
The diaphragm wall is constructed from the land at circa NAP +5.0 m as shown in the left side of figure 9. A trench is excavated and filled with bentonite, to guarantee the stability of the trench. Next the reinforcement cage is placed in the trench. Finally the bentonite slurry is replaced with concrete. The separate panels are connected with a rubber joint.
figure 9: Construction diaphragm wall Installation mv‐piles
The ground level is excavated to NAP +0.00 m. MV‐piles are driven under a steep angle of circa 1:1 as shown in the right site of figure 9. An MV‐pile consists of a steel HP‐profile which is continuously injected with grout during driving. Due to this grout layer great tensile forces can be absorbed.
Vibro‐piles are constructed with a steel tube as shown in figure 10. The tube is drilled into the soil and filled with concrete and reinforcement. Afterwards the steel tube is pulled out of the soil with help of vibrating. The steel tube is closed at the bottom with a steel bottom plate.
18

Master Thesis G.P. Maas Comparison of quay wall designs with regard to the CO2‐emission and the Life Cycle Analysis 1227858
Drilling of tube Fill tube with concrete
Pull steel tube
Place reinforcement
figure 10: Installation of vibro‐piles
The ground level is excavated to NAP ‐2.00 m. The diaphragm wall and the vibro‐piles are chopped to the right level and the mv‐piles are prepared for connection to the relieving structure.
The floor of the relieving structure is constructed. First the form work, then the reinforcement is placed and the concrete is cast. Finally, the same is done to construct the wall.
The crane track on the seaside is constructed on the relieving structure. The one on landside is constructed a separate shallow foundation made of concrete. All other element for mooring, fendering etc. are installed.
In the final situation the soil is excavated to NAP ‐19.50 m. The construction depth is NAP ‐22.00 m.
5.4 Material properties and dimensions
5.4.1 Diaphragm wall
Concrete quality B35 Thickness wall 1200 mm Length 32.00 m, from NAP ‐2.00 m to NAP ‐34.00 m Concrete cover 120 mm Reinforcement steel FeB500 E‐modulus reinforcement 200.000 N/mm2 C.t.c. layers reinforcement 80 mm
5.4.2 Relieving structure Concrete quality B35 Thickness wall 2500 mm Length wall 7.00 m, NAP +5.00 m to NAP ‐2.00 m Thickness floor 1500 mm Length floor 18.5 m Reinforcement steel FeB500
19

Master Thesis G.P. Maas Comparison of quay wall designs with regard to the CO2‐emission and the Life Cycle Analysis 1227858
20
5.4.3 MV‐piles
Quality S355 HP‐profiles 360x174 mm Average driving depth circa 36.00 m Average length circa 53.00 m Angle 1:1 c.t.c 5600 mm
5.4.4 Vibro piles Concrete quality B35 Reinforcement steel FeB500 Diameter Ø560Ø600 Average driving depth circa 28.50 m Average length circa 30.00 m Angle 3:1 c.t.c 2800 mm, in two rows
5.5 References [5.1] Drawing Delta Marine Consultants, Project: 022518, “A2‐004”, 2004.

Ma er Thesis Com arison of quay w
st G.P. Maas p all designs with regard to the CO2‐emission and the Life Cycle Analysis 1227858
6 Steel
6.1 Introduction In the tendering phase in 2004, BAM proposed two designs for the quay wall in the Euromax terminal. The first one with the diaphragm wall was reviewed in the previous chapter. The second design consists of a construction with a combi wall as the retaining structure.
6.2 Design Except for a bundle of drawings little information is available about this design [6.1]. A cross‐section of the structure is presented in figure 11.
figure 11: Cross section of design with steel combi wall
In figure 11 it can be seen that this design is quit similar to the design with the diaphragm wall. The relieving structure is similar to the previous design. Only the diaphragm wall of chapter 5 is replaced by a combi wall. Furthermore the location of the MV‐piles has changed. In the design with the diaphragm wall they are connected to the relieving structure at the point where the floor is connected to the wall. Now they are positioned almost at the end of the relieving floor.
21
Master Thesis G.P. Maas Comparison of quay wall designs with regard to the CO2‐emission and the Life Cycle Analysis 1227858
22
6.3 Construction stages The construction of this quay wall structure is executed in the same way as the design with the diaphragm wall. The only difference is the installation of the combi wall. So first the steel tubes and sheet piles are driven into the soil and connected to each other with slots. Next the mv‐piles and the vibro‐piles are installed. Finally the concrete relieving structure is constructed.
6.4 Material properties and dimensions
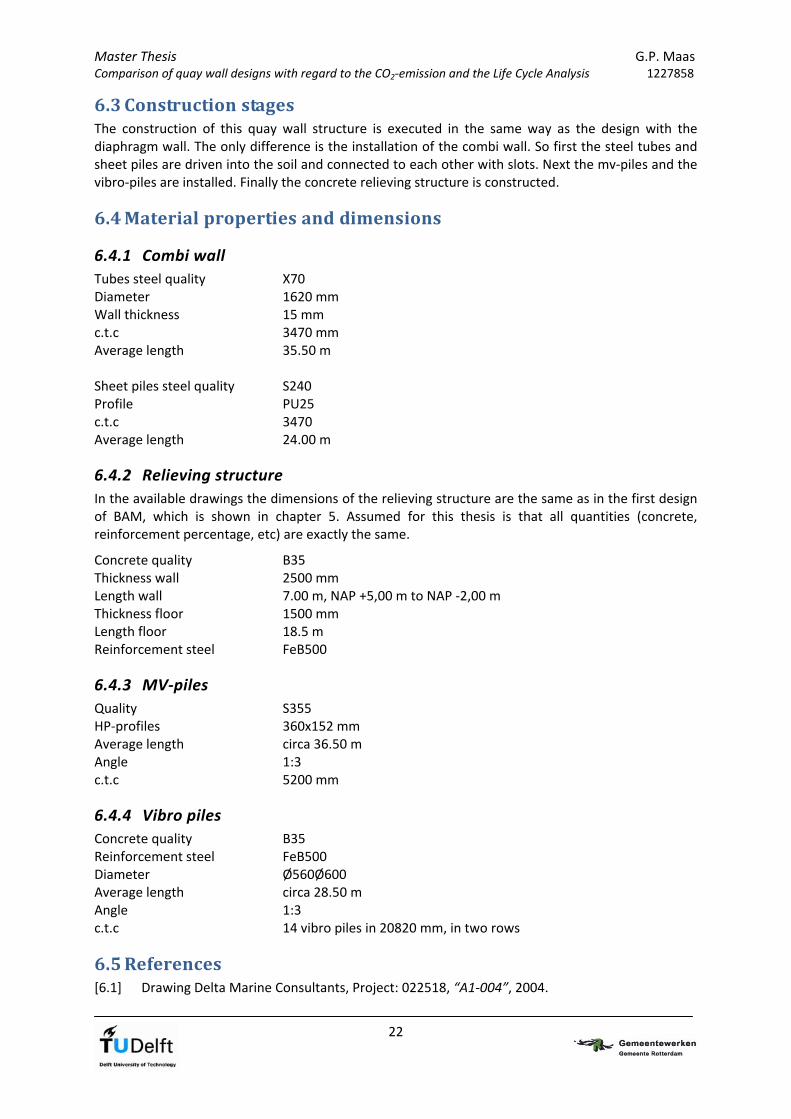
6.4.1 Combi wall
Tubes steel quality X70 Diameter 1620 mm Wall thickness 15 mm c.t.c 3470 mm Average length 35.50 m Sheet piles steel quality S240 Profile PU25 c.t.c 3470 Average length 24.00 m
6.4.2 Relieving structure In the available drawings the dimensions of the relieving structure are the same as in the first design of BAM, which is shown in chapter 5. Assumed for this thesis is that all quantities (concrete, reinforcement percentage, etc) are exactly the same.
Concrete quality B35 Thickness wall 2500 mm Length wall 7.00 m, NAP +5,00 m to NAP ‐2,00 m Thickness floor 1500 mm Length floor 18.5 m Reinforcement steel FeB500
6.4.3 MV‐piles
Quality S355 HP‐profiles 360x152 mm Average length circa 36.50 m Angle 1:3 c.t.c 5200 mm
6.4.4 Vibro piles Concrete quality B35 Reinforcement steel FeB500 Diameter Ø560Ø600 Average length circa 28.50 m Angle 1:3 c.t.c 14 vibro piles in 20820 mm, in two rows
6.5 References [6.1] Drawing Delta Marine Consultants, Project: 022518, “A1‐004”, 2004.

Ma er Thesis Com arison of quay wa
st G.P. Maas p ll designs with regard to the CO2‐emission and the Life Cycle Analysis 1227858
23
7 Wood
7.1 Introduction In this chapter a design for the Euromax quay wall is proposed using wood as the main building material. This chapter is set up as follows: first a literature study is presented. This study shows what is the best type of wood for the design of a quay wall that is subjected to large impacts and is situated in a permanent salty environment. A preference was to use only European softwood. Responsible forest management shall be an important issue in this study. Secondly the design values for the strength properties will be determined from the characteristic values with help of modification and material factors. Thirdly a number of ideas will be presented. Several types of constructions will be researched. The main dimensions will be determined with rough calculations and the feasibility is checked. Finally the best alternative shall be chosen with help of several criteria. This alternative will be used for the comparison of the quay walls designed with concrete, steel and composites in chapter 11.
7.2 Literature study wood
7.2.1 Introduction Wood is one of the oldest building materials. It can be applied in many forms, for example piles, boards and frames or floors with beams and trusses. The material wood is a natural raw material. To be able to obtain usable wood of good quality which is logged in a legal way, it is necessary to manage forests in a responsible manner. With help of a system of certificates the origin of the wood is traceable. Wood production is only one of the many functions of the forest. Forests preserve the growth of flora and fauna, food and materials for medicines. Furthermore a young forest absorbs CO2. A mature forest is CO2 neutral, because degradation emits just as much CO2 as is absorbed by new growth [7.1]. A lot of wood is cultivated purely for relatively low‐grade applications, such as in the pulp and paper industry. Only 18% of the total wood production is used in civil‐engineering projects [7.2]. Two different types of wood can be distinguished, hardwood and softwood. Hardwood is gained from trees with leaves and softwood from trees with needles. One specification to keep in mind while constructing with wood, is that it is an anisotropic material due to its structure, which means that the material properties vary in different directions.
7.2.2 Durability
7.2.2.1 European softwood
Two different types of wood have been distinguished, softwood and hardwood. At the start of this master thesis, the use of European softwood for the construction of the quay wall is preferred. Typical softwood species are pinewood, red wood and larch. The preference for European softwood existed for several reasons:
The first one is the bad forestry and irresponsible forest management in most tropical rainforests. In general wood gained from these forests is illegally logged and the rainforests are not maintained to be preserved for the future. A lot of forest disappears because the land is more profitable when it is used for other purposes, like palm oil plantations.
The second reason for the preference of European softwood is the supposition that the growth of these trees is much faster than the growth of hardwood trees. In a circa 15 years a

Master Thesis G.P. Maas Comparison of quay wall designs with regard to the CO2‐emission and the Life Cycle Analysis 1227858
24
new softwood tree is ready for logging. In contrary to a hardwood tree that needs circa 50 years to mature. Experts from TU Delft state that the growth of European softwood is circa 40 to 50 years, which is almost just as long as hardwood species. Therefore this advantage is unfortunately not valid for the use of European softwood [7.3], [7.4].
7.2.2.2 Durable wood properties
When a wooden structure is designed a number of important steps need to be taken to choose the right type of wood to be able to make a durable construction. These steps are:
1. Conditions for the structure, such as loads and environmental exposure 2. Maintenance 3. Choose a material
Structures are classified in 5 different risk classes, depending on the application and the related environmental exposure [7.5]. These hazard classes are shown in table 10. Hazard class Application Moistening Moisture content
[%] Type of structure
1 Covered and dry, no soil contact
Permanent dry Max 20% Indoor, floors and girders
2 Covered, possibly wet, no soil contact
Occasionally wet Temporarily > 20% Roof elements, covered elements
3 Not covered, no soil contact
Regularly wet Regularly > 20% Facades, uncovered roof elements
4 In contact with groundwater (fresh)
Permanently exposed to fresh (ground)water
Permanent > 20% piles and sheet piles
5 Salt water Permanently exposed to salt water
Permanent > 20% Hydraulic structures in ports and coasts.
table 10: Relation between hazard classes and the application of structures
Furthermore wood species are assigned to durability classes, in which durability class 1 is very durable and durability class 5 is said to be not durable. In table 11 is shown which durability class is appropriate for each specific hazard class [7.5]. Natural durability classes Hazard class 1 2 3 4 5
1 O O O O O
2 O O O (O) (O)
3 O O (O) (O)‐(X) (O)‐(X)
4 O (O) (X) X X
5 O (X) (X) X X
table 11: Relation durability classes and hazard classes.
Master Thesis G.P. Maas Comparison of quay wall designs with regard to the CO2‐emission and the Life Cycle Analysis 1227858
25
Explanation symbols used in table 11: O Natural durability is sufficient (O) Natural durability is in principle sufficient, but in some conditions it’s necessary to modify the
wood. (O)‐(X) Natural durability is sufficient, but wood specie, treatability and application determine if ` preservation of the wood is necessary. (X) Chemical preservation is advised, but for some applications natural durability can be
sufficient. X Chemical treatment is inevitable The durability of wood species depends on their chemical composition and density. In a salty environment the structure is affected by fungus and marine borers. Some wood species have a natural poison in their consistency, which repulses degradation. The three main components of wood are hemicellulose, cellulose and lignin. Hemicellulose is easy decomposable by micro organisms. Cellulose is more difficult to decompose and lignin is the hardest to be decomposed by micro organisms. Wood species with a high concentration of lignin in their cell walls are the most durable. [7.6] Furthermore some wood species have such a high density, due to silica grains in their heartwood, that marine borers can not affect them [7.7]. Important is to use the right material for the right application and design the details of the structure in such a way that the wood is used in its best way. Wood which is permanently in water is not exposed to oxygen, so fungus does not get a chance to develop. It is better to position structural elements not in the waterline, because than they are exposed to water and oxygen, creating good conditions for the development of fungus, which is unwanted. The Euromax quay wall has a life time of 50 years and a permanent exposure to a salty environment. In table 11 can be seen, that this quay wall must be constructed of wood that is allocated to durability class 1. Literature [7.8], [7.9] shows an overview of wood species that are suitable for hydraulic structures. Unfortunately no European softwood of durability class 1 is available. It can be concluded the natural properties of hardwood are much better for the application of a quay wall than softwood. Their strength properties are higher than softwood and the quay wall is subjected to heavy loads. Besides that, the chemical composition and density of hardwood is well capable of withstanding the environmental impacts. The natural properties of softwood are not capable of that. Recommended by literature and the TU Delft experts is, to use hardwood for the design of the quay wall, because of the properties needed for this application. Modification and preservation is possible, but it is not advisable. It can have a negative influence on the material properties. Besides that it is difficult to impregnate the large and robust elements that are needed for the quay wall thoroughly. [7.3], [7.4], [7.10]
7.2.2.3 Modification of wood
It is possible to make wood more durable with help of preserving and modification methods. These methods can improve certain properties of the wood. Different methods are available, for example thermal or chemical modification. In thermal modification wood is heated for a long time. This changes the chemical structure of the wood, so absorption of moisture becomes more difficult. By doing so the moisture content is limited and the material is less sensitive to fungus. Due to this process the material can become more brittle. During chemical modification these wood properties are changed with help of chemical treatments [7.11]. The main purpose of these modification treatments is to increase the resistance against organisms like bacteria, fungus and insects. The structural elements that will be used for the quay wall need to be very robust, which makes it more difficult to modify the wood, because it needs to be threatened

Master Thesis G.P. Maas Comparison of quay wall designs with regard to the CO2‐emission and the Life Cycle Analysis 1227858
26
thoroughly. Furthermore these modifications do not have a positive effect on the strength properties of the wood. For these reasons it is advised to avoid the use of European softwood for the construction of the quay wall [7.3], [7.4].
7.2.3 Sustainability
7.2.3.1 Responsible forestry FSC
When looking at the properties of the wood species only, it is better to use hardwood instead of softwood. But what about the irresponsible forest management? It is undesirable to construct a quay wall with wood that is coming from a badly managed forest. Forestry is considered sustainable when the ecosystem of the forest, with all its flora and fauna is being preserved on the long term. Although it is difficult, it is possible to make use of wood coming from a responsible managed forest. The Forest Stewardship Council is an organization that promotes responsible forest management worldwide. The FSC certification system is based on ten principles and criteria and is worldwide supported [7.12]:
1. Compliance with all applicable laws and international treaties. 2. Demonstrated and uncontested, clearly defined, long term land tenure and use rights. 3. Recognition and respect of indigenous peoples’ rights. 4. Maintenance or enhancement of long‐term social and economic well‐being of forest workers
and local communities and respect for workers rights in compliance with International Labor Organizations (ILO) conventions.
5. Equitable use and sharing of benefits derived from the forest. 6. Reduction of environmental impact of logging activities and maintenance of the ecological
functions and integrity of the forest. 7. Appropriate and continuously updated management plan. 8. Appropriate monitoring and assessment activities to assess the condition of the forest,
management activities and their social and environmental impacts. 9. Maintenance of High Conservation Value Forests (HCVFs) defined as environmental and
social values that are considered to be outstanding significance of critical importance. 10. In addition to compliance with all of the above, plantations must contribute to reduce the
pressures on and promote the restoration and conservation of natural forests. The FSC‐label is only given to products whose origin is known, with help of the chain‐of‐custody. The goal of chain‐of‐custody certification is to ensure that the FSC‐certified material can be traced through the whole production chain from forest to final product. Every company that takes FSC certified products in possession and wants to trade it with FSC claim to the next client , must have an FSC chain‐of‐custody certificate. Without the FSC chain‐of‐custody certificate the chain is interrupted and the product shall not obtain the FSC certificate. Companies and wood suppliers that commit to these ten principles can become FSC certified. Their wood is defined as sustainable. Note that FSC certified forests represent only the equivalent of 5% of the world’s productive forests. Therefore attention must be paid when choosing wood. But it is possible to make use of responsible wood.
7.2.3.2 Report Rijkswaterstaat: “Azobé anders?”
In 2005 Rijkswaterstaat analyzed the possibilities for the acquisition of durable produced wood specie Azobé or other equivalent lesser known wood species in Central Africa. Commissioned by Rijkswaterstaat a lot of tropical hardwood is used in structures. Only not all wood could be obtained
Master Thesis G.P. Maas Comparison of quay wall designs with regard to the CO2‐emission and the Life Cycle Analysis 1227858
27
through sustainable and responsible forestry. For this purpose they visited several wood suppliers and sawmills in the Republic of Congo (Brazzaville) and Cameroon. In the process to guaranteed provable and sustainable produced wood, three stages can be distinguished:
First stage: Wood is proven legal and the chain‐of‐custody is transparent and well documented. The chain‐of‐custody implies that delivered wood or a wood product can be traced back to the forest where it is originated in a provable way. This wood is legal, but there is no guarantee for sustainable forestry. When it is determined that a part of the forest gets another purpose, like agriculture, wood obtained from this is legal, but not sustainable.
Second stage: Wood is provable legal, the chain‐of‐custody is well documented and the forestry is on its way to a certificate for responsible and sustainable forestry. This implies that the forest operator attempts several steps towards sustainable forestry and that the company will be certified in a foreseeable time.
Final stage: The forestry and chain‐of‐custody are certified as being sustainable. Several problems with deforestation are present in Central Africa, due to the use of firewood and changing of the land use for agriculture. To solve these problems in Central Africa, the purchase of sustainable wood only is not sufficient. Solutions for sustainable energy sources, poverty reducing and sustainable agriculture must be developed. A lot of wood is logged with permission of a so called Vente de Coupe. This vente de coupe is a permit for a restricted size of land (circa 2500 ha) where a control plan is not needed. The vente de coupes are located in districts of which the government has determined to be a “non‐permanent forest”. These locations are mainly used for agricultural use. Main conclusion from the report is that there are several initiatives to produce wood in a sustainable way in a number of years. This turning point takes time. For Rijkswaterstaat it is important to support the development in responsible forestry, but also to keep the wood supply to the Netherlands continuous. When they make the ‘the level of sustainability’ for the suppliers to high, the risk is that they can not satisfy the rules and they stop developing towards sustainable forestry. On the other side, Rijkswaterstaat needs to make incentives, so it is import for companies to develop in a sustainable way [7.13].
7.2.3.3 Costs and application of sustainable wood
Certified sustainable wood is more expensive than ‘normal’ wood. These extra costs are based on the costs of the certification process. Next to that the costs are depending on the way wood suppliers have to change their way of forest management and harvesting. Information about these extra costs and the willingness to pay by constructors and consumers was obtained from an advisor of “Centrum Hout” [7.14]. It is a Dutch organization which promotes, advises and researches wood as a building material. The centre is financed by the timber branch. They state that the extra costs for FSC certified wood is varying from 10‐30%. For large tenders the difference between certified wood and normal wood will be smaller. Private consumers pay on average no extra costs for sustainable wood. Further more they state that the share of sustainably produced wood is already much higher than 5%. The organization for Dutch branch of wood suppliers, VVHN (Vereniging van Houtondernemingen in Nederland), has an average of 24% for hardwood. Governmental authorities are obliged to use a certain percentage of sustainably produced wood. In 2015 this will be 100% for all public works. For Rijkswaterstaat this is already valid and for local authorities it is 75% at the moment.
7.2.3.4 Wood supplier: “Wijma B.V.”
A number of Dutch wood suppliers trade FSC certified wood. After contacting several wood suppliers, Wijma was able to advise, which will be used as example for the Dutch wood suppliers. Wijma is a company in Kampen, the Netherlands. Before 2003, Wijma had problems with Greenpeace and the Ministry of Housing, Spatial planning and the Environment. They stated that Wijma bought wood

Master Thesis G.P. Maas Comparison of quay wall designs with regard to the CO2‐emission and the Life Cycle Analysis 1227858
28
from subcontractors that logged illegally [7.15]. Furthermore it was said that Wijma traded wood from vente de coupes of which they were not able to prove that it was obtained in a legal way. Wijma declared that they stopped with buying wood from third parties and only uses one single wood supplier. Since 2002 Wijma does not work with vente de coupes anymore and they progressed towards becoming a supplier of sustainable wood. In September 2006 they obtained the FSC certification. They have several employees in West Africa, who are trained to work careful and safe. Logging is done with the Reduced Impact Logging method (RIL). This means that on an average 1 of 2 trees per hectare are logged to limit the damage of the forest. The developing process of the forest goes as follows [7.16]:
1‐10 years: New seeds are spread in the forest and rejuvenation is starting. Pioneer species grow fast and fill up the gaps in the foliage, creating the necessary shadow for the growth of the other species.
20‐30 years: Pioneer trees do not live long. The trees which are growing in their shadow get a change to develop. The other mature trees give them enough shadow so they can continue to grow. At this stage the rainforest is the most divers.
20‐30 years: The pioneer species are gone and the secondary trees have closed the foliage so there is hardly any growth at the soil surface. After 30 years the forest is ready for some selective logging.
After logging the new openings in the forest give new trees the chance to develop and the whole cycle continues.
7.2.4 Wood specie
7.2.4.1 Hardwood versus softwood
Softwood grows almost just as slow as hardwood, so from that point of view there is no preference for softwood. As to the responsible forest management, it is possible to make use of ‘good’ wood. Note that it is difficult and the process towards sustainable forestry is complex and takes time, but it can be said that initiatives are there. The chemical and strength properties of hardwood are much more suitable for hydraulic structures than softwood. Obtaining sustainable hardwood is not easy, but if it is carefully selected, hardwood is the best type of wood for the construction of a quay wall.
7.2.4.2 Hardwood
It is decided that the quay wall will be constructed with hardwood. Many species are available and they are mostly coming from tropical rainforests. The only exception is Robinia Wood. The mostly used wood species for hydraulic structures will be discussed [7.5], [7.8], [7.9], [7.17] and [7.18].
Robinia: Robinia is a hardwood specie that is originally from north and Central America. In the 19th century it was planted in East Europe. Robinia grows fast and is ready for logging in 30‐35 years. The properties of Robinia are very durable and the production does not affect the tropical rainforests because it is growing in Europe. The disadvantage of this wood are the limited dimensions in which it is available. Elements up to 3 m are the maximum, which is rather small for a quay wall construction in the Euromax Terminal. Therfore, Robinia wood is unfortunately not appropriate [7.19].
Azobé: Azobé is very widely used in hydraulic structures. It is a tropical hardwood from West Africa with durable properties. Wood supplier Wijma trades Azobé in different dimensions. It is possible to obtain it FSC certified from them, to be sustainable wood as well. Elements up to circa 400 mm x 480 mm x 7.30 m or 600 mm x 600 mm x 10.0 m are available. Longer elements give difficulties with transportation and handling.
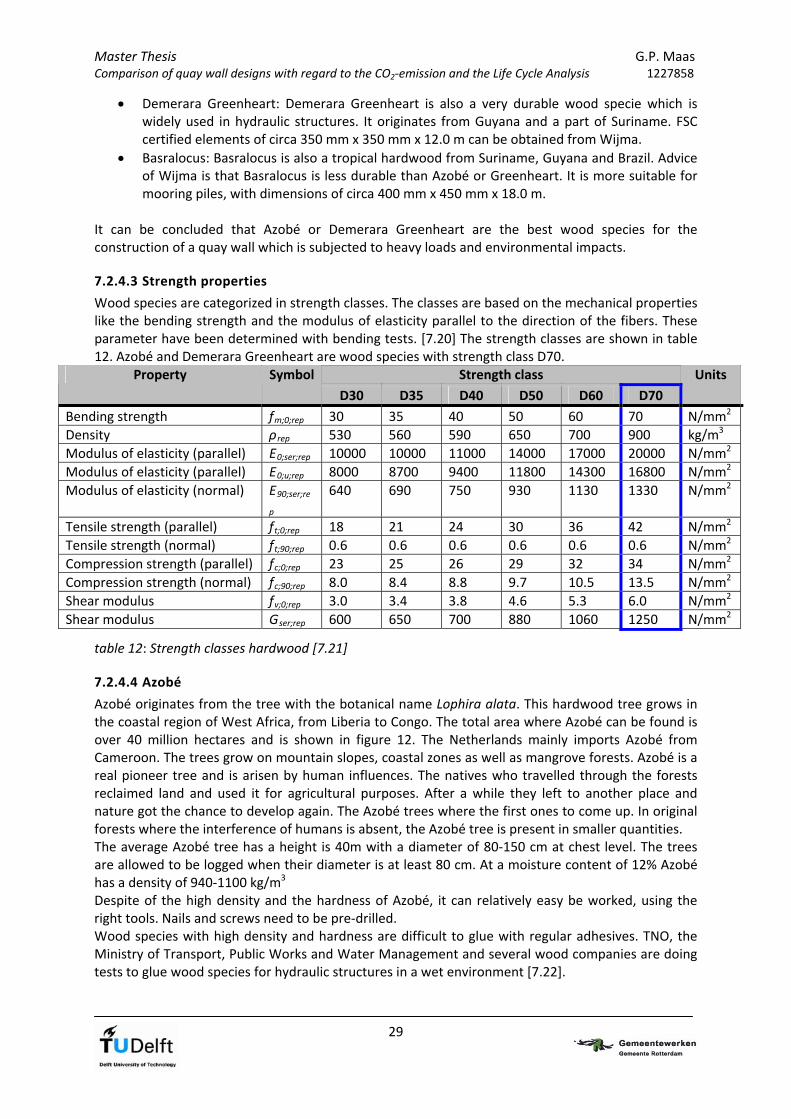
Master Thesis G.P. Maas Comparison of quay wall designs with regard to the CO2‐emission and the Life Cycle Analysis 1227858
29
Demerara Greenheart: Demerara Greenheart is also a very durable wood specie which is widely used in hydraulic structures. It originates from Guyana and a part of Suriname. FSC certified elements of circa 350 mm x 350 mm x 12.0 m can be obtained from Wijma.
Basralocus: Basralocus is also a tropical hardwood from Suriname, Guyana and Brazil. Advice of Wijma is that Basralocus is less durable than Azobé or Greenheart. It is more suitable for mooring piles, with dimensions of circa 400 mm x 450 mm x 18.0 m.
It can be concluded that Azobé or Demerara Greenheart are the best wood species for the construction of a quay wall which is subjected to heavy loads and environmental impacts.
7.2.4.3 Strength properties
Wood species are categorized in strength classes. The classes are based on the mechanical properties like the bending strength and the modulus of elasticity parallel to the direction of the fibers. These parameter have been determined with bending tests. [7.20] The strength classes are shown in table 12. Azobé and Demerara Greenheart are wood species with strength class D70.
Strength class Property Symbol
D30 D35 D40 D50 D60 D70
Units
Bending strength fm;0;rep 30 35 40 50 60 70 N/mm2
Density ρrep 530 560 590 650 700 900 kg/m3
Modulus of elasticity (parallel) E0;ser;rep 10000 10000 11000 14000 17000 20000 N/mm2
Modulus of elasticity (parallel) E0;u;rep 8000 8700 9400 11800 14300 16800 N/mm2
Modulus of elasticity (normal) E90;ser;re
p
640 690 750 930 1130 1330 N/mm2
Tensile strength (parallel) ft;0;rep 18 21 24 30 36 42 N/mm2
Tensile strength (normal) ft;90;rep 0.6 0.6 0.6 0.6 0.6 0.6 N/mm2
Compression strength (parallel) fc;0;rep 23 25 26 29 32 34 N/mm2
Compression strength (normal) fc;90;rep 8.0 8.4 8.8 9.7 10.5 13.5 N/mm2
Shear modulus fv;0;rep 3.0 3.4 3.8 4.6 5.3 6.0 N/mm2
Shear modulus Gser;rep 600 650 700 880 1060 1250 N/mm2
table 12: Strength classes hardwood [7.21]
7.2.4.4 Azobé
Azobé originates from the tree with the botanical name Lophira alata. This hardwood tree grows in the coastal region of West Africa, from Liberia to Congo. The total area where Azobé can be found is over 40 million hectares and is shown in figure 12. The Netherlands mainly imports Azobé from Cameroon. The trees grow on mountain slopes, coastal zones as well as mangrove forests. Azobé is a real pioneer tree and is arisen by human influences. The natives who travelled through the forests reclaimed land and used it for agricultural purposes. After a while they left to another place and nature got the chance to develop again. The Azobé trees where the first ones to come up. In original forests where the interference of humans is absent, the Azobé tree is present in smaller quantities. The average Azobé tree has a height is 40m with a diameter of 80‐150 cm at chest level. The trees are allowed to be logged when their diameter is at least 80 cm. At a moisture content of 12% Azobé has a density of 940‐1100 kg/m3 Despite of the high density and the hardness of Azobé, it can relatively easy be worked, using the right tools. Nails and screws need to be pre‐drilled. Wood species with high density and hardness are difficult to glue with regular adhesives. TNO, the Ministry of Transport, Public Works and Water Management and several wood companies are doing tests to glue wood species for hydraulic structures in a wet environment [7.22].

Master Thesis G.P. Maas Comparison of quay wall designs with regard to the CO2‐emission and the Life Cycle Analysis 1227858
figure 12: Growth area of Azobé, the dark blue areas are important for Dutch trading.
7.2.4.5 Demerara Greenheart
The botanical name of demerara greenheart is Chlorocardium rodiei and it grows in Guyana and a part of Suriname shown in figure 13. The average tree height is 21‐35 m, with a maximum of 40 m. The straight, cylindrical tree‐trunk without branches is 15‐25 m long and has a diameter of 0.4‐0.6 m, maximal 1.0 m. The density is circa 1020‐1200 kg/m3 at a moisture content of 12%. Due to the high density and hardness Demerara Greenheart is difficult to process. Nails and screws need to be pre‐drilled to avoid splitting. Demerara Greenheart is capable of withstanding fungus, termites and marine boorers, due to a natural chemical resistance of the material.
figure 13: Growth area of Demerara Greenheart in Suriname and Guyana
30
Master Thesis G.P. Maas Comparison of quay wall designs with regard to the CO2‐emission and the Life Cycle Analysis 1227858
31
7.2.4.6 Conclusion
It can be concluded that both Azobé and Demerara Greenheart are suitable wood species for the design of a quay wall in the Euromax Terminal. The workability of Azobé is somewhat easier. Furthermore the available dimensions of this wood species are larger than Demerara Greenheart. Both the experts of “Centrum Hout” and wood supplier Wijma advice to use Azobé, because of its durable properties and available dimensions. Therefore, is chosen to calculate the designs for the quay walls with Azobé as a building material.

Master Thesis G.P. Maas Comparison of quay wall designs with regard to the CO2‐emission and the Life Cycle Analysis 1227858
7.3 Design properties
7.3.1 Strength grading In the literature study the representative strength properties of strength class D70 were given. Furthermore, structural timber must be strength graded in order to ensure that its strength and stiffness properties are reliable and satisfactory for use. These characteristic strength values are the lower 5‐percentile of the population. Traditionally strength grading was done by visually selecting, taking into account strength reducing factors that could be actually seen, mainly knots and annual ring width. It was based on tradition and local experience. The introduction of machine grading circa 40 years ago improved the grading process. Most of the grading machines in use are the bending machines which determine the average bending modulus of elasticity. Azobé is classified as a wood in strength class D70 [7.23].
7.3.2 Moisture content
The mechanical properties of wood are dependent on its moisture content. An increase in moisture produces lower strength and elasticity values. When water penetrates the cell wall, it weakens the hydrogen bonds responsible for keeping the cell wall together. Moisture variations above the fibre saturation point have no effect on mechanical properties. Failure due to moisture effects in compression parallel to the grain in caused by fibre buckling. It is dependent on the hydrogen bonds that are sensitive to moisture. The tension strength depends on rupture of covalent bonds when the cell wall micro fibrils are torn apart. Failure in compression is more sensitive to moisture than failure due to tension [7.24].
7.3.3 Duration of load Another important factor which has a large influence on the strength properties of wood is the duration of the load. Timber experiences a significant loss of strength over a long period. The strength values to be used in design of timber members for long‐term permanent loads are approximately only 60% of the strength values found in a short‐term laboratory test. Since a large number of duration of load tests on structural wood have been carried out, most countries have included modification factors in their design codes. [7.24].
7.3.4 Modification factors
In timber design, the influence of moisture and duration of load is taken into consideration by assigning timber structures to hazard classes and actions to load duration classes. Euro Code 5 defines modification factors, kmod for each combination of the two classifications [7.24]. The design strength of wood is [7.25]:
m
kd
RkR
mod
With: Rk = characteristic value of strength property. kmod = modification factor that takes into account the influence of the time of loading and
the moisture content. γm = 1.3, material factor [7.26] The modification factor is dependent on the type of loading and the climate of the structure. With the help of table 13 this factor can be determined [7.25].
32

Master Thesis G.P. Maas Comparison of quay wall designs with regard to the CO2‐emission and the Life Cycle Analysis 1227858
Loading time classes Material Climate class Permanent Long Medium long Short Very short
> 10 years 0.5 yr – 10 yr 1 week – 0.5 yr < 1 week
1 0.5 0.5 0.65 0.8 1.1
2 0.5 0.5 0.65 0.8 1.1
Saw wood, glued, laminated 3 0.4 0.4 0.55 0.65 0.75
table 13: Modification factors
Climate class 1 is characterized by a moisture content in the materials which corresponds to a temperature of 20 °C and a relative humidity of the surrounding air which is only several weeks per year higher than 65%.
Climate class 2 is characterized by a moisture content in the materials which corresponds to a temperature of 20 °C and a relative humidity of the surrounding air which is only several weeks per year higher than 85%.
Climate class 3 is characterized by climatic conditions which induce higher moisture content in the materials than climate class 2.
The quay wall in the Euromax terminal is in table 13 classified as climate class 3. Furthermore, the modification factor kmod is dependent on the type of loading. Eurocode 5 states that when a load combination consists of loads which belong to different types of loading time classes, the modification factor kmod corresponding to the shortest loading time must be chosen. Therefore, the modification factor must be applied to the total load combinations. This means that different load combinations result in different modification factors. The load combination which includes just the permanent load must be checked for a kmod of 0.4. For a load combination which includes variables loads like the bollard and fender loads a different modification factor needs to be used. The bollard and fender loads correspond to loading time class “short”, so for this combination a kmod of 0.65 is valid. The design values of the strength parameters for permanent loads will be:
kk
d RR
R 31.03.1
40.0
For load combinations which include short term loads the design values of the strength parameter will be:
kk
d RR
R 50.03.1
65.0
7.3.5 Modulus of elasticity
For the calculation of the final displacements, the modulus of elasticity is reduced by a factor kdef which takes into account the creep deformation. The factor kdef can be found in table 3.2 of Eurocode 5. This creep reduction factor is valid over the average modulus of elasticity, since all members of the wooden wall work together as a whole. In case of single piles the 5% lower bound of the E‐modulus must be used, because all members must suffice individually.
)1(,def
meanfinmean k
EE
With: Emean = 20.000 N/mm2 Kdef = 2.0 for sawn wood in climate class 3.
33
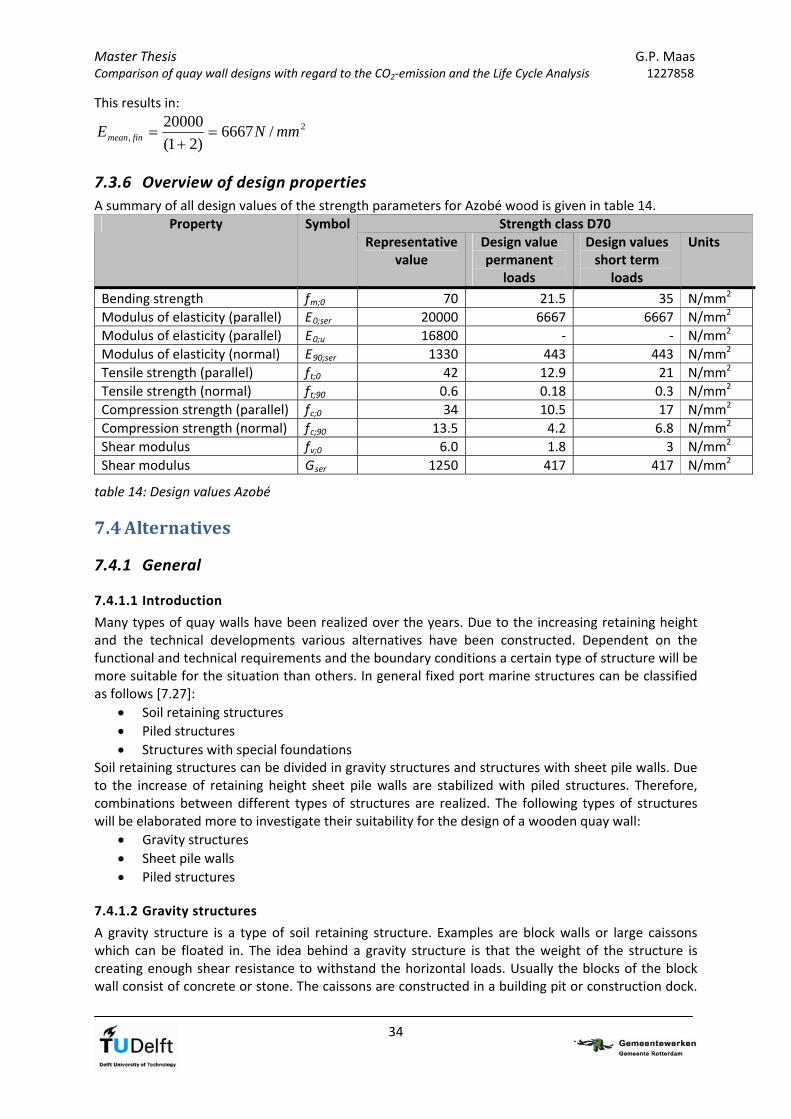
Master Thesis G.P. Maas Comparison of quay wall designs with regard to the CO2‐emission and the Life Cycle Analysis 1227858
This results in:
2, /6667
)21(
20000mmNE finmean
7.3.6 Overview of design properties
A summary of all design values of the strength parameters for Azobé wood is given in table 14. Strength class D70 Property Symbol
Representative value
Design value permanent
loads
Design values short term
loads
Units
Bending strength fm;0 70 21.5 35 N/mm2
Modulus of elasticity (parallel) E0;ser 20000 6667 6667 N/mm2
Modulus of elasticity (parallel) E0;u 16800 ‐ ‐ N/mm2
Modulus of elasticity (normal) E90;ser 1330 443 443 N/mm2
Tensile strength (parallel) ft;0 42 12.9 21 N/mm2
Tensile strength (normal) ft;90 0.6 0.18 0.3 N/mm2
Compression strength (parallel) fc;0 34 10.5 17 N/mm2
Compression strength (normal) fc;90 13.5 4.2 6.8 N/mm2
Shear modulus fv;0 6.0 1.8 3 N/mm2
Shear modulus Gser 1250 417 417 N/mm2
table 14: Design values Azobé
7.4 Alternatives
7.4.1 General
7.4.1.1 Introduction
Many types of quay walls have been realized over the years. Due to the increasing retaining height and the technical developments various alternatives have been constructed. Dependent on the functional and technical requirements and the boundary conditions a certain type of structure will be more suitable for the situation than others. In general fixed port marine structures can be classified as follows [7.27]:
Soil retaining structures
Piled structures
Structures with special foundations Soil retaining structures can be divided in gravity structures and structures with sheet pile walls. Due to the increase of retaining height sheet pile walls are stabilized with piled structures. Therefore, combinations between different types of structures are realized. The following types of structures will be elaborated more to investigate their suitability for the design of a wooden quay wall:
Gravity structures
Sheet pile walls
Piled structures
7.4.1.2 Gravity structures
A gravity structure is a type of soil retaining structure. Examples are block walls or large caissons which can be floated in. The idea behind a gravity structure is that the weight of the structure is creating enough shear resistance to withstand the horizontal loads. Usually the blocks of the block wall consist of concrete or stone. The caissons are constructed in a building pit or construction dock.
34
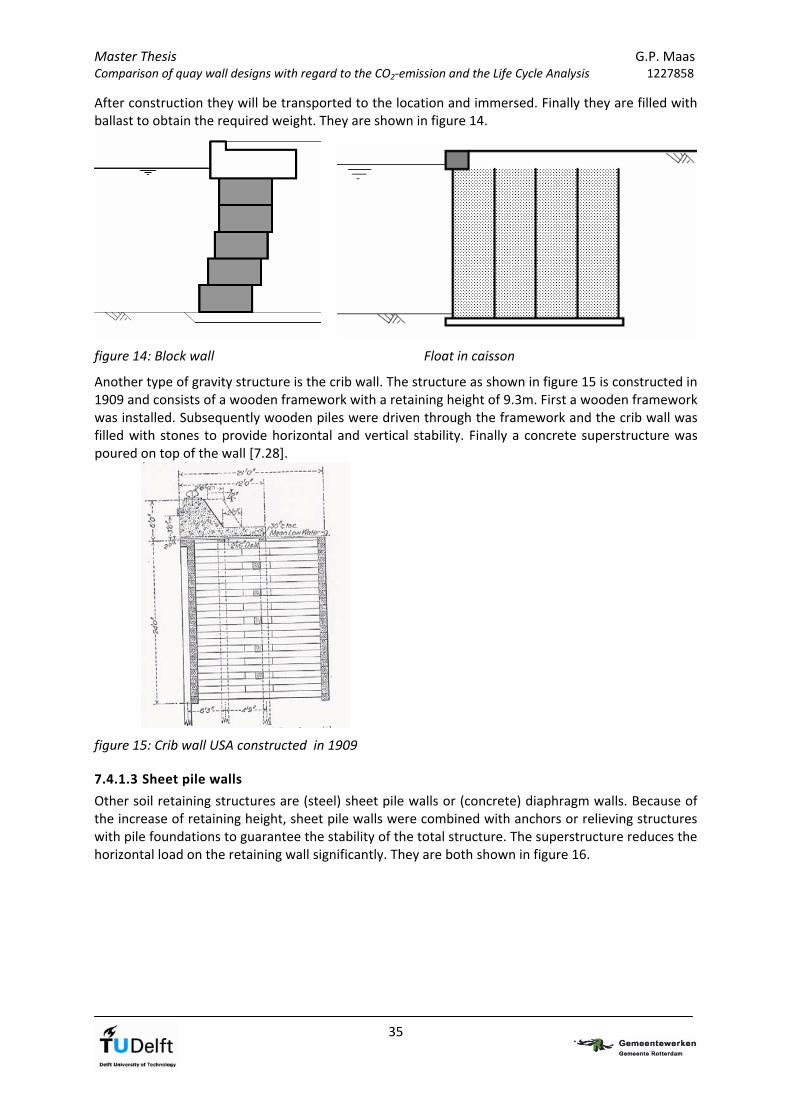
Master Thesis G.P. Maas Comparison of quay wall designs with regard to the CO2‐emission and the Life Cycle Analysis 1227858
After construction they will be transported to the location and immersed. Finally they are filled with ballast to obtain the required weight. They are shown in figure 14.
figure 14: Block wall Float in caisson
Another type of gravity structure is the crib wall. The structure as shown in figure 15 is constructed in 1909 and consists of a wooden framework with a retaining height of 9.3m. First a wooden framework was installed. Subsequently wooden piles were driven through the framework and the crib wall was filled with stones to provide horizontal and vertical stability. Finally a concrete superstructure was poured on top of the wall [7.28].
figure 15: Crib wall USA constructed in 1909
7.4.1.3 Sheet pile walls
Other soil retaining structures are (steel) sheet pile walls or (concrete) diaphragm walls. Because of the increase of retaining height, sheet pile walls were combined with anchors or relieving structures with pile foundations to guarantee the stability of the total structure. The superstructure reduces the horizontal load on the retaining wall significantly. They are both shown in figure 16.
35
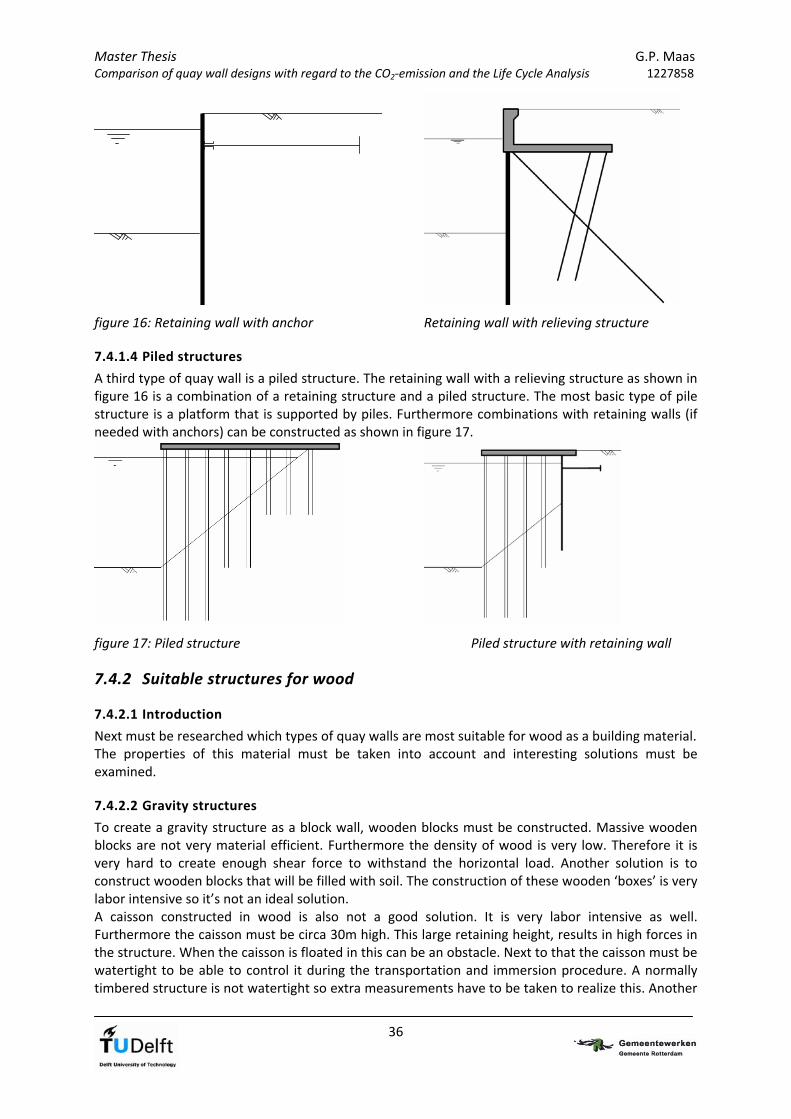
Master Thesis G.P. Maas Comparison of quay wall designs with regard to the CO2‐emission and the Life Cycle Analysis 1227858
figure 16: Retaining wall with anchor Retaining wall with relieving structure
7.4.1.4 Piled structures
A third type of quay wall is a piled structure. The retaining wall with a relieving structure as shown in figure 16 is a combination of a retaining structure and a piled structure. The most basic type of pile structure is a platform that is supported by piles. Furthermore combinations with retaining walls (if needed with anchors) can be constructed as shown in figure 17.
figure 17: Piled structure Piled structure with retaining wall
7.4.2 Suitable structures for wood
7.4.2.1 Introduction
Next must be researched which types of quay walls are most suitable for wood as a building material. The properties of this material must be taken into account and interesting solutions must be examined.
7.4.2.2 Gravity structures
To create a gravity structure as a block wall, wooden blocks must be constructed. Massive wooden blocks are not very material efficient. Furthermore the density of wood is very low. Therefore it is very hard to create enough shear force to withstand the horizontal load. Another solution is to construct wooden blocks that will be filled with soil. The construction of these wooden ‘boxes’ is very labor intensive so it’s not an ideal solution. A caisson constructed in wood is also not a good solution. It is very labor intensive as well. Furthermore the caisson must be circa 30m high. This large retaining height, results in high forces in the structure. When the caisson is floated in this can be an obstacle. Next to that the caisson must be watertight to be able to control it during the transportation and immersion procedure. A normally timbered structure is not watertight so extra measurements have to be taken to realize this. Another
36

Master Thesis G.P. Maas Comparison of quay wall designs with regard to the CO2‐emission and the Life Cycle Analysis 1227858
37
way to construct a caisson is in an open building pit. In this way a crib wall can be constructed like was done in figure 15. The main disadvantage is that the building pit must be circa 30m deep.
7.4.2.3 Sheet pile walls
The quay wall in the Euromax terminal is constructed with a diaphragm wall. A quay wall created with a wooden wall is not very obvious solution, but in this case it would be very interesting to investigate it possibilities. The superstructure with its anchors and compression piles can be used as a basis for the design. It must be studied if the forces in the structure result in realistic dimensions. Furthermore the constructability is of great importance, because the dimensions of wooden elements are limited and they can not be constructed in the same way as a concrete diaphragm wall.
7.4.2.4 Piled structures
A piled structure results in a jetty type of structure. This type of structure is very suitable for a building material like wood. It has been applied widely in various ways. Unfortunately in hydraulic structures the retaining height of wooden jetties is usually limited. When is looked at structures outside hydraulic engineering, very large structures for wooden roller coasters have been realized. Inspired by these the possibilities for the design of a wooden jetty are worth to investigate.
7.4.2.5 Conclusion
Concluded can be that two types of structures will be investigated further, because they are the most suitable for wood as a building material and the most interesting to study. First of all a wooden wall with a relieving structure as is realized in the Euromax terminal will be elaborated. Secondly, a jetty structure will be designed, since this construction technique is still widely used for building with wood nowadays. A crib wall like has been constructed up to the beginning of the 20th century can be a solution too, but because the retaining height for the Euromax terminal is much higher, it will not be investigated furthermore. The wooden wall and the jetty seem more interesting solutions for now.

Master Thesis G.P. Maas Comparison of quay wall designs with regard to the CO2‐emission and the Life Cycle Analysis 1227858
7.4.3 Wooden wall
7.4.3.1 Overview of structure
One way to construct a quay wall is to make use of a robust wall that is composed out of several wooden elements. For this large retaining height a normal wooden sheet pile wall is not strong and stiff enough, therefore this is not an option. When connecting wooden elements a wall of any desired dimension can be created, comparable to the principle of laminating. It means that, for this structure the diaphragm wall of the original design shall be replaced by wooden elements. The relieving structure decreases the forces that have to be retained by the diaphragm/wooden wall. An overview of the structure is shown in figure 18.
figure 18: Quay wall with wooden wall and relieving structure.
7.4.3.2 First rough estimation
The concrete diaphragm wall which is constructed for the quay wall in the Euromax terminal has a thickness of 1200mm. For a first rough estimation for the thickness of the wooden diaphragm wall a comparison between the bending stiffness EI has been done. In design reports of the Euromax quay wall several values have been found:
Stiffness EI = 1.868 x 10⁶ kNm2/m [7.29] E = 10800 N/mm2/m.
Stiffness EI = 3.63 x 10⁶ kNm2/m [7.30] E = 21000 N/mm2/m. Azobé wood has two different moduli of elasticity, because wood in general is an anisotropic material. Dependent on the orientation to the grain, the design values are:
Parallel to the grain: E0; mean,fin= 6667 N/mm2
Normal to the grain: E90;mean,fin = 443 N/mm2 Because the material is much stiffer in the direction parallel to the grain, the wooden wall will be designed in such a way that the material will only be subjected to bending parallel to the grain. In this way the properties of the material are used in its best way. Comparing the bending stiffness that have been found in the reports [7.29],[7.30], with the modulus of elasticity of Azobé, a required moment of inertia can be found, resulting in a wall thickness.
38

Master Thesis G.P. Maas Comparison of quay wall designs with regard to the CO2‐emission and the Life Cycle Analysis 1227858
The wooden wall will be composed of several members connected to each other. The way the connection between these elements is realised is very important for the effective moment of inertia of the wooden wall. In principle this can be done in two ways. The first way is to glue the elements together to obtain one monolithic construction member. Unfortunately it is difficult to glue hardwood members, especially in a wet environment. The bond ability of wood is affected by the surface properties and the physical properties of the wood. Density, porosity and moisture content are important parameters in this matter. High‐density woods, like Azobé are difficult to bond, because they have a thicker cell wall and less lumen volume. Therefore, adhesives are not able to penetrate easily. Important mechanical interlocking of the adhesive is limited to one or two cells deep. Furthermore the amount of moisture in wood in combination with water in the adhesive can lead to difficulties in wood bonding [7.31]. The second option is to connect the wooden members using mechanical joints, like bolds or dowels. This will probably be the most realistic solution, but unfortunately these connections are not able to transmit all the shear forces. This loss is significant, therefore the decrease in the effective moment of inertia must be taken into account. Assumed is that the effective stiffness will be 70% of the total bending stiffness. With help of the bending stiffness of the concrete diaphragm wall, an estimation of the necessary wall thickness in wood can be done:
For the first stiffness EI = 1.868 x 10⁶ kNm2/m: EIconcrete = EIwood
46
6
280.010667.6
10868.1m
E
EII
wood
concretewood
With 3
12
17.0 hbI wood , and b = 1000 mm, this results in a thickness of circa 1700 mm.
The same can be done for the other value of EI = 3.63 x 10⁶ kNm2/m. This results in a thickness of circa 2100 m.
It can be concluded that at first sight it is possible to construct a wooden wall provided that the material is only subjected to bending parallel to the fibers of the wood. Unfortunately it was difficult to find where the values of the EI were based on in the available parts of the reports about the Euromax quay wall. Several reports use different values for loads and different load combinations. For this reason a new calculation for the structure with a wooden wall shall be made, knowing that the first rough calculation gives feasible dimensions. The loads and the normative load combinations will be determined, which makes the calculation more transparent.
7.4.3.3 Model
The structure will be studied per running meter. In the literature study a description of the structure can be found. Here a summary of the way it is modelled is given:
Floor relieving structure: 16,0 m x 1.5 m.
Wall relieving structure: 2,5 m x 7.0 m.
Mv‐piles: depth of 36.0 m, 1:1, the properties of the piles are divided by the c.t.c distance. Lsys = 5,6m.
Vibro‐piles: depth of 28.5 m, 1:3, 2 rows of piles are modelled as 1. The properties of the piles are divided by the 0.5 times the c.t.c distance of 2.8 m (because of the 2 rows). Lsys = 1.4.
Water levels: Most unfavourable combination of water levels for the wooden wall will be a high ground water level in combination with a low sea water level. This results in a ground water level of NAP +0.52 m and a sea water level of NAP ‐1.38 m.
39

Master Thesis G.P. Maas Comparison of quay wall designs with regard to the CO2‐emission and the Life Cycle Analysis 1227858
Appendix C.2 shows an overview of the properties of the piles which are used in the model.
figure 19: Model of structure
The connections to the superstructure are modelled as hinges as shown in figure 19. The supports of the piles and the diaphragm wall are hinges as well. The thickness of the diaphragm wall is 1700 mm.
7.4.3.4 Loads acting on structure
Several loads are acting on the structure. They have been determined from the list of requirements for the Euromax quay wall. The loads acting on the quay wall are:
1. Dead load of the structure 2. Soil and water pressure 3. Field loads above relieving floor 4. Field loads behind relieving floor 5. Crane load vertical in operation 6. Crane load horizontal in operation 7. Crane load vertical in storm 8. Crane load horizontal in storm 9. Bollard loads 10. Fender loads 11. Accidental loads: 2 x fender load
In appendix C.3 the loads are more elaborated. An overview of the magnitudes and the way the loads act on the structure is given. Also the horizontal and vertical reactions of the loads on the members of the structure are calculated for each load. Furthermore the anchor force and the related extra normal force in the wooden wall are determined.
40

Master Thesis G.P. Maas Comparison of quay wall designs with regard to the CO2‐emission and the Life Cycle Analysis 1227858
7.4.3.5 Stress calculation
To calculate the maximum bending moment and deformations in the wooden wall, the normative load combinations have to be determined. The stresses in the wooden wall shall be calculated with the combination of bending moment and normal force.
W
M ddm , and
A
Nddc ,
With: Md = design moment in diaphragm wall
W = elastic section modulus, which for a rectangular cross section is 2
6
1hbW
Nd = design normal force in diaphragm wall A = cross section of diaphragm wall The wooden wall is calculated per meter and can be modeled as a slender column which is loaded axially and has a tendency to deflect sideways. The strength of a slender member depends on the strength of the material, which is determined in paragraph 7.3 but also on its stiffness. There are two principle ways to design a compression member. The first involves a second order analysis where the equilibrium of moment and forces is calculated by considering the deformed shape wooden wall. The second approach uses buckling curves to account for the decrease in strength of a real column compared to a compression member which is infinitely stiff in bending. The Eurocode 5 chapter 6 determines the stability design as a compression design with a modified compression strength. The decrease in load‐bearing capacity depends on the slenderness ratio of the member [7.32]. This slenderness is a ratio between the buckling length and the radius of gyration:
y
bucy i
l
With: lbuc = buckling length
iy = )12/1(7.0)12/1(7.07.0 3
h
hb
hb
A
I y
And the relative slenderness becomes:
05,0
,0,, E
f kcyyrel
For columns with a relative low slenderness, 3.0, yrel and 3.0, zrel , the combination of
bending and compression stresses should satisfy the following conditions:
1,,
,,
,,
,,
2
,0,
,0.
dzm
dzmm
dym
dym
dc
dc
fk
ff
With: dc ,0, = design value of the occurring normal compression stress in the wooden wall
parallel to the grain
= design value of the maximum allowable compression stress dcf ,0,
dym ,, = design value of the occurring stress due to bending moment around the y‐
axis
= design value of the maximum allowable bending stress around the y‐axis dymf ,,
The stresses due to bending moment around the z‐axis are negligible, therefore the unity check becomes:
41

Master Thesis G.P. Maas Comparison of quay wall designs with regard to the CO2‐emission and the Life Cycle Analysis 1227858
1,,
,,
2
,0,
,0.
dym
dym
dc
dc
ff
(1)
In all other cases, where 3.0, yrel the stresses should satisfy the following conditions:
1,,
,,
,0.,
,0, dym
dym
dcyc
dc
ffk
(2)
Where kc,y takes into account the decrease in load bearing capacity due to the slenderness of the wooden wall. In the above equations can be seen that the slenderness in y‐direction is not depending on the width of the column (in this case the infinite long wall). Determined must be which of the stress unity checks for combined normal force and bending
moment is valid in this case. The criteria is 3.0, yrel :
3.005,0
,0,,
E
f kcyyrel
This results in an upper boundary for the slenderness:
6.1416800/70
3.0
y
With the buckling length and the radius of gyration, the upper boundary for the thickness of the wooden wall can be found:
6.14)12/1(7.0
25000
hi
lbucy
Approximately . Rough estimations show that the thickness of the wooden wall probably will be less than 7000 mm, therefore the stresses in the material must satisfy equation (2).
mmh 7000
7.4.3.6 Load combinations
To find the normative stresses in the wooden wall, the combination of the maximum occurring bending moment and normal force must be found. Furthermore, the maximum bending stress and compressive stress shall be calculated. The combination of these stresses must satisfy the unity check based on the design values of the maximum allowable stresses for Azobé, which are dependent on the duration of the load combination. Therefore four load combinations have been studied:
Combination 1: Permanent loads.
Combination 2: Resulting in the maximum normal force in the wooden wall with the corresponding horizontal force.
Combination 3: Load combination which creates the maximum horizontal force, with the corresponding normal force. A larger horizontal force results in larger bending moments in the wooden wall, but the normal forces are less in this combination. Dependent on the combination of bending and compression stress either combination 2 or combination 3 will be the normative combination that includes variable loads.
Combination 4: Accidental load.
42

Master Thesis G.P. Maas Comparison of quay wall designs with regard to the CO2‐emission and the Life Cycle Analysis 1227858
These combinations have been composed with help of load factors and combination factors summarized in table 15 [7.33].
Permanent loads Gd Variable loads Qd Type of combination Unfavorable Favorable Leading
variable load Other simultaneously occurring variable
loads
Accidental loads Fa;d
Fundamental 1.15 x Grep max 0.95 x G rep min 1.3 x Q1;d 1.3 x 0.7 x Qj;rep ‐
Accidental 1.0 x Grep max 1.0 x Grep min 1.0 x 0.6 x Q1;rep
1.0 x 0.5 x Qj;rep Fa;rep
table 15: Design values for loads in combinations of loads in the serviceability limit state
Combination 1: This combination consists of all permanent loads acting on the quay wall and is shown in table 16.
Load factor combination
Loads diaphragm wall floor γ factor Ψ0 diaphragm wall Floor
1. Dead load superstructure ‐500 124 1,15 1 ‐575 142,6
2. Soil and water pressure ‐301 251 1,15 1 ‐346,15 288,65
3. Field loads above structure ‐190 138 0 0
4a. Field loads behind structure ‐47 0 0 0
4b. Field loads behind structure ‐11 0 0 0
5. Crane load vertical operation ‐1500 0 0 0
6. Crane load horizontal operation <‐‐ ‐84 ‐9 0
7. Crane load vertical storm ‐1050 0 0 0
8. Crane load horizontal storm <‐‐ ‐321 ‐34 0 0
9. Fender load ‐‐> 448 31 0 0
10. Bollard load <‐‐ ‐472 ‐50 0 0
11. Accidental load ‐‐> 896 62 0 0
12. Dead load diaphragm wall ‐54 0 1,15 1 ‐62,1 0
13. Anchor force ‐574 0 1,15 1 ‐660,1 0
Total ‐1643,35 431,25
Normal force [kN/m] total contribution [kN/m]
0
table 16: Combination 1: Maximum normal force in diaphragm wall.
The horizontal force is modelled in MSheet. Subsequently the bending moments in the wooden wall can be determined. In combination with the normal force, the maximum bending stress and compression stress can be calculated, resulting in a combined unity check. The maximum allowable stresses are determined with the modification factor for permanent loads, resulting in low stresses. Combination 2: The maximum stresses in the wooden wall are dependent on the normal force and the bending moment. This load combination represents the maximum normal force in the wooden wall and is shown in table 17.
Load factor combination
Loads diaphragm wall floor γ factor Ψ0 diaphragm wall Floor
1. Dead load superstructure ‐500 124 1,15 1 ‐575 142,6
2. Soil and water pressure ‐301 251 1,15 1 ‐346,15 288,65
3. Field loads above structure ‐190 138 1,3 0,7 ‐172,9 125,58
4a. Field loads behind structure ‐47 0 1,3 0,7 ‐47 0
4b. Field loads behind structure ‐11 0 1,3 0,7 ‐11 0
5. Crane load vertical operation ‐1500 0 1,3 1 ‐1950 0
6. Crane load horizontal operation <‐‐ ‐84 ‐9 1,3 0,7 ‐76,44 ‐8,19
7. Crane load vertical storm ‐1050 0 0 0
8. Crane load horizontal storm <‐‐ ‐321 ‐34 0 0
9. Fender load ‐‐> 448 31 0 0
10. Bollard load <‐‐ ‐472 ‐50 1,3 0,7 ‐429,52 ‐45,5
11. Accidental load ‐‐> 896 62 0 0
12. Dead load diaphragm wall ‐54 0 1,15 1 ‐62,1 0
13. Anchor force ‐574 0 1,15 1 ‐660,1 0
Total ‐4330,21 503,14
Normal force [kN/m] total contribution [kN/m]
43
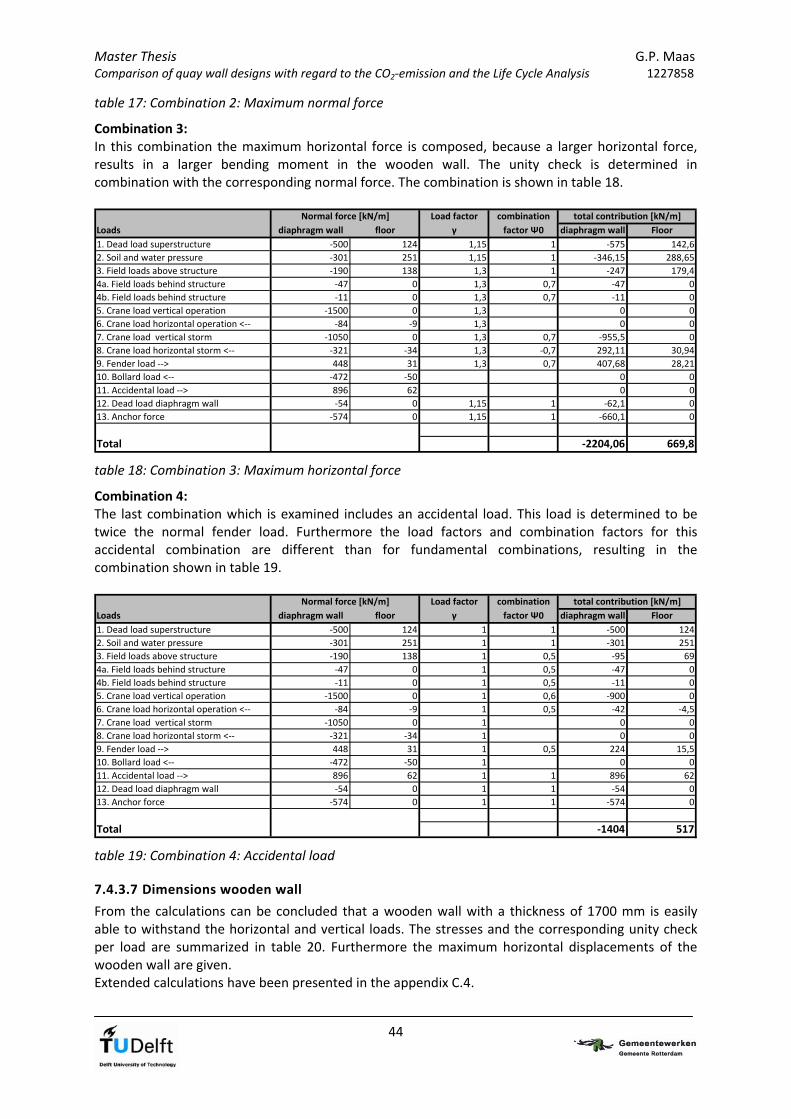
Master Thesis G.P. Maas Comparison of quay wall designs with regard to the CO2‐emission and the Life Cycle Analysis 1227858
table 17: Combination 2: Maximum normal force
Combination 3: In this combination the maximum horizontal force is composed, because a larger horizontal force, results in a larger bending moment in the wooden wall. The unity check is determined in combination with the corresponding normal force. The combination is shown in table 18.
Load factor combination
Loads diaphragm wall floor γ factor Ψ0 diaphragm wall Floor
1. Dead load superstructure ‐500 124 1,15 1 ‐575 142,6
2. Soil and water pressure ‐301 251 1,15 1 ‐346,15 288,65
3. Field loads above structure ‐190 138 1,3 1 ‐247 179,4
4a. Field loads behind structure ‐47 0 1,3 0,7 ‐47 0
4b. Field loads behind structure ‐11 0 1,3 0,7 ‐11 0
5. Crane load vertical operation ‐1500 0 1,3 0 0
6. Crane load horizontal operation <‐‐ ‐84 ‐9 1,3 0
7. Crane load vertical storm ‐1050 0 1,3 0,7 ‐955,5 0
8. Crane load horizontal storm <‐‐ ‐321 ‐34 1,3 ‐0,7 292,11 30,94
9. Fender load ‐‐> 448 31 1,3 0,7 407,68 28,21
10. Bollard load <‐‐ ‐472 ‐50 0 0
11. Accidental load ‐‐> 896 62 0
12. Dead load diaphragm wall ‐54 0 1,15 1 ‐62,1 0
13. Anchor force ‐574 0 1,15 1 ‐660,1 0
Total ‐2204,06 669,8
Normal force [kN/m] total contribution [kN/m]
0
0
table 18: Combination 3: Maximum horizontal force
Combination 4: The last combination which is examined includes an accidental load. This load is determined to be twice the normal fender load. Furthermore the load factors and combination factors for this accidental combination are different than for fundamental combinations, resulting in the combination shown in table 19.
Load factor combination
Loads diaphragm wall floor γ factor Ψ0 diaphragm wall Floor
1. Dead load superstructure ‐500 124 1 1 ‐500 124
2. Soil and water pressure ‐301 251 1 1 ‐301 251
3. Field loads above structure ‐190 138 1 0,5 ‐95 69
4a. Field loads behind structure ‐47 0 1 0,5 ‐47 0
4b. Field loads behind structure ‐11 0 1 0,5 ‐11 0
5. Crane load vertical operation ‐1500 0 1 0,6 ‐900 0
6. Crane load horizontal operation <‐‐ ‐84 ‐9 1 0,5 ‐42 ‐4,5
7. Crane load vertical storm ‐1050 0 1 0 0
8. Crane load horizontal storm <‐‐ ‐321 ‐34 1 0 0
9. Fender load ‐‐> 448 31 1 0,5 224 15,5
10. Bollard load <‐‐ ‐472 ‐50 1 0 0
11. Accidental load ‐‐> 896 62 1 1 896 62
12. Dead load diaphragm wall ‐54 0 1 1 ‐54 0
13. Anchor force ‐574 0 1 1 ‐574 0
Total ‐1404 517
Normal force [kN/m] total contribution [kN/m]
table 19: Combination 4: Accidental load
7.4.3.7 Dimensions wooden wall
From the calculations can be concluded that a wooden wall with a thickness of 1700 mm is easily able to withstand the horizontal and vertical loads. The stresses and the corresponding unity check per load are summarized in table 20. Furthermore the maximum horizontal displacements of the wooden wall are given. Extended calculations have been presented in the appendix C.4.
44

Master Thesis G.P. Maas Comparison of quay wall designs with regard to the CO2‐emission and the Life Cycle Analysis 1227858
Combi Max displacement
Stress [N/mm2]
Compression stress
Bending stress
UC compression
UC bending
UC total
Occurring 1.0 8.6 1 180 mm
Allowable 6.1 21.5 0.16 0.40 0.56
Occurring 2.55 10.1 2 215 mm
Allowable 9.9 35.0 0.26 0.29 0.55
Occurring 1.30 10.2 3 212 mm
Allowable 9.9 35.0 0.13 0.29 0.42
Occurring 0.83 9.4 4 197 mm
allowable 9.9 35.0 0.08 0.27 0.35
table 20: Unity checks of stresses in wooden wall 1700 mm.
The unity checks in table 20 show that the combination with the permanent loads result in the maximum unity check of 0.56. This value is low compared to the maximum unity check of 1.0, which means that the wooden wall can be less than 1700 mm. Iterations show that a wooden wall of 1400 mm is sufficient. In Appendix C.5 these calculations have elaborated. A summary of the unity checks is given in table 21.
Combi Max displacement
Stress [N/mm2]
Compression stress
Bending stress
UC compression
UC bending
UC total
Occurring 1.15 12.1 1 290 mm
Allowable 4.5 21.5 0.26 0.56 0.82
Occurring 3.07 14.33 2 356 mm
Allowable 7.3 35.0 0.42 0.41 0.83
Occurring 1.56 14.34 3 350 mm
Allowable 7.3 35.0 0.21 0.41 0.62
Occurring 0.97 13.26 4 323 mm
Allowable 7.3 35.0 0.13 0.38 0.51
table 21: Unity checks of stresses in wooden wall 1400 mm.
7.4.3.8 Bearing capacity of wooden wall
Important is to check if the bearing capacity of the wooden wall is sufficient to withstand the normal force. The maximum normal force due to the normative load combination 3 for a wall thickness of 1400 mm is: Fd = 4300 kN/m. The bearing capacity of the diaphragm wall will be calculated according NEN6743 “Foundation on piles” [7.34]. The bearing capacity is a combination between the bearing capacity of the tip of the wooden wall and the shaft friction:
shaftrtiprr FFF ;max;;max;;max
The design value is:
45
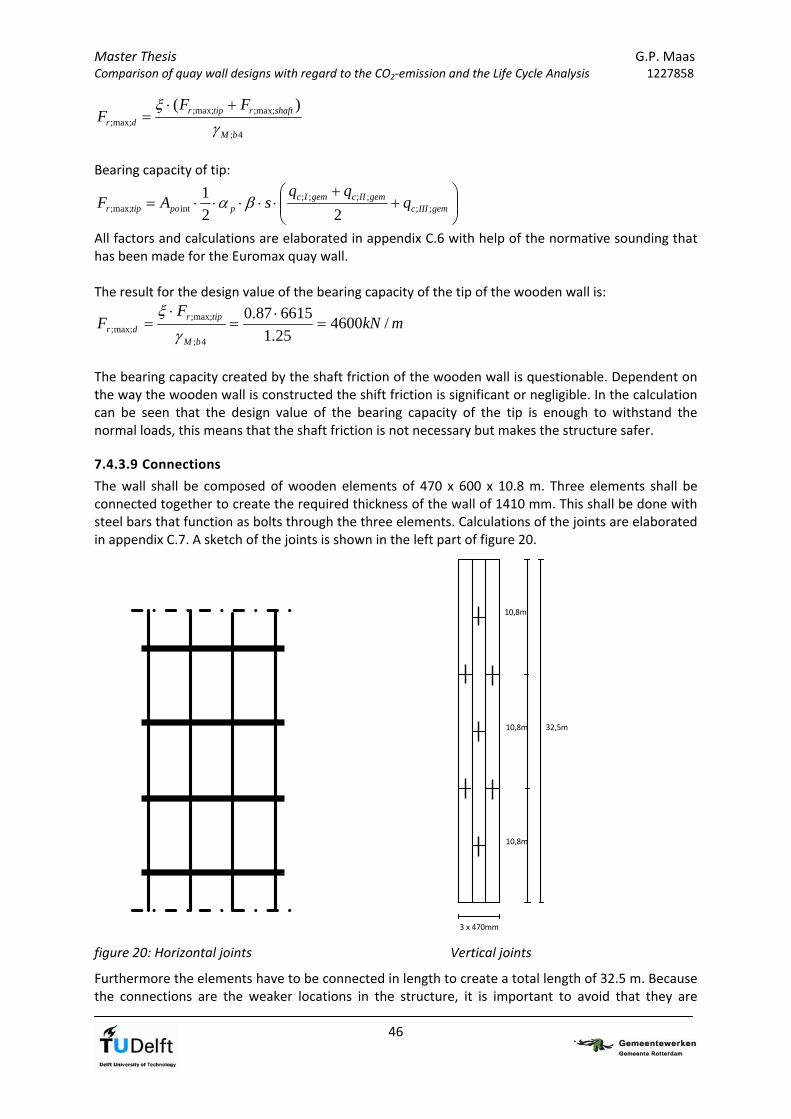
Master Thesis G.P. Maas Comparison of quay wall designs with regard to the CO2‐emission and the Life Cycle Analysis 1227858
4;
max;;max;;max;;
)(
bM
shaftrtiprdr
FFF
Bearing capacity of tip:
gemIIIc
gemIIcgemIcppotipr q
qqsAF ;;
;;;;intmax;; 22
1
All factors and calculations are elaborated in appendix C.6 with help of the normative sounding that has been made for the Euromax quay wall. The result for the design value of the bearing capacity of the tip of the wooden wall is:
mkNF
FbM
tiprdr /4600
25.1
661587.0
4;
max;;max;;
The bearing capacity created by the shaft friction of the wooden wall is questionable. Dependent on the way the wooden wall is constructed the shift friction is significant or negligible. In the calculation can be seen that the design value of the bearing capacity of the tip is enough to withstand the normal loads, this means that the shaft friction is not necessary but makes the structure safer.
7.4.3.9 Connections
The wall shall be composed of wooden elements of 470 x 600 x 10.8 m. Three elements shall be connected together to create the required thickness of the wall of 1410 mm. This shall be done with steel bars that function as bolts through the three elements. Calculations of the joints are elaborated in appendix C.7. A sketch of the joints is shown in the left part of figure 20.
32,5m
10,8m
10,8m
10,8m
3 x 470mm
figure 20: Horizontal joints Vertical joints
Furthermore the elements have to be connected in length to create a total length of 32.5 m. Because the connections are the weaker locations in the structure, it is important to avoid that they are
46

Master Thesis G.P. Maas Comparison of quay wall designs with regard to the CO2‐emission and the Life Cycle Analysis 1227858
47
concentrated in one location. One way to solve this problem is to shift the elements with respect to each other as shown in the right part of figure 20. In vertical way the piles shall be connected with a steel plate that is inserted in grooves that are made in the piles. Pens can be used as fasteners through the plates and the piles, connecting the two piles together in vertical way. To guarantee the quality of the connections it is better to realise the biggest part of the joints on another location than the building site. The length of the total wall is large, but it is still possible to transport 32 m by road or sea. In this way the segments of 1410 mm x 600 mm x 32.5 m can be constructed by the wood supplier and transported to the building site. At the building site the segments can be lowered in the trench, as described in paragraph 7.4.3.10.
7.4.3.10 Constructability
Since the required dimensions of the quay wall are known the constructability will be studied. The wooden wall must have a thickness of 1400 mm and a length of 32. 5m (NAP ‐1.5 m to NAP ‐34.0 m). The traditional way of constructing a concrete diaphragm wall shall be the first starting point for the realization of the wooden wall. The construction of a concrete diaphragm wall is done in several steps:
First soil is excavated creating a trench in the shape of the future diaphragm wall. This is done in segments of circa 7 m.
To ensure that the trench does not collapse it is filled with a bentonite slurry, a support fluid with a density of circa 13 kN/m3.
The reinforcement is placed in position in the trench.
Finally the bentonite is replaced by concrete resulting in the diaphragm wall after hardening. To create a wooden wall one possibility is to make use of such an excavated trench. When the wooden elements are connected to each other large discs or panels can be created. These panels can be lowered in the trench, creating one wall. Several solutions have to be found:
How can the wooden elements be connected to each other to create a larger panel/disk? All the elements should be connected to each other for the shear forces to be transferred. When the elements can slide with respect to each other, the moment of inertia is lower. The joints are calculated in such af way that the effective moment of inertia is 70% of the real moment of inertia. In the direction perpendicular to the diaphragm wall 3 elements of 470 mm create a wall of 1410 m. These elements can be connected to each other with a large bolt that goes through all the elements. The length can be circa 10.0 m. The width of the piles can be as large as possible, which is circa 600 mm. In horizontal way the piles will be connected to eachother with help of bolts. In vertical way they will be placed shifted with respect to each other. In this way the connections will not be concentrated in one location. With a steel plate inserted in the top and bottom of 2 piles, they can be connected to each other with pens.
How can de wooden elements be lowered in the trench? The connections between the piles can be made at the factory of the wood supplier. Panels of 1410 mm x 600 mm x 32.5 m can be transported to the building site. The panels can be lowered in the trench which is filled with bentonite. Note that the density of wood is lower than the bentonite slurry, creating a large upward force, therefore the wooden panels will float in the trench. Without the bentonite slurry the trench will collapse. One way is to hold the elements down with a weight that is enough to withstand the upward force. Another way is to make a connection to the bottom of the trench. For example a large steel profile driven in the soil, where the wooden panels can be placed on top through a whole that is realized in the panel before placing. Holding the elements down with an extra downward

Master Thesis G.P. Maas Comparison of quay wall designs with regard to the CO2‐emission and the Life Cycle Analysis 1227858
force is probably the easiest solution. For a panel of 1,41x0.6x32.5m the upward force in the bentonite slurry will be:
kNVF azobebentonite 55)1113(5.326.04.1)(
A guiding profile can be designed. With help of this guiding profile the elements which already have been placed can be kept on their position in horizontal and vertical way. Furthermore it can guide the element during placing. The connection between the panels can be done by making a groove in each panel. An extra wooden strip can be lowered in the grooves, creating a connection as shown in figure 21.
figure 21: Top view of wooden wall, connection between panels
When the panels are in position, the bentonite is removed. The upward force will be gone as well, resulting in a wooden wall. The concrete superstructure can be cast in situ on top of the wall.
A cross section of the design is presented in Appendix C.8.
48

Master Thesis G.P. Maas Comparison of quay wall designs with regard to the CO2‐emission and the Life Cycle Analysis 1227858
7.4.4 Jetty
7.4.4.1 Overview of structure
The second type of structure well suitable for the construction of a wooden quay wall is a jetty. Wooden pile lengths are limited due to nature. The maximum lengths which are available are circa 10m. The piles can be driven into the soil. To be able to obtain the required height the piles must be connected and joined together. For stability and to limit deformations, beams and girders are applied. A deck of concrete or steel covers the total jetty. The result is a truss construction, which is often used in rollercoasters and steel offshore platforms. A number of alternatives are possible, sketches are shown in figure 22.
figure 22: Sketch of jetty alternatives
An alternative is to construct a jetty in combination with a (wooden) sheet pile wall. This results in a shorter jetty structure as shown in the right part of figure 22. To withstand the horizontal loads due to the soil pressure an anchor can be placed. Inspired by the superstructure of the Euromax Terminal a third alternative is possible. This is the relieving structure with a wooden substructure, shown in figure 23.
figure 23: Relieving floor with wooden substructure
7.4.4.2 First rough calculation
For the first calculation is chosen to use the most basic form of a jetty shown in the left side of figure 22. At first some rough dimensions will be estimated and assumptions will be made. Slope The slope of the subsoil is important for the length of the jetty. The angle of internal friction is an important parameter in this matter. Due to groundwater flow the slope of the soil can be estimated to be:
27.0)305.0tan()5.0tan(
Resulting in a slope of circa 1:4. The height of the structure is from NAP ‐22.0 m to NAP +5.0 m. Therefore the length of the jetty becomes: 27 m x 4 = 108 m.
49

Master Thesis G.P. Maas Comparison of quay wall designs with regard to the CO2‐emission and the Life Cycle Analysis 1227858
Pile length Due to nature, the wooden piles have a maximum length of circa 10 m. Because of the large height of the structure, the piles must be connected to obtain larger lengths. With the help of a (steel) shoe element, the connection can be made. A sketch of this idea is shown in figure 24. The forces in the piles are mainly normal compressive forces, therefore the connection does not have to be able to transfer large bending moments.
figure 24: Sketch of possible connection between two piles in vertical direction
Deck The top of the structure shall be a concrete deck. A lot of heavy traffic is driving on the deck to facilitate the containers and other port activities. Therefore it is necessary to have a top surface which can easily handle for example oil, de‐icing salt during winter time and other chemicals. Furthermore the guiding systems for the Automated Guided Vehicles, driving on the deck must be integrated in the deck. A concrete deck is able to spread the loads, therfore they are more evenly distributed to the bearing structure. Point loads will be transferred to several piles instead of only one. In front of the quay wall a vertical straight wall from NAP +2.0 m to NAP ‐5.0 m must be present. It is one of the requirements for the Euromax quay wall. It is chosen to make this wall out of concrete too. The fenders will be connected to this vertical wall. For this vertical wall a thickness of 1.00 m is assumed. Pile configuration Next the configuration and the dimensions of the piles must be determined. This is dependent on the position and the magnitude of the loads. The acceptable normal compressive force in the piles can be calculated as follows:
Permanent loads: pilepilem
repcd AAkF 5.10
3.1
3440.0;
mod
Pile: 400 x 400 mm: Fd = 1888 kN 500 x 500 mm: Fd = 2950 kN 600 x 600 mm: Fd = 4250 kN
Short term variable loads: pilepilem
repcd AAkF 17
3.1
3465.0;
mod
Pile: 400 x 400 mm: Fd = 2720 kN 500 x 500 mm: Fd = 4250 kN 600 x 600 mm: Fd = 6120 kN
50

Master Thesis G.P. Maas Comparison of quay wall designs with regard to the CO2‐emission and the Life Cycle Analysis 1227858
The vertical crane loads act as a line load on the structure. When locally underneath the crane tracks the deck of the structure is increased, these loads can be spread over multiple piles. Taking this into account, the position of the piles can be determined after some rough calculations with the largest loads. This results in the following pile configuration shown in appendix D.1. Thickness of deck The c.t.c distance of the piles is 5.0 m. Locally they are positioned c.t.c. 2.5 m to be able to transfer the large loads due to the crane track. The top deck will be at this location 2.5 m. Due to the height of the concrete deck, the loads will spread over 45° to the centre of the deck. In this way the load of the crane track will be spread over three different piles, which decreases the normal compressive force in these piles significantly. It is shown in figure 25.
Fcrane,vertical
2,5m
5,0m
figure 25: Spreading of crane loads at 2.5m and 30.5m from the waterfront
Now the thickness of the remaining part of the concrete deck can be estimated. The field load behind the crane track is 60 kN/m2. Per 5.0 m this is:
mkNq /300600.5
The field moment is:
mkNlqM rep /9400.53008
1
8
1 22
mkNMM repd /12503.1
Normal force in compressive zone in concrete is equal to tensile stress in reinforcement:
d
MNN d
sb
9.0'
Necessary amount of steel reinforcement: s
d
s
ds fd
M
f
NA
9.0
Percentage of reinforcement: bfd
M
A
A
s
d
b
s
20 9.0
Assuming 0.5% reinforcement, the thickness of the deck can be estimated:
mmdbfd
M
A
A
s
d
b
s 3605000432005.09.0
101250
9.0
6
20
Including extra height for coverage, stirrups, reinforcement and dead weight, the deck will be 500 mm.
51
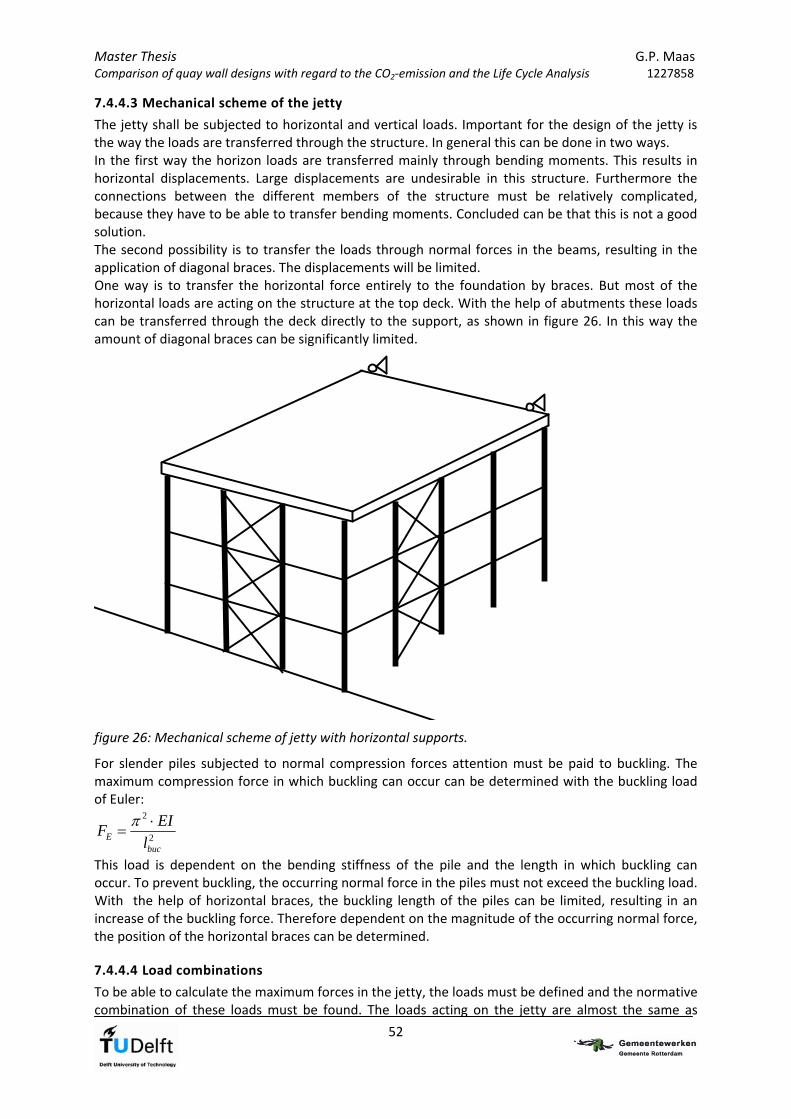
Master Thesis G.P. Maas Comparison of quay wall designs with regard to the CO2‐emission and the Life Cycle Analysis 1227858
7.4.4.3 Mechanical scheme of the jetty
The jetty shall be subjected to horizontal and vertical loads. Important for the design of the jetty is the way the loads are transferred through the structure. In general this can be done in two ways. In the first way the horizon loads are transferred mainly through bending moments. This results in horizontal displacements. Large displacements are undesirable in this structure. Furthermore the connections between the different members of the structure must be relatively complicated, because they have to be able to transfer bending moments. Concluded can be that this is not a good solution. The second possibility is to transfer the loads through normal forces in the beams, resulting in the application of diagonal braces. The displacements will be limited. One way is to transfer the horizontal force entirely to the foundation by braces. But most of the horizontal loads are acting on the structure at the top deck. With the help of abutments these loads can be transferred through the deck directly to the support, as shown in figure 26. In this way the amount of diagonal braces can be significantly limited.
figure 26: Mechanical scheme of jetty with horizontal supports.
For slender piles subjected to normal compression forces attention must be paid to buckling. The maximum compression force in which buckling can occur can be determined with the buckling load of Euler:
2
2
bucE l
EIF
This load is dependent on the bending stiffness of the pile and the length in which buckling can occur. To prevent buckling, the occurring normal force in the piles must not exceed the buckling load. With the help of horizontal braces, the buckling length of the piles can be limited, resulting in an increase of the buckling force. Therefore dependent on the magnitude of the occurring normal force, the position of the horizontal braces can be determined.
7.4.4.4 Load combinations
To be able to calculate the maximum forces in the jetty, the loads must be defined and the normative combination of these loads must be found. The loads acting on the jetty are almost the same as
52

Master Thesis G.P. Maas Comparison of quay wall designs with regard to the CO2‐emission and the Life Cycle Analysis 1227858
those acting on the diaphragm wall, but due to the different lay out of the structure some loads, like the soil pressures, are different. Note that the jetty is such a large structure that the loads of the crane track at the landside are acting on the jetty as well. In case of the design with the wooden wall, this crane track had a separate shallow foundation. With the help of Scia Engineer a model of the jetty structure is composed. In appendix D.2 the model which is used is explained. Loads acting on the structure:
1. Dead load of the deck and front wall 2. Field loads between the crane tracks 3. Field loads behind the crane tracks 4. Crane load vertical in operation, both crane tracks. 5. Crane load horizontal in operation, both crane tracks. 6. Crane load vertical in storm, both crane tracks. 7. Crane load horizontal in storm, both crane tracks. 8. Bollard loads 9. Fender loads 10. Accidental load: 2 x Fender load
In appendix D.3 an overview of the loads, the way they act on the structure and there magnitudes are presented. Several load combination are composed to study the normative combination:
1. Permanent loads. 2. Variable loads: Combination for the maximum vertical load for the piles c.t.c 2,50 m. 3. Variable loads: Combination for the maximum vertical load for the piles c.t.c 5,0 m. 4. Variable loads: Combination for the maximum horizontal load. 5. Accidental load: Maximum horizontal load with combination factors for an accidental load.
Combined with the combination factor Ψ0 and the material factors, this results in the combinations shown in appendix D.4.
7.4.4.5 Pile reactions
The modelling of the structure and the loads is done, next the normal forces in the pile can be calculated. After a first estimation with the largest loads the calculations with the loads combinations are done for the following pile dimensions:
Piles below the crane track (c.t.c 2,50 m): 400x400 mm.
The other piles (c.t.c. 5,0 m): 600x600 mm. The normative design compression force in the pile may not exceed the maximum allowable stress. When that is the case a larger pile should be chosen, to decrease the stress in the pile. The vertical pile reactions of all load combinations are presented in appendix D.5. Combination 1: Permanent loads, kmod = 0.4: The pile reactions for the permanent loads are for the piles c.t.c 2,50 m:
kNFd 723
For the piles c.t.c 5.0 m:
kNFd 375
53
Master Thesis G.P. Maas Comparison of quay wall designs with regard to the CO2‐emission and the Life Cycle Analysis 1227858
These values are much lower than the maximum allowable normal force in the piles taking the modification factor for permanent loads into account. From this point of view a smaller pile can be chosen. Combination 2: Variable loads, kmod = 0.65 From the vertical reactions can be seen that combination 2 results in the largest normal forces in the piles below the crane track. For these piles, c.t.c 2.50m the maximum normal force is:
kNFd 3160
In paragraph 4.4.2 is calculated that the maximum allowable compressive force for a pile 600 x 600mm is 6120kN. This is much more than the occurring normal force. A pile of 500x500mm with an allowable compression force of 4250kN is sufficient as well. Combination 3: Variable loads, kmod = 0.65 In this combination the variable field loads will have a combination factor Ψ0=1.0. This results in the largest normal forces in the piles c.t.c. 5.0m. For the piles c.t.c 5.0m, the maximum reaction force is:
kNFd 2400
The allowable compression force of a pile 400x400mm is 2720kN, therefore the dimensions of these piles are chosen well. It can be concluded that the piles below the crane tracks must be 500x500mm and for the other pile dimensions of 400x400mm are sufficient. When the calculations are done again with the new pile dimensions, the normal forces in the piles change, because their stiffness has changed. The piles of 400mm have become relatively stiffer, therefore they attract more loads. The increase in these loads is limited, so the allowable stresses in the piles are not exceeded. Combination 4: Horizontal force The horizontal forces in the jetty are transferred through the deck of the structure to abutments.
Due to load combination 4 the maximum horizontal reaction force is kNFh 3820 per 5.0m jetty.
7.4.4.6 Position of braces
The normal forces in the piles are known. In combination with the maximum buckling load for the piles, the position of the braces can be determined. The buckling load of Euler is:
2
2
bucE l
EIF
With: lbuc = the buckling length. To avoid buckling from happening the maximum normal force in the piles must not exceed this buckling load. Because the maximum pile loads are known, the corresponding buckling length can be determined:
dbuc F
EIl
10
2
In appendix D.6 these calculations are more elaborated. For the piles c.t.c 2.50m with dimensions 500 x 500 mm2, the maximum distance between the braces is 10.40m. For the piles c.t.c. 5.00m with dimensions 400 x 400 mm2, the maximum distance between the braces is 7.60m.
54

Master Thesis G.P. Maas Comparison of quay wall designs with regard to the CO2‐emission and the Life Cycle Analysis 1227858
A cross section of the total framework of the jetty structure is shown in appendix D.9.
7.4.4.7 Bearing capacity of piles
The piles are up to now schematized as rigidly supported. A pile foundation is needed, which in reality creates a spring support. Wooden piles driven in the soil have a certain bearing capacity, dependent on the soil. The bearing capacity of a pile is a combination between the shaft friction and the bearing capacity of the pile tip. It can be calculated as follows according to NEN6743 “Foundation on piles” [7.34]:
shaftrtiprr FFF max;;max;;max,
With:
gemIIIc
gemIIcgemIcppotipr q
qqsAF ;;
;;;;intmax;; 22
1
dlqOdlpOF azcsgempshaftrgempshaftr ;;;max;;;max;;
The calculations are elaborated in appendix D.8. A pile length of 10.0m is assumed because of its natural restriction. For the longest piles this results in a foundation on the Pleistocene sand layer which has a good bearing capacity. The calculations show that the bearing capacity for these piles is sufficient. The sand layers above vary is quality, because some clay layers and a peat layer are present. Assumed is that an average pile length of 10.0m is sufficient. More detailed calculations are needed to check the total bearing capacity of all the piles, but this will not be done in this thesis.
7.4.4.8 Constructability
The construction of the jetty is executed in several steps. First the piles have to be driven in the soil. Piles of 500x500mm and 400x400mm. The forces in these piles with large dimension will be very high. It is questionable if these piles can be driven without damage or failure. To avoid this, the piles can be constructed in the same way as is done for vibro‐piles. For the construction of vibro‐piles first a steel hollow tube that is closed with a bottom plate is driven in the soil. Normally reinforcement is lowered in the tube and concrete is cast. In this case a wooden pile can be lowered in the tube. Afterwards the steel tube is pulled again with help of vibration, resulting in a wooden pile in the soil with sufficient bearing capacity. Next the piles of the jetty must be connected to the pile foundation. At the location where the jetty is the highest, several piles have to be connected to each other to obtain the required height. This connection can be done with help of the steel shoe shown in figure 24. This connection is able to transfer the normal forces through the piles. The piles are not subjected to bending moments or shear forces. To guarantee the stability of the piles, girders and braces have to be applied. The braces prevent the long piles from buckling, because the buckling length is limited. With help of bolds the connections between the piles and the braces can be realised. It is favourable when they can be as long as possible, so they can be connected to several piles, instead of just between 2 piles. It results in a higher stability of the structure and easier construction, because fewer elements have to be handled. Finally the top deck shall be realised. This concrete deck shall be cast in situ, covering the total jetty. At the land side abutments must be realized, to bear and support the horizontal forces acting on the structure by cranes and vessels. The front wall shall be cast in situ as well. When the jetty is realized, the fenders, crane tracks and other facilities have to be installed.
55
Master Thesis G.P. Maas Comparison of quay wall designs with regard to the CO2‐emission and the Life Cycle Analysis 1227858
56
7.5 Comparison of designs
7.5.1 Introduction In the previous paragraphs two types of structures have been designed and the main dimensions are calculated. Only one of the designs will be used for the life cycle analysis and the calculation of the CO2 emission. For this purpose one of the alternatives of the wooden quay wall will be chosen. This is done in a number of steps:
First a list of important criteria is set up.
For each criteria a qualitative and where possible a quantitative consideration will be done.
The criteria will be compared to each other, in which some criteria are more important than others.
Finally a conclusion can be drawn.
7.5.2 Criteria Many criteria are important for the design of a quay wall. For this study it is important that these criteria are based on the entire lifecycle of the structure. The influences of most criteria will be determined on a qualitative way, to be able to make a relative comparison between the two designs. The following criteria will be taken into account:
1. Quantity of material: For each design can be calculated how many m3 of construction material is needed. In this a distinction can be made between wood, concrete and steel. Besides the preference to use as less material as possible, it is desirable to use a high percentage of wood in the structure.
2. Experience in execution of the structure: These types of structures are not common for these large dimensions, therefore not much experience is present. When experience is present in some construction phases, this is positive. It can cost extra material and energy when something needs to be done over or methods have to be examined.
3. Risks during construction: The same holds for the risks. New execution methods always bring risks. It is possible that unforeseen risks occur, causing damage to materials and surroundings. Relative estimations of the possible risks per design have to be made.
4. Durability: Important is which type of structure is better to withstand the environmental impacts. Exposure to a combination of water, air and oxygen is unwanted.
5. Sustainability: For the CO2 calculation, which will be executed in chapter 11, it is important to choose the structure which is most sustainable. Besides the material quantities the way of construction is important in this matter. Furthermore the origin of the materials is important. An overall estimation of the state of the structure after its lifetime needs to be made. Next to that, the possibility to reuse parts and the demolition of the structure needs to be taken into account.
6. Maintenance: The amount of maintenance is important as well. Of course as less maintenance as possible is preferred. Besides that the possibility to execute the maintenance and to be able to check the structure is important. Some structural parts are hard or even impossible to reach.
7. Robustness: In case of an accident the structure will be subjected to undesirable loads. During the design calculation a larger fender load is taken into account. But in general the robustness of a structure is important. How good is the structure able to withstand undesired loads and what is de order of the damage.
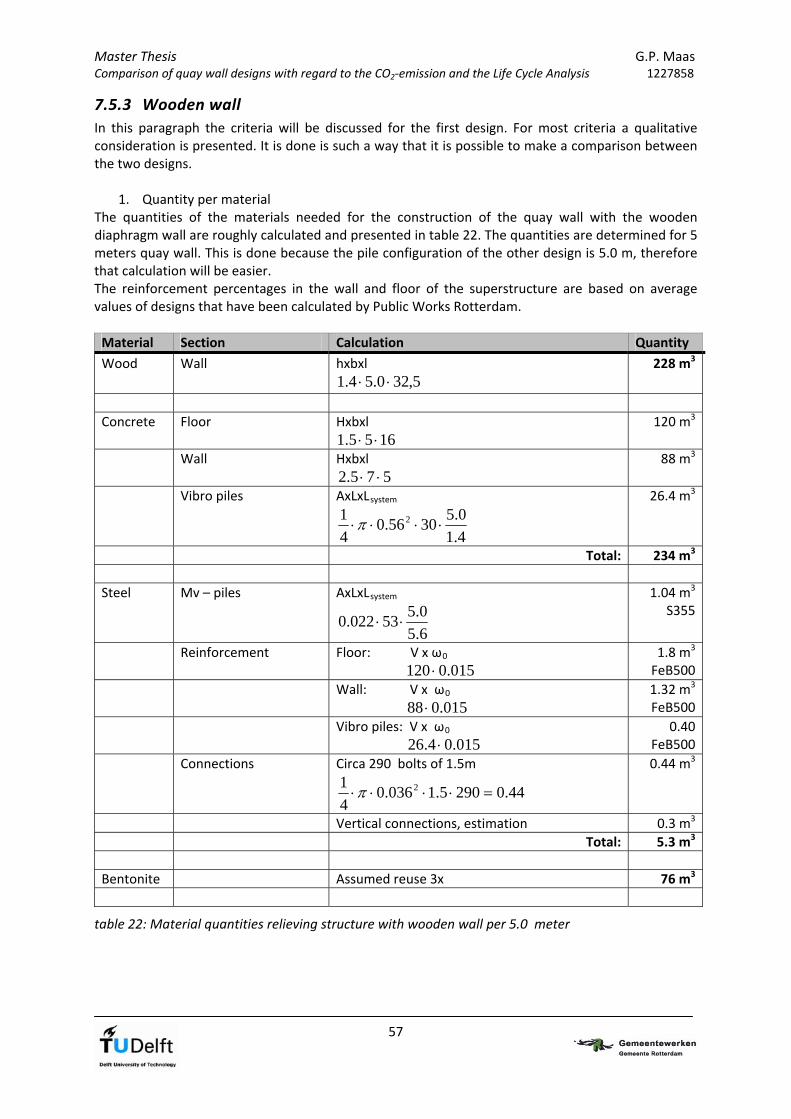
Master Thesis G.P. Maas Comparison of quay wall designs with regard to the CO2‐emission and the Life Cycle Analysis 1227858
7.5.3 Wooden wall
In this paragraph the criteria will be discussed for the first design. For most criteria a qualitative consideration is presented. It is done is such a way that it is possible to make a comparison between the two designs.
1. Quantity per material The quantities of the materials needed for the construction of the quay wall with the wooden diaphragm wall are roughly calculated and presented in table 22. The quantities are determined for 5 meters quay wall. This is done because the pile configuration of the other design is 5.0 m, therefore that calculation will be easier. The reinforcement percentages in the wall and floor of the superstructure are based on average values of designs that have been calculated by Public Works Rotterdam. Material Section Calculation Quantity
Wood Wall hxbxl
5,320.54.1
228 m3
Concrete Floor Hxbxl
1655.1
120 m3
Wall Hxbxl
575.2
88 m3
Vibro piles AxLxLsystem
4.1
0.53056.0
4
1 2
26.4 m3
Total: 234 m3
Steel Mv – piles AxLxLsystem
6.5
0.553022.0
1.04 m3
S355
Reinforcement Floor: V x ω0
015.0120
1.8 m3
FeB500
Wall: V x ω0
015.088
1.32 m3
FeB500
Vibro piles: V x ω0
015.04.26
0.40FeB500
Connections Circa 290 bolts of 1.5m
44.02905.1036.04
1 2
0.44 m3
Vertical connections, estimation 0.3 m3
Total: 5.3 m3
Bentonite Assumed reuse 3x 76 m3
table 22: Material quantities relieving structure with wooden wall per 5.0 meter
57

Master Thesis G.P. Maas Comparison of quay wall designs with regard to the CO2‐emission and the Life Cycle Analysis 1227858
58
2. Experience A wooden wall with these dimensions has never been constructed in a hydraulic structure jet, therefore no exact experience is present. A couple of large bridges constructed of laminated wood have been executed. Constructing a quay wall of these dimensions with a wooden wall is very new.
3. Risks
Constructing the wooden wall is a process with very little experience. Due to all the separate wooden elements the risks during construction are significant. Lowering the panels in the trench in the right position and making sure that they stay in the right place due to the upward force is a complicated action.
4. Durability
The entire wooden wall will be permanent in the water, which is very favourable for the material. In this way the exposure to both oxygen and water is avoided, creating poor conditions for the attack of fungus.
5. Sustainability
The wooden wall and the jetty will be constructed with the same wood specie, Azobé, therefore this makes no difference between the structures. The wood that is used will be FSC‐certified and must originate from sustainable managed forest. After the lifetime of the structure the superstructure can be dismantled, then the wall can be reached. Depending on the condition of the wood, parts can be reused for example in smaller pieces in other structures. The part of the wall that is in the soil is hard to reach, which makes reuse of this part not realistic.
6. Maintenance The wooden wall is the front of the quay wall, which can be inspected, although the wall is very deep. The inside, backside and the whole bottom part of the wall which is in the soil can not be reached, therefore checking the condition of the wall is not possible.
7. Robustness
Due to the superstructure, the quay wall is very robust. In case of an accident loads will be spread through the structure, resulting in damage, but probably not in failure of the structure.
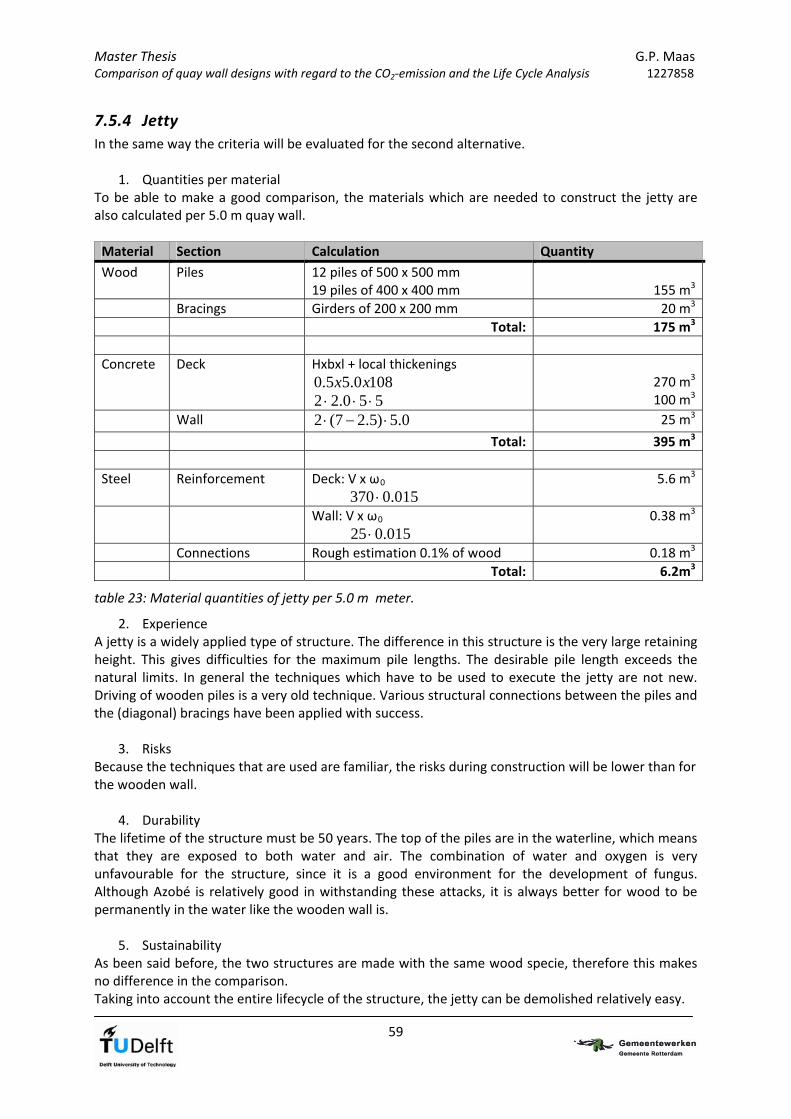
Master Thesis G.P. Maas Comparison of quay wall designs with regard to the CO2‐emission and the Life Cycle Analysis 1227858
7.5.4 Jetty In the same way the criteria will be evaluated for the second alternative.
1. Quantities per material To be able to make a good comparison, the materials which are needed to construct the jetty are also calculated per 5.0 m quay wall. Material Section Calculation Quantity
Wood Piles 12 piles of 500 x 500 mm 19 piles of 400 x 400 mm 155 m3
Bracings Girders of 200 x 200 mm 20 m3
Total: 175 m3
Concrete Deck Hxbxl + local thickenings
1080.55.0 xx
550.22
270 m3
100 m3
Wall 0.5)5.27(2 25 m3
Total: 395 m3
Steel Reinforcement Deck: V x ω0
015.0370
5.6 m3
Wall: V x ω0
015.025
0.38 m3
Connections Rough estimation 0.1% of wood 0.18 m3
Total: 6.2m3
table 23: Material quantities of jetty per 5.0 m meter.
2. Experience A jetty is a widely applied type of structure. The difference in this structure is the very large retaining height. This gives difficulties for the maximum pile lengths. The desirable pile length exceeds the natural limits. In general the techniques which have to be used to execute the jetty are not new. Driving of wooden piles is a very old technique. Various structural connections between the piles and the (diagonal) bracings have been applied with success.
3. Risks Because the techniques that are used are familiar, the risks during construction will be lower than for the wooden wall.
4. Durability The lifetime of the structure must be 50 years. The top of the piles are in the waterline, which means that they are exposed to both water and air. The combination of water and oxygen is very unfavourable for the structure, since it is a good environment for the development of fungus. Although Azobé is relatively good in withstanding these attacks, it is always better for wood to be permanently in the water like the wooden wall is.
5. Sustainability As been said before, the two structures are made with the same wood specie, therefore this makes no difference in the comparison. Taking into account the entire lifecycle of the structure, the jetty can be demolished relatively easy.
59

Master Thesis G.P. Maas Comparison of quay wall designs with regard to the CO2‐emission and the Life Cycle Analysis 1227858
60
When the concrete deck is removed, the piles can be demounted. The different materials can be separated and if possible reused. The piles that have been driven in the soil are difficult to get out of the soil. Depending on the next purpose of the location, the piles can either be left in the soil or be taken out.
6. Maintenance The jetty is a very open structure, therefore it is easily accessible. In this way the structure can be checked regularly for damage or degradation of structural elements. When needed, parts can be strengthened or replaced when possible.
7. Robustness The jetty consists of piles that are easily individually exposed during collision. When a single pile is subjected to an accidental load, this pile will fail. When a single pile fails, the loads will be spread over the total jetty, which means that the structure will not collapse.
7.5.5 Conclusion The amount of material used for the wooden wall is significantly lower than for the jetty. This is the result of the large slope that the jetty has to overcome, resulting in a the structure that must be 108 m long. For the comparison of the CO2‐emission the material use is very important. Furthermore the durability of the wooden wall is higher than the jetty, because the wooden wall is permanently in the water. Besides that the wooden wall with the superstructure is more robust in case of an accident, due to the stiff relieving structure. On the other hand the risks during construction are higher for the wooden wall than for the jetty, because the jetty makes use of more experienced techniques. The construction of the jetty is easier. Concluded can be that the quay wall constructed with a wooden wall and relieving structure is the best solution. The main argument for this is the significant difference in material use of the two structures.

Master Thesis G.P. Maas Comparison of quay wall designs with regard to the CO2‐emission and the Life Cycle Analysis 1227858
61
7.6 References [7.1] Dr. Ir. J.W.G. van de Kuilen, Lecture notes “Constructieleer 2A Hout”, maart 2006, p. 5. [7.2] Prof. Dr. Ir Ch. F. Hendriks, “Sustainable Construction”, 2001, p. 89. [7.3] Conversation with Ir P.A. de Vries, TU Delft, department Building and Civil structures, Wood
structures and wood technology, 18‐06‐2010 [7.4] Conversation with Drs. W.F. Gard, TU Delft, department Building and Civil structures, Wood
structures and wood technology, 18‐06‐2010 [7.5] Rijkswaterstaat, “CUR 213 – Hout in de GWW‐sector, duurzaam detailleren in hout”, 2003. [7.6] Rijkswaterstaat, “CUR 213 – Hout in de GWW‐sector, duurzaam detailleren in hout”, 2003, p.
18. [7.7] Rijkswaterstaat, “CUR 213 – Hout in de GWW‐sector, duurzaam detailleren in hout”, 2003, p.
27. [7.8] Verver en Fraaij, “Materiaalkunde, Bouwkunde & Civiele techniek”, 2004, p. 170. [7.9] www.houtdatabase.nl [7.10] Verver and Fraaij, “Materiaalkunde, Bouwkunde & Civiele techniek”, 2004, chapter 2. [7.11] Rijkswaterstaat, “CUR 213 – Hout in de GWW‐sector, duurzaam detailleren in hout”, 2003, p.
16 [7.12] www.fsc.org [7.13] Report Ministerie van Verkeer en Waterstaat, Rijkswaterstaat “Azobé anders?”, april 2005. [7.14] E‐mail contact with Dhr. E de Munck, Manager of “Centrum Hout” on 15‐09‐2010. [7.15] Report Greenpeace, “Kettingzaagcrimineel Wijma”, april 2003. [7.16] www.wijma.com/nl/index.php?page=verantwoord_bosbeheer [7.17] Report “Wijma – Jetties/Pontoons/Decking/Piling”, 2007,
www.wijma.com/nl/index.php?page=producten_steigersvlonders [7.18] Conversation with Mr. Kemper from Wijma Kampen B.V. 29‐06‐2010 [7.19] www.robiniawood.nl/robinia‐3.html [7.20] Verver en Fraaij, “Materiaalkunde, Bouwkunde & Civiele techniek”, 2004, p. 99. [7.21] Dr. Ir. J.W.G. van de Kuilen, Lecture notes “Constructieleer 2A Hout”, maart 2006, appendix 2. [7.22] Article Centrum Hout, “Bomen over, Azobé”, Houtblad, februari 2005. [7.23] Centrum Hout, “Timber Engineering STEP 1”, 1995, lecture A6, Strength Grading. [7.24] Centrum Hout, “Timber Engineering STEP 1”, 1995, lecture A4, Wood as a building material. [7.25] Kmod, “NEN‐EN 1995‐1‐1 Inclusief Nationale Bijlage (nl), Eurocode 5: Ontwerp en berekening
van houtconstructies – Deel 1‐1: Algemeen – Gemeenschappelijke regels en regels voor gebouwen”, paragraph 3.1.3, table 3.1.
[7.26] Material factor, “NEN‐EN 1995‐1‐1 Inclusief Nationale Bijlage (nl), Eurocode 5: Ontwerp en berekening van houtconstructies – Deel 1‐1: Algemeen – Gemeenschappelijke regels en regels voor gebouwen”, paragraph 2.4.1, equation 2.14.
[7.27] Dr. ir. J.G. de Gijt, Lecture notes ct5313, “Structures in Hydraulic Engineering”, 2004, chapter 4, Port Infrastructure, p. 26.
[7.28] Dr. Ir. J.G. de Gijt, PhD thesis: “A History of Quay walls, techniques, types, costs and future”, 2010, p 91.
[7.29] Report O‐R‐015, “Kadeconstructie: berekening diepwand en fundering”, Revisie C, 2005, p. 19.
[7.30] Ir. A.A. Roubos, Report Gemeentewerken Rotterdam, “Euromax berekeningen”, 2004, Appendix E1‐14
[7.31] A.H. Conner, Encyclopedia of materials: Science and Technology, “Wood: Adhesives”, 2008, p. 9583‐9599.
[7.32] Centrum Hout, “Timber Engineering STEP 1”, 1995, lecture B6, Columns.

Master Thesis G.P. Maas Comparison of quay wall designs with regard to the CO2‐emission and the Life Cycle Analysis 1227858
62
[7.33] CUR211E, “Handbook of Quay walls”, 2005, combination of table 6.7 p.255 and table 6.10 p.265.
[7.34] NEN6743, “Funderingen op palen”, 1991.
Ma er Thesis Com arison of quay wall designs with regard to the CO2‐emission and the Life C
st G.P. Maas p ycle Analysis 1227858
63
8 Fiber Reinforced Polymer
8.1 Introduction In the previous chapters designs of quay walls with the building materials concrete, steel and wood have been presented. In this chapter the last building material shall be studied and a design of a quay wall of Fiber Reinforced Polymers will be proposed. This design will also be based on the requirements of the Euromax quay wall. This chapter is set up as follows: first a literature study is presented, which shows what is possible with this material and what has already been done. Then several types of constructions will be researched. Subsequently for the best alternatives of this material calculations will be made to determine the main dimensions and to check their feasibility. Finally these alternatives will be compared, to determine which alternative is the best to use in the comparison for CO2 calculation and life cycle analysis.
8.2 Literature study
8.2.1 Fiber Reinforced Polymer
8.2.1.1 Introduction
Engineering in plastics results in the use of Fiber Reinforced Polymers. Fiber reinforced polymer (FRP) composites consist of a polymer resin matrix reinforced by glass or carbon fibers. The strength and stiffness of a composite component are determined primarily by the type, orientation, quantity and location of the fibers within the part [8.1]. This means that the material properties can differ in each direction depending on the composition, resulting in an orthotropic material. The choice for resin must be adjusted to the structure, temperature, environmental conditions, and the production method. Fiber Reinforced Polymers in civil structures are becoming more popular. They are applied in bridge decks, girders and handrails. The main advantages for this use are [8.2]:
Fibre reinforced polymers have a high stiffness to weight ratio and strength to weight ratio compared to conventional construction materials.
Low thermal expansion.
Good resistance to corrosion.
Easy transportation and handling due to low weight, resulting in low costs of transportation and allows some prefabrication to take place at the factory, which reduces the time at the building site.
Low energy consumption during fabrication of raw materials and structure.
Very durable, resulting in low maintenance. Disadvantage is:
The high costs compared to conventional materials. But when installation is included in the cost comparison of FRP projects the material can be competitive. It must be researched if this holds for the construction of a large quay wall as well.
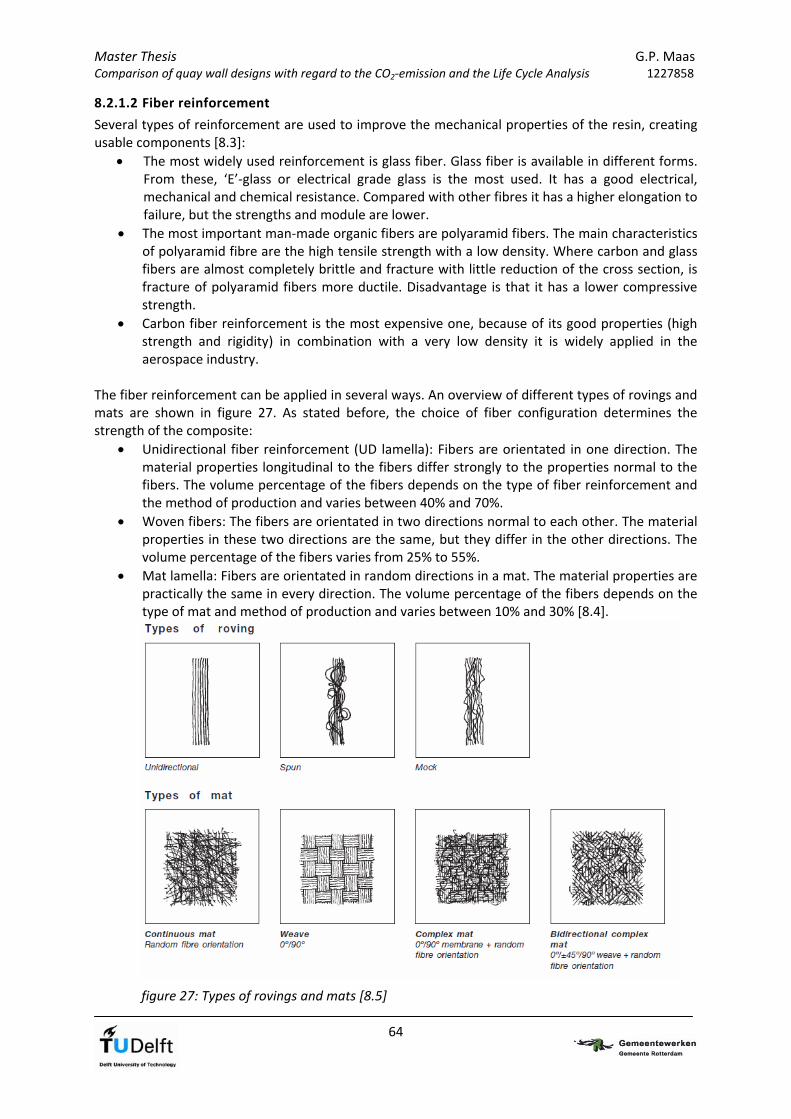
Master Thesis G.P. Maas Comparison of quay wall designs with regard to the CO2‐emission and the Life Cycle Analysis 1227858
8.2.1.2 Fiber reinforcement
Several types of reinforcement are used to improve the mechanical properties of the resin, creating usable components [8.3]:
The most widely used reinforcement is glass fiber. Glass fiber is available in different forms. From these, ‘E’‐glass or electrical grade glass is the most used. It has a good electrical, mechanical and chemical resistance. Compared with other fibres it has a higher elongation to failure, but the strengths and module are lower.
The most important man‐made organic fibers are polyaramid fibers. The main characteristics of polyaramid fibre are the high tensile strength with a low density. Where carbon and glass fibers are almost completely brittle and fracture with little reduction of the cross section, is fracture of polyaramid fibers more ductile. Disadvantage is that it has a lower compressive strength.
Carbon fiber reinforcement is the most expensive one, because of its good properties (high strength and rigidity) in combination with a very low density it is widely applied in the aerospace industry.
The fiber reinforcement can be applied in several ways. An overview of different types of rovings and mats are shown in figure 27. As stated before, the choice of fiber configuration determines the strength of the composite:
Unidirectional fiber reinforcement (UD lamella): Fibers are orientated in one direction. The material properties longitudinal to the fibers differ strongly to the properties normal to the fibers. The volume percentage of the fibers depends on the type of fiber reinforcement and the method of production and varies between 40% and 70%.
Woven fibers: The fibers are orientated in two directions normal to each other. The material properties in these two directions are the same, but they differ in the other directions. The volume percentage of the fibers varies from 25% to 55%.
Mat lamella: Fibers are orientated in random directions in a mat. The material properties are practically the same in every direction. The volume percentage of the fibers depends on the type of mat and method of production and varies between 10% and 30% [8.4].
figure 27: Types of rovings and mats [8.5]
64
Master Thesis G.P. Maas Comparison of quay wall designs with regard to the CO2‐emission and the Life Cycle Analysis 1227858
65
8.2.1.3 Resin
The bundles of fibers are joined by resin, which makes the material usable for structural applications. By ‘gluing’ bundles of fibers together with resin matrices, the strong, stiff fibers are able to carry most of the stress while the matrix distributes the external load to all the fibres. Furthermore the resin affords protection and prevents the fibers from buckling under compressive forces. Types of resin are:
Polyester resins are syrups consisting of polymer chains dissolved in a reactive organic solvent.
Vinyl ester resin is an extension of the polyester resin. It has a higher chemical resistance than polyester resins.
Epoxy resin has the best properties for FRP, but is also the most expensive.
8.2.1.4 Coating
Gell coats are applied first to the mould surface of a laminate to produce a decorative and protective surface finish. The formulation and application of the base resin is very important for the integrity and performance of a gel coat.
8.2.1.5 Additives
Several additives can be added to the resin to change the material properties. Fillers can be added to reduce the costs. Dyes and pigments can be used to obtain any desirable colour. Extra materials can be added to increase the fire resistance and other additives can control the shrinkage of the material.
8.2.1.6 Production methods
Several production methods are possible for Fiber Reinforced Polymers. Open mould techniques:
Hand lay‐up: In this production method the resin is applied in layers in the fiber reinforcement with help of manually rolling. It is labour intensive and difficult to control.
Spray lay‐up: Resin and short fibers are applied simultaneously with a spray gun and subsequently rolled manually.
Filament winding: This technique is used for the production of simple hollow shapes. In resin soaked fibers are winded around a mould.
Closed mould techniques:
Vacuum assisted resin transfer moulding: Fiber reinforcement a placed in a mould. When the mould is closed, resin in drawn through the fiber reinforcement with help of vacuum. Benefits of this process are the large moulds and high fiber contents which can be used.
Prepreg: A prepreg is a fiber reinforcement which is pre‐impregnated with epoxy resin and then partly is hardened. Subsequently the prepregs are applied in a mould and they are consolidated with help of vacuum and heath.
Pultrusion: Bunches of fibers and fiber reinforcement are soaked in resin and pulled through a mould. Simultaneously it is cured. It is a continuous process and the last step of the process is to cut the laminates to the desired length. This method is only suitable for the production of profiles.
8.2.1.7 Durability
The durability of FRP materials is important when they are used in construction. The resistance to frost and de‐icing salts is very good. A disadvantage is that glass fibers are not able to withstand humidity, therefore cracks in the resin matrix must be avoided. Furthermore most resins are not able to withstand UV attack. Only carbon fibers are generally considered to be UV resistant. UV attack is

Master Thesis G.P. Maas Comparison of quay wall designs with regard to the CO2‐emission and the Life Cycle Analysis 1227858
in this matter not a problem, because most or probably even the entire quay wall is not subjected to any UV. Humidity on the other hand is of great importance in this matter. Moisture may affect the laminates through chemical changes, such as relaxation and oxidation of the matrix material. Diffusion of water rapidly destroys the bond between resin and glass fibers. Most of the times the first damage mode of a composite structure is cracking, which is in principle not the final failure mode, but in the case of a quay wall a rapid moisture absorption can be expected. When the moisture in take increases, the material degradation will increase as well, therefore the formation of cracks in the laminates must be avoided [8.6], [8.7].
8.2.1.8 Sustainability
As stated above, FRP are based on fibers and resin. Glass fibers are mainly made from quartz powder and limestone. The energy consumption of fiber and polymer components during manufacturing is circa 25% of the energy which is needed to produce steel. The production of carbon fibers requires very much energy. Polymers are waste products from the oil industry, so they are produced from fossil fuels. Recycling of a polymer matrix is limited and the structural components can not easily be reused to perform a similar function in another structure. The resins which are applied are mostly thermosetting polymers, which can only be reused by processing it to granulate and use as a filler material, so called down cycling. The benefits of FRP composites can be realized from the material properties. The low weight results in an increased speed of constructing. Furthermore due to the high strength properties less material can be used to achieve similar performances as traditional materials. Fiber reinforced polymer is a material which is still developing. If it would be possible to make use of thermoplastic matrices in the future, the material will be more sustainable, because of the possibilities for recycling [8.3], [8.8].
8.2.2 Sandwich panels
8.2.2.1 Composition
One way of constructing FRP elements are sandwich panels. Sandwich constructions are composed of strong, stiff face sheets, separated by a core material with a low density. The face sheets and core materials can be changed during manufacturing, creating a tremendous flexibility in designing various sandwich panels. The individual sandwich panels are usually joined to each other by tongue‐and‐groove ends [8.2], [8.9].
figure 28: Foam core Honeycomb sandwich panel
Examples of sandwich constructions are a foam core and the honeycomb panels shown in figure 28. The face sheets are taking care of the normal forces and create the required bending stiffness, while the core is able to withstand the shear forces. Especially the lamellas in a honeycomb sandwich are creating shear capacity in the panel. The lamella (flanges) can be positioned in any desirable way.
66
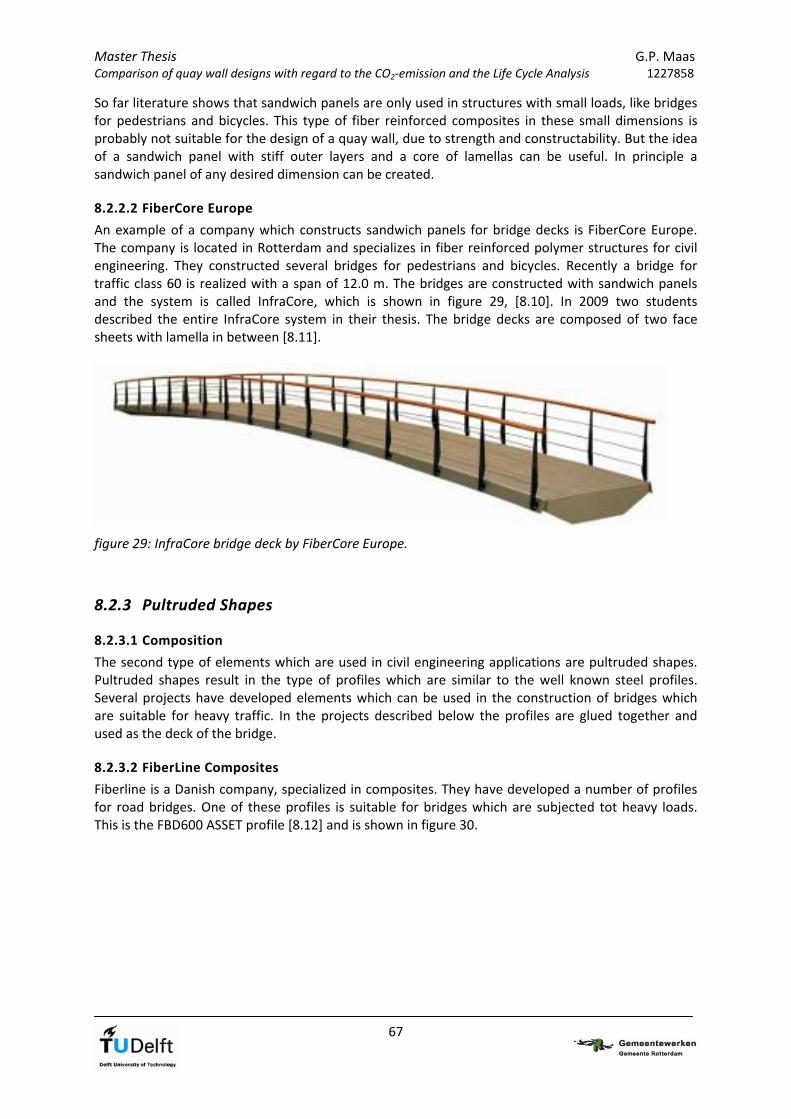
Master Thesis G.P. Maas Comparison of quay wall designs with regard to the CO2‐emission and the Life Cycle Analysis 1227858
So far literature shows that sandwich panels are only used in structures with small loads, like bridges for pedestrians and bicycles. This type of fiber reinforced composites in these small dimensions is probably not suitable for the design of a quay wall, due to strength and constructability. But the idea of a sandwich panel with stiff outer layers and a core of lamellas can be useful. In principle a sandwich panel of any desired dimension can be created.
8.2.2.2 FiberCore Europe
An example of a company which constructs sandwich panels for bridge decks is FiberCore Europe. The company is located in Rotterdam and specializes in fiber reinforced polymer structures for civil engineering. They constructed several bridges for pedestrians and bicycles. Recently a bridge for traffic class 60 is realized with a span of 12.0 m. The bridges are constructed with sandwich panels and the system is called InfraCore, which is shown in figure 29, [8.10]. In 2009 two students described the entire InfraCore system in their thesis. The bridge decks are composed of two face sheets with lamella in between [8.11].
figure 29: InfraCore bridge deck by FiberCore Europe.
8.2.3 Pultruded Shapes
8.2.3.1 Composition
The second type of elements which are used in civil engineering applications are pultruded shapes. Pultruded shapes result in the type of profiles which are similar to the well known steel profiles. Several projects have developed elements which can be used in the construction of bridges which are suitable for heavy traffic. In the projects described below the profiles are glued together and used as the deck of the bridge.
8.2.3.2 FiberLine Composites
Fiberline is a Danish company, specialized in composites. They have developed a number of profiles for road bridges. One of these profiles is suitable for bridges which are subjected tot heavy loads. This is the FBD600 ASSET profile [8.12] and is shown in figure 30.
67

Master Thesis G.P. Maas Comparison of quay wall designs with regard to the CO2‐emission and the Life Cycle Analysis 1227858
figure 30: the module figure 31: the profile
Dimensions figure 30: the module Figure 6: the profile
H 225 mm 225 mm
B 1000 mm 521 mm
Beff 299 mm
B1 500 mm 260.5 mm
B2 500 mm 260.5 mm
H1 114 mm 112.5 mm
H2 111 mm 112.5 mmGeometrical data: A 54252 mm2/m 15644 mm2
Ix 425.6x106 mm4/m 125.4x106 mm4
Wx 3733.3x103 mm3/m 1114x103 mm3
Iy 228.8x106 mm4
Wy 87x103 mm3
Stiffness Eo (longitudinal) 20x103 MPa 20x103 N/mm2
Weight 103690 g/m2 29900 g/m
table 24: Dimensions ASSET profile by Fiberline.
The profile has been applied in a number of projects, for example a bridge of 52 metres long, crossing a motorway in the UK. It is shown in the left side of figure 32.
figure 32: GRP bridge crossing UK motorway West Mill Bridge, UK
In the right side of figure 32 the West Mill Bridge is shown. The four main supporting beams are constructed of four ASSET profiles glued together. The profiles are GFRP, glass fiber reinforced polymer. The bending stiffness was increased by adding CFRP, carbon fiber reinforced polymers to the top and bottom flanges. On top of that, ASSET profiles are spanned transversely. The bridge was fabricated at a temporary site and was lifted into position in under 30 minutes. This ASSET bridge project was founded by the European Commission. Before building the bridge, the issues concerning joining the different parts of the bridge deck together were discussed thoroughly. The predominant idea at the beginning was to mainly bolt the parts together. Nevertheless, as the project proceeded it became more evident that bonding by gluing would be preferable [8.13].
68
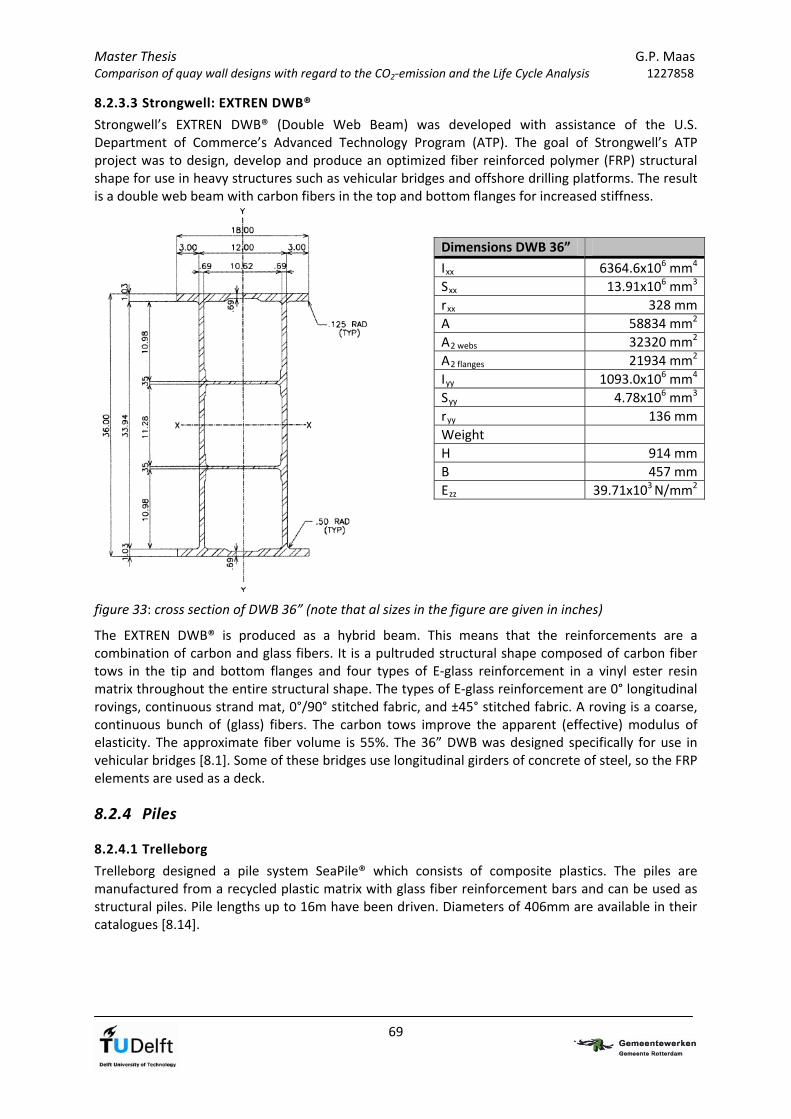
Master Thesis G.P. Maas Comparison of quay wall designs with regard to the CO2‐emission and the Life Cycle Analysis 1227858
8.2.3.3 Strongwell: EXTREN DWB®
Strongwell’s EXTREN DWB® (Double Web Beam) was developed with assistance of the U.S. Department of Commerce’s Advanced Technology Program (ATP). The goal of Strongwell’s ATP project was to design, develop and produce an optimized fiber reinforced polymer (FRP) structural shape for use in heavy structures such as vehicular bridges and offshore drilling platforms. The result is a double web beam with carbon fibers in the top and bottom flanges for increased stiffness.
Dimensions DWB 36”
Ixx 6364.6x106 mm4
Sxx 13.91x106 mm3
rxx 328 mm
A 58834 mm2
A2 webs 32320 mm2
A2 flanges 21934 mm2
Iyy 1093.0x106 mm4
Syy 4.78x106 mm3
ryy 136 mm
Weight
H 914 mm
B 457 mm
Ezz 39.71x10³ N/mm2
figure 33: cross section of DWB 36” (note that al sizes in the figure are given in inches)
The EXTREN DWB® is produced as a hybrid beam. This means that the reinforcements are a combination of carbon and glass fibers. It is a pultruded structural shape composed of carbon fiber tows in the tip and bottom flanges and four types of E‐glass reinforcement in a vinyl ester resin matrix throughout the entire structural shape. The types of E‐glass reinforcement are 0° longitudinal rovings, continuous strand mat, 0°/90° stitched fabric, and ±45° stitched fabric. A roving is a coarse, continuous bunch of (glass) fibers. The carbon tows improve the apparent (effective) modulus of elasticity. The approximate fiber volume is 55%. The 36” DWB was designed specifically for use in vehicular bridges [8.1]. Some of these bridges use longitudinal girders of concrete of steel, so the FRP elements are used as a deck.
8.2.4 Piles
8.2.4.1 Trelleborg
Trelleborg designed a pile system SeaPile® which consists of composite plastics. The piles are manufactured from a recycled plastic matrix with glass fiber reinforcement bars and can be used as structural piles. Pile lengths up to 16m have been driven. Diameters of 406mm are available in their catalogues [8.14].
69

Master Thesis G.P. Maas Comparison of quay wall designs with regard to the CO2‐emission and the Life Cycle Analysis 1227858
figure 34: SeaPile and SeaTimber by Trelleborg
8.2.4.2 Concrete‐filled FRP pile
Another possibility is a fiber reinforced polymer pile filled with concrete. The FRP shell provides a confinement to the concrete, tensile reinforcement and corrosion protection. The concrete filling provides the compressive load capacity. The piles can be installed either by driving the empty FRP shell and fill it subsequently with concrete. Or it can be filled first and driven after the concrete has cured [8.15].
figure 35: Concrete filled FRP tube
8.2.5 Conclusion Literature shows that a variety of composite structural elements are available. Their use in civil structures is mainly in the construction and renovation of bridges. Most of those bridges are only suitable for light traffic. Some of the pultruded shapes are appropriate for heavy traffic bridges. The Double Web Beam of Strongwell is especially designed for that purpose. A combination of different pultruded shapes linked together (like the ASSET module) can function as the retaining wall of the quay wall. Because almost all applications of composites are bridges, no information about installation with help of drilling can be found. These profiles are not designed for driving, therefore this possibility is doubtful. Attention for this fact is needed in the design. The SeaPiles by Trelleborg can be driven, but it is not known if it is still possible for the great lengths needed for the Euromax quay wall. Concluded can be that FRP elements can be composed entirely in any desired way, depending on the specific requirements. Regarding both the costs and the sustainability, the use of carbon fibers is not a good solution, glass fibers are the better choice. When a design of only composite elements is not possible due to strength and stability, a combination with concrete filled FRP piles can be made. Another option is a FRP wall supported by steel or concrete girders.
70
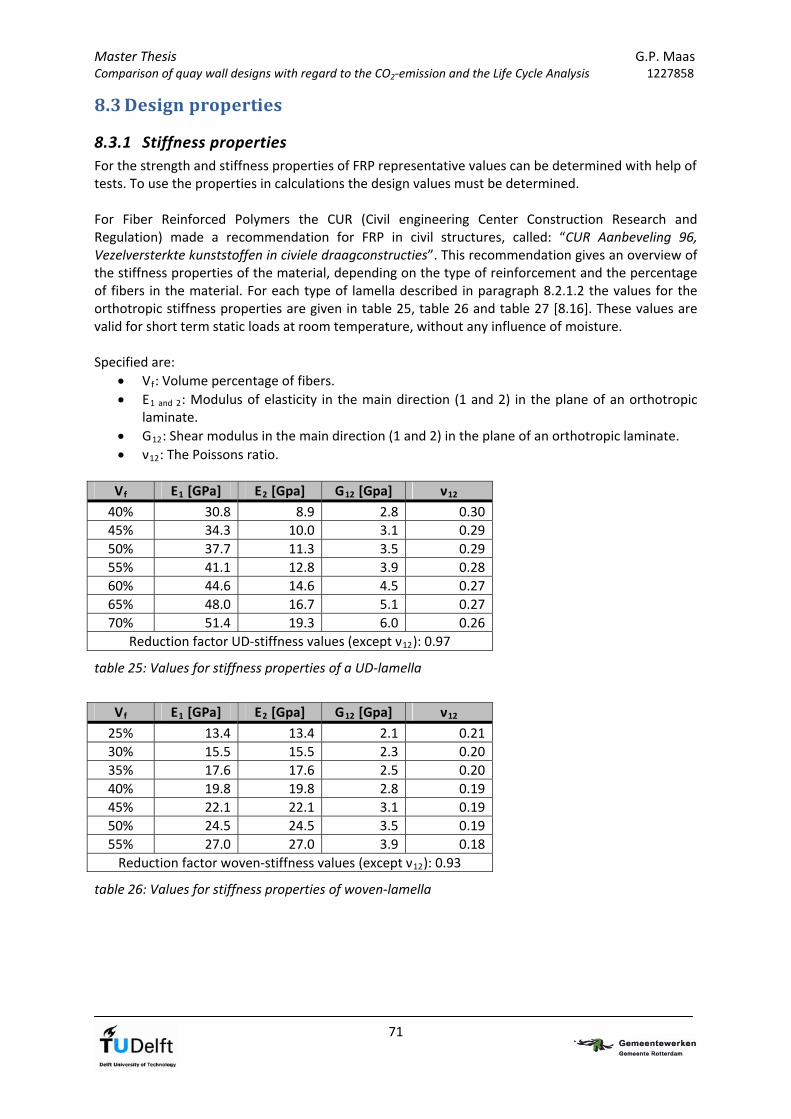
Master Thesis G.P. Maas Comparison of quay wall designs with regard to the CO2‐emission and the Life Cycle Analysis 1227858
71
8.3 Design properties
8.3.1 Stiffness properties For the strength and stiffness properties of FRP representative values can be determined with help of tests. To use the properties in calculations the design values must be determined. For Fiber Reinforced Polymers the CUR (Civil engineering Center Construction Research and Regulation) made a recommendation for FRP in civil structures, called: “CUR Aanbeveling 96, Vezelversterkte kunststoffen in civiele draagconstructies”. This recommendation gives an overview of the stiffness properties of the material, depending on the type of reinforcement and the percentage of fibers in the material. For each type of lamella described in paragraph 8.2.1.2 the values for the orthotropic stiffness properties are given in table 25, table 26 and table 27 [8.16]. These values are valid for short term static loads at room temperature, without any influence of moisture. Specified are:
Vf: Volume percentage of fibers.
E1 and 2: Modulus of elasticity in the main direction (1 and 2) in the plane of an orthotropic laminate.
G12: Shear modulus in the main direction (1 and 2) in the plane of an orthotropic laminate.
ν12: The Poissons ratio.
Vf E1 [GPa] E2 [Gpa] G12 [Gpa] ν12
40% 30.8 8.9 2.8 0.30
45% 34.3 10.0 3.1 0.29
50% 37.7 11.3 3.5 0.29
55% 41.1 12.8 3.9 0.28
60% 44.6 14.6 4.5 0.27
65% 48.0 16.7 5.1 0.27
70% 51.4 19.3 6.0 0.26
Reduction factor UD‐stiffness values (except ν12): 0.97
table 25: Values for stiffness properties of a UD‐lamella
Vf E1 [GPa] E2 [Gpa] G12 [Gpa] ν12
25% 13.4 13.4 2.1 0.21
30% 15.5 15.5 2.3 0.20
35% 17.6 17.6 2.5 0.20
40% 19.8 19.8 2.8 0.19
45% 22.1 22.1 3.1 0.19
50% 24.5 24.5 3.5 0.19
55% 27.0 27.0 3.9 0.18
Reduction factor woven‐stiffness values (except ν12): 0.93
table 26: Values for stiffness properties of woven‐lamella

Master Thesis G.P. Maas Comparison of quay wall designs with regard to the CO2‐emission and the Life Cycle Analysis 1227858
72
Vf E1 [GPa] E2 [Gpa] G12 [Gpa] ν12
10% 6.2 6.2 2.3 0.33
12.5% 6.9 6.9 2.6 0.33
15% 7.6 7.6 2.9 0.33
17.5% 8.3 8.3 3.1 0.33
20% 9.1 9.1 3.4 0.33
25% 10.6 10.6 4.0 0.33
30% 12.2 12.2 4.6 0.33
Reduction factor mat‐stiffness values (except ν12): 0.91
table 27: Values for stiffness properties of mat‐lamella
The tables above show clearly how the properties of the lamella vary in each direction, depending on the composition of the fibers. Furthermore for two types of UD‐lamella the properties based on the 1.2% strain limit are presented. Both an isotropic UD‐laminate with 25% fibers in all directions and an anisotropic laminate with 55% fibers in the 0°‐direction and 15% fibers in the other directions is provided. The total fiber volume of the laminates is 50%. The stiffness and strength properties are shown in table 28 [8.16].
Property [MPa] Quasi‐isotropic laminate Anisotropic laminate
E1 18.600 25.800
E2 18.600 15.900
G12 7000 5.600
ν [‐] 0,33 0,32
σ 223 310
σ 223 310
σ 223 191
σ 223 191
τ 168 134
table 28: Strength and stiffness properties for two types of laminates
For the different types of resins the interlaminar tensile strength and the interlaminar shear strength is given in table 29.
Resin Inter laminar tensile stressILTS [MPa]
Inter laminar shear stress ILSS [MPa]
Polyester 10.0 20
Vinyl ester 12.5 25
Epoxy 15.0 30
table 29: Representative values for shear strength depending on resin

Master Thesis G.P. Maas Comparison of quay wall designs with regard to the CO2‐emission and the Life Cycle Analysis 1227858
8.3.2 Safety factors
8.3.2.1 Introduction
In general a structure or an element of a structure must satisfy the following with respect to its strength and load:
cmf
RS
With: S = Representative load γf = Load factor R = Representative strength of the element or structure γm = Material factor γc = Conversion factor
8.3.2.2 Material factor
The material factor γm for a FRP structure is [8.16]: γm = γm,1 x γm,2 With: γm,1 = 1.35, the partial material factor due to uncertainties in obtaining the right material
properties. γm,2 = the partial material factor due to uncertainties depending on the production method
as shown in table 30. Partial material factor γm,2 Production method Post‐cured laminate Not post‐cured laminate
Spray lay‐up 1.6 1.9
Hand lay‐up 1.4 1.7
Vacuum assisted resin transfer moulding 1.2 1.4
Filament winding 1.1 1.3
Prepreg 1.1 1.3
Pultrusion 1.1 1.3
table 30: Material factors γm,2 depending on the production method.
8.3.2.3 Conversion factor
Depending on the situation of the structure several conversion factor must be used. These factors are comparable with the modification factors of wood. The total conversion factor for the ultimate limit state must be determined with [8.16]:
cfckcvctc
With: ct = factor for temperature effects, is 1,1.
cv = factor for moisture effects, is 1,3 for structures that are permanently exposed to
humid conditions like surface water, ground water or sea water.
ck = factor for creep effects.
cf = factor for fatigue effects, is 1,1.
The conversion factor for creep effects must be taken into account with long term loads (including the dead load) and is determined with:
nck t
With: t = duration of the load in hours
73
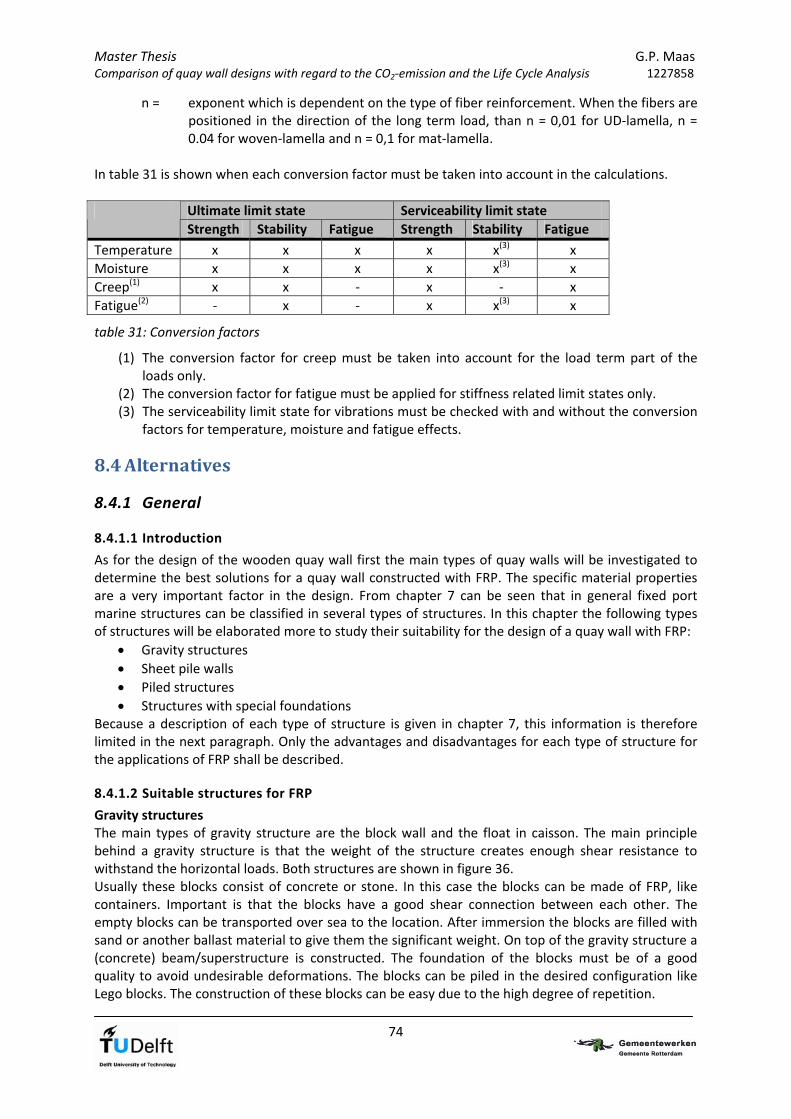
Master Thesis G.P. Maas Comparison of quay wall designs with regard to the CO2‐emission and the Life Cycle Analysis 1227858
74
n = exponent which is dependent on the type of fiber reinforcement. When the fibers are positioned in the direction of the long term load, than n = 0,01 for UD‐lamella, n = 0.04 for woven‐lamella and n = 0,1 for mat‐lamella.
In table 31 is shown when each conversion factor must be taken into account in the calculations.
Ultimate limit state Serviceability limit state
Strength Stability Fatigue Strength Stability Fatigue
Temperature x x x x x(3) x
Moisture x x x x x(3) x
Creep(1) x x ‐ x ‐ x
Fatigue(2) ‐ x ‐ x x(3) x
table 31: Conversion factors
(1) The conversion factor for creep must be taken into account for the load term part of the loads only.
(2) The conversion factor for fatigue must be applied for stiffness related limit states only. (3) The serviceability limit state for vibrations must be checked with and without the conversion
factors for temperature, moisture and fatigue effects.
8.4 Alternatives
8.4.1 General
8.4.1.1 Introduction
As for the design of the wooden quay wall first the main types of quay walls will be investigated to determine the best solutions for a quay wall constructed with FRP. The specific material properties are a very important factor in the design. From chapter 7 can be seen that in general fixed port marine structures can be classified in several types of structures. In this chapter the following types of structures will be elaborated more to study their suitability for the design of a quay wall with FRP:
Gravity structures
Sheet pile walls
Piled structures
Structures with special foundations Because a description of each type of structure is given in chapter 7, this information is therefore limited in the next paragraph. Only the advantages and disadvantages for each type of structure for the applications of FRP shall be described.
8.4.1.2 Suitable structures for FRP
Gravity structures The main types of gravity structure are the block wall and the float in caisson. The main principle behind a gravity structure is that the weight of the structure creates enough shear resistance to withstand the horizontal loads. Both structures are shown in figure 36. Usually these blocks consist of concrete or stone. In this case the blocks can be made of FRP, like containers. Important is that the blocks have a good shear connection between each other. The empty blocks can be transported over sea to the location. After immersion the blocks are filled with sand or another ballast material to give them the significant weight. On top of the gravity structure a (concrete) beam/superstructure is constructed. The foundation of the blocks must be of a good quality to avoid undesirable deformations. The blocks can be piled in the desired configuration like Lego blocks. The construction of these blocks can be easy due to the high degree of repetition.
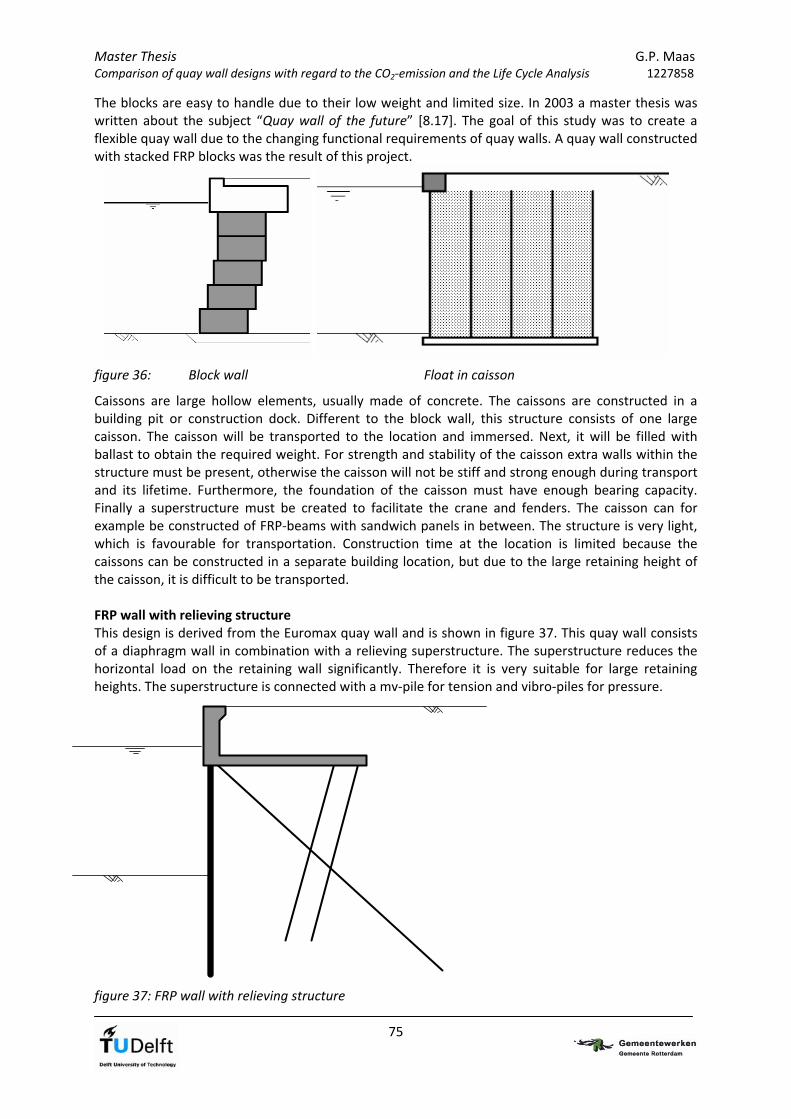
Master Thesis G.P. Maas Comparison of quay wall designs with regard to the CO2‐emission and the Life Cycle Analysis 1227858
The blocks are easy to handle due to their low weight and limited size. In 2003 a master thesis was written about the subject “Quay wall of the future” [8.17]. The goal of this study was to create a flexible quay wall due to the changing functional requirements of quay walls. A quay wall constructed with stacked FRP blocks was the result of this project.
figure 36: Block wall Float in caisson
Caissons are large hollow elements, usually made of concrete. The caissons are constructed in a building pit or construction dock. Different to the block wall, this structure consists of one large caisson. The caisson will be transported to the location and immersed. Next, it will be filled with ballast to obtain the required weight. For strength and stability of the caisson extra walls within the structure must be present, otherwise the caisson will not be stiff and strong enough during transport and its lifetime. Furthermore, the foundation of the caisson must have enough bearing capacity. Finally a superstructure must be created to facilitate the crane and fenders. The caisson can for example be constructed of FRP‐beams with sandwich panels in between. The structure is very light, which is favourable for transportation. Construction time at the location is limited because the caissons can be constructed in a separate building location, but due to the large retaining height of the caisson, it is difficult to be transported. FRP wall with relieving structure This design is derived from the Euromax quay wall and is shown in figure 37. This quay wall consists of a diaphragm wall in combination with a relieving superstructure. The superstructure reduces the horizontal load on the retaining wall significantly. Therefore it is very suitable for large retaining heights. The superstructure is connected with a mv‐pile for tension and vibro‐piles for pressure.
figure 37: FRP wall with relieving structure
75
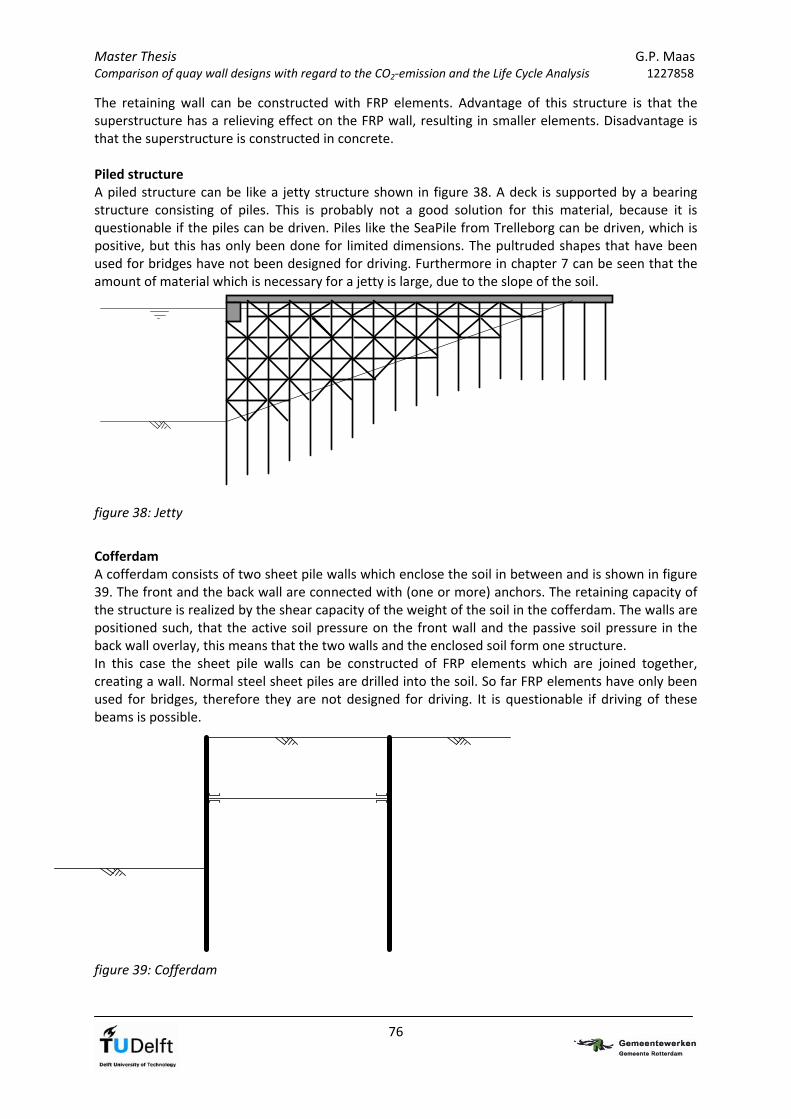
Master Thesis G.P. Maas Comparison of quay wall designs with regard to the CO2‐emission and the Life Cycle Analysis 1227858
The retaining wall can be constructed with FRP elements. Advantage of this structure is that the superstructure has a relieving effect on the FRP wall, resulting in smaller elements. Disadvantage is that the superstructure is constructed in concrete. Piled structure A piled structure can be like a jetty structure shown in figure 38. A deck is supported by a bearing structure consisting of piles. This is probably not a good solution for this material, because it is questionable if the piles can be driven. Piles like the SeaPile from Trelleborg can be driven, which is positive, but this has only been done for limited dimensions. The pultruded shapes that have been used for bridges have not been designed for driving. Furthermore in chapter 7 can be seen that the amount of material which is necessary for a jetty is large, due to the slope of the soil.
figure 38: Jetty
Cofferdam A cofferdam consists of two sheet pile walls which enclose the soil in between and is shown in figure 39. The front and the back wall are connected with (one or more) anchors. The retaining capacity of the structure is realized by the shear capacity of the weight of the soil in the cofferdam. The walls are positioned such, that the active soil pressure on the front wall and the passive soil pressure in the back wall overlay, this means that the two walls and the enclosed soil form one structure. In this case the sheet pile walls can be constructed of FRP elements which are joined together, creating a wall. Normal steel sheet piles are drilled into the soil. So far FRP elements have only been used for bridges, therefore they are not designed for driving. It is questionable if driving of these beams is possible.
figure 39: Cofferdam
76
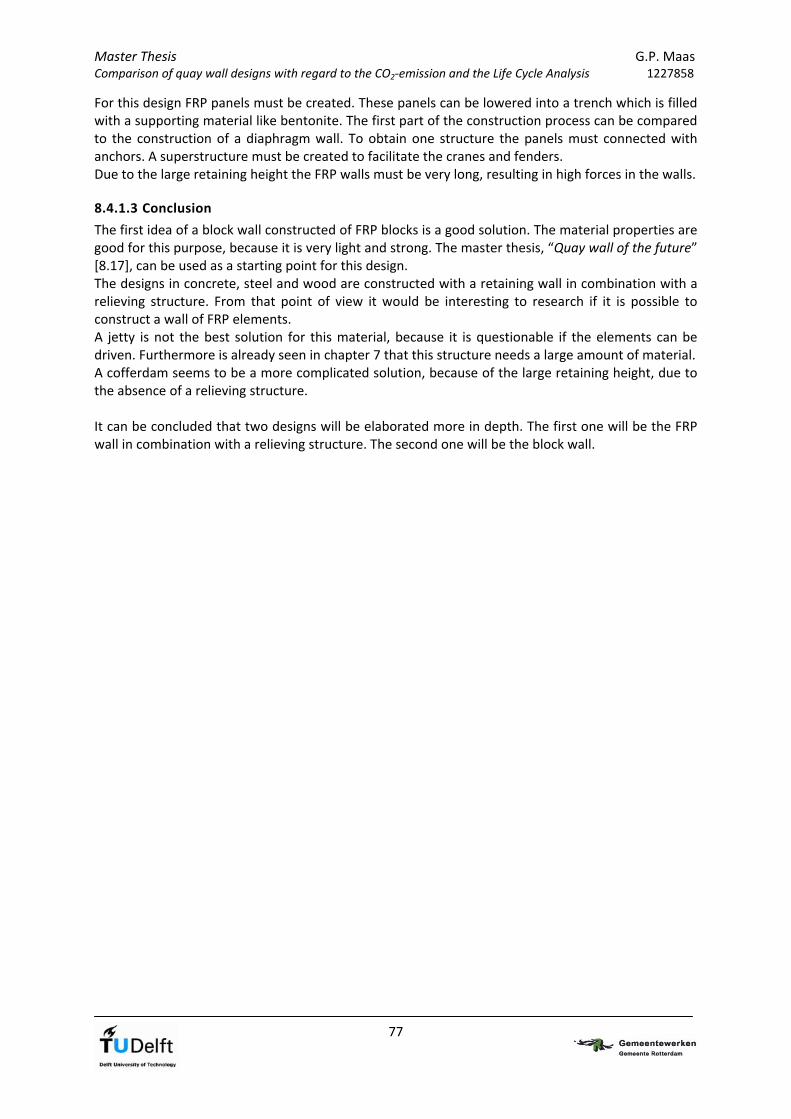
Master Thesis G.P. Maas Comparison of quay wall designs with regard to the CO2‐emission and the Life Cycle Analysis 1227858
77
For this design FRP panels must be created. These panels can be lowered into a trench which is filled with a supporting material like bentonite. The first part of the construction process can be compared to the construction of a diaphragm wall. To obtain one structure the panels must connected with anchors. A superstructure must be created to facilitate the cranes and fenders. Due to the large retaining height the FRP walls must be very long, resulting in high forces in the walls.
8.4.1.3 Conclusion
The first idea of a block wall constructed of FRP blocks is a good solution. The material properties are good for this purpose, because it is very light and strong. The master thesis, “Quay wall of the future” [8.17], can be used as a starting point for this design. The designs in concrete, steel and wood are constructed with a retaining wall in combination with a relieving structure. From that point of view it would be interesting to research if it is possible to construct a wall of FRP elements. A jetty is not the best solution for this material, because it is questionable if the elements can be driven. Furthermore is already seen in chapter 7 that this structure needs a large amount of material. A cofferdam seems to be a more complicated solution, because of the large retaining height, due to the absence of a relieving structure. It can be concluded that two designs will be elaborated more in depth. The first one will be the FRP wall in combination with a relieving structure. The second one will be the block wall.

Master Thesis G.P. Maas Comparison of quay wall designs with regard to the CO2‐emission and the Life Cycle Analysis 1227858
8.4.2 FRP wall
8.4.2.1 Overview of structure
The quay wall will be constructed in the same way as the Euromax quay wall and is shown in figure 40. The retaining wall will be composed of Fiber Reinforced Polymer. First some rough calculations will be done to find out what is the best solution.
figure 40: Quay wall with FRP wall and relieving structure
8.4.2.2 General
The first idea was to create a wall with help of the available profiles developed by the companies Strongwell and Fiberline. The elements can be linked together to create panels with the required properties. The thesis “Applications of composites in bridge decks” [8.11] gave a good impression on the composition of a sandwich panel used for bridge decks by FiberCore. The advantage of a sandwich panel is that it can be constructed in any desired way, specific for each project. From that point of view it is decided to create a sandwich panel with a vinyl ester resin and glass fibers, because they have the best mechanical properties in relation to the costs for this purpose. From the calculations of the wooden wall in chapter 7 the required bending stiffness is roughly known. This will be again the starting point for the design. The bending stiffness EI of the concrete diaphragm wall found in reports [8.18] is: EI = 1,868x106 kNm2/m.
8.4.2.3 Loads
The loads are identical to the loads acting on the wooden wall: 1. Dead load of the structure 2. Soil and water pressure 3. Field loads above relieving floor 4. Field loads behind relieving floor 5. Crane load vertical in operation 6. Crane load horizontal in operation 7. Crane load vertical in storm 8. Crane load horizontal in storm 9. Bollard loads 10. Fender loads 11. Accidental loads: 2 x fender load
78
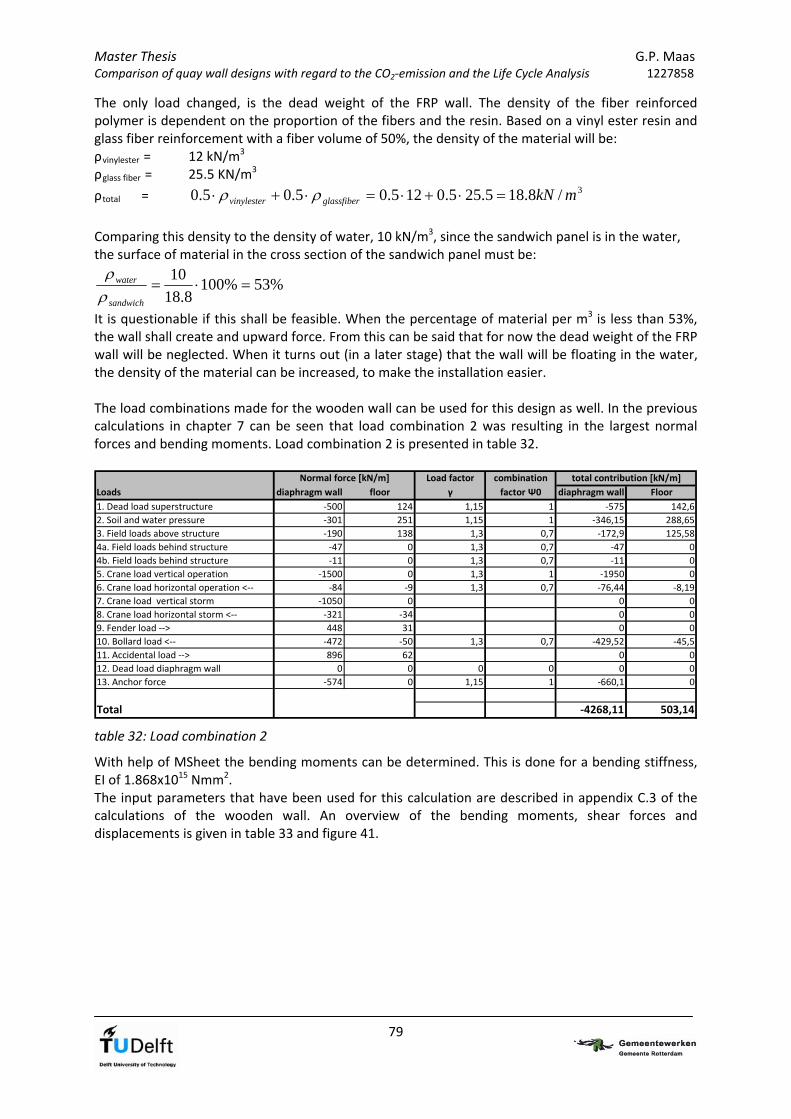
Master Thesis G.P. Maas Comparison of quay wall designs with regard to the CO2‐emission and the Life Cycle Analysis 1227858
The only load changed, is the dead weight of the FRP wall. The density of the fiber reinforced polymer is dependent on the proportion of the fibers and the resin. Based on a vinyl ester resin and glass fiber reinforcement with a fiber volume of 50%, the density of the material will be: ρvinylester = 12 kN/m3
ρglass fiber = 25.5 KN/m3
ρtotal = 3/8.185.255.0125.05.05.0 mkNglassfibervinylester Comparing this density to the density of water, 10 kN/m3, since the sandwich panel is in the water, the surface of material in the cross section of the sandwich panel must be:
%53%1008.18
10
sandwich
water
It is questionable if this shall be feasible. When the percentage of material per m3 is less than 53%, the wall shall create and upward force. From this can be said that for now the dead weight of the FRP wall will be neglected. When it turns out (in a later stage) that the wall will be floating in the water, the density of the material can be increased, to make the installation easier. The load combinations made for the wooden wall can be used for this design as well. In the previous calculations in chapter 7 can be seen that load combination 2 was resulting in the largest normal forces and bending moments. Load combination 2 is presented in table 32.
Load factor combination
Loads diaphragm wall floor γ factor Ψ0 diaphragm wall Floor
1. Dead load superstructure ‐500 124 1,15 1 ‐575 142,6
2. Soil and water pressure ‐301 251 1,15 1 ‐346,15 288,65
3. Field loads above structure ‐190 138 1,3 0,7 ‐172,9 125,58
4a. Field loads behind structure ‐47 0 1,3 0,7 ‐47 0
4b. Field loads behind structure ‐11 0 1,3 0,7 ‐11 0
5. Crane load vertical operation ‐1500 0 1,3 1 ‐1950 0
6. Crane load horizontal operation <‐‐ ‐84 ‐9 1,3 0,7 ‐76,44 ‐8,19
7. Crane load vertical storm ‐1050 0 0 0
8. Crane load horizontal storm <‐‐ ‐321 ‐34 0 0
9. Fender load ‐‐> 448 31 0 0
10. Bollard load <‐‐ ‐472 ‐50 1,3 0,7 ‐429,52 ‐45,5
11. Accidental load ‐‐> 896 62 0 0
12. Dead load diaphragm wall 0 0 0 0 0
13. Anchor force ‐574 0 1,15 1 ‐660,1 0
Total ‐4268,11 503,14
Normal force [kN/m] total contribution [kN/m]
0
table 32: Load combination 2
With help of MSheet the bending moments can be determined. This is done for a bending stiffness, EI of 1.868x10¹⁵ Nmm2. The input parameters that have been used for this calculation are described in appendix C.3 of the calculations of the wooden wall. An overview of the bending moments, shear forces and displacements is given in table 33 and figure 41.
79
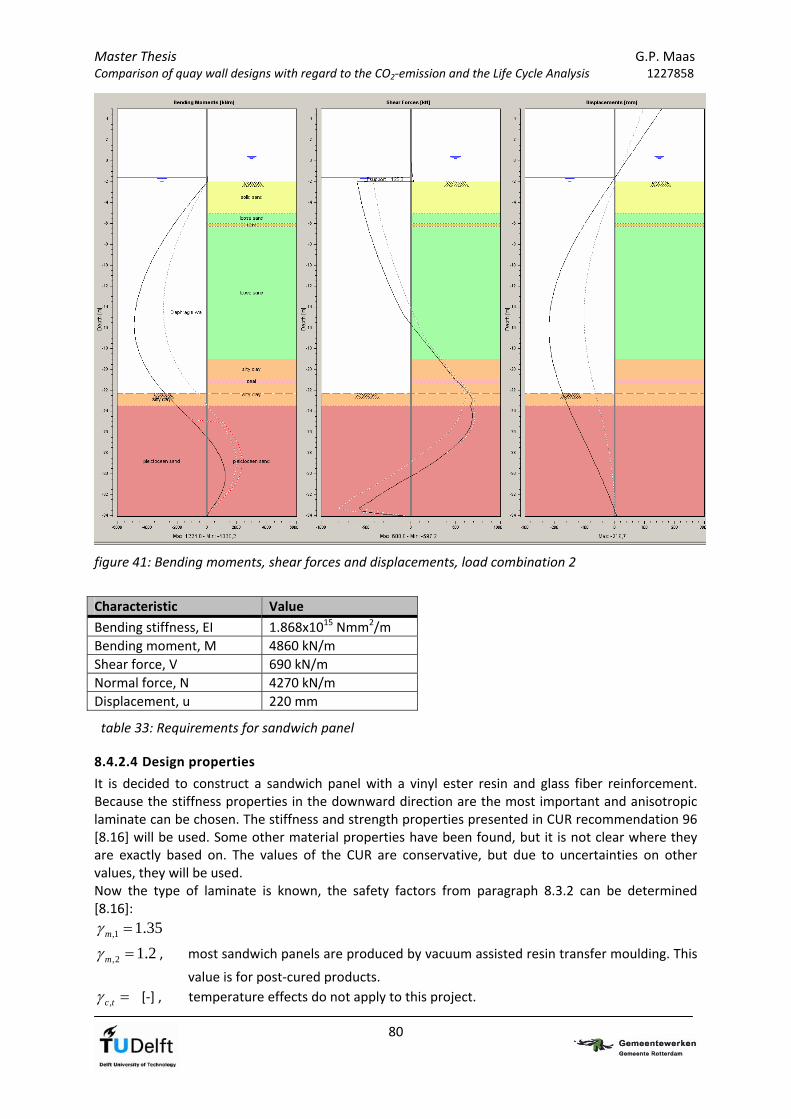
Master Thesis G.P. Maas Comparison of quay wall designs with regard to the CO2‐emission and the Life Cycle Analysis 1227858
figure 41: Bending moments, shear forces and displacements, load combination 2
Characteristic Value
Bending stiffness, EI 1.868x10¹⁵ Nmm2/m
Bending moment, M 4860 kN/m
Shear force, V 690 kN/m
Normal force, N 4270 kN/m
Displacement, u 220 mm
table 33: Requirements for sandwich panel
8.4.2.4 Design properties
It is decided to construct a sandwich panel with a vinyl ester resin and glass fiber reinforcement. Because the stiffness properties in the downward direction are the most important and anisotropic laminate can be chosen. The stiffness and strength properties presented in CUR recommendation 96 [8.16] will be used. Some other material properties have been found, but it is not clear where they are exactly based on. The values of the CUR are conservative, but due to uncertainties on other values, they will be used. Now the type of laminate is known, the safety factors from paragraph 8.3.2 can be determined [8.16]:
35.11, m
2.12, m , most sandwich panels are produced by vacuum assisted resin transfer moulding. This
value is for post‐cured products.
tc, [‐] , temperature effects do not apply to this project.
80
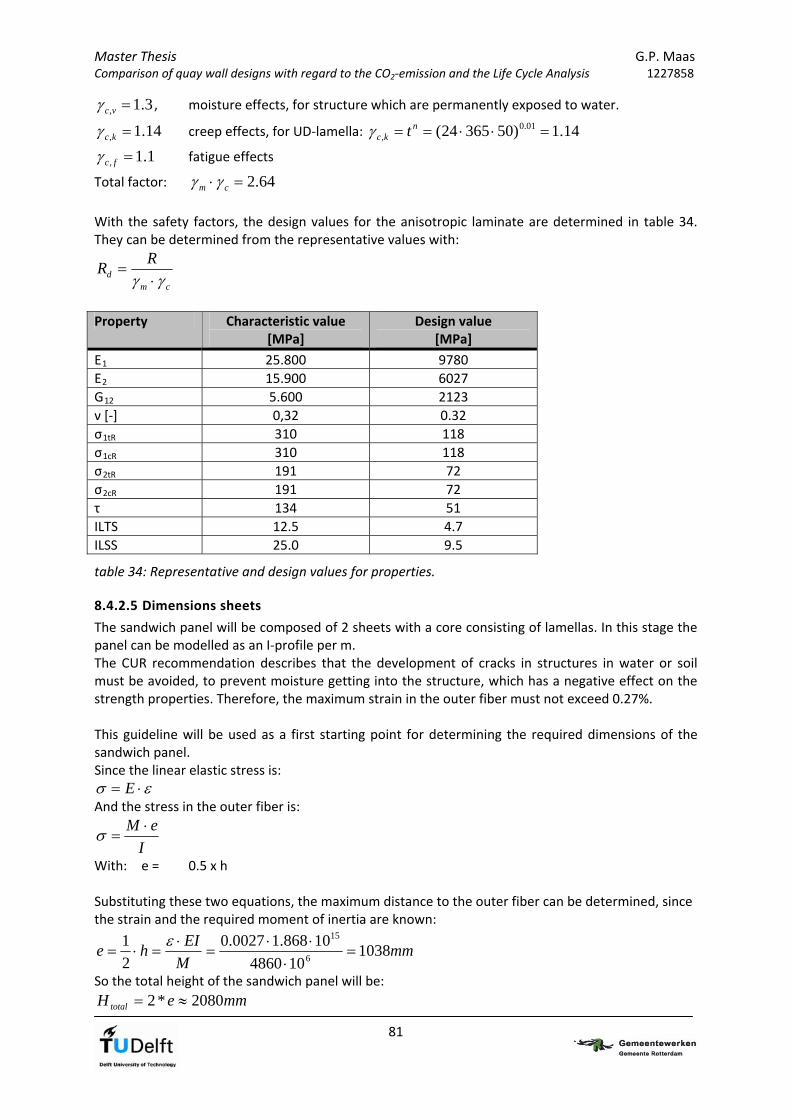
Master Thesis G.P. Maas Comparison of quay wall designs with regard to the CO2‐emission and the Life Cycle Analysis 1227858
3.1, vc , moisture effects, for structure which are permanently exposed to water.
14.1, kc creep effects, for UD‐lamella: 14.1)5036524( 01.0, nkc t
1.1, fc fatigue effects
Total factor: 64.2 cm
With the safety factors, the design values for the anisotropic laminate are determined in table 34. They can be determined from the representative values with:
cmd
RR
Property Characteristic value [MPa]
Design value [MPa]
E1 25.800 9780
E2 15.900 6027
G12 5.600 2123
ν [‐] 0,32 0.32
σ1tR 310 118
σ1cR 310 118
σ2tR 191 72
σ2cR 191 72
τ 134 51
ILTS 12.5 4.7
ILSS 25.0 9.5
table 34: Representative and design values for properties.
8.4.2.5 Dimensions sheets
The sandwich panel will be composed of 2 sheets with a core consisting of lamellas. In this stage the panel can be modelled as an I‐profile per m. The CUR recommendation describes that the development of cracks in structures in water or soil must be avoided, to prevent moisture getting into the structure, which has a negative effect on the strength properties. Therefore, the maximum strain in the outer fiber must not exceed 0.27%. This guideline will be used as a first starting point for determining the required dimensions of the sandwich panel. Since the linear elastic stress is:
E And the stress in the outer fiber is:
I
eM
With: e = 0.5 x h Substituting these two equations, the maximum distance to the outer fiber can be determined, since the strain and the required moment of inertia are known:
mmM
EIhe 1038
104860
10868.10027.0
2
16
15
So the total height of the sandwich panel will be:
mmeHtotal 2080*2
81
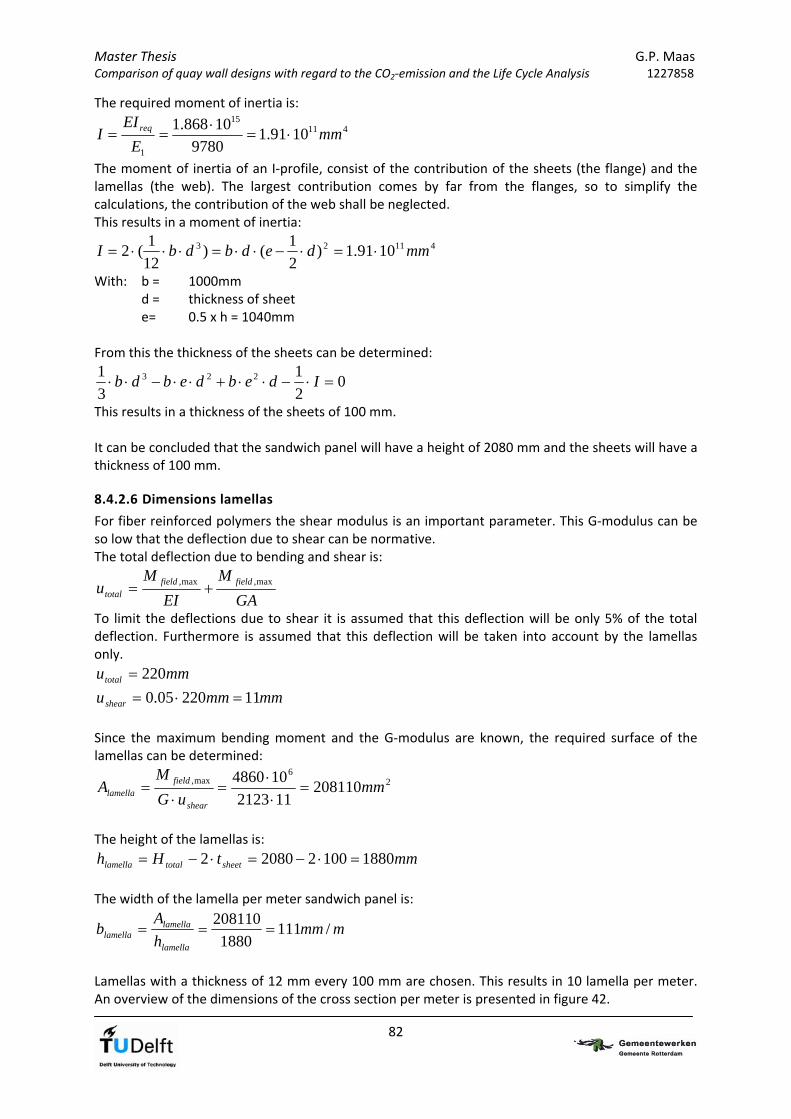
Master Thesis G.P. Maas Comparison of quay wall designs with regard to the CO2‐emission and the Life Cycle Analysis 1227858
The required moment of inertia is:
41115
1
1091.19780
10868.1mm
E
EII req
The moment of inertia of an I‐profile, consist of the contribution of the sheets (the flange) and the lamellas (the web). The largest contribution comes by far from the flanges, so to simplify the calculations, the contribution of the web shall be neglected. This results in a moment of inertia:
41123 1091.1)2
1()
12
1(2 mmdedbdbI
With: b = 1000mm d = thickness of sheet e= 0.5 x h = 1040mm From this the thickness of the sheets can be determined:
02
1
3
1 223 Idebdebdb
This results in a thickness of the sheets of 100 mm. It can be concluded that the sandwich panel will have a height of 2080 mm and the sheets will have a thickness of 100 mm.
8.4.2.6 Dimensions lamellas
For fiber reinforced polymers the shear modulus is an important parameter. This G‐modulus can be so low that the deflection due to shear can be normative. The total deflection due to bending and shear is:
GA
M
EI
Mu fieldfield
totalmax,max,
To limit the deflections due to shear it is assumed that this deflection will be only 5% of the total deflection. Furthermore is assumed that this deflection will be taken into account by the lamellas only.
mmutotal 220
mmmmushear 1122005.0
Since the maximum bending moment and the G‐modulus are known, the required surface of the lamellas can be determined:
26
max, 208110112123
104860mm
uG
MA
shear
fieldlamella
The height of the lamellas is:
mmtHh sheettotallamella 1880100220802
The width of the lamella per meter sandwich panel is:
mmmh
Ab
lamella
lamellalamella /111
1880
208110
Lamellas with a thickness of 12 mm every 100 mm are chosen. This results in 10 lamella per meter. An overview of the dimensions of the cross section per meter is presented in figure 42.
82

Master Thesis G.P. Maas Comparison of quay wall designs with regard to the CO2‐emission and the Life Cycle Analysis 1227858
figure 42: Cross section of sandwich panel per meter.
To avoid buckling of the lamella extra triangle shaped lamella will be applied as well. They will have a length of 200mm and they are shown in figure 43.
figure 43: Top view of sandwich panel detail of triangular lamella
83

Master Thesis G.P. Maas Comparison of quay wall designs with regard to the CO2‐emission and the Life Cycle Analysis 1227858
8.4.2.7 Stresses
The stresses in the top en bottom fibers will be checked. They must be smaller than the maximum allowable tensile and compression stress for the material. The stresses are dependent on the bending moment and the normal force:
A
N
I
eM
The maximum compression stress:
23
11
6
/9.474.215.2610001002
104270
1091.1
1040104860mmN
A
N
I
eM
The maximum allowable compression stress is:
2,,1 /118 mmNdc
It can be concluded that the maximum compression stress is ok. The maximum tensile stress:
23
11
6
/1.54.215.2610001002
104270
1091.1
1040104860mmN
A
N
I
eM
The maximum allowable tensile stress is:
2,,1 /118 mmNdc
It can be concluded that the maximum tensile stress is ok.
8.4.2.8 Shear
The shear force sax per mm length between the lamella and the sheets is dependent on the shear force Vd,max. The sandwich panel is now modelled as an I‐profile with a width of 100 mm, because this is the distance between the lamella. The web of the I‐profile will be one lamella. The shear force can be calculated with:
zz
azax I
SVs
With: sxa = The shear force per mm length between the sheet and the lamella.
Vz = Design value of shear force per 100 mm. Sa = First moment of area of the top sheet per 100 mm. Izz = Moment of inertia sandwich panel per 100 mm.
NVz23 1069010/10690
361095.499010050 mmzASa
4923 10809.9)990100501005012
1(2 mmI zz
This results in the shear force per mm length:
mmNI
SVs
zz
azax /82.34
10809.9
1095.4106909
62
84

Master Thesis G.P. Maas Comparison of quay wall designs with regard to the CO2‐emission and the Life Cycle Analysis 1227858
The shear stress per lamella will be:
2/90.2112
82.34mmN
A
s
lamella
ax
The interlaminaire shear stress is 9.5N/mm2, this means that the shear stress is ok.
8.4.2.9 Buckling
For the sandwich panel different types of buckling can be distinguished:
Buckling of the total sandwich panel.
Buckling of a single sheet (flange).
Buckling of the lamellas (webs). Buckling of total sandwich panel The maximum buckling force can be determined with the Euler buckling force:
kNkNl
EIF
k
k3
2
152
2
2
105.2929498000.25
10868.1
With: lk = The buckling length, is estimated at 25.0m, because this is the length between the locations where the bending moment is zero, which simulates a simply supported beam.
The maximum normal force in the sandwich panel is, N = 4270kN, therefore buckling of the entire sandwich panel will not happen. Buckling of single sheet Taking into account that the buckling length of the sheets is reduced significantly by the triangular lamellas. The buckling length is now maximum 200mm, this results in a buckling force:
kNl
EIF
k
k6
2
152
2
2
10460200
10868.1
The normal force in one sheet is maximum 0.5 x N = 2135 kN This means that buckling of a single sheet will not occur. Buckling of lamella The buckling force of each triangular lamella will be checked. The moment of inertia of a triangle is:
463333 100.36013036
188200
36
1
36
1
36
1mmhbhbI ininoutouttriangle
figure 44: Dimensions triangular lamella
85
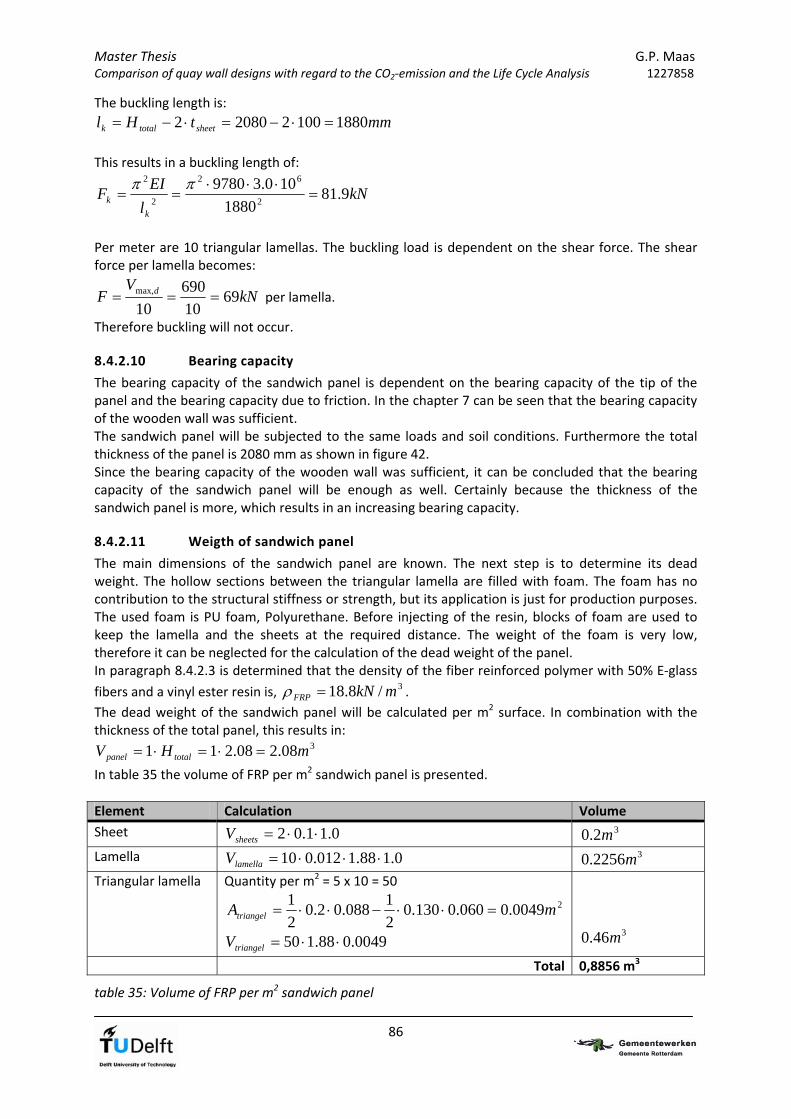
Master Thesis G.P. Maas Comparison of quay wall designs with regard to the CO2‐emission and the Life Cycle Analysis 1227858
The buckling length is:
mmtHl sheettotalk 1880100220802
This results in a buckling length of:
kNl
EIF
k
k 9.811880
100.397802
62
2
2
Per meter are 10 triangular lamellas. The buckling load is dependent on the shear force. The shear force per lamella becomes:
kNV
F d 6910
690
10max, per lamella.
Therefore buckling will not occur.
8.4.2.10 Bearing capacity
The bearing capacity of the sandwich panel is dependent on the bearing capacity of the tip of the panel and the bearing capacity due to friction. In the chapter 7 can be seen that the bearing capacity of the wooden wall was sufficient. The sandwich panel will be subjected to the same loads and soil conditions. Furthermore the total thickness of the panel is 2080 mm as shown in figure 42. Since the bearing capacity of the wooden wall was sufficient, it can be concluded that the bearing capacity of the sandwich panel will be enough as well. Certainly because the thickness of the sandwich panel is more, which results in an increasing bearing capacity.
8.4.2.11 Weigth of sandwich panel
The main dimensions of the sandwich panel are known. The next step is to determine its dead weight. The hollow sections between the triangular lamella are filled with foam. The foam has no contribution to the structural stiffness or strength, but its application is just for production purposes. The used foam is PU foam, Polyurethane. Before injecting of the resin, blocks of foam are used to keep the lamella and the sheets at the required distance. The weight of the foam is very low, therefore it can be neglected for the calculation of the dead weight of the panel. In paragraph 8.4.2.3 is determined that the density of the fiber reinforced polymer with 50% E‐glass
fibers and a vinyl ester resin is, . 3/8.18 mkNFRP The dead weight of the sandwich panel will be calculated per m2 surface. In combination with the thickness of the total panel, this results in:
308.208.211 mHV totalpanel
In table 35 the volume of FRP per m2 sandwich panel is presented.
Element Calculation Volume
Sheet 0.11.02 sheetsV 32.0 m
Lamella 0.188.1012.010 lamellaV 32256.0 m
Triangular lamella Quantity per m2 = 5 x 10 = 50
20049.0060.0130.02
1088.02.0
2
1mAtriangel
0049.088.150 triangel V
346.0 m
Total 0,8856 m3
table 35: Volume of FRP per m2 sandwich panel
86
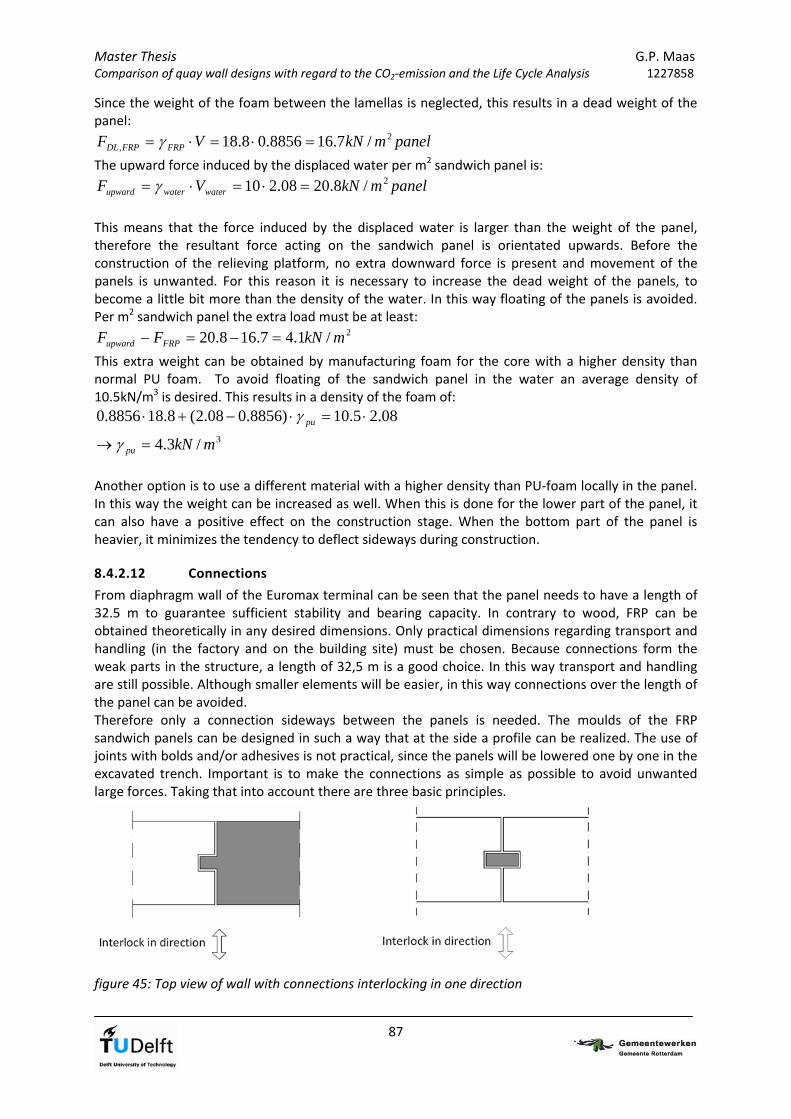
Master Thesis G.P. Maas Comparison of quay wall designs with regard to the CO2‐emission and the Life Cycle Analysis 1227858
Since the weight of the foam between the lamellas is neglected, this results in a dead weight of the panel:
panelmkNVF FRPFRPDL2
, /7.168856.08.18
The upward force induced by the displaced water per m2 sandwich panel is:
panelmkNVF waterwaterupward2/8.2008.210
This means that the force induced by the displaced water is larger than the weight of the panel, therefore the resultant force acting on the sandwich panel is orientated upwards. Before the construction of the relieving platform, no extra downward force is present and movement of the panels is unwanted. For this reason it is necessary to increase the dead weight of the panels, to become a little bit more than the density of the water. In this way floating of the panels is avoided. Per m2 sandwich panel the extra load must be at least:
2/1.47.168.20 mkNFF FRPupward
This extra weight can be obtained by manufacturing foam for the core with a higher density than normal PU foam. To avoid floating of the sandwich panel in the water an average density of 10.5kN/m3 is desired. This results in a density of the foam of:
3/3.4
08.25.10)8856.008.2(8.188856.0
mkNpu
pu
Another option is to use a different material with a higher density than PU‐foam locally in the panel. In this way the weight can be increased as well. When this is done for the lower part of the panel, it can also have a positive effect on the construction stage. When the bottom part of the panel is heavier, it minimizes the tendency to deflect sideways during construction.
8.4.2.12 Connections
From diaphragm wall of the Euromax terminal can be seen that the panel needs to have a length of 32.5 m to guarantee sufficient stability and bearing capacity. In contrary to wood, FRP can be obtained theoretically in any desired dimensions. Only practical dimensions regarding transport and handling (in the factory and on the building site) must be chosen. Because connections form the weak parts in the structure, a length of 32,5 m is a good choice. In this way transport and handling are still possible. Although smaller elements will be easier, in this way connections over the length of the panel can be avoided. Therefore only a connection sideways between the panels is needed. The moulds of the FRP sandwich panels can be designed in such a way that at the side a profile can be realized. The use of joints with bolds and/or adhesives is not practical, since the panels will be lowered one by one in the excavated trench. Important is to make the connections as simple as possible to avoid unwanted large forces. Taking that into account there are three basic principles.
figure 45: Top view of wall with connections interlocking in one direction
87

Master Thesis G.P. Maas Comparison of quay wall designs with regard to the CO2‐emission and the Life Cycle Analysis 1227858
In figure 45 two types of connections between the sandwich panels are shown. On the left side of the figure a tongue and groove is presented. On the right side both sides of the panels have a notch and after positioning the panels in the trench, an extra plank can be placed in both notches, creating a connection. Disadvantage of the last method is, that extra structural parts are needed. With this method the panels are still able to deflect side ways, but this is avoided when the panel next to it is in position as well.
figure 46: Top view of wall with connection interlocking in two directions
In figure 46 a more complex solution for the connection is shown. This connection functions during positioning as a guiding profile which prevents the panel from deflecting sideways as well. It is questionable if this is necessary. A big disadvantage of this connection is the complexity, resulting in high forces in small structural parts. In the above sketches can be seen that the solution in the left part of figure 45 is the best solution for this problem, since it is simple, as will be the distribution of the forces in the connection. From this idea several shapes can be evaluated as shown in figure 47.
figure 47:Top view of alternatives for simple tongue and groove connections
The connection creates a location in the wall where sand particles are able to move out of the sand body. This process must be avoided. On the other hand it is favourable if water pressure in the pores, induced by fluctuations in the water level can decrease. This can be obtained by applying a filter. The filter must be permeable for water, but impermeable for sand particles.
8.4.2.13 Constructability
The construction of the quay wall can be established in several steps, dependent on the building method. Like the construction of the wooden wall in chapter 7 the main two building methods are:
Making use of an open building pit.
Constructing the wall with a trench like the first stages of the construction of a concrete diaphragm wall.
As the open building pit needs to be very deep, at least down to NAP‐32.0m, it would be easier to make use of a trench in which the sandwich panels can be lowered. Taking the above into account as a starting point, the construction of the quay wall will have several stages:
First the sandwich panels need to be constructed. This can be done in a separate factory where the climate and the quality of the production can be controlled. In the core of the
88
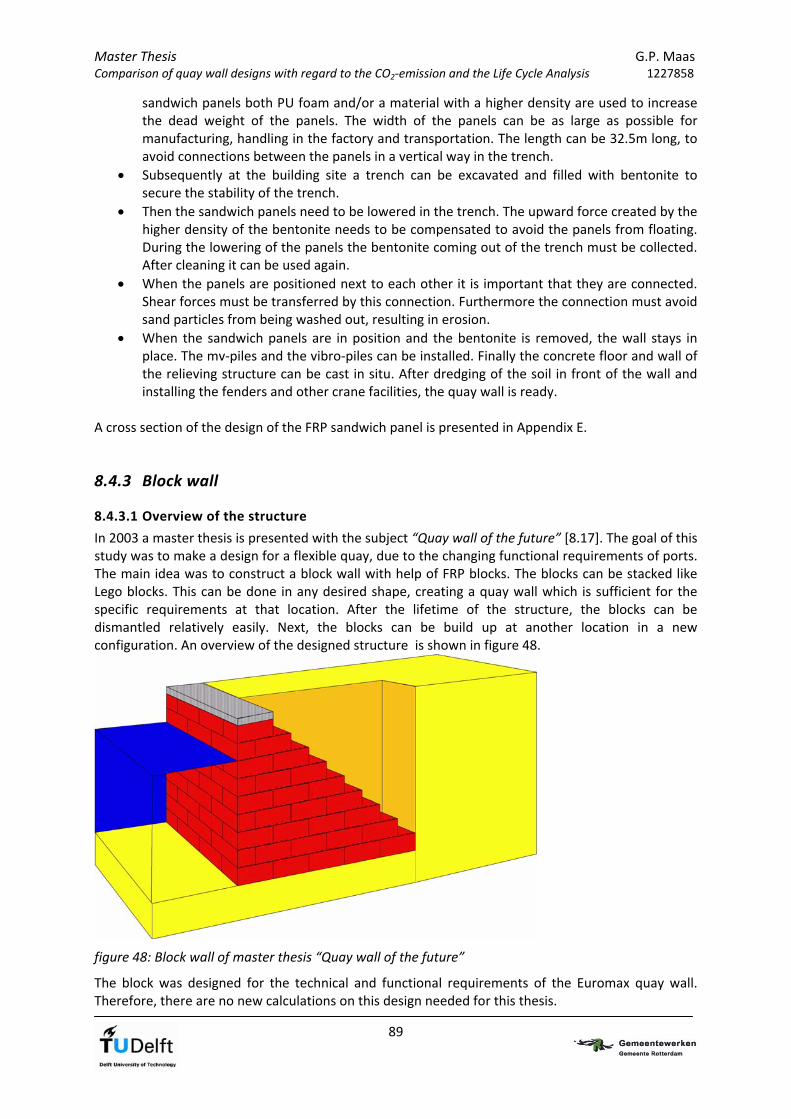
Master Thesis G.P. Maas Comparison of quay wall designs with regard to the CO2‐emission and the Life Cycle Analysis 1227858
sandwich panels both PU foam and/or a material with a higher density are used to increase the dead weight of the panels. The width of the panels can be as large as possible for manufacturing, handling in the factory and transportation. The length can be 32.5m long, to avoid connections between the panels in a vertical way in the trench.
Subsequently at the building site a trench can be excavated and filled with bentonite to secure the stability of the trench.
Then the sandwich panels need to be lowered in the trench. The upward force created by the higher density of the bentonite needs to be compensated to avoid the panels from floating. During the lowering of the panels the bentonite coming out of the trench must be collected. After cleaning it can be used again.
When the panels are positioned next to each other it is important that they are connected. Shear forces must be transferred by this connection. Furthermore the connection must avoid sand particles from being washed out, resulting in erosion.
When the sandwich panels are in position and the bentonite is removed, the wall stays in place. The mv‐piles and the vibro‐piles can be installed. Finally the concrete floor and wall of the relieving structure can be cast in situ. After dredging of the soil in front of the wall and installing the fenders and other crane facilities, the quay wall is ready.
A cross section of the design of the FRP sandwich panel is presented in Appendix E.
8.4.3 Block wall
8.4.3.1 Overview of the structure
In 2003 a master thesis is presented with the subject “Quay wall of the future” [8.17]. The goal of this study was to make a design for a flexible quay, due to the changing functional requirements of ports. The main idea was to construct a block wall with help of FRP blocks. The blocks can be stacked like Lego blocks. This can be done in any desired shape, creating a quay wall which is sufficient for the specific requirements at that location. After the lifetime of the structure, the blocks can be dismantled relatively easily. Next, the blocks can be build up at another location in a new configuration. An overview of the designed structure is shown in figure 48.
figure 48: Block wall of master thesis “Quay wall of the future”
The block was designed for the technical and functional requirements of the Euromax quay wall. Therefore, there are no new calculations on this design needed for this thesis.
89

Master Thesis G.P. Maas Comparison of quay wall designs with regard to the CO2‐emission and the Life Cycle Analysis 1227858
8.4.3.2 Dimensions of blocks
In the thesis “Quay wall of the future” [18], the dimensions of a block were determined to be 5500 mm x 2750 mm x 3000 mm as shown in figure 49.
figure 49: Cross sections of block top view of block
With a configuration of the blocks as shown in figure 48, 9.8 blocks per running meter are needed. Each block is constructed with 7.54 m3 fiber reinforced polymer composed of an epoxy resin with 50% glass fibers. This results in 73.9 m3 FRP per meter quay wall.
8.4.3.3 Costs
For the block wall a cost estimation is made in 2003. This rough cost estimation resulted in €670.000,‐ per meter quay wall. So for 5,0m this results in €3.350.000,‐.
8.5 Comparison of designs
8.5.1 Introduction Goal of this thesis was to compare quay walls in four different materials. In the previous chapter two designs for a wooden quay wall were presented. Subsequently several criteria were used to compare them:
Quantity of material.
Experience in execution of the structure.
Risks during construction.
Durability.
Sustainability.
Maintenance.
Robustness. As can be seen in the previous chapters 5, 6 and 7, the designs in concrete, steel as well as wood are composed of a wall in combination with a concrete superstructure with steel and concrete foundation piles. So for the Life Cycle Analysys of chapter 11, the design with the sandwich panel is the best comparable, since it has the same shape as the designs of the other materials. To be complete the quantities per material shall be determined for the sandwich panel and the block wall.
90

Master Thesis G.P. Maas Comparison of quay wall designs with regard to the CO2‐emission and the Life Cycle Analysis 1227858
8.5.2 Quantity of material
8.5.2.1 Sandwich panel
The quantities of the materials that are needed to construct the quay wall with help of an FRP sandwich panel are summarized in table 36. Material Section Calculation Quantity
FRP Sandwich panel Vxbxl
5.320.58856.0
144 m3
(PU) foam in panel Vxbxl
5.320.5)8856.008.2(
194 m3
Concrete Floor Hxbxl
1655.1
120 m3
Wall Hxbxl
575.2
88 m3
Vibro‐piles AxLxLsystem
4.1
0.53056.0
4
1 2
26.4 m3
Total: 234 m3
Steel Mv – piles AxLxLsystem
6.5
0.553022.0
1.04 m3
S355
Reinforcement Floor: V x ω0
015.0120
1.8 m3
FeB500
Wall: V x ω0
015.088
1.32 m3
FeB500
Vibro piles: V x ω0
015.04.26
0.40 m3
FeB500
Total: 4.56 m3
Bentonite Assume 3x reuse 113 m3
table 36: Material quantities sandwich panel with relieving structure per 5.0m
8.5.2.2 Block wall
The same can be done for the quantity of material used for the block wall as shown in table 37.
Material Section Calculation Quantity
FRP Blocks Number x V x b 9.8 x 7.54 x 5
369.5 m3
table 37: Material quantities block wall per 5.0m
8.5.3 Conclusion A choice must be made between the two designs with FRP. The first is a sandwich panel in combination with a relieving structure, the second the block wall. As been said before, the designs in concrete, steel and wood, consists of a retaining wall in combination with a superstructure. So for the comparison of CO2, that will be done in chapter 11, the design with the FRP sandwich panel will be chosen, because it has the same ‘shape’ as the other designs.
91

Master Thesis G.P. Maas Comparison of quay wall designs with regard to the CO2‐emission and the Life Cycle Analysis 1227858
92
8.6 References [8.1] Strongwell, “EXTREN DWB®Design Guide”, 2003, p8, www.strongwell.com [8.2] C.E. Bakis et al., Paper: “Fiber‐Reinforced Polymer Composites for construction – State of the
art review”, 2002. [8.3] Dr. M.H. Kolstein, Reader “Fibre Reinforced Polymer (FRP) Structures, ct5128”, feb 2008,
chapter 3. [8.4] CUR recommendation 96, “Vezelversterkte kunstoffen in civiele draagconstructies”, 2003,
chapter 4. [8.5] FiberLine, “FiberLine Design manual”, 2003, p 0.0.6, www.fiberline.com. [8.6] J. Lundgren, Paper: “Moisture absorption in glass‐fiber/epoxy laminates with transverse
matrix cracks”, 1998 [8.7] K.H.G. Ashbee, Paper: “Water damage in glass fiber/resin composites”, 1969. [8.8] L.S. Lee, “The role of FRP composites in a sustainable world”, Editorial of Clean Techn Environ
Policy, 2009 [8.9] Julio F Davalos et al., Paper: “Modeling and characterization of fiber‐reinforced plastic
honeycomb sandwich panels for highway bridge applications”, 2001 [8.10] FiberCore Europe, http://www.fibercore‐europe.com/ [8.11] M. Sayed and W.D. Schutte, thesis Hogeschool Rotterdam, “Toepassing composietmateriaal
in brugconstructies”, 2009 [8.12] www.fiberline.com [8.13] Arvid Hejil et al., Paper: “Large scale hybrid FRP composite girders for use in bridge structures
– theory, test and field application”, 2005. [8.14] Trelleborg, Trelleborg Marine Systems catalogue, Section 6: “Engineered Plastics”, 2008,
www trelleborg.com/marine [8.15] National Composites Network, “Case review – FRP piles”, http://www.ncn‐
uk.co.uk/DesktopDefault.aspx?tabindex=92&tabid=408 [8.16] CUR recommendation 96, “Vezelversterkte kunstoffen in civiele draagconstructies”, 2003,
chapter 6. [8.17] M.P. van Breugel, M.Sc. Thesis, “Kademuur van de toekomst”, March 2003. [8.18] Report O‐R‐015, “Kadeconstructie: berekening diepwand en fundering”, Revisie C, 2005, p.
19.

Ma er Thesis GCom arison of quay wall designs with regard to the CO2‐emission and the Life Cycle Analysis
st .P. Maas p 1227858
93
9 Overview Material Properties and Designs
9.1 Material properties In this thesis several materials have been used to calculate a quay wall. An overview of the representative values of concrete, steel, wood and FRP is given in table 38.
Concrete: B35.
Steel: Combi wall, quality X70. Sheet piles, quality S240.
Wood: Azobé, strength class D70.
FRP: Vinyl ester resin with 50% E‐glass fiber. The fibers are positioned in such a way that an anisotropic material is obtained.
Concrete Steel Wood FRP
Property [N/mm2] B35 X70 S240 D70
Bending strength 70
Density [kg/m3] 2500 7800 7800 1100 1880
E‐modulus, 0° 34.000 210.000 210.000 20.000 25.800
E‐modulus, 90° 34.000 210.000 210.000 1330 15.900
G‐modulus 5.700 81.000 81.000 1250 5600
Compression strength, 0° 35 485 240 34 310
Compression strength, 90° 35 485 240 13,5 191
Tensile strength, 0° 3,2 485 240 42 310
Tensile strength, 90° 3,2 485 240 0,6 191
Shear strength 0,56 280 139 6,0 25
table 38: Summary representative values of materials
9.2 Impressions of four quay wall designs Next impressions of the four quay wall designs will be presented in figure 50 to figure 53.
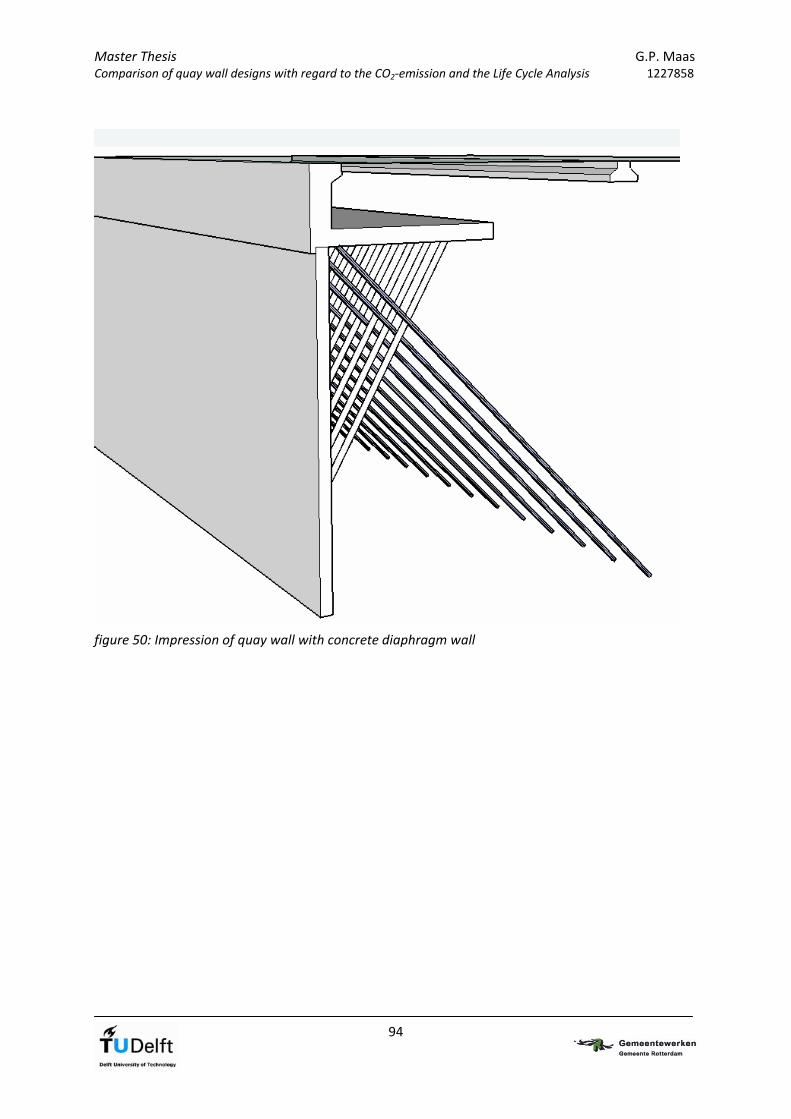
Master Thesis G.P. Maas Comparison of quay wall designs with regard to the CO2‐emission and the Life Cycle Analysis 1227858
figure 50: Impression of quay wall with concrete diaphragm wall
94
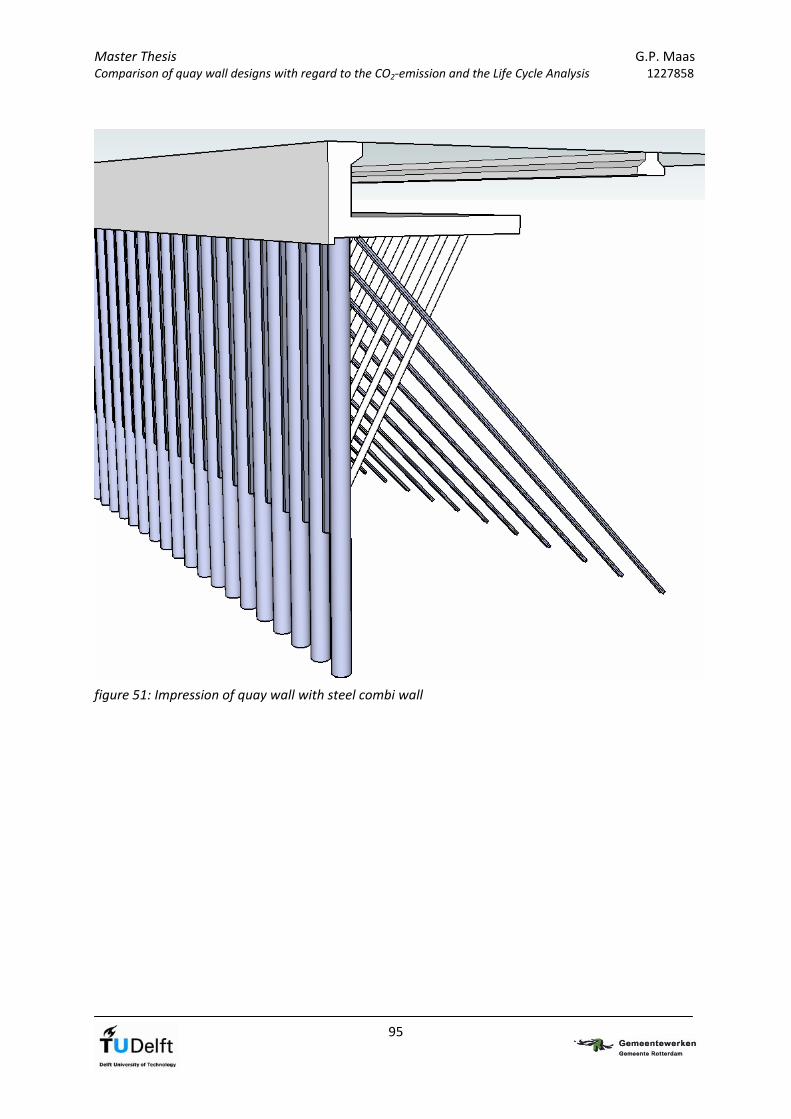
Master Thesis G.P. Maas Comparison of quay wall designs with regard to the CO2‐emission and the Life Cycle Analysis 1227858
figure 51: Impression of quay wall with steel combi wall
95
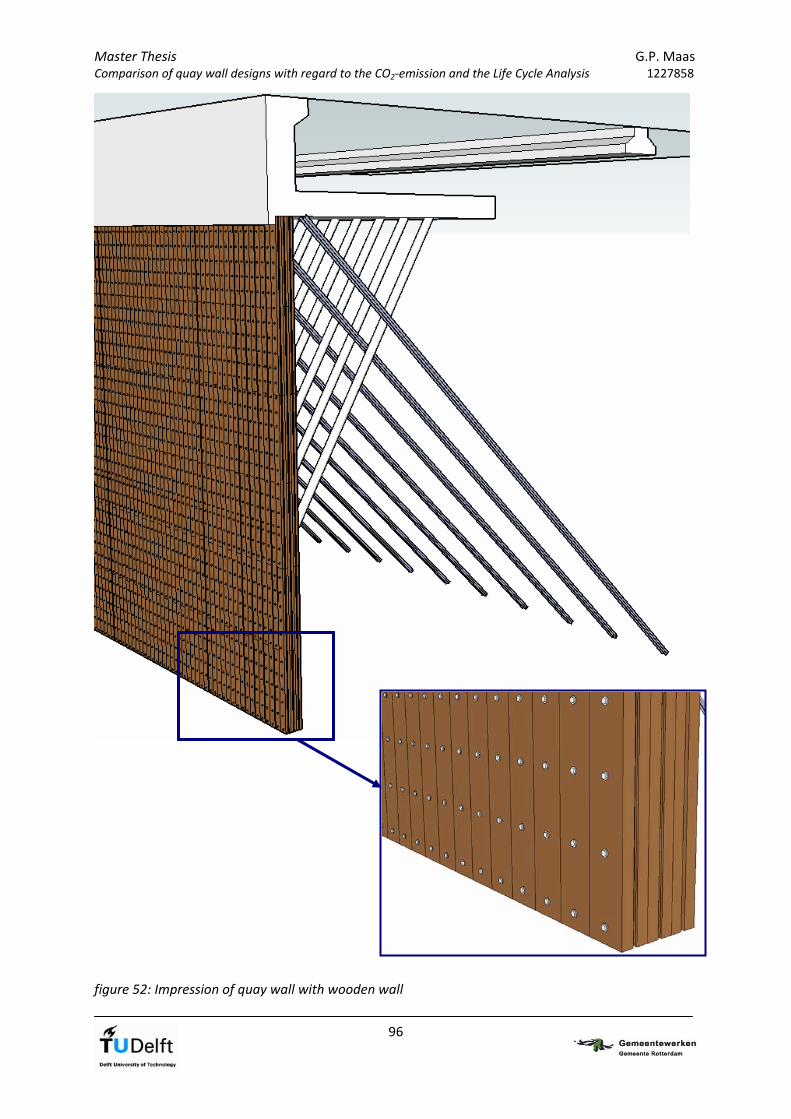
Master Thesis G.P. Maas Comparison of quay wall designs with regard to the CO2‐emission and the Life Cycle Analysis 1227858
figure 52: Impression of quay wall with wooden wall
96

Master Thesis G.P. Maas Comparison of quay wall designs with regard to the CO2‐emission and the Life Cycle Analysis 1227858
figure 53: Impression of quay wall with FRP sandwich panel
97

Master Thesis G.P. Maas Comparison of quay wall designs with regard to the CO2‐emission and the Life Cycle Analysis 1227858
98

Master Thesis Compar son of quay wall designs with regard to the CO
G.P. Maas i 2‐emission and the Life Cycle Analysis 1227858
99
10 Cost estimation
10.1 Introduction The four designs are known and the next step is to make a cost estimation. As shown in figure 11, the configuration of the mv‐ and the vibro‐piles of the steel combi wall design is different from the design with the concrete diaphragm wall. The length of the piles are however all most the same. For that reason the relieving structure will be generalized for all four quay wall designs. So assumed is, that all designs make use of the same relieving structure with bearing and anchor piles. This superstructure is combined with a retaining wall in a different material. Summarizing these retaining walls:
Concrete diaphragm wall of 1.20m
Steel combi wall of tubes and sheet piles
Wooden wall of Azobé, 1.40m
FRP sandwich panel of 2.08m All costs are determined for 1.0m quay wall. Note that this is a rough cost estimation.
10.2 Costs The costs for the superstructure are determined separately in table 39. Subsequently these costs are combined with the costs for each specific retaining wall, resulting in the total costs per design. The values used are based on cost estimations of quay walls made by Public Works Rotterdam.

Master Thesis G.P. Maas Comparison of quay wall designs with regard to the CO2‐emission and the Life Cycle Analysis 1227858
Superstructure: 1,0 mSection Element Description Costs
Building pit Excavation €10,60 per m2
27 x 10,60 = 1431 286,00€
Drainage €6,70 per m2
27 x 6,70 = 905 181,00€
Vibro piles €50,65,‐ per m pile
0,714 piles of 30m
0,714 x 30 x 50,65 = 1085 1.085,00€
MV piles €10334,‐ per pile
0,1786 piles
0,1786 x 10334 = 1845 1.845,00€
Drainage system €100,‐ per m 100,00€
Concrete wall Formwork €73,‐ per m2
7,0 x 73 = 511
5,5 x 73 = 402 912,00€
Reinforcement €1,83 per kg steel
120 kg per m3 concrete
7,0 x 2,5 x 120 x 1,83 = 3843 3.843,00€
Concrete €121,‐ per m3
7,0 x 2,5 x 121 = 2118 2.118,00€
Concrete floor Formwork €72,97 per m2
1,5 x 72,97 = 109 109,00€
Reinforcement €1,83 per kg steel
120 kg per m3 concrete
16 x 1,5 x 120 x 1,83 = 5270 5.270,00€
Concrete €121,‐ per m3
16,0 x 1,5 x 121 = 2904 2.904,00€
Mooring and fender
structures
Bollard €3047,‐ per bollard
2 per 15.0 m, so 0,133 per 1,0 m
0,133 x 3047 = 406 406,00€
Toggle €1092 per toggle
1 per 15,0 m so 0,067 per 1,0 m
0,067 x 1092 = 73 73,00€
Fender €19000,‐ per fender system
1 per 15,0 m so 0,067 per 1,0 m
0,067 x 19000 = 1273 1.273,00€
Stair €1777,‐ per stair
1 per 15,0 m so 0,067 per 1,0 m
0,067 x 1777 = 118 118,00€
Dredging €4,‐ per m3
21,65 x 50 x 4 = 4330 4.330,00€
Scour protection Several layers bottom
protection
€2593,‐ per 1,0 m
2.593,00€
Maintenance Fender €19000,‐ per fender system 1
per 15,0 m so 0,067 per 1,0 m
0,067 x 19000 = 1267 1.267,00€
28.713,00€ Total
table 39: Costs superstructure per 1.0 m
100
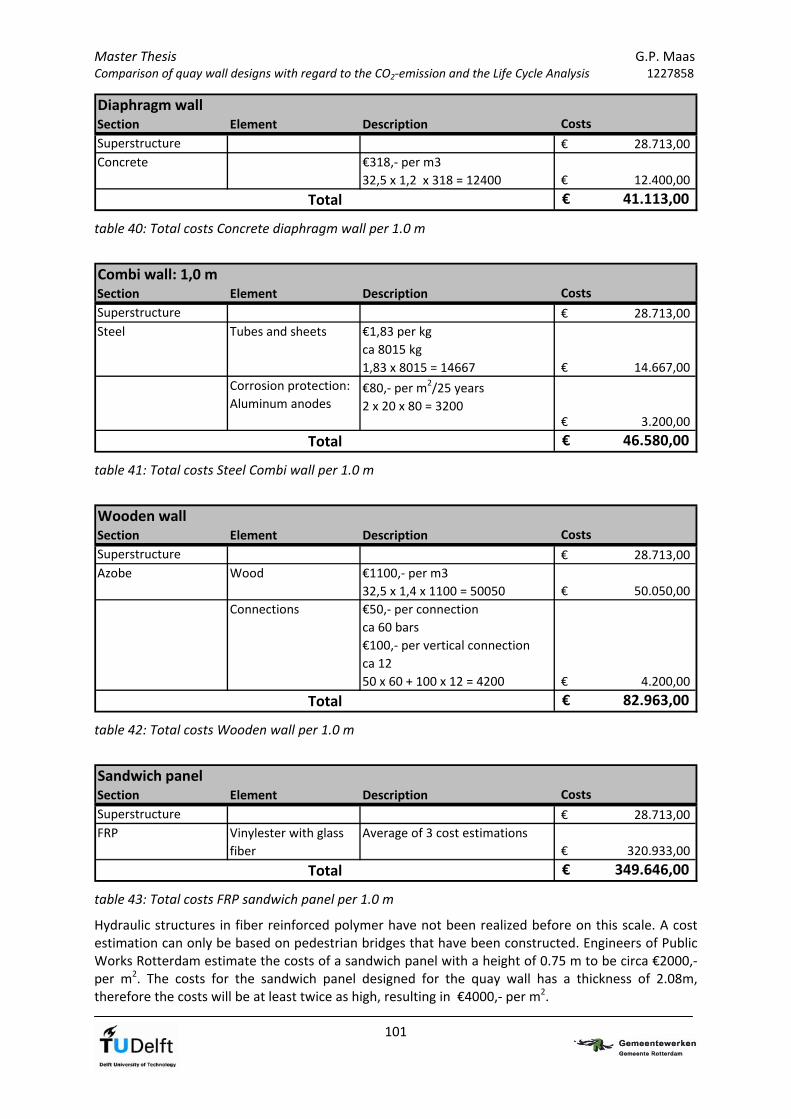
Master Thesis G.P. Maas Comparison of quay wall designs with regard to the CO2‐emission and the Life Cycle Analysis 1227858
Diaphragm wallSection Element Description Costs
Superstructure 28.713,00€
Concrete €318,‐ per m3
32,5 x 1,2 x 318 = 12400 12.400,00€
41.113,00€ Total
table 40: Total costs Concrete diaphragm wall per 1.0 m
Combi wall: 1,0 mSection Element Description Costs
Superstructure 28.713,00€
Steel Tubes and sheets €1,83 per kg
ca 8015 kg
1,83 x 8015 = 14667 14.667,00€
Corrosion protection:
Aluminum anodes€80,‐ per m2/25 years
2 x 20 x 80 = 32003.200,00€
46.580,00€ Total
table 41: Total costs Steel Combi wall per 1.0 m
Wooden wallSection Element Description Costs
Superstructure 28.713,00€
Azobe Wood €1100,‐ per m3
32,5 x 1,4 x 1100 = 50050 50.050,00€
Connections €50,‐ per connection
ca 60 bars
€100,‐ per vertical connection
ca 12
50 x 60 + 100 x 12 = 4200 4.200,00€
82.963,00€ Total
table 42: Total costs Wooden wall per 1.0 m
Sandwich panelSection Element Description Costs
Superstructure 28.713,00€
FRP Vinylester with glass
fiber
Average of 3 cost estimations
320.933,00€
349.646,00€ Total
table 43: Total costs FRP sandwich panel per 1.0 m
Hydraulic structures in fiber reinforced polymer have not been realized before on this scale. A cost estimation can only be based on pedestrian bridges that have been constructed. Engineers of Public Works Rotterdam estimate the costs of a sandwich panel with a height of 0.75 m to be circa €2000,‐ per m2. The costs for the sandwich panel designed for the quay wall has a thickness of 2.08m, therefore the costs will be at least twice as high, resulting in €4000,‐ per m2.
101

Master Thesis G.P. Maas Comparison of quay wall designs with regard to the CO2‐emission and the Life Cycle Analysis 1227858
For 1,0 m quay wall this will be: 32.5 x €4000 = €130.000,‐ Engineers of Lightweight Structures, a company in Delft that specializes in fiber reinforced polymers, advice a price of €5,‐ to €10,‐ per kg material. For 1.0 m quay wall this results in: 55520 kg x €5 = €277600,‐ or 55520 kg x €10 = €555200,‐ The range between the above calculated costs is very large. For this reason the average of these costs will be determined, taking into account that this cost estimation is very rough. The costs for 1.0 m sandwich panel will be: €320933,‐
10.3 Conclusion When comparing the costs it can be seen in figure 54 that the designs in traditional building materials, like concrete and steel have the lowest prizes. Azobé is more than twice as expensive. Hardwood material is expensive and in addition the construction method is complicated. Finally the FRP sandwich panel is very expensive, it differs a factor 8‐10 compared to the concrete structure.
Costs 1,0 m quay wall
€ -
€ 50.000,00
€ 100.000,00
€ 150.000,00
€ 200.000,00
€ 250.000,00
€ 300.000,00
€ 350.000,00
€ 400.000,00
Concrete Steel Wood FRP
Eu
ro Retaining wall
Relieving structure
figure 54: Costs 1.0 m quay wall
102

Master Thesis Compar son of quay wall designs with regard to the CO2‐emission and the Life Cycle A
G.P. Maas i nalysis 1227858
11 CO2 and Life Cycle Analysis
11.1 Introduction The main dimensions of the quay wall in four different materials and the costs are determined, in this chapter the CO2‐emission per structure will be determined. Furthermore a Life Cycle Analysis will be done. First a literature study about these matters will be presented.
11.2 Literature study
11.2.1 Introduction Climate change is a very popular subject. Since Al Gore’s movie, An Inconvenient Truth, everybody is aware of global warming and green is more popular than ever. The main accepted idea is that global warming is induced by the greenhouse effect, but there are also critics who state that the climate has been changing eternally and they do not believe the influence of human behaviour on our climate.
11.2.2 Climate scenario’s
11.2.2.1 Intergovernmental Panel on Climate Change (IPCC)
The Intergovernmental Panel on Climate Change is a scientific body established by the United Nations. Their goal is to provide the world with a clear scientific view on the state of climate change and the consequences. Thousands of scientists from all over the world contribute to the work of the IPCC on a voluntary basis.
figure 55: Changes in atmospheric concentrations of greenhouse gases
103
Master Thesis G.P. Maas Comparison of quay wall designs with regard to the CO2‐emission and the Life Cycle Analysis 1227858
104
IPCC states in their assessment report that the global atmospheric concentrations of carbon dioxide, methane and nitrous oxide have increased markedly as a result of human activities since 1750 as shown in figure 55. The pre‐industrial values are now far exceeded. The global increases in carbon dioxide concentration are primarily due to fossil fuel use and change in land use, while those of methane and nitrous oxide are primarily due to agriculture [11.1].
11.2.2.2 Sceptics
On the other hand a lot of scientists do not agree with the foregoing opinion of the IPCC. Some think that the influence of the sun is much larger than the influence of human behaviour on the climate. Cycles of the sun induce the increase in temperature. Other scientists think that this is just the right time to live on planet earth. Over the years the sea level has fluctuated for hundreds of meters and so has the CO2 content in the atmosphere. Trying to keep them at the same level as it is now is just unrealistic. Besides that, another group thinks that the computer models used to predict the temperature rise due to global warming are not correct and that the temperature changes are caused by normal fluctuations in the climate. Their arguments are strengthened by the fact that measurements over the last years show a decrease in temperature [11.2].
11.2.3 What are global warming and the greenhouse effect?
According to the Intergovernmental Panel on Climate Change (IPCC) global warming is induced by the greenhouse effect. The greenhouse effect works as follows: Sunlight enters the atmosphere and heats the surface of the earth. Greenhouse gases absorb the radiation of the sun and reflect it again in all directions, including back to the earth surface. Due to this natural process the earth’s surface has a higher temperature than when it would be only radiated by direct sunlight. The increase of greenhouse gases reinforces the natural greenhouse effect, resulting in global warming. The six most important greenhouse gases include [11.3]:
Carbon dioxide (CO2)
Methane (CH4)
Nitrous oxide (N2O)
Hydrofluorocarbons (HFC’s)
Perfluorcarbons (PFC’s)
Sulphur hexafluoride (SF6) For each of these gases the potential contribution to global warming can be determined. This Global Warming Potential (GWP) is a relative indicator with CO2 as the reference, this means that it indicates the degree in which a substance is able to absorb infra red radiation compared to one mass unit of CO2. For example: The contribution to global warming of 1 kg methane is comparable to 23 kg CO2‐emission. In this way for all greenhouse gases the contribution relative to CO2 can be determined, resulting in these so called Global Warming Potentials or CO2‐equivalents. Converting greenhouse gasses to CO2‐equivalents is called normalization. The CO2‐equivalents can be added, resulting in one expression for global warming. An overview of the GWP’s of the six most important greenhouse gases is shown in table 44. The GWP’s are dependent on the time horizon over which the potential effect is determined. A gas that is quickly removed from the atmosphere may initially have a large effect, but for a longer time period it has been removed, which makes it become less important. Mostly a time horizon of 100 years is used.

Master Thesis G.P. Maas Comparison of quay wall designs with regard to the CO2‐emission and the Life Cycle Analysis 1227858
105
Greenhouse gas GWP 100 years
Carbon dioxide (CO2) 1
Methane (CH4) 23
Nitrous oxide (N2O) 296
Hydroflurocarbons (HFC‐23) 12000
Perfluoromethane (CF4) 5700
Sulphur hexafluoride (SF6) 22200
table 44: Global Warming Potentials of greenhouse gases
Combining these GWP’s with the kg emissions resulting from a product or process, results in the so called Carbon Footprint.
11.2.4 Life Cycle Analysis
11.2.4.1 Steps for Life Cycle Analysis
A Life Cycle Analysis (LCA) is a systematic way to evaluate the environmental impacts of products or actions with help of the cradle‐to‐cradle approach. A LCA consists of several steps [11.4], [11.5]:
1. Goal and scope definition In this step a number of questions have to be answered. What is the product you want to compare? Who is the initiator for the assessment? The functional unit must be determined. Finally the depth of the study must be defined. The depth of the study depends on the quality of the input data. These points must be formulated as precise as possible. The output of this step is a text that describes the subject and the structure of the study.
2. Inventory analysis with a flowchart
The flowchart is a qualitative presentation of all relevant processes involved in the life cycle of the researched system. The system consists of processes which induce several flows of materials. To construct a flowchart, start with the production process of the main product. Than add the components which happen before and after production. Important is to define the system boundaries and determine which processes are taken into account in the assessment and which are not. Goal of this step is to present a flowchart that gives an overview from mining of the raw materials to demolishing and waste.
3. Impact assessment
After the flowchart is made, the required data can be collected. It is important to obtain the right data of good quality. This step results in a number of datasheets. The data that is collected must be converted to units that can be handled easily. Then the specific quantities for each component in the system must be calculated. This results in a list of specified quantities per functional unit. Subsequently all calculated quantities are converted to a contribution per impact category. Determined must be which environmental effects/impact categories are taken into account. This step results in a table of all relevant environmental effects that describes the environmental profile of the functional unit in absolute or normalized numbers. When normalizing, all contribution to an impact category are converted to equivalents relative to one of the contributions to that impact category. For example the conversion of greenhouse gases into Global Warming Potentials as shown in table 44.

Master Thesis G.P. Maas Comparison of quay wall designs with regard to the CO2‐emission and the Life Cycle Analysis 1227858
106
4. Evaluation In the last step the impact categories get a weighing factor. Since all effects and emissions are assigned to its specific impact category in equivalents with help of normalization, now a method needs to be found to add the contributions of each impact category. This can be done with weighing factors. These factors can be different per impact category to be able to take local effects in to account. Finally an overview of the total life cycle assessment can be presented. The LCA’s of different structures can now be compared to each other.
11.2.4.2 Functional Unit
In the first step of the Life Cycle Analysis the functional unit must be determined. It defines:
The unit that will be researched.
The effects that will be taken into account.
The time horizon of the effects. This is the lifetime of the structure, which is 50 years.
11.2.4.3 Impact categories
In a Life Cycle Analysis several environmental effects, called impact categories, can be taken into account. The impacts can be assigned to different classes:
Pollution
Depletion
Land use
Disturbance Every impact category can be expressed in kg of a certain equivalent. Since it is not possible to express every impact in kg CO2, each impact is expressed in a different equivalent, suitable for that impact. Arguments why a specific equivalent is assigned to an impact category are difficult to give, but in ISO14000 and NEN8006 the impact categories and their equivalents are defined and they are standard for the use in LCA’s. As described in NEN8006 [11.5] and [11.6], the environmental assessment of a product (or structure in this case), involves thirteen impact categories. An overview of these impacts, which are related to the first three classes, is given in table 45.

Master Thesis G.P. Maas Comparison of quay wall designs with regard to the CO2‐emission and the Life Cycle Analysis 1227858
Impact category Explanation Equivalent
Global Warming Potential GWP Increase in CO2‐equivalents in atmosphere, contributing to the greenhouse effect
Kg CO2‐equivalents
Ozone depletion potential ODP Depletion of the ozone layer, resulting in an increase of UV‐radiation on the earth surface
CFK‐11‐equivalents
Human toxicity potential HTP Exposure of humans to toxic substances through air, water, soil or the food chain
Kg 1,4‐dichlorobenzene eq
Fresh water aquatic ecotoxicity potential
FAETP Exposure of flora and fauna to toxic substances in fresh water
Kg 1,4‐dichorobenzene eq
Salt water aquatic ecotoxicity potential
SAETP Exposure of flora and fauna to toxic substances in salt water
Kg 1,4‐dichlorobenzene eq
Terrestrial ecotoxicity potential
TETP Exposure of flora and fauna to toxic substances
Kg 1,4‐dichlorebenzene eq
Photochemical oxidant creation potential
POCP Creation of smog in the air by a chemical reaction of NOx and volatile organic compounds under the influence of UV
Kg ethylene eq
Acidification potential AP Precipitation of acids on soil or in water, induces changes in acidity, which can have consequences for flora and fauna
Kg SO2 eq
Eutrophication potential EP Addition of fertilizer to water or soil, increasing the production of biomass, leading to a decrease of oxygen, causing undesirable shifts in ecosystems.
Kg PO4‐ eq
Biotic depletion potential BDP Mining of renewable resources Kg antimoon eq
Abiotic depletion potential ADP Mining of non renewable resources Kg antimoon eq
Energy depletion potential EDP Mining of non renewable energy sources Kg antimoon eq
Land use Use of land m2
table 45: Impact categories and their equivalents
11.2.5 People, planet, profit People, planet, profit is a model used in sustainable development. The main idea is that one should focus on people, planet and profit in projects. When they are not balanced and the focus is for example on profit, then people and planet will suffer from this. In this thesis the main focus is on “planet”; “What are the environmental effects of several structures?” and somewhat on “profit”; “What are the costs of the structures?”. “People” and especially the impact of the use of materials on society is not taken into account. Note that this can be very important for some materials. For example the use of coltan has an enormous impact on the society of Congo.
figure 56: People, Planet, Profit
107

Master Thesis G.P. Maas Comparison of quay wall designs with regard to the CO2‐emission and the Life Cycle Analysis 1227858
108
Coltan is a metallic ore from which tantalum is obtained. This metal is extremely heat‐resistant and a good conductor of electricity. It is used in almost all electronics, for example laptops and mobile phones. Due to technological developments the use of tantalum has increased significantly. In Congo a civil war over this mineral is going on. The coltan‐rich areas are controlled by rebels who benefit from the ongoing conflicts.
11.2.6 Scientific papers In scientific papers a lot of research is presented about life cycle analysis and CO2. Most of them are focussing on buildings and not so much on large (hydraulic) structures. Nevertheless a number of important comments came across which are summarized here. Mostly used keywords in the Science Direct database and Google Scholar are: “GHG or greenhouse gas or CO2 or carbon dioxide” and “building or construction”.
o Greenhouse gas emissions are mainly induced by six sources:
Manufacturing of building materials
Transportation of building materials
Transportation of construction equipment
Energy consumption of construction equipment
Transportation of workers
Disposal of construction waste A case study of One Peking, a large commercial building in Hong Kong, shows that the most part of GHG emissions are due to the manufacture and transport of building materials [11.7].
o Competition in the construction sector grows stronger day by day. LCA can be used to minimize the costs of a project. The influence that initial decisions related to maintenance and associated operational costs in the design phase have over the building actual environmental impact can be evaluated. In the calculation of the environmental impact, it is necessary to calculate data regarding emissions related to production, use and end‐of life of different materials. Due to the large amount of data required to perform a LCA, it is recommended to use a software tool. Most LCA tools include databases. When deciding which programs to use, it is necessary to consider several criteria such as adequate indicators, study’s purpose, how precise the calculation has to be or the way in which the results should be presented [11.8].
o Long‐term global reductions in CO2 emissions will only be possible with a massive move from fossil energy to solar and other renewable energy sources. One strategy for reducing fossil fuel use is to increase the use of less energy‐intensive materials. A shift from steel, concrete and aluminium to greater use of wood in construction, contributes to the reduction of energy use and CO2 emission. This paper uses energy coefficients of building materials to estimate the total energy required to manufacture various buildings and the resulting emissions of CO2 to the atmosphere. To estimate the energy and CO2‐emission a lot of data is available, but it is sometimes contradictory, especially between different countries. This is due to many of reasons, the most important are:
Industrial processes and economic activities vary widely between countries. Less developed countries tend to have less efficient processes.
Industrial energy usage is process‐specific. Modern factories are generally far more energy‐efficient than older ones.

Master Thesis G.P. Maas Comparison of quay wall designs with regard to the CO2‐emission and the Life Cycle Analysis 1227858
109
There are many differences between raw materials, efficiencies of labour, treatment of waste products and levels of recycling.
Finally it is mentioned in this paper that in theory, wood is a renewable resource, but in practise the world’s forests are disappearing at a much faster rate than they are being replaced by natural or assisted regeneration [11.9].
11.2.7 Databases A lot of companies are developing standards to determine the ‘carbon footprint’ of a project. They developed databases which contain data about kg CO2‐emmision of the production of different materials. Some are public and ready to use, but unfortunately most of them are not. A problem with this data is the inconsistency between them. Data that is available for this master thesis:
Project Carbon Calculator ‐ BAM Building constructor BAM wants to share the knowledge they have within the company
about CO2 emissions. Their goal is to achieve a substantial reduction in CO2 emissions through collaboration with suppliers, building companies and clients.
They developed the Project Carbon Calculator. It can be used as a tool to determine where CO2 reduction can be achieved during the construction of a project. The carbon footprint of an infrastructural project can be determined in every phase [11.10].
Report of IGWR: “CO2 Footprint of quay walls, emission of CO2 for construction and maintenance of quay walls.”
In this report the CO2 footprint of 3 existing quay walls is determined. Data which has been used is coming from the Ecoinvent 2.0 database and the IVAM LCA Data 4. The Ecoinvent Centre is a competence centre of a number of Swiss institutions. They have developed the Ecoinvent database, with over 4000 life cycle inventory data. The entire database is only accessible after payment.
IVAM is a research and consulting bureau for sustainability, which is originated from the department of Environment (IVAM) of the University of Amsterdam. IVAM elaborated all the data for the IGWR report. Their data is not public [11.11].
University of Bath: Inventory of Carbon&Energy (ICE) The University of Bath created a database with embodied energy and embodied carbon, the
Inventory of Carbon & Energy (ICE) Version 1.6a. It is the freely available summary of the larger ICE‐database. The data has been collected from journal articles, Life Cycle Assessments, books, conference papers and more. Resources based on subscription have not been used, due to potential copyright issues. The boundary condition for this database is ‘Cradle‐to‐Gate’, which means that only energy and carbon is taken into account, which is consumed by the product until it reached the point of use. A number of criteria were applied for the selection of embodied energy and carbon values for the ICE database. The data primarily focuses on construction materials [11.12].
Database of materials by NIBE NIBE is the “Dutch institute for building biology and ecology”. They research and advise about environment, health and building/maintenance. NIBE made environmental assessments for building products based on the LCA methodology. It shows the environmental impact and the costs of a product. A database gives an overview of circa 250 materials with their emissions per impact category, including monetization numbers [11.13].

Master Thesis G.P. Maas Comparison of quay wall designs with regard to the CO2‐emission and the Life Cycle Analysis 1227858
110
Other databases:
Ecoinvent The Ecoinvent database is created by the Ecoinvent Centre, Swiss centre for life cycle
inventories. Several LCA software tools, like SimaPro, make use of this database. It contains international industrial life cycle inventory data on energy supply, resource extraction, material supply, chemicals, metals, agriculture, waste management services and transport services [11.14].
“Stichting Bouwkwaliteit” This is actually not a database, but the goal of SBK, Stichting Bouwkwaliteit, is to stimulate and promote quality management in the building sector and to harmonize all national guidelines and certification. Amongst other things this resulted in a method, “SBK assessment methodology for material bound environmental performance of buildings and soil, road and hydraulic structures” and a related environmental database. The method is developed to obtain standardization in the determination of the environmental performance of buildings and soil, road and hydraulic structures. The goal is to make a calculation in different LCA software (GreenCalc, DuboCalc and Eco‐Install) that gives the same end result [11.15]. Soon the SKB will present the Dutch national database, then all Dutch LCA’s can be based on the same emissions per product, making a comparison easier.
Several other databases As been said before a lot of companies are trying to determine their Carbon Footprint. ProRail presented the “CO2 performance ladder” to stimulate companies to reduce their Carbon Footprint [11.16]. “Stichting Bouwend Nederland” presented recently the National CO2 database. It is initiated by Ballast Nedam, Heijmans and Structon in the beginning of 2010 [11.17].
Another database is the national CO2 benchmark , developed by Corporate Facility Partners BV and Foundation Stimular [11.18].
All databases have the same goal, stimulating companies to reduce their Carbon Footprint. The data in the databases differs from each other. Advised is to make use of the Dutch available data, because this data is based on local production and building processes. Therefore it is better to use the data of IVAM and BAM instead of the ICE report, which is based on manufacturing and construction in the UK.
11.2.8 Software
11.2.8.1 Methods
Several software programs are available to perform a LCA. A number of Dutch software programs will be mentioned here: GPR‐Gebouw, GreenCalc and DuboCalc. They all contain data, or data can be loaded from a database. The method which is used in these software programs is the Life Cycle Analysis, which determines the environmental impact from the cradle to the grave, including mining, production, building, maintenance and demolition.
11.2.8.2 DuboCalc
Rijkswaterstaat developed software especially for geotechnical projects, roads and hydraulic structures. The program defines the environmental impacts of material and energy use of infrastructural projects. It helps engineers to compare their designs. DuboCalc calculates environmental effects which results in an MKI (MilieuKostenIndicator, “Environmental Costs Indicator”). It is based on life cycle analysis and takes effects from mining to demolishing and recycling into account. The software is still in development, but can be used for tests [11.19].
Master Thesis G.P. Maas Comparison of quay wall designs with regard to the CO2‐emission and the Life Cycle Analysis 1227858
111
11.2.8.3 SimaPro
SimaPro is a software tool used by the engineers of Public Works Rotterdam. It is a professional tool to make life cycle assessments of products and services. The program makes use of a number of databases including the Ecoinvent database.
11.2.9 Conclusion From this literature study can be concluded that several databases and software are available to perform an LCA. The best to use are the ones based on Dutch production and building processes, since this thesis concerns a Dutch structure. It is questionable if it is necessary to make use of a software tool for the life cycle analysis. The use of software does not contribute to the insight in the processes of the LCA. Attention must be paid that the software tool becomes unclear. Besides that the use of these programs is restricted with expensive licences, which means that it is not possible to make unlimited use of the software. To perform the LCA there will be started with the determination of the goal, boundaries and the inventory analysis with flowcharts. When the total system is determined, the CO2 emission can be calculated with help of the Dutch databases. The emissions from the other impact categories can be determined with the material database of NIBE.
11.3 Life Cycle Analysis
11.3.1 Goal, scope and definition of the LCA Now a Life Cycle Analysis of the Euromax quay wall designs will be preformed. This will be done according to the steps described in paragraph 11.2.4. To be able to make a LCA first the goal and scope must be defined. The goal of this LCA is: “Compare the environmental effects induced by the lifetime of 1 functional unit of the four quay walls designed in concrete, steel, wood and fiber reinforced polymers. These designs are based on the same functional and technical requirements as the quay wall in the Euromax Terminal.” The functional unit can be defined as described in 11.2.4: Unit: 1.0 m quay wall, the quay wall facilities such as fenders, cranes, etc. will not be taken
into account. Furthermore the bottom protection will not be taken into account. Effects: 1. Global Warming Potential 2. Ozone depletion potential 3. Human toxicity potential 4. Fresh water aquatic ecotoxicity potential 5. Salt water aquatic ecotoxicity potential 6. Terrestrial ecotoxicity potential 7. Photochemical oxidant creation potential 8. Acidification potential 9. Eutrophication potential 10. Biotic depletion potential 11. Abiotic depletion potential 12. Energy depletion potential 13. Land use Time horizon: 50 years, because in the technical requirements is defined that the lifetime of the
quay wall must be at least 50 years.
Master Thesis G.P. Maas Comparison of quay wall designs with regard to the CO2‐emission and the Life Cycle Analysis 1227858
112
11.3.2 Inventory analysis with help of a flowchart
The next step is to make a flowchart. The flowchart is composed of processes with their inputs and outputs. In the flowchart these processes can be assigned to several stages:
Production of materials
Transportation
Construction
Use
Demolish
Process The four quay wall designs all consist of the concrete superstructure with foundation piles in combination with a retaining wall constructed in the specific material. For this reason five different flowcharts are made:
Superstructure: Concrete relieving floor with foundation of mv‐piles and vibro‐piles
Concrete diaphragm wall
Steel combi wall
Wooden wall of Azobé
Sandwich panel of fiber reinforced polymer Each design shall be represented by the flowchart of the superstructure in combination with the flowchart for the retaining wall of the relevant material. The bottom protection in front of the quay wall, the facilities like crane, fenders etc, and the drainage system below the relieving floor are not taken into account. The flowcharts are presented in Appendix F.1.
11.3.3 Impact assessment
11.3.3.1 Inventory of quantities per functional unit
All the processes with their inputs and outputs are known in a qualitative way. The next step is to quantify them. For this several assumptions have been made. All results are shown in tables in Appendix F.2 and F.3. Production First the quantities of the materials must be determined. Based on the designs, the required volumes are calculated. Dependent on the specific density for the material, this results in the kg’s per material. Transportation The next step is to determine the distance for transportation from the factory to the building site. Some of these values are based on the previous study of IGWR concerning the carbon footprint of several quay walls in the Port of Rotterdam [11.11]. All data in that study was obtained by IVAM UvA BV (research and consultancy on sustainability by the University of Amsterdam). The following assumptions for the transportation of materials are made:
Steel: Luxembourg, 280 km per axle
Concrete: Europort Rotterdam, 13 km per axle
FRP sandwich panels: Rotterdam, 40 km per axle
Reinforcement steel: South Rotterdam, 41 km per axle
Wood, Azobé: Dutch wood supplier, ca 200 km by barge
Master Thesis G.P. Maas Comparison of quay wall designs with regard to the CO2‐emission and the Life Cycle Analysis 1227858
113
Construction Subsequently the materials must be constructed (poured, driven, lowered, pumped etc.). This is done by cranes, pumps, aggregates etc. for several hours, resulting in emissions as well. Per construction stage the required equipment and the number of hours needed for the job are determined. Use The previously mentioned stages are all concerning the construction of the structure. During the lifetime of the structure it must be checked and maintained. The materials and use of equipment during the maintenance over 50 years must be determined. The maintenance to be done to the quay wall in its lifetime is to replace the fender and mooring systems. Since these facilities are the same for all designs, they are not taken into account. Furthermore the cathodic protection of the steel combi wall needs to be sufficient during the entire lifetime of the structure. Assumed is that circa 13 kg per m2 quay wall is needed to protect the tubes and sheets from corrosion. This is an average value for the exposed area of the quay wall, from NAP‐2,0 m to NAP ‐22,0 m and is advised by the engineers of Public Works Rotterdam. It is expected that the aluminium anode are sufficient over a period of 25 years, therefore two sets of anodes are needed during the lifetime of the structure. Demolition Finally, when the lifetime of the structures is over several scenarios are possible:
Reuse
Recycling
Incineration
Dump For demolition again certain equipment during a number of hours is needed. This process needs energy as well, resulting in emissions. All data about emissions of materials concerns the environmental effects of the entire lifetime of the materials. This means that the data includes emission during production, demolishing and processing of waste. For this reason the last two categories in the flowchart, demolish and processing of waste, do not have to be taken into account in the inventory, because they are already included in the emissions of the materials. Finally the inventory concerns:
Materials
Transportation to building site
Construction Every stage of the lifetime causes waste. During the production stage this waste comes from the production process and at the building site extra material is needed, when mistakes are being made. For waste during construction an extra percentage of material can be taken into account. But because this needs to be done for all materials, this gives no contribution to the comparison of the emissions, since they all increase by that certain percentage. For this reason extra material induced by waste is not taken into account.
11.3.3.2 Emissions per impact category
Subsequently the emissions per environmental effect for each material or process must be determined. This is the most difficult step, because the quality of the data is of great importance. The access to one of the software as mentioned in 11.2.8, which includes a database, appears not to be possible. The literature study shows that the use of Dutch data is preferable, because it is based on Dutch production processes and this thesis concerns a Dutch structure. For this reason the ICE data [11.12] will not be used in this thesis. The data that is available will be summarized including its advantages and disadvantages:

Master Thesis G.P. Maas Comparison of quay wall designs with regard to the CO2‐emission and the Life Cycle Analysis 1227858
114
Material database by NIBE [11.13]: This database gives an overview of the kg emission per impact category per kg material of 245 materials. Advantage of this database is, that the emissions of all impact categories listed in the functional unit in 11.3.1 are given. Furthermore a monetization number per effect is presented. Disadvantage of this database is that a description of the materials is concise, which makes it difficult to see where the values are based on and what their application is, since different types of material qualities are used for different purposes. About the emission resulting from (fuel and electricity for) equipment used for transport and construction no information is given.
Report of IGWR [11.11]: Data used in this report is determined by IVAM. It is based on the Ecoinvent 2.0 database and IVAM LCA Data 4. The last contains data concerning construction products and processes, gathered in projects executed by IVAM. Advantage is that the inventorisation of this data is executed, keeping in mind that it is used for determining the carbon footprint of a quay wall. Resulting in a list of almost all materials used in this thesis. Furthermore data about transport and equipment is present. Large disadvantage of the data in the IGWR report is, that the figures are only specified for the CO2 – emission and not for the 12 other impact categories.
Project Carbon Calculator by BAM [11.10]: The project carbon calculator contains a database which can determine the carbon footprint of a project. It is divided in six categories, including materials, equipment and transportation. Disadvantage is, as the name says, that this database only includes figures concerning the CO2 – emission. Advantage is that it includes information about transportation and equipment.
The figures in each database are based on certain processes. Therefore it is best to minimize combination of different databases. When only one database is being used, all emissions are based on the same assumptions, making the outcome more consequent.
11.3.3.3 Weighing factor
The best way to compare the four designs with respect to their environmental impact is with one final indicator. Question is how this can be attained, because every impact category has its own equivalent unit. For example, one kilo of CO2 can not be added to one kilo CFK‐11. With help of weighing factors the importance of every effect can be indicated. By multiplying each environmental effect with their weighing factor a comparable outcome can be obtained. Adding them for all the effects, results in one indicator for the entire project. But how to obtain good weighing factors? A way to construct this indicator is to make use of so called “shadow prices”. This method is called monetization. The shadow prices measure the difference between the actual environmental impact of the structure and the sustainable environmental impact of the structure. In which a sustainable environmental impact is the impact carried on until infinity without significant negative effects for the health of human, the biodiversity and ecological processes on earth. The shadow prices represent the costs for preventive measures which must be taken to reduce the emissions to a sustainable level. These environmental costs can be seen as virtual costs, which means that the measures have not been executed in reality, therefore they are not integrated in the production processes and thus not integrated in the real cost. The costs of a kilo emission per impact category are shown in table 46 [11.20].

Master Thesis G.P. Maas Comparison of quay wall designs with regard to the CO2‐emission and the Life Cycle Analysis 1227858
115
CE Delft is a research and consulting bureau that specializes in environmental issues. They have developed a manual on shadow prices, concerning rating and weighing of emissions and environmental effects. It involves the calculation methods for the shadow prices and the weighing factors for the impact categories. Due to new insights and methods these shadow prices keep changing and developing. The shadow prices as shown in table 46 are from the NIBE material database. From these weighing factors can be seen that costs per kg CFK‐11‐equivalents, causing depletion of the ozone layer, are very high. Furthermore it must be noticed that the impact category “Salt water aquatic ecotoxicity potential” has no monetization number. Several experts state that it is very difficult to assign shadow costs to this category, because sometimes this results in such high costs, that it dominates the total LCA. For this reason these shadow costs are not taken into account.
Impact category Monetization number (€/kg emission)
Global warming potential 0.09
Ozone depletion potential 5724.69
Human toxicity potential 0.05
Fresh water aquatic ecotoxicity potential 0.05
Salt water aquatic ecotoxicity potential 0
Terrestrial ecotoxicity potential 0.05
Photochemical oxidant creation potential 4.40
Acidification potential 2.72
Eutrophication potential 54.45
Biotic depletion potential 0.04
Abiotic depletion potential 0.04
Energy depletion potential 0.04
Land Use 0.20
table 46: Monetization number per impact category

Master Thesis G.P. Maas Comparison of quay wall designs with regard to the CO2‐emission and the Life Cycle Analysis 1227858
11.3.3.4 CO2‐emissions
Carbon Footprint IVAM and BAM First the CO2‐emissions of the structures have determined with help of the data of IVAM and BAM. In this a distinction is made between production, transport and construction. First the emissions of the entire quay wall structure, including both the superstructure and the retaining wall, are presented in figure 57.
CO2 emission total quay wall, 1.0m
-
20.000
40.000
60.000
80.000
100.000
120.000
140.000
160.000
Concrete Steel Wood FRP
kg C
O2
equ
ival
ent
construction
transport
production
figure 57: CO2 ‐emission of quay walls with data from IVAM and BAM
Subsequently the emissions of the retaining walls only are shown in figure 58 to emphasize the difference in construction materials. Details about the quantities of materials and their corresponding emissions are presented in Appendix F.2.
CO2 emission retaining wall, 1.0m
-
20.000
40.000
60.000
80.000
100.000
120.000
140.000
Concrete Steel Wood FRP
kg C
O2
equ
ival
ent
construction
transport
production
figure 58: CO2 emission of retaining walls with data from IVAM and BAM
As been said before this Carbon Footprint uses the data of IVAM completed with data of the BAM Carbon Calculator. An exception is made for the emissions of Azobé, because the emission from IVAM gives an unexpected value for this material. The CO2‐emission of 1 kg Azobé appears to be
116

Master Thesis G.P. Maas Comparison of quay wall designs with regard to the CO2‐emission and the Life Cycle Analysis 1227858
circa 23 times higher than of 1 kg concrete. For this reason the data of the NIBE material database is used for Azobé. This difference can be explained by the scenarios concerning production and end of life, which have been used as a base for the CO2‐emission. Each scenario involves different processes, resulting in different emissions. An example of a process that can result in variations in emissions is drying of wood. After logging wood must be dried, which can be done in several ways. One way is to let it air dry, a second possibility is to kiln dry the wood. This last one needs extra energy, resulting in higher emissions. Next to that, the growth of a tree is an important factor in the calculation of the CO2‐emission. For the growth of wood CO2 is needed. This is extracted from the air, resulting in a “negative” CO2‐emission during the lifetime of the tree. Subsequently, emissions are induced by logging, transportation and processing. From the NIBE database is known, that the “negative” emission is not taken into account. The reasons for the high CO2‐emission of Azobé from IVAM are unfortunately not known. Carbon Footprint NIBE material database Secondly the Carbon Footprint of the retaining walls is determined with the material database of NIBE as shown in figure 59. These calculations have been elaborated in Appendix F.3. This Carbon Footprint only concerns the life cycle of the used materials. Extra emissions due to transportation or construction have not been taken into account, because they were absent in the database. But from the previous Carbon Footprint as shown in figure 58 can be seen that transport and construction have a minor impact on the total emissions.
Global warming potential
0
50000
100000
150000
200000
250000
Concrete Steel Wood FRP
kg C
O2
equ
ival
ent
figure 59: CO2‐emissions of retaining walls with NIBE material database
When these two Carbon Footprints, as shown in figure 58 and figure 59, are compared to each other, it can be seen they both look very similar. Wood gives the best result, followed by steel and concrete. The CO2‐emissions of the FRP sandwich panel are much more. The NIBE material database gives somewhat higher emissions, when compared to the IVAM and BAM data. For concrete and steel, they are respectively 20 and 25% higher. For wood they are of course the same, since they are both based on the NIBE database. The CO2‐emissions of the FRP sandwich panel are with the NIBE database circa twice as high as with the IVAM data. It can be concluded that both Carbon Footprints show the same trend, when they are compared in a relative way.
117

Master Thesis G.P. Maas Comparison of quay wall designs with regard to the CO2‐emission and the Life Cycle Analysis 1227858
As been explained previously in this paragraph, the negative CO2‐emission of Azobé during growth of the trees is not taken into account. Therefore, the Carbon Footprint of the Azobé retaining wall is even somewhat smaller than as shown in figure 59.
11.3.3.5 Impact categories with material database NIBE
Next with help of the material database of NIBE the effect on the environment of several other impact categories can be determined. In Appendix F.3 an overview is given. This appendix shows the emissions of the retaining walls per impact category. Using the method of the shadow costs as explained in paragraph 11.3.3.3, one final indicator for each retaining wall can be obtained. The shadow prices are shown in figure 60. This database only includes the life cycle of the materials for the quay walls. Emissions due to transportation and use of equipment are not taken into account.
Shadow prices per Impact Category, 1.0 m retaining wall
0
10000
20000
30000
40000
50000
60000
Concrete Steel Wood FRP
Eu
ro
Global Warming Potential Ozone Layer Depletion Human Toxicity
Aquatic toxicity fresh water Aquatic toxicity salt water Terrestrial toxicity
Photochemical oxidation Acidification Eutrophication
Exhaus biotic Exhaus abiotic Exhaus energy
Landuse
figure 60: Shadow prices of retaining walls with NIBE material database
In figure 60 can be seen that again the FRP sandwich panel results in the highest impact on the environment. Besides CO2, the impact category “Human Toxicity”, concerning the exposure of humans to toxic substances through air, water, soil or the food chain, has a large contribution. The emissions in this impact category are caused by glass fiber.
118

Master Thesis G.P. Maas Comparison of quay wall designs with regard to the CO2‐emission and the Life Cycle Analysis 1227858
Furthermore it can be seen that the shadow costs for the Azobé retaining wall are higher, compared to steel and concrete. Especially “Eutrophication”, concerning the impact that fertilizers have on water and soil, has a large share in the total shadow costs. In Appendix F.3 the emissions of the retaining walls per impact category are shown. For most impact categories FRP results in the highest emissions of the four retaining walls. An exception is made for the Abiotic depletion potential, concerning the mining of non renewable resources, which is shown in figure 61. It can be seen that the production of concrete makes use of the most non renewable resources, resulting in exhaustion at a certain moment in time. The influence of this impact category on the total shadow costs is very low.
Abiotic deplection potential
0
500
1000
1500
2000
2500
Concrete Steel Wood FRP
kg a
nti
mo
on
eq
uiv
alen
t
figure 61: Abiotic depletion of retaining walls with NIBE material database
11.3.4 Evaluation In general it can be concluded that the contribution of emissions due to transportation and construction is small. This means that the construction materials are decisive for the Carbon Footprint. The same result is expected for the other impact categories. From the four designs which have been compared, the FRP sandwich panel has the biggest impact on the environment. This results in both the largest Carbon Footprint and the highest shadow costs. Wood results in the smallest Carbon Footprint, followed by steel and concrete. Regarding the shadow costs, the wooden retaining wall creates higher shadow costs than steel and concrete. It must be said that the designs for wood and FRP where just preliminary designs, in contrary to the designs in concrete and steel. Looking at the shadow costs of each retaining wall in relation to the weight, a factor can be determined. Each retaining wall uses besides its main material, a combination of different materials:
Concrete diaphragm wall: concrete and steel reinforcement
Combi wall: steel tubes and sheet, with aluminium anodes
Wooden wall: Azobé as the main material with steel connections
FRP: 50% of the volume of the laminates is vinyl ester resin and 50% glass fibers, in between PU foam is used
119

Master Thesis G.P. Maas Comparison of quay wall designs with regard to the CO2‐emission and the Life Cycle Analysis 1227858
120
All these materials have their own density. For each retaining wall the shadow costs for 1kg can be calculated. Subsequently a factor is calculated, which represents how many times a structure must be lighter resulting in the same level of sustainability. This is done relative to concrete, therefore that factor is said to be 1 and is shown in table 47. Total weight [kg] Total costs €/kg Factor
Diaphragm wall: Concrete and steel reinforcement
98.280 €4.116,58 €0,04 1
Combi wall: Steel tubes and sheet, Aluminium anodes
8.532 €3.899,19 €0,46 11
Wooden wall: Azobé with steel connections
51.204 €6.408,09 €0,13 3
FRP sandwich panel: Vinyl ester, glass fiber and PU foam
55.519 €52.602,14 €0,95 23
table 47: Factor relative to concrete of which the retaining walls must be lighter to have the same level of sustainability using the shadow prices.
In table 47 can be seen that a FRP structure must be 23 times lighter with respect to a reinforced concrete structure to obtain the same level of sustainability. The preliminary design which is made for the FRP sandwich panel is circa 2 times lighter compared to the concrete diaphragm wall. The sandwich panel can be optimized, resulting in a lower weight, but the optimization will not result in a factor 23 compared to concrete. Therefore it can be concluded, that a FRP structure used as a hydraulic structure and designed according to the (conservative) CUR recommendation 96, will not be a sustainable structure. Another important fact are the processes which are and which are not taken into account in the LCA. The depth of the study can vary, which has an impact on the final results. Two of these matters shall be mentioned here: The first one concerns capital goods. For processing of materials, machines and equipment are used. The production of these machines and equipment creates emissions to. Furthermore, machines are needed to construct that equipment. In this way one can go on and on. Therefore clear boundaries must be defined. The NIBE material database does not take the emissions due to capital goods into account. The second important matter which will be discussed, involves the end‐of‐life scenarios for the structures. As been mentioned before in paragraph 11.3.3.1, several possibilities are present for the structures. These are dump, incineration, recycling and reuse. The data in the NIBE material database includes a combination of these scenarios. With help of software tools, like SimaPro, variations in the scenarios can be made and the influence on the outcomes of the LCA can be determined. In table 48 an overview of the assumptions which have been made in the NIBE database is shown. It can be seen that a large part of the steel and aluminium is assumed to be recycled. It is questionable if this is possible. The aluminium anodes will corrode during their lifetime, therefore this can be seen as dump, resulting in a higher impact on the environment. When the lifetime of the structure is over, it is assumed in this LCA that the steel tubes and sheets will be pulled and reused or recycled. In reality it is not sure if this is possible. The choice for recycling or dump is highly depending on the costs which are needed for these processes.

Master Thesis G.P. Maas Comparison of quay wall designs with regard to the CO2‐emission and the Life Cycle Analysis 1227858
121
Dump Incineration Recycling Reuse
Concrete 0%
Steel (reinforcement, tubes and sheets)
3% 0% 83% 14%
Aluminium 5% 5% 90% 0%
Bentonite: Clay 5% 0% 95% 0%
Polypropene 5% 50% 45% 0%
Azobé 5% 95% 0% 0%
Vinyl ester resin 15% 85% 0% 0%
Glass fiber
PU foam 5% 90% 5% 0%
table 48: End of life scenarios NIBE material database
For the concrete retaining wall the database gives no percentages for the different scenarios. But it can be said that is it very difficult to demolish the large concrete wall which is partly in the soil. Leaving the wall in the soil can be seen as dump. It can be concluded that the end‐of‐life scenarios influence the outcomes of the LCA. With help of software tools, which requires expertise, the impact of these processes can be studied. It is questionable if the concrete and steel structures still show the best results when the scenarios are taken into account in a more realistic way.

Master Thesis G.P. Maas Comparison of quay wall designs with regard to the CO2‐emission and the Life Cycle Analysis 1227858
122
11.4 References [11.1] Ippc, Contribution of Working Group I to the Third Assessment Report of the
Intergovernmental Panel on Climate Change: “Climate Change 2001: The Scientific Basis”, 2001.
[11.2] Elsevier, special edition: “Klimaat: alles over de zoektocht naar duurzame energie & de groene strijd tegen de opwarming van de planeet aarde”, 2009.
[11.3] NEN‐ISO 14064‐1:2006 [11.4] Centrum voor Milieukunde Leiden, “Handleiding milieugerichte levenscyclusanalyse”, 1995. [11.5] Stichting Bouwkwaliteit, “Bepalingsmethode milieuprestatie Gebouwen en GWW‐werken”,
2010. [11.6] NEN8006, “Environmental data of building materials, building products and building elements
for application in environmental product declarations – Assessment according to the Life Cycle Assessment (LCA) methodology”, 2004.
[11.7] Hui Yan, paper: “Greenhouse gas emissions in building construction: A case study of One Peking in Hong Kong”, 2009.
[11.8] Zabalza, I, paper: “Life cycle assessment in building sector: state of the art and assessment of environmental impact for building materials”, 2009.
[11.9] Buchanan, A.H., paper: “Energy and carbon dioxide implications of building construction”, 1993.
[11.10] www.wiki.bamco2desk.nl [11.11] Deltrap, M.A., Report IGWR: “CO2 Footprint kademuren, De uitstoot van CO2 bij de bouw en
onderhoud van kademuren”, 2010. [11.12] Prof. Geoff Hammond, University of Bath UK, SERT Departement of Mechanical Engineering
“Inventory of carbon & energy (ICE), Version 1.6a”, 2008. [11.13] NIBE, “Material database”, 2008. [11.14] www.ecoinvent.ch [11.15] www.bouwkwaliteit.nl [11.16] www.prorail.nl/Zakenpartners/Aanbesteden%20en%20inkoop/Pages/CO2Prestatieladder.
aspx [11.17] www.co2reductieindebouw.nl/ [11.18] www.co2benchmark.nl [11.19] www.rws.nl [11.20] NIBE Research bv, Report: “Monetarisering (verborgen milieukosten)”, 2002.
Master Thesis GCompar son of quay wall designs with regard to the CO2‐emission and the Life Cycle Analysis
.P. Maas i 1227858
123
12 Conclusions & Recommendations
12.1 Introduction From this thesis several conclusions can be made. They will follow the order of the chapters in the thesis. Next to that, recommendations shall be given.
12.2 Conclusions
12.2.1 Wood
At the start of this thesis there was a preference for the use of European softwood in the wooden quay wall design. After a literature study on the durability of softwood and hardwood it followed that hardwood was the better choice for constructing a quay wall. Wood structures can be classified in hazard classes. A quay wall which is subjected to heavy loads and environmental impacts, like salt water is categorized to the highest hazard class. Next to that, wood species are classified in natural durability classes in which hardwood appears to be much more durable than softwood. Structures classified in a high hazard class need to be designed in a wood specie which is very durable. Both the hardness and the chemical resistance of hardwood against fungus and marine boorers are much better than those of softwood. Modification of softwood appears to be difficult due to the large dimensions of the elements. On the other hand sustainability is an important matter as well. A lot of hardwood is logged in an irresponsible way, resulting in the decay of tropical rainforests. With help of the FSC and the chain‐of‐custody the origin of the wood can be registered en checked. The process towards sustainable forestry is difficult and takes a lot of time. Because the mechanical and chemical properties of hardwood are much better than softwood, it is concluded that Azobé is the best type of wood for this quay wall design. Note that this wood must be selected carefully to be sustainable, which is difficult, but it can be said that the initiatives towards sustainable forestry are there. Two types of structures have been researched. First a wooden retaining wall, because it seems an interesting solution with respect to the concrete and steel designs. This resulted in a wall thickness of 1.40 m. The second design concerned a jetty, because this type of structure is often used for wood as a building material. When these two designs were compared on several criteria, it can be concluded that the use of material was most decisive and the wooden wall with the relieving structure appeared to be the better design.
12.2.2 Fiber Reinforced Polymers
Fiber Reinforced Polymers consists of a resin reinforced by fibers and can be composed in any desired way. With respect to costs and material properties, it can be concluded that a vinyl ester resin with glass fibers is the best combination for civil structures. Carbon fibers have a higher strength and stiffness with regard to their weight, but the costs are also circa 25 times higher compared to glass fiber. Following the Dutch CUR recommendation 96, the small strain which is allowed in the outer fibers is normative for the design of a sandwich panel that will function as the retaining wall of the structure. The result of the design was a sandwich panel with a thickness of 2.08m.

Master Thesis G.P. Maas Comparison of quay wall designs with regard to the CO2‐emission and the Life Cycle Analysis 1227858
124
12.2.3 Costs A cost comparison between the four designs shows that the traditional building materials, concrete and steel, result in de lowest costs. The wooden quay wall is circa two times as expensive and the costs of the FRP sandwich panel are circa 7 – 10 times higher compared to a traditional retaining wall.
12.2.4 Carbon Footprint & Life Cycle Analysis The largest part of the emissions results from the production of the materials. Transport and construction have a small contribution. Comparing the Carbon Footprints of the four retaining walls, it can be concluded that the wooden wall results in the smallest Carbon Footprint. Steel and concrete induce more CO2‐emission during their lifetimes. The Carbon Footprint of the FRP sandwich panel is much larger. Using the data of IVAM and BAM this results per 1,0 m retaining wall in:
Wood: 16 ton kg CO2
Steel: 16,6 ton kg CO2
Concrete: 20 ton kg CO2
FRP: 115 ton kg CO2 Looking at the other impact categories, the steel wall creates the lowest shadow prices, followed by the concrete diaphragm wall. The wooden wall is now the third best alternative. Finally the shadow prices for the FRP sandwich panel are again much higher. With help of the NIBE material database these shadow costs have been determined again for 1,0 m retaining wall:
Steel: €3.900,‐
Concrete: €4.200,‐
Wood: €6.500,‐
FRP: €53.000,‐ When it comes to the impact category Abiotic depletion, the concrete retaining wall has the highest emission. This means that for this structure the most non renewable raw materials are needed. Comparing the shadow costs of a kg of each retaining wall, relative to reinforced concrete this result in: Concrete : 1, Steel : 11, Wood : 3, FRP: 23. This means that a FRP structure must be 23 times lighter compared to a reinforced concrete structure to obtain the same level of sustainability. The design of the sandwich panel is circa twice as light as the diaphragm wall. Optimization of this preliminary design is advisable, but to obtain a factor 23 seems not realistic. This is caused by the small allowed strains for hydraulic structures, according to CUR Recommendation 96. Therefore it can also be concluded that the “sustainability” of a material is not only depending on the emissions per kg material, but also on its application. Some materials have properties which are favorably for certain applications, resulting in slender structures. When less material is needed for a structure, lower emissions are created. Finally the question which was formulated in paragraph 1.3.2 of the introduction needs to be answered: “Are structures which are cost efficient in real prices, also efficient with respect to the environment?” At first sight it can be said that the environmental shadow prices follow the trend of the real costs. But a mark must be made concerning the end‐of‐life scenarios, which have not been studied in this thesis. They can have a large impact on the outcomes of the LCA. It is questionable if the concrete and steel retaining walls will still result in the lowest shadow costs, when the scenarios are taken into account more realistically.

Master Thesis G.P. Maas Comparison of quay wall designs with regard to the CO2‐emission and the Life Cycle Analysis 1227858
125
12.3 Recommendations
12.3.1 Wood
The design of the wooden wall is a preliminary design and needs to be elaborated furthermore. Especially the connections need more detailed calculations. A type of wooden structures which have been constructed around 1900 is the crib wall. It can be worth while to investigate if this quay wall design results in less material use.
12.3.2 Fiber Reinforced Polymers
The use of FRP in civil structures in under great development. It is mostly used in bridge decks. Not many guidelines for designing are available, besides CUR recommendation 96. This recommendation is very conservative. Shortly it will be revised and one of the goals is to make is less conservative. The design of the FRP sandwich panel is also a preliminary design, therefore optimizations are advised and some adjustments are recommended. The lightness of the structure is in this application as a sandwich panel not really an advantage, because the entire sandwich panel will act like a large floater. When it would be possible in the future to also drive large FRP elements, the construction techniques of sheet piles can be used. The advantages of FRP sheet piles compared to steel are that they can be handled easily due to the lower weight. Besides that, FRP is more durable since is doesn’t corrode. Note that the FRP structures will only be sustainable when it becomes possible to use less material. When the small allowed strains stay the normative requirement in the design, this can be difficult.
12.3.3 Carbon Footprint & Life Cycle Analysis Finally some recommendations will be given concerning the Carbon Footprint and the Life Cycle Analysis. Because the production of materials has the largest impact on the life cycle of a quay wall, it is recommended to minimize material quantities. The scenarios concerning the end‐of‐life of the structures, like reuse, recycling, incineration and dumping have a large impact on the outcomes of the LCA. In this thesis no variations in these scenarios have been analyzed, because it was difficult to do without the use of a software tool like SimaPro. Recommended is to research the impact of the different end‐of‐life scenarios. In general it is advised to obtain more insight in all emissions and databases, so it is better known were the values are based on. In this way it becomes more clear which processes are and which are not taken into account, avoiding that processes are forgotten and others are calculated twice.