Embed Size (px)
Citation preview
ALTIUM FULL YEAR FISCAL 2021INVESTOR PRESENTATION
Double-Digit Growth in the Second Half with a Positive Outlook for FY2022
Aram Mirkazemi CEOMartin Ive CFOKim Besharati Chief of Staff
30 August – 2 September 2021VIRTUAL
2
This presentation has been prepared by Altium Limited (ACN 009 568 772)and is for information purposes only. It does not constitute financial productor investment advice or a recommendation to acquire Altium shares and hasbeen prepared without taking into account the objectives, financial situationor needs of individuals. Before making an investment decision prospectiveinvestors should consider the appropriateness of the information havingregard to their own objectives, financial situation and needs and seek legaland taxation advice appropriate to their jurisdiction. Altium is not licensed toprovide financial product advice in respect of Altium shares.
With a unique range of technologies, Altium helps organizations and designcommunities to innovate, collaborate and create connected products whileremaining on time and on budget. Products provided are ACTIVEBOM®,ActiveRoute®, Altium 365®, Altium Concord Pro™, Altium Designer®, AltiumNEXUS®, Altium Vault®, Autotrax®, Camtastic®, Ciiva™, CIIVASMARTPARTS®, CircuitMaker®, CircuitStudio®, Common Parts Library™,Draftsman®, DXP™, Easytrax®, EE Concierge®, NanoBoard®, NATIVE3D™,OCTOMYZE®, Octopart®, P-CAD®, PCBWORKS®, PDN Analyzer™,Protel®, Situs®, SmartParts™, Upverter®, X2®, XSignals®, PCB:NG®, andGumstix®.
Disclaimer
Future performance - Forward looking statements, opinions and estimates provided inthis presentation are based on assumptions and contingencies which are subject tochange without notice, as are statements about market and industry trends, which arebased on interpretations of current market conditions. Forward looking statementsincluding projections, guidance on future earnings and estimates are provided as ageneral guide only and should not be relied upon as an indication or guarantee of futureperformance. An investment in Altium shares is subject to investment and other knownand unknown risks, some of which are beyond the control of Altium Limited. Norepresentation or warranty, express or implied, is made as to the fairness, accuracy,completeness or correctness of the information, opinions and conclusions contained inthis presentation. To the maximum extent permitted by law, none of Altium employees,its directors, employees or agents, nor any other person accepts any liability, including,without limitation, any liability arising out of fault or negligence, for any loss arising fromthe use of the information contained in this presentation. In particular, no representationor warranty, express or implied is given as to the accuracy, completeness or correctness,likelihood of achievement or reasonableness of any forecasts, prospects or returnscontained in this Presentation nor is any obligation assumed to update such information.Such forecasts, prospects or returns are by their nature subject to significantuncertainties and contingencies. Before making an investment decision, you shouldconsider, with or without the assistance of a financial adviser, whether an investment isappropriate in light of your particular investment needs, objectives and financialcircumstances.
Financial dataAll dollar values are in US dollars (US$) unless as otherwise presented.
Agenda
2021 Full Year Financial Performance2
2021 Full Year Highlights1
4 Growth Engines and Flywheels for Dominance and Transformation
Appendix: Company Overview 5
3 Altium’s Unique Position in the Engineering Ecosystem
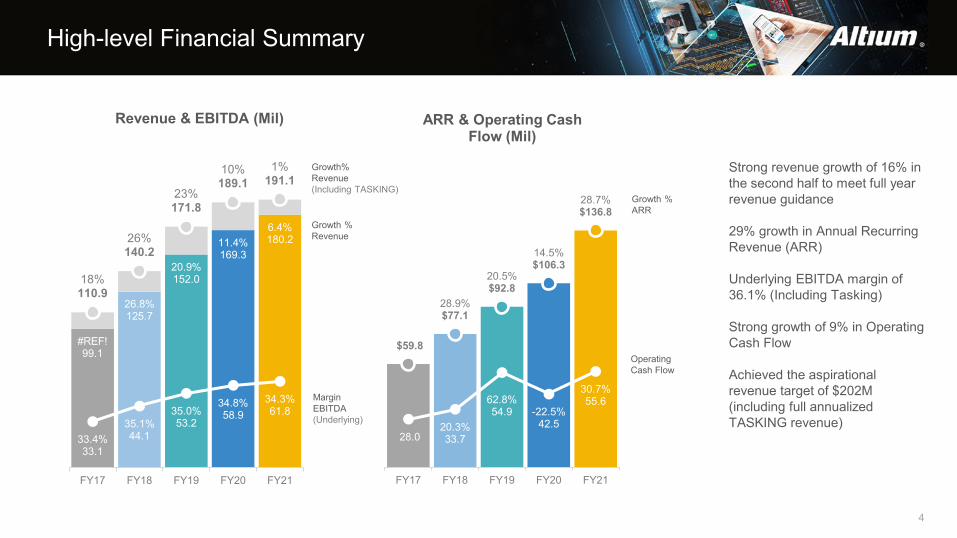
High-level Financial Summary
4
#REF!99.1
26.8%125.7
20.9%152.0
11.4%169.3
6.4%180.2
18%110.9
26%140.2
23%171.8
10%189.1
1%191.1
33.4%33.1
35.1%44.1
35.0%53.2
34.8%58.9
34.3%61.8
FY17 FY18 FY19 FY20 FY21
Revenue & EBITDA (Mil)
Strong revenue growth of 16% in the second half to meet full year revenue guidance
29% growth in Annual Recurring Revenue (ARR)
Underlying EBITDA margin of 36.1% (Including Tasking)
Strong growth of 9% in Operating Cash Flow
Achieved the aspirational revenue target of $202M (including full annualized TASKING revenue)
$59.8
28.9%$77.1
20.5%$92.8
14.5%$106.3
28.7%$136.8
28.020.3%33.7
62.8%54.9 -22.5%
42.5
30.7%55.6
FY17 FY18 FY19 FY20 FY21
ARR & Operating Cash Flow (Mil)
Growth%Revenue (Including TASKING)
Growth %Revenue
MarginEBITDA(Underlying)
Growth %ARR
Operating Cash Flow
5
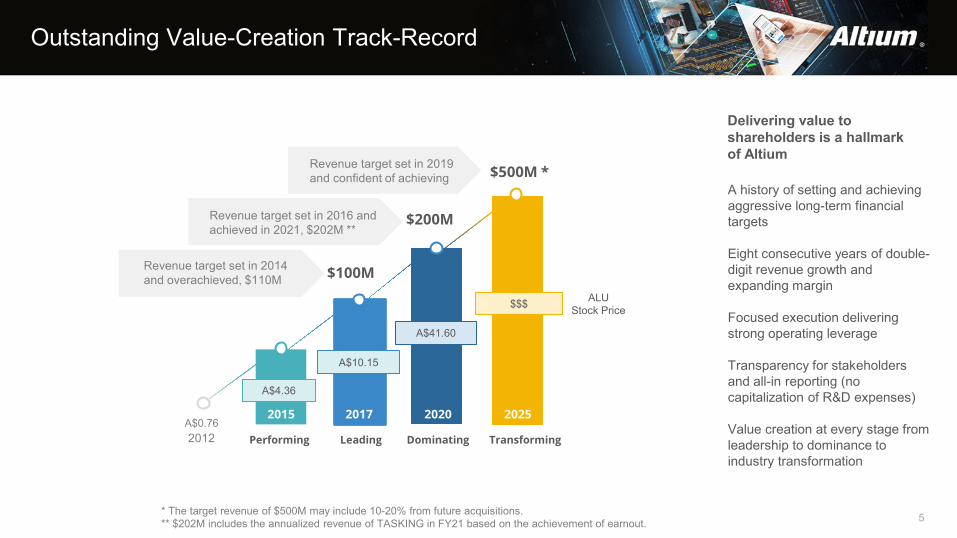
Leading Dominating Transforming
$100M
$200M
$500M *
PerformingA$0.76
Outstanding Value-Creation Track-Record
ALUStock Price
2012
Delivering value to shareholders is a hallmarkof Altium
A history of setting and achieving aggressive long-term financial targets
Eight consecutive years of double-digit revenue growth andexpanding margin
Focused execution delivering strong operating leverage
Transparency for stakeholders and all-in reporting (no capitalization of R&D expenses)
Value creation at every stage from leadership to dominance to industry transformation
Revenue target set in 2014 and overachieved, $110M
Revenue target set in 2016 and achieved in 2021, $202M **
Revenue target set in 2019 and confident of achieving
* The target revenue of $500M may include 10-20% from future acquisitions. ** $202M includes the annualized revenue of TASKING in FY21 based on the achievement of earnout.
A$4.36
A$10.15
A$41.60
$$$
2015 2017 2020 2025
On-Track with Flight Path to $500M
2021 – 2026
$100MRevenue
35,000 Subscribers
$200M Revenue
50,000Subscribers
Dominating & TransformingLeadingPerformingRebuilding
$25M
$0M
$50M
$75M
$100M
$125M
$150M
$175M
$200M
$225M
2012 - 2014 2015 – 2017 2018 - 2020
$7.3M13.0%
$55.9M12.9%
$18.7M29.6%
$63.2M13.1%
$21.5M29.7%
$33.4M33.7%$27.8M
33.2%
$44.3M35.2%
$1.4M2.7%
$49.5M14%
$53.2M35.0%
$58.9M34.8%
$72-80M34-36%
$209-217M16-20%
$500M *Revenue
6
$61.8M34.3%
$180.2M6.4%
$136.8M28.7%
$106.3M14.5%
$93.0M20.5%
$77.1M28.9%
$59.8M
$250M
Revenue CAGR > 20%
(FY21-FY26)
$168-174M23-27%
ARR CAGR > 20%
(FY21-FY26)
Rule of 50Margin Floor of 34%
(FY21-FY26)
FY22
* The target revenue of $500M may include 10-20% from future acquisitions. ** Revenue includes the annualized revenue of TASKING based on the achievement of earnout.
$202M **6.9%
$125.7M26.8%
$152.0M20.9%
$169.3M11.4%
$72.5M14.7%
$99.1M18.4%
$83.7M15.4%
Revenue Growth %
EBITDA (Underlying)Margin %
Annual Recurring Revenue (ARR)Growth %
Revenue (Including TASKING)Growth %
FY21 FY26
100,000Subscribers
7
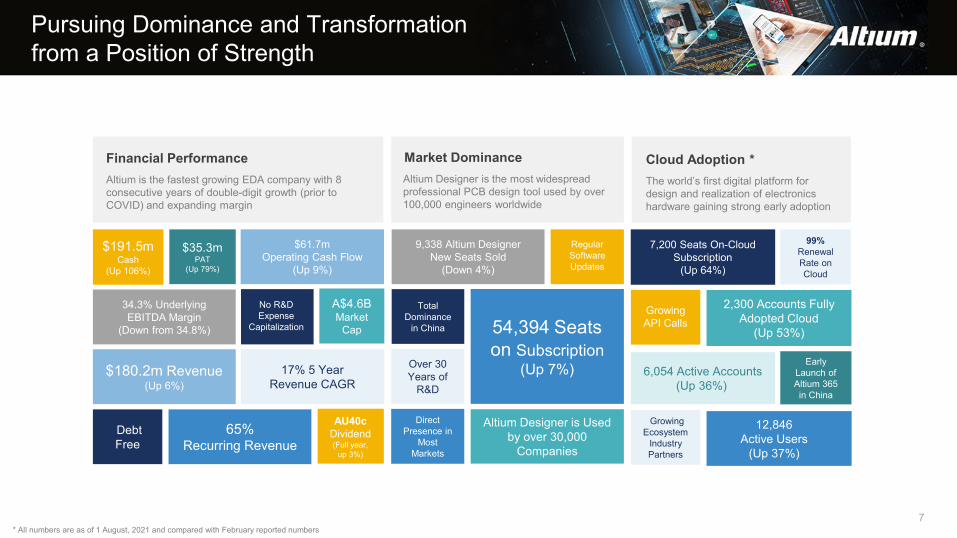
Pursuing Dominance and Transformation from a Position of Strength
Over 30 Years of
R&D
$61.7mOperating Cash Flow
(Up 9%)
9,338 Altium Designer New Seats Sold
(Down 4%)
Regular Software Updates
Altium Designer is Used by over 30,000
Companies
Total Dominance
in China
$180.2m Revenue (Up 6%)
$191.5mCash
(Up 106%)
$35.3mPAT
(Up 79%)
DebtFree
54,394 Seats on Subscription
(Up 7%)
65% Recurring Revenue
17% 5 Year Revenue CAGR
34.3% Underlying EBITDA Margin
(Down from 34.8%)
7,200 Seats On-Cloud Subscription
(Up 64%)
2,300 Accounts Fully Adopted Cloud
(Up 53%)
Financial PerformanceAltium is the fastest growing EDA company with 8 consecutive years of double-digit growth (prior to COVID) and expanding margin
Market DominanceAltium Designer is the most widespread professional PCB design tool used by over 100,000 engineers worldwide
Cloud Adoption *The world’s first digital platform for design and realization of electronics hardware gaining strong early adoption
A$4.6BMarket
Cap
No R&D Expense
Capitalization
Direct Presence in
Most Markets
* All numbers are as of 1 August, 2021 and compared with February reported numbers
AU40cDividend(Full year,
up 3%)
6,054 Active Accounts(Up 36%)
99% Renewal Rate on Cloud
Early Launch of Altium 365 in China
Growing Ecosystem
Industry Partners
12,846Active Users
(Up 37%)
Growing API Calls
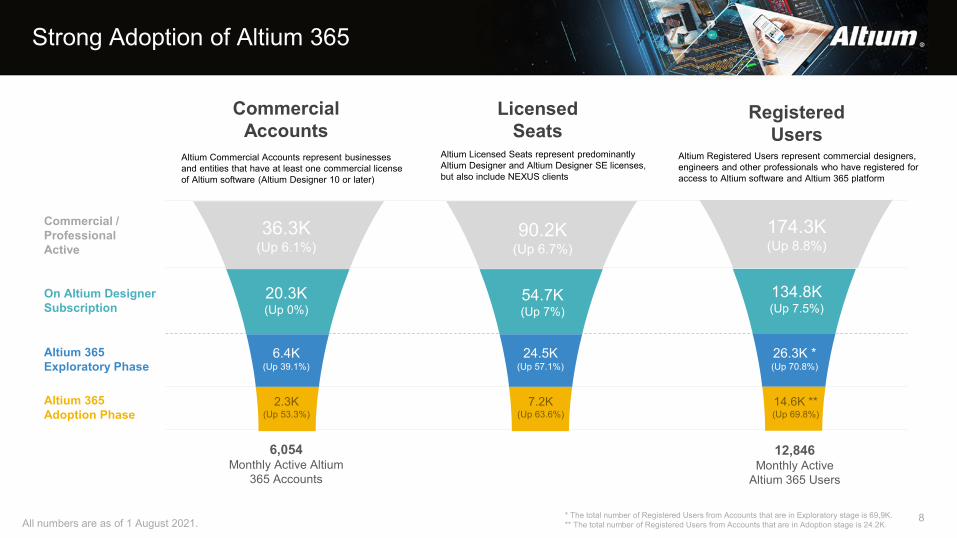
Strong Adoption of Altium 365
CommercialAccounts
LicensedSeats
RegisteredUsers
Commercial /ProfessionalActive
On Altium Designer Subscription
8
Altium 365 Exploratory Phase
Altium 365 Adoption Phase
36.3K(Up 6.1%)
20.3K(Up 0%)
6.4K (Up 39.1%)
2.3K (Up 53.3%)
Altium Commercial Accounts represent businesses and entities that have at least one commercial license of Altium software (Altium Designer 10 or later)
Altium Licensed Seats represent predominantly Altium Designer and Altium Designer SE licenses, but also include NEXUS clients
Altium Registered Users represent commercial designers, engineers and other professionals who have registered for access to Altium software and Altium 365 platform
90.2K(Up 6.7%)
54.7K(Up 7%)
24.5K (Up 57.1%)
7.2K (Up 63.6%)
174.3K(Up 8.8%)
134.8K(Up 7.5%)
* The total number of Registered Users from Accounts that are in Exploratory stage is 69,9K.** The total number of Registered Users from Accounts that are in Adoption stage is 24.2K.
6,054Monthly Active Altium
365 Accounts
12,846Monthly Active
Altium 365 Users
26.3K * (Up 70.8%)
14.6K ** (Up 69.8%)
All numbers are as of 1 August 2021.
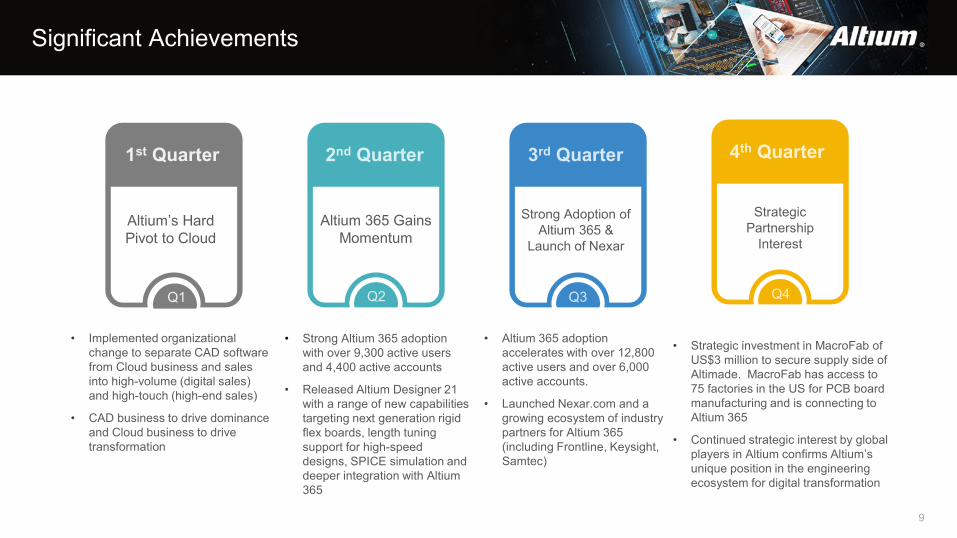
Significant Achievements
9
• Strategic investment in MacroFab of US$3 million to secure supply side of Altimade. MacroFab has access to 75 factories in the US for PCB board manufacturing and is connecting to Altium 365
• Continued strategic interest by global players in Altium confirms Altium’s unique position in the engineering ecosystem for digital transformation
Strong Adoption of Altium 365 &
Launch of Nexar
3rd Quarter
Q3
• Altium 365 adoption accelerates with over 12,800 active users and over 6,000 active accounts.
• Launched Nexar.com and a growing ecosystem of industry partners for Altium 365 (including Frontline, Keysight, Samtec)
4th Quarter
Q4
Strategic Partnership
Interest
• Strong Altium 365 adoption with over 9,300 active users and 4,400 active accounts
• Released Altium Designer 21 with a range of new capabilities targeting next generation rigid flex boards, length tuning support for high-speed designs, SPICE simulation and deeper integration with Altium 365
Altium’s Hard Pivot to Cloud
1st Quarter
Q1
• Implemented organizational change to separate CAD software from Cloud business and sales into high-volume (digital sales) and high-touch (high-end sales)
• CAD business to drive dominance and Cloud business to drive transformation
Altium 365 Gains Momentum
2nd Quarter
Q2
10
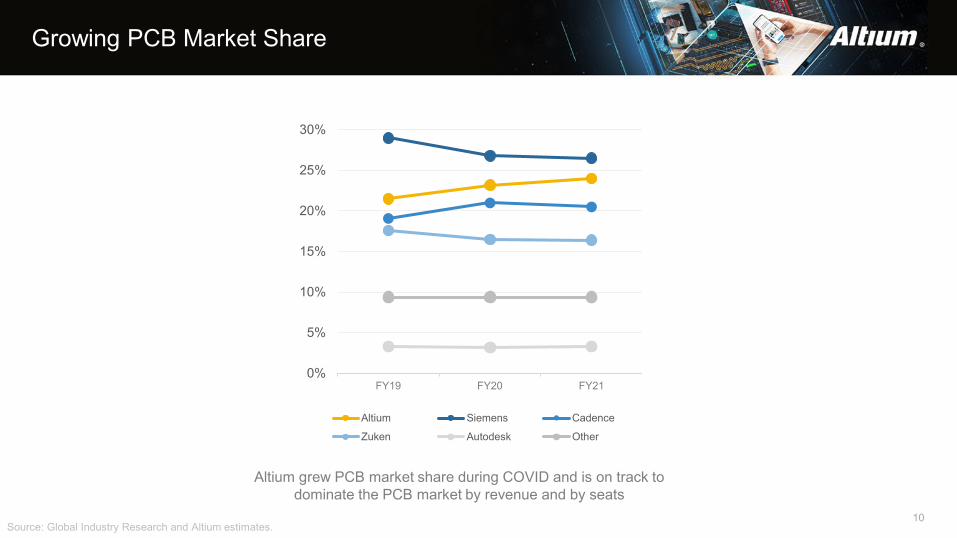
Growing PCB Market Share
Source: Global Industry Research and Altium estimates.
Altium grew PCB market share during COVID and is on track to dominate the PCB market by revenue and by seats
0%
5%
10%
15%
20%
25%
30%
FY19 FY20 FY21
Altium Siemens Cadence
Zuken Autodesk Other
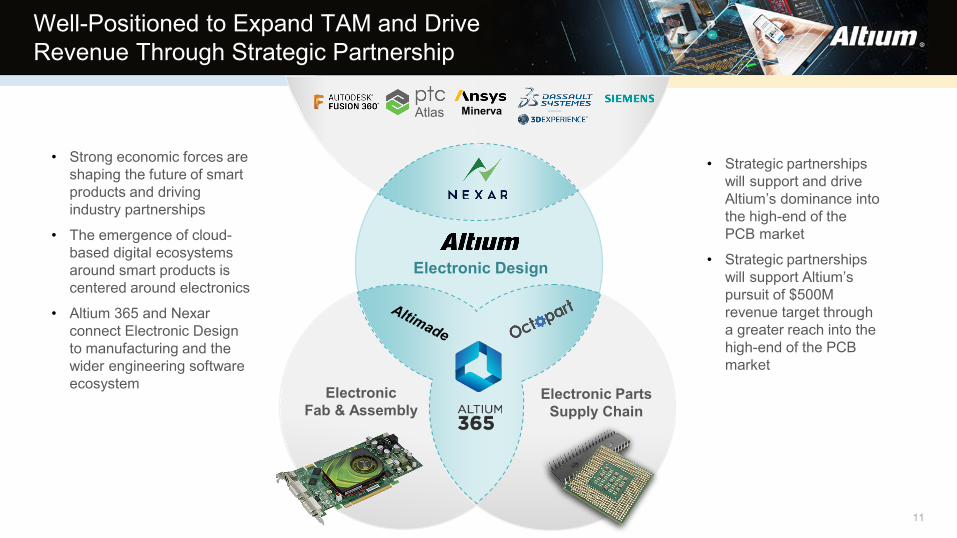
Well-Positioned to Expand TAM and Drive Revenue Through Strategic Partnership
Electronic Fab & Assembly
Electronic Parts Supply Chain
Electronic Design
$2 TrillionEstimated Size of the Electronic Industry 11
Atlas
• Strong economic forces are shaping the future of smart products and driving industry partnerships
• The emergence of cloud-based digital ecosystems around smart products is centered around electronics
• Altium 365 and Nexar connect Electronic Design to manufacturing and the wider engineering software ecosystem
• Strategic partnerships will support and drive Altium’s dominance into the high-end of the PCB market
• Strategic partnerships will support Altium’s pursuit of $500M revenue target through a greater reach into the high-end of the PCB market
Minerva
Agenda
2021 Full Year Financial Performance2
2021 Full Year Highlights1
4 Growth Engines and Flywheels for Dominance and Transformation
Appendix: Company Overview 5
3 Altium’s Unique Position in the Engineering Ecosystem
13
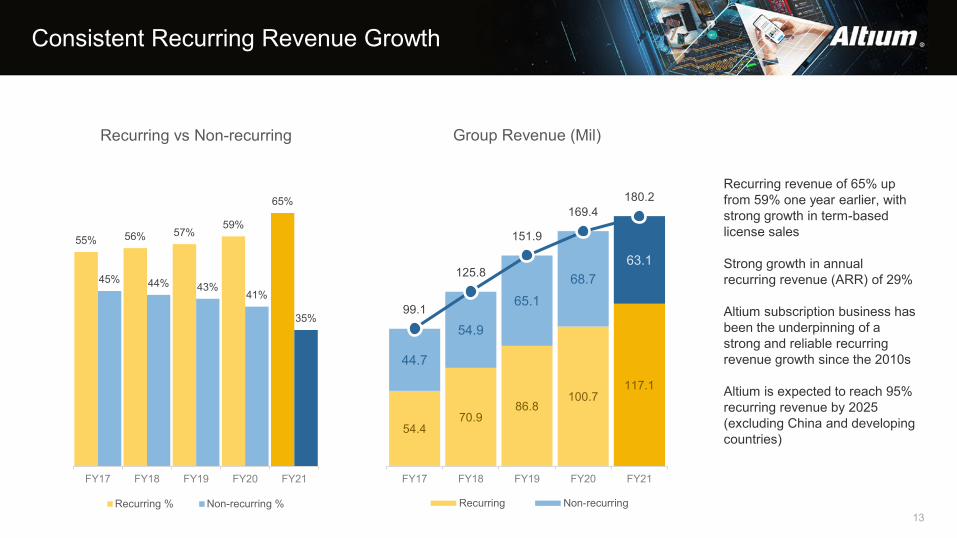
Consistent Recurring Revenue Growth
54.470.9
86.8100.7
117.1
44.7
54.9
65.168.7
63.1
99.1
125.8
151.9
169.4180.2
FY17 FY18 FY19 FY20 FY21
Group Revenue (Mil)
Recurring Non-recurring
55% 56% 57%59%
65%
45% 44% 43%41%
35%
FY17 FY18 FY19 FY20 FY21
Recurring vs Non-recurring
Recurring % Non-recurring %
Recurring revenue of 65% up from 59% one year earlier, with strong growth in term-based license sales
Strong growth in annual recurring revenue (ARR) of 29%
Altium subscription business has been the underpinning of a strong and reliable recurring revenue growth since the 2010s
Altium is expected to reach 95% recurring revenue by 2025 (excluding China and developing countries)
14
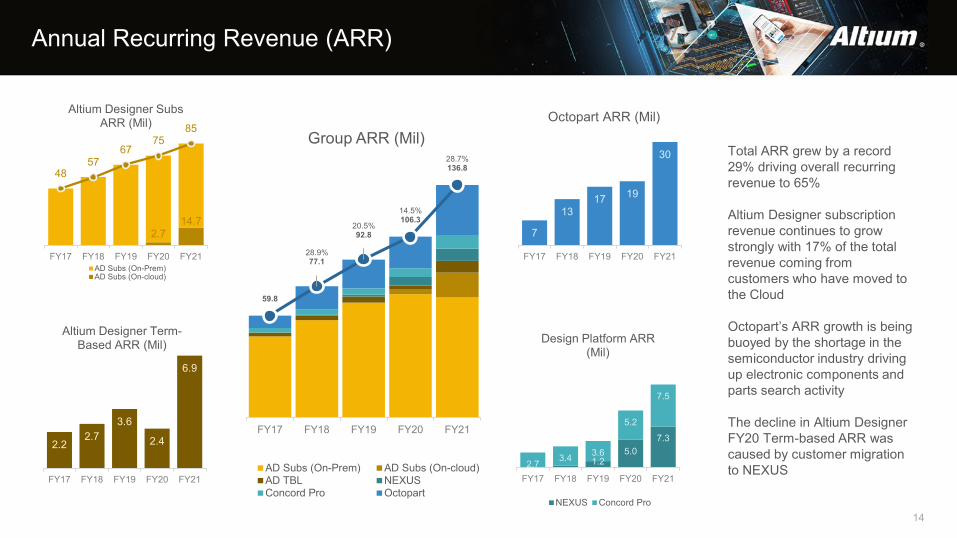
Annual Recurring Revenue (ARR)
59.8
28.9%77.1
20.5%92.8
14.5%106.3
28.7%136.8
FY17 FY18 FY19 FY20 FY21
Group ARR (Mil)
AD Subs (On-Prem) AD Subs (On-cloud)AD TBL NEXUSConcord Pro Octopart
2.714.7
4857
6775
85
FY17 FY18 FY19 FY20 FY21
Altium Designer Subs ARR (Mil)
AD Subs (On-Prem)AD Subs (On-cloud)
7
1317 19
30
FY17 FY18 FY19 FY20 FY21
Octopart ARR (Mil)
2.22.7
3.6
2.4
6.9
FY17 FY18 FY19 FY20 FY21
Altium Designer Term-Based ARR (Mil)
1.25.0
7.3
2.7 3.4 3.6
5.2
7.5
FY17 FY18 FY19 FY20 FY21
Design Platform ARR (Mil)
NEXUS Concord Pro
Total ARR grew by a record 29% driving overall recurring revenue to 65%
Altium Designer subscription revenue continues to grow strongly with 17% of the total revenue coming from customers who have moved to the Cloud
Octopart’s ARR growth is being buoyed by the shortage in the semiconductor industry driving up electronic components and parts search activity
The decline in Altium Designer FY20 Term-based ARR was caused by customer migration to NEXUS
15
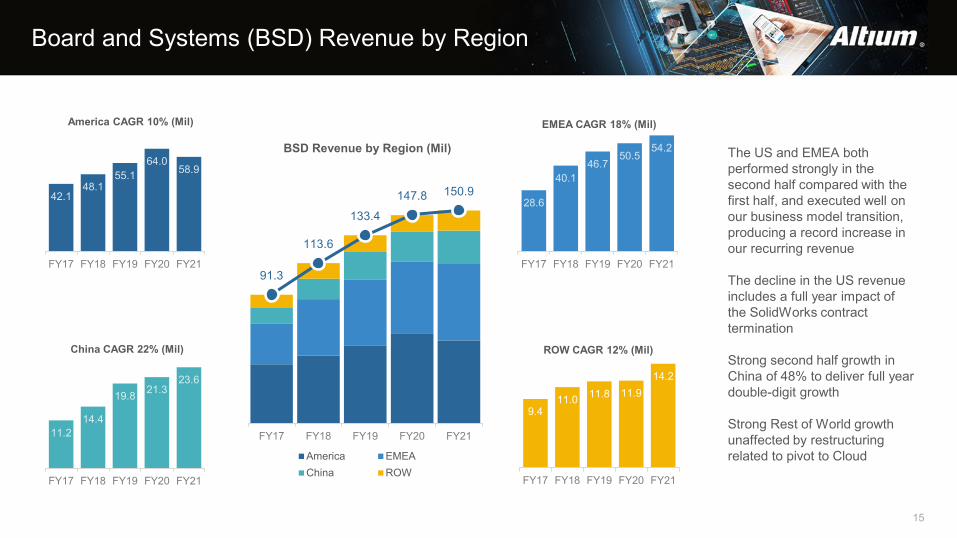
Board and Systems (BSD) Revenue by Region
42.148.1
55.164.0
58.9
FY17 FY18 FY19 FY20 FY21
America CAGR 10% (Mil)
91.3
113.6
133.4147.8 150.9
FY17 FY18 FY19 FY20 FY21
BSD Revenue by Region (Mil)
America EMEAChina ROW
28.6
40.146.7
50.554.2
FY17 FY18 FY19 FY20 FY21
EMEA CAGR 18% (Mil)
11.214.4
19.8 21.323.6
FY17 FY18 FY19 FY20 FY21
China CAGR 22% (Mil)
9.411.0 11.8 11.9
14.2
FY17 FY18 FY19 FY20 FY21
ROW CAGR 12% (Mil)
The US and EMEA both performed strongly in the second half compared with the first half, and executed well on our business model transition, producing a record increase in our recurring revenue
The decline in the US revenue includes a full year impact ofthe SolidWorks contract termination
Strong second half growth in China of 48% to deliver full year double-digit growth
Strong Rest of World growth unaffected by restructuring related to pivot to Cloud
9.88.6
FY17 FY18 FY19 FY20 FY21
NEXUS (Mil)
1.9 2.0
3.0 2.9
1.2
FY17 FY18 FY19 FY20 FY21
Other (CircuitStudio,SolidWorks PCB, PDN
Analyzer) (Mil)
16
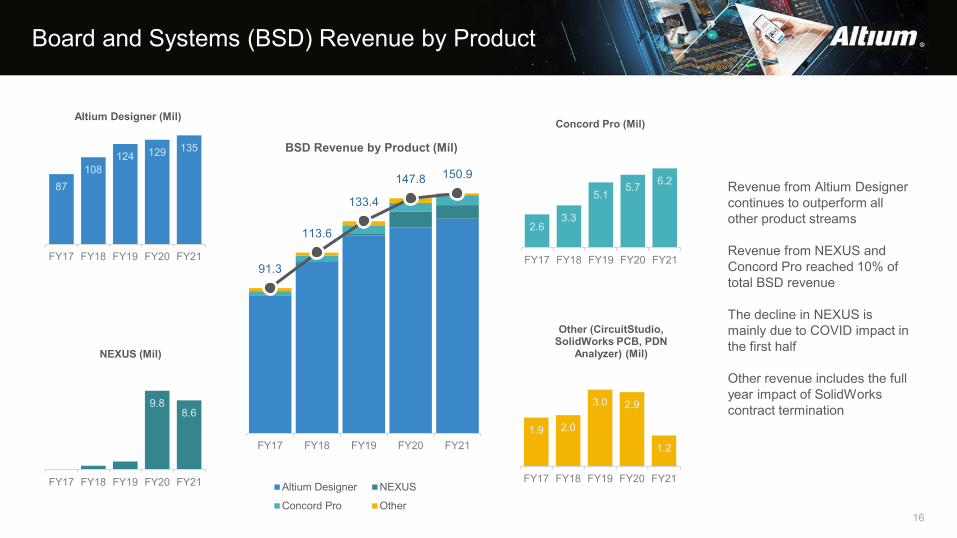
Board and Systems (BSD) Revenue by Product
91.3
113.6
133.4
147.8 150.9
FY17 FY18 FY19 FY20 FY21
BSD Revenue by Product (Mil)
Altium Designer NEXUS
Concord Pro Other
87108
124 129 135
FY17 FY18 FY19 FY20 FY21
Altium Designer (Mil)
2.63.3
5.15.7 6.2
FY17 FY18 FY19 FY20 FY21
Concord Pro (Mil)
Revenue from Altium Designer continues to outperform all other product streams
Revenue from NEXUS and Concord Pro reached 10% of total BSD revenue
The decline in NEXUS is mainly due to COVID impact in the first half
Other revenue includes the full year impact of SolidWorks contract termination
17
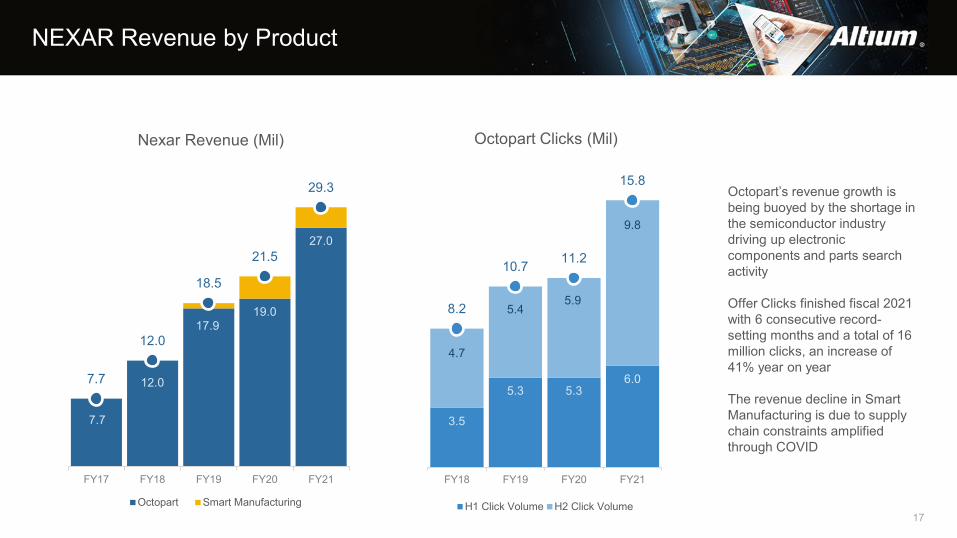
NEXAR Revenue by Product
7.7
12.0
17.919.0
27.0
7.7
12.0
18.5
21.5
29.3
FY17 FY18 FY19 FY20 FY21
Nexar Revenue (Mil)
Octopart Smart Manufacturing
3.5
5.3 5.36.0
4.7
5.45.9
9.8
8.2
10.7 11.2
15.8
FY18 FY19 FY20 FY21
Octopart Clicks (Mil)
H1 Click Volume H2 Click Volume
Octopart’s revenue growth is being buoyed by the shortage in the semiconductor industry driving up electronic components and parts search activity
Offer Clicks finished fiscal 2021 with 6 consecutive record-setting months and a total of 16 million clicks, an increase of 41% year on year
The revenue decline in Smart Manufacturing is due to supply chain constraints amplified through COVID
18
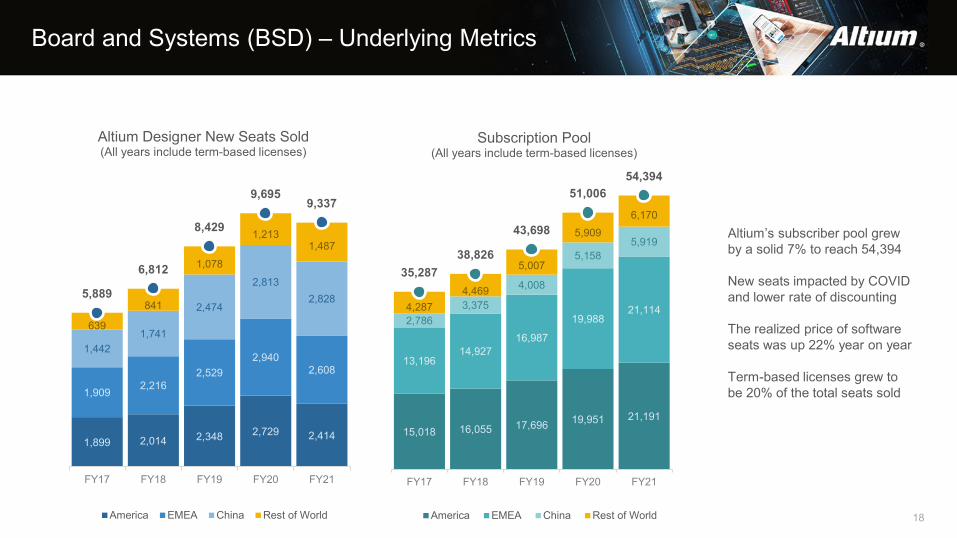
Board and Systems (BSD) – Underlying Metrics
1,899 2,014 2,348 2,729 2,414
1,909 2,2162,529
2,9402,608
1,4421,741
2,474
2,8132,828
639
841
1,078
1,2131,487
5,889
6,812
8,429
9,6959,337
FY17 FY18 FY19 FY20 FY21
Altium Designer New Seats Sold(All years include term-based licenses)
America EMEA China Rest of World
15,018 16,055 17,696 19,951 21,191
13,19614,927
16,987
19,98821,114
2,7863,375
4,008
5,1585,919
4,2874,469
5,007
5,9096,170
35,28738,826
43,698
51,00654,394
FY17 FY18 FY19 FY20 FY21
Subscription Pool(All years include term-based licenses)
America EMEA China Rest of World
Altium’s subscriber pool grew by a solid 7% to reach 54,394
New seats impacted by COVID and lower rate of discounting
The realized price of software seats was up 22% year on year
Term-based licenses grew to be 20% of the total seats sold
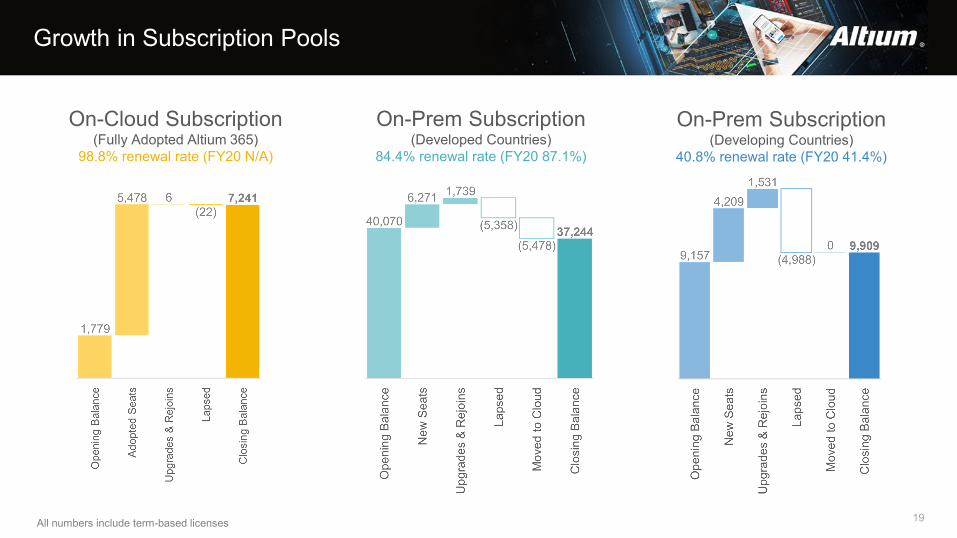
Growth in Subscription Pools
19
On-Cloud Subscription(Fully Adopted Altium 365)
98.8% renewal rate (FY20 N/A)
On-Prem Subscription(Developed Countries)
84.4% renewal rate (FY20 87.1%)
On-Prem Subscription(Developing Countries)
40.8% renewal rate (FY20 41.4%)
All numbers include term-based licenses
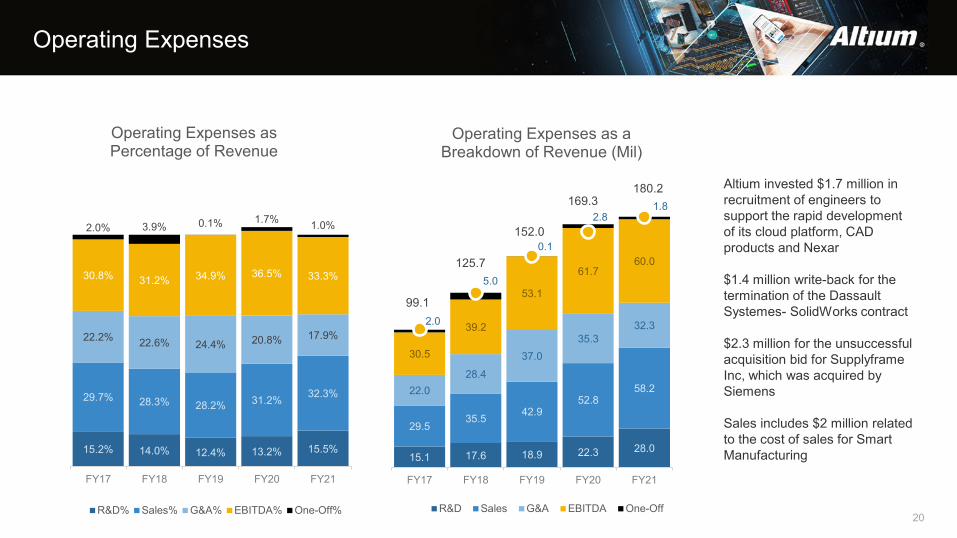
Operating Expenses
20
15.1 17.6 18.9 22.3 28.0
29.535.5 42.9
52.858.222.0
28.437.0
35.332.3
30.5
39.2
53.1
61.760.0
2.0
5.0
0.1
2.81.8
99.1
125.7
152.0
169.3180.2
FY17 FY18 FY19 FY20 FY21
Operating Expenses as a Breakdown of Revenue (Mil)
R&D Sales G&A EBITDA One-Off
Altium invested $1.7 million in recruitment of engineers to support the rapid development of its cloud platform, CAD products and Nexar
$1.4 million write-back for the termination of the Dassault Systemes- SolidWorks contract
$2.3 million for the unsuccessful acquisition bid for SupplyframeInc, which was acquired by Siemens
Sales includes $2 million related to the cost of sales for Smart Manufacturing15.2% 14.0% 12.4% 13.2% 15.5%
29.7% 28.3% 28.2% 31.2% 32.3%
22.2% 22.6% 24.4% 20.8% 17.9%
30.8% 31.2% 34.9% 36.5% 33.3%
2.0% 3.9% 0.1% 1.7% 1.0%
FY17 FY18 FY19 FY20 FY21
Operating Expenses as Percentage of Revenue
R&D% Sales% G&A% EBITDA% One-Off%
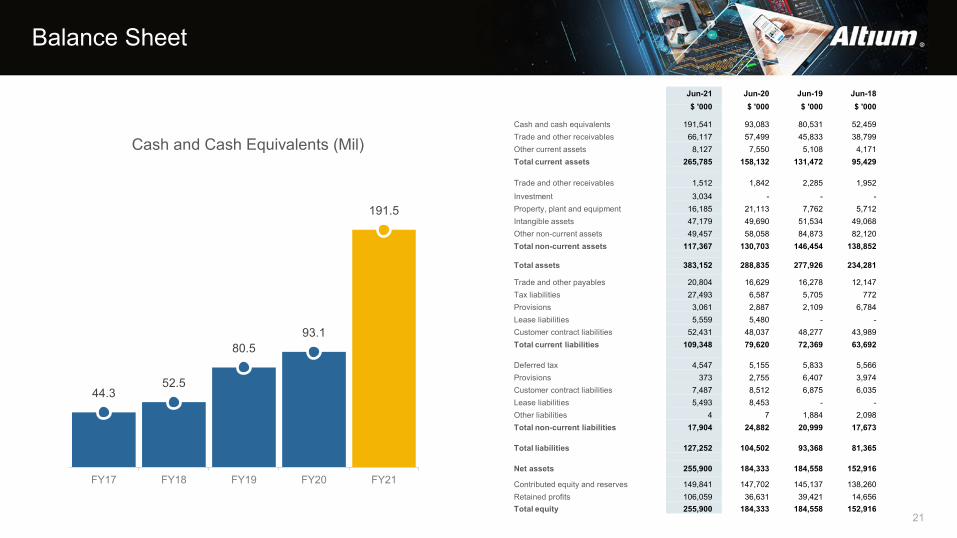
Balance Sheet
21
Jun-21 Jun-20 Jun-19 Jun-18$ '000 $ '000 $ '000 $ '000
Cash and cash equivalents 191,541 93,083 80,531 52,459Trade and other receivables 66,117 57,499 45,833 38,799Other current assets 8,127 7,550 5,108 4,171Total current assets 265,785 158,132 131,472 95,429
Trade and other receivables 1,512 1,842 2,285 1,952Investment 3,034 - - -Property, plant and equipment 16,185 21,113 7,762 5,712Intangible assets 47,179 49,690 51,534 49,068Other non-current assets 49,457 58,058 84,873 82,120Total non-current assets 117,367 130,703 146,454 138,852
Total assets 383,152 288,835 277,926 234,281
Trade and other payables 20,804 16,629 16,278 12,147Tax liabilities 27,493 6,587 5,705 772Provisions 3,061 2,887 2,109 6,784Lease liabilities 5,559 5,480 - -Customer contract liabilities 52,431 48,037 48,277 43,989 Total current liabilities 109,348 79,620 72,369 63,692
Deferred tax 4,547 5,155 5,833 5,566Provisions 373 2,755 6,407 3,974Customer contract liabilities 7,487 8,512 6,875 6,035Lease liabilities 5,493 8,453 - -Other liabilities 4 7 1,884 2,098Total non-current liabilities 17,904 24,882 20,999 17,673
Total liabilities 127,252 104,502 93,368 81,365
Net assets 255,900 184,333 184,558 152,916
Contributed equity and reserves 149,841 147,702 145,137 138,260Retained profits 106,059 36,631 39,421 14,656Total equity 255,900 184,333 184,558 152,916
44.352.5
80.593.1
191.5
FY17 FY18 FY19 FY20 FY21
Cash and Cash Equivalents (Mil)
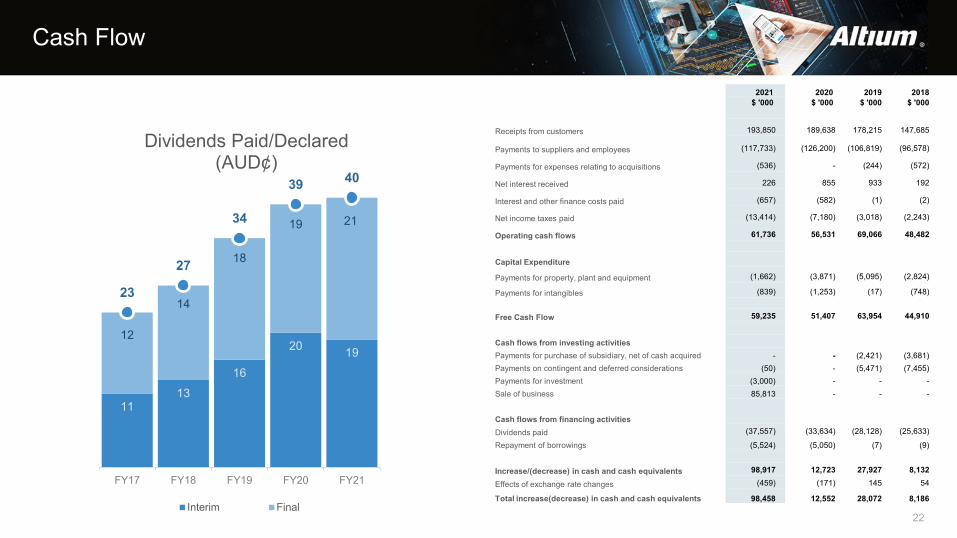
Cash Flow
2021 2020 2019 2018 $ '000 $ '000 $ '000 $ '000
-
Receipts from customers 193,850 189,638 178,215 147,685
Payments to suppliers and employees (117,733) (126,200) (106,819) (96,578)
Payments for expenses relating to acquisitions (536) - (244) (572)
Net interest received 226 855 933 192
Interest and other finance costs paid (657) (582) (1) (2)
Net income taxes paid (13,414) (7,180) (3,018) (2,243)
Operating cash flows 61,736 56,531 69,066 48,482
Capital Expenditure
Payments for property, plant and equipment (1,662) (3,871) (5,095) (2,824)
Payments for intangibles (839) (1,253) (17) (748)
Free Cash Flow 59,235 51,407 63,954 44,910
Cash flows from investing activitiesPayments for purchase of subsidiary, net of cash acquired - - (2,421) (3,681)Payments on contingent and deferred considerations (50) - (5,471) (7,455)Payments for investment (3,000) - - -Sale of business 85,813 - - -
Cash flows from financing activitiesDividends paid (37,557) (33,634) (28,128) (25,633)
Repayment of borrowings (5,524) (5,050) (7) (9)
Increase/(decrease) in cash and cash equivalents 98,917 12,723 27,927 8,132
Effects of exchange rate changes (459) (171) 145 54
Total increase(decrease) in cash and cash equivalents 98,458 12,552 28,072 8,186
22
1113
16
20 1912
14
18
19 21
23
27
34
39 40
FY17 FY18 FY19 FY20 FY21
Dividends Paid/Declared(AUD¢)
Interim Final
23
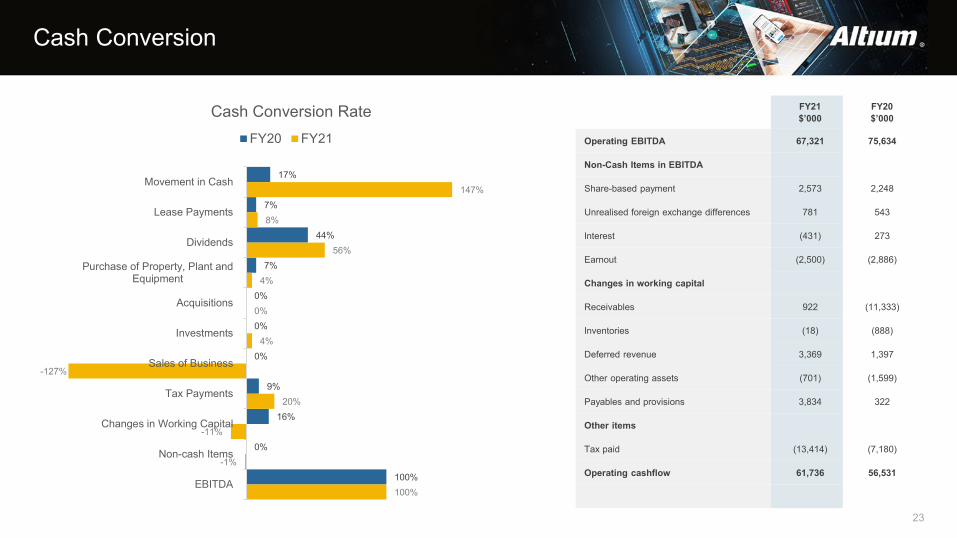
Cash Conversion
FY21$’000
FY20$’000
Operating EBITDA 67,321 75,634
Non-Cash Items in EBITDA
Share-based payment 2,573 2,248
Unrealised foreign exchange differences 781 543
Interest (431) 273
Earnout (2,500) (2,886)
Changes in working capital
Receivables 922 (11,333)
Inventories (18) (888)
Deferred revenue 3,369 1,397
Other operating assets (701) (1,599)
Payables and provisions 3,834 322
Other items
Tax paid (13,414) (7,180)
Operating cashflow 61,736 56,531
17%
7%
44%
7%
0%
0%
0%
9%
16%
0%
100%
147%
8%
56%
4%
0%
4%
-127%
20%
-11%
-1%
100%
Movement in Cash
Lease Payments
Dividends
Purchase of Property, Plant andEquipment
Acquisitions
Investments
Sales of Business
Tax Payments
Changes in Working Capital
Non-cash Items
EBITDA
Cash Conversion RateFY20 FY21
24
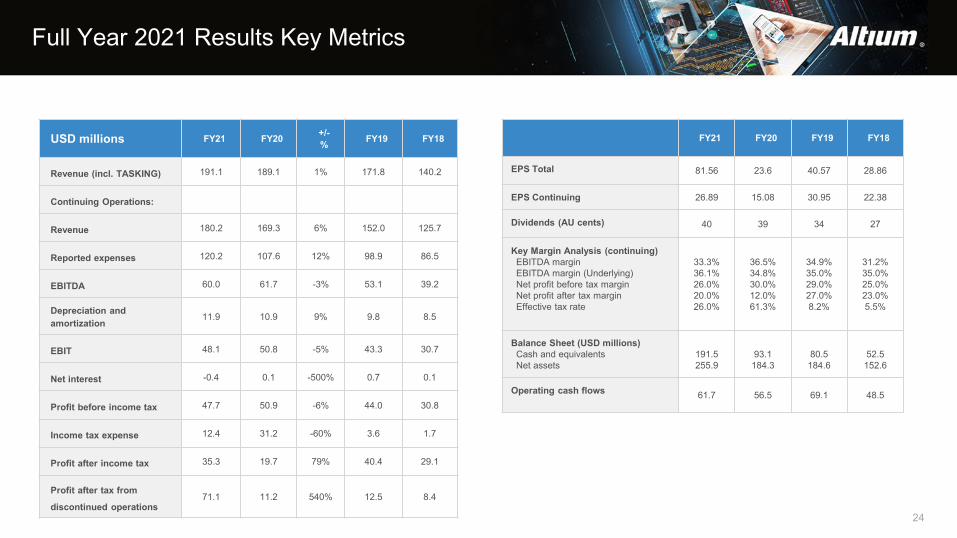
Full Year 2021 Results Key Metrics
USD millions FY21 FY20 +/-% FY19 FY18
Revenue (incl. TASKING) 191.1 189.1 1% 171.8 140.2
Continuing Operations:
Revenue 180.2 169.3 6% 152.0 125.7
Reported expenses 120.2 107.6 12% 98.9 86.5
EBITDA 60.0 61.7 -3% 53.1 39.2
Depreciation and amortization 11.9 10.9 9% 9.8 8.5
EBIT 48.1 50.8 -5% 43.3 30.7
Net interest -0.4 0.1 -500% 0.7 0.1
Profit before income tax 47.7 50.9 -6% 44.0 30.8
Income tax expense 12.4 31.2 -60% 3.6 1.7
Profit after income tax 35.3 19.7 79% 40.4 29.1
Profit after tax from
discontinued operations71.1 11.2 540% 12.5 8.4
FY21 FY20 FY19 FY18
EPS Total 81.56 23.6 40.57 28.86
EPS Continuing 26.89 15.08 30.95 22.38
Dividends (AU cents) 40 39 34 27
Key Margin Analysis (continuing)EBITDA marginEBITDA margin (Underlying)Net profit before tax marginNet profit after tax marginEffective tax rate
33.3%36.1%26.0%20.0%26.0%
36.5%34.8%30.0%12.0%61.3%
34.9%35.0%29.0%27.0%8.2%
31.2%35.0%25.0%23.0%5.5%
Balance Sheet (USD millions)Cash and equivalentsNet assets
191.5255.9
93.1184.3
80.5184.6
52.5152.6
Operating cash flows 61.7 56.5 69.1 48.5
Agenda
2021 Full Year Financial Performance2
2021 Full Year Highlights1
4 Growth Engines and Flywheels for Dominance and Transformation
Appendix: Company Overview 5
3 Altium’s Unique Position in the Engineering Ecosystem

Electronics at the Heart of All Intelligent Systems
26
Printed Circuit Boards are central to the design & realization of electronics and smart connected products
Nasa’s Mars Ingenuity Copter’s electronics were designed using Altium software
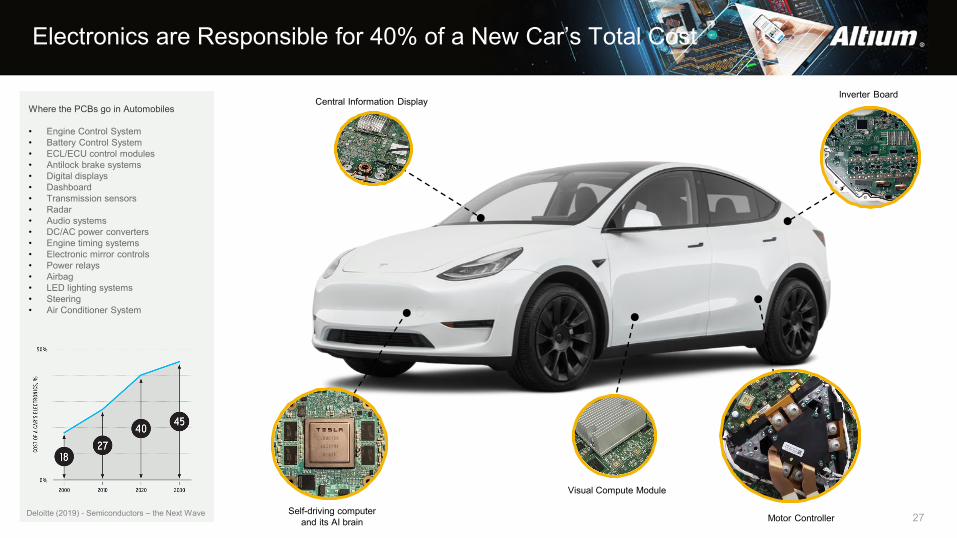
Electronics are Responsible for 40% of a New Car’s Total Cost
27Self-driving computer and its AI brain
Central Information Display
Visual Compute Module
Inverter Board
Motor Controller
Where the PCBs go in Automobiles
• Engine Control System• Battery Control System• ECL/ECU control modules• Antilock brake systems• Digital displays• Dashboard• Transmission sensors• Radar• Audio systems• DC/AC power converters• Engine timing systems• Electronic mirror controls• Power relays• Airbag• LED lighting systems• Steering• Air Conditioner System
Deloitte (2019) - Semiconductors – the Next Wave
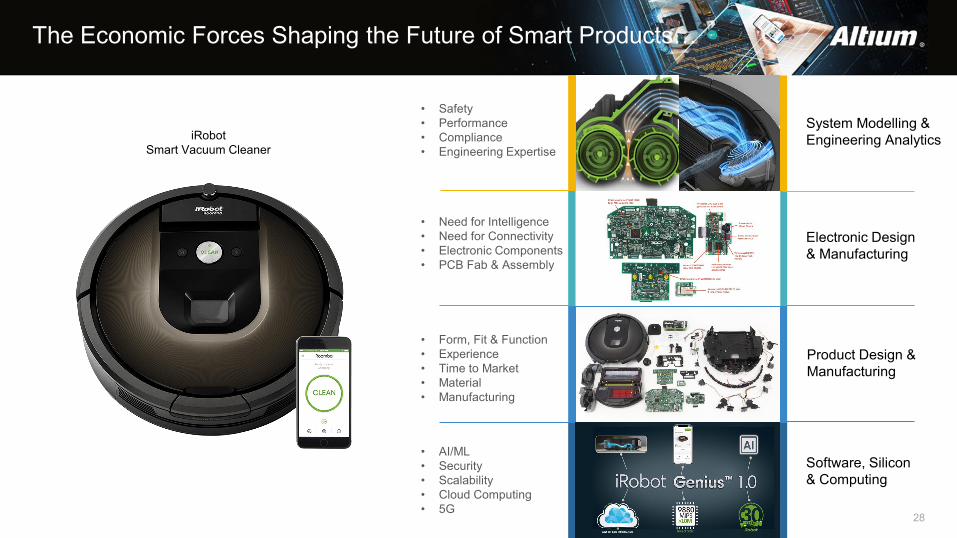
The Economic Forces Shaping the Future of Smart Products…
Product Design & Manufacturing
Software, Silicon & Computing
Electronic Design & Manufacturing
System Modelling & Engineering Analytics
• Safety• Performance• Compliance• Engineering Expertise
• Need for Intelligence • Need for Connectivity• Electronic Components• PCB Fab & Assembly
• Form, Fit & Function• Experience• Time to Market • Material• Manufacturing
• AI/ML• Security• Scalability• Cloud Computing• 5G
iRobotSmart Vacuum Cleaner
28
System Modelling & Engineering Analytics
Electronic Design & Manufacturing
Product Design & Manufacturing
Software, Silicon & Computing
29
Atlas
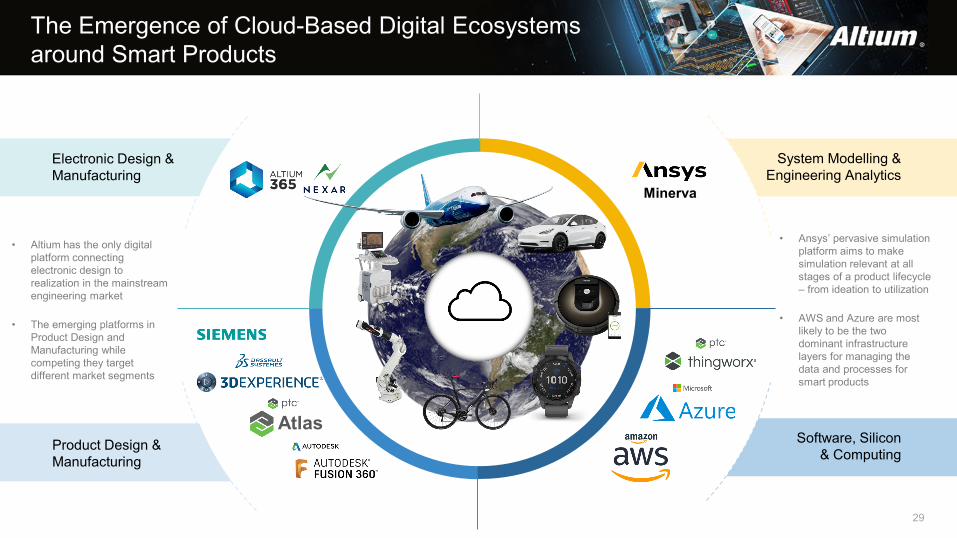
The Emergence of Cloud-Based Digital Ecosystems around Smart Products
• Ansys’ pervasive simulation platform aims to make simulation relevant at all stages of a product lifecycle – from ideation to utilization
• AWS and Azure are most likely to be the two dominant infrastructure layers for managing the data and processes for smart products
• Altium has the only digital platform connecting electronic design to realization in the mainstream engineering market
• The emerging platforms in Product Design and Manufacturing while competing they target different market segments
Minerva
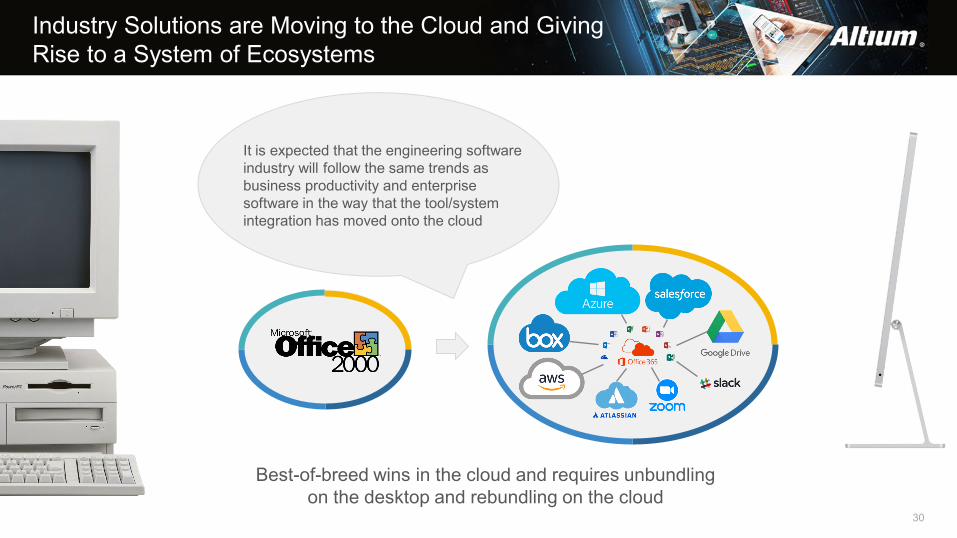
Industry Solutions are Moving to the Cloud and Giving Rise to a System of Ecosystems
30
Best-of-breed wins in the cloud and requires unbundling on the desktop and rebundling on the cloud
It is expected that the engineering software industry will follow the same trends as business productivity and enterprise software in the way that the tool/system integration has moved onto the cloud
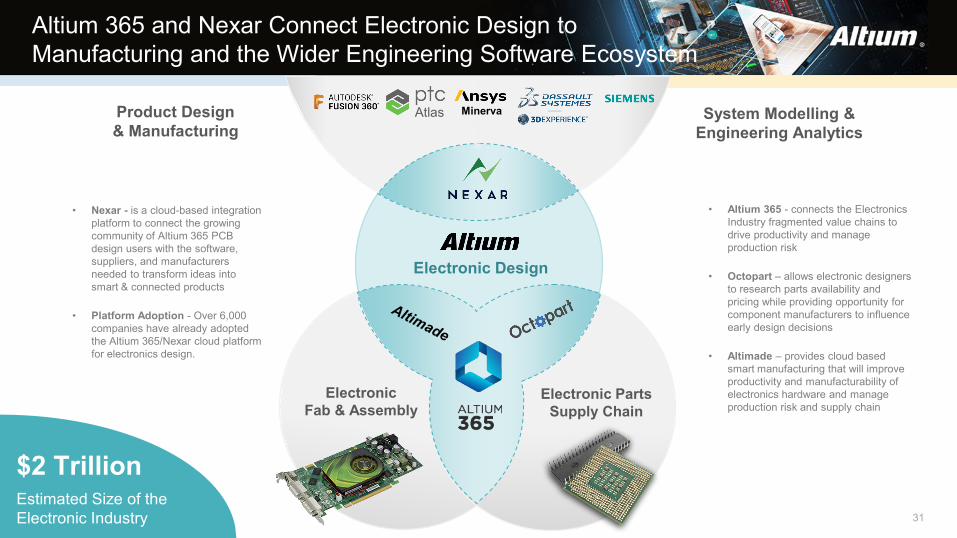
Altium 365 and Nexar Connect Electronic Design to Manufacturing and the Wider Engineering Software Ecosystem
Electronic Fab & Assembly
Electronic Parts Supply Chain
System Modelling & Engineering Analytics
Product Design & Manufacturing
Electronic Design
$2 TrillionEstimated Size of the Electronic Industry
• Nexar - is a cloud-based integration platform to connect the growing community of Altium 365 PCB design users with the software, suppliers, and manufacturers needed to transform ideas into smart & connected products
• Platform Adoption - Over 6,000 companies have already adopted the Altium 365/Nexar cloud platform for electronics design.
• Altium 365 - connects the Electronics Industry fragmented value chains to drive productivity and manage production risk
• Octopart – allows electronic designers to research parts availability and pricing while providing opportunity for component manufacturers to influence early design decisions
• Altimade – provides cloud based smart manufacturing that will improve productivity and manufacturability of electronics hardware and manage production risk and supply chain
31
Atlas Minerva
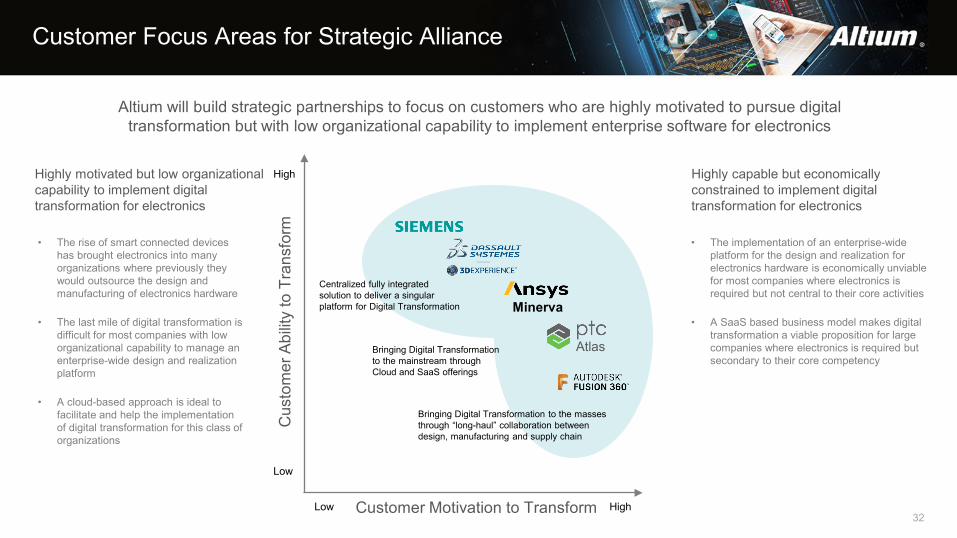
Customer Focus Areas for Strategic Alliance
32
Cus
tom
er A
bilit
y to
Tra
nsfo
rm
Customer Motivation to Transform
High
Low
Low High
Minerva
• The rise of smart connected devices has brought electronics into many organizations where previously they would outsource the design and manufacturing of electronics hardware
• The last mile of digital transformation is difficult for most companies with low organizational capability to manage an enterprise-wide design and realization platform
• A cloud-based approach is ideal to facilitate and help the implementation of digital transformation for this class of organizations
• The implementation of an enterprise-wide platform for the design and realization for electronics hardware is economically unviable for most companies where electronics is required but not central to their core activities
• A SaaS based business model makes digital transformation a viable proposition for large companies where electronics is required but secondary to their core competency
Highly motivated but low organizational capability to implement digital transformation for electronics
Highly capable but economically constrained to implement digital transformation for electronics
Altium will build strategic partnerships to focus on customers who are highly motivated to pursue digital transformation but with low organizational capability to implement enterprise software for electronics
Centralized fully integrated solution to deliver a singular platform for Digital Transformation
Bringing Digital Transformation to the mainstream through Cloud and SaaS offerings
Bringing Digital Transformation to the masses through “long-haul” collaboration between design, manufacturing and supply chain
Atlas
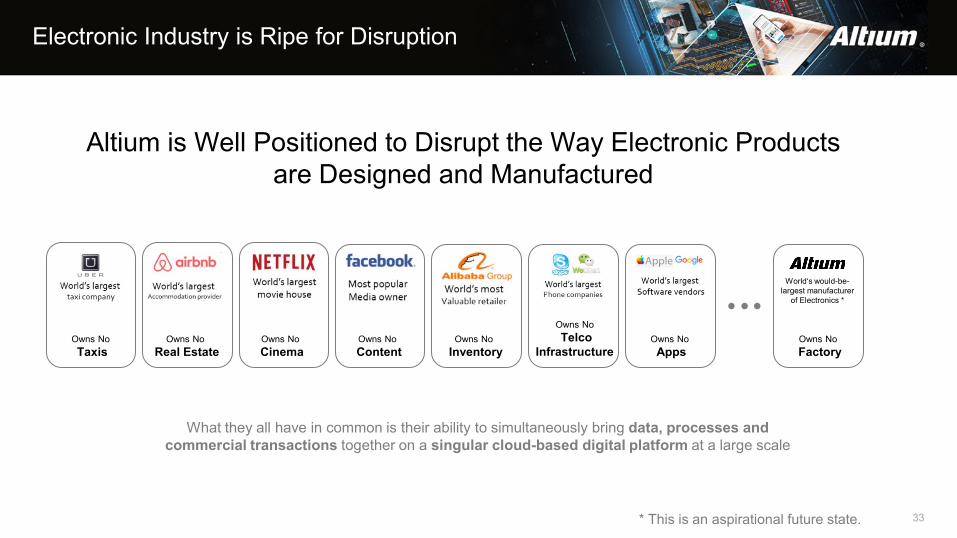
Electronic Industry is Ripe for Disruption
33
Owns NoTaxis
Owns NoReal Estate
Owns NoCinema
Owns NoContent
Owns NoInventory
Owns NoTelco
InfrastructureOwns NoApps
What they all have in common is their ability to simultaneously bring data, processes and commercial transactions together on a singular cloud-based digital platform at a large scale
Altium is Well Positioned to Disrupt the Way Electronic Products are Designed and Manufactured
Owns NoFactory
World‘s would-be-largest manufacturer
of Electronics *
* This is an aspirational future state.
Agenda
2021 Full Year Financial Performance2
2021 Full Year Highlights1
4 Growth Engines and Flywheels for Dominance and Transformation
Appendix: Company Overview 5
3 Altium’s Unique Position in the Engineering Ecosystem

From Market Leadership to Dominance and Transformation
Altium must target 100,000 active subscribers by 2025 to compel key industry stakeholders to support its agenda to transform electronic design and its realization
Pursuit of Market Leadership
Pursuit of Market Dominance
Pursuit of Industry Transformation
Lead
35
Unify Transform

Altium’s Hard Pivot to the Cloud
36
Software Business(Dominance Engine) Cloud Business
(Transformation Engine)
Product
Go-To-Market
Professional Channel
CAD Software
Altium 365Cloud Platform
Digital Channel
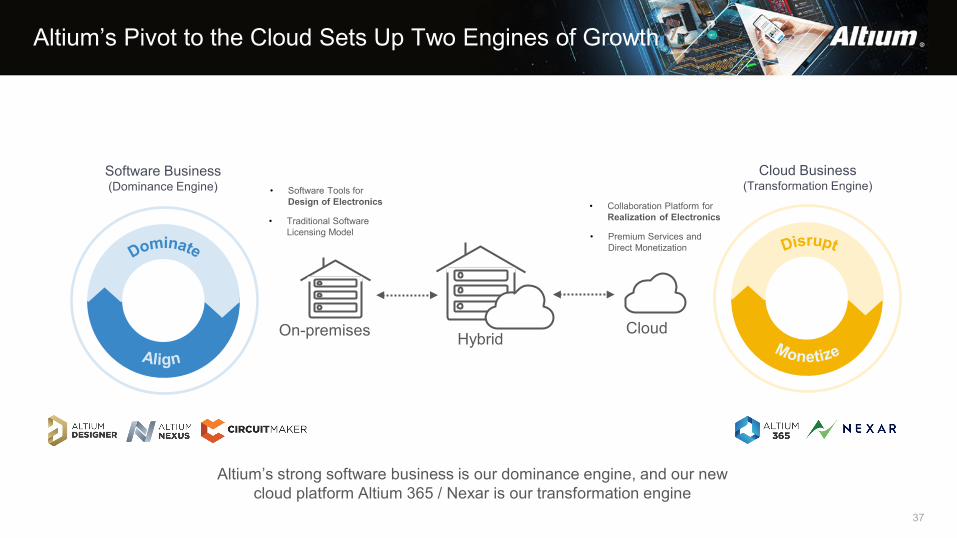
Altium’s Pivot to the Cloud Sets Up Two Engines of Growth
37
Software Business(Dominance Engine)
Cloud Business (Transformation Engine)
• Traditional Software Licensing Model
• Software Tools for Design of Electronics • Collaboration Platform for
Realization of Electronics
• Premium Services and Direct Monetization
CloudOn-premises Hybrid
Altium’s strong software business is our dominance engine, and our new cloud platform Altium 365 / Nexar is our transformation engine
38
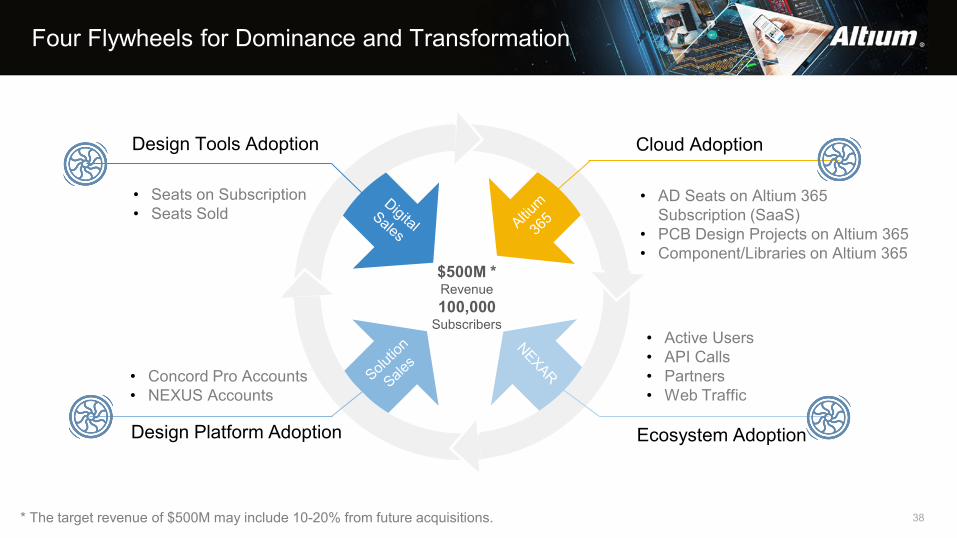
Four Flywheels for Dominance and Transformation
Cloud AdoptionDesign Tools Adoption
Ecosystem AdoptionDesign Platform Adoption
• AD Seats on Altium 365 Subscription (SaaS)
• PCB Design Projects on Altium 365• Component/Libraries on Altium 365
• Seats on Subscription• Seats Sold
• Active Users• API Calls• Partners• Web Traffic
• Concord Pro Accounts• NEXUS Accounts
$500M *Revenue100,000
Subscribers
* The target revenue of $500M may include 10-20% from future acquisitions.

39
Guidance and Long-Term Outlook
• A return to strong pre-COVID growth in fiscal 2022
• Digital sales platform to drive volume and strategic partnerships to expand TAM in PCB design for the high-end
• Altium 365 cloud adoption to further accelerate and reduce subscription churn
• Confident of achieving the flight path for dominance of US$500 million, 100,000subscribers and 95% recurring revenue, ex-China and developing countries
• Altium commits to the guided range for the full year fiscal 2022:
o Revenue of US$209 million to US$217 million (16-20% growth)o Underlying EBITDA margin of 34-36%o ARR growth of 23-27%
Agenda
2021 Full Year Financial Performance2
2021 Full Year Highlights1
4 Growth Engines and Flywheels for Dominance and Transformation
Appendix: Company Overview 5
3 Altium’s Unique Position in the Engineering Ecosystem
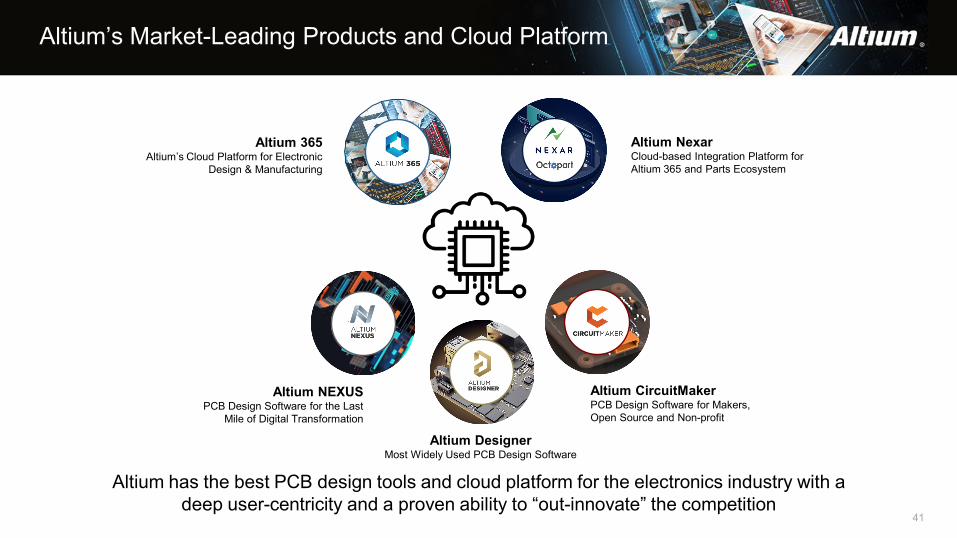
Altium’s Market-Leading Products and Cloud Platform
Altium DesignerMost Widely Used PCB Design Software
Altium NEXUSPCB Design Software for the Last
Mile of Digital Transformation
Altium 365Altium’s Cloud Platform for Electronic
Design & Manufacturing
Altium NexarCloud-based Integration Platform for Altium 365 and Parts Ecosystem
Altium has the best PCB design tools and cloud platform for the electronics industry with a deep user-centricity and a proven ability to “out-innovate” the competition
41
Altium CircuitMakerPCB Design Software for Makers, Open Source and Non-profit
42
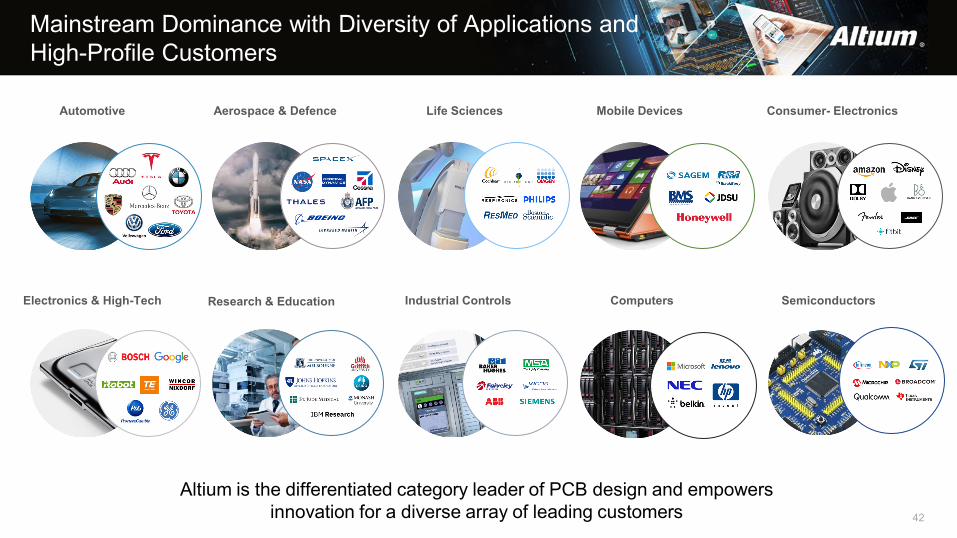
Mainstream Dominance with Diversity of Applications and High-Profile Customers
Automotive Aerospace & Defence Life Sciences Mobile Devices Consumer- Electronics
Electronics & High-Tech Research & Education Industrial Controls Computers Semiconductors
Altium is the differentiated category leader of PCB design and empowers innovation for a diverse array of leading customers
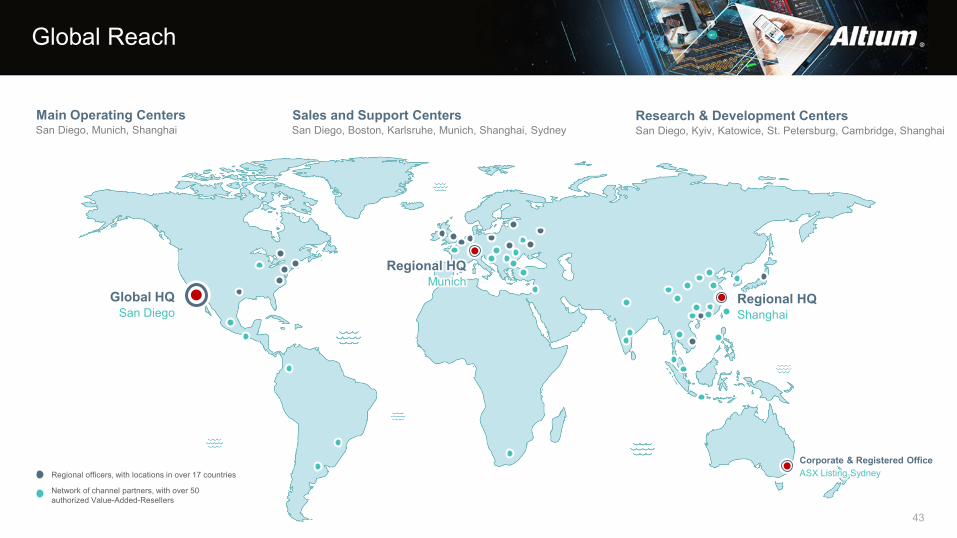
Global Reach
Regional officers, with locations in over 17 countries
Network of channel partners, with over 50 authorized Value-Added-Resellers
Main Operating CentersSan Diego, Munich, Shanghai
Sales and Support CentersSan Diego, Boston, Karlsruhe, Munich, Shanghai, Sydney
Research & Development Centers
Regional HQMunich
Global HQSan Diego
Regional HQShanghai
Corporate & Registered OfficeASX Listing Sydney
San Diego, Kyiv, Katowice, St. Petersburg, Cambridge, Shanghai
43
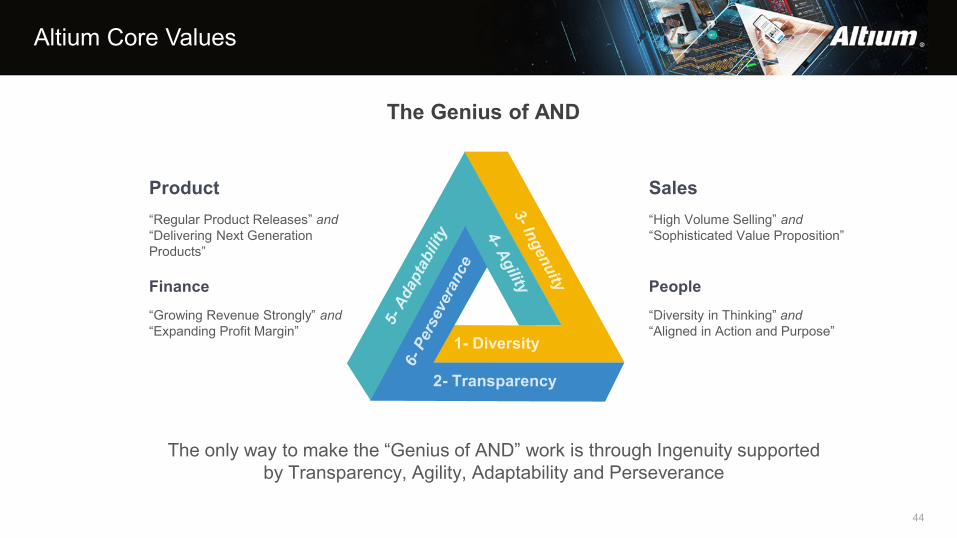
Altium Core Values
44
1- Diversity
2- Transparency
The only way to make the “Genius of AND” work is through Ingenuity supported by Transparency, Agility, Adaptability and Perseverance
The Genius of AND
“Growing Revenue Strongly” and“Expanding Profit Margin”
“Regular Product Releases” and“Delivering Next Generation Products”
“High Volume Selling” and“Sophisticated Value Proposition”
Sales
PeopleFinance
Product
“Diversity in Thinking” and“Aligned in Action and Purpose”
45
Guidance and Long-Term Outlook
• A return to strong pre-COVID growth for fiscal 2022
• Digital sales platform to drive volume and strategic partnerships to expand TAM in PCB design for the high-end
• Altium 365 cloud adoption to further accelerate and reduce subscription churn
• Confident of achieving the flight path for dominance of US$500 million, 100,000 subscribers and 95% recurring revenue, ex-China and developing countries
• Altium commits to the guided range for the full year fiscal 2022:
o Revenue of US$209 million to US$217 million (16-20% growth)o Underlying EBITDA margin of 34-36%o ARR growth of 23-27%