Embed Size (px)
Citation preview
Altruism and the Child-Cycle of Alumni Donations
by
Jonathan Meer, Stanford University Harvey S. Rosen, Princeton University
CEPS Working Paper No. 150
May 2007
Acknowledgements: We are grateful to B. Douglas Bernheim, William Bowen, Ronald Ehrenberg, Jean Grossman, Bo Honore, Donna Lawrence, Brian McDonald, Ashley Miller, John Morgan, Sriniketh Nagavarapu, Andres Santos, Julie Shadle and Burton Weisbrod for useful suggestions. Brent Newhouse and Zhihao Zhang provided excellent research assistance. This research was supported in part by Princeton’s Center for Economic Policy Studies and in part by the Stanford Institute for Economic Policy Research.
ABSTRACT
Altruism and the Child-Cycle of Alumni Giving
This paper uses a unique data set to assess whether donors’ contributions to a nonprofit institution are affected by the perception that the institution might confer a reciprocal benefit. We study alumni contributions to an anonymous research university. Inter alia, the data include information on the ages of the alumni’s children, whether they applied for admission to the university, and if so, whether they were accepted. The premise of our analysis is simple: If alumni believe that donations will increase the like-lihood of admission for their children and if this belief helps motivate their giving, then the pattern of giving should vary systematically with the ages of their children, whether the children ultimately apply to university, and the outcome of the admissions process. We refer to this pattern as the child-cycle of alumni giving.
If the child-cycle is operative, one would observe that, ceteris paribus, the pres-ence of children increases the propensity to give, that giving drops off after the admis-sions decision is made, and that the decline is greater when the child is rejected by the university. Further, under the joint hypothesis that alumni can reasonably predict the likelihood that their children will someday apply to the university and that reciprocity in the form of a higher probability of admission is expected, we expect that alumni with children in their early teens who eventually apply will give more than alumni whose teenagers do not. The evidence is strongly consistent with the child-cycle pattern. Thus, while al-truism drives some giving, the hope for a reciprocal benefit plays a role as well. Using our results, we compute rough estimates of the proportion of giving due to selfish mo-tives. Jonathan Meer Harvey S. Rosen Department of Economics Department of Economics Stanford University Princeton University Stanford, CA 94305 Princeton, NJ 08544 [email protected] [email protected]
1. Introduction
In an essay on the economics of altruism, Samuelson [1993, p. 143] writes
Mesmerized by Homo economicus, who acts solely on egoism, economists shy away from altruism almost comically. Caught in a shameful act of heroism, they aver: “Shucks, it was only enlightened self interest.” Sometimes it is. At other times it may be only rationalization… “If I rescue somebody’s son, someone will rescue mine.”
Samuelson concludes that such arguments render economists guilty of “face saving tau-
tologies.” Bergstrom and Stark [1993, p. 149] similarly criticize economists’ stance to-
ward altruistic behavior: “Why are economists convinced that Homo economicus is self-
ish? No doubt we find considerable support for this hypothesis in the behavior of our
colleagues.”
However, the notion that mainstream economics categorically rejects the exis-
tence of altruism is essentially false. As noted below, a substantial theoretical literature
explicitly allows for the possibility that human behavior is unselfish and draws out the
implications of altruism in a variety of contexts. Contrary to Samuelson, it would be
more accurate to characterize economists’ view of the importance of altruism as agnostic
rather than skeptical. They are willing to contemplate the possibility that altruism is an
important motivator of behavior, but at the same time do not rule out selfishness. Clot-
felter’s [1985] important volume on charitable giving is typical in this regard. In an in-
troductory section, he provides a list of possible motivations for charity. Some involve
narrow self-interest, such as the expectation that donors and their families will receive
services in return, or favorable publicity for their businesses. But the list gives equal
footing to altruism, associated with social norms or a sense of duty or commitment.
2
Clotfelter takes no position on the relative importance of the various motivations, mere-
ly observing that they could all be operative.1
Of course, saying that both selfishness and altruism can be present does not tell
us that both motivations actually guide behavior. This is an empirical question, but
empirical work using observational data is rare in this area. Perhaps the primary reason
is the difficulty of measuring the benefits that donors expect to receive. Without quanti-
fiable indicators of the potential selfish benefits, one cannot estimate how responsive
giving is to their existence.
This paper uses a unique data set that allows us to assess whether donors’ con-
tributions to a nonprofit institution are affected by the expectation of a reciprocal bene-
fit. We study alumni contributions to an anonymous selective research university, hen-
ceforth referred to as Anon U. The proprietary data provided by Anon U contain de-
tailed information about donations made by alumni as well as a variety of their eco-
nomic and demographic characteristics. The data also include information on the ages of
the children of the alumni, whether they applied for admission to Anon U, and if so,
whether they were accepted. The premise of our analysis is simple: If alumni believe
that donations increase the likelihood of their children being accepted to Anon U and if
this belief helps motivate their giving, then the pattern of giving should vary systemati-
cally with the age of their children, whether the children ultimately apply to Anon U,
and the outcome of the admissions process. Specifically, if reciprocity influences the be-
havior of donors, one would expect that, ceteris paribus, the presence of children in-
creases the propensity to give, that giving drops off after the admissions decision is ren-
dered, and that the decline is greater when the child is rejected. We refer to this pattern
as the child-cycle of alumni giving.
1 In the same way, Dugan et al. [1999, p.2] ascribe a number of motivations to university donors. The list includes “avoidance of social stigma, tax incentives, recognition for generosity, a response to past or deterrence to future so-licitation, and quid pro quo for services rendered indirectly such as access to elite social circles or business con-tacts.” However, at the top of their list is “pure altruism.”
3
An interesting feature of this phenomenon is that the institution makes no prom-
ise of reciprocity whatsoever. True, children of Anon U alumni have a higher rate of ac-
ceptance than other students,2 but this does not prove that having a parent who made
donations in the past increases a child’s likelihood of admission. Nevertheless, the view
that reciprocity exists is widespread. As one account of the college admissions process
stated, “Traditionally, universities have relied on gifts from alumni, who are rewarded
with ‘legacy’ preferences for their children.” [Golden, 2006, p. A10]. Perceptions of re-
ciprocity may be reinforced by university administrators who link the acceptance of
alumni children to financial support of their institutions. In a recent interview with the
Wall Street Journal, the president of Princeton University was asked, “Why does Prin-
ceton give admissions preference to alumni children…?” Her response was, “We are
deeply dependent on the generosity of our alumni each and every year… They are ex-
tremely important to the financial well-being of this university.” (Hechinger [2006, p.
B1]). We know of no statistical evidence on whether alumni donations at any university
affect admissions probabilities for their children, and if so, how much. For our purposes,
the key insight is that generating the child-cycle of alumni giving requires only the per-
ception of reciprocity.
Determining whether a child life-cycle exists is important because of the oppor-
tunity it provides to shed light on the general issue of altruism. Gaining a better under-
standing of the motivations for alumni giving is also of independent interest because of
its importance to the financing of higher education. In 2004-05, alumni contributed $7.1
billion to higher education, about 28 percent of all voluntary support.3
2 According to public information, children of alumni at Anon U are accepted at roughly three times the rate as other applicants. However, Bowen et al. [2005] document the importance of correcting for differences in the characteris-tics of applicant pools when assessing the importance of legacy preferences. 3 Other sources of voluntary support include other individuals, corporations, foundations, and religious and other organizations. See Chronicle of Higher Education [2006].
4
In Section 2 we briefly review some pertinent previous research in this area, with
particular emphasis on theoretical work that helps motivate a child-cycle framework.
Section 3 describes the data and econometric framework. The results are presented in
Section 4. The evidence is strongly consistent with the child-cycle pattern. Alumni par-
ents of teenage children who eventually apply to Anon U make larger donations than
alumni whose children do not eventually apply. Once an alumnus’s child is accepted, his
donations fall off substantially. If the child is rejected, giving falls off dramatically. Sec-
tion 5 discusses the sensitivity of the results to alternative specifications of the model.
Section 6 concludes with a summary and suggestions for additional research.
2. Previous Literature
The role of altruism in human behavior has long been of interest to economists.
As Kolm [2000b, p. 7] notes, “all great economists have considered the effects of positive
social sentiments,” including Smith, Mill, Walras, Pareto, and Bentham. In more recent
times, notions of altruism have been brought to bear in theoretical analyses of charitable
giving (Becker [1974]), rescues (Landes and Posner [1978]), commercial policy (Rotem-
berg [2000]) and remittances of migrants to their home countries (Docquier and Rapo-
port [2000]), among other important social phenomena. Additional examples can be
found in Kolm [2000a].
Altruistic behavior within families has received particularly extensive attention
because of its implications for several important policy questions. In particular, the effi-
cacy of fiscal policy hinges on the extent to which intergenerational bequests are moti-
vated by altruism. Becker [1974] considers a theoretical model in which parents are al-
truistic and shows that, under certain assumptions — an important one being that par-
ents’ utility depends only on family income — they have no incentives to be strategic
with respect to their children. In contrast, Bernheim, Shleifer and Summers [1985] de-
5
velop a theory in which bequests are motivated not only by altruistic concern for chil-
dren, but also with the hope for reciprocity in the form of care or attention.
Theories relating to intra-family altruism have been tested in a rich econometric
literature. This literature has developed because there are observable variables related
to the selfish gains that might be obtained from seemingly altruistic behavior. For ex-
ample, one can look at the amount of contact between elderly parents and children and
how it is related to the parents’ bequeathable wealth. The results are mixed. Bernheim,
Shleifer and Summers [1985], Altonji et al. [1992] and Cigno and Rosati [2000] find evi-
dence that gifts from parents to children have a strategic component, while McGarry
and Schoeni [1995], Raut and Tran [2000] and Ioannides and Kan [2000] find that altru-
istic motives predominate.
Turning to the important case of charitable donations — which amounted to
about $250 billion in 20044 — researchers have more or less taken for granted that self-
ish motives play a role. According to Clotfelter [1985, p. 38], “Individuals may volunteer
for organizations in order for their families or themselves to consume services.” Weis-
brod [1978, p. 34] is more pointed: “The extent to which narrow self-interest lies behind
the donations of money and time to non-profit organizations is little understood, but
there can be no doubt that donors often do benefit through the making of business con-
tacts and the receipt of favorable publicity for good deeds.” Similarly, it has been sug-
gested that selfish motives may underlie donations to universities: “Donors demand at-
tention and prestige supplied by college fund raisers”5 [Yoo and Harrison,1989, p. 367].
Are such assertions valid? Schokkaert and Van Ootegem [2000] provide extensive
survey evidence of reasons for giving. Also, a number of laboratory experiments have
4 Giving USA Foundation [2005]. 5 This suggests that efforts by college development offices could be an important determinant of alumni giving. Certainly this is why colleges have such offices in the first place. While there is some evidence of a correlation between development costs and donations across institutions (Harrison, et al. [1995]), it is dif-ficult to ascribe a causal relationship because the variables are likely jointly determined.
6
investigated the extent to which contributions to public goods are marked by altruism.
(See, for example, Andreoni [1993] and List [2006].6 ) However, in marked contrast to
the literature on giving within the family, we have been able to find no statistical work
on motivations for charitable giving based on observational data. The same holds for
the voluminous literature on the determinants of alumni giving to their universities.7
Econometric studies of alumni giving have examined a wide array of variables: attitudi-
nal measures of satisfaction with the undergraduate experience, income, marital status,
number of children, occupation, the state of the stock market, marginal tax rates, gen-
der, ethnicity, academic performance as an undergraduate, extracurricular activities in-
cluding varsity athletics, membership in fraternities or other social clubs, whether the
individual received financial aid, performance of athletic teams, and so on.8 However, we
have found no systematic attempts at all to assess whether self-interest might have a
role in explaining giving behavior.
The likely reason for the dearth of such research is the absence of measurable in-
dicators of the benefits that donors expect to receive in return for their donations. Our
study is premised on the notion that alumni believe that donations enhance the prob-
ability that their children will be admitted to their alma mater. Therefore, the presence
of children, their ages, and their admissions status are measurable indicators of the po-
tential for reciprocal benefits generated by donations. In this view, alumni believe that
donations buy them entrance into a lottery whose prize is admissions for their children.
Framing the issue this way suggests a connection between alumni giving and
Morgan’s [2000] theory of lotteries as a mechanism for financing public goods. Morgan
observes that lotteries are often held by private charities. He shows that, under a broad
set of conditions, lotteries raise the level of provision of a public good relative to stan-
6 For an ethnographic approach to studying motivations for charitable giving, see Odendahl [1990]. 7 Taylor and Martin [1995] provide an extensive survey of variables that have been analyzed in previous studies. 8 See, for example, Clotfelter [2003], Monks [2003], Shulman and Bowen [2001, Chapter 10], Taylor and Martin [1995], and Wunnava and Lauze [2001].
7
dard voluntary contribution schemes—a lottery increases giving, ceteris paribus. An-
other of Morgan’s important findings is that as the lottery becomes more “discriminat-
ing” (that is, the prize is more likely to go to whomever donates the most money), the
overall giving level increases.9
Our child-cycle framework fits well within Morgan’s model. Here, the public good
is the donation to the university, which benefits its students, faculty, and society at
large. The power of our test comes from the fact that only alumni with children can
play the lottery, and among those who have children, the value depends on their ages.
In particular, the value is relatively high for the parents of teenagers who plan to apply
to their parents’ alma mater. On the other hand, once a child is past the college admis-
sions age, playing the lottery has no value at all.
As we stressed above, whether the probability of one’s child being admitted de-
pends on prior or expected future donations is unknown.10 However, as long as alumni
perceive that their contributions improve their children’s chances of being admitted and
that greater contributions by others lessen the odds, Morgan’s mechanism is operative.11
3. Data and Econometric Model
3.1 Data
Our primary data source is the administrative archives of Anon U’s Development
Office, which contain information on all alumni donations from 1983 to 2006. The data
are proprietary and sensitive, and individuals’ names were stripped from the records be-
fore being made available to us. Our unit of observation is a yearly giving opportunity.
9 This particular result is demonstrated in an unpublished 1995 working paper with the same title as the published version. 10 In particular, our data do not allow us to explore this hypothesis for Anon U as we have no information on the attributes of rejected students. (See below.) 11 However, the mapping from Morgan’s model into the alumni donation problem is not perfect. The model assumes that the impact on the amount that is donated upon the probability of winning is common knowledge, which is clearly not true in our context.
8
For example, if an individual has been an alumna for 5 years, she accounts for 5 giving
opportunities in our analysis, starting in the first fiscal year after graduation. Multiple
gifts in the same year are summed together. The Development Office data also include
information on academic major, extracurricular activities when the alumnus was an un-
dergraduate, post graduate education, occupation, residence, whether he or she is mar-
ried to another graduate of Anon U, as well as information on the age and admissions
status of the alumnus’s children. Anon U’s Registrar supplemented these data with in-
formation on SAT scores, academic honors, ethnicity, type of high school, summary
evaluations made by the Admissions Office during the application process, and grade
point average. The Registrar’s data are available only for the classes of 1972 and on-
wards, so we restrict most of our analysis to this group of individuals.
We begin with 547,836 observations, representing 35,556 alumni. We delete
27,992 observations because of missing data on the child’s age, essential information for
our analysis. 1,100 observations were deleted because the child withdrew his or her ap-
plication before a decision was rendered, and another 32,041 because of missing data for
other variables. Altogether, our analysis sample has 487,913 observations on a total of
32,488 alumni.
We focus on three dimensions of alumni giving. First is the probability that an
alumnus made any gift at all in a given year.12 Universities care about the proportion of
their alumni who make donations. Anon U, for example, makes considerable efforts to
contact as many alumni as possible, and urge them to give something, even if it is just a
few dollars. Second, we analyze the amount donated in any given year. Third, as is typ-
ically the case, a few relatively large gifts account for a disproportionate amount of
Anon U’s donations. For example, in 2006, the top one percent of gifts accounted for
69.2 percent of total giving. We estimate the probability that the alumnus is a “class
12 Pledges without an associated gift are not counted.
9
leader” in a given year, where a class leader is defined as an individual who donated an
amount greater than or equal to the 90th percentile of gifts in his or her class.
The mean and standard deviation of each of these variables are shown at the top
of Table 1.13 The unconditional mean gift (in 2006 dollars) is $466. The relatively large
standard deviation, $49,512, reflects the presence of enormous outliers. To reduce the
likelihood that outliers drive our results, we take the log of the amount given. 14 In addi-
tion, we also estimate our models (except for class leader) without the top 1 percent of
the observations, and find that the results are essentially unchanged. With respect to
the probability of giving, Table 1 shows that about 55.6 percent of the giving opportuni-
ties result in a donation to the university.
Most of the explanatory variables in the table are dichotomous. For each set of
dichotomous variables, the “omitted category” is the variable that is excluded from the
regressions. About 65.1 percent of our observations are associated with male alumni.
Historically, Anon U was an all-male institution, and did not confer degrees upon wom-
en until the 1970s. Whites comprise 81.9 percent of our observations. 57.9 percent of the
observations are associated with secondary education at a public school; almost 39 per-
cent with participation in undergraduate varsity athletics15; and 45.3 percent with indi-
viduals who receive honors when they graduate. About 40 percent receive a post bacca-
laureate degree.
Unfortunately, the data include no direct information on income, an important
determinant of giving (Shulman and Bowen [2001, p. 404]). We address this issue in two
ways. First, for a large subset of our alumni, we have information that is closely related
13 As noted above, these are summary statistics of our observations, which are not the same as summary statistics for the alumni themselves. In effect, the data in the table weight alumni characteristics by the number of years each alumnus was in the sample. Therefore, changes in the demographic structure of Anon U may not be fully evident. 14A logarithmic transformation presents problems for observations that take a value of zero. As noted be-low, we set 320 gifts that are greater than zero but less than or equal to $1.00 equal to $1.01. Therefore, observations for which there is no giving are associated with $1, whose logarithm is zero. 15 Varsity athletes are defined as those who participated in a varsity-level sport, not necessarily receiving a varsity letter. Club sports are defined as those that do not confer a varsity letter.
10
to permanent income, occupation and field.16 Table 2 shows the occupations and fields
for the 344,342 observations, representing 20,039 alumni, for which we have this infor-
mation.17 The fields of education, finance, health care and law are highly represented.
We re-estimate our basic models with this subsample including the occupation and field
data in order to see whether our substantive results are sensitive to their inclusion. As
shown below, they are not. Second, if we are willing to think of an alumnus’s permanent
income as an unchanging attribute (at least during our sample period), then we can
model it as a fixed effect. We show below that our substantive results are unchanged
with fixed effects estimation.
3.2 Characterizing the Child-Cycle.
We characterize the child-cycle by a vector of dichotomous variables indicating
whether the alumnus has a child, and if so, his or her age and admissions status. We
discuss the treatment of families with several children below. Recall that in our frame-
work, alumni with children believe that a gift to Anon U may some day generate a re-
ciprocal benefit, and therefore the presence of a child should increase the probability of
making a gift. Perhaps, though, having a child is correlated with unobserved variables
that also drive giving decisions. For example, individuals who become parents might
care about young people in general, and hence be particularly willing to support higher
education. But if so, there would be no reason to expect giving to decline just when the
child exceeds the age at which college admissions decisions are made. In contrast, the
child-cycle framework implies that once the child is beyond that age, giving will drop
off, because the admissions lottery is over. To examine how giving varies with the age of
the child, we include a series of dichotomous variables, CHILDi, which take a value of
16 In this context, it is important to note that a number of the variables in our basic specification are also correlated with income, including gender, ethnicity, college major and grade point average, advanced de-grees, years since graduation, and location. Moreover, Cunningham and Cochi-Ficano (2002) point out that SAT scores are closely related to family socioeconomic status as well. 17 Due to lack of reliable data regarding the start- and stop-dates of occupation and field, these variables indicate whether the alumnus was ever involved in that field or occupation, rather than whether they are involved during the particular year of observation.
11
one if the alumnus has a child of age i and zero otherwise. The range of i is from zero
(less than one year old) to 26 years and older.
Even if giving increases as admissions time approaches (at approximately 18
years old) and falls thereafter, hopes for reciprocity need not be at work. Perhaps, for
example, a child of college age reawakens fond memories of an alumnus’s undergraduate
days, or inspires thoughts of experiences that the alumnus and his child might share
during future parents’ weekends. This could lead to an increase in an alumnus’s propen-
sity to give. To investigate this possibility, we take advantage of information on
whether the child ultimately applies for admission. Suppose that by the time the child is
a teenager, an alumnus can reasonably estimate the probability that his or her child will
ultimately apply. Such an estimate could be based on the child’s expressed preferences
for type of college, academic performance, and so on. If so, the perceived payoff to the
admissions lottery should be higher for alumni whose children ultimately apply than
those who do not and so should their donations. We therefore include a set of interac-
tion terms, CHILDiAppl, which multiply CHILDi by a dichotomous variable that equals
one if a child of age i eventually applied to Anon U and zero otherwise. We assume that
parents can form reasonably accurate expectations about whether their children will ap-
ply only when the children are into their teens, so that CHILDiAppl is defined only for
values of i from 14 through 17. Under the joint hypothesis that alumni can predict with
some accuracy whether their children will apply and that expected reciprocity is a moti-
vation for giving, these interaction terms should have positive coefficients.
Similarly, we define a series of dichotomous variables, CHILDiNoAppl, which
equal one if the child ultimately did not apply and zero otherwise, with i running from
14 to 17. If expected reciprocity is present, the coefficients on these variables will be
smaller than those associated with the CHILDiAppl variables, but still positive. They
remain positive because presumably some parents in this group believe that their chil-
12
dren will apply, so their giving should be higher than that of members of the omitted
category, who have no children at all. A third series of dichotomous variables, CHILDi-
Young, equal of one if the child was not old enough to have applied by the end of our
sample in 2006, with i running from 14 to 16.
Turning now to the outcome of the admissions decision, we expect it to have no
impact on giving if altruism is the only motivation. On the other hand, to the extent
that giving is motivated by expected reciprocity, we expect parents of admitted children
to reduce giving, as there is no longer an expected gain.18 This effect will be attenuated
if these alumni perceive that Anon U has “held up its side of the bargain,” and recipro-
cate by continuing to give. Below, we examine some other reasons why admittance of
one’s child might not lead to a dramatic decrease in giving. Turning now to the parents
of rejected children, not only is the prospect of an expected gain gone, but the alumnus
may perceive that the university has not reciprocated properly, and therefore retaliates
by reducing donations even further.
To examine these conjectures about the impact of the admissions decision, we
create a set of dichotomous variables, CHILDiAcc, which equal one if the child applied
to Anon U and was accepted and zero otherwise; and CHILDiRej, which equal one if the
child applied to Anon U and was rejected and zero otherwise.19 For these variables, i
runs from 18 through 26 and over.
A complication arises when families have multiple children: which one should be
used for characterizing the child-cycle? In our basic results reported below, all the child-
cycle variables are defined in terms of the first child. This makes sense because the giv-
ing decision surrounding the first child is unaffected by any prior personal experience of
18 Reduced giving after admissions might be driven by income effects associated with tuition payments. If tuition is the important factor, then we would also expect to see decreases in giving among alumni whose children did not apply to Anon U but instead attended other institutions. As shown below, these alumni do not exhibit anything like the substantial decreases in giving that we see for the alumni of accepted children. 19 The data allow us to distinguish between those who are accepted but do not attend and those who do attend. However, nearly all of Anon U’s alumni children who are accepted to Anon U choose to attend; therefore, sample sizes are too small to accurately measure any differences in the two populations.
13
reciprocity. However, some of the giving that occurs during the first child’s cycle might
be affected by the presence of younger children. For example, alumni might continue to
make large donations after their first child is accepted out of concern about the admis-
sions prospects of younger children. Given the large number of child cycle variables, it is
infeasible to include in one model the cycles for multiple children and their interactions.
Therefore, we simply estimate the child-cycle based on the last child in the family. As
shown below, the substantive results are essentially the same as those based on the first
child.
It would be cumbersome and uninformative to report summary statistics for each
of the large number of variables that characterize the child-cycle. To provide some basic
information, we note that in 2006, the last year of our sample, 23.5 percent of the alum-
ni had at least one child; of those who had a child, the mean age was 13.6 years. Condi-
tional on reaching age 17, 1,501 alumni children, representing 52.9 percent of that sub-
sample, had applied to Anon U, and 37.2 percent were accepted.
3.4 Econometric Model
We model the decision to make a gift to Anon U with a probit model:
Prob(G jt) = Φ[α + CYCLE jtβ1 + X jtγ + YEARtβ2 + LOC jtβ3 + CLASS jβ4] ,
where Prob(Gjt) is the probability that alumnus j makes a gift in year t, Φ[•] is the cu-
mulative normal distribution function, CYCLE jt is the vector of variables characterizing
the child-cycle as discussed above, Xjt is a vector of the alumnus’s personal characteris-
tics, YEARt is a set of time effects, LOCjt is a set of location effects (state or foreign
country of residence) and CLASSj is a set of class effects (equal to one if the alumnus
graduated in a given year and zero otherwise). The time effects account for the impacts
14
of the state of the business cycle, the stock market, and so on.20 The class effects control
for common influences on alumni in the same class, such as the political milieu when
they were undergraduates, the presence of certain professors or administrators, and so
on.
As noted above, we have more than one observation per alumnus. Because the
errors for the observations on a given alumnus are likely to be correlated, the standard
errors are adjusted for clustering within individuals. Our analysis of class leaders also
uses a probit model; here the outcome variable is the probability that in a given year,
the alumnus made a gift that was greater than or equal to the gift made by the top 10
percent of his or her classmates.
When we turn to the actual amount of the gift, we face two issues that arise in
all studies of donative behavior. First, a substantial number of the observations are ze-
ro; second, there are a few very large outliers. For example, the three largest gifts in our
sample are $3.1, $6.0, and $31.1 million. To address the first issue, we use the Tobit es-
timator, which explicitly takes censoring into account. The second problem suggests
that we transform the data to reduce the influence of outliers. We take logarithms. Be-
cause the logarithm of zero is not defined, we set the 320 positive gifts that were less
than or equal to one dollar equal to one dollar and one cent. In effect, then, we have
censoring at the point where the logarithm of the gift is equal to zero, and can then ap-
ply Tobit straightforwardly. There is, of course, some arbitrariness to this procedure. To
assess its robustness, we also estimate the model in levels, first with the entire sample
and then eliminating the top one percent of the observations in order to reduce the im-
pact of outliers The substantive results with respect to the child-cycle variables are not
affected.
20 Bristol [1991] emphasizes the role of the stock market and Ehrenberg and Smith [2003] document the importance of macroeconomic conditions. Time effects also take into account changes in the value of the university’s endowment (Oster [2001]).
15
We assume that the determinants of the amount of giving are the same as those
that affect the probability of giving. As with the probit estimates, we correct for corre-
lation among the error terms for any given individual by using a clustering procedure.
4. Results
4.1. Probability of Making a Gift
Our basic results are reported in Table 3. To begin, column (1) shows each vari-
able’s marginal effect on the probability that an alumnus made any gift in a given year
and the associated standard error.21 We discuss the child-cycle variables and then turn
to the other covariates.
Consider first the CHILDi variables, each of which takes a value of one if the
alumnus had a child of age i during the year of the observation and zero otherwise.
When a child is born, the probability of making a donation increases by about 13 per-
centage points. The incremental effect of the child’s presence generally increases with
the child’s age, reaching about 17 percentage points by the time he or she is 13. These
coefficients are precisely estimated.
When children reach the age of 14, we distinguish between those who eventually
apply to Anon U and those who do not. The figures under the heading Child Did Not
Apply show the coefficients on interactions of a dichotomous variable equal to one if the
child did not apply with the child’s age, that is, the CHILDiNoAppl variables. The vari-
ables under Child Did Apply show the corresponding coefficients when the child eventu-
ally did apply, CHILDiAppl in our earlier notation. Comparing the two sets of coeffi-
cients, we see that at every age from 14 to 17, the incremental probability of giving is
greater for alumni whose children ultimately applied. The differences at each age are
statistically significant from each other. This differential is consistent with the joint hy-
21 The year, class, and location effects are not reported for brevity.
16
pothesis that alumni can reasonably predict the likelihood that their children will apply
to Anon U and that reciprocity in the form of admission is expected.22
The CHILDiAppl variables are defined only up to the age of 17. After that point,
we distinguish between successful and unsuccessful applications to Anon U.23 The coeffi-
cients under the Child Accepted heading indicate that, conditional on applying, the
probability of giving increases by about 34 percentage points for an alumnus whose 18
year old child is accepted. The incremental probability falls after acceptance (by age 20
it is down to 27 percentage points), but remains elevated into the child’s mid-20s. The
parents of unsuccessful applicants behave very differently. As the figures under Child
Rejected indicate, the incremental probability of making a gift falls off substantially at
age 18, and at ages 19 and beyond, it is essentially zero. At each age, the differences be-
tween probabilities for alumni whose children were accepted and those who were not are
statistically significant except for those whose children were 26 or older. Interestingly,
having a child rejected lowers the probability of giving to the level of alumni who have
no children. Indeed, for most ages one cannot reject the hypothesis that the coefficients
for individuals without children and parents of rejected children are the same.
To provide a better sense of the implications of the child-cycle coefficients in col-
umn (1), we graph them in Figure 1. The horizontal axis measures the child’s age, and
the vertical axis shows the incremental effect on the probability of making a gift (rela-
tive to having no children). The graph starts when the child is born and shows that
having a child increases the probability of giving by about 13 percentage points. At age
14, the line divides, showing the difference between alumni whose children do and do
not ultimately apply to Anon U. The gap between the two groups is substantial, and it
widens as the children approach college age. At age 18, the graph splits again, this time
22 Note also that this finding is inconsistent with the notion that the child-cycle pattern is due to the fundraising office focusing on alumni with children approaching college age. To explain this finding, one would have to argue that the fundraisers have perfect foresight with respect to the future behavior of alumni children. 23 Because our unit of observation is based on an entire year, there is some ambiguity in precisely when the admissions decision becomes known. The year in which the child turns 18 is a sensible choice.
17
between applicants who were rejected and those who were accepted at Anon U. At ad-
missions time, the probability of making a gift falls substantially for alumni whose chil-
dren were rejected. It also declines for those whose children were accepted, albeit by a
smaller amount.
One concern with our interpretation of these findings is that the likelihood of giv-
ing and the likelihood that a child applies to Anon U are both driven by some unob-
served third variable, perhaps the extent to which a parent feels an affinity to Anon U.
To investigate this possibility, we estimated a model in which CHILDiAppl and CHILD-
iNoAppl are included for ages 0 through 17. If our results are driven by affinity for Anon
U, then we would expect the differences between these variables at young ages to be as
important as when the children are teenagers. However, this is not the case. When the
dependent variable is the probability of making a gift, the joint hypothesis that the co-
efficients on CHILDiAppl and CHILDiNoAppl are equal for ages 0 through 13 cannot be
rejected (p = 0.1415). The same is true for amount given (p = 0.3083) and annual class
leader (p = 0.6902). These findings increase our confidence that the child-cycle results
are not being driven the alumnus’s unobservable affinity for Anon U. Further evidence
along these lines is presented in Section 5 below.
The patterns in Figure 1 cannot readily be explained by public good provision or
by a “warm glow” from giving. In contrast, the results fit well in the child-cycle frame-
work.
Other variables. The coefficients on the linear and quadratic terms for years since
graduation imply that the probability of making a gift falls for about the first 20 years
after graduation, and then turns upward. With respect to gender, men are 4.6 percent-
age points less likely to donate in a given year, ceteris paribus. Whites are more likely
to contribute than American Indians, African-Americans, Hispanics or Asians. The gap
is largest with African-Americans, who are 16 percentage points less likely to make a
gift than whites. These gender and ethnic/racial differentials are similar to those re-
18
ported in previous studies (Monks [1993]).24 Alumni who attended boarding or private
schools are somewhat more likely to contribute than those who attended public schools.
There is no discernible impact of home or alternative schooling on the probability of
giving relative to public school attendees.
As noted above, the admissions office produces summary evaluations of appli-
cants on the basis of both non-academic and academic criteria. An A is the highest
score and an E is the lowest score. Alumni who received the lowest non-academic rat-
ings at the time of admissions are 6.9 percentage points less likely to make donations.
On the other hand, students in the highest academic category are somewhat less likely
to make donations than those with lower ratings. SAT scores do not appear to have any
statistically significant impact on the probability of giving.
We now turn from variables that are known before matriculation at Anon U to
those that reflect the alumnus’s undergraduate experiences. Involvement in a varsity
sport increases the probability of giving by about 5 percentage points, and membership
in one of Anon U’s fraternities or sororities increases it by 13 percentage points.25 These
results are consistent with previous findings that students who were actively engaged in
extracurricular activities as undergraduates are more likely to make donations as alumni
(Dugan et al. [1999]). With respect to academic performance, receiving honors has no
effect on the probability of giving. However, the probability of giving increases with
grade point average (GPA). Those in the bottom quartile of the GPA distribution were
5.7 percentage points less likely to make a gift, while those in the third quartile were 2.1
percentage points less likely. There is no significant difference in giving between the sec-
ond and top quartiles.
24 Some of these differentials may be due to the fact that income and wealth differ across ethnic groups. As noted below, when we re-estimate the model for a subsample of our data which includes some reason-able measures of permanent income, the differentials do not disappear. 25 Several organizations did not provide membership information for the class of 2001 and above. Interact-ing indicators for those classes with the Greek indicator did not change the estimate of the main coeffi-cient substantially.
19
Consistent with earlier studies, giving patterns differ substantially by course of
study (Dugan, et al. [1999], Monks [2003]). Alumni who majored in engineering, eco-
nomics and public policy have relatively high probabilities of making a gift later in life;
majors in the small social sciences departments (such as sociology) and small humanities
departments (such as linguistics) tend to have relatively low probabilities. Students with
minors in finance are more likely to make subsequent gifts (by about 9 percentage
points), while those with minors in theater are less likely (by about 7 percentage
points).
Turning to schooling after Anon U, alumni who continue their education are
more likely to make donations than those who do not, a finding consistent with previous
studies (Dugan et al., [1999], Monks [2003]). Finally, we note that, consistent with pre-
vious research (Grant and Lindauer [1986], Olsen et al. [1989]) the likelihood of giving
increases substantially during reunion years, with the probability increasing by 6.3 per-
centage points.
Taken together, our results are very much in line with those from previous stud-
ies. While no school is “typical,” Anon U appears not to be idiosyncratic with respect to
the determinants of the donation decision. It is not unreasonable to expect, therefore,
that the child-cycle results would also generalize to other selective institutions.
4.2 Amount of Giving
Each entry in column (2) of Table 3 shows the unconditional marginal effect of
the corresponding variable on the amount given. Because the dependent variable is the
logarithm of giving, small coefficients are approximately percentage changes. However,
this approximation is not very good for large coefficients, so caution is required in their
interpretation. Qualitatively, just as in column 1, the coefficients are consistent with the
child-cycle framework. Having a child increases the expected logarithm of the amount of
giving by 0.76, or roughly 114 percent. Once the child enters the teens, parents whose
children eventually apply to Anon U give more than parents whose children do not. For
20
example, at age 15, the logarithm of giving is 1.38 higher (about 223 percent) for par-
ents of future applicants than for individuals without children. The corresponding coeffi-
cient for alumni whose children do not eventually apply is 1.01 (about 175 percent). For
parents of successful applicants, giving remains elevated after admission; the incre-
mental effect on the logarithm of giving at age 18 is about 2.5 (about 1150 percent). For
parents of rejectees, one cannot reject the hypothesis that the incremental effect on the
amount of giving falls to about zero at age 19. As we saw for the probability of giving,
the parents of rejected applicants behave no differently than alumni without children.
The child-cycle coefficients are graphed in Figure 2.
Figure 2 allows us to address that possibility that reduced giving after admissions
might be driven by income effects associated with tuition payments. If tuition were the
important factor, then we would also expect to see decreases in giving among alumni
whose children did not apply to Anon U but instead attended other institutions. As
Figure 2 demonstrates, these alumni do not exhibit anything like the substantial de-
creases in giving that we see for the alumni of accepted children.26
Another issue pertaining to the child-cycle interpretation of Figure 2 is that the
overall giving over an alumnus’s life may not be affected much by having an eligible
child, just the timing of donations. To investigate this possibility, we estimate a cross
sectional regression in which the left-hand side variable was lifetime giving as of 2006,27
and the right hand side included the basic demographic variables in Table 3 (minus the
child-cycle variables) augmented with a series of dichotomous variables for number of
children, and continuous variables for the age of each child. We find that lifetime giving
is 109 percent higher for alumni with one child and an additional 58 percent higher with
a second child. Further, lifetime giving increases by 5.1 percent for each year of the first
26 Another argument along the same lines is that when one’s child is accepted at another institution, new opportunities for charitable giving open at that institution. Again, though, if this were the case, we would expect the behavior of the parents of rejected children and the parents of children who never applied to be about the same, in contrast to Figure 2. 27 Specifically, this is computed as the sum of giving in constant dollars over all years that the alumnus has been in the sample.
21
child’s age and 2.0 percent for each year of the second child’s age. In short, life-time
giving is affected by the presence and age of children; the child-cycle does not arise sim-
ply because alumni are shifting donations over time.
The coefficients on the other variables in column (2) generally have the same
signs as those for the probability of giving in column (1). One possible concern is that
even after taking logs, the estimates in column (2) might be driven by outliers. We es-
timate the model after deleting the largest one percent of the gifts, and no substantive
differences emerge. To assess the sensitivity of our results to the logarithmic transforma-
tion, we also estimate the Tobit equation in levels (with censoring at zero), both with
and without the top one percent of gifts deleted. As shown in the Appendix figures, the
child cycle is robust with respect to this change in functional form.
4.3 Probability of Being a Class Leader
As is true at most universities, the majority of money donated to Anon U comes
from a few very generous donors. Column (3) of Table 3 examines the probability of be-
ing a class leader, defined as an individual whose gift was greater than or equal to the
90th percentile in his or her class. When interpreting these figures, recall that, by defini-
tion, the probability of a random person being a class leader is about 10 percent. There-
fore, if a given characteristic raises the probability by (say) 5 percentage points, this
represents a 50 percent increase relative to the mean.
The coefficients indicate that, for this dimension of giving as well, the child-cycle
pattern is present and very similar to the patterns we have already seen. These coeffi-
cients are graphed in Figure 3. The other covariates are generally similar in sign to
those in the other two columns. An important exception is gender. While women are
more likely to make a gift in a given year (column (1)) and to make larger gifts on aver-
age (column (2)), ceteris paribus, column (3) tells us that the probability of making a
very large gift is 1.2 percentage points higher for males.
22
4.4 The Role of Directed Giving
Giving by parents of accepted children remains high after the admissions decision
has been rendered, a result that is not necessarily wholly consistent with the child cycle
model. After all, the lottery has been decided; why continue to buy tickets? Perhaps the
alumnus is showing tangible evidence of warm feelings engendered by the acceptance of
his or her child.28 Without ruling out this explanation, we note that another force may
be operative: certain donations made by alumni with children on campus could be less
public goods than relatively targeted benefits for their progeny. An example is a dona-
tion earmarked for a child’s varsity team.
To explore this possibility, we estimate the probability that an alumnus makes a
directed gift in a particular year as a function of the variables in Table 3.29 We find
that, conditional on making any gift, alumni with 17-year old children who are applying
to Anon U are 3.4 percentage points more likely to make a directed gift than alumni
who have no children, and the difference is statistically significant. After admission, this
figure increases substantially. Alumni with 18 year old accepted children are 6.1 per-
centage points more likely to make a directed gift, while those whose accepted children
are 19 years old are 12.8 percentage points more likely. The impact of having a child
accepted at Anon U on directed giving peaks at 16.5 percentage points when the child is
21. It remains statistically significant through age 25, but drops to an insignificant -0.22
percentage points for children aged 26 and older. In contrast, conditional on giving, the
parents of rejected children are not significantly more likely to make a directed gift
when their children are of college age.30
In short, during the time an alumnus’s child is on campus, the probability of
making a gift aimed at specific purposes, conditional on making a gift at all, is elevated.
28 Another possibility is that the alumnus is concerned about admissions prospects for younger children. However, as shown below, the same tendency exists when we look at the child-cycle for the last child in the family. 29 A directed gift is defined as one not made to the general annual appeal. 30 The full set of results is available upon request.
23
This phenomenon might be due to the fact that prior to the matriculation of their chil-
dren, parents know little about the activities of certain campus organizations, or even of
their existence. But if that is the case, it is hard to explain why the relative likelihood of
directed giving drops after the child graduates. We conjecture that at least part of the
explanation is that the specific purposes directly benefit the child. Therefore, elevated
giving after the admission of one’s child may be due in part to non-altruistic motiva-
tions.
4.5 Basic Model: Summary
Whether we look at the probability of making any gift, the size of the gift, or the
probability of making a large gift (relative to one’s classmates), the child-cycle pattern
comes through clearly. This is not to say that altruism is unimportant--people without
any children give substantial amounts of money, after all. For the top 1 percent of all
gifts, unconditional on class or year, 2,875 gifts came from alumni with children, while
2,003 came from alumni without any children. Among the top 1 percent of lifetime (cu-
mulative to 2006) givers, 212 had children and 110 did not. However, it is hard to ex-
plain the patterns found in Table 3 on the basis of altruism alone.
If we are willing to make some strong assumptions, we can be more precise about
the relative roles played by altruistic and selfish motivations. Specifically, suppose that:
1) Giving by alumni without children is done without the expectation of receiving any
reciprocal benefit. Of course, other motivations, such as public recognition or donating
to research projects that could be useful to one’s business, may also be present. To the
extent that they are, our estimate of the proportion of giving due to altruism may be
considered an upper bound. 2) The additional giving by alumni with children who do
not ultimately apply to Anon U is unselfish as well—as conjectured above, it is gener-
ated for one reason or another by warm feelings toward Anon U that are associated
24
with having children.31 3) The additional giving by alumni whose children do apply is
motivated by self-interest. Under these assumptions, we can use our estimates of the dif-
ference in giving associated with a child who did not apply relative to a child who did
apply to estimate the self-interested component of giving. A complication arises because
this differential depends on the child’s age. Seventeen years seems a sensible choice, be-
cause at this age, the application choice has generally been made so that alumni whose
children do not apply are not making any precautionary donations. At the same time,
these children have not yet been accepted, so parents do not have an incentive to make
directed donations as discussed in Section 4.4. For the same reason, neither can dona-
tions be influenced by warm feelings due to the acceptance of one’s child.
Under these assumptions and using the coefficients on CHILD17Appl and
CHILD17NoAppl from column (2) of Table 3, we calculate that about 52 percent of giv-
ing by alumni whose children apply to Anon U is due to altruism and the remaining 48
percent is due to self-interest.32 To the best of our knowledge, this is the first attempt to
use observational data to decompose donative behavior into altruistic and self-interested
components, and it suggests that the two motivations are of about equal importance, at
least in this context.
5. Alternative Specifications
In this section we present some alternative specifications of our model in order to
assess the robustness of the basic results.
31 One concern is that giving by alumni whose children do not apply may be motivated by the desire to enhance the prospects of younger children. However, as shown below, this portion of the child-cycle for the last child in a family is very similar to the child-cycle for the first child. 32 The calculation is done as follows: We assume, without loss of generality, that giving associated with no children (the baseline) is 1. We then exponentiate the coefficient on CHILD17Appl, which gives us a figure of 6.06, the amount donated by alumni whose 17 year old children applied to Anon U, relative to the baseline. We next exponentiate the coefficient on CHILD17NoAppl to obtain the relative amount given by those whose 17 year old children did not apply, which is 3.14. Under our assumptions, the proportion due to altruism has two components: baseline altruism and the increment associated with having children. The proportion of giving from baseline altruism is 1/6.06 (= 0.165), while the proportion due to warm feelings associated with having children is (3.14-1)/6.06 (= 0.353), and the amount associated with selfish reasons is (6.06-3.14)/6.06 (= 0.482).
25
5.1 Subsequent Children
So far we have characterized the child cycle in terms of the first child in the fam-
ily. A possible drawback is that giving along the first child’s cycle could be affected by
concerns about younger children’s admissions prospects. Therefore, estimating the cycle
for the last child might allow a cleaner test of the model.33 We began by re-estimating
our basic model from Table 3 using information on the last child rather than the first,
which, in effect, ignores any possible impact of older siblings. All alumni with complete
data, including those who only have one child, are included in this sample. After delet-
ing observations with missing data on the child’s age (27,882 observations), this sample
contains 488,297 observations.
Again, for brevity we present only the graphical representation of the child-cycle
for amounts given. (See Figure 5.) If anything, the child-cycle pattern is even stronger
than for the first child. Note that giving by those whose last child was rejected is lower
than those with no children at all, and significantly so at ages 22 and 23. This is a shar-
per relative decrease than we observed for first children. Within our framework, this
suggests that parents of rejected first children still give some amount with an eye to-
ward enhancing their younger children’s prospects. But with the last child, this motiva-
tion disappears.34
A natural question is whether the character of the child-cycle is affected by a
previous child’s outcome. Does acceptance of a first child to Anon U reinforce the no-
tion that donations generate a reciprocal benefit? One way to answer this question
33 For families with only one child, the first child is also considered to be the last. Future children may not yet be born, but it is reasonable to expect that at least for the children’s age group that is our pri-mary interest, 14 years and older, most families are unlikely to have another child. In addition, for some families, previous children may be sufficiently old that alumni are concerned about the admissions pros-pects for grandchildren. 34 This raises the question of whether other family relationships might be associated with expectations of reciprocal benefits to giving. For example, grandparents might make donations hoping to enhance the likelihood of admissions for their grandchildren. Unfortunately, in our data set, we are only able to relia-bly link grandparents and grandchildren when the members of the intermediate generation also attended Anon U. This would leave us with a small and very unrepresentative sample of grandparent-grandchild pairs.
26
would be to interact the child-cycle variables for the second child with indicators for the
first child’s outcome. However, estimating such a model is infeasible, as it would involve
hundreds of right hand side variables, many of which are all or nearly all zeros. Instead,
we augmented the specification for the second child with three indicator variables relat-
ing to the status of the first child: whether the first child was rejected by Anon U,
whether the first child was accepted, and whether the first child did not apply to Anon
U at all. Note that these variables are not constant over time; their values change as the
first child grows older and his or her admissions status becomes known.35
We find that the shape of the giving cycle associated with the second child is un-
affected by the inclusion of these variables. However, if the first child is known to have
been accepted, the entire child cycle shifts upwards. The probability of making a gift
increases by 11.6 percentage points, while the amount given increases by about 87 per-
cent. If the first child is rejected, the probability of making a gift falls by 6.1 percentage
points, while the amount given decreases by about 27 percent. (All of these figures are
statistically significant.) If the first child did not apply, there is no significant change in
the probability of making a gift or the amount given. These results have a straightfor-
ward interpretation within the child-cycle framework: Rejection of the first child indi-
cates to the alumnus that his or her expectations regarding reciprocity were to some ex-
tent incorrect, and giving behavior is adjusted accordingly. In the same way, acceptance
of the first child reinforces the perception that reciprocity is present.
As an additional test, we estimate the cycle for third children.36 The shape of the
cycle associated with the third child is very similar to that of both the first and second
children. The oldest child’s rejection reduces the amount given by 14.5 percent (impre-
cisely estimated), while the second child’s rejection reduces the amount given by a sta-
35 In particular, the variables for first child acceptance and rejection can take on a value of one only for those years in which the first child is 18 or over, while the indicator for first child non-application can be one only for those years in which the first child is 14 and over. 36 In this specification, there are 493,854 observations representing 32,817 alumni with 1,687 third chil-dren.
27
tistically significant 39 percent. The first child’s and second child’s acceptances increase
the amount given by 134 percent and 118 percent, respectively, and both figures are
statistically significant. Again, information that reinforces or weakens the perception of
a reciprocal benefit affects giving.
5.2 Occupation and Field
As noted earlier, a drawback of our data set is lack of information on income or
wealth. However, for a subset of observations, we have detailed information on the
alumnus’s occupational field and position. We know whether the individual ever worked
in a number of fields, including consulting, finance, information technology, health care,
education, and so on. From the position data, we can classify the alumnus as an execu-
tive, government worker, academic, attorney, physician, white collar worker, or some
other occupation. We believe that this information, together with the variables in our
basic model, likely do a reasonable job of proxying for permanent income. Using the
field and position data reduces our sample size substantially, from 487,913 to 344,342
giving opportunities, which is why we did not include these variables in our basic model.
When we augment the basic model with the field and position variables, the es-
timated child-cycle is essentially unchanged. For brevity, we do not include the coeffi-
cients here. Rather, we present a graphical summary of the child-cycle for the amount
given in Figure 4. The same tendencies that we saw in Figure 1 are clearly present.
Hence, the existence of a child-cycle is not sensitive to the inclusion of a rich set of vari-
ables relating to the alumnus’s permanent income.37
37 Although the child-cycle coefficients do not substantially change, we note in passing that some of the other coefficients do. For example, in our basic model, being an economics major increases the amount of giving by about 85 percent (computed from column (2) of Table 3). However, once we take occupation into account, this figure falls to 37 percent. In part, the coefficient in Table 3 reflects the fact that Anon U’s economics majors are particularly likely to go into the field of finance which, by itself, increases the amount of giving by about 75 percent, ceteris paribus. Interestingly, the coefficients on the race variables do not change substantially; for instance, the independent effect of being black is -56.8 percent in the ba-sic model and -59.4 percent when we augment the model with occupation and field. Other race variables are similarly unaffected. Detailed estimates for these models are available upon request.
28
5.3 Permanent Income and Fixed Effects Estimation
Another approach to dealing with missing income data begins with the hypothe-
sis that giving depends on the alumnus’s permanent income. If so, then a sensible alter-
native is fixed effects estimation, which controls for any attributes of an alumnus that
do not change over time (or at least over the length of our sample period). Indeed, a
fixed effects model takes into account any time-invariant unobservable variables that
might drive both giving behavior and the admissions status of an alumnus’s child, and
hence confound the child-cycle interpretation of our findings. Such unobservables in-
clude affinity to Anon U, generosity, quality of undergraduate experience, and so on.
Estimating fixed effects in a probit model is not possible, and doing so with Tobit is
cumbersome. Therefore, we use ordinary least squares. Figures 6, 7, and 8 show the
child-cycles for the probability of giving, the amount given, and the probability of being
a class leader, respectively. If our results were in fact being driven by permanent income
or other time-invariant unobservables, then the child cycle would be less pronounced
than previously, or perhaps disappear altogether. However, if anything, the fixed effects
estimates are more consistent with the child-cycle framework. The probability that an
alumnus with an accepted 22 year old child makes a gift is 18.5 percentage points higher
than for an alumnus without children. But this differential trends downward to 8.5 per-
centage points by age 25. The incremental probability of an alumnus with a rejected
child making a gift drops to -.044 percentage points at age 19 and stays insignificantly
different from the probability for a childless alumnus. The results for amount given and
probability of being a class leader are similarly pronounced. We conclude that our re-
sults are not likely affected by time-invariant unobservable variables.
5.4 Augmented Sample
Our analysis sample is based on alumni who graduated between 1972 and 2005.
We have additional data on alumni who graduated before 1972. This sample, which in-
cludes alumni from classes as early as 1914, is far larger: 939,671 giving opportunities
29
between 1983 and 2006. It has many more alumni children who are at college age and
beyond, a group that is essential to estimating the child-cycle. The number of children
who applied since 1983 is 5,096 (41.9 percent of whom were accepted), compared to
1,501 in our basic sample. The tradeoff is a less rich set of explanatory variables, be-
cause we lack data on SAT scores, admissions rating, race, grade point average, secon-
dary school type, and honors for the pre-1972 classes. This section presents results based
on the augmented sample.
Figures 9, 10, and 11 show the child-cycles for the probability of giving, the
amount given, and the probability of being a class leader, respectively. The results are
nearly identical to those from the basic sample. The only noticeable difference is in Fig-
ure 10, which shows that although the relative amount given by parents of rejected
children falls, it does not actually become statistically indistinguishable from childless
alumni. The key point, though, is that our main results continue to hold using a data
set with much more information on a critical group of alumni, those with children old
enough to have gone through the admissions process.
6. Conclusions
Our starting point is an old question in economics: To what extent does philan-
thropy stem from altruism rather than the expectation of receiving some reciprocal
benefit? Research on this topic using observational data is rare because quantifying a
reciprocal benefit is difficult. To address the problem, we analyze a unique data set that
allows us to estimate how alumni contributions to a university relate to a perceived
benefit—an improvement in the likelihood that their children will be admitted.
We find that the presence of children increases an alumnus’s giving, that giving
drops off after the admissions decision, and that the decline is far greater when the child
is rejected. In short, alumni giving varies systematically with the age and admissions
status of their children. This child-cycle of alumni giving is consistent with the hypothe-
30
sis that some donations are made in the hope of a reciprocal benefit. The result is robust
to choice of estimation method and alternative specifications of the model, and does not
appear to be due to unobservable variables such as underlying affinity to the university.
Our results do not imply that self-interest is the only motivation behind donative
behavior. As we document in the text, many alumni with no apparent reason to expect
a reciprocal benefit, at least in terms of a higher admissions probability for their chil-
dren, are extraordinarily generous. In the context of the larger debate over the motiva-
tions for altruism, our analysis shows that both selflessness and giving with the hope of
reciprocity are present.
We do not know whether these results generalize to other selective universities.
However, we are encouraged by the fact that other institutions seem quite similar to the
university we study with respect to other variables that affect giving. Hence, behavior
with respect to the child-cycle might be similar as well. That said, it would be useful to
investigate whether the child-cycle is present at other selective schools.38 Similarly, it
would be informative to study the trajectory of alumni giving at non-selective schools.
At such schools, the child-cycle is not operative, and hence we would expect to see a
path of alumni giving with respect to children’s age that is less steep, and that exhibits
less of a falloff after the child’s admissions decision.
38 By definition, the child-cycle can be operative only at selective schools.
31
References
Altonji, Joseph. G., Fumio Hayashi and Laurence J. Kotlikoff, “Is the Extended Family Altruistically Linked? Direct Tests Using Micro Data,” American Economic Re-view 82, no. 5, 1992, pp. 1177-98.
Andreoni, James, “An Experimental Test of the Public-Goods Crowding-Out Hypothesis, American Economic Review 83, no. 5, December, 1993, pp. 1317-1327.
Becker, Gary S., A Theory of Social Interactions,” Journal of Political Economy 82, pp. 1063-93.
Bergstrom, Theodore C. and Oded Stark, “How Altruism Can Prevail in an Evo-lutionary Environment, American Economic Review 83, no. 2, May 1993, pp. 149-155.
Bernheim, B. Douglas, Andrei Shleifer, and Lawrence H. Summers, “The Strate-gic Bequest Motive, Journal of Political Economy 93, no. 6, December 1985, pp. 1045-1076.
Bowen, William G., Martin A. Kurzweil, Eugene M. Tobin, and Susanne C. Pich-ler, Equity and Excellence in American Higher Education (Thomas Jefferson Founda-tion Distinguished Lecture Series), University of Virginia Press, 2005.
Bristol, Ralph, “How Much Will Alumni Give in the Future?” Planning for High-er Education 20, Winter 1991-92, pp. 1-12.
Chronicle of Higher Education, The 2006-7 Almanac, Volume 53, Issue 1, p. 30, http://chronicle.com/weekly/almanac/2006/nation/0103003.htm
Cigno, Alessandro and Furio C. Rosati, “Mutual Interest, Self-enforcing Consti-tutions and Apparent Generosity,” in Gerard-Varet, L.-A., S.-C. Kolm and J. Mercier Ythier (eds.), The Economics of Reciprocity, Giving and Altruism, Macmillan Press Ltd.: London, 2000, pp. 226-247.
Clotfelter, Charles, Federal Tax Policy and Charitable Giving, The University of Chicago Press: Chicago, 1985.
Clotfelter, Charles, “Alumni Giving to Elite Private Colleges and Universities ,” Economics of Education Review 22, 2003, pp. 109-120.
Cunningham, Brendan and Carlena Cochi-Ficano, “The Determinants of Dona-tive Revenue Flows from Alumni of Higher Education: An Empirical Inquiry,” Journal of Human Resources 37, no. 3, Summer 2002, pp. 540-569.
Docquier, Frederic and Hillel Rapoport, “Strategic and Altruistic Remittances,” in Gerard-Varet, L.-A., S.-C. Kolm and J. Mercier Ythier (eds.), The Economics of Re-ciprocity, Giving and Altruism, Macmillan Press Ltd.: London, 2000, pp. 285-297.
Dugan, Kelly, Charles H. Mullin and John J. Siegfried, “Undergraduate Financial Aid and Subsequent Alumni Giving Behavior,” Working Paper, Vanderbilt University, 1999.
32
Ehrenberg, Ronald and Christopher L. Smith, “The Sources and Uses of Annual Giving at Private Research Universities,” Economics of Education Review 22, June 2003, pp. 223-341.
Gerard-Varet, L.-A., S.-C. Kolm and J. Mercier Ythier, The Economics of Recip-rocity, Giving and Altruism, Macmillan Press Ltd.: London, 2000.
Giving USA Foundation, “Charitable Giving Rises 5 Percent to Nearly $250 Bil-lion in 2004,” http://www.aafrc.org/gusa/GUSA05˙Press˙Release.pdf#search =%22total%20charitable%20giving%22
Golden, Daniel, “How Lowering the Bar Helps Colleges Prosper,” Wall Street Journal, Saturday/Sunday, September 9-10, 2006, pp. A1, A10.
Grant, James H. and David L. Lindauer, “The Economics of Charity—Life-Cycle Patterns of Alumnae Contributions,” Eastern Economic Journal 2, April-June, 1986, pp. 129-141.
Harrison, William B., Shannor K. Mitchell, and Steven P. Peterson, “Alumni Donations and Colleges’ Development Expenditures: Does Spending Matter?” The American Journal of Economics and Sociology 54, no. 4, October, 1995, pp. 397-412.
Hechinger, John, “The Tiger Roars,” Wall Street Journal, July 17, 2006, p. B1.
Ioannides, Yannis M. and Kamhon Kan, “The Nature of Two-directional Inter-generational Transfers of Money and Time: An Empirical Analysis,” in Gerard-Varet, L.-A., S.-C. Kolm and J. Mercier Ythier (eds.), The Economics of Reciprocity, Giving and Altruism, Macmillan Press Ltd.: London, 2000, pp. 314-331.
Kolm, Serge-Christophe, “The Theory of Reciprocity,” in Gerard-Varet, L.-A., S.-C. Kolm and J. Mercier Ythier (eds.), The Economics of Reciprocity, Giving and Altru-ism, Macmillan Press Ltd.: London, 2000, pp. 115-141.
Landes, William M. and Richard A. Posner, “Salvors, Finders, Good Samaritans and Other Rescuers: An Economic Study of Law and Altruism,” Working Paper No. 227, National Bureau of Economic Research, January 1978.
List, John A., “On the Interpretation of Giving in Dictator Games,” Working Pa-per, University of Chicago, November 2006.
McGarry, Kathleen and Robert F. Schoeni, “Transfer Behavior: Measurement and the Redistribution of Resources within the Family,” Working Paper No. 4607, Na-tional Bureau of Economic Research, January 1994.
Monks, James, “Patterns of Giving to One’s Alma Mater among Young Gradu-ates from Selective Institutions,” Economics of Education Review 22, 2003, pp. 121-130.
Morgan, John, “Financing Public Goods by Means of Lotteries,” The Review of Economic Studies 67, no 4, October 2000, pp. 761-784.
33
Odendahl, T. J., Charity Begins at Home: Generosity and Self-Interest among the Philanthropic Elite, Basic Books, 1990.
Olsen, Katherine., Amy L. Smith and Phanindra V. Wunnava, “An Empirical Study of the Life-Cycle Hypothesis with Respect to Alumni Donations, “ American Economist 33, no 2, 1989, pp. 60-63.
Oster, Sharon, “The Effect of University Endowment Growth on Giving: Is There Evidence of Crowding Out?” Working Paper, Yale School of Management, February 2001.
Raut, Lakshmi K. and Lien H. Tran, “Reciprocity with Two-sided Altruism in Intergenerational Transfers: Evidence from Indonesian Family Life Survey Data, “ in Gerard-Varet, L.-A., S.-C. Kolm and J. Mercier Ythier (eds.), The Economics of Recip-rocity, Giving and Altruism, Macmillan Press Ltd.: London, 2000, pp. 298-313.
Rotemberg, Julio J., “Commercial Policy with Altruistic Voters,” Working Paper No. 7984, National Bureau of Economic Research, October 2000.
Samuelson, Paul A., “Altruism as a Problem Involving Group versus Individual Selection in Economics and Biology,” American Economic Review 83, no. 2, May 1993, pp. 143-148.
Schokkaert, Erik and Luc Van Ootegem, “Preference Variation and Private Do-nations,” in Gerard-Varet, L.-A., S.-C. Kolm and J. Mercier Ythier (eds.), The Econom-ics of Reciprocity, Giving and Altruism, Macmillan Press Ltd.: London, 2000, pp. 78-95.
Shulman, James L. and William G. Bowen, The Game of Life, Princeton Univer-sity Press: Princeton, 2001.
Taylor, Alton L. and Joseph C. Martin, “Characteristics of Alumni Donors and Nondonors at a Research I, Public University,” Research in Higher Education 36, June, 1995, pp. 283-302.
Weisbrod, Burton A., “The Forgotten Economic Sector: Private but Non-Profit,” Challenge, September-October 1978, pp. 32-36.
Willemain, Thomas R., Anil Goyal, Mark Van Deven, and Inderpreet S. Thukral, “Alumni Giving: The Influences of Reunion, Class, and Year,” Research in Higher Edu-cation 35, no. 5, October 1994, pp. 609-629.
Wunnava, P.V. and M. A. Lauze, “Alumni Giving at a Small Liberal Arts Col-lege: Evidence from Consistent and Occasional Donors,” Economics of Education Re-view 20, 2001, pp. 533-543.
Yoo, Y.H. and W. B. Harrison, “Altruism in the Market for Giving and Receiv-ing: A Case of Higher Education,” Economics of Education Review 8, no. 4, 1989, pp. 367-379.
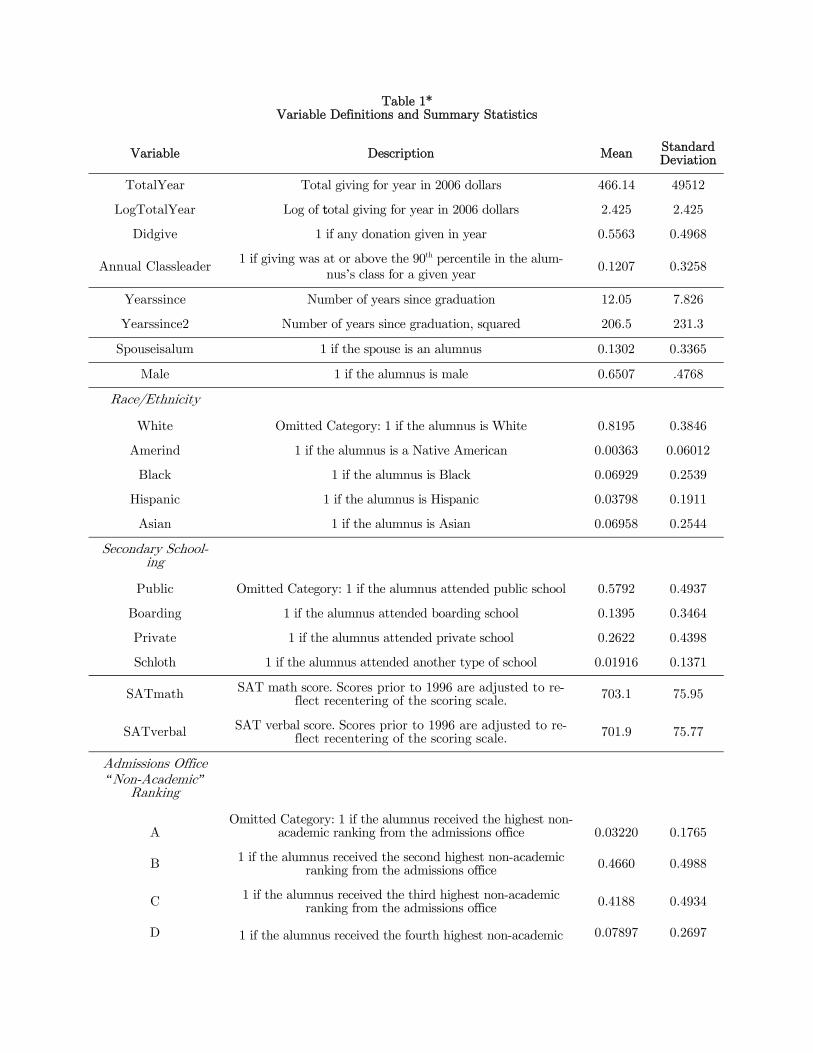
Table 1* Variable Definitions and Summary Statistics
Variable Description Mean Standard Deviation
TotalYear Total giving for year in 2006 dollars 466.14 49512
LogTotalYear Log of total giving for year in 2006 dollars 2.425 2.425
Didgive 1 if any donation given in year 0.5563 0.4968
Annual Classleader 1 if giving was at or above the 90th percentile in the alum-
nus’s class for a given year 0.1207 0.3258
Yearssince Number of years since graduation 12.05 7.826
Yearssince2 Number of years since graduation, squared 206.5 231.3
Spouseisalum 1 if the spouse is an alumnus 0.1302 0.3365
Male 1 if the alumnus is male 0.6507 .4768
Race/Ethnicity
White Omitted Category: 1 if the alumnus is White 0.8195 0.3846
Amerind 1 if the alumnus is a Native American 0.00363 0.06012
Black 1 if the alumnus is Black 0.06929 0.2539
Hispanic 1 if the alumnus is Hispanic 0.03798 0.1911
Asian 1 if the alumnus is Asian 0.06958 0.2544
Secondary School-ing
Public Omitted Category: 1 if the alumnus attended public school 0.5792 0.4937
Boarding 1 if the alumnus attended boarding school 0.1395 0.3464
Private 1 if the alumnus attended private school 0.2622 0.4398
Schloth 1 if the alumnus attended another type of school 0.01916 0.1371
SATmath SAT math score. Scores prior to 1996 are adjusted to re-flect recentering of the scoring scale.
703.1 75.95
SATverbal SAT verbal score. Scores prior to 1996 are adjusted to re-flect recentering of the scoring scale.
701.9 75.77
Admissions Office “Non-Academic”
Ranking
A Omitted Category: 1 if the alumnus received the highest non-
academic ranking from the admissions office 0.03220 0.1765
B 1 if the alumnus received the second highest non-academic ranking from the admissions office
0.4660 0.4988
C 1 if the alumnus received the third highest non-academic ranking from the admissions office
0.4188 0.4934
D 1 if the alumnus received the fourth highest non-academic 0.07897 0.2697
ranking from the admissions office
E 1 if the alumnus received the fifth highest non-academic ranking from the admissions office 0.00401 0.06319
Admissions Office �Academic� Rank-
ing
A
Omitted Category: 1 if the alumnus received the highest aca-demic ranking from the admissions office
0.1536 0.3605
B 1 if the alumnus received the second highest academic rank-ing from the admissions office
0.4242 0.4942
C 1 if the alumnus received the third highest academic ranking from the admissions office
0.2708 0.4444
D 1 if the alumnus received the fourth highest academic rank-ing from the admissions office 0.1435 0.3506
E 1 if the alumnus received the fifth highest academic ranking from the admissions office
0.0079 0.08858
Varsity 1 if the alumnus played on a varsity team 0.3892 0.4876
Clubsport 1 if the alumnus played on a club team 0.1728 0.3780
Honors 1 if the alumnus graduated magna, summa, or cum laude 0.4532 0.4978
Greek 1 if the alumnus was a member of a fraternity or sorority 0.6949 0.4604
Major
Molbio
Omitted Category: 1 if the alumnus majored in molecular biology
Small Social Sciences
1 if the alumnus majored in Anthropology, Urban Studies, or Sociology.
0.02940 0.1689
English 1 if the alumnus majored in English 0.1073 0.3095
Economics 1 if the alumnus majored in Economics 0.07949 0.2705
Public Policy 1 if the alumnus majored in Public Policy 0.05841 0.2345
Political Science 1 if the alumnus majored in Political Science 0.08796 0.2832
Psychology 1 if the alumnus majored in Psychology 0.04890 0.2157
History 1 if the alumnus majored in History 0.1182 0.3229
MAE 1 if the alumnus majored in Mechanical/Aerospace Engineer-ing
0.03534 0.1846
EE/CS 1 if the alumnus majored in Electrical Engineering or Com-puter Science 0.05533 0.2286
Arch & Civ 1 if the alumnus majored in Architecture or Civil Engineer-ing
0.07040 0.2558
Small Humanities 1 if the alumnus majored in Art, Art History, Classics, East Asian Studies, Linguistics, Music, Near Eastern Studies, Phi-losophy, Religion, or Languages and Literature departments
0.1180 0.3226
Small Engineering 1 if the alumnus majored in �Engineering�, Operations Re-search and Financial Engineering, or Chemical Engineering
0.03132 0.1742
Small Sciences 1 if the alumnus majored in Applied Mathematics, Astro- 0.1375 0.3444
physics, Biochemistry, Biology, Chemistry, Ecology and Evo-lutionary Biology, Geology, Mathematics, Physics, or Statis-
tics
Minor
No Minor Omitted Category: 1 if the alumnus received no minor 0.7673 0.4226
African/African-American Studies
1 if the alumnus received a minor in African or African-American Studies
0.02303 0.1500
American Studies 1 if the alumnus received a minor in American Studies 0.02324 0.1507
Latin 1 if the alumnus received a minor in Latin 0.00186 0.04305
Finance 1 if the alumnus received a minor in Finance 0.00324 0.05683
Theater 1 if the alumnus received a minor in Theater 0.01293 0.1130
Public Policy 1 if the alumnus received a minor in Public Policy 0.05027 0.2185
Other Engineering 1 if the alumnus received a minor in Architecture, Basic En-gineering, Bioengineering, Electrical Engineering, Geological Engineering, Management, Materials Sciences, or Robotics.
0.01840 0.1344
Other Sciences 1 if the alumnus received a minor in Applied and Computa-tional Mathematics, Biophysics, Cognitive Studies, Environ-mental Studies, Science in Human Affairs, or Neuroscience.
0.02731 0.1630
Other Humanities 1 if the alumnus received a minor in a humanities field 0.05261 0.2233
Teaching 1 if the alumnus received a teaching certificate 0.01377 0.1165
Reunion 1 if the year after graduation is some multiple of 5 0.1795 0.3838
Post Baccalaureate Education
NoPostAB
Omitted Category: 1 if the alumnus has no advanced degree 0.6053 0.4888
PhD 1 if the alumnus has a Ph.D. or equivalent degree 0.06742 0.2508
Masters 1 if the alumnus has a masters 0.1381 0.3450
JD 1 if the alumnus has a JD 0.1004 0.3006
MDDDS 1 if the alumnus has a medical degree 0.06173 0.2407
MBA 1 if the alumnus has an MBA 0.08986 0.2860
*Based on 487,913 observations on gift-giving from 1983 to 2006. 32,488 alumni who graduated from 1972 to 2005 are represented.
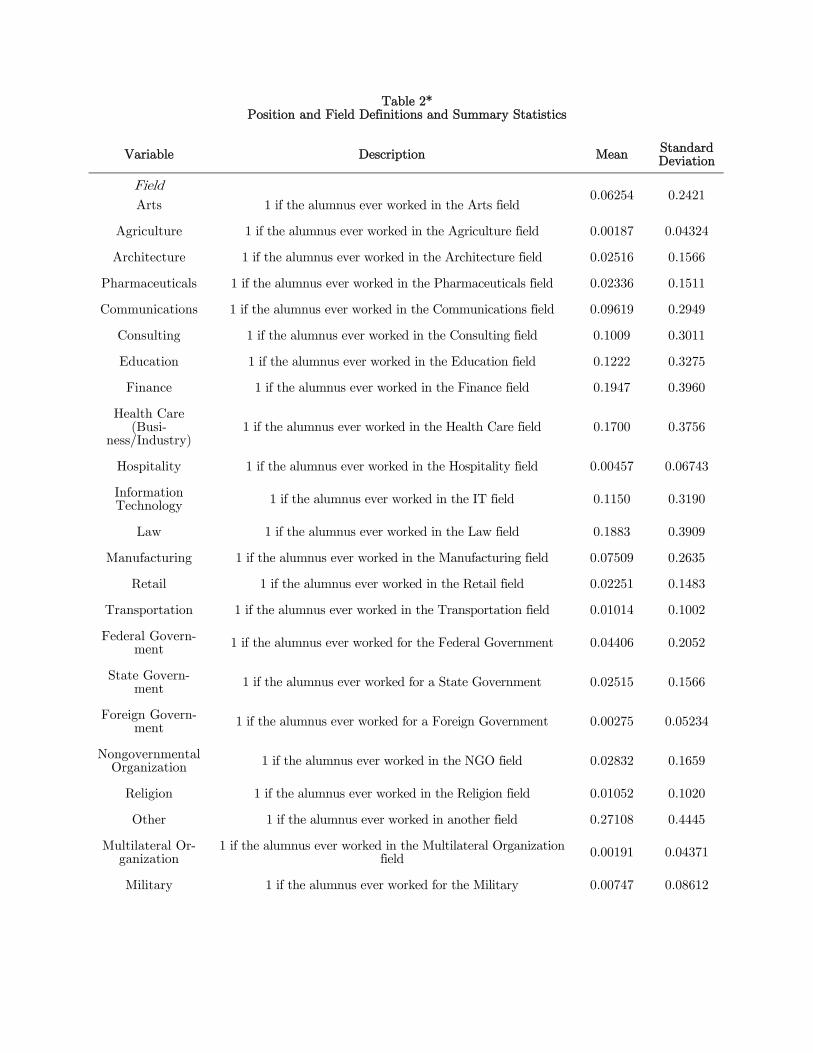
Table 2* Position and Field Definitions and Summary Statistics
Variable Description Mean Standard Deviation
Field
Arts 1 if the alumnus ever worked in the Arts field 0.06254 0.2421
Agriculture 1 if the alumnus ever worked in the Agriculture field 0.00187 0.04324
Architecture 1 if the alumnus ever worked in the Architecture field 0.02516 0.1566
Pharmaceuticals 1 if the alumnus ever worked in the Pharmaceuticals field 0.02336 0.1511
Communications 1 if the alumnus ever worked in the Communications field 0.09619 0.2949
Consulting 1 if the alumnus ever worked in the Consulting field 0.1009 0.3011
Education 1 if the alumnus ever worked in the Education field 0.1222 0.3275
Finance 1 if the alumnus ever worked in the Finance field 0.1947 0.3960
Health Care (Busi-
ness/Industry) 1 if the alumnus ever worked in the Health Care field 0.1700 0.3756
Hospitality 1 if the alumnus ever worked in the Hospitality field 0.00457 0.06743
Information Technology 1 if the alumnus ever worked in the IT field 0.1150 0.3190
Law 1 if the alumnus ever worked in the Law field 0.1883 0.3909
Manufacturing 1 if the alumnus ever worked in the Manufacturing field 0.07509 0.2635
Retail 1 if the alumnus ever worked in the Retail field 0.02251 0.1483
Transportation 1 if the alumnus ever worked in the Transportation field 0.01014 0.1002
Federal Govern-ment 1 if the alumnus ever worked for the Federal Government 0.04406 0.2052
State Govern-ment
1 if the alumnus ever worked for a State Government 0.02515 0.1566
Foreign Govern-ment
1 if the alumnus ever worked for a Foreign Government 0.00275 0.05234
Nongovernmental Organization 1 if the alumnus ever worked in the NGO field 0.02832 0.1659
Religion 1 if the alumnus ever worked in the Religion field 0.01052 0.1020
Other 1 if the alumnus ever worked in another field 0.27108 0.4445
Multilateral Or-ganization
1 if the alumnus ever worked in the Multilateral Organization field
0.00191 0.04371
Military 1 if the alumnus ever worked for the Military 0.00747 0.08612
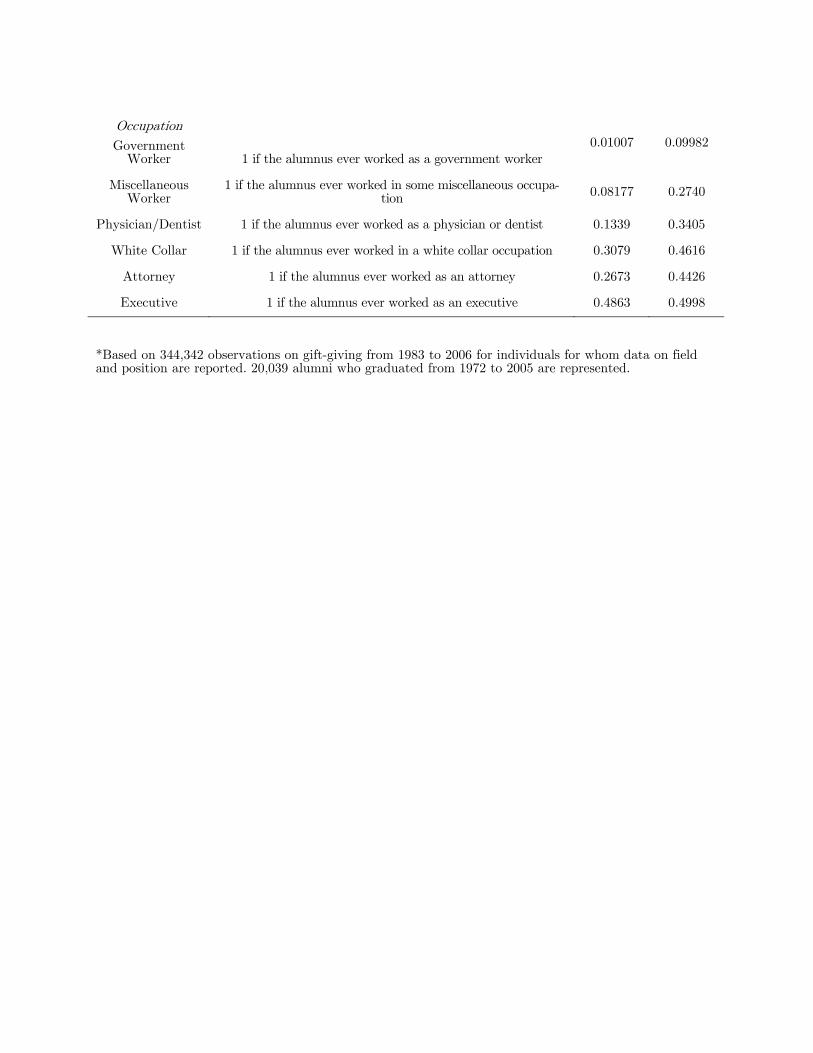
Occupation
Government Worker 1 if the alumnus ever worked as a government worker
0.01007 0.09982
Miscellaneous Worker
1 if the alumnus ever worked in some miscellaneous occupa-tion
0.08177 0.2740
Physician/Dentist 1 if the alumnus ever worked as a physician or dentist 0.1339 0.3405
White Collar 1 if the alumnus ever worked in a white collar occupation 0.3079 0.4616
Attorney 1 if the alumnus ever worked as an attorney 0.2673 0.4426
Executive 1 if the alumnus ever worked as an executive 0.4863 0.4998
*Based on 344,342 observations on gift-giving from 1983 to 2006 for individuals for whom data on field and position are reported. 20,039 alumni who graduated from 1972 to 2005 are represented.
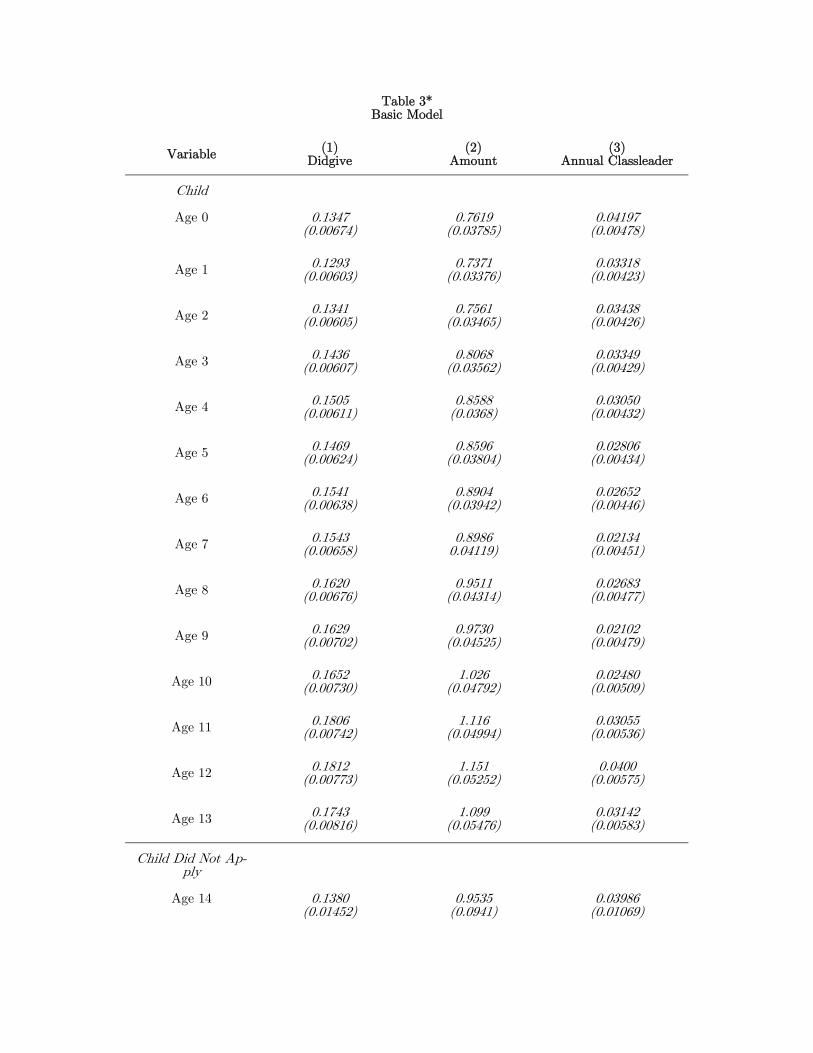
Table 3* Basic Model
Variable (1) Didgive
(2) Amount
(3) Annual Classleader
Child
Age 0
0.1347
(0.00674)
0.7619
(0.03785)
0.04197
(0.00478)
Age 1 0.1293 (0.00603)
0.7371 (0.03376)
0.03318 (0.00423)
Age 2 0.1341 (0.00605)
0.7561 (0.03465)
0.03438 (0.00426)
Age 3 0.1436 (0.00607)
0.8068 (0.03562)
0.03349 (0.00429)
Age 4 0.1505 (0.00611)
0.8588 (0.0368)
0.03050 (0.00432)
Age 5 0.1469 (0.00624)
0.8596 (0.03804)
0.02806 (0.00434)
Age 6 0.1541 (0.00638)
0.8904 (0.03942)
0.02652 (0.00446)
Age 7 0.1543 (0.00658)
0.8986 0.04119)
0.02134 (0.00451)
Age 8 0.1620 (0.00676)
0.9511 (0.04314)
0.02683 (0.00477)
Age 9 0.1629 (0.00702)
0.9730 (0.04525)
0.02102 (0.00479)
Age 10 0.1652 (0.00730)
1.026 (0.04792)
0.02480 (0.00509)
Age 11 0.1806 (0.00742)
1.116 (0.04994)
0.03055 (0.00536)
Age 12 0.1812 (0.00773)
1.151 (0.05252)
0.0400 (0.00575)
Age 13 0.1743 (0.00816)
1.099 (0.05476)
0.03142 (0.00583)
Child Did Not Ap-ply
Age 14
0.1380
(0.01452)
0.9535
(0.0941)
0.03986
(0.01069)
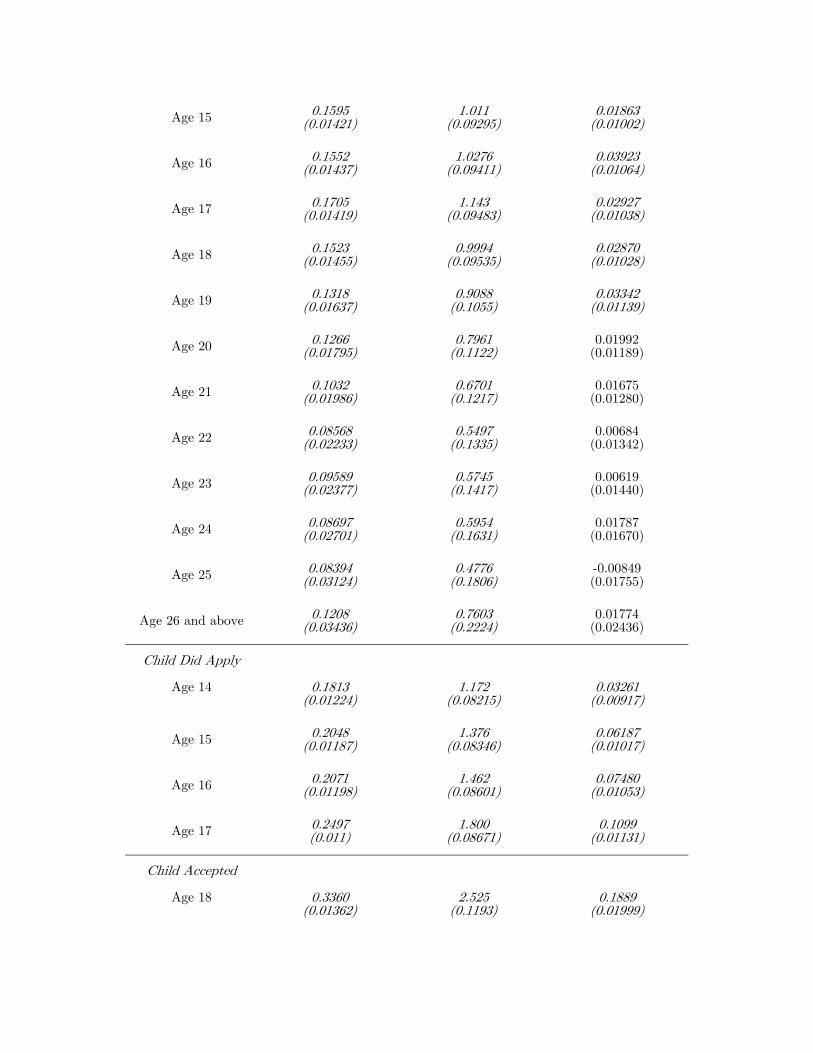
Age 15 0.1595 (0.01421)
1.011 (0.09295)
0.01863 (0.01002)
Age 16 0.1552 (0.01437)
1.0276 (0.09411)
0.03923 (0.01064)
Age 17 0.1705 (0.01419)
1.143 (0.09483)
0.02927 (0.01038)
Age 18 0.1523 (0.01455)
0.9994 (0.09535)
0.02870 (0.01028)
Age 19 0.1318 (0.01637)
0.9088 (0.1055)
0.03342 (0.01139)
Age 20 0.1266 (0.01795)
0.7961 (0.1122)
0.01992 (0.01189)
Age 21 0.1032 (0.01986)
0.6701 (0.1217)
0.01675 (0.01280)
Age 22 0.08568 (0.02233)
0.5497 (0.1335)
0.00684 (0.01342)
Age 23 0.09589 (0.02377)
0.5745 (0.1417)
0.00619 (0.01440)
Age 24 0.08697 (0.02701)
0.5954 (0.1631)
0.01787 (0.01670)
Age 25 0.08394 (0.03124)
0.4776 (0.1806)
-0.00849 (0.01755)
Age 26 and above 0.1208 (0.03436)
0.7603 (0.2224)
0.01774 (0.02436)
Child Did Apply
Age 14
0.1813
(0.01224)
1.172
(0.08215)
0.03261
(0.00917)
Age 15 0.2048 (0.01187)
1.376 (0.08346)
0.06187 (0.01017)
Age 16 0.2071 (0.01198)
1.462 (0.08601)
0.07480 (0.01053)
Age 17 0.2497 (0.011)
1.800 (0.08671)
0.1099 (0.01131)
Child Accepted
Age 18
0.3360
(0.01362)
2.525
(0.1193)
0.1889
(0.01999)
Age 19 0.3071 (0.01631)
2.382 (0.1346)
0.1852 (0.0212)
Age 20 0.2670 (0.0202)
2.083 (0.1515)
0.1610 (0.02230)
Age 21 0.2674 (0.02271)
2.078 (0.1665)
0.1748 (0.02579)
Age 22 0.2512 (0.02597)
1.837 (0.1807)
0.1497 (0.02820)
Age 23 0.2491 (0.02913)
1.736 (0.1982)
0.1284 (0.03013)
Age 24 0.1747 (0.03589)
1.284 (0.2281)
0.06793 (0.02969)
Age 25 0.1459 (0.04276)
1.122 (0.2517)
0.08681 (0.03492)
Age 26 and above 0.07759 (0.05461)
0.5236 (0.3015)
-0.00234 (0.03083)
Child Rejected
Age 18
0.1352
(0.01639)
0.9030
(0.1055)
0.03016
(0.01164)
Age 19 0.02262 (0.01896)
0.2026 (0.1070)
-0.01564 (0.01014)
Age 20 0.02675 (0.02073)
0.1698 (0.1143)
-0.01788 (0.01093)
Age 21 0.04713 (0.02238)
0.2869 (0.1251)
-0.02333 (0.01157)
Age 22 0.02477 (0.02595)
0.1222 (0.1377)
-0.01926 (0.01354)
Age 23 -0.01938 (0.03031)
-0.1187 (0.1519)
-0.03922 (0.01374)
Age 24 -0.00816 (0.03412)
-0.02148 (0.1794)
-0.02581 (0.01711)
Age 25 -0.04415 (0.03943)
-0.2117 (0.1999)
-0.05188 (0.01662)
Age 26 and above -0.03201 (0.05015)
-0.1109 (0.2663)
-0.02369 (0.02394)
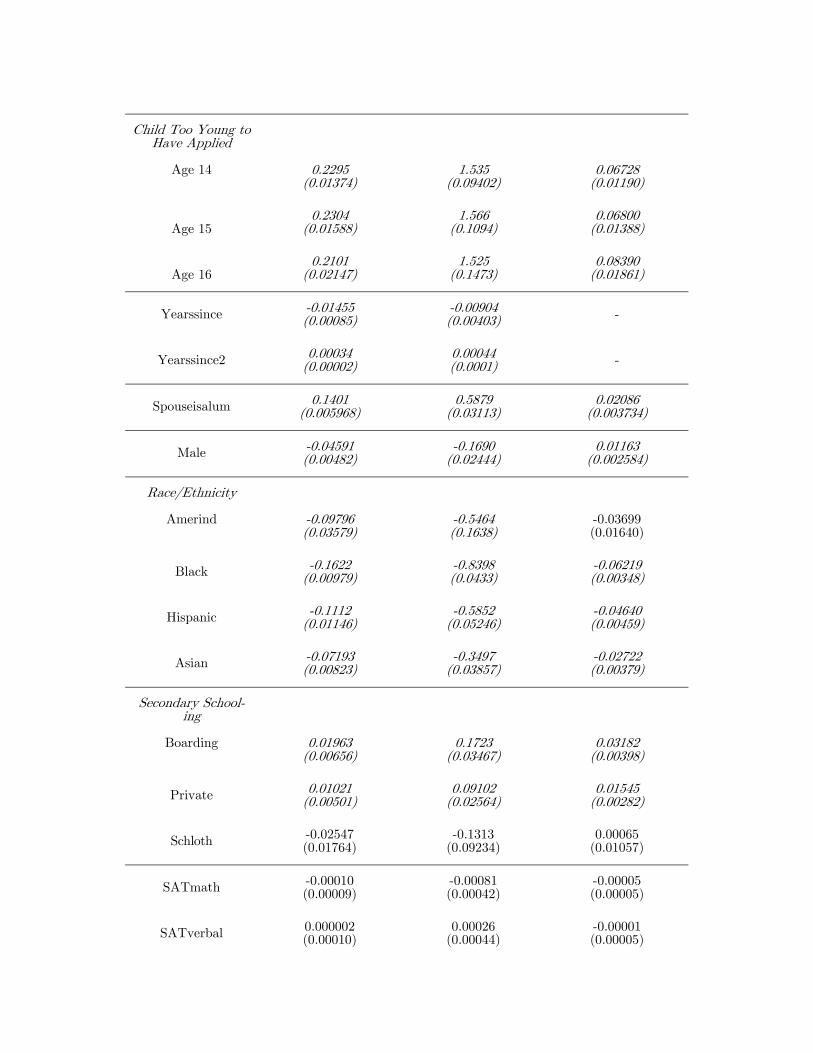
Child Too Young to
Have Applied
Age 14
0.2295
(0.01374)
1.535
(0.09402)
0.06728
(0.01190)
Age 15 0.2304
(0.01588) 1.566
(0.1094) 0.06800
(0.01388)
Age 16 0.2101
(0.02147) 1.525
(0.1473) 0.08390
(0.01861)
Yearssince -0.01455 (0.00085)
-0.00904 (0.00403) -
Yearssince2 0.00034 (0.00002)
0.00044 (0.0001) -
Spouseisalum 0.1401 (0.005968)
0.5879 (0.03113)
0.02086 (0.003734)
Male -0.04591 (0.00482)
-0.1690 (0.02444)
0.01163 (0.002584)
Race/Ethnicity
Amerind
-0.09796 (0.03579)
-0.5464 (0.1638)
-0.03699 (0.01640)
Black -0.1622 (0.00979)
-0.8398 (0.0433)
-0.06219 (0.00348)
Hispanic -0.1112 (0.01146)
-0.5852 (0.05246)
-0.04640 (0.00459)
Asian -0.07193 (0.00823)
-0.3497 (0.03857)
-0.02722 (0.00379)
Secondary School-ing
Boarding
0.01963
(0.00656)
0.1723
(0.03467)
0.03182
(0.00398)
Private 0.01021 (0.00501)
0.09102 (0.02564)
0.01545 (0.00282)
Schloth -0.02547 (0.01764)
-0.1313 (0.09234)
0.00065 (0.01057)
SATmath -0.00010 (0.00009)
-0.00081 (0.00042)
-0.00005 (0.00005)
SATverbal 0.000002 (0.00010)
0.00026 (0.00044)
-0.00001 (0.00005)
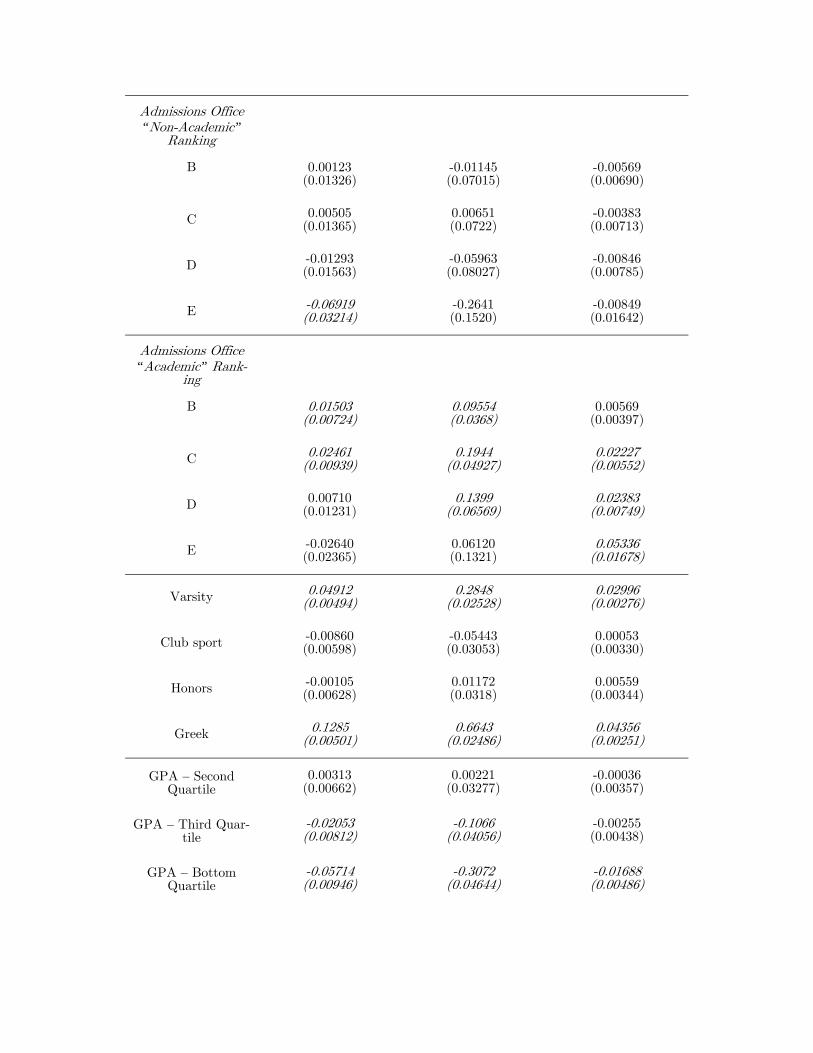
Admissions Office “Non-Academic”
Ranking
B
0.00123
(0.01326)
-0.01145 (0.07015)
-0.00569 (0.00690)
C 0.00505 (0.01365)
0.00651 (0.0722)
-0.00383 (0.00713)
D -0.01293 (0.01563)
-0.05963 (0.08027)
-0.00846 (0.00785)
E -0.06919 (0.03214)
-0.2641 (0.1520)
-0.00849 (0.01642)
Admissions Office “Academic” Rank-
ing
B
0.01503
(0.00724)
0.09554 (0.0368)
0.00569
(0.00397)
C 0.02461 (0.00939)
0.1944 (0.04927)
0.02227 (0.00552)
D 0.00710 (0.01231)
0.1399 (0.06569)
0.02383 (0.00749)
E -0.02640 (0.02365)
0.06120 (0.1321)
0.05336 (0.01678)
Varsity 0.04912 (0.00494)
0.2848 (0.02528)
0.02996 (0.00276)
Club sport -0.00860 (0.00598)
-0.05443 (0.03053)
0.00053 (0.00330)
Honors -0.00105 (0.00628)
0.01172 (0.0318)
0.00559 (0.00344)
Greek 0.1285 (0.00501)
0.6643 (0.02486)
0.04356 (0.00251)
GPA – Second Quartile
0.00313 (0.00662)
0.00221 (0.03277)
-0.00036 (0.00357)
GPA – Third Quar-tile
-0.02053 (0.00812)
-0.1066 (0.04056)
-0.00255 (0.00438)
GPA – Bottom Quartile
-0.05714 (0.00946)
-0.3072 (0.04644)
-0.01688 (0.00486)
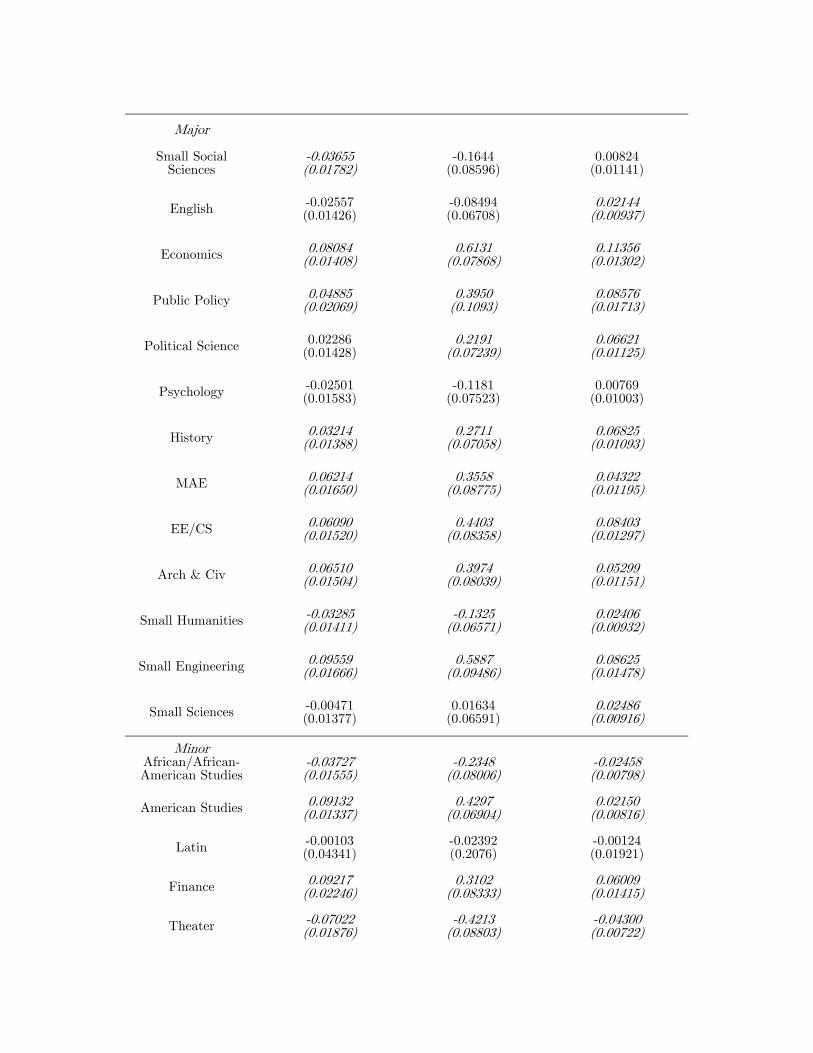
Major
Small Social
Sciences
-0.03655 (0.01782)
-0.1644
(0.08596)
0.00824
(0.01141)
English -0.02557 (0.01426)
-0.08494 (0.06708)
0.02144 (0.00937)
Economics 0.08084 (0.01408)
0.6131 (0.07868)
0.11356 (0.01302)
Public Policy 0.04885 (0.02069)
0.3950 (0.1093)
0.08576 (0.01713)
Political Science 0.02286 (0.01428)
0.2191 (0.07239)
0.06621 (0.01125)
Psychology -0.02501 (0.01583)
-0.1181 (0.07523)
0.00769 (0.01003)
History 0.03214 (0.01388)
0.2711 (0.07058)
0.06825 (0.01093)
MAE 0.06214 (0.01650)
0.3558 (0.08775)
0.04322 (0.01195)
EE/CS 0.06090 (0.01520)
0.4403 (0.08358)
0.08403 (0.01297)
Arch & Civ 0.06510 (0.01504)
0.3974 (0.08039)
0.05299 (0.01151)
Small Humanities -0.03285 (0.01411)
-0.1325 (0.06571)
0.02406 (0.00932)
Small Engineering 0.09559 (0.01666)
0.5887 (0.09486)
0.08625 (0.01478)
Small Sciences -0.00471 (0.01377)
0.01634 (0.06591)
0.02486 (0.00916)
Minor African/African-American Studies
-0.03727 (0.01555)
-0.2348
(0.08006)
-0.02458 (0.00798)
American Studies 0.09132 (0.01337)
0.4297 (0.06904)
0.02150 (0.00816)
Latin -0.00103 (0.04341)
-0.02392 (0.2076)
-0.00124 (0.01921)
Finance 0.09217 (0.02246)
0.3102 (0.08333)
0.06009 (0.01415)
Theater -0.07022 (0.01876)
-0.4213 (0.08803)
-0.04300 (0.00722)
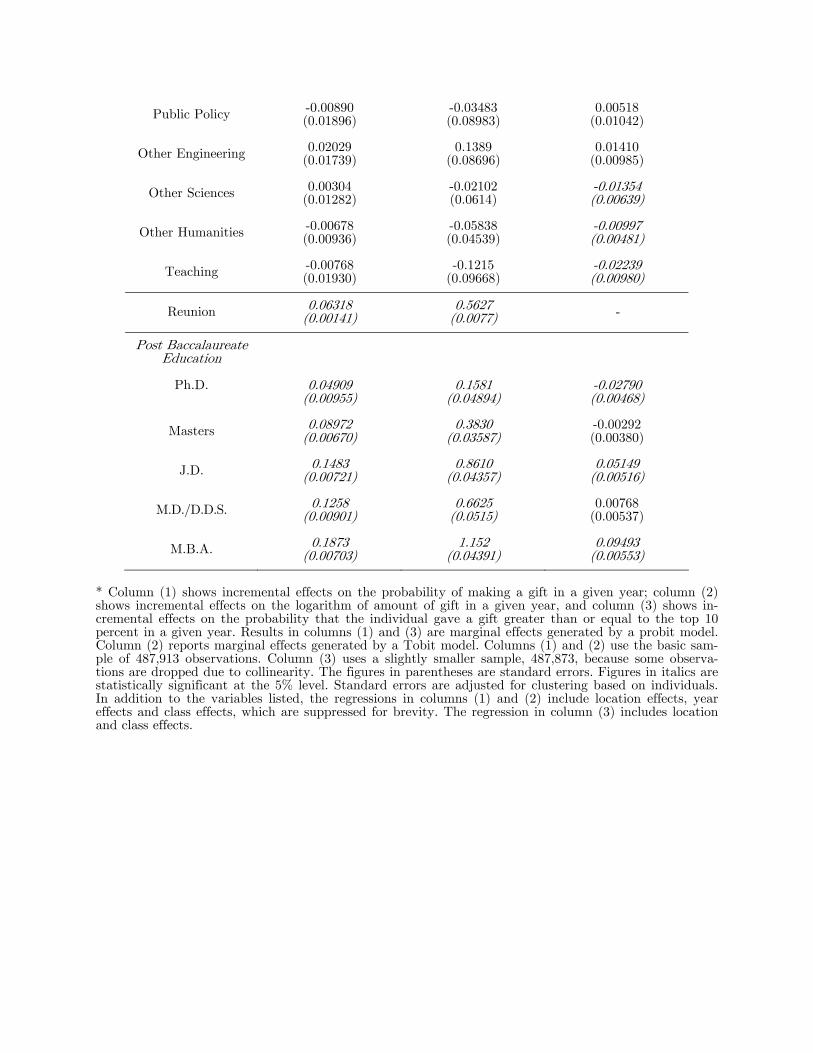
Public Policy -0.00890 (0.01896)
-0.03483 (0.08983)
0.00518 (0.01042)
Other Engineering 0.02029 (0.01739)
0.1389 (0.08696)
0.01410 (0.00985)
Other Sciences 0.00304 (0.01282)
-0.02102 (0.0614)
-0.01354 (0.00639)
Other Humanities -0.00678 (0.00936)
-0.05838 (0.04539)
-0.00997 (0.00481)
Teaching -0.00768 (0.01930)
-0.1215 (0.09668)
-0.02239 (0.00980)
Reunion 0.06318 (0.00141)
0.5627 (0.0077) -
Post Baccalaureate Education
Ph.D.
0.04909
(0.00955)
0.1581
(0.04894)
-0.02790 (0.00468)
Masters 0.08972 (0.00670)
0.3830 (0.03587)
-0.00292 (0.00380)
J.D. 0.1483 (0.00721)
0.8610 (0.04357)
0.05149 (0.00516)
M.D./D.D.S. 0.1258 (0.00901)
0.6625 (0.0515)
0.00768 (0.00537)
M.B.A. 0.1873 (0.00703)
1.152 (0.04391)
0.09493 (0.00553)
* Column (1) shows incremental effects on the probability of making a gift in a given year; column (2) shows incremental effects on the logarithm of amount of gift in a given year, and column (3) shows in-cremental effects on the probability that the individual gave a gift greater than or equal to the top 10 percent in a given year. Results in columns (1) and (3) are marginal effects generated by a probit model. Column (2) reports marginal effects generated by a Tobit model. Columns (1) and (2) use the basic sam-ple of 487,913 observations. Column (3) uses a slightly smaller sample, 487,873, because some observa-tions are dropped due to collinearity. The figures in parentheses are standard errors. Figures in italics are statistically significant at the 5% level. Standard errors are adjusted for clustering based on individuals. In addition to the variables listed, the regressions in columns (1) and (2) include location effects, year effects and class effects, which are suppressed for brevity. The regression in column (3) includes location and class effects.
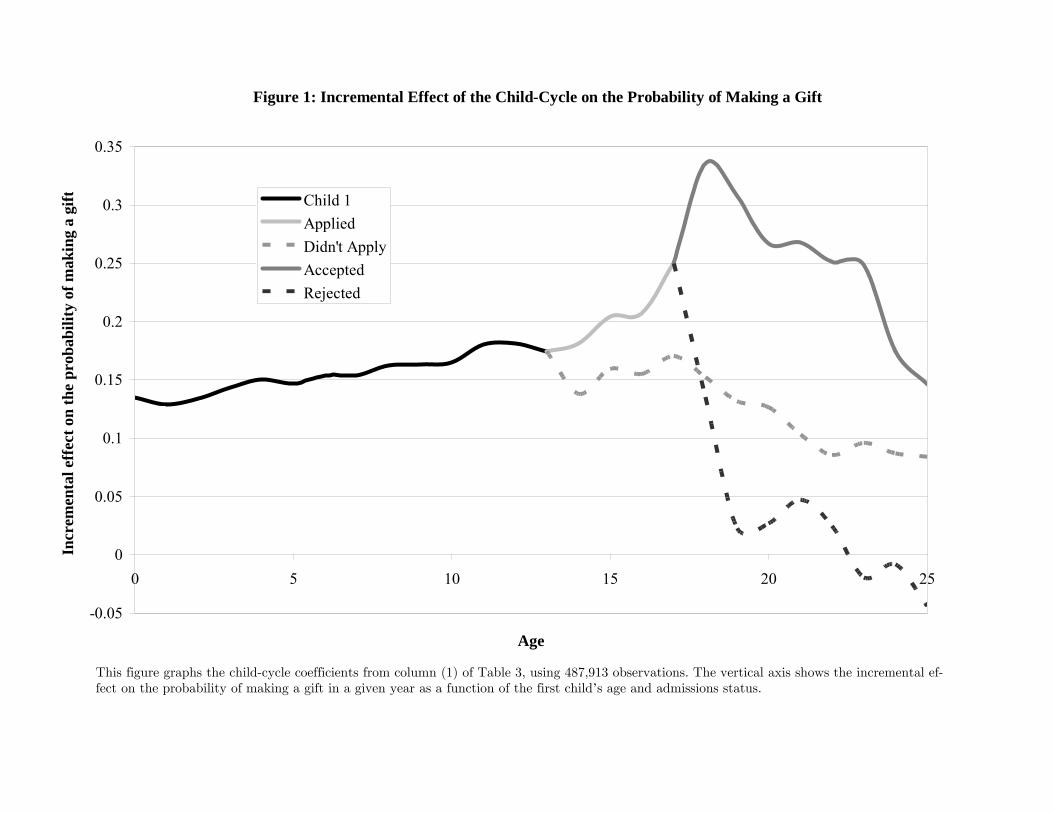
Figure 1: Incremental Effect of the Child-Cycle on the Probability of Making a Gift
-0.05
0
0.05
0.1
0.15
0.2
0.25
0.3
0.35
0 5 10 15 20 25
Age
Incr
emen
tal e
ffec
t on
the
prob
abili
ty o
f mak
ing
a gi
ft Child 1AppliedDidn't ApplyAcceptedRejected
This figure graphs the child-cycle coefficients from column (1) of Table 3, using 487,913 observations. The vertical axis shows the incremental ef-fect on the probability of making a gift in a given year as a function of the first child’s age and admissions status.
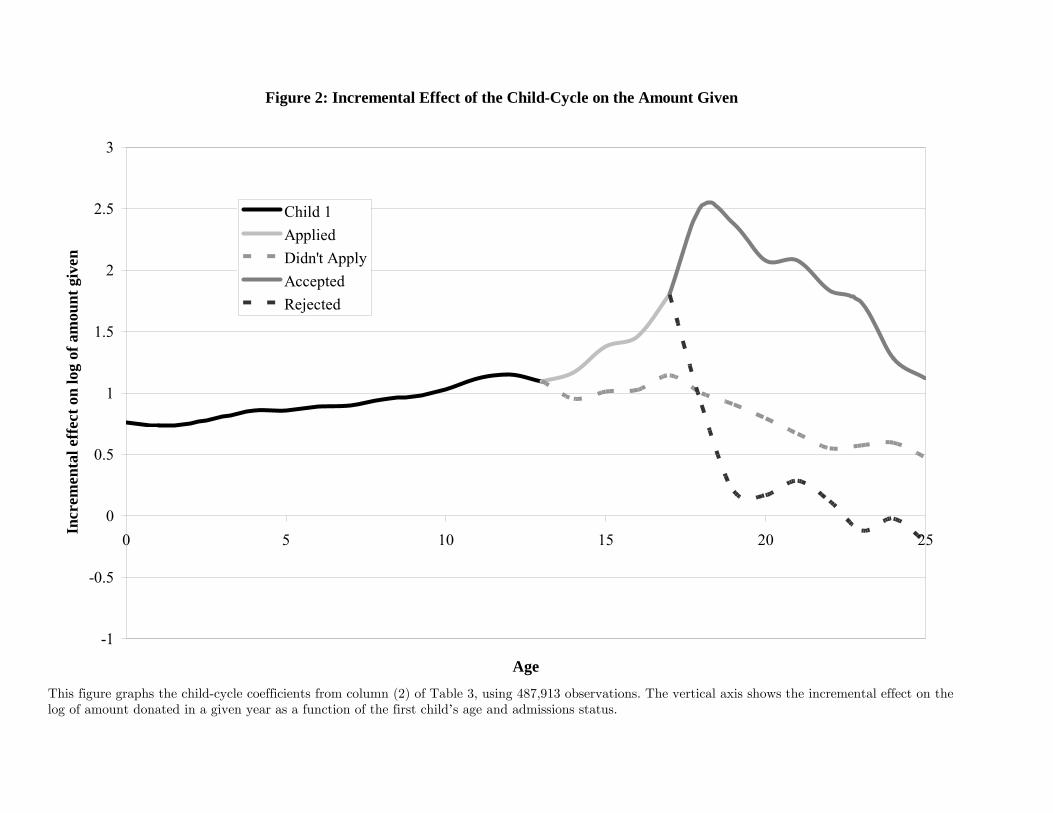
Figure 2: Incremental Effect of the Child-Cycle on the Amount Given
-1
-0.5
0
0.5
1
1.5
2
2.5
3
0 5 10 15 20 25
Age
Incr
emen
tal e
ffec
t on
log
of a
mou
nt g
iven
Child 1AppliedDidn't ApplyAcceptedRejected
This figure graphs the child-cycle coefficients from column (2) of Table 3, using 487,913 observations. The vertical axis shows the incremental effect on the log of amount donated in a given year as a function of the first child’s age and admissions status.
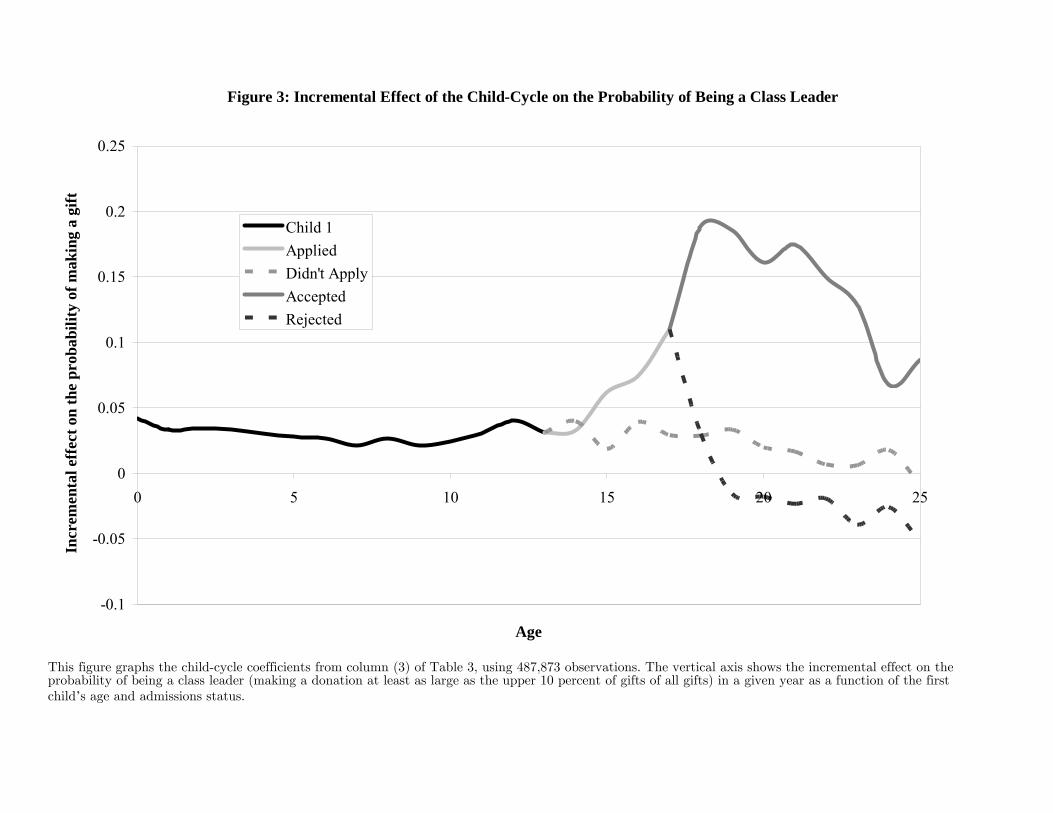
Figure 3: Incremental Effect of the Child-Cycle on the Probability of Being a Class Leader
-0.1
-0.05
0
0.05
0.1
0.15
0.2
0.25
0 5 10 15 20 25
Age
Incr
emen
tal e
ffec
t on
the
prob
abili
ty o
f mak
ing
a gi
ft
Child 1AppliedDidn't ApplyAcceptedRejected
This figure graphs the child-cycle coefficients from column (3) of Table 3, using 487,873 observations. The vertical axis shows the incremental effect on the probability of being a class leader (making a donation at least as large as the upper 10 percent of gifts of all gifts) in a given year as a function of the first child’s age and admissions status.
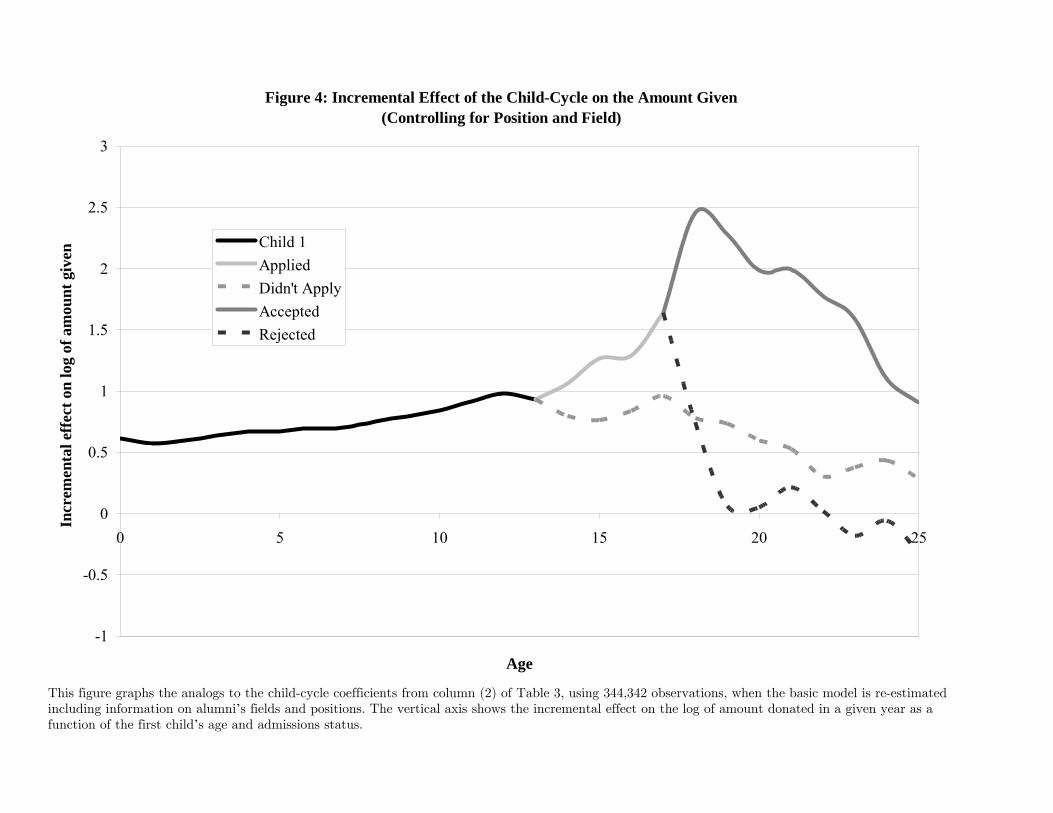
Figure 4: Incremental Effect of the Child-Cycle on the Amount Given (Controlling for Position and Field)
-1
-0.5
0
0.5
1
1.5
2
2.5
3
0 5 10 15 20 25
Age
Incr
emen
tal e
ffec
t on
log
of a
mou
nt g
iven
Child 1AppliedDidn't ApplyAcceptedRejected
This figure graphs the analogs to the child-cycle coefficients from column (2) of Table 3, using 344,342 observations, when the basic model is re-estimated including information on alumni’s fields and positions. The vertical axis shows the incremental effect on the log of amount donated in a given year as a function of the first child’s age and admissions status.
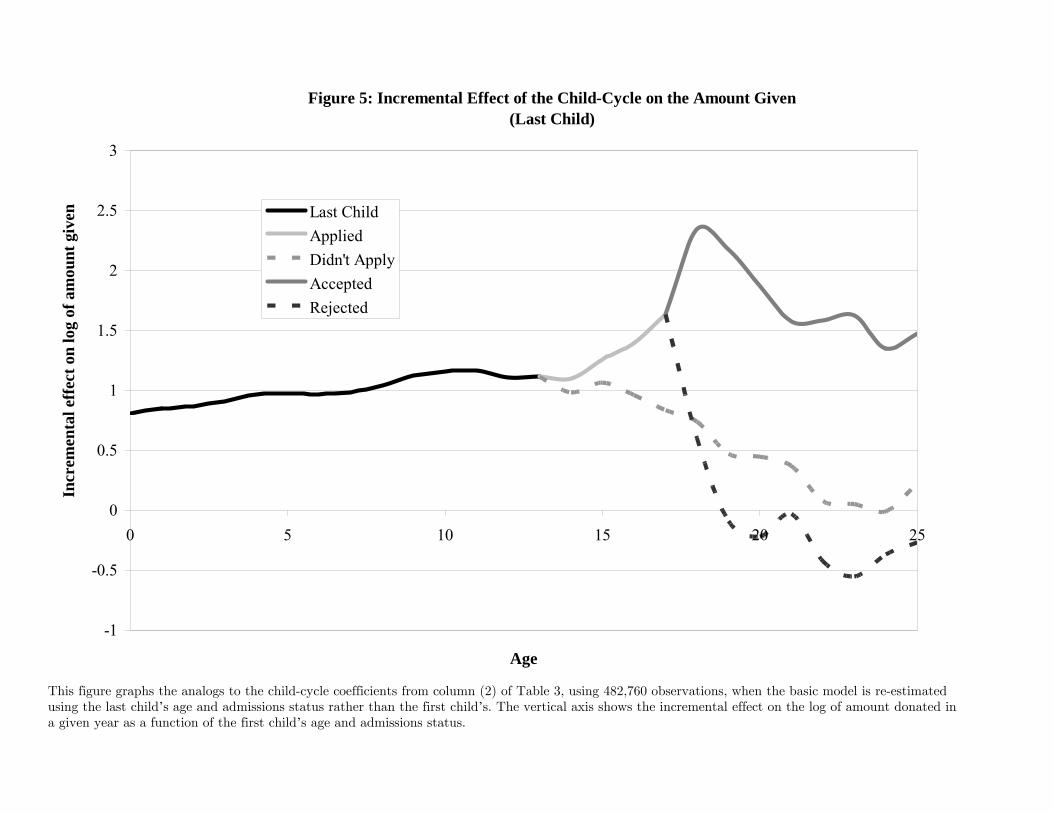
Figure 5: Incremental Effect of the Child-Cycle on the Amount Given(Last Child)
-1
-0.5
0
0.5
1
1.5
2
2.5
3
0 5 10 15 20 25
Age
Incr
emen
tal e
ffec
t on
log
of a
mou
nt g
iven Last Child
AppliedDidn't ApplyAcceptedRejected
This figure graphs the analogs to the child-cycle coefficients from column (2) of Table 3, using 482,760 observations, when the basic model is re-estimated using the last child’s age and admissions status rather than the first child’s. The vertical axis shows the incremental effect on the log of amount donated in a given year as a function of the first child’s age and admissions status.
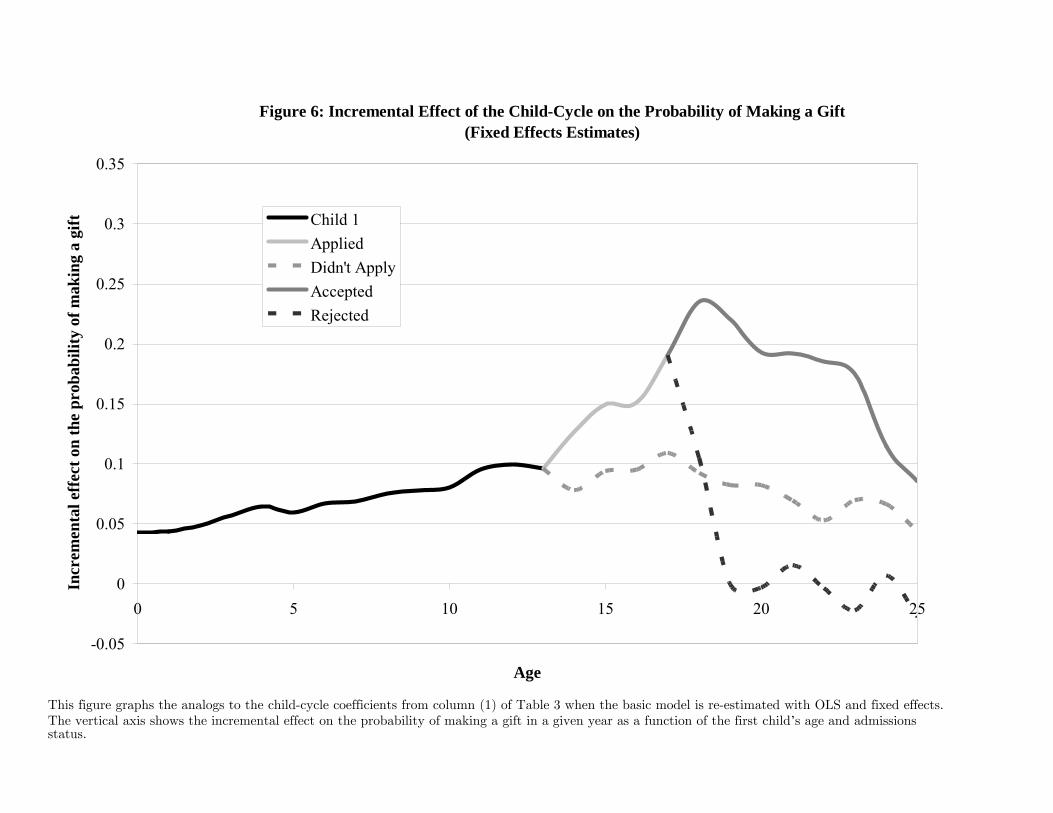
Figure 6: Incremental Effect of the Child-Cycle on the Probability of Making a Gift(Fixed Effects Estimates)
-0.05
0
0.05
0.1
0.15
0.2
0.25
0.3
0.35
0 5 10 15 20 25
Age
Incr
emen
tal e
ffec
t on
the
prob
abili
ty o
f mak
ing
a gi
ft Child 1AppliedDidn't ApplyAcceptedRejected
This figure graphs the analogs to the child-cycle coefficients from column (1) of Table 3 when the basic model is re-estimated with OLS and fixed effects. The vertical axis shows the incremental effect on the probability of making a gift in a given year as a function of the first child’s age and admissions status.
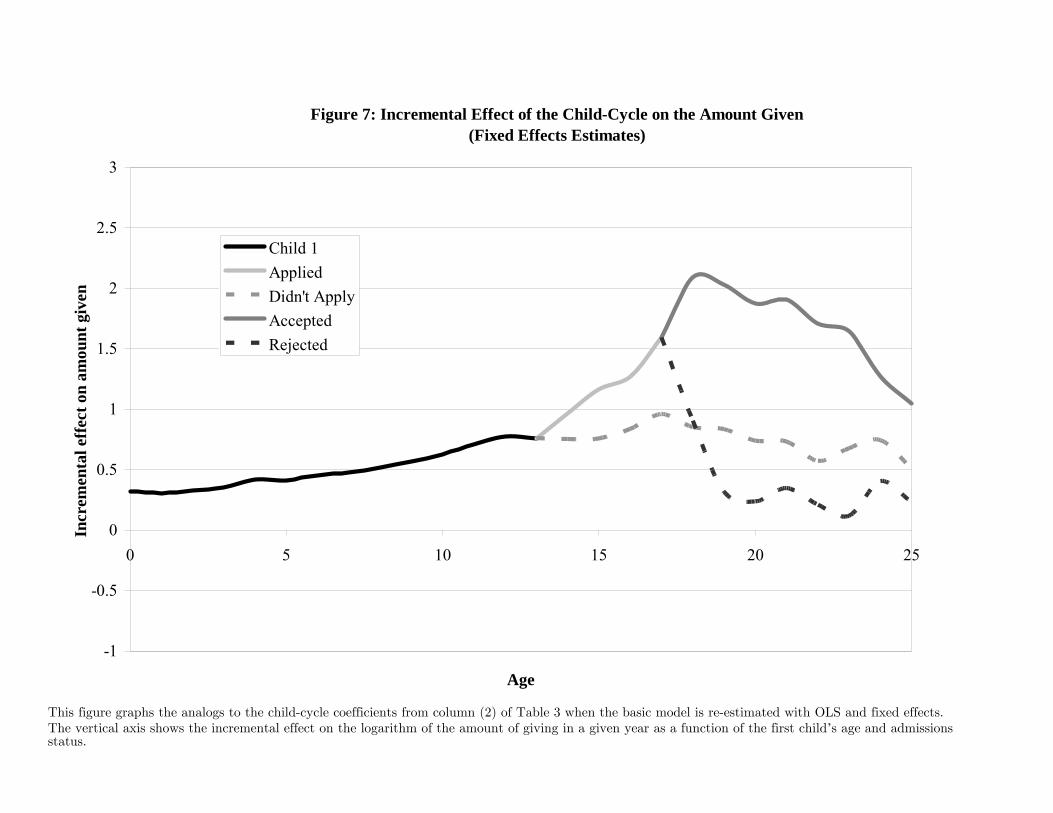
Figure 7: Incremental Effect of the Child-Cycle on the Amount Given(Fixed Effects Estimates)
-1
-0.5
0
0.5
1
1.5
2
2.5
3
0 5 10 15 20 25
Age
Incr
emen
tal e
ffec
t on
amou
nt g
iven
Child 1AppliedDidn't ApplyAcceptedRejected
This figure graphs the analogs to the child-cycle coefficients from column (2) of Table 3 when the basic model is re-estimated with OLS and fixed effects. The vertical axis shows the incremental effect on the logarithm of the amount of giving in a given year as a function of the first child’s age and admissions status.
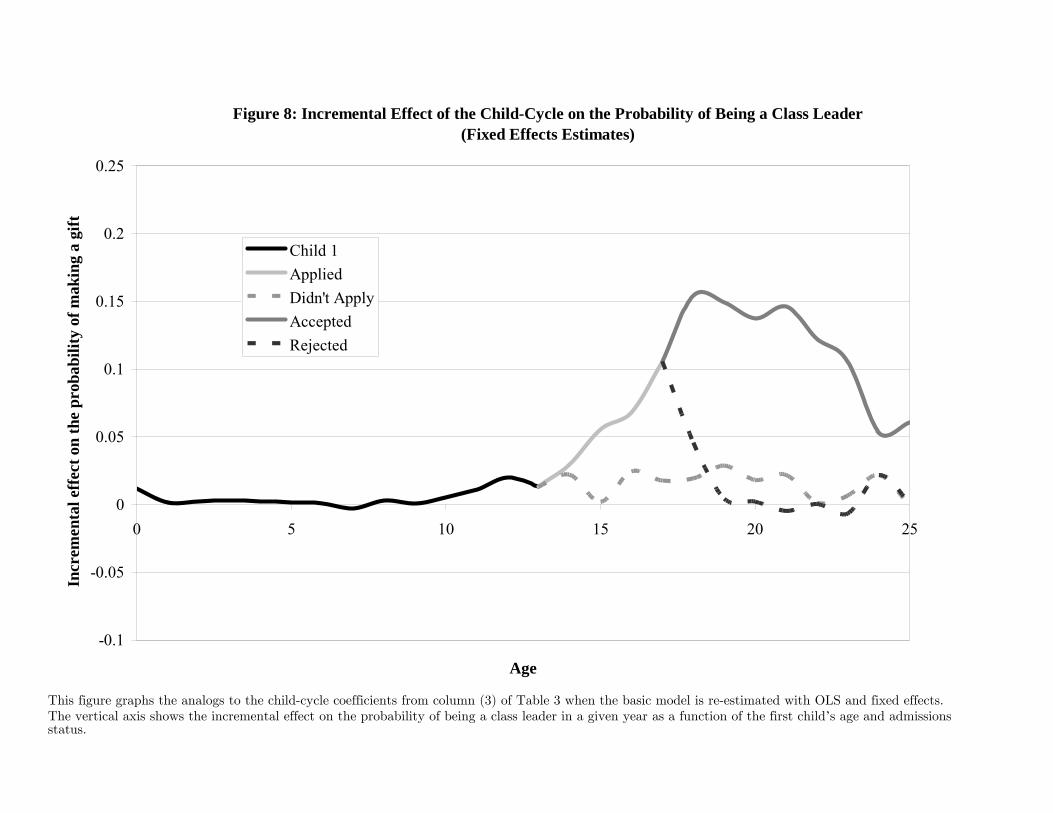
Figure 8: Incremental Effect of the Child-Cycle on the Probability of Being a Class Leader(Fixed Effects Estimates)
-0.1
-0.05
0
0.05
0.1
0.15
0.2
0.25
0 5 10 15 20 25
Age
Incr
emen
tal e
ffec
t on
the
prob
abili
ty o
f mak
ing
a gi
ft
Child 1AppliedDidn't ApplyAcceptedRejected
This figure graphs the analogs to the child-cycle coefficients from column (3) of Table 3 when the basic model is re-estimated with OLS and fixed effects. The vertical axis shows the incremental effect on the probability of being a class leader in a given year as a function of the first child’s age and admissions status.
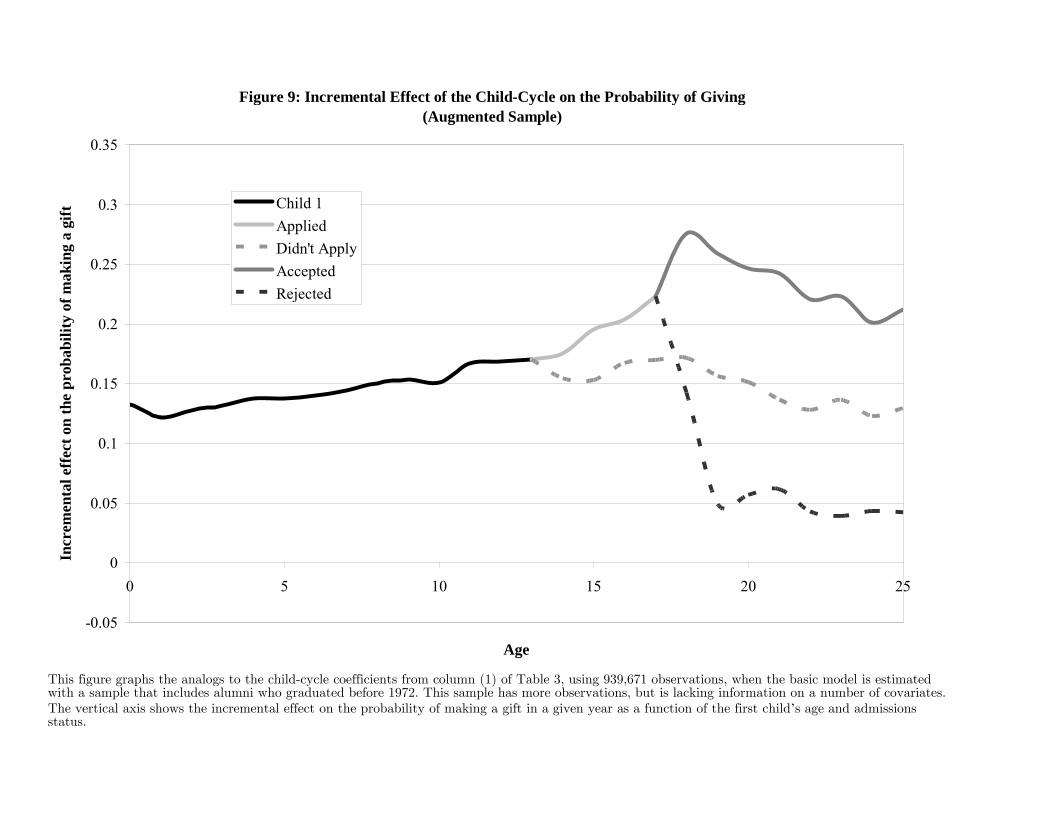
Figure 9: Incremental Effect of the Child-Cycle on the Probability of Giving (Augmented Sample)
-0.05
0
0.05
0.1
0.15
0.2
0.25
0.3
0.35
0 5 10 15 20 25
Age
Incr
emen
tal e
ffec
t on
the
prob
abili
ty o
f mak
ing
a gi
ft Child 1AppliedDidn't ApplyAcceptedRejected
This figure graphs the analogs to the child-cycle coefficients from column (1) of Table 3, using 939,671 observations, when the basic model is estimated with a sample that includes alumni who graduated before 1972. This sample has more observations, but is lacking information on a number of covariates. The vertical axis shows the incremental effect on the probability of making a gift in a given year as a function of the first child’s age and admissions status.
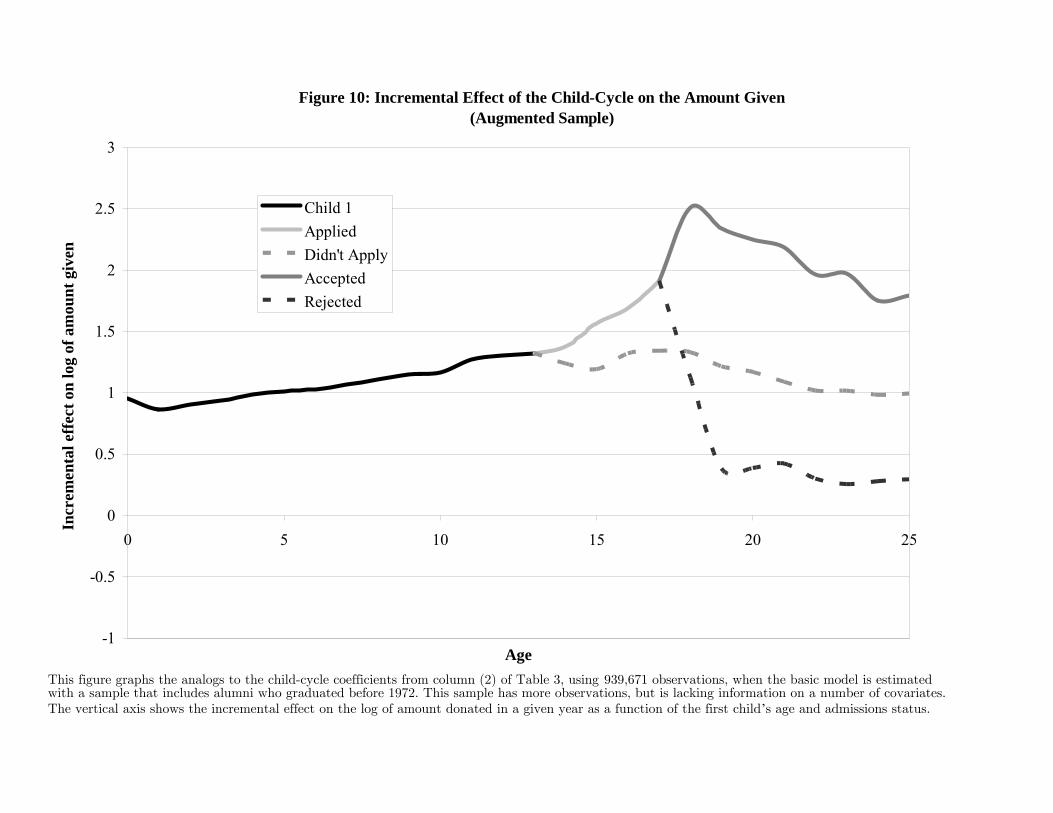
Figure 10: Incremental Effect of the Child-Cycle on the Amount Given (Augmented Sample)
-1
-0.5
0
0.5
1
1.5
2
2.5
3
0 5 10 15 20 25
Age
Incr
emen
tal e
ffec
t on
log
of a
mou
nt g
iven
Child 1AppliedDidn't ApplyAcceptedRejected
This figure graphs the analogs to the child-cycle coefficients from column (2) of Table 3, using 939,671 observations, when the basic model is estimated with a sample that includes alumni who graduated before 1972. This sample has more observations, but is lacking information on a number of covariates. The vertical axis shows the incremental effect on the log of amount donated in a given year as a function of the first child’s age and admissions status.
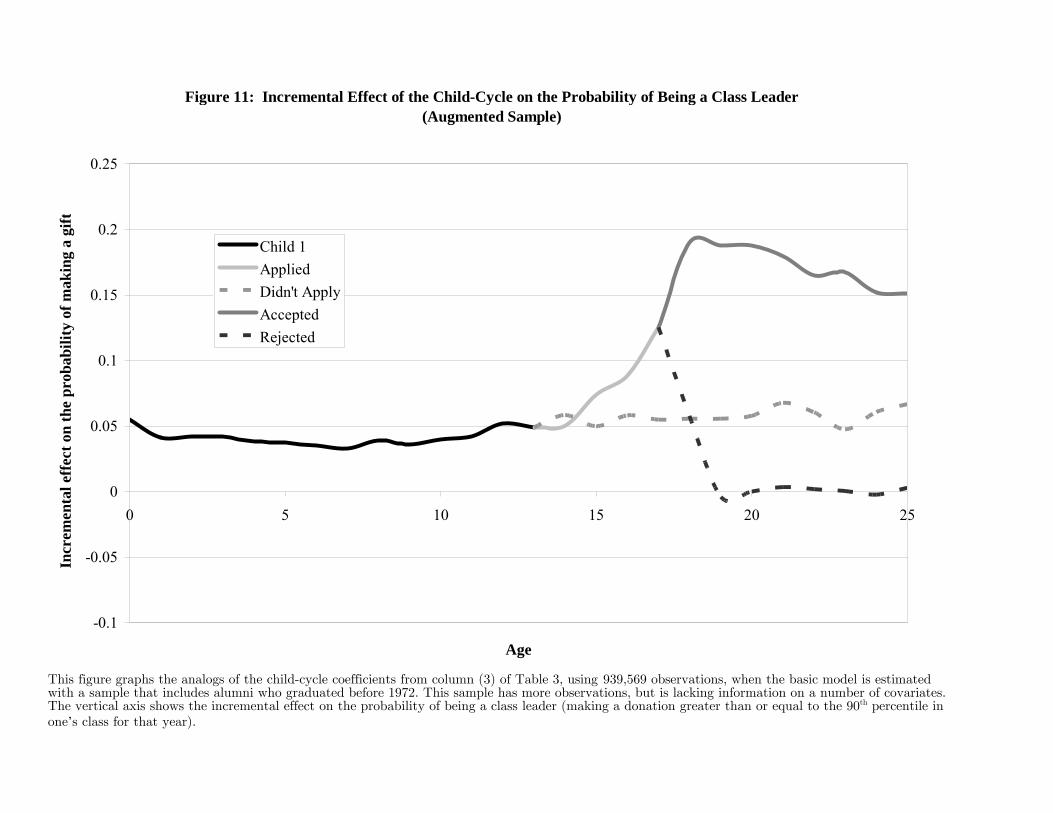
Figure 11: Incremental Effect of the Child-Cycle on the Probability of Being a Class Leader (Augmented Sample)
-0.1
-0.05
0
0.05
0.1
0.15
0.2
0.25
0 5 10 15 20 25
Age
Incr
emen
tal e
ffec
t on
the
prob
abili
ty o
f mak
ing
a gi
ft
Child 1AppliedDidn't ApplyAcceptedRejected
This figure graphs the analogs of the child-cycle coefficients from column (3) of Table 3, using 939,569 observations, when the basic model is estimated with a sample that includes alumni who graduated before 1972. This sample has more observations, but is lacking information on a number of covariates. The vertical axis shows the incremental effect on the probability of being a class leader (making a donation greater than or equal to the 90th percentile in one’s class for that year).
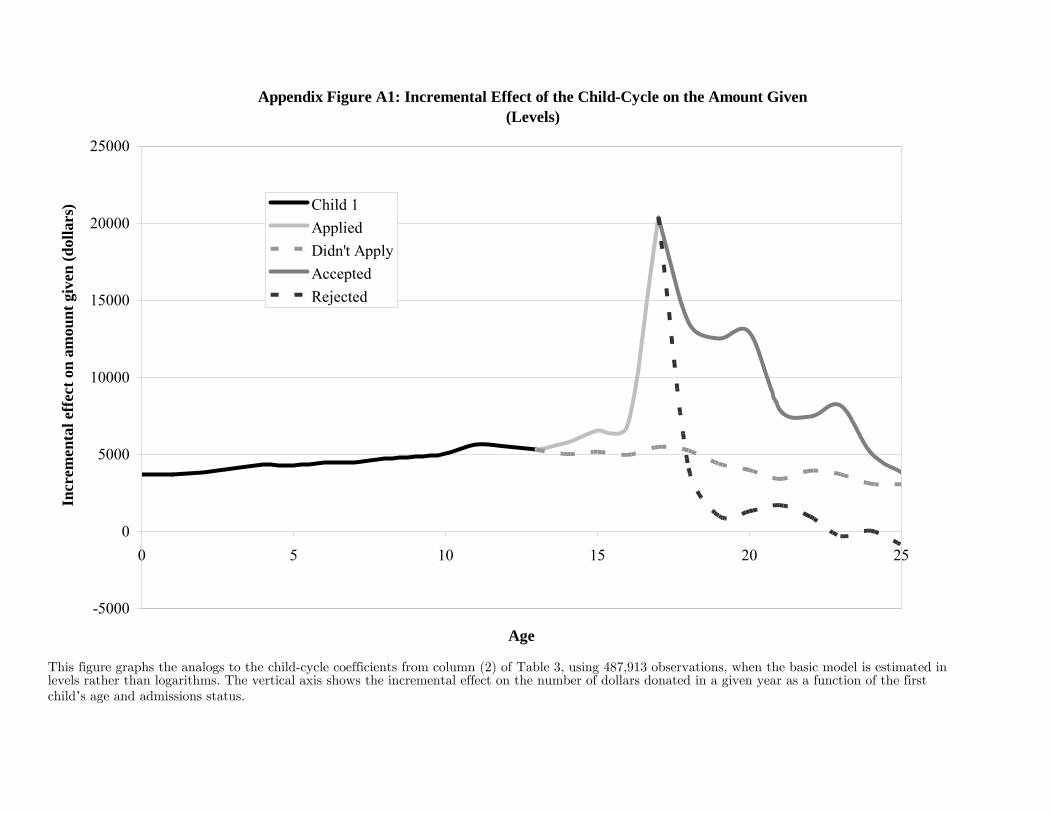
Appendix Figure A1: Incremental Effect of the Child-Cycle on the Amount Given (Levels)
-5000
0
5000
10000
15000
20000
25000
0 5 10 15 20 25
Age
Incr
emen
tal e
ffec
t on
amou
nt g
iven
(dol
lars
) Child 1AppliedDidn't ApplyAcceptedRejected
This figure graphs the analogs to the child-cycle coefficients from column (2) of Table 3, using 487,913 observations, when the basic model is estimated in levels rather than logarithms. The vertical axis shows the incremental effect on the number of dollars donated in a given year as a function of the first child’s age and admissions status.
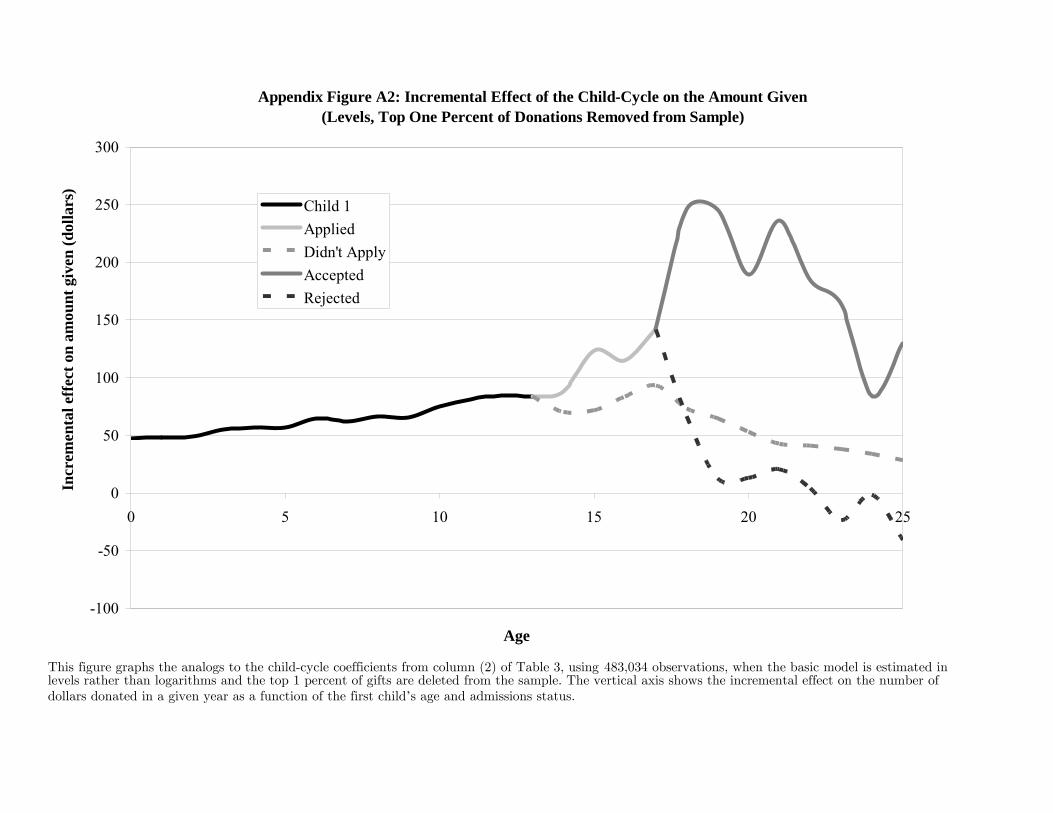
Appendix Figure A2: Incremental Effect of the Child-Cycle on the Amount Given(Levels, Top One Percent of Donations Removed from Sample)
-100
-50
0
50
100
150
200
250
300
0 5 10 15 20 25
Age
Incr
emen
tal e
ffec
t on
amou
nt g
iven
(dol
lars
)
Child 1AppliedDidn't ApplyAcceptedRejected
This figure graphs the analogs to the child-cycle coefficients from column (2) of Table 3, using 483,034 observations, when the basic model is estimated in levels rather than logarithms and the top 1 percent of gifts are deleted from the sample. The vertical axis shows the incremental effect on the number of dollars donated in a given year as a function of the first child’s age and admissions status.