Embed Size (px)
Citation preview

Alumni
Engagement
Model Discussion with the National Board
of Directors – January 2011

Agenda
• Measurable touch points: What
attributes comprise the model?
• Goal setting: FY10 learnings,
FY11 goal
• Model uses and opportunities:
Each entry makes a difference
• Quarter Two: Where do we stand?

Model Goals
• Can count each attribute
• Work to improve/increase each year
• Measurement and ownership across
Marquette (everyone has a stake)
• Informed on regular basis with
various ways to review data

Involvement/Connectivity (worth 50% of score)
•Athletic – season ticket holder as recorded
(men’s, women’s basketball) (1 point)
•Online community (1 point)
•Action – limited to visit/meeting/face-to-face
(1 point)
•Volunteer (1 point)

Involvement/Connectivity continued
(worth 50% of score)
• Email address (1 point)
•Existence of business employer/title
(inc. retired, community volunteer) and/or
seasonal address (1 point)
• Event attendance – non-reunion (1 point)
•Reunion attendance (1 point)

Giving (worth 50% of score)
• Gave this fiscal year (4 points)
• Gave last fiscal year (3 points)
• Increase between two years (1 point)

Whom are we measuring?
• Approximately 107,000 alumni
• All mailable/contactable alumni
• Still living/not deceased
• “Alumni” primary constituent code

FY10 Learnings
• FY09 average with goal to increase
this score in FY10
• 6.25% increase each year (1/16 –
goal to improve each constituent by
1 point)
• Rather, look at each attribute and
apply a goal to each area;
ultimately, numbers weighted
together for final goal
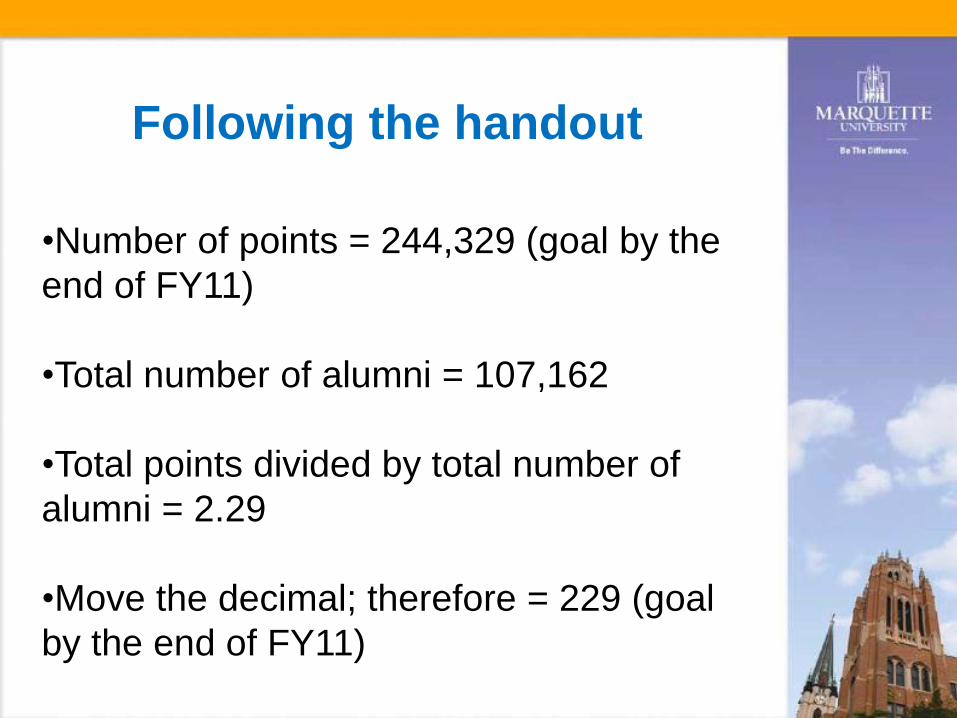
Following the handout
•Number of points = 244,329 (goal by the
end of FY11)
•Total number of alumni = 107,162
•Total points divided by total number of
alumni = 2.29
•Move the decimal; therefore = 229 (goal
by the end of FY11)

FY11 Goal
•Athletic Average past two fiscal years
with 5% increase (5 game offerings)
•Online community Lose significant
amount due to MU Connect re-launch;
online community includes:
•Facebook, Linked In, Marquette
Magazine submissions, class notes,
MU Connect
•Took down 1/3 for overlap

FY11 Goal
•Visit
•Of the constituents begin visited,
approximately half are visited twice
•Approximately 1/3 of the constituents
visited are non-alumni
•Took all managed prospects down by
approximately 25%
•Took this number down by 1/3 since
that amount are non-alumni

FY11 Goal
•Volunteer
•Additional 200
•Additional 1,000 emails acquired
•Employment, Seasonal
•Sustaining current information is the
most important element with this
attribute
•Retired, community volunteer, etc.
count as an engagement point –
anything in the employment field

FY11 Goal
•Event
•Took average of FY09 and FY10
•Reunion
•Apply a 6% increase to FY10 based
on past data

FY11 Goal •Prior Yr
•See an increase of nearly 2.5% from
previous year (more donors in FY10)
•Number remains static based on
FY10
•Current Yr
•Apply 14.5% participation goal
•Increase
•Over past two years, approximately
25% of our current year donors are
increasing their gift size; therefore
apply a 25% goal

Model Uses and
Opportunities
•Mailings
• Fundraiser Portfolios •Prioritizing visits
•Legacy
• Segment Analysis •College
•Regional
•Reunion vs. non-reunion
• Individual Profile

Engagement Score by Quarter Tracked in Raiser’s Edge

Quarter Two:
Where Do We Stand? • On track at 206
• Athletic, Reunion – met goal (track
this earlier in the fiscal year)
• Online Community – still need an
additional 1750 unique alumni in FY11
• Action – 500 unique alumni visited
in Q1, 800 in Q2; at 63% of goal

Quarter Two:
Where Do We Stand? • Volunteer – need 80 more unique
volunteers in FY11
• Email, Employment – on track, met
goal (could likely decrease, though)
• Event – at 66% of goal
• Giving – last year remains static, on
track for giving this year, increase
(14% in Q1, 49% in Q2)

Our Alumni Leaders Can
Make a Difference… • Every piece of data counts – help to
track
• Each engagement touch point can
make an impact
•Email = E-solicitation, awareness
of engagement platforms, further
connections to alma mater
•Focus on two to three areas

Marquette University. Be The Difference.