Embed Size (px)
Citation preview
1
Alvanchi, A., & JavadiAghdam, S. (2019). Job site weather index: an indicator for open 1
environment construction projects. Construction Innovation. Construction Innovation, 2
Vol. 19 No. 1, pp. 110-124. 3
4
Job site Weather Index: an Indicator for Open Environment Construction Projects 5
Amin Alvanchi1,*, Shayan JavadiAghdam2 6
7
1Assistant Professor, Department of Civil Engineering, Sharif University of Technology, Tehran, 8
Iran Email: [email protected] 9
2MSc Student, Department of Civil Engineering, Sharif University of Technology, Iran Email: 10
12
* Corresponding author: 13
#427, Department of Civil Engineering, Sharif University of Technology, Azadi street, 15
Tehran, Iran 16
Postal Code: 145888-9694 17
Tel: 0098-21-66164221, 0098-912-1839912 Fax: 0098-21-66014828 18
19
Abstract 20
Purpose: Many construction projects are implemented in open-environment job sites and can be 21
significantly affected by various weather conditions. Evaluating the overall impacts of the weather 22
conditions on a project can assist project managers to prepare effectively. Nevertheless, methods measuring 23
the overall adverse impacts of the job sites’ weather condition on the project performance are still missing. 24
Method: In this investigation, a survey-based method was proposed to evaluate the overall impacts of the 25
This author accepted manuscript is deposited under a Creative Commons Attribution Non-commercial 4.0 International (CC BY-NC) licence. This means
that anyone may distribute, adapt, and build upon the work for non-commercial purposes, subject to full attribution. If you wish to use this manuscript
for commercial purposes, please contact [email protected].
2
weather conditions on the construction project resources through a new indicator called job site weather 26
index (JWI). The target survey population includes practitioners directly involved in the on-site 27
construction operations. Findings: The JWI suggests the direction of the resource change in new 28
construction projects based on the weather condition. The method was implemented in the road construction 29
projects of Iran and successfully applied to four sample cities. In this experiment, construction workers 30
were identified as the most susceptible resources to the unfavorable weather conditions. Hot temperature 31
above 50° C and cold temperature below -10°C were ranked as the most influential factors for the workers. 32
The results achieved showed high accordance with the trends currently followed in the country. 33
Originality: This research was the first structured method for capturing impacts of weather conditions on 34
the performance of construction resources in open environment construction projects. Implementation of 35
the method in road construction projects of Iran revealed new results that have not been previously 36
identified. The impacts of the company-specific factors on the final productivity rate, however, were not 37
investigated in the research. Investigations accounting impacts of various company-specific factors on the 38
final productivity rate are required. 39
Keywords: Weather condition; Open-environment project; Construction job site; Project performance 40
1. Introduction 41
Weather conditions significantly affect many construction projects performed in the open-environment job 42
sites. It is quite important to prepare mitigation strategies before facing adverse impacts of weather 43
conditions to suffer a minimum possible cost. Following that, a variety of mitigation strategies were 44
proposed by researchers to alleviate these adverse impacts on the construction industry. Health and Safety 45
Executive (HSE 2013) proposed strategies such as wetting the material, wearing masks and regularly 46
replacing equipment filters. Use of anti-freezing solutions to improve the performance of equipment and 47
materials in cold weather conditions is a quite common mitigation method in different job sites (PCA 2008). 48
Al-Abbasi (2014) proposed the use of temporary shades and cold water spray to mitigate the effects of 49
extreme heat on the construction workers in Qatar. Alshebania and Wedawattab (2014) suggested 50
employing workers from India and Pakistan, used to living in hot climates, to improve the project 51
3
performance in the United Arab Emirates. Scheduling activities with low susceptibility to cold weather, 52
heating the ground, using hot water, and setting up tents are also some mitigation strategies used in cold 53
weather (Shea and Smith 2015). 54
Weather conditions can drastically change from one project job site to another or even from one day to 55
another. When construction project managers prepare their mitigation plans for working in open-56
environment job sites, it is quite important to perceive regarding upcoming weather condition and its 57
potential impacts on the project performance. For decades, developing tools and methods for predicting job 58
site weather conditions and estimating their impacts on project performance have been the focus of 59
researchers in the construction industry. Use of numerical simulation techniques to estimate expected 60
impacts of weather condition is the primary approach followed. Ahuja and Nandakumar (1985) developed 61
a Monte Carlo simulation model based on past project records to estimate expected project delays. Wales 62
and AbouRizk (1996) developed a combined simulation and neural network model based on past project 63
data to capture impacts of precipitation and temperature on the productivity. Apipattanavis et al. (2010) 64
accounted for extreme weather conditions in road construction project using a stochastic weather generator. 65
Shahin et al. (2011) studied the impact of extreme cold and windy conditions on a pipeline project using a 66
simulation-based technique. Wolken-M¨ohlmann et al. (2016) used weather time series data to simulate 67
project schedule and assess uncertainties involved in the impacts of weather conditions on offshore 68
construction projects. Al-Alawi et al. (2017) proposed a non-parametric weather generation method for 69
predicting impacts of weather conditions. Kerkhovea and Vanhoucke (2017) developed a combined 70
simulation method for preparing schedules of offshore construction projects. 71
Other types of numerical approaches have also been adopted for capturing impacts of weather condition on 72
construction projects. Maunder et al. (1971) applied a Markov chain model on historical data for estimating 73
impacts of rainfall on road construction projects. Moselhi et al. (1997) developed a computer program based 74
on a set of proposed equations to estimate reduced labor productivity and work stoppage. El-Rayes and 75
Moselhi (2001) captured impacts of rainfall on the productivity of road construction projects through a step 76
by step procedure based on historical data. Jang et al. (2008) proposed a method for applying expected 77
4
schedule updates on Microsoft Project software based on the short-term weather condition forecast. Al-78
Abbasi et al. (2014) identified impacts of extremely hot and humid weather condition on labor productivity 79
through linear regression equations. Boldin and Wright (2015) assessed employment data and found the 80
number of workers in the construction sector is highly affected by seasonal weather conditions. Two 81
questionnaire-based research efforts also were found (Gandhi 2013; Wedawatta and Bingunath 2016), both 82
of which focused on the impacts of extreme weather conditions. 83
Construction projects are implemented in various locations over different seasons of the year with a variety 84
of weather conditions and different possible adverse impacts. In general, these adverse impacts can be 85
categorized in four main categories, including 1) payable or non-payable project suspensions, 2) reduced 86
the productivity of resources, 3) damages to the constructed parts and 4) delayed and stood-off time of 87
resources (Randolph and Yikamoumis 1987). To properly prepare for adverse impacts of weather 88
conditions, accounting for all possible adverse impacts during the implementation period of projects is 89
necessary. However, past research efforts mainly consider adverse impacts of one or a limited number of 90
weather elements, most of which adopted numerical methods using historical data. Nevertheless, creating 91
a comprehensive perspective of possible adverse impacts of weather conditions based on historical data 92
requires a large number of detailed data from various aspects of past construction projects which makes 93
this mission quite challenging. In this study, a method was proposed based on aggregated judgments of 94
project experts extracted from a questionnaire-based survey to draw an overall view of the adverse impacts 95
of weather conditions on construction projects. Job site weather index (JWI), as a new indicator, was 96
introduced to reflect the overall impacts of various weather conditions on three main types of project 97
resources including workers, equipment, and materials. Steps taken to implement the proposed method are 98
presented for the road construction projects in four sample cities in Iran. Usefulness and limitations of the 99
proposed method are discussed based on the results achieved during the method implementation. 100
5
2. Proposed Method 101
A five-step method was proposed for capturing overall unfavorable impacts of weather conditions of the 102
construction projects in the JWI. Figure 1 summarizes the different steps of the proposed method. Each step 103
is explained in the rest of the section. 104
105
Figure 1. Various steps of the proposed methods 106
107
Different types of projects require different sets of working resources and methods, and they can be affected 108
differently by various weather conditions. For instance, windy weather conditions can affect structural steel 109
construction projects more severely than road construction projects. Lifting heavy objects with a crane and 110
working at high levels carries a higher risk in windy conditions than earthmoving activities, which are 111
mainly conducted on the ground. Furthermore, workers from different cultures, habits, and backgrounds 112
may react differently when they face similar weather conditions. For example, people from a hot climate 113
can overcome the hot weather conditions more properly that the ones grew up in mild or cold weather 114
condition (Alshebania and Wedawattab 2014). Therefore, in the first step of the proposed method the 115
project scope, including the project type and its geographical limits, is specified. It is recommended that a 116
region with similar construction project contractors’ evaluation systems is determined as the geographical 117
limits. In this perspective, country or political borders can be proper instances of the determined 118
geographical limits in many cases. 119
6
In the second step, expected overall impacts of the possible weather elements, such as temperature, 120
humidity, wind, and precipitation, on the implementation of the construction projects in different job sites 121
within the specified scope is identified. Measuring the overall impact of the weather condition on the 122
construction projects is a complicated process using quantitative methods since numerous effective factors 123
affect the project performance. Instead, implementation of a questionnaire-based survey method for 124
extracting collective judgment of the experienced construction project practitioners is proposed. The survey 125
questions need to include various possible weather conditions within the specified geographical scope. The 126
survey group should include experienced practitioners working in different parts of the construction projects 127
within the specified scope. In the survey, respondents are asked to rate the extent of the adverse impacts of 128
different weather conditions on the performance of the project’s workers, equipment, and materials. It is 129
recommended that the questions are designed with ascending rating, i.e., high rates represent severe adverse 130
impacts of the weather elements on the project performance. The adverse impact rates of different weather 131
conditions on the projects are estimated by aggregating the results achieved in the survey in the third step. 132
Here, the calculated impact rates of different weather elements are unit-less and represent the relative values 133
meaningful in comparison to each other. In the fourth step, historical weather conditions of the required 134
construction project job sites within the specified geographical scope are extracted. The historical weather 135
conditions over different months of the year and the calculated weather element impact rates (calculated in 136
the third step) are used for calculating the JWI of the job sites in the fifth step. The JWI of the job site is 137
calculated as an aggregate of the impact rates of the weather elements in different months. The comparison 138
between JWIs of different job sites represents the direction of the change in the resource performance when 139
a construction company moves from one job site to another. High construction costs are expected in the job 140
sites with severe adverse weather conditions or high JWIs. 141
The JWI can also be calculated for the projects being implemented on different job site. Not necessarily a 142
construction project is implemented over an entire period of one year. Here, the frequencies of different 143
months over the course of the project can be used as the weight factor in the calculation of the JWI of the 144
project. For example, if a project begins in April and ends in July of the same year, the weight factor of 1 145
7
is considered for April, May, June, and July in the calculation of JWI. The weight factors for the rest of the 146
months are zero. Furthermore, there is a chance of facing periods with concurrent dominant weather 147
elements. For example, a job site may concurrently receive hot and rainy or cold and windy weather 148
conditions for a specific period. In such cases, it is recommended that impact rates of likely concurrent 149
weather conditions are directly asked and scored in the survey. When these concurrent weather conditions 150
become dominant, their extracted impact rates are directly used for JWI calculations. However, 151
combinations of different weather conditions can create extra options, requiring extra questions, which do 152
not simply fit in a single survey. Therefore, for concurrent weather conditions that are not directly scored 153
by survey respondents, it is recommended that the weather condition with a high rate is used in the JWI 154
calculations. Further details about the different steps of the proposed method are presented in the next 155
section, during the implementation of the proposed method in the actual case of road construction projects 156
in Iran. 157
3. Method Implementation 158
To check the applicability of the method and use its output results, different steps of the method were 159
implemented for road construction projects in Iran. A brief explanation of the process and results achieved 160
in each step follows below. 161
3.1. Project Type and Survey Group 162
Road construction projects are mainly done in the open environment, and their performance can be highly 163
affected by different weather conditions. In Iran, many road construction projects are accomplished 164
annually by the Ministry of Roads and Urban Development in different parts of the country. For example, 165
the estimated investment required for expressways currently announced or under development by the 166
Ministry of Roads and Urban Development is estimated at €4.5 billion (MRUD 2017). Approximately, 167
1100 road construction companies are active in different road construction projects across Iran (MPOI 168
2017). Practitioners working in different parts of the road construction projects formed the survey group of 169
the study. 170
8
3.2. Conducting the Survey 171
The design process of the survey questionnaire was started with an initial list of different adverse weather 172
elements reported in the past research. Then applicable adverse weather condition to the specified 173
geographical scope of the survey, i.e., Iran, was investigated. In general, the four different climate zones 174
identified in Iran include 1) moderate and humid, 2) cold and semiarid, 3) hot and humid, and 4) hot and 175
dry. According to the variety of weather conditions identified in the country, road construction projects in 176
Iran can receive a wide range of weather elements, including hot, cold, humid, rainy, windy, and dusty and 177
air polluted. The list of adverse weather conditions was then finalized by the research team considering 178
possible weather conditions in the country and the adverse weather conditions reported in the literature. 12 179
identified adverse weather conditions were used to design a questionnaire with 36 questions for capturing 180
the impacts of weather conditions on the construction workers, equipment, and materials. The provided 181
guidelines in the literature (Carifio and Perla 2007; Brown 2011; Losby and Wetmore 2012) were followed 182
in the design of the multiple choice questions based on the five-point Likert scale, with 1 representing no 183
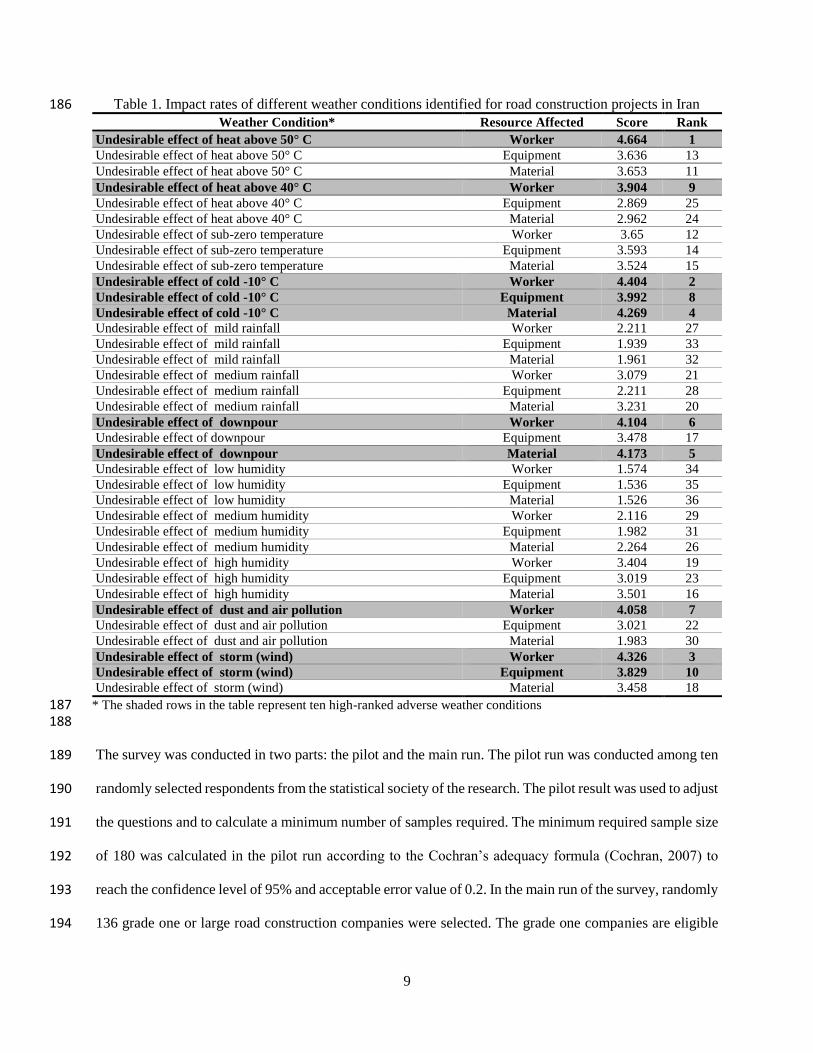
impact and 5 representing severe impact. Table 1 represents the list of questions used in the questionnaire. 184
185
9
Table 1. Impact rates of different weather conditions identified for road construction projects in Iran 186 Rank Score Resource Affected Weather Condition*
1 4.664 Worker Undesirable effect of heat above 50° C
13 3.636 Equipment Undesirable effect of heat above 50° C
11 3.653 Material Undesirable effect of heat above 50° C
9 3.904 Worker Undesirable effect of heat above 40° C
25 2.869 Equipment Undesirable effect of heat above 40° C
24 2.962 Material Undesirable effect of heat above 40° C
12 3.65 Worker Undesirable effect of sub-zero temperature
14 3.593 Equipment Undesirable effect of sub-zero temperature
15 3.524 Material Undesirable effect of sub-zero temperature
2 4.404 Worker Undesirable effect of cold -10° C
8 3.992 Equipment Undesirable effect of cold -10° C
4 4.269 Material Undesirable effect of cold -10° C
27 2.211 Worker Undesirable effect of mild rainfall
33 1.939 Equipment Undesirable effect of mild rainfall
32 1.961 Material Undesirable effect of mild rainfall
21 3.079 Worker Undesirable effect of medium rainfall
28 2.211 Equipment Undesirable effect of medium rainfall
20 3.231 Material Undesirable effect of medium rainfall
6 4.104 Worker Undesirable effect of downpour
17 3.478 Equipment Undesirable effect of downpour
5 4.173 Material Undesirable effect of downpour
34 1.574 Worker Undesirable effect of low humidity
35 1.536 Equipment Undesirable effect of low humidity
36 1.526 Material Undesirable effect of low humidity
29 2.116 Worker Undesirable effect of medium humidity
31 1.982 Equipment Undesirable effect of medium humidity
26 2.264 Material Undesirable effect of medium humidity
19 3.404 Worker Undesirable effect of high humidity
23 3.019 Equipment Undesirable effect of high humidity
16 3.501 Material Undesirable effect of high humidity
7 4.058 Worker Undesirable effect of dust and air pollution
22 3.021 Equipment Undesirable effect of dust and air pollution
30 1.983 Material Undesirable effect of dust and air pollution
3 4.326 Worker Undesirable effect of storm (wind)
10 3.829 Equipment Undesirable effect of storm (wind)
18 3.458 Material Undesirable effect of storm (wind)
* The shaded rows in the table represent ten high-ranked adverse weather conditions 187 188
The survey was conducted in two parts: the pilot and the main run. The pilot run was conducted among ten 189
randomly selected respondents from the statistical society of the research. The pilot result was used to adjust 190
the questions and to calculate a minimum number of samples required. The minimum required sample size 191
of 180 was calculated in the pilot run according to the Cochran’s adequacy formula (Cochran, 2007) to 192
reach the confidence level of 95% and acceptable error value of 0.2. In the main run of the survey, randomly 193
136 grade one or large road construction companies were selected. The grade one companies are eligible 194
10
for bidding on public road construction projects with no limitation on the project size and are listed annually 195
by the Plan and Budget Organization of Iran (MPOI 2017). The maximum number of 3 experienced road 196
construction practitioners in each construction company was contacted and asked to fill out the questions. 197
In total, 400 questionnaires were distributed and a total number of 208 responses were returned which 198
indicates the response rate of 52%. The survey response rate is an important factor analyzed in the past 199
research. Considering the average and standard deviation reported for the response rate of the past research 200
(Baruch 1999; Baruch and Holtom 2008), the achieved response rate in the research falls within the 201
expected range and is close to the average. In this perspective, the achieved response rate is deemed 202
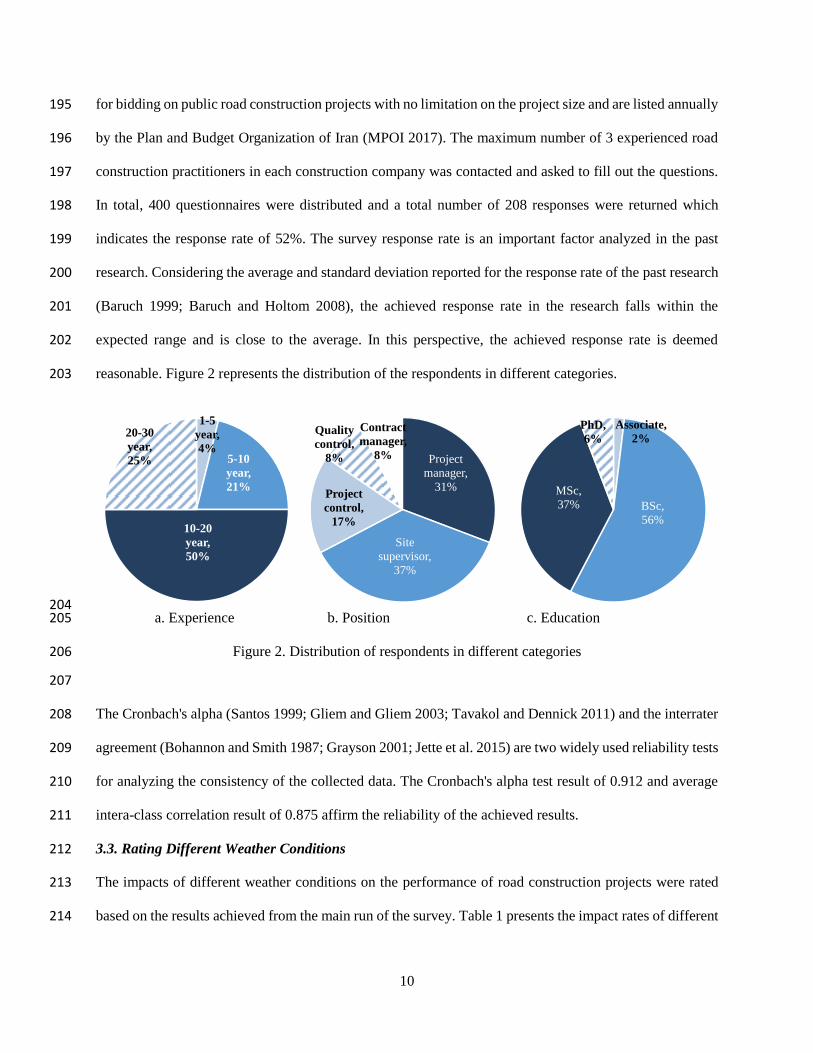
reasonable. Figure 2 represents the distribution of the respondents in different categories. 203
204 a. Experience b. Position c. Education 205
Figure 2. Distribution of respondents in different categories 206
207
The Cronbach's alpha (Santos 1999; Gliem and Gliem 2003; Tavakol and Dennick 2011) and the interrater 208
agreement (Bohannon and Smith 1987; Grayson 2001; Jette et al. 2015) are two widely used reliability tests 209
for analyzing the consistency of the collected data. The Cronbach's alpha test result of 0.912 and average 210
intera-class correlation result of 0.875 affirm the reliability of the achieved results. 211
3.3. Rating Different Weather Conditions 212
The impacts of different weather conditions on the performance of road construction projects were rated 213
based on the results achieved from the main run of the survey. Table 1 presents the impact rates of different 214
Project
manager,
31%
Site
supervisor,
37%
Project
control,
17%
Quality
control,
8%
Contract
manager,
8%
Associate,
2%
BSc,
56%
MSc,
37%
PhD,
6%
1-5
year,
4%5-10
year,
21%
10-20
year,
50%
20-30
year,
25%

11
weather conditions scored in the survey in the same order as the distributed questionnaire. Among different 215
weather conditions, “hot weather with a temperature above 50 °C” (average rate of 4.66) scored the highest 216
impact rate and was ranked as the most undesirable weather condition for construction workers. “Cold 217
temperature below -10 °C” (average rate of 4.40) and “stormy weather conditions” (average rate of 4.33) 218
were ranked in the second and third places, respectively. The top 10 weather conditions with the highest 219
impact rates are presented in Table 1. Construction workers are subject to the highest undesirable impacts 220
from weather conditions, with six items on the list. Although both construction equipment and construction 221
materials have two items apiece on the list, items related to construction materials indicate higher impact 222
rates. 223
3.4. Weather Condition of Sample Job sites 224
Four different major cities were selected including Isfahan in Isfahan province, North-Tehran in Tehran 225
province, Rasht in Gilan province, and Zahedan in Sistan province to test the applicability of the proposed 226
method and get an overall view of the expected JWIs of different cities in the country. Historical weather 227
condition of these sample cities was collected from the Iran Meteorological Organization. As an example, 228
Table 2 presents monthly climate conditions for the North Tehran region based on historical data from 1988 229
to 2010, extracted from the portal of the Iran Meteorological Organization website. Similar data were 230
extracted for the other three cities. For the sake of brevity, the other sample cities were avoided here. 231
Table 2. Historical weather condition of North Tehran 232
Month Jan Feb Mar Apr May Jun Jul Aug Sep Oct Nov Dec
Record high °C 16.4 19.0 23.8 33.6 33.6 37.8 39.8 39.4 35.6 31.2 23.0 19.0
Average high °C 6.1 8.1 12.9 19.8 25.0 31.2 33.9 33.5 29.3 22.4 14.3 8.6
Average low °C −1.5 −0.2 4.0 9.8 14 19.6 22.6 21.9 17.5 11.6 5.4 1.0
Record low °C −11.4 −11.0 −8.0 −1.6 3.0 12.0 15.4 13.5 8.8 2.6 −5.2 −9.6
Average precipitation mm 63.1 66.5 83.3 50.1 27.1 4.0 4.2 3.2 3.4 16.5 41.3 66.3
Average rainy days 12.3 10.9 12.3 10.0 8.9 3.3 3.4 1.6 1.3 5.8 8.6 10.7
Average snowy days 8.9 6.6 2.5 0.1 0.1 0 0 0 0 0 0.6 4.9
Average relative humidity % 67 59 53 44 39 30 31 31 33 44 57 66
Mean monthly sunshine hours 137 151 186 219 280 329 337 337 301 247 169 134
233
12
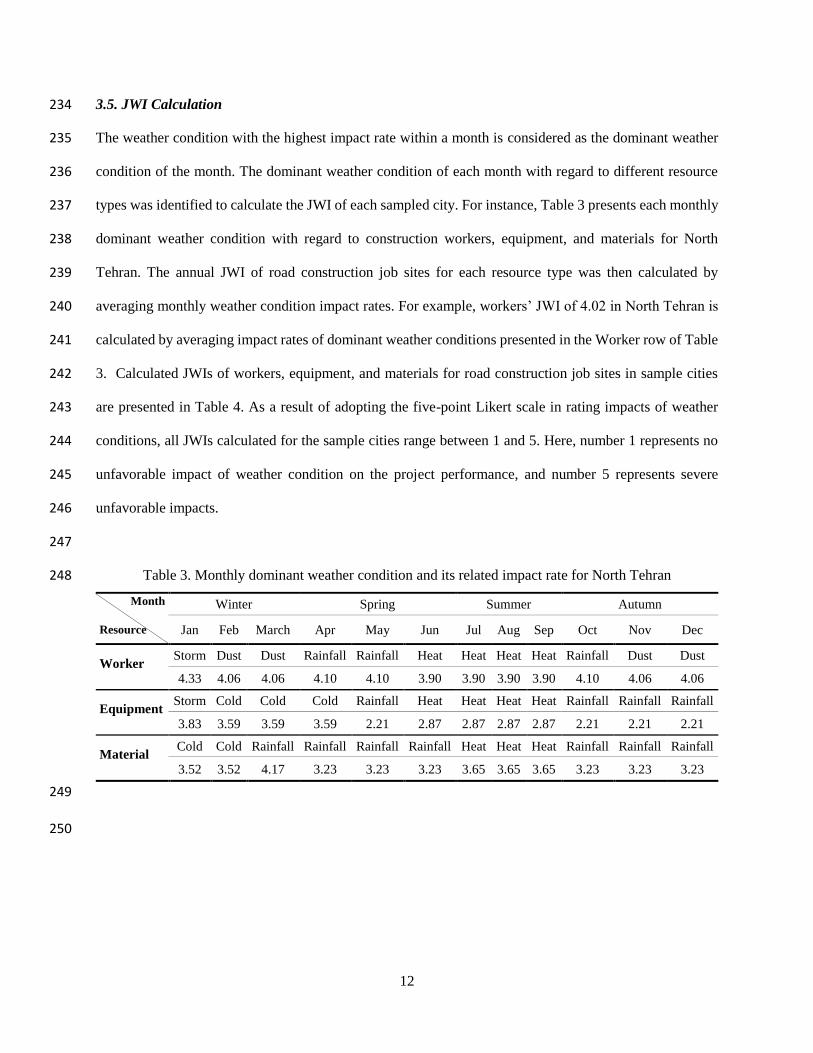
3.5. JWI Calculation 234
The weather condition with the highest impact rate within a month is considered as the dominant weather 235
condition of the month. The dominant weather condition of each month with regard to different resource 236
types was identified to calculate the JWI of each sampled city. For instance, Table 3 presents each monthly 237
dominant weather condition with regard to construction workers, equipment, and materials for North 238
Tehran. The annual JWI of road construction job sites for each resource type was then calculated by 239
averaging monthly weather condition impact rates. For example, workers’ JWI of 4.02 in North Tehran is 240
calculated by averaging impact rates of dominant weather conditions presented in the Worker row of Table 241
3. Calculated JWIs of workers, equipment, and materials for road construction job sites in sample cities 242
are presented in Table 4. As a result of adopting the five-point Likert scale in rating impacts of weather 243
conditions, all JWIs calculated for the sample cities range between 1 and 5. Here, number 1 represents no 244
unfavorable impact of weather condition on the project performance, and number 5 represents severe 245
unfavorable impacts. 246
247
Table 3. Monthly dominant weather condition and its related impact rate for North Tehran 248
Month
Resource
Winter Spring Summer Autumn
Jan Feb March Apr May Jun Jul Aug Sep Oct Nov Dec
Worker Storm Dust Dust Rainfall Rainfall Heat Heat Heat Heat Rainfall Dust Dust
4.33 4.06 4.06 4.10 4.10 3.90 3.90 3.90 3.90 4.10 4.06 4.06
Equipment Storm Cold Cold Cold Rainfall Heat Heat Heat Heat Rainfall Rainfall Rainfall
3.83 3.59 3.59 3.59 2.21 2.87 2.87 2.87 2.87 2.21 2.21 2.21
Material Cold Cold Rainfall Rainfall Rainfall Rainfall Heat Heat Heat Rainfall Rainfall Rainfall
3.52 3.52 4.17 3.23 3.23 3.23 3.65 3.65 3.65 3.23 3.23 3.23
249
250
13
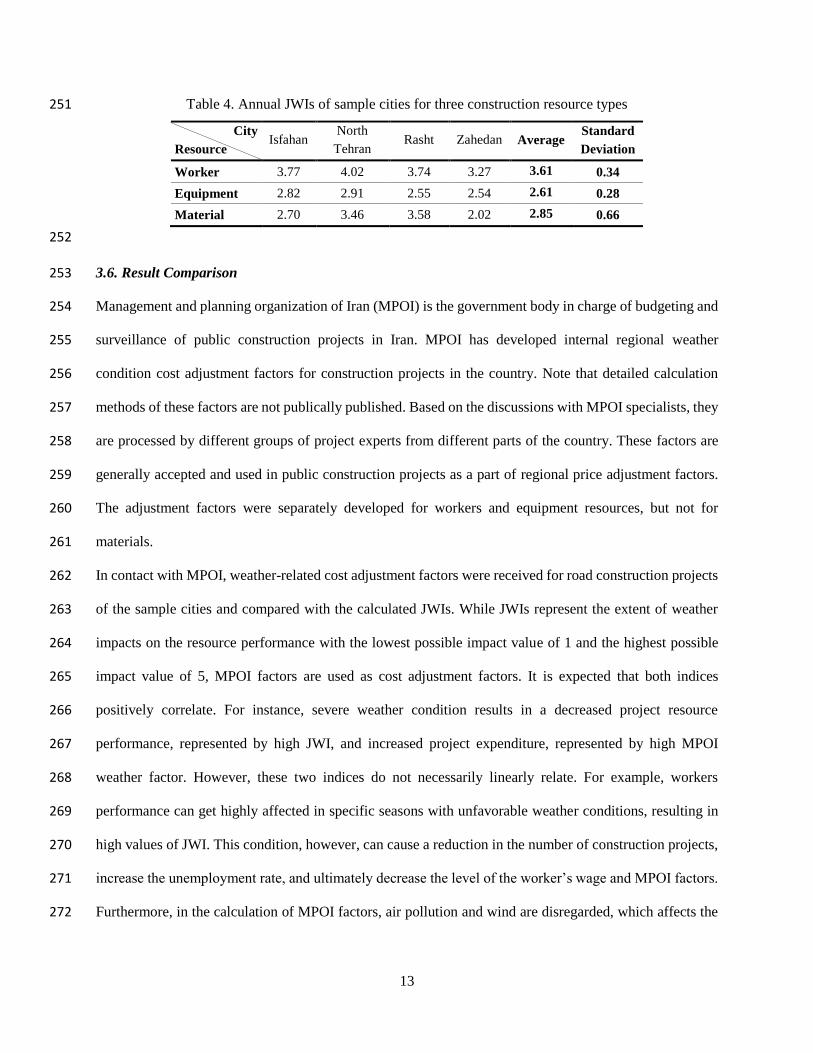
Table 4. Annual JWIs of sample cities for three construction resource types 251
City
Resource Isfahan
North
Tehran Rasht Zahedan Average
Standard
Deviation
Worker 3.77 4.02 3.74 3.27 3.61 0.34
Equipment 2.82 2.91 2.55 2.54 2.61 0.28
Material 2.70 3.46 3.58 2.02 2.85 0.66
252
3.6. Result Comparison 253
Management and planning organization of Iran (MPOI) is the government body in charge of budgeting and 254
surveillance of public construction projects in Iran. MPOI has developed internal regional weather 255
condition cost adjustment factors for construction projects in the country. Note that detailed calculation 256
methods of these factors are not publically published. Based on the discussions with MPOI specialists, they 257
are processed by different groups of project experts from different parts of the country. These factors are 258
generally accepted and used in public construction projects as a part of regional price adjustment factors. 259
The adjustment factors were separately developed for workers and equipment resources, but not for 260
materials. 261
In contact with MPOI, weather-related cost adjustment factors were received for road construction projects 262
of the sample cities and compared with the calculated JWIs. While JWIs represent the extent of weather 263
impacts on the resource performance with the lowest possible impact value of 1 and the highest possible 264
impact value of 5, MPOI factors are used as cost adjustment factors. It is expected that both indices 265
positively correlate. For instance, severe weather condition results in a decreased project resource 266
performance, represented by high JWI, and increased project expenditure, represented by high MPOI 267
weather factor. However, these two indices do not necessarily linearly relate. For example, workers 268
performance can get highly affected in specific seasons with unfavorable weather conditions, resulting in 269
high values of JWI. This condition, however, can cause a reduction in the number of construction projects, 270
increase the unemployment rate, and ultimately decrease the level of the worker’s wage and MPOI factors. 271
Furthermore, in the calculation of MPOI factors, air pollution and wind are disregarded, which affects the 272
14
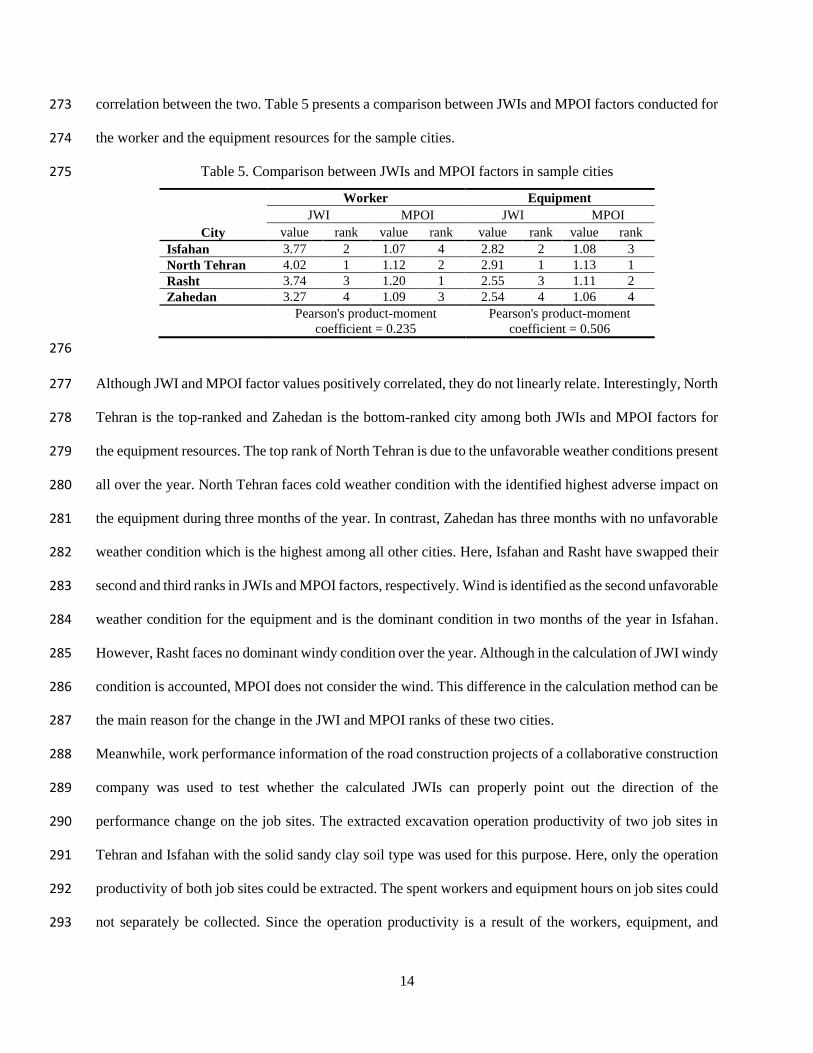
correlation between the two. Table 5 presents a comparison between JWIs and MPOI factors conducted for 273
the worker and the equipment resources for the sample cities. 274
Table 5. Comparison between JWIs and MPOI factors in sample cities 275
City
Worker Equipment
JWI MPOI JWI MPOI
value rank value rank value rank value rank
Isfahan 3.77 2 1.07 4 2.82 2 1.08 3
North Tehran 4.02 1 1.12 2 2.91 1 1.13 1
Rasht 3.74 3 1.20 1 2.55 3 1.11 2
Zahedan 3.27 4 1.09 3 2.54 4 1.06 4
Pearson's product-moment
coefficient = 0.235
Pearson's product-moment
coefficient = 0.506
276
Although JWI and MPOI factor values positively correlated, they do not linearly relate. Interestingly, North 277
Tehran is the top-ranked and Zahedan is the bottom-ranked city among both JWIs and MPOI factors for 278
the equipment resources. The top rank of North Tehran is due to the unfavorable weather conditions present 279
all over the year. North Tehran faces cold weather condition with the identified highest adverse impact on 280
the equipment during three months of the year. In contrast, Zahedan has three months with no unfavorable 281
weather condition which is the highest among all other cities. Here, Isfahan and Rasht have swapped their 282
second and third ranks in JWIs and MPOI factors, respectively. Wind is identified as the second unfavorable 283
weather condition for the equipment and is the dominant condition in two months of the year in Isfahan. 284
However, Rasht faces no dominant windy condition over the year. Although in the calculation of JWI windy 285
condition is accounted, MPOI does not consider the wind. This difference in the calculation method can be 286
the main reason for the change in the JWI and MPOI ranks of these two cities. 287
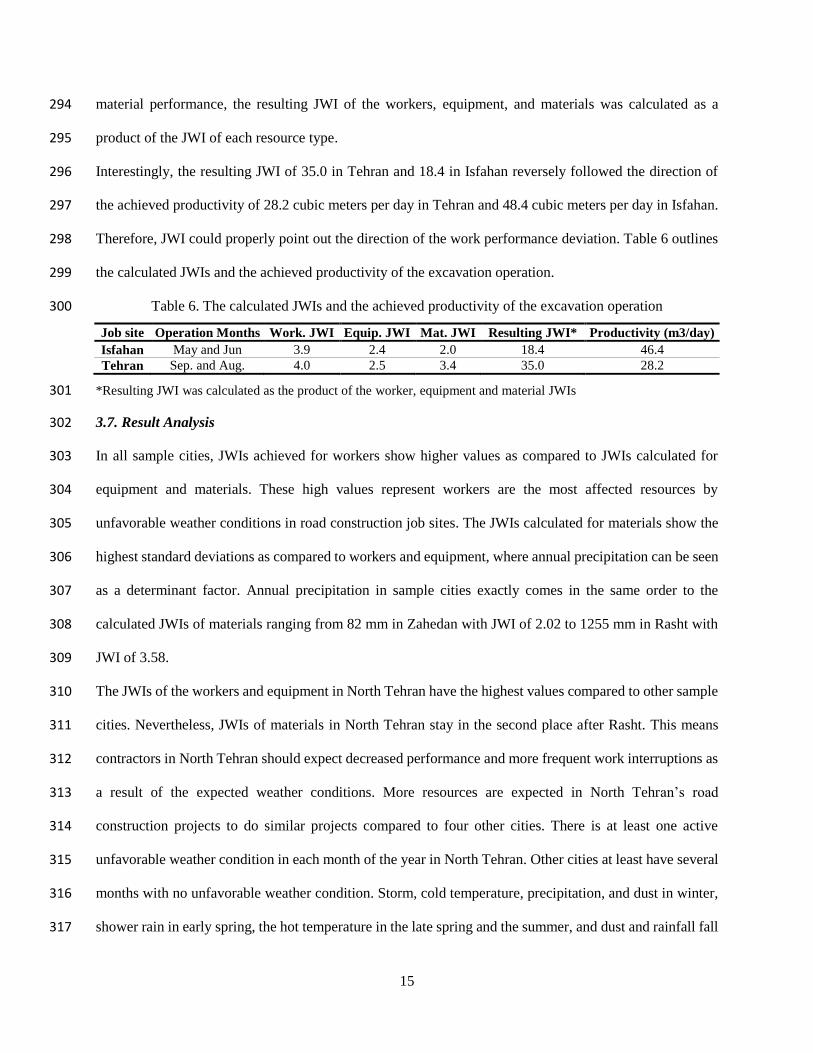
Meanwhile, work performance information of the road construction projects of a collaborative construction 288
company was used to test whether the calculated JWIs can properly point out the direction of the 289
performance change on the job sites. The extracted excavation operation productivity of two job sites in 290
Tehran and Isfahan with the solid sandy clay soil type was used for this purpose. Here, only the operation 291
productivity of both job sites could be extracted. The spent workers and equipment hours on job sites could 292
not separately be collected. Since the operation productivity is a result of the workers, equipment, and 293
15
material performance, the resulting JWI of the workers, equipment, and materials was calculated as a 294
product of the JWI of each resource type. 295
Interestingly, the resulting JWI of 35.0 in Tehran and 18.4 in Isfahan reversely followed the direction of 296
the achieved productivity of 28.2 cubic meters per day in Tehran and 48.4 cubic meters per day in Isfahan. 297
Therefore, JWI could properly point out the direction of the work performance deviation. Table 6 outlines 298
the calculated JWIs and the achieved productivity of the excavation operation. 299
Table 6. The calculated JWIs and the achieved productivity of the excavation operation 300
Job site Operation Months Work. JWI Equip. JWI Mat. JWI Resulting JWI* Productivity (m3/day)
Isfahan May and Jun 3.9 2.4 2.0 18.4 46.4
Tehran Sep. and Aug. 4.0 2.5 3.4 35.0 28.2
*Resulting JWI was calculated as the product of the worker, equipment and material JWIs 301
3.7. Result Analysis 302
In all sample cities, JWIs achieved for workers show higher values as compared to JWIs calculated for 303
equipment and materials. These high values represent workers are the most affected resources by 304
unfavorable weather conditions in road construction job sites. The JWIs calculated for materials show the 305
highest standard deviations as compared to workers and equipment, where annual precipitation can be seen 306
as a determinant factor. Annual precipitation in sample cities exactly comes in the same order to the 307
calculated JWIs of materials ranging from 82 mm in Zahedan with JWI of 2.02 to 1255 mm in Rasht with 308
JWI of 3.58. 309
The JWIs of the workers and equipment in North Tehran have the highest values compared to other sample 310
cities. Nevertheless, JWIs of materials in North Tehran stay in the second place after Rasht. This means 311
contractors in North Tehran should expect decreased performance and more frequent work interruptions as 312
a result of the expected weather conditions. More resources are expected in North Tehran’s road 313
construction projects to do similar projects compared to four other cities. There is at least one active 314
unfavorable weather condition in each month of the year in North Tehran. Other cities at least have several 315
months with no unfavorable weather condition. Storm, cold temperature, precipitation, and dust in winter, 316
shower rain in early spring, the hot temperature in the late spring and the summer, and dust and rainfall fall 317
16
are dominant weather conditions in Tehran over a year. This result, however, challenges general appraisal 318
on the expected smooth progress and low cost of construction projects implemented in the areas close to 319
the capital city of Tehran. This is assumed due to the relatively high density of the skilled workers, 320
construction equipment, and construction materials in Tehran. 321
For calculating the JWI of a specific road construction project within a particular city, the frequency of each 322
month over the course of the project implementation is considered in the averaging formula. It should be 323
considered that calculated JWIs indicate the direction of change in project resource performance, and 324
correspondingly, the number of resources required. High values achieved for JWI of one project job site 325
alerts project managers for a decreased resource performance and an increased number of resources. 326
4. Research Findings and Discussion 327
Construction companies in Iran face a wide range of weather conditions in different parts of the country. 328
Even for a specific job site, seasonal weather condition change can bring a variety of weather conditions to 329
the project job site. This changing weather condition, however, can affect the project performance in various 330
manners over the year. Facing a variety of unfavorable weather conditions and getting affected by their 331
resulting deprived resource performance is not limited to construction projects in Iran. It is a trend many 332
construction companies experience in different parts of the world. Evaluating the impacts of different types 333
of unfavorable weather conditions can help construction companies to prepare their mitigation plans in 334
advance and to minimize adverse effects of unfavorable weather conditions on their projects. Nevertheless, 335
the most research efforts done for evaluating impacts of weather conditions are based on past project records 336
and only consider one or a limited number of weather condition types. These efforts are quite helpful in 337
many cases, especially when the specified weather condition is a dominant condition in a region. However, 338
they are unable to help construction companies draw an overall picture of the expected impacts of the 339
weather conditions over their projects’ implementation periods. 340
This research is supposed that construction project experts can evaluate the adverse impacts of single 341
weather conditions on construction project performance since they have closely experienced them over the 342
years. Although project experts are aware of the impacts of single weather conditions, it is an impossible 343
17
task for them to synthesize the overall effects of a variety of weather condition types in minds. The proposed 344
method in this research depends on the experts’ judgments for synthesizing the overall impacts of various 345
weather condition on construction projects. Here, JWI plays a central role in presenting the overall picture 346
of weather condition impacts. Successful implementation of the proposed method for road construction 347
projects of four major cities in Iran and calculation of their JWIs affirms applicability of the method to real 348
construction projects. Results achieved in this implementation, reveal some interesting points previously 349
have not been noted. For example, worker performance is more affected by unfavorable weather conditions 350
compared to equipment and materials. Precipitation affects construction materials more severely compared 351
to other unfavorable weather conditions. Road construction projects near Tehran benefit from the 352
abundance of the skilled workers, construction equipment, and construction materials. Nevertheless, the 353
unfavorable weather condition in North Tehran negates some parts of benefits gained from this abundance 354
which should be accounted for developing project plans. 355
A main limitation of the JWI is that it does not directly estimate the expected productivity of the research. 356
Rather, it represents the direction of the changes in the resource productivity. The research outcome was 357
presented in the meetings with the experienced construction project practitioners from ten different road 358
construction companies to discuss the applicability of the JWI in real construction projects. It was 359
concluded that to apply the JWI in the construction projects, project practitioners need, first, to depend on 360
their judgment. They can, however, gradually tune their estimations by taking into account the actual results 361
achieved. The proposed method is suggested to be implemented within specified scopes of construction 362
projects with similar working culture and techniques. However, it should be noted that every project 363
implemented by a construction company is a separate entity with identical specifications and dissimilarities 364
involved. Even for a similar type of construction projects implemented in a region, different construction 365
companies can be affected differently by unfavorable weather conditions. Therefore, construction 366
companies may use calculated JWIs to develop their own specific estimates. Furthermore, calculation of 367
JWIs in the proposed method is based on expected weather conditions from long-term historical weather 368
records. Recent changes in the climate can affect this long-term trend in many locations (Colombo and Byer 369
18
2012; Hands and Hudson 2016). Therefore, over time adjustments might be required for the long-term 370
weather condition trends to account for this evolving weather conditions. 371
372 5. Summary and Conclusion 373
Many construction projects are affected by unfavorable weather conditions during their implementation 374
period. Capturing impacts of unfavorable weather conditions, though, can help construction project 375
managers plan for upcoming weather conditions and minimize their unfavorable impacts. In this research, 376
a novel method is proposed for capturing the overall impacts of various types of weather conditions on 377
construction projects. This method is based on project expert judgments in combination with long-term 378
weather records of project locations. It draws an overall perspective on the impacts of various types of 379
weather conditions on construction projects performance through a new performance indicator, called JWI. 380
To test the applicability of the proposed method, it is applied to road construction projects being 381
implemented in four major cities with different climate conditions in Iran. JWIs of these sample cities were 382
used to determine the direction of changes in the required resources. Calculated JWIs presented reasonable 383
accordance with weather condition cost adjustment factors estimated by MPOI, the government body in 384
charge of budgeting for public construction projects. 385
The proposed method in this research is the first structured method introduced for capturing impacts of 386
weather conditions on open environment construction projects. Implementation of the proposed method in 387
road construction projects of Iran revealed new results had not been previously identified. The results 388
suggest that temperature above 50° C and below -10° C are the most influential weather conditions on road 389
construction projects in Iran. In general, workers are more affected by unfavorable weather conditions in 390
road construction projects in the country. Furthermore, the rainy condition is identified as the most effective 391
factor in road construction materials. By expanding JWI calculations to various cities and different types 392
of construction projects, comprehensive lists of JWIs can be prepared for construction projects being 393
implemented in specified geographical scopes. Construction project managers and project planners can then 394
use them as guidelines for adjusting required resources in new locations taking into account the resource 395
19
performance of in past projects implemented in other job sites. The JWI introduced in this research 396
represents the expected direction of the productivity change. 397
Nevertheless, various possible company-specific factors, such as workers experience, construction 398
management techniques, construction methods, and employed construction equipment, can contribute to 399
the final productivity rate in job site with a specific weather condition. The impacts of these factors on the 400
resulting productivity rate, however, have not been investigated at this point of the research. To apply the 401
JWI in the real construction projects initially required changes in the resources project can be estimated 402
based on the practitioners’ judgment. Gradually, estimations become accurate by taking into account the 403
actual results achieved. Future research is recommended to investigate how particular specifications of 404
construction companies can be incorporated in calculating the expected resource productivity rate based on 405
the JWI. 406
REFERENCES 407
Ahuja, H.N. and Nandakumar, V. 1985. Simulationmodel to forecast completion time. ASCE Journal of 408
Construction Engineering and Management, 111, (4), pp. 325-342. 409
Al-Abbasi, M.D. 2014. Impact of Weather Condition on Construction Labor Productivity in State of Qatar. 410
M.Sc. Thesis, College of Engineering, Qatar University. 411
Al-Alawi, M., Bouferguene, A. and Mohamed Y. 2017. Non-parametric weather generator for modelling 412
construction operations: Comparison with the parametric approach and evaluation of construction-413
based impacts. Automation in Construction, Volume 75, March 2017, pp. 108-126. 414
Alshebania, M.N. and Wedawattab G. 2014. Making the Construction Industry Resilient to Extreme 415
Weather Lessons from Construction in Hot Weather Conditions. 4th International Conference on 416
Building Resilience, Building Resilience, September 2014, Salford Quays, United Kingdom, pp. 417
635-642. 418
Apipattanavis, S., Sabol, K., Molenaar, K.R., Rajagopalan, B., Xi, Y., Blackard, B. and Patil, S. 2010. 419
Integrated Framework for Quantifying and Predicting Weather-Related Highway Construction 420
Delays. Journal of Construction Engineering and Management, Vol. 136, Issue 11, pp. 1160-1168. 421
20
Baruch, Y. (1999). Response rate in academic studies—A comparative analysis. Human relations, 52(4), 422
421-438. 423
Baruch, Y., & Holtom, B. C. (2008). Survey response rate levels and trends in organizational research. 424
Human relations, 61(8), 1139-1160. 425
Bohannon, R. W., & Smith, M. B. (1987). Interrater reliability of a modified Ashworth scale of muscle 426
spasticity. Physical therapy, 67(2), pp. 206-207. 427
Boldin, M. and Wright, J.H. 2015. Weather Adjusting Economic Data. Brookings Papers on Economic 428
Activity, Fall 2015, pp. 227-278. 429
Brown, J. D. (2011). Likert items and scales of measurement. Statistics, 15(1), 10-14. 430
Carifio, J., & Perla, R. J. (2007). Ten common misunderstandings, misconceptions, persistent myths and 431
urban legends about likert scales and likert response formats and their antidotes. Journal of Social 432
Sciences, 3(3), 106-116. 433
Cochran, W. G. (2007). Sampling techniques. John Wiley & Sons. 434
Colombo A.F. and Byer P.H. 2012. Adaptation, flexibility and project decision-making with climate change 435
uncertainties. Impact Assessment and Project Appraisal, Vol. 30, No. 4, pp. 229-241. 436
Crissinger, J.L. 2005. Design and Construction vs. Weather. Interface, Technical Journal of RCI, Inc., 437
February 2005, Accessible from: rci-online.org/wp-content/uploads/2005-02-crissinger.pdf. 438
El-Rayes, K. and Moselhi, O. 2001. Impact of Rainfall on the Productivity of Highway Construction. 439
Journal of Construction Engineering and Management, April 2001, Vol. 127, Issue 2, pp. 125-131. 440
Gandhi, S., Gupta, A. and Sethi, S. 2013. Extreme Weather Events and Climate Change Impact on 441
Construction Small Medium Enterprises (SME’s): Imbibing Indigenous Responses for 442
Sustainability of SME’s. Journal of Earth Science & Climatic Change, Volume 5, Issue 1. 443
Gliem, J. A., & Gliem, R. R. (2003). Calculating, interpreting, and reporting Cronbach’s alpha reliability 444
coefficient for Likert-type scales. Midwest Research-to-Practice Conference in Adult, Continuing, 445
and Community Education. 446
Grayson, K. (2001). Interrater reliability. Journal of Consumer Psychology, 10(1&2), pp. 71-73. 447
21
Hands S. and Hudson M.D. 2016. Incorporating climate change mitigation and adaptation into 448
environmental impact assessment: a review of current practice within transport projects in England. 449
Impact Assessment and Project Appraisal, Volume 34, Issue 4, pp. 330-345. 450
HSE (Health and Safety Executive). 2013. Construction Dust. ©Crown, Health and Safety Executive, 451
Construction Information Sheet No 36, Rev2, Accessible from: 452
http://www.hse.gov.uk/pUbns/cis36.pdf 453
Jang, M., Yoon, Y., Suh, S. and Ko, S. 2008. Method of Using Weather Information for Support to Manage 454
Building Construction projects. ASCE Architectural Engineering National Conference 2008: 455
Building Integration Solutions, Denver, Colorado, September 24-27, 2008. 456
Jette, D. U., Stilphen, M., Ranganathan, V. K., Passek, S., Frost, F. S., & Jette, A. M. (2015). Interrater 457
reliability of AM-PAC “6-Clicks” basic mobility and daily activity short forms. Physical therapy, 458
95(5), pp. 758-766. 459
Kerkhovea, L.P. and Vanhoucke M. 2017. Optimised scheduling for weather sensitive offshore construction 460
projects. Omega, Volume 66, Part A, January 2017, pp. 58-78. 461
Losby, J., & Wetmore, A. (2012). CDC coffee break: Using Likert Scales in evaluation survey work. 462
Centers for Disease Control and Prevention. 463
Maunder, W.J., Johnson, S.R. and McQuigg, J.D. 1971. Study of the Effect of Weather on Road 464
Construction. Journal of Monthly Weather Review, December 1971, Vol. 99, No. 12 Columbia, 465
pp. 939-945. 466
Moselhi, O. Daji, G. and El-Rayes, K. 1997. Estimating weather impact on the duration of construction 467
activities. Canadian Journal of Civil Engineering, 24, (3), pp. 359-366. 468
MPOI (Management and Planning Organization of Iran). 2017. Iran’s Consulting and Contracting 469
Companies Information System. Retrieved January, 2017 from: http://sajar.mporg.ir 470
MRUD (Ministry of Roads & Urban Development). 2017. Investment Opportunities in Transportation & 471
Urban Development. Deputy of Transportation Planning & Economics, Ministry of Roads & Urban 472
Development, Retrieved February, 2017 from: http://investment.mrud.ir/en/area/expressways. 473
22
PCA (Portland Cement Association). 2008. Cold Weather Masonry Construction. Portland Cement 474
Association, IS248.04. Accessible from: http://www.cement.org/docs/default-source/fc_mat-475
app_pdfs/masonry/is248-cold-weather-masonry-construction.pdf 476
Santos, J. R. A. (1999). Cronbach’s alpha: A tool for assessing the reliability of scales. Journal of extension, 477
37(2), pp. 1-5. 478
Shahin, A., AbouRizk, S.M. and Mohamed, Y. 2011. Modeling Weather-Sensitive Construction Activity 479
Using Simulation. Journal of Construction Engineering and Management, March 2011, Vol. 137, 480
Issue 3, pp. 238-236. 481
Shea, M.S. and Smith, A.B. 2015. Cold Weather Construction Applications: A Case Study on Cold Weather 482
Construction Practices on the I-15 CORE Project. 16th International Conference on Cold Regions 483
Engineering, July 19-22, 2015, Salt Lake City, Utah, pp. 500-511. 484
Tavakol, M., & Dennick, R. (2011). Making sense of Cronbach's alpha. International journal of medical 485
education, 2, 53. 486
Wales, R. and AbouRizk, S. 1996. An integrated simulation model for construction. Journal of Simulation 487
Practice and Theory, 3, (6), pp. 401–420. 488
Wedawatta, G. and Ingirige, B. 2016. A conceptual framework for understanding resilience of construction 489
SMEs to extreme weather events. Built Environment Project and Asset Management, 6 (4), pp. 490
428-443. 491
Wolken-M¨ohlmann, G., Bendlin, D., Buschmann, J. and Wiggert, M. 2016. Project schedule assessment 492
with a focus on different input weather data sources. 13th Deep Sea Offshore Wind R&D 493
Conference, EERA DeepWind’2016, 20-22 January 2016, Trondheim, Norway. 494