Embed Size (px)
Citation preview

HAL Id: hal-00721549https://hal.inria.fr/hal-00721549
Submitted on 27 Jul 2012
HAL is a multi-disciplinary open accessarchive for the deposit and dissemination of sci-entific research documents, whether they are pub-lished or not. The documents may come fromteaching and research institutions in France orabroad, or from public or private research centers.
L’archive ouverte pluridisciplinaire HAL, estdestinée au dépôt et à la diffusion de documentsscientifiques de niveau recherche, publiés ou non,émanant des établissements d’enseignement et derecherche français ou étrangers, des laboratoirespublics ou privés.
Alzheimer’s patient activity assessment using differentsensors
Carlos Fernando Crispim-Junior, Véronique Joumier, Hsu Yu-Liang,Ming-Chyi Pai, Pau-Choo Chung, Arnaud Dechamps, Philippe Robert,
François Bremond
To cite this version:Carlos Fernando Crispim-Junior, Véronique Joumier, Hsu Yu-Liang, Ming-Chyi Pai, Pau-Choo Chung,et al.. Alzheimer’s patient activity assessment using different sensors. Gerontechnology, ISG In-ternational Society for Gerontechnology, 2012, 11 (2), pp.266-267. �10.4017/gt.2012.11.02.597.678�.�hal-00721549�

Alzheimer’s patient activity assessment using different sensors
Carlos Fernando Crispim-Junior
1, Veronique Joumier
2,4, Yu-Liang Hsu
3, Ming-Chyi Pai
5, Pau-Choo Chung
3, Arnaud
Dechamps2,4
, Philippe Robert2,4
, François Bremond1,4*
1 INRIA - Sophia Antipolis, France
2 CMRR Plateforme patient CHU, Nice, France
3 National Cheng Kung University, Taiwan
4 EA CoBTek Université de Nice Sophia-Antipolis, France
5 National Cheng Kung University Hospital, Taiwan
* Corresponding author ([email protected])
Purpose: Older people population is expected to grow dramatically over the next 20 years (including Alzheimer’s
patients), while the number of people able to provide care will decrease. We present the development of medical
and information and communication technologies to support the diagnosis and evaluation of dementia progress in
early stage Alzheimer disease (AD) patients. Method: We compare video and accelerometers activity assessment
for the estimation of older people performance in instrumental activities of daily living (IADL) and physical tests in
the clinical protocol developed by the Memory Center of the Nice Hospital and the Department of Neurology at
National Cheng Kung University Hospital – Taiwan. This clinical protocol defines a set of IADLs (e.g., preparing
coffee, watching TV) that could provide objective information about dementia symptoms and be realistically
achieved in the two sites observation room. Previous works studied accelerometers activity assessment for the
detection of changes in older people gait patterns caused by dementia progress, or video-based event detection
for personal self-care activities (ADLs)[1, 2, 3], but none has used both sensors for IADLs analysis. The proposed
system uses a constraint-based ontology to model and detect events based on different sensors readings (e.g., 2D
video stream data is converted to 3D geometric information that is combined with a priori semantic information, like
defined spatial zones or posture estimations given by accelerometer). The ontology language is declarative and
intuitive (as it uses natural terminology), allowing medical experts to define and modify the IADL models. The pro-
posed system was tested with 44 participants (healthy=21, AD=23). A stride detection algorithm was developed by
the Taiwanese team for the automatic acquisition of patients gait parameters (e.g., stride length, stride frequency)
using a tri-axial accelerometer embedded in a wearable device. It was tested with 33 participants (healthy=17,
Alzheimer = 16) during a 40 meters walking test. Results & Discussion: The proposed system detected the full
set of activities of the first part of our clinical protocol (e.g., repeated transfer test, walking test) with a true positive
rate of 96.9 % to 100%. Extracted gait parameters and automatically detected IADLs will be future analyzed for the
evaluation of differences between Alzheimer patients at mild to moderate stages and healthy control participants,
and for the monitoring of patients motor and cognitive abilities.
Keywords: Information Technology, Health & self-esteem, multi-modal sensors monitoring systems, Alzheimer’s disease, dementia, elderly, older people
INTRODUCTION
The older people population is expected to grow
dramatically over the next 20 years, and the number
of people requiring care will grow accordingly (in-
cluding Alzheimer’s patients), while the number of
people able to provide care will decrease1.
Information and Communications Technologies (ICT)
have been proposed to improve and support older
people care (e.g., wearable sensors, smart-homes,
video monitoring systems). For instance, wearable
sensors measurements have been proposed for
medical diagnosis trials on the evaluation of older
people motor functions2-3
. The patients wore a chest
or wrist sensor during a gait analysis test to extract
kinematic parameters for gait patterns analysis (e.g.,
stride length, stride cadence). The extracted kine-
matic parameters were used as evidence to evaluate
existing differences between gait patterns of health
participants and patient diagnosed with dementia
(Alzheimer’s disease patients at mild to moderate
stage). Similar ICT applications were applied and
studied for the analysis of Parkinson’s disease im-
pairments, e.g., force-plates placed below patient
gait test path 7 and accelerometer-based wearable
devices 6. This approach could be also explored for
the study of patient activity patterns in activities of
daily living (e.g., dressing, eating). Although weara-
ble sensors are suitable for description of personal
kinematics parameters, they do not provide data
about a subject’s actions over his/her environment
(contextual data). For example, a person’ interaction
with household appliances (coffee making machine,
TV, etc), or his/her time spent in certain home areas
(e.g., kitchen, bedroom, living room).

Video-based system for older people surveillance is
growing as a research field (particularly frailty detec-
tion) 9-13
, as it can provide data about a people inter-
action with their environment (e.g., time spent in
zones and interaction with objects of interest). Appli-
cations are generally associated with detection of
daily living activities (e.g., eating, dressing, walking),
or the detection of (potentially) dangerous situations
(e.g., older people falls). But, for particular domotic
environment, illumination conditions, or camera field
of view, these systems could have problems in char-
acterizing a person’s postures (e.g., bending to an
object), or at quantifying an impairment in a limb
movement (e.g., a restricted range of motion). High-
er resolution video cameras or multiple cameras
arrays could be applied in this case, but they will
increase the ICT project cost and complexity.
To address the above limitations of current systems,
we present the first results of the SWEET-HOME
project, an initiative focused on the development of a
medical and ICT-based system for the improvement
of diagnosis and evaluation of dementia progress in
early stage Alzheimer’s Disease (AD) patients.
We attempt to overcome the described limitations of
the sole use of video or wearable sensors by deploy-
ing several sensors types (video and accelerometer)
for our clinical tests analysis. These sensors were
tested inside a clinical protocol developed and exe-
cuted by the Memory Center of the Nice Hospital –
France and the Department of Neurology at National
Cheng Kung University Hospital – Taiwan.
The clinical protocol is intended to assess older peo-
ple performance in IADLs (Instrumental Activities of
Daily Living, e.g., preparing coffee, watching TV) and
in gait analysis tests (e.g., performing a balance
test). IADLs are preferred to ADLs, as IADLs have
been recently addressed as better indicators of
emerging neuropsychiatric symptoms 5. ADLs gen-
erally refer to basic activities of personal self-care
(e.g., eating, dressing, washing), while IADLs are
associated with more complex tasks, e.g., using the
telephone, shopping groceries, organizing medica-
tions, and managing personal finances. IADLs seem
to be affected earlier than ADLs for early stage Alz-
heimer patients. We postulate that comparing data
from several sensors could provide new (or at least
complementary) quantitative evidence about chang-
es in a patient’s activities profile5. The clinical proto-
col’ activities were specifically chosen according to
their possibility of being realistically achieved into the
observation room of the hospital and at the same
time provide objective information about dementia
symptoms.
Figure1. Video monitoring system results being ana-
lyzed by the evaluation platform (VISEVAL) devel-
oped by the STARS team (France).
MATERIALS AND METHODS
This multi-centric study was carried out in French
and Taiwanese experimental sites. Experiments in
France took place in an observation room equipped
with household appliances. Experimental data was
recorded using a 2D video camera (AXIS®, Model
P1346, 8 fps - frames per second), and an ambient
audio microphone (Tonsion, Model TM6, Software
Audacity, WAV file format, 16bit PCM/16kHz). A mo-
tion sensor (e.g., MotionPod®) was fixed on the
chest of the participant to quantify their movements.
MotionPod® sensor provides an index of activity and
estimation about the patient posture (standing, sit-
ting, lying, walking), both of them with a resolution of
1 data per second.
The Taiwanese experiments took place in indoor and
outdoor environments. For the indoor experiments a
room equipped with household appliances was used
and experimental data was recorded using eight
ambient 2D video cameras (AXIS, Model 215PTZ,
30 fps). For outdoor experiments a tri-axial accel-
erometer mounted on the shoes of the participants
was used to analyze their gait parameters
Clinical protocol
The Clinical Protocol is divided into four scenarios:
directed activities (indoor), semi-directed activities
(indoor), undirected activities (indoor), and directed
activities (outdoor).
Scenario 01 (S1) or Directed activities in an indoor
environment is intended to assess kinematic param-
eters about the participant’s gait profile (e.g., static
and dynamic balance test, walking test). During this
scenario an assessor stays with the participant in-
side the room and asks him/her to perform seven
physical activities within 10 minutes. These activities
are briefly described as follows:

Balance testing (S1_A1-A4): the participant
should keep balance while performing the
following actions:
o Side by side stand (S1_A1): both
feet together,
o Semi tandem stand (S1_A2): stand
with the side of the heel of one foot
touching the big toe of the other
foot,
o Tandem stand (S1_A3): stand with
the heel of one foot touching the
toes of the other foot,
o Participant stands on one foot
(S1_A4): Right foot first then left
foot, eyes open, for ten seconds or
less if he/she has difficulty.
Walking speed test (S1_A5): the assessor
asks the participant to walk through the
room, following a straight path from one side
of the room to another (chair side to video
camera side, outward attempt, 4 meters),
and then to return (return attempt, 4 me-
ters);
Repeated chair stands testing (S1_A6): The
assessor asks the participant to make the
first posture transfer (from sitting to standing
posture) without using help of his/her arms.
The examiner will then ask the participant to
repeat the same action five times in a row.
Time Up & Go test (TUG – S1_A7): partici-
pants start from the sitting position, and at
the assessor’s signal he/she needs to stand
up, to walk a 3 meters path, to make a U-
turn in the center of the room, return and sit
down again.
Scenario 02 (S2) or semi-directed activities (indoor)
aims at evaluating the degree of independence of
the older people by performing IADLs in a given
order. The participant stays alone in the room with a
list of activities to perform, and he/she has to leave
the room only when feeling that has completed the
required tasks (no maximum time). It includes 7
indoor IADLs to be performed in the following order:
Reading for 2 minutes (S2_A1);
Warming water (S2_A2);
Making a call for phone number 34775
(S2_A3);
Watering a plant (S2_A4);
Watching TV (S2_A5);
Classifying cards by color (S2_A6);
Taking ABCD Folder in the zone Office
(S2_A7a); Matching ABCD letters of the
ABCD Folder with ABCD letters placed over
the room (S2_A7b), Returning ABCD folder
to its place (S2_A7c), and;
Leaving the room (S2_A8).
Scenario 03 (S3) or undirected (“free”) activities (30
minutes) aim at assessing how the participant spon-
taneously initiates activities in the room (e.g., reading
magazines/newspapers, drinking, playing cards, and
watching TV) and also how he/she organize time
without receiving specific instructions. Figure 2
shows the French indoor observation room (Scenar-
ios 1-3).
Scenario 04 (S4) or Directed activities in an outdoor
environment aim at analyzing different gait parame-
ters using the tri-axial accelerometers and the stride
algorithm developed in the project. The participant is
asked to walk around the ring region in the NCKU
campus (following the plan shown in Figure3). Dur-
ing this walking period he/she performs a simple
walking test of 40 m on a straight line; and a dual
task test where he/she needs to walk the same dis-
tance while counting down from 100 to 1.
Figure2. French indoor experimental room, observa-
tion room
Figure3. Taiwanese outdoor experimental environ-
ment
Participants
French participants aged more than 65 years were
recruited by the Nice Memory Center (NMC) of the
Nice Hospital. Inclusion criteria of the AD group
were: diagnosis of AD according to NINCDS-ADRDA
criteria and a Mini-Mental State Exam (MMSE) score
above 15. AD participants with significant motor dis-
turbances as per the Unified Parkinson’s Disease
Rating Scale were excluded.
Taiwanese participants aged more than 50 years
were recruited by the Department of Neurology at
National Cheng Kung University Hospital. The Inclu-
sion criterion of the AD group was a MMSE score
value above 16.
Tables 1-4 describe the clinical and demographical
characteristics of the participants (healthy control –
HC, and AD) according to the different evaluated
scenarios.
Table 1.French participants on S1
HC (N=21) AD (N=23)
Female, N (%) 12 (50%) 16(68.75%)
Age, years(mean ± SD) 73.4±6.09 76.7±7.84
MMSE(mean ± SD) 28.4±0.98 21.35±3.97
Table 2.French participants on S2
HC (N=10) AD (N=16)
Female, N (%) 5 (50%) 11(68.8%)
Age, years (mean±SD) 73.9±6.24 76.7± 7.56
MMSE (mean ± SD) 28.1±1.85 20.7± 3.70
Table 3.Taiwanese participants on S1 and S2
HC (N=45) AD (N=36)
Female, N (%) 24 (53.3%) 21 (58.3%)
Age,years (mean ± SD) 64.51±8,33 70.25±9.25
MMSE (mean ± SD) 27.60±2.04 23.44±3.32
Table 4.Taiwanese participants on S4
HC(N=17) AD(N=16)
Female, N (%) 9 (52.9%) 9 (56.3%)
Age,years (mean ± SD) 62.35±2.04 66.69±5.69
MMSE (mean ± SD) 27.65±2.40 24.19±3.62
Systems overview
Table 5 describes the sensors used to compute dif-
ferent parameters about older people activities (e.g.,
duration of activity execution, gait parameters).
Table 5. Sensors used for older people activity anal-
ysis within each scenario
France Taiwan
S1
2D video camera
(Activities annotation)
Automatic Sensor Moni-
toring
2D video camera
(Activities annotation)
S2 2D video camera
Activities annotation
2D video camera
Activities annotation
S4 - Tri-axial
accelerometer
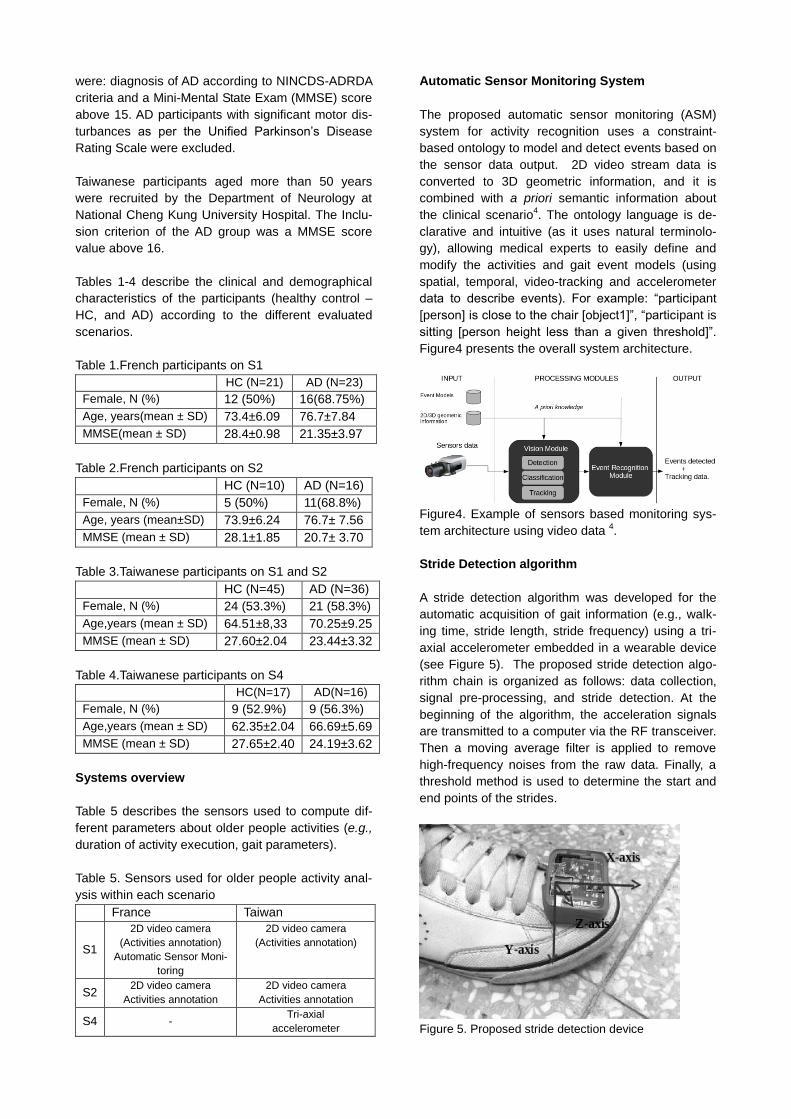
Automatic Sensor Monitoring System
The proposed automatic sensor monitoring (ASM)
system for activity recognition uses a constraint-
based ontology to model and detect events based on
the sensor data output. 2D video stream data is
converted to 3D geometric information, and it is
combined with a priori semantic information about
the clinical scenario4. The ontology language is de-
clarative and intuitive (as it uses natural terminolo-
gy), allowing medical experts to easily define and
modify the activities and gait event models (using
spatial, temporal, video-tracking and accelerometer
data to describe events). For example: “participant
[person] is close to the chair [object1]”, “participant is
sitting [person height less than a given threshold]”.
Figure4 presents the overall system architecture.
Figure4. Example of sensors based monitoring sys-
tem architecture using video data 4.
Stride Detection algorithm
A stride detection algorithm was developed for the
automatic acquisition of gait information (e.g., walk-
ing time, stride length, stride frequency) using a tri-
axial accelerometer embedded in a wearable device
(see Figure 5). The proposed stride detection algo-
rithm chain is organized as follows: data collection,
signal pre-processing, and stride detection. At the
beginning of the algorithm, the acceleration signals
are transmitted to a computer via the RF transceiver.
Then a moving average filter is applied to remove
high-frequency noises from the raw data. Finally, a
threshold method is used to determine the start and
end points of the strides.
Figure 5. Proposed stride detection device
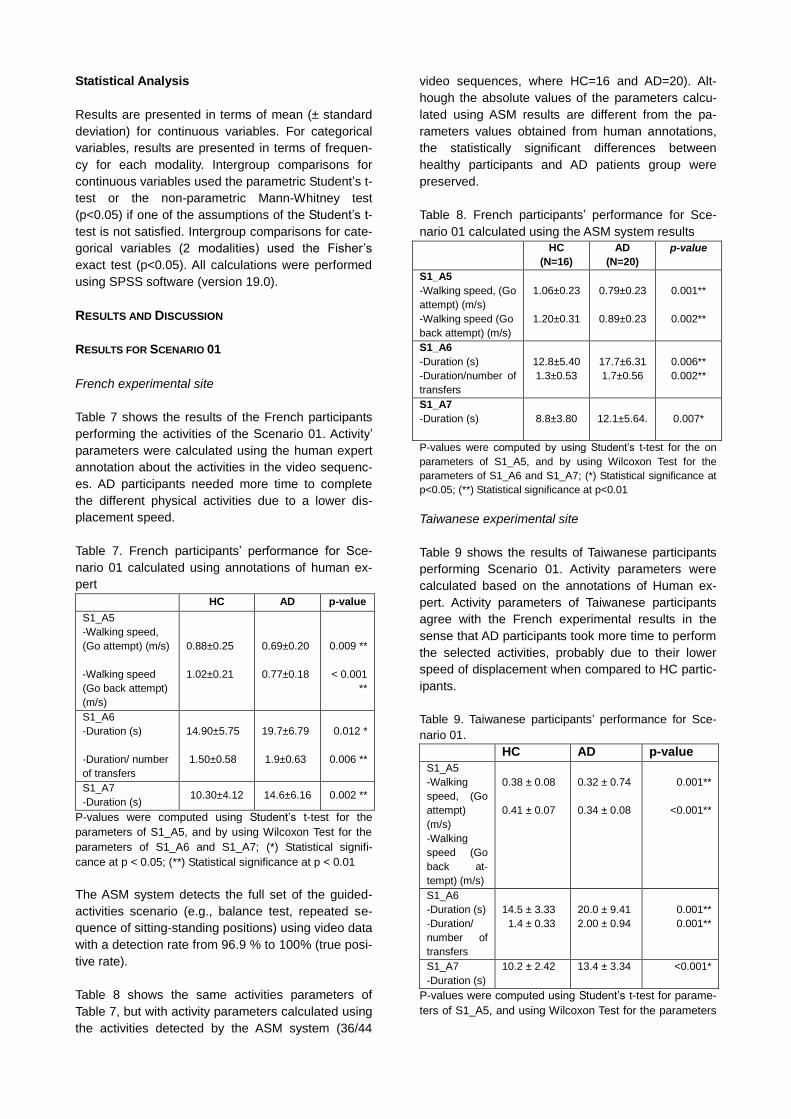
Statistical Analysis
Results are presented in terms of mean (± standard
deviation) for continuous variables. For categorical
variables, results are presented in terms of frequen-
cy for each modality. Intergroup comparisons for
continuous variables used the parametric Student’s t-
test or the non-parametric Mann-Whitney test
(p<0.05) if one of the assumptions of the Student’s t-
test is not satisfied. Intergroup comparisons for cate-
gorical variables (2 modalities) used the Fisher’s
exact test (p<0.05). All calculations were performed
using SPSS software (version 19.0).
RESULTS AND DISCUSSION
RESULTS FOR SCENARIO 01
French experimental site
Table 7 shows the results of the French participants
performing the activities of the Scenario 01. Activity’
parameters were calculated using the human expert
annotation about the activities in the video sequenc-
es. AD participants needed more time to complete
the different physical activities due to a lower dis-
placement speed.
Table 7. French participants’ performance for Sce-
nario 01 calculated using annotations of human ex-
pert
HC AD p-value
S1_A5
-Walking speed,
(Go attempt) (m/s)
-Walking speed
(Go back attempt)
(m/s)
0.88±0.25
1.02±0.21
0.69±0.20
0.77±0.18
0.009 **
< 0.001
**
S1_A6
-Duration (s)
-Duration/ number
of transfers
14.90±5.75
1.50±0.58
19.7±6.79
1.9±0.63
0.012 *
0.006 **
S1_A7
-Duration (s) 10.30±4.12 14.6±6.16 0.002 **
P-values were computed using Student’s t-test for the
parameters of S1_A5, and by using Wilcoxon Test for the
parameters of S1_A6 and S1_A7; (*) Statistical signifi-
cance at p < 0.05; (**) Statistical significance at p < 0.01
The ASM system detects the full set of the guided-
activities scenario (e.g., balance test, repeated se-
quence of sitting-standing positions) using video data
with a detection rate from 96.9 % to 100% (true posi-
tive rate).
Table 8 shows the same activities parameters of
Table 7, but with activity parameters calculated using
the activities detected by the ASM system (36/44
video sequences, where HC=16 and AD=20). Alt-
hough the absolute values of the parameters calcu-
lated using ASM results are different from the pa-
rameters values obtained from human annotations,
the statistically significant differences between
healthy participants and AD patients group were
preserved.
Table 8. French participants’ performance for Sce-
nario 01 calculated using the ASM system results
HC
(N=16)
AD
(N=20)
p-value
S1_A5
-Walking speed, (Go
attempt) (m/s)
-Walking speed (Go
back attempt) (m/s)
1.06±0.23
1.20±0.31
0.79±0.23
0.89±0.23
0.001**
0.002**
S1_A6
-Duration (s)
-Duration/number of
transfers
12.8±5.40
1.3±0.53
17.7±6.31
1.7±0.56
0.006**
0.002**
S1_A7
-Duration (s)
8.8±3.80
12.1±5.64.
0.007*
P-values were computed by using Student’s t-test for the on
parameters of S1_A5, and by using Wilcoxon Test for the
parameters of S1_A6 and S1_A7; (*) Statistical significance at
p<0.05; (**) Statistical significance at p<0.01
Taiwanese experimental site
Table 9 shows the results of Taiwanese participants
performing Scenario 01. Activity parameters were
calculated based on the annotations of Human ex-
pert. Activity parameters of Taiwanese participants
agree with the French experimental results in the
sense that AD participants took more time to perform
the selected activities, probably due to their lower
speed of displacement when compared to HC partic-
ipants.
Table 9. Taiwanese participants’ performance for Sce-
nario 01.
HC AD p-value
S1_A5
-Walking
speed, (Go
attempt)
(m/s)
-Walking
speed (Go
back at-
tempt) (m/s)
0.38 ± 0.08
0.41 ± 0.07
0.32 ± 0.74
0.34 ± 0.08
0.001**
<0.001**
S1_A6
-Duration (s)
-Duration/
number of
transfers
14.5 ± 3.33
1.4 ± 0.33
20.0 ± 9.41
2.00 ± 0.94
0.001**
0.001**
S1_A7
-Duration (s)
10.2 ± 2.42 13.4 ± 3.34 <0.001*
P-values were computed using Student’s t-test for parame-
ters of S1_A5, and using Wilcoxon Test for the parameters

of S1_A6 and S1_A7; (*) Statistical significance at p<0.05;
(**) Statistical significance at p<0.01.
Figure 6 and 7 show the time taken by the Taiwan-
ese cohort to perform the right and left leg activities
of balance test, respectively. Significant differences
were found in both tests in the comparison of AD and
HC groups (p<0.01 for right leg standing and left leg
standing).
Figure 6. Time taken by Participants to perform the
activity “right leg standing” of the balance test in the
Taiwanese clinical trial
Figure7. Time taken by the Participants to perform
the activity “left leg standing” of the balance test in
Taiwanese clinical trial
Comparison between France and Taiwan results
Figures 8 and 9 show the mean speed of participants
in the TUG test for AD and healthy participants at the
French and Taiwanese experimental sites, respec-
tively. In both sites, AD patients presented a signifi-
cantly lower speed compared with healthy controls in
the TUG test (p<0.01).
Figure8. Mean speed of French participants in the
TUG test
Figure 9. Mean speed of Taiwanese participants in
the TUG test
Results for Scenario 02
French experimental site
Tables 10 and 11 present participants performance in
Scenario 02 at the French experimental site. Table
10 shows global results according to activity parame-
ters: duration spent inside the room to perform the
Scenario 02 (seconds) and organizational errors in
activity ordering. Activity ordering errors are present-
ed as the number of participants who at least once
omitted, repeated, or changed the expected tem-
poral order of activities.
Table 10. Global performance of the French partici-
pants for Scenario 02
Activity
HC AD p-value
- Total time
spent in the
room (s)
454±160.4 715±352 0.060
Number of Participants presenting errors about:
- Activity omis-
sion (n, %)
0 (0%)
2 (12.5%) 0.508
- Activity repeti-
tion (n,%)
0 (0%) 6 (37.5%) 0.053

- Activity order
(n, %) 0 (0%) 4 (25%) 0.106
- At least one
error at activities
organization
(n, %)
0 (0%) 8 (50%¨) 0.008 (**)
P-values for continuous variables were computed using
Wilcoxon test; p-values for categorical variables (2 modali-
ties) were computed using Fisher’s exact test; (*) Statistical
significance at p<0.05; (**) Statistical significance at
p<0.01.
Table 11 shows the participants’ performance for
each activity in terms of speed (seconds), omission,
and repetition parameters. The speed term was used
instead of activity time duration to imply that lower
values of this attribute highlight the ability of a partic-
ipant at performing the activity faster. AD participants
spent more time performing activities that involve
sorting or classifying objects (A6 and A7), and they
had difficulty to manage the time of reading activity
(A1) compared to HC participants.
Table 11. French participants performance for each
activity of Scenario 02
Activity
HC AD p-value
S2_A1
- Speed (s)
- Omitted, N(%)
-Repeated, N(%)
138±79.6
0 (0%)
0 (0%)
88±215.2
0 (0%)
2 (12.5%)
0.001 (**)
X
0.508
S2_A2
- Speed (s)
- Omitted, N(%)
-Repeated, N(%)
4±3.8
0 (0%)
0 (0%)
8±13.4
0 (0%)
2 (12.5%)
0.660
X
0.508
S2_A3
- Speed (s)
- Omitted, N(%)
-Repeated, N(%)
25±12.3
0 (0%)
0 (0%)
28±20.3
0 (0%)
2 (12.5%)
0.979
X
0.508
S2_A4
- Speed (s)
- Omitted, N(%)
-Repeated, N(%)
9±4.4
0 (0%)
0 (0%)
11±7.2
0 (0%)
3 (18.75%)
0.856
X
0.262
S2_A5
- Speed (s)
- Omitted, N(%)
-Repeated, N(%)
32±24.3
0 (0%)
0 (0%)
57±57.9
0 (0%)
2 (12.5%)
0.165
X
0.508
S2_A6
- Speed (s)
- Omitted, N(%)
-Repeated, N(%)
78±30.9
0 (0%)
0 (0%)
143±176
1 (6.25%)
3 (18.75%)
0.216
1.00
0.262
S2_A7
- Speed (s)
- Omitted, N(%)
-Repeated, N(%)
49±21.3
0 (0%)
0 (0%)
80±48.5
1 (6.25%)
0 (0%)
0.129
1.00
x
P-values for continuous variables were computed using
Wilcoxon test; p-values for categorical variables (2 modali-
ties) were computed using Fisher’s exact test; (*) Statistical
significance at p<0.05; (**) Statistical significance at
p<0.01.
Tables 12 and 13 present examples of an AD patient
and a HC participant performance in Scenario 02
activities in the French experimental site. In this
example the AD participant forgot to perform 3 activi-
ties, and performed 2 activities in the wrong order.
Comparatively, HC participant performed the activi-
ties in the correct order, only omitting one.
Table 12. French AD participant’s performance for
Scenario 02
Activity Right
Order
Order
Error
Omission Duration
(mm:ss)
S2_A1 OK 2:20
S2_A2 OK 0:28
S2_A3 X
S2_A4 X
S2_A5 X 0:31
S2_A6 X 1:06
S2_A7 X
Table 13. French HC participant’s performance for
Scenario 02
Activity Right Order
Order Error
Omission Duration (mm:ss)
S2_A1 OK 01:45
S2_A2 OK 00:16
S2_A3 X
S2_A4 OK 00:05
S2_A5 OK 00:25
S2_A6 OK 00:55
S2_A7 OK 00:19
Taiwanese experimental site
Tables 14 and 15 show the mean and standard devi-
ation of the speed of participants’ activities and their
number of errors at performing the activities pro-
posed in the given order (number of activities
skipped or performed in an temporal order different
from the expected), respectively. Statistical differ-
ences were found in the comparison between AD
and HC groups (p<0.01, **; p<0.05, *). Activities
S2_A4 (water the plant) and S2_A7c (“ABCD” folder)
are significant differences between AD and HC for
both activity parameters analyzed (speed and fre-
quency).
Table 14. Mean and standard deviation of partici-
pants speed in activities of Scenario 02
Speed (seconds)
Act. A1 A2 * A3 **
AD 129.8±57.8 41.4±21.0 39.7±22.5
HC 121.1±49.2 23.8±12.1 21.7±6.9
Act. A4 ** A5 A6
AD 52.3±28.7 36.4±24.4 98.8±35.5
HC 25.3±10.4 23.0±11.7 69.5±21.0
Act. A7a * A7b * A7c **
AD 19.4±21.2 78.3±37.9 87.0±46.3
HC 9.4±7.4 50.4±21.0 50.8±19.7
Act. A8 *
AD 48.1±35.1
HC 23.2±10.9
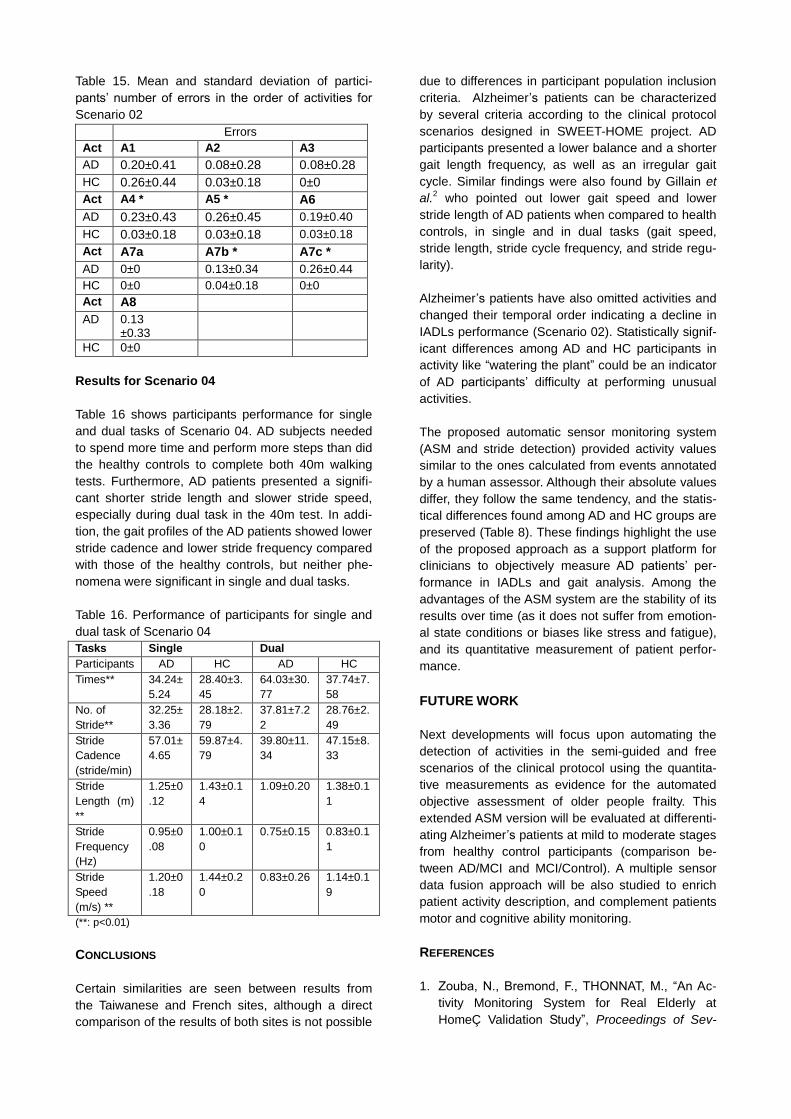
Table 15. Mean and standard deviation of partici-
pants’ number of errors in the order of activities for
Scenario 02
Errors
Act A1 A2 A3
AD 0.20±0.41 0.08±0.28 0.08±0.28
HC 0.26±0.44 0.03±0.18 0±0
Act A4 * A5 * A6
AD 0.23±0.43 0.26±0.45 0.19±0.40
HC 0.03±0.18 0.03±0.18 0.03±0.18
Act A7a A7b * A7c *
AD 0±0 0.13±0.34 0.26±0.44
HC 0±0 0.04±0.18 0±0
Act A8
AD 0.13 ±0.33
HC 0±0
Results for Scenario 04
Table 16 shows participants performance for single
and dual tasks of Scenario 04. AD subjects needed
to spend more time and perform more steps than did
the healthy controls to complete both 40m walking
tests. Furthermore, AD patients presented a signifi-
cant shorter stride length and slower stride speed,
especially during dual task in the 40m test. In addi-
tion, the gait profiles of the AD patients showed lower
stride cadence and lower stride frequency compared
with those of the healthy controls, but neither phe-
nomena were significant in single and dual tasks.
Table 16. Performance of participants for single and
dual task of Scenario 04
Tasks Single Dual
Participants AD HC AD HC
Times** 34.24±
5.24
28.40±3.
45
64.03±30.
77
37.74±7.
58
No. of
Stride**
32.25±
3.36
28.18±2.
79
37.81±7.2
2
28.76±2.
49
Stride
Cadence
(stride/min)
57.01±
4.65
59.87±4.
79
39.80±11.
34
47.15±8.
33
Stride
Length (m)
**
1.25±0
.12
1.43±0.1
4
1.09±0.20 1.38±0.1
1
Stride
Frequency
(Hz)
0.95±0
.08
1.00±0.1
0
0.75±0.15 0.83±0.1
1
Stride
Speed
(m/s) **
1.20±0
.18
1.44±0.2
0
0.83±0.26 1.14±0.1
9
(**: p<0.01)
CONCLUSIONS
Certain similarities are seen between results from
the Taiwanese and French sites, although a direct
comparison of the results of both sites is not possible
due to differences in participant population inclusion
criteria. Alzheimer’s patients can be characterized
by several criteria according to the clinical protocol
scenarios designed in SWEET-HOME project. AD
participants presented a lower balance and a shorter
gait length frequency, as well as an irregular gait
cycle. Similar findings were also found by Gillain et
al.2 who pointed out lower gait speed and lower
stride length of AD patients when compared to health
controls, in single and in dual tasks (gait speed,
stride length, stride cycle frequency, and stride regu-
larity).
Alzheimer’s patients have also omitted activities and
changed their temporal order indicating a decline in
IADLs performance (Scenario 02). Statistically signif-
icant differences among AD and HC participants in
activity like “watering the plant” could be an indicator
of AD participants’ difficulty at performing unusual
activities.
The proposed automatic sensor monitoring system
(ASM and stride detection) provided activity values
similar to the ones calculated from events annotated
by a human assessor. Although their absolute values
differ, they follow the same tendency, and the statis-
tical differences found among AD and HC groups are
preserved (Table 8). These findings highlight the use
of the proposed approach as a support platform for
clinicians to objectively measure AD patients’ per-
formance in IADLs and gait analysis. Among the
advantages of the ASM system are the stability of its
results over time (as it does not suffer from emotion-
al state conditions or biases like stress and fatigue),
and its quantitative measurement of patient perfor-
mance.
FUTURE WORK
Next developments will focus upon automating the
detection of activities in the semi-guided and free
scenarios of the clinical protocol using the quantita-
tive measurements as evidence for the automated
objective assessment of older people frailty. This
extended ASM version will be evaluated at differenti-
ating Alzheimer’s patients at mild to moderate stages
from healthy control participants (comparison be-
tween AD/MCI and MCI/Control). A multiple sensor
data fusion approach will be also studied to enrich
patient activity description, and complement patients
motor and cognitive ability monitoring.
REFERENCES
1. Zouba, N., Bremond, F., THONNAT, M., “An Ac-
tivity Monitoring System for Real Elderly at
HomeÇ Validation Study”, Proceedings of Sev-

enth IEEE International Conference on Advanced
Video and Signal Based Surveillance, 2010,
pp.278-285.
2. Gillain, S., Warzee, E., Lekeu, F., Wojtasik, V.,
Ma-quet, D., Croisier, J.-L., Salmon, E., Peter-
mans, J., “The value of instrumental gait analysis
in elderly healthy, MCI or Alzheimer’s disease
subjects and a comparison with other clinical
tests used in single and dual-task conditions”,
Annals of Physical and Rehabilitation Medicine,
Vol. 52, pp. 453–474, 2009.
3. Auvinet, B., Touzard, P., Chaleil, D., Touzard, C.,
Delafond, A., Foucher, C., Multon, F., “Dual task-
ing and gait in people with Mild Cognitive Impair-
ment according to amnesic and non-amnesic
subgroups, preliminary results”, Annals of Physi-
cal and Rehabilitation Medicine, Vol. 54, S1,
pp.e87–e94, 2011.
4. Romdhane, R., Mulin, E., Derreumeaux, A., Zou-
ba, N., Piano, J., Lee, L., Leroi, I., Mallea, P., Da-
vid, R., Thonnat, M., Bremond, F., Robert, Ph.,
“Automatic Video Monitoring System for Assess-
ment of Alzheimer Disease Symptoms”, The
Journal of Nutrition, Health, and Aging, Vol.
16,3,pp 213 - 218.
5. Monaci, L., Morris, R.G., “Neuropsychological
screening performance and the association with
activities of daily living and instrumental activities
of daily living in dementia: baseline and 19- to 24-
month follow-up”, International Journal of Geriat-
ric Psychiatry, Vol. 27:2, 2012, pp.197-204.
6. Cancela, J., Pastorino, M., Arredondo, M.T.,
Pansera, M., Pastor-Sanz, L. , Villagra, F., Pastor,
M.A., Gonzalez, A.P., “Gait assessment in Par-
kinson’s disease patients through a network of
wearable accelerometers in unsupervised envi-
ronments”, Proceedings of 33rd Annual Int. Conf.
of the IEEE EMBS, Massachusetts, 2011.
7. Manap, H.H., Tahir, N.M., Yassin, A.I. M., and Ab-
dullah, R., “Anomaly Gait Classification of Parkin-
son Disease based on ANN”, Annals of Physical
and Rehabilitation Medicine, Vol. 52, 2009,
pp.579–587.
8. Masayuki Nambu, Kazuki Nakajima, Makoto
Noshiro, And Toshiyo Tamura, “An algorithm for
the automatic detection of health conditions”,
Engineering in Medicine and Biology Magazine,
Vol. 24:4, pp. 38-42.
9. Foroughi, H.; Aski, B.S.; Pourreza, H., “Intelligent
video surveillance for monitoring fall detection of
elderly in home environments”, 11th International
Conference on Computer and Information Tech-
nology, pp. 219- 224, 2008.
10. Nasution, A.H.; Peng Zhang; Emmanuel, S.,
Video surveillance for elderly monitoring and
safety, Proceedings of TENCON 2009 - IEEE
Region 10 Conference, 2009, pp. 1 – 6.
11. Nasution, A.H.; Emmanuel, S.; Intelligent Video
Surveillance for Monitoring Elderly in Home En-
vironments, IEEE 9th Workshop Multimedia Sig-
nal Processing, 2007, pp. 203 – 206.
12. Ming-Liang Wang; Chi-Chang Huang; Huei-Yung
Lin, An Intelligent Surveillance System Based on
an Omnidirectional Vision Sensor, EEE Confer-
ence on Cybernetics and Intelligent Systems,
2006, pp.1–6.
13. Fleck, S.; Strasser, W.; “Smart Camera Based
Monitoring System and Its Application to Assisted
Living”, Proceedings of the IEEE, v.96: 10, 2008,
pp. 1698 – 1714.