Embed Size (px)
Citation preview

Amadeus Gas Pipeline
Access Arrangement
Information
Effective 1 July 2016 – 30 June 2021
January 2016

APT Pipelines (NT) Pty Limited
Amadeus Gas Pipeline Access Arrangement Information
iii
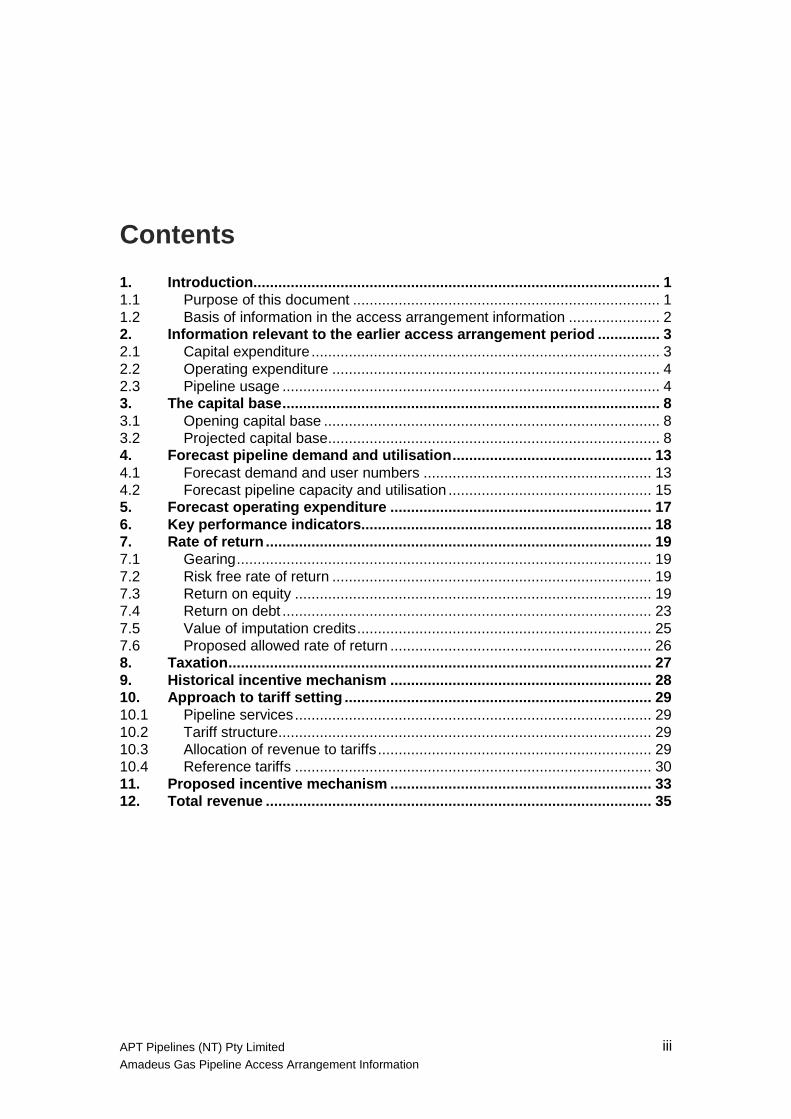
Contents
1. Introduction .................................................................................................. 1 1.1 Purpose of this document .......................................................................... 1 1.2 Basis of information in the access arrangement information ...................... 2 2. Information relevant to the earlier access arrangement period ............... 3 2.1 Capital expenditure .................................................................................... 3 2.2 Operating expenditure ............................................................................... 4 2.3 Pipeline usage ........................................................................................... 4 3. The capital base ........................................................................................... 8 3.1 Opening capital base ................................................................................. 8 3.2 Projected capital base ................................................................................ 8 4. Forecast pipeline demand and utilisation ................................................ 13 4.1 Forecast demand and user numbers ....................................................... 13 4.2 Forecast pipeline capacity and utilisation ................................................. 15 5. Forecast operating expenditure ............................................................... 17 6. Key performance indicators...................................................................... 18 7. Rate of return ............................................................................................. 19 7.1 Gearing .................................................................................................... 19 7.2 Risk free rate of return ............................................................................. 19 7.3 Return on equity ...................................................................................... 19 7.4 Return on debt ......................................................................................... 23 7.5 Value of imputation credits ....................................................................... 25 7.6 Proposed allowed rate of return ............................................................... 26 8. Taxation ...................................................................................................... 27 9. Historical incentive mechanism ............................................................... 28 10. Approach to tariff setting .......................................................................... 29 10.1 Pipeline services ...................................................................................... 29 10.2 Tariff structure .......................................................................................... 29 10.3 Allocation of revenue to tariffs .................................................................. 29 10.4 Reference tariffs ...................................................................................... 30 11. Proposed incentive mechanism ............................................................... 33 12. Total revenue ............................................................................................. 35

APT Pipelines (NT) Pty Limited
Amadeus Gas Pipeline Access Arrangement Information
1
1. Introduction
1.1 Purpose of this document
This Access Arrangement Information (AAI) document has been prepared, in
accordance with Rule 43(1) of the National Gas Rules 2008 (NGR), to provide Users
and Prospective Users with sufficient information to understand the derivation of the
Access Arrangement and its compliance with the NGR.
This Access Arrangement Information accompanies APT Pipelines (NT) Pty Limited’s
(APTNT’s) access arrangement for the Amadeus Gas Pipeline. The revised access
arrangement is expected to commence on 1 July 2016.
The Amadeus Gas Pipeline spans from the Palm Valley and Mereenie gas fields to
Darwin. A more detailed description of the Covered Pipeline, including a map, is
available on the APA Group website at www.apa.com.au, which shows key offtakes
and inputs for the Pipeline, and intersections with other transmission pipelines.
1.1.1. Layout of this access arrangement information
This document follows the structure of Rule 721 setting out the requirements for
content of the access arrangement information for a full access arrangement
proposal.
APTNT’s access arrangement proposal commences at the end of an earlier access
arrangement period, and therefore contains information relevant to the earlier access
arrangement period (in this case spanning from 1 August 2011 to 30 June 2016) as
required under the Rules. This information is included in Part 2 of the AAI. The
remaining parts of this AAI are as follows:
Part 3 establishes the capital base for the access arrangement period (in this
case proposed to span 1 July 2016 to 30 June 2021), including forecast capital
expenditure for the access arrangement period;
Part 4 discusses forecast pipeline demand, capacity and utilisation used to derive
the reference tariff;
Part 5 outlines forecast operating expenditure for the access arrangement period;
Part 6 sets out key performance indicators for the pipeline;
Part 7 sets out the rate of return used in the access arrangement;
Part 8 outlines the approach to taxation and how the tax asset base has been
calculated;
1 All references to Rules or a particular Rule in this document refer to the National Gas Rules 2008, or
part thereof, unless an alternative meaning is expressly stated.

APT Pipelines (NT) Pty Limited
Amadeus Gas Pipeline Access Arrangement Information
2
Parts 9 and 11 discuss historical and proposed incentive mechanisms;
Part 10 describes the reference service, approach to tariff setting and reference
tariff variation mechanism; and
Part 12 sets out the total revenue requirement for the pipeline for each year of the
access arrangement.
1.2 Basis of information in the access arrangement
information
Unless otherwise stated, all information in the access arrangement revision proposal
is provided in real 2015/16 dollars. Nominal values are brought to this basis using the
Consumer Price Index (CPI) all groups, eight capital cities average June over June
published by the Australian Bureau of Statistics (ABS) up to June 2015 (most recent
CPI data available) and then using an annual forecast CPI of 2.5 per cent thereafter.

APT Pipelines (NT) Pty Limited
Amadeus Gas Pipeline Access Arrangement Information
3
2. Information relevant to the earlier access arrangement period
2.1 Capital expenditure
Capital expenditure by asset class over the earlier access arrangement period2 is set
out in Table 2.1 below. These costs are based on actual costs in financial years
2011/12 to 2014/15, and forecast costs for financial year 2015/16.
Table 2.1 – Capital expenditure by asset class over the earlier access arrangement
period ($2015/16)
$’000 2011/12 2012/13 2013/14 2014/15 2015/16
E
Total
Pipeline 2,548 14,273 1,364 1,149 9,762 29,097
Compression 0 0 0 0 0 0
Meter Station 1,564 802 846 773 1,621 5,607
SCADA & Communications 0 0 184 180 2,883 3,248
Operation & Management facilities 405 1,894 1,888 2,102 558 6,846
Building 0 0 0 0 0 0
Return Tariff Payment 0 0 0 0 0 0
Total 4,517 16,969 4,282 4,205 14,824 44,798
2 As required by Rule 72(1)(a)(i)

APT Pipelines (NT) Pty Limited
Amadeus Gas Pipeline Access Arrangement Information
4
2.2 Operating expenditure
Operating expenditure by category over the earlier access arrangement period3 is set
out in Table 2.2 below. These costs are based on actual costs in financial years
2011/12 to 2014/15, and forecast costs for financial year 2015/16.
Table 2.2 – Operating expenditure by category over the earlier access arrangement
period ($2015/16)
$’000 2011/12 2012/13 2013/14 2014/15 2015/16
E
Total
Operations & Maintenance 9,791 11,648 9,935 9,976 12,281 53,630
Overheads 4,860 4,930 4,968 5,738 5,045 25,540
Sales & Marketing 69 69 69 69 69 345
Total 14,719 16,646 14,971 15,783 17,395 79,515
2.3 Pipeline usage
Pipeline minimum, maximum and average demand figures for each delivery point
over the earlier access arrangement period are set out in Table 2.3 below. These
values are based on actual demand in years 2011/12 to 2014/15, and forecast
demand for year 2015/16.
Table 2.3 - Minimum, Maximum and average demand, and total volume by delivery
point over the earlier access arrangement period
2011/12 2012/13 2013/14 2014/15 2015/16 E
Delivery point Unit
Alice Springs Min (TJ/d) 6.1 5.8 6.7 6.1 6.3
Max (TJ/d) 13.0 13.4 14.1 12.2 13.0
Average (TJ/d) 9.5 9.6 10.0 8.9 7.3
Total (TJ/a) 3,465.6 3,505.4 3,642.3 3,255.7 2,673.5
Tennant Creek Min (TJ/d) 0.6 0.5 0.6 0 0.5
Max (TJ/d) 1.7 1.7 1.6 1.7 1.7
Average (TJ/d) 1.2 1.2 1.2 1.1 1.0
Total (TJ/a) 443.2 436.1 431.4 413.5 382
3 As required by Rule 72(1)(a)(ii)
APT Pipelines (NT) Pty Limited
Amadeus Gas Pipeline Access Arrangement Information
5
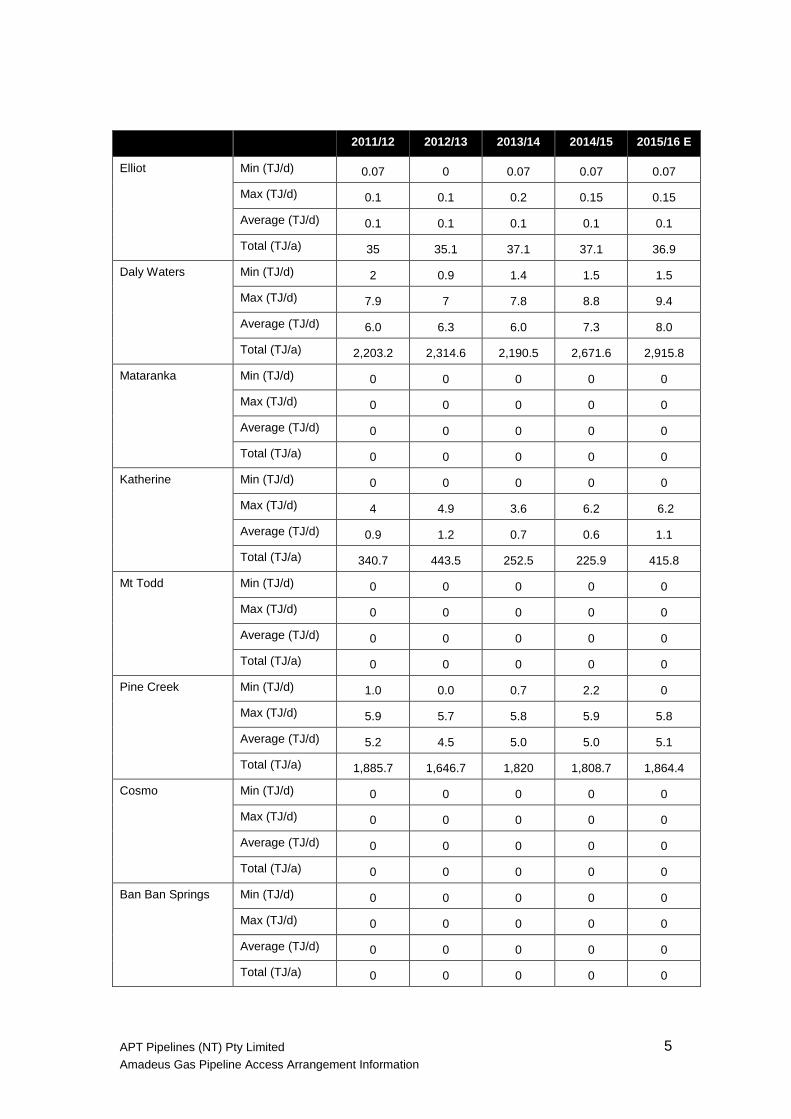
2011/12 2012/13 2013/14 2014/15 2015/16 E
Elliot Min (TJ/d) 0.07 0 0.07 0.07 0.07
Max (TJ/d) 0.1 0.1 0.2 0.15 0.15
Average (TJ/d) 0.1 0.1 0.1 0.1 0.1
Total (TJ/a) 35 35.1 37.1 37.1 36.9
Daly Waters Min (TJ/d) 2 0.9 1.4 1.5 1.5
Max (TJ/d) 7.9 7 7.8 8.8 9.4
Average (TJ/d) 6.0 6.3 6.0 7.3 8.0
Total (TJ/a) 2,203.2 2,314.6 2,190.5 2,671.6 2,915.8
Mataranka Min (TJ/d) 0 0 0 0 0
Max (TJ/d) 0 0 0 0 0
Average (TJ/d) 0 0 0 0 0
Total (TJ/a) 0 0 0 0 0
Katherine Min (TJ/d) 0 0 0 0 0
Max (TJ/d) 4 4.9 3.6 6.2 6.2
Average (TJ/d) 0.9 1.2 0.7 0.6 1.1
Total (TJ/a) 340.7 443.5 252.5 225.9 415.8
Mt Todd Min (TJ/d) 0 0 0 0 0
Max (TJ/d) 0 0 0 0 0
Average (TJ/d) 0 0 0 0 0
Total (TJ/a) 0 0 0 0 0
Pine Creek Min (TJ/d) 1.0 0.0 0.7 2.2 0
Max (TJ/d) 5.9 5.7 5.8 5.9 5.8
Average (TJ/d) 5.2 4.5 5.0 5.0 5.1
Total (TJ/a) 1,885.7 1,646.7 1,820 1,808.7 1,864.4
Cosmo Min (TJ/d) 0 0 0 0 0
Max (TJ/d) 0 0 0 0 0
Average (TJ/d) 0 0 0 0 0
Total (TJ/a) 0 0 0 0 0
Ban Ban Springs Min (TJ/d) 0 0 0 0 0
Max (TJ/d) 0 0 0 0 0
Average (TJ/d) 0 0 0 0 0
Total (TJ/a) 0 0 0 0 0

APT Pipelines (NT) Pty Limited
Amadeus Gas Pipeline Access Arrangement Information
6
2011/12 2012/13 2013/14 2014/15 2015/16 E
Townend Road4 Min (TJ/d) - - 0 0 0.2
Max (TJ/d) - - 0.045 0.7 1.30
Average (TJ/d) - - 0.0 0.3 0.6
Total (TJ/a) - - 0.1 124 202.8
Darwin City Gate Min (TJ/d) 0.002 0.0 0.02 0.02 0.01
Max (TJ/d) 0.1 0.2 0.3 0.2 0.2
Average (TJ/d) 0.0 0.1 0.1 0.1 0.1
Total (TJ/a) 10.4 25.6 25.8 27.3 24.4
Weddell Min (TJ/d) 0.0 0.0 0.0 2.4 0.0
Max (TJ/d) 17.3 16.6 20.8 25.7 26
Average (TJ/d) 9.9 10.1 10.3 13.4 14.4
Total (TJ/a) 3,595.9 3,701.7 3,773.1 4,892.1 5,249.2
Channel Island Min (TJ/d) 16.7 17.8 16.3 15.2 15.2
Max (TJ/d) 44.1 44.9 47.7 45.2 46
Average (TJ/d) 31.6 30.5 31.3 30.2 31.0
Total (TJ/a) 1,1520.1 11,120 11,439.8 11,031.1 11,323.2
Total volume Total (TJ/a) 23,499.8 23,228.7 23,612.6 24,487.0 25,088.0
4 New AGP delivery point from 2013/14

APT Pipelines (NT) Pty Limited
Amadeus Gas Pipeline Access Arrangement Information
7
Pipeline user numbers for each delivery point over the earlier access arrangement
period5 are set out in Table 2.4 below. These figures are based on actual customer
numbers in years 2011/12 to 2014/15, and forecast customer numbers for year
2015/16.
Table 2.4 - User numbers by delivery point over the earlier access arrangement period
Delivery points 2011/12 2012/13 2013/14 2014/15 2015/16 E
Alice Springs 1 1 1 1 1
Tennant Creek 1 1 1 1 1
Elliott 1 1 1 1 1
Daly Waters 2 2 2 2 2
Mataranka 0 0 0 0 0
Katherine 1 1 1 1 1
Mt Todd 0 0 0 0 0
Pine Creek 1 1 1 1 1
Cosmo 0 0 0 0 0
Ban Ban Springs 0 0 0 0 0
Townend Road - - 1 1 1
Darwin City Gate 2 1 1 1 1
Weddell 1 1 1 1 1
Channel Island 1 1 1 1 1
5 As required by Rule 72(1)(a)(iii)(B)
APT Pipelines (NT) Pty Limited
Amadeus Gas Pipeline Access Arrangement Information
8
3. The capital base
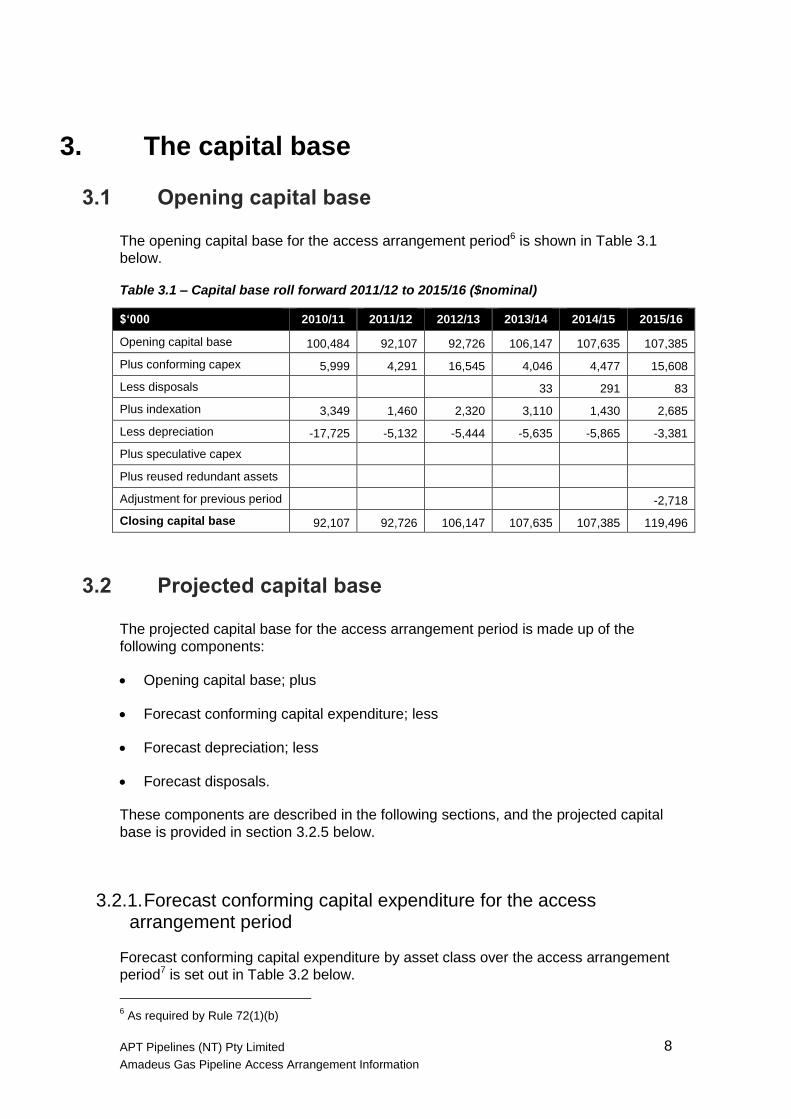
3.1 Opening capital base
The opening capital base for the access arrangement period6 is shown in Table 3.1
below.
Table 3.1 – Capital base roll forward 2011/12 to 2015/16 ($nominal)
$‘000 2010/11 2011/12 2012/13 2013/14 2014/15 2015/16
Opening capital base 100,484 92,107 92,726 106,147 107,635 107,385
Plus conforming capex 5,999 4,291 16,545 4,046 4,477 15,608
Less disposals 33 291 83
Plus indexation 3,349 1,460 2,320 3,110 1,430 2,685
Less depreciation -17,725 -5,132 -5,444 -5,635 -5,865 -3,381
Plus speculative capex
Plus reused redundant assets
Adjustment for previous period -2,718
Closing capital base 92,107 92,726 106,147 107,635 107,385 119,496
3.2 Projected capital base
The projected capital base for the access arrangement period is made up of the
following components:
Opening capital base; plus
Forecast conforming capital expenditure; less
Forecast depreciation; less
Forecast disposals.
These components are described in the following sections, and the projected capital
base is provided in section 3.2.5 below.
3.2.1. Forecast conforming capital expenditure for the access arrangement period
Forecast conforming capital expenditure by asset class over the access arrangement
period7 is set out in Table 3.2 below.
6 As required by Rule 72(1)(b)

APT Pipelines (NT) Pty Limited
Amadeus Gas Pipeline Access Arrangement Information
9
Table 3.2 – Forecast capital expenditure by asset class over the access arrangement
period ($2015/16)
$’000 2016/17 2017/18 2018/19 2019 20 2020/21 Total
Pipeline 14,338 258 262 264 267 15,389
Compression 0 0 0 0 0 0
Meter Stations 1,142 1,018 711 668 570 4,108
SCADA & Communications 683 718 634 616 706 3,356
Operation & Management facilities 847 484 639 719 874 3,563
Building 3,099 - - - - 3,099
Land and easements 53 53 0 53 0 159
Total 20,162 2,531 2,245 2,321 2,416 29,675
APTNT’s capital expenditure forecast is has been derived based on purpose in
categories as follows:
Expansion capital expenditure, which is required to expand the capacity of the
pipeline to meet demand both within the access arrangement period and beyond;
Replacement capital expenditure, which is required to maintain the integrity of the
pipeline and includes items such as replacement of instrumentation (for example
metering, telemetry, remote terminal units), pipeline hardware (for example pipes,
meter valves, regulators and fittings), site capital improvements (for example
fencing and security), and specialised major spares; and
Non-system capital expenditure, which relates to capital required for replacement
of items such as office furniture and computer equipment.
Forecast conforming capital expenditure by category over the access arrangement
period in shown in Table 3.3 below.
Table 3.3 – Forecast capital expenditure by category over the access arrangement
period ($2015/16)
$‘000 2016/17 2017/18 2018/19 2019/20 2020/21
Expansion - - - - -
Replacement 15,789 1,591 1,241 1,261 1,119
Non-system 4,370 939 1,003 1,059 1,296
Gross Total Capital Expenditure 20,159 2,530 2,244 2,320 2,415
Contributions - - - - -
Asset disposals 176 66 110 132 176
Net Total Capital Expenditure 19,983 2,464 2,134 2,188 2,239
7 As required by Rule 72(1)(c)(i)

APT Pipelines (NT) Pty Limited
Amadeus Gas Pipeline Access Arrangement Information
10
3.2.2. Forecast depreciation
Forecast depreciation by asset class over the access arrangement period8 is shown
in Table 3.4 below.
Table 3.4 – Forecast straight line depreciation over the access arrangement period
($nominal)
$‘000 2016/17 2017/18 2018/19 2019 20 2020/21
Straight-line depreciation 3,614 4,129 4,357 4,594 4,845
Indexation 2,987 3,499 3,550 3,589 3,626
Regulatory depreciation 627 630 808 1,006 1,219
Remaining asset lives reflect the composite remaining economic life of assets in the
class, reflecting that new assets will be included in the class at the full economic life,
and are shown in Table 3.5 below.
Table 3.5 – Remaining Economic Lives
Asset Class Economic life (years) Average Remaining
Economic Life (years)
Transmission Pipeline 80 59.26
Compressor Stations:
Rotating Equipment
Station Facilities
30 15
Regulation and Metering Stations
Odorising Stations 50 36.89
SCADA 15 10.72
O&M Facilities 10 8.22
Buildings 40 31.00
3.2.3. Forecast disposals
Forecast disposals for the access arrangement period are set out Table 3.6 below.
Table 3.6 – Forecast disposals over the access arrangement period ($nominal)
$’000 2016/17 2017/18 2018/19 2019 20 2020/21
Disposals 176 66 110 132 176
8 As required by Rule 72(1)(c)(ii)
APT Pipelines (NT) Pty Limited
Amadeus Gas Pipeline Access Arrangement Information
11
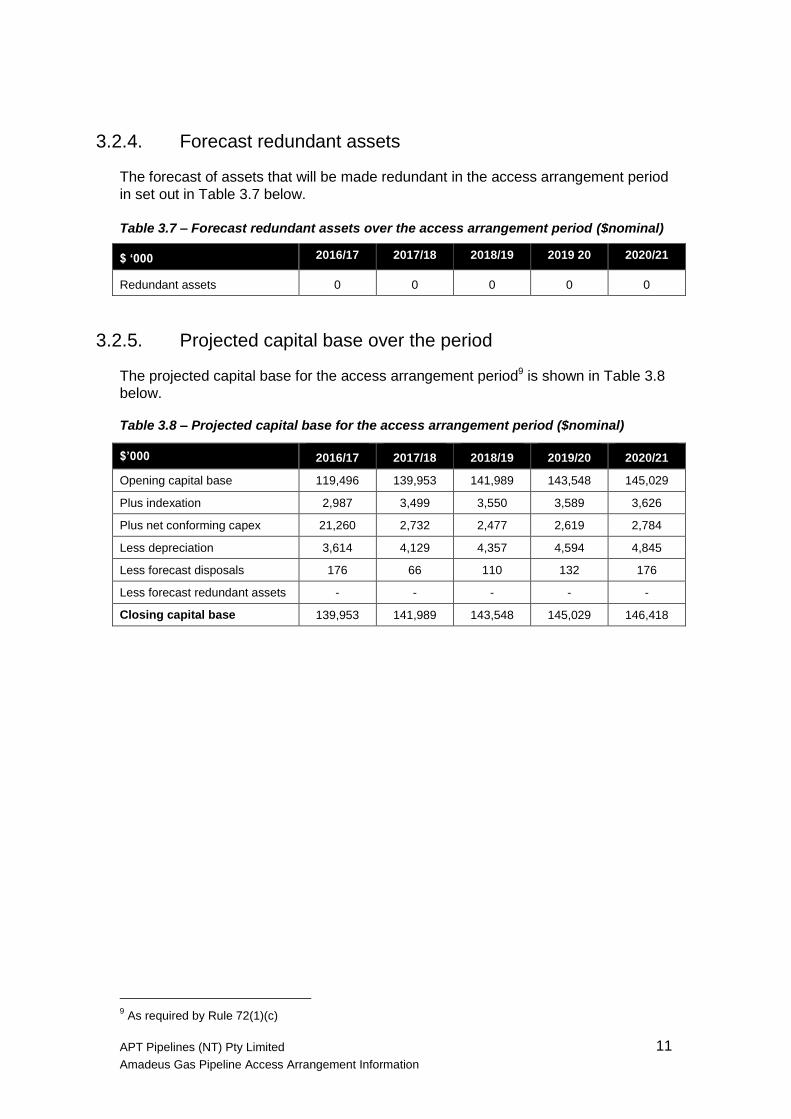
3.2.4. Forecast redundant assets
The forecast of assets that will be made redundant in the access arrangement period
in set out in Table 3.7 below.
Table 3.7 – Forecast redundant assets over the access arrangement period ($nominal)
$ ‘000 2016/17 2017/18 2018/19 2019 20 2020/21
Redundant assets 0 0 0 0 0
3.2.5. Projected capital base over the period
The projected capital base for the access arrangement period9 is shown in Table 3.8
below.
Table 3.8 – Projected capital base for the access arrangement period ($nominal)
$’000 2016/17 2017/18 2018/19 2019/20 2020/21
Opening capital base 119,496 139,953 141,989 143,548 145,029
Plus indexation 2,987 3,499 3,550 3,589 3,626
Plus net conforming capex 21,260 2,732 2,477 2,619 2,784
Less depreciation 3,614 4,129 4,357 4,594 4,845
Less forecast disposals 176 66 110 132 176
Less forecast redundant assets - - - - -
Closing capital base 139,953 141,989 143,548 145,029 146,418
9 As required by Rule 72(1)(c)


APT Pipelines (NT) Pty Limited
Amadeus Gas Pipeline Access Arrangement Information
13
4. Forecast pipeline demand and utilisation
4.1 Forecast demand and user numbers
Forecast demand by delivery point over the access arrangement period is shown in
Table 4.1 below.
Table 4.1 - Minimum, maximum and average demand and total volume by delivery point
over the access arrangement period
2016/17 2017/18 2018/19 2019/20 2020/21
Delivery points Unit
Alice Springs Min (TJ/d) 6.3 6.3 6.3 6.3 6.3
Max (TJ/d) 14.0 14.3 14.6 14.9 15.2
Average (TJ/d) 7.5 7.6 7.8 7.9 8.1
Total (TJ/a) 2,730.0 2,780.0 2,840.0 2,900.0 2,960.0
Tennant Creek Min (TJ/d) 0.5 0.5 0.5 0.5 0.5
Max (TJ/d) 1.7 1.7 1.7 1.7 1.7
Average (TJ/d) 1.1 1.1 1.1 1.1 1.1
Total (TJ/a) 386.0 390.0 394.0 398.0 402.0
Elliott Min (TJ/d) 0.1 0.1 0.1 0.1 0.1
Max (TJ/d) 0.2 0.2 0.2 0.2 0.2
Average (TJ/d) 0.1 0.1 0.1 0.1 0.1
Total (TJ/a) 37.0 37.0 37.0 37.0 37.0
Daly Waters Min (TJ/d) 1.5 1.5 1.5 1.5 1.5
Max (TJ/d) 9.4 9.4 9.4 9.4 9.4
Average (TJ/d) 8.1 8.1 8.1 8.1 8.1
Total (TJ/a) 2,956.5 2,956.5 2,956.5 2,956.5 2,956.5
Mataranka Min (TJ/d) - - - - -
Max (TJ/d) - - - - -
Average (TJ/d) - - - - -
Total (TJ/a) - - - - -
Katherine Min (TJ/d) - - - - -
Max (TJ/d) 6.2 6.2 6.2 6.2 6.2
Average (TJ/d) 1.2 1.2 1.2 1.2 1.2
Total (TJ/a) 420.0 424.0 428.0 432.0 436.0
Mt Todd Min (TJ/d) - - - - -
Max (TJ/d) - - - - -
Average (TJ/d) - - - - -
Total (TJ/a) - - - - -

APT Pipelines (NT) Pty Limited
Amadeus Gas Pipeline Access Arrangement Information
14
2016/17 2017/18 2018/19 2019/20 2020/21
Pine Creek Min (TJ/d) - - - - -
Max (TJ/d) 5.9 5.9 5.9 5.9 5.9
Average (TJ/d) 5.1 5.1 5.1 5.1 5.1
Total (TJ/a) 1,860.0 1,860.0 1,860.0 1,860.0 1,860.0
Cosmo Min (TJ/d) - - - - -
Max (TJ/d) - - - - -
Average (TJ/d) - - - - -
Total (TJ/a) - - - - -
Ban Ban Springs Min (TJ/d) - - - - -
Max (TJ/d) - - - - -
Average (TJ/d) - - - - -
Total (TJ/a) - - - - -
Townend Road Min (TJ/d) 0.2 0.2 0.2 0.2 0.2
Max (TJ/d) 1.3 1.3 1.3 1.3 1.3
Average (TJ/d) 0.9 0.9 0.9 0.9 0.9
Total (TJ/a) 310.6 310.6 310.6 310.6 310.6
Darwin City Gate Min (TJ/d) 0.0 0.0 0.0 0.0 0.0
Max (TJ/d) 0.2 0.2 0.2 0.2 0.2
Average (TJ/d) 0.1 0.1 0.1 0.1 0.1
Total (TJ/a) 24.4 24.4 24.4 24.4 24.4
Weddell Min (TJ/d) - - - - -
Max (TJ/d) 27.0 27.6 28.2 28.8 29.5
Average (TJ/d) 14.7 15.0 15.4 15.7 16.0
Total (TJ/a) 5,365.0 5,483.0 5,604.0 5,727.0 5,853.0
Channel Island Min (TJ/d) 15.2 15.2 15.2 15.2 15.2
Max (TJ/d) 47.0 48.1 49.1 50.2 51.3
Average (TJ/d) 31.7 32.4 33.1 33.8 34.6
Total (TJ/a) 11,572.0 11,827.0 12,087.0 12,353.0 12,625.0
Total volume Total (TJ/a) 25,661.5 26,092.5 26,541.5 26,998.5 27,464.5

APT Pipelines (NT) Pty Limited
Amadeus Gas Pipeline Access Arrangement Information
15
Forecast user numbers by delivery point over the access arrangement period are
shown in Table 4.2 below.
Table 4.2 - User numbers by delivery point over the access arrangement period
Delivery Points 2016/17 2017/18 2018/19 2019/20 2020/21
Alice Springs 1 1 1 1 1
Tennant Creek 1 1 1 1 1
Elliott 1 1 1 1 1
Daly Waters 1 1 1 1 1
Mataranka 0 0 0 0 0
Katherine 1 1 1 1 1
Mt Todd 0 0 0 0 0
Pine Creek 1 1 1 1 1
Cosmo 0 0 0 0 0
Ban Ban Springs 0 0 0 0 0
Townend Road 1 1 1 1 1
Darwin City Gate 1 1 1 1 1
Weddell 1 1 1 1 1
Channel Island 1 1 1 1 1
4.2 Forecast pipeline capacity and utilisation
Forecast pipeline capacity and utilisation are shown in Table 4.3 below.
Forecast capacity has been determined after modelling the current aggregate
contracted demands on the pipeline, and then simulating the additional quantity that
can be delivered without breaching the physical and contractual constraints on the
pipeline.
Utilisation of the pipeline has been forecast using an estimate of the non-coincident
maximum demand for all delivery points divided by the forecast capacity of the
pipeline. The estimate of non-coincident demand has been derived from recent flow
data extrapolated for the forecast years with an annual growth rate matching forecast
volume growth.
Table 4.3 - Pipeline capacity and utilisation over the access arrangement period
Units 2016/17 2017/18 2018/19 2019/20 2020/21
Pipeline capacity TJ/day 120 120 120 120 120
Average utilisation of pipeline capacity
% 59 60 61 62 63

APT Pipelines (NT) Pty Limited
Amadeus Gas Pipeline Access Arrangement Information
17
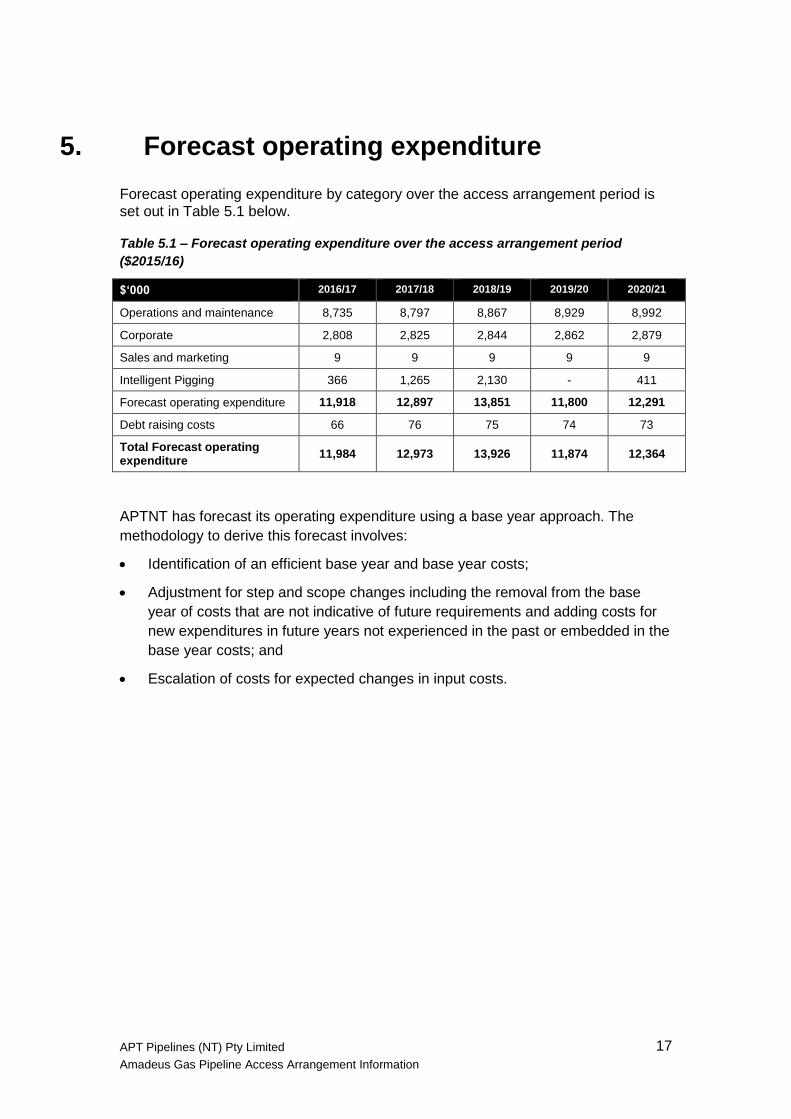
5. Forecast operating expenditure
Forecast operating expenditure by category over the access arrangement period is
set out in Table 5.1 below.
Table 5.1 – Forecast operating expenditure over the access arrangement period
($2015/16)
$‘000 2016/17 2017/18 2018/19 2019/20 2020/21
Operations and maintenance 8,735 8,797 8,867 8,929 8,992
Corporate 2,808 2,825 2,844 2,862 2,879
Sales and marketing 9 9 9 9 9
Intelligent Pigging 366 1,265 2,130 - 411
Forecast operating expenditure 11,918 12,897 13,851 11,800 12,291
Debt raising costs 66 76 75 74 73
Total Forecast operating expenditure
11,984 12,973 13,926 11,874 12,364
APTNT has forecast its operating expenditure using a base year approach. The
methodology to derive this forecast involves:
Identification of an efficient base year and base year costs;
Adjustment for step and scope changes including the removal from the base
year of costs that are not indicative of future requirements and adding costs for
new expenditures in future years not experienced in the past or embedded in the
base year costs; and
Escalation of costs for expected changes in input costs.
APT Pipelines (NT) Pty Limited
Amadeus Gas Pipeline Access Arrangement Information
18
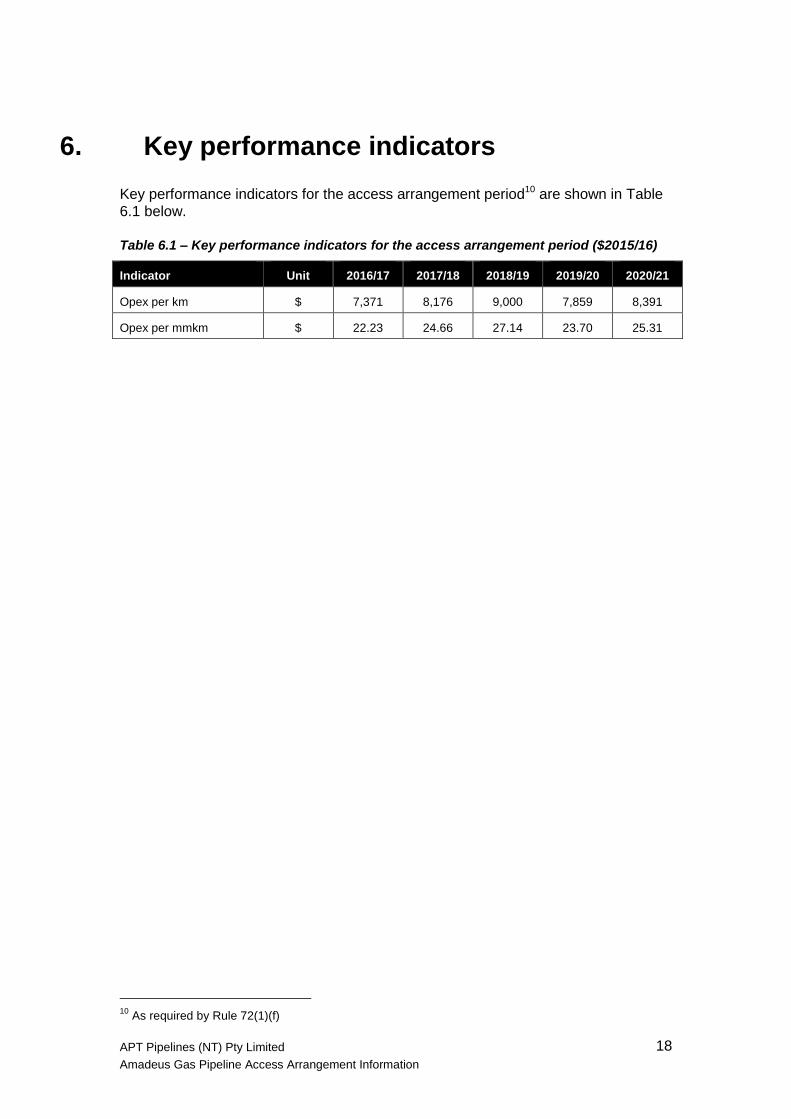
6. Key performance indicators
Key performance indicators for the access arrangement period10 are shown in Table
6.1 below.
Table 6.1 – Key performance indicators for the access arrangement period ($2015/16)
Indicator Unit 2016/17 2017/18 2018/19 2019/20 2020/21
Opex per km $ 7,371 8,176 9,000 7,859 8,391
Opex per mmkm $ 22.23 24.66 27.14 23.70 25.31
10
As required by Rule 72(1)(f)
APT Pipelines (NT) Pty Limited
Amadeus Gas Pipeline Access Arrangement Information
19
7. Rate of return
The return on the projected capital base included in the total revenue is determined
as the product of a rate of return and the projected capital base at the beginning of
each regulatory year of an access arrangement period.
The rate of return – the allowed rate of return of rule 87 of the NGR – is a nominal
vanilla weighted average of an estimate of the return on equity and an estimate of the
return on debt. Rule 72(g) requires the Access Arrangement Information to include:
(g) the proposed return on equity, return on debt and allowed rate of return,
for each regulatory year of the access arrangement period, in accordance
with rule 87, including any departure from the methodologies set out in the
rate of return guidelines and the reasons for that departure;
7.1 Gearing
The weight assigned to the estimate of the return on equity in the weighted average
is 40%, and the weight assigned to the estimate of the return on debt is 60%.
7.2 Risk free rate of return
The risk free rate of return is an important input into rate of return determination.
The risk free rate is estimated from the yields on Commonwealth Government
securities (CGS) with terms to maturity of 10 years. An estimate of 2.92% has been
made from yields on CGS over the 20 trading days to 30 November 2015.
7.3 Return on equity
APTNT has departed from the AER’s Rate of Return Guideline when estimating the
return on equity.
The Rate of Return Guideline requires estimation of the return on equity using the
Sharpe-Lintner Capital Asset Pricing Model (SL CAPM). The SL CAPM provides a
simplified representation of the trade-off between systematic risk and return. It
cannot, alone, provide an estimate of the return on equity which can contribute to the
achievement of a rate of return commensurate with the efficient financing costs of a

APT Pipelines (NT) Pty Limited
Amadeus Gas Pipeline Access Arrangement Information
20
benchmark efficient entity with a similar degree of risk as that which applies to the
service provider in respect of the provision of reference services.
Multiple models, with a different bases – and different strengths and limitations –
must be used to estimate the return on equity. In addition to the SL CAPM, the Rate
of Return Guideline identifies the Black CAPM, the Dividend Growth Model, and the
Fama-French Three Factor Model as models as being relevant to estimating the
return on equity.
Through the use of multiple models, factors which are neglected in a single model
can be taken into account and, if “convergence” is demonstrated, the result can be
interpreted as not being the unique outcome from use of a particular theoretical
framework or single data set. Where there are divergent results, the reasons why
this is the case should be examined and taken into account in reaching a conclusion
on the phenomenon under investigation.
Each of the Sharpe-Lintner CAPM, the Black CAPM, the Dividend Growth Model,
and the Fama-French Three Factor Model is used to make a point estimate of the
return on equity. The results are used in a considered way to arrive at the estimate
of the return on equity required by rule 87.
SL CAPM
The SL CAPM represents the expected return, E(rj), on a particular financial asset j,
as:
𝐸(𝑟𝑗) = 𝑟𝑓 + 𝛽𝑗 × [𝐸(𝑟𝑚) − 𝑟𝑓]
where rf, is the risk free rate of return; βj is the beta for asset j, and E(rm) is the
expected return on the market portfolio of assets.
APTNT has departed from the AER’s Rate of Return Guideline when using the SL
CAPM to estimate the return on equity.
At the time the SL CAPM is applied, estimates are made of:
the rate of return on the risk free asset assumed to be available to investors at
that time (the risk free rate); and
the return those investors expect, at that time, to earn on the market portfolio.
The difference between the estimate of the return on the market portfolio and the
estimate of the risk free rate is the estimate of the term [𝐸(𝑟𝑚) − 𝑟𝑓] in the SL CAPM.
This is not the AER’s “standard approach”, in which the term [𝐸(𝑟𝑚) − 𝑟𝑓] is
estimated as a single parameter. The AER’s “standard approach” to estimating the

APT Pipelines (NT) Pty Limited
Amadeus Gas Pipeline Access Arrangement Information
21
risk free rate and the term [𝐸(𝑟𝑚) − 𝑟𝑓] is inconsistent with the assumptions from
which SL CAPM is derived.
APTNT has re-estimated the return on equity using the SL CAPM, with the following
estimates for the input variables of the model:
risk free rate: rf = 2.92%;
equity beta: βi = 0.8; and
E(rm): in the range 10.4% per cent to 11.5% (based on the AER’s dividend
growth model results).
The estimated return on equity is in the range 8.9% to 9.8%.
Black CAPM
Estimation of the return on equity using the Black CAPM requires that values be
assigned to its three input variables. These are:
the return on the zero beta portfolio;
the equity beta; and
the return on the market portfolio.
APTNT uses an estimate of 3.34% for the zero beta premium, an estimate of 0.8 for
the equity beta, and uses the range 10.4% to 11.5% for the return on the market.
Using these estimates for the input variables, the Black CAPM delivers a range for
the estimate of the return on equity of 9.5% to 10.5%.
Dividend Growth Model
The Dividend Growth Model provides an estimate of the return on equity for energy
infrastructure businesses of 10.8%.
Fama-French three factor model
The expected return on equity, E(rj), from the Fama-French Three Factor Model is:
𝐸(𝑟𝑗) = 𝑟𝑓 + 𝑏𝑒𝑡𝑎𝑗 × [𝐸(𝑟𝑚) − 𝑟𝑓] + 𝑠𝑗 × 𝑆𝑀𝐵 + ℎ𝑗 × 𝐻𝑀𝐿
sj is the size factor “beta”; SMB is the size factor.

APT Pipelines (NT) Pty Limited
Amadeus Gas Pipeline Access Arrangement Information
22
hj is the value factor “beta”; HML is the value factor.
A suite of estimates for the Fama-French model parameters, recently made by SFG
Consulting and which are now in the public domain, is used to estimate the expected
return on equity.11 These estimated values are summarised in Table 7.1.
Table 7.1 – Parameters for the Fama-French Three Factor Model
Parameter Australian data U.S. data
Market return beta 0.48 0.87
Size factor beta (sj) 0.03 -0.07
Size factor (SMB) -0.43% 3.58*
Value factor beta (hj) 0.30 0.12
Value factor (HML) 9.97% 4.81%
The rate of return on the market portfolio has not been adjusted for any value which
might to be attributed to the imputation credits available via Australian taxation law.
The resulting estimates of the return on equity, before and after adjustment for the
value of imputation credits, are also shown in Table 7.2. The adjustment for
imputation credits has been made using the “Officer formula” with a value of 0.25 for
the factor gamma (γ).
Table 7.2 – Application of the Fama-French Three Factor Model
Parameter
Risk free rate 2.92%
Market risk premium 6.11%
Return on equity Using Australian factor
estimates Using U.S. factor estimates
No adjustment for imputation credits 8.83% 8.56%
Adjusted for the value of imputation
credits 9.78% 9.48%
Applying the weighting 24 per cent Australian data/76 per cent U.S. data, the
weighted average of the estimates of the return on equity adjusted for the value of
imputation credits is 9.5 per cent.
Estimates of the return on equity from four models
Estimates of the return on equity made using the four financial models relevant to
estimating equity returns are summarised in Table 7.3.
11
SFG Consulting, The Fama-French model: Report for Jemena Gas Networks, ActewAGL, Ergon,
Transend, TransGrid, and SA PowerNetworks, 13 May 2014
APT Pipelines (NT) Pty Limited
Amadeus Gas Pipeline Access Arrangement Information
23
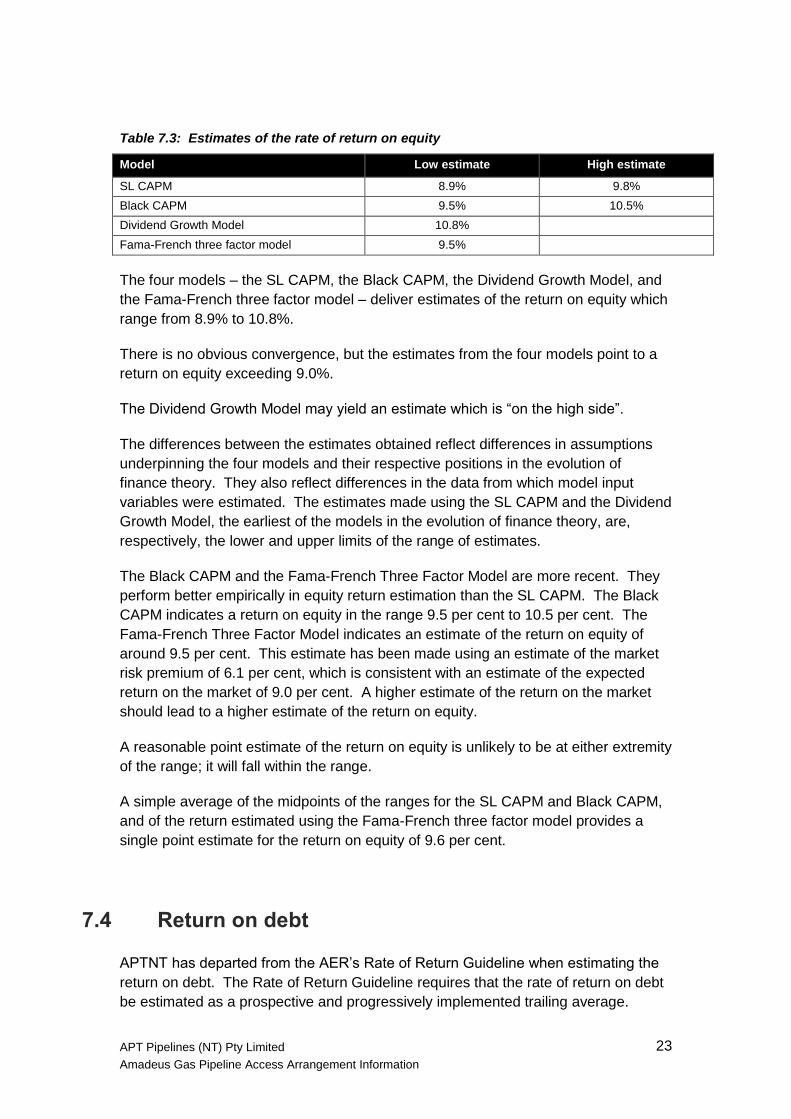
Table 7.3: Estimates of the rate of return on equity
Model Low estimate High estimate
SL CAPM 8.9% 9.8%
Black CAPM 9.5% 10.5%
Dividend Growth Model 10.8%
Fama-French three factor model 9.5%
The four models – the SL CAPM, the Black CAPM, the Dividend Growth Model, and
the Fama-French three factor model – deliver estimates of the return on equity which
range from 8.9% to 10.8%.
There is no obvious convergence, but the estimates from the four models point to a
return on equity exceeding 9.0%.
The Dividend Growth Model may yield an estimate which is “on the high side”.
The differences between the estimates obtained reflect differences in assumptions
underpinning the four models and their respective positions in the evolution of
finance theory. They also reflect differences in the data from which model input
variables were estimated. The estimates made using the SL CAPM and the Dividend
Growth Model, the earliest of the models in the evolution of finance theory, are,
respectively, the lower and upper limits of the range of estimates.
The Black CAPM and the Fama-French Three Factor Model are more recent. They
perform better empirically in equity return estimation than the SL CAPM. The Black
CAPM indicates a return on equity in the range 9.5 per cent to 10.5 per cent. The
Fama-French Three Factor Model indicates an estimate of the return on equity of
around 9.5 per cent. This estimate has been made using an estimate of the market
risk premium of 6.1 per cent, which is consistent with an estimate of the expected
return on the market of 9.0 per cent. A higher estimate of the return on the market
should lead to a higher estimate of the return on equity.
A reasonable point estimate of the return on equity is unlikely to be at either extremity
of the range; it will fall within the range.
A simple average of the midpoints of the ranges for the SL CAPM and Black CAPM,
and of the return estimated using the Fama-French three factor model provides a
single point estimate for the return on equity of 9.6 per cent.
7.4 Return on debt
APTNT has departed from the AER’s Rate of Return Guideline when estimating the
return on debt. The Rate of Return Guideline requires that the rate of return on debt
be estimated as a prospective and progressively implemented trailing average.

APT Pipelines (NT) Pty Limited
Amadeus Gas Pipeline Access Arrangement Information
24
The rate of return on debt is estimated as a simple historical trailing average of
estimates of return on debt for each of the last 10 years. The terms of the trailing
average are equally weighted, and each of the terms is the sum of the risk free rate
and a debt risk premium (as in the Rate of Return Guideline).
The benchmark efficient entity of rule 87(3) is not a regulated entity which would
have hedged its debt in a particular way in response to the prevailing regulatory
regime as the Rate of Return Guideline proposes. The benchmark efficient entity is a
firm of similar scale to the service provider which operates in a workably competitive
market. Such a firm would be expected to issue debt with a term to maturity of 10
years, and to stagger its debt issues to minimise refinancing risk, in the way the Rate
of Return Guideline proposes, without any need for concern about hedging
arrangements which have to be “unwound”. The trailing average approach to
estimation of the return on debt can be implemented immediately (without any need
for a period of transition).
Reserve Bank of Australia data on the credit spreads of Australian non-financial
corporations have been used to estimate the debt risk premiums in the terms of the
trailing average (and not an average of Reserve Bank and Bloomberg service credit
spreads).
Bond samples used by the Reserve Bank of Australia, for corporations with credit
ratings in the BBB band, provide a better “view” of the yields on the bond issues
which are relevant to estimating the return on debt of the benchmark efficient entity of
rule 87. An estimate made using the data from the RBA samples is more likely to be
an estimate which can contribute to achievement of the allowed rate of return
objective of rule 87(3). The Reserve Bank’s method of curve fitting is transparent,
and has yielded a curve which has been shown to be responsive to changes in
conditions in financial markets where the Bloomberg curve is unresponsive.
Where necessary, the data are extrapolated or interpolated in the way proposed by
the AER so that the estimates of the return on debt obtained (and which are the
terms of the trailing average) are for terms to maturity of 10 years consistent with the
assumption made in respect of the financing of the benchmark efficient entity.
The last, and most recent, term in the trailing average is an estimate of the return on
debt made for an averaging period of 20 business days ending 30 November 2015.
The earlier terms of the average are estimated using data for averaging periods
which were at intervals of multiples of twelve months prior to the averaging period of
the last and most recent term.
Using Reserve Bank of Australia data for an averaging period of 20 business days
ending 30 November 2015, and for prior averaging periods in November in each of
the previous nine years, an estimate of the return on debt for the benchmark efficient
entity is 7.9%.

APT Pipelines (NT) Pty Limited
Amadeus Gas Pipeline Access Arrangement Information
25
In making this estimate, APTNT has used Reserve Bank data for August 2007 rather
than for November. August is the closest prior month for which data are available to
be used in place of the November 2007 data, which the Reserve Bank advises are
unavailable.
This historical trailing average is to be updated, annually, by deleting its earliest term,
and adding a new term calculated for the current year. The equal weighting of the
terms are to be retained in the updating process.
7.5 Value of imputation credits
APTNT has departed from the AER’s Rate of Return Guideline when estimating the
value of imputation credits. The Rate of Return Guideline requires that the value of
imputation credits – the factor gamma (γ) – be estimated as the product of the
distribution rate and theta.
The benchmark efficient entity is an entity with 100% Australian income. Such an
entity cannot maintain a distribution rate above its earnings distribution rate.
Therefore, the distribution rate of listed equity (with material foreign earnings) is not a
good proxy for the distribution rate for the benchmark entity. The all equity rate is a
better estimate of the distribution rate of the benchmark efficient entity. The best
estimate possible for the distribution rate is, in the circumstances, 0.7.
The Rate of Return Guideline advises that, when estimating theta:
significant reliance is to be placed on the equity ownership approach;
some reliance is to be placed on tax statistics; and
less reliance is to be placed upon implied market value studies.
But the value to be assigned to imputation credits is their market value. Accordingly,
significant reliance should be placed upon implied market value studies which
estimate theta.
The definitive estimate of theta – the market value of distributed credits remains the
estimate made by SFG in 2011, using a dividend drop-off study. This estimate, 0.35,
was accepted by the Australian Competition Tribunal in Energex Limited (No.5).
Professor Stephen Gray, author of the SFG’s 2011 report, has continued to update
the work which led to the 2011 estimate, and has recently advised that 0.35
continues to be a conservative estimate of the market value of distributed imputation
credits.
Since gamma is estimated as the product of the distribution rate and theta, the best
estimate possible in the circumstances is 0.7 x 0.35 = 0.25.
APT Pipelines (NT) Pty Limited
Amadeus Gas Pipeline Access Arrangement Information
26
7.6 Proposed allowed rate of return
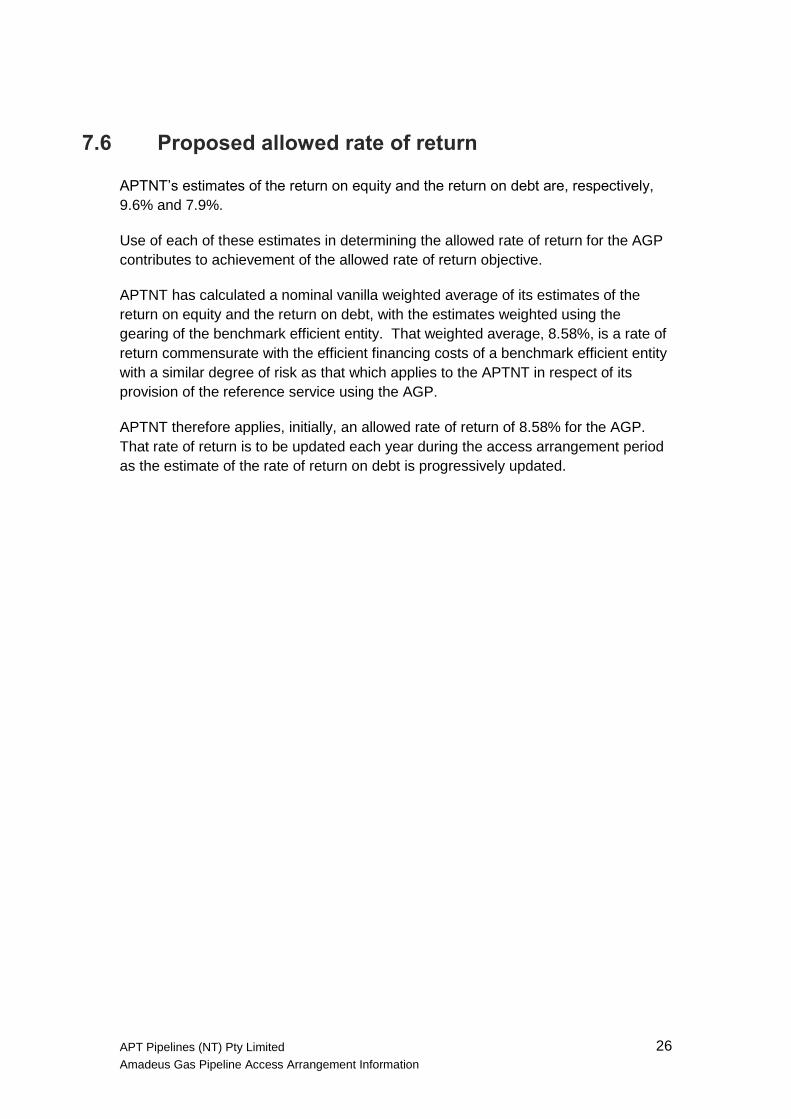
APTNT’s estimates of the return on equity and the return on debt are, respectively,
9.6% and 7.9%.
Use of each of these estimates in determining the allowed rate of return for the AGP
contributes to achievement of the allowed rate of return objective.
APTNT has calculated a nominal vanilla weighted average of its estimates of the
return on equity and the return on debt, with the estimates weighted using the
gearing of the benchmark efficient entity. That weighted average, 8.58%, is a rate of
return commensurate with the efficient financing costs of a benchmark efficient entity
with a similar degree of risk as that which applies to the APTNT in respect of its
provision of the reference service using the AGP.
APTNT therefore applies, initially, an allowed rate of return of 8.58% for the AGP.
That rate of return is to be updated each year during the access arrangement period
as the estimate of the rate of return on debt is progressively updated.

APT Pipelines (NT) Pty Limited
Amadeus Gas Pipeline Access Arrangement Information
27
8. Taxation
APTNT has adopted a post tax approach. Under this approach, the cash flows of the
business include an estimate of the amount of tax payable on regulatory revenues.
APTNT has rolled forward its TAB using the same principles as the normal asset
base rollforward. That is, APTNT has adopted the opening TAB in the earlier access
arrangement period, and rolled it forward using actual capital expenditure. As the
TAB is not indexed, it was not necessary to update the rollforward for outturn CPI
increases. The TAB rollforward is shown in Table 8.1 and Table 8.2.
Table 8.1 – Tax Asset Base as at 30 June 2016 ($nominal)
$‘000 2011/12 2012/13 2013/14 2014/15 2015/16
Opening tax asset base 9,251 11,757 26,039 27,949 29,962
Plus capex 4,116 15,798 3,824 4,020 14,824
Less tax depreciation -1,611 -1,516 -1,914 -2,007 -2,309
Closing tax asset base 11,757 26,039 27,949 29,962 42,477
Table 8.2 – Forecast Tax Asset Base ($nominal)
$’000 2016/17 2017/18 2018/19 2019/20 2020/21
Opening tax asset base 42,477 60,093 58,827 57,108 55,351
Plus capex 20,485 2,590 2,300 2,416 2,534
Less tax depreciation 2,869 3,857 4,018 4,173 4,335
Closing tax asset base 60,093 58,827 57,108 55,351 53,551
The TAB is then applied to determine the corporate income tax allowance derived
from the AER’s Post Tax Revenue Model, as indicated in Table 8.3. This calculation
of corporate income tax reflects a value for tax imputation credits, gamma, of 0.25.
Table 8.3 – Corporate income tax allowance ($nominal)
$’000 2016/17 2017/18 2018/19 2019/20 2020/21
Tax allowance 681 623 651 681 712

APT Pipelines (NT) Pty Limited
Amadeus Gas Pipeline Access Arrangement Information
28
9. Historical incentive mechanism
There was no incentive mechanism operative in the earlier access arrangement
period giving rise to increments or decrements that need to be included in the
revenue requirement for the access arrangement period12.
12
As required by Rule 72(1)(i)
APT Pipelines (NT) Pty Limited
Amadeus Gas Pipeline Access Arrangement Information
29
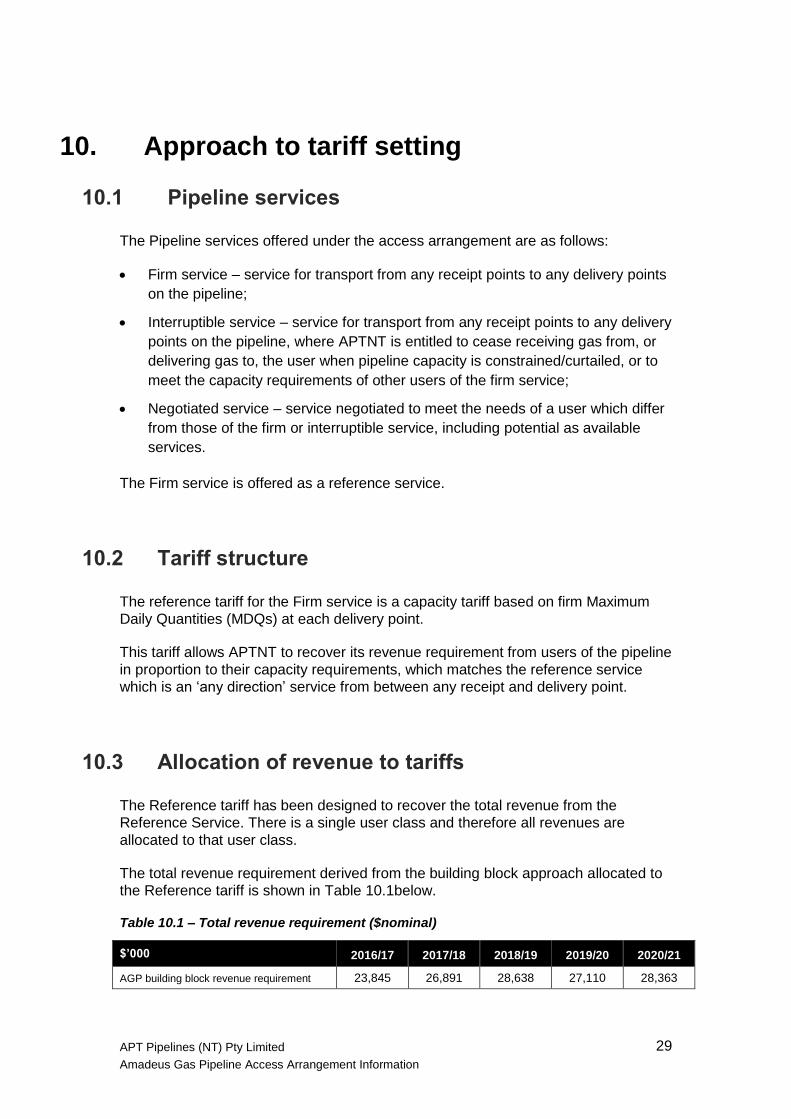
10. Approach to tariff setting
10.1 Pipeline services
The Pipeline services offered under the access arrangement are as follows:
Firm service – service for transport from any receipt points to any delivery points
on the pipeline;
Interruptible service – service for transport from any receipt points to any delivery
points on the pipeline, where APTNT is entitled to cease receiving gas from, or
delivering gas to, the user when pipeline capacity is constrained/curtailed, or to
meet the capacity requirements of other users of the firm service;
Negotiated service – service negotiated to meet the needs of a user which differ
from those of the firm or interruptible service, including potential as available
services.
The Firm service is offered as a reference service.
10.2 Tariff structure
The reference tariff for the Firm service is a capacity tariff based on firm Maximum
Daily Quantities (MDQs) at each delivery point.
This tariff allows APTNT to recover its revenue requirement from users of the pipeline
in proportion to their capacity requirements, which matches the reference service
which is an ‘any direction’ service from between any receipt and delivery point.
10.3 Allocation of revenue to tariffs
The Reference tariff has been designed to recover the total revenue from the
Reference Service. There is a single user class and therefore all revenues are
allocated to that user class.
The total revenue requirement derived from the building block approach allocated to
the Reference tariff is shown in Table 10.1below.
Table 10.1 – Total revenue requirement ($nominal)
$’000 2016/17 2017/18 2018/19 2019/20 2020/21
AGP building block revenue requirement 23,845 26,891 28,638 27,110 28,363

APT Pipelines (NT) Pty Limited
Amadeus Gas Pipeline Access Arrangement Information
30
The present value of this revenue requirement, discounted at the WACC of 8.58 per
cent, is $105.438 million.
The smoothed revenue requirement is shown in Table 10.2 below.
Table 10.2 – Smoothed revenue requirement
$’000 2016/17 2017/18 2018/19 2019/20 2020/21
Smoothed Revenue requirement 25,559 26,217 26,892 27,662 28,301
The present value of this revenue requirement, discounted at the WACC of 8.58 per
cent, is $105.438 million.
10.4 Reference tariffs
The tariff for the reference service is set out in Schedule 1 of the access
arrangement. The reference tariff is published for 2016/17 (in $2016/17) and is
exclusive of goods and services tax (GST). The 2016/17 tariff that forms the starting
point for the access arrangement period is $0.6865 per GJ of Delivery Point MDQ.
10.4.1. Reference tariff variation mechanism
The Reference Tariff for the Firm Service may be varied during the Access
Arrangement Period through the operation of the Reference Tariff Variation
Mechanism, which is made up of:
A Scheduled Reference Tariff Variation Mechanism – which applies in respect of
each year of the Access Arrangement Period; and
A Cost Pass-through Reference Tariff Variation Mechanism - under which
Service Provider may seek to vary the Reference Tariff as a result of occurrence
of a Cost Pass-through Event.
10.4.2. Scheduled reference tariff variation mechanism
A symmetrical annual tariff variation adjustment formula adjusts the reference tariff
on each 1 July of the access arrangement period in respect of changes to the
Consumer Price Index (CPI) and to the return on debt.
These adjustments are intended to ensure an efficient tariff over the access
arrangement period. Relevant values and formulae for the above parameters are set
out in section 4.7 of the access arrangement.

APT Pipelines (NT) Pty Limited
Amadeus Gas Pipeline Access Arrangement Information
31
10.4.3. Cost pass through reference tariff variation mechanism
A symmetrical cost pass through reference tariff variation mechanism is included in
the access arrangement to allow the reference tariff to be adjusted to recover (or
return) material incremental costs resulting from defined cost pass through events.
The cost pass through events defined in the access arrangement are:
a regulatory change event;
a service standard event;
a tax change event;
a terrorism event;
an insurer credit risk event;
an insurance cap event;
a natural disaster event.
Part 4.7 of the access arrangement sets out the tariff variation process the materiality
threshold for cost pass-through events.


APT Pipelines (NT) Pty Limited
Amadeus Gas Pipeline Access Arrangement Information
33
11. Proposed incentive mechanism
The access arrangement does not include an incentive mechanism of the type
described under the Rules13, however APTNT faces incentives to reduce costs and
increase demand over the access arrangement period compared with the forecast on
which the access arrangement is based, as total revenue will not be adjusted to
reflect differences between forecast and actual gas demand and/or business costs.
13
See Rule 98

APT Pipelines (NT) Pty Limited
Amadeus Gas Pipeline Access Arrangement Information
35
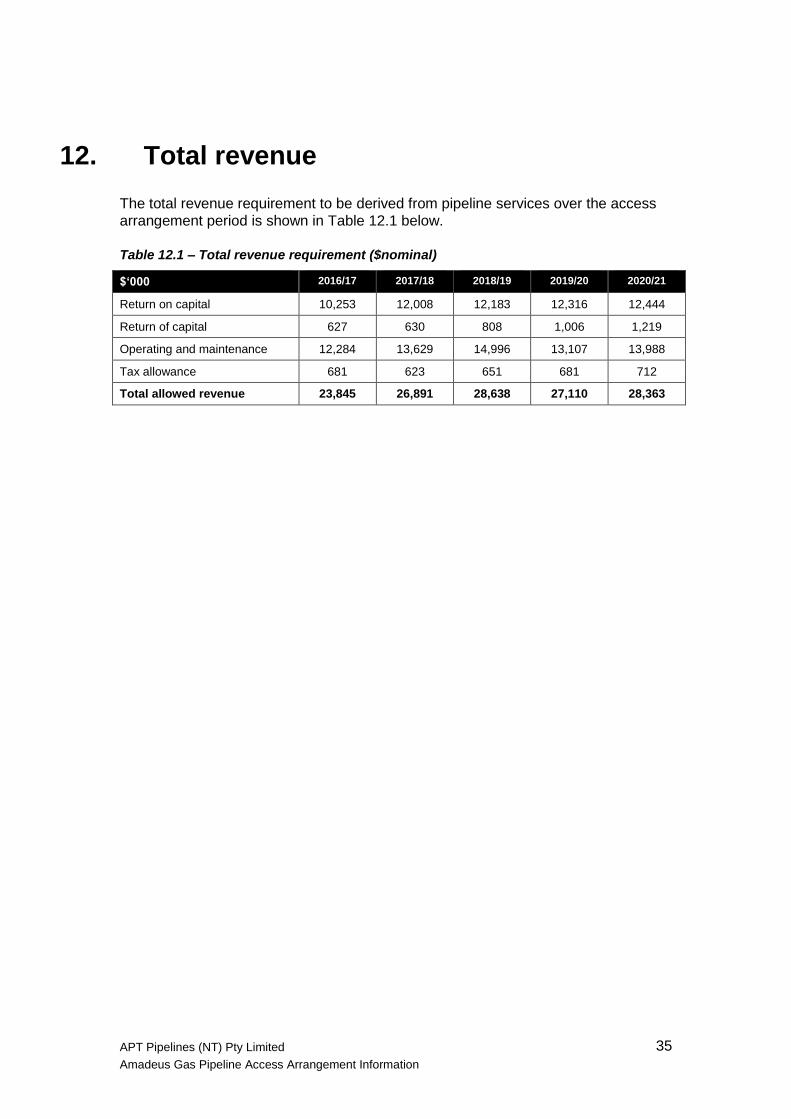
12. Total revenue
The total revenue requirement to be derived from pipeline services over the access
arrangement period is shown in Table 12.1 below.
Table 12.1 – Total revenue requirement ($nominal)
$‘000 2016/17 2017/18 2018/19 2019/20 2020/21
Return on capital 10,253 12,008 12,183 12,316 12,444
Return of capital 627 630 808 1,006 1,219
Operating and maintenance 12,284 13,629 14,996 13,107 13,988
Tax allowance 681 623 651 681 712
Total allowed revenue 23,845 26,891 28,638 27,110 28,363