Embed Size (px)
Citation preview

AMB201: MARKETING & AUDIENCE RESEARCH Assessment 3: Predictors of Online Retail Shopping
Student name: Jenny Chan
Student number: n8738254
Tutor name: Jay Kim
Tutorial time: Friday 2pm-3pm
Due Date: 3 June 2016
Word count: 1993
Word count:

Jenny Chan n8738254
1
Table of Contents Participant Reflection .............................................................................................................................. 2
Executive Summary ................................................................................................................................ 3
1.0 Introduction and Background............................................................................................................ 4
1.1 Importance of the research ............................................................................................................ 4
1.2 Scope of the report ........................................................................................................................ 4
1.3 Research problem/question ........................................................................................................... 4
1.4 Aim and objectives ....................................................................................................................... 4
2.0 Method .............................................................................................................................................. 5
2.1 Methodology considerations and assumptions ............................................................................. 5
2.2 Sample considerations .................................................................................................................. 5
2.3 Data collection and framework, and analytical considerations ..................................................... 6
3.0 Ethical considerations ....................................................................................................................... 6
4.0 Analysis............................................................................................................................................. 7
4.1 Data cleaning and editing .............................................................................................................. 7
4.2 Descriptive Data ............................................................................................................................ 7
4.3 Analysis for Objective 1 ............................................................................................................. 10
4.4 Analysis for Objective 2 ............................................................................................................. 12
4.4.1 Correlation ............................................................................................................................... 12
4.4.2 Regression ................................................................................................................................ 13
5.0 Discussion and Recommendations.................................................................................................. 14
5.1 Objective 1 .................................................................................................................................. 14
5.1 Objective 2 .................................................................................................................................. 14
6.0 Limitations ...................................................................................................................................... 15
7.0 References ....................................................................................................................................... 16
8.0 Appendices ...................................................................................................................................... 17
8.1 Objective 2 definition for two variables ..................................................................................... 17
8.2 Surveys ........................................................................................................................................ 17

Jenny Chan n8738254
2
Participant Reflection
The project I chose to participate was Handbags! Showy and Blingy, or Subtle and confident
which it is an online study of quantitative survey based on the brand research on the
handbags. Reason why I took this participant as a quantitative survey project because it is an
good experience for me as a participant which I am interested in handbags fashion and I have
the knowledge about the handbags design include luxury handbags. Before I take this project
participant, I read the description on this project on the handbags research is to examining on
the consumer perceptions of different types of luxury handbags. The participation project is
based on the survey questions include the knowledge question about the luxury handbags
brands and there is a two picture of the luxury handbags product brands are Coach and Louis
Vuitton. While I did the survey, the Coach products with an equally price show the two
similar products include handbags size design but different colour and pattern compare to
Louis Vuitton. Louis Vuitton products has the equally price which it show the pictures of the
same bags design but the Louis Vuitton logo is different on the bags. The first bag of Louis
Vuitton logo is the middle of the bags and second bag is on the right hand corner. Overall
with this survey are negative and positive questions for people are willing to buy the luxury
bags design. Also there is a question in the survey is that if my friends were shopping for a
handbag and I would recommend to my friend which bag design of Coach and Louis Vuitton
between those two bags design. The use of this participate project experience would use my
own survey question as different question. Using with my own questions in the survey would
be easier because I can use my own questions by using the scale 1 to 7. 1 is disagree and 7 is
agree which it can be relate how people see the brand of the handbags products for example:
would you buy a handbags with a good quality products, I am motivated to buy luxury
products, did some research on luxury handbags products and have you own any luxury
handbags products. The researchers who are interested and have the knowledge in handbags
can also take part in research as a participant because it shows that the researchers can see
who take part of this project and they can have their own opinion because there is no right or
wrong answer in the survey.
Jenny Chan n8738254
3
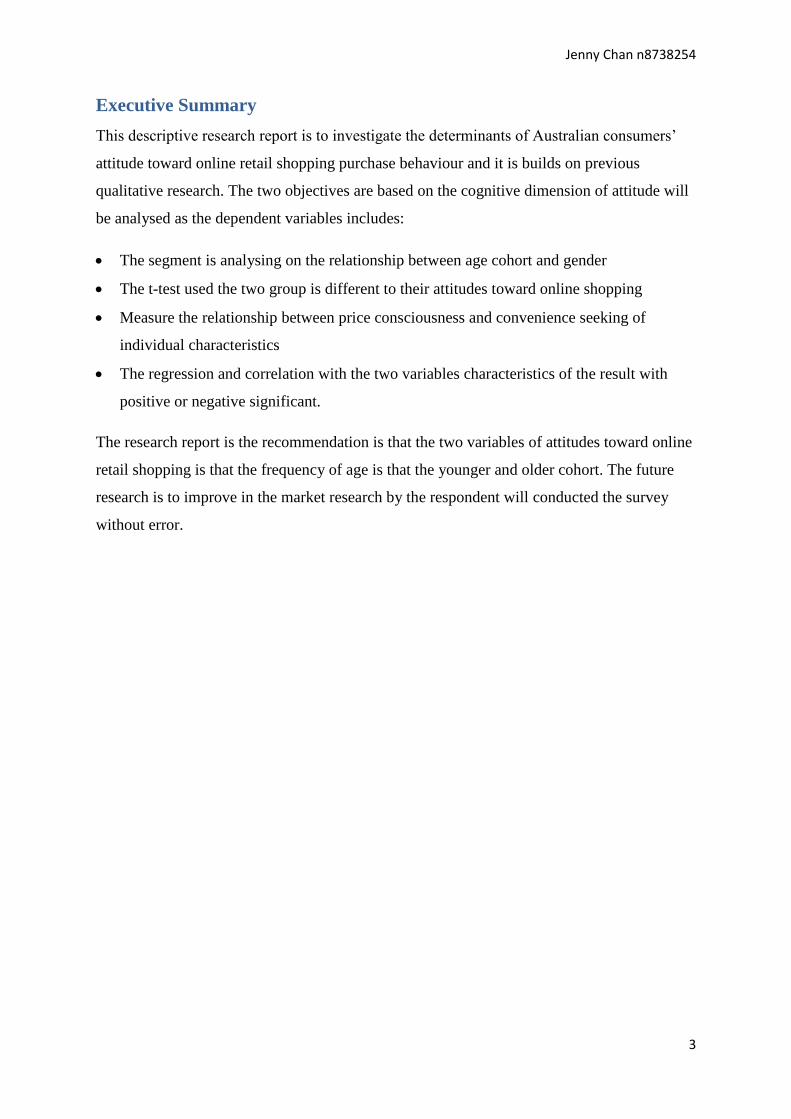
Executive Summary
This descriptive research report is to investigate the determinants of Australian consumers’
attitude toward online retail shopping purchase behaviour and it is builds on previous
qualitative research. The two objectives are based on the cognitive dimension of attitude will
be analysed as the dependent variables includes:
The segment is analysing on the relationship between age cohort and gender
The t-test used the two group is different to their attitudes toward online shopping
Measure the relationship between price consciousness and convenience seeking of
individual characteristics
The regression and correlation with the two variables characteristics of the result with
positive or negative significant.
The research report is the recommendation is that the two variables of attitudes toward online
retail shopping is that the frequency of age is that the younger and older cohort. The future
research is to improve in the market research by the respondent will conducted the survey
without error.

Jenny Chan n8738254
4
1.0 Introduction and Background
1.1 Importance of the research
The importance of the research is to be part as the market research is to systematic and
objective process of generating the information by making in a marketing decision on the
Australian adults with their attitudes toward online shopping (Zikmund, D’Alessandro,
Winzar, Lowe & Babin, 2014, p.6). The research is important to be part of the market
research is to use the descriptive research with their behaviour on the Australian consumers
attitudes towards online shopping by their behaviour, as well as any potential market
segment.
This research is related to the findings from the previous qualitative research with their
experience online shopping. Quantitative research is important to allow the questioning of
facts necessary determine a course of action which it building the insight from the qualitative
research (Zikmund et al, 2014, p72). Unlike the exploratory research is conducted the initial
stage of the research process and the descriptive research being undertaken based on a
previous research to understanding of the research problem (Zikmund et al, 2014).
1.2 Scope of the report
The scope of this research report is based on the Australian adults consumers’ behaviour
concerns with their attitudes toward online shopping. The role of this research is stage 2 of 2
in the research report process. The participants must be over 18 to participate in surveys. The
participants must have one respondent aged of 18-40 which it is younger cohort and one
respondent aged of 41+ which it is older cohort. This report will cover on segmentations
variables and characteristics constructs based on the attitudes toward online retail shopping
cognitive.
1.3 Research problem/question
The research question is to show the behaviour on the determinants of Australian consumers’
attitudes toward online shopping.
1.4 Aim and objectives
The aim and objectives of this report are to explore the quantitative research on the
determinants of Australian consumers’ attitudes toward online retail shopping. The two
specific objectives used in the survey include:

Jenny Chan n8738254
5
Objective 1: to examine if attitude toward online retail shopping differ across population
segments is based on the younger verse older, men verse women and married verse single of
the target population.
Objective 2: to determine the impact of individual characteristics on attitudes toward online
retail shopping is various each individual characteristics relate to the respondents attitude
toward online shopping.
2.0 Method
2.1 Methodology considerations and assumptions
The methodology in the report use the descriptive research is being is use quantitative
research techniques is the objective to conducted the survey are designed of online shopping
behaviour (Zikmund et al, 2014). The descriptive research is to describe the characteristics of
the target population and conducted to help to segment the market and often to reveal the
nature of shoppiung or other consumer behaviour (Zikmund et al, 2014, p.25). This research
study is cross-sectional are surveys to divide the sample by age into subgroups and the
respondents are only interviewed once (Zikmund, Ward, Lowe, Winza r & Babin, 2011,
p134). Cross-sectional studies are time and cost efficient, measure the behaviour and attitudes
at a point of time and the predictability of findings can be questionable (Zikmund et al, 2011,
p135). The primary data is that the researcher specific purpose of addressing the problem
(Malhotra, Hall, Shaw & Oppenheim, 2006, p138) to gather and assembled specifically for
the research at hand (Zikmund et al, 2014, p.23-4). It is assumed that the participants have
correct insight with their own behaviour and being honest with these as accuracy of
paramount in descriptive research ((Zikmund et al, 2014, p.25). The number of male and
female from each age have been selected as assumed the sample representative. However, the
random sample error and systematic errors is related to the sampling process can be
representative of the sample (Zikmund et al, 2011, p329-30).
2.2 Sample considerations
The sample is the target population of the survey is Australian adults who regularly use the
internet aged of 18 and above. The target population sample size is 748. The probability
sampling techniques use the population known as non-zero probability in the research
selection (Zikmund et al, 2014, p355). With these sampling is a quota sampling which the
Australian consumers’ attitude toward shopping which it is various subgroups in the target

Jenny Chan n8738254
6
population to represent the sample with their characteristics result (Zikmund et al, 2011,
p338).
2.3 Data collection and framework, and analytical considerations
The research is generally involves with quantitative techniques in this report. Researchers
were divided two equal groups according to the family surname. One group gathered two
male respondents and other gathered two female respondents aged of 18-40 and aged 41+.
Each researcher interviewed one respondent from each age group using the same survey
document attached the consent form and the survey should takes approximately 10 to 15
minutes to answer all survey questions. Researcher uploaded the data onto online database
and leaving room for the systematic error. The survey use t-test, regression, correlation and
coefficient. The t-test is to choose the two segmentation variables of age cohort, gender,
relationship status and communication preference to statistically differ between with the two
groups by the variability these means. The correlation and regression is to choose the two
segmentation variables of risk aversion, price consciousness, variety seeking, convenience
seeking, impulsiveness and materialism. The correlation is the relationship between two
segment variables will be negative or positive correlation relationship (Zikmund et al, 2014,
p479). The regression is analysis to identifies the nature of the relationship using the equation
(Wilson, 2003, p215).
3.0 Ethical considerations
The ethics is the important part in the marketing research as research is depends on the
consumers willing be part of the research and willing to cooperate with their respondents
(AMSRS, 2015). The consumers can trust and rely on the assumption of the research must be
conducted honest, truthful and objectively with the respondents privacy (AMSRS, 2015). In
line with Queensland University of Technology (QUT) is that the data material will be
collected, maintained and retained in the ethics policy (QUT, 2016). The respondents are
entirely voluntary at all the research stages and were not misleading (AMSRS, 2015). The
Respondents are 18 and over, require to sign the consent form from the appendices section is
under QUT policy which the form explain the participants confirms and agrees to do the
surveys. The consent form describes the research, participant, expected benefits, risks and
privacy and confidentially (AMSRS, 2015).

Jenny Chan n8738254
7
4.0 Analysis
4.1 Data cleaning and editing
The data was cleaned, issues with respondent data were resolved which some of the data sets
were removed and frequencies were checked to ensure that the data value were in range. Any
negative phrased items were reversed and the construct values were determined for each
respondent is to average the data across with their relevant items.
4.2 Descriptive Data
Table 1: Descriptive Statistics
* N Minimum Maximum Mean Std.
Deviation
ATTC 741 1.00 7.00 5.1109 1.18821
RA 741 1.50 7.00 4.6736 .94368
PC 741 1.50 7.00 4.9312 .96492
IMP 741 1.00 7.00 3.7038 1.16682
VS 741 1.86 6.43 4.5024 .74788
CS 741 2.43 7.00 4.7777 .79270
MAT 741 1.17 7.00 4.7665 .95731
Valid N
(listwise)
741
Table 1 show that the mean has the highest is PC at 4.9312 and the lowest is IMP at 3.7038.
However, the ATTC mean is higher at 5.1109 which the range is different to the other
variable constructs.
Figure 1: Age cohort
* Frequency Percent Valid Percent Cumulative
Percent
Valid Younger 370 49.9 49.9 49.9
Older 371 50.1 50.1 100.0
Total 741 100.0 100.0

Jenny Chan n8738254
8
Figure 1 demonstrates there were similar numbers of respondents in each age cohort.
Figure 2: What is your gender?
* Frequency Percent Valid Percent Cumulative
Percent
Valid Male 419 56.5 56.5 56.5
Female 322 43.5 43.5 100.0
Total 741 100.0 100.0
The figure 2 explains the male is slightly more than female in the sample.
Figure 3: What is your relationship status?
* Frequency Percent Valid Percent Cumulative
Percent
Valid Single 263 35.5 35.5 35.5
Partnered 478 64.5 64.5 100.0
Total 741 100.0 100.0
Figure 3 shows that the number of partnered has more respondents than single who shop
online.
Figure 4: Which method of online communication do you use more frequently?
* Frequency Percent Valid Percent Cumulative
Percent
Valid Email 368 49.7 49.7 49.7
Instant
messaging
(online chat)
373 50.3 50.3 100.0
Total 741 100.0 100.0
Figure 4 explains that the two figures quite familiar, in figure 4 demonstrates respondents
prefer to instant messaging (online chat) than email.

Jenny Chan n8738254
9
Figure 5: What is your gender? Age Cohort Crosstabulation
* Age Cohort Total
Younger Older
What is your gender Male 209 210 419
Female 161 161 322
Total 370 371 741
The figure 5 explains relatively the age is split between genders.
Figure 6: What is your relationship status? Age Cohort Crosstabulation
* Age Cohort Total
Younger Older
What is your relationship
status?
Single 222 41 263
Partnered 148 330 478
Total 370 371 741
Figure 6 shows that the younger group is more single and older group is more partnered.
Figure 7: Which method of online communication do you more frequently use? Age Cohort
Crosstabulation
* Age Cohort Total
Younger Older
Which online communication
do you more frequently use?
Email 75 293 368
Instant
messaging
(online chat)
295 78 373
Total 370 371 741

Jenny Chan n8738254
10
Figure 7 is explain that the older group prefer email and compare to younger group prefer
instant messaging (online chat).
In figure 8 the graph shows the highest frequency of ages from to 18 to 23 years and whilst
the frequency of ages is relatively similar.
4.3 Analysis for Objective 1
Figure 9: Age Cohort group
* Age Cohort N Mean Std.
Deviation
Std. Error
Mean
ATTC Younger 370 5.5319 1.00000 .05199
Older 371 4.6911 1.21344 .06300
In figure 9 is that the table for older cohort has the highest mean at 5.5319 attitudes toward
online shopping than younger cohort at 4.6911.
Figure 10: t-test on Age Cohort
0
10
20
30
40
50
60
70
Freq
uen
cy
Ages
Figure 8: Frequency of Ages

Jenny Chan n8738254
11
Levene’s test
for equality
of variance
t-test for equality of means
f Sig. t df Sig.
(2
tailed)
Mean
difference
Std error
difference
95% confidence
interval of the
difference
Lower Upper
ATTC Equal
variances
assumed
Equal
variances
not
assumed
18.851 .000 10.291 739 .000 .84079 .08170 .68039 1.00118
10.294 713.663 .000 .84079 .08168 .68043 1.00115
In figure 10 is assuming equal variance, a t-test showed that the difference between younger
and older cohort is that the t-test is significant at .000 which it is below 0.05. This indicates
that the means difference for younger and older cohort.
Figure 11: Gender group
* What is your
gender?
N Mean Std.
Deviation
Std. Error
Mean
ATTC Male 419 5.1499 1.8736 .05801
Female 322 5.0602 1.8924 .06627
Figure 11 is that the male has the highest mean at 5.1499, while the mean attitude towards
online shopping for female was 5.0602.
Figure 12: t-test on Gender
Levene’s test
for equality
of variance
t-test for equality of means

Jenny Chan n8738254
12
f Sig. t df Sig.
(2
tailed)
Mean
difference
Std error
difference
95% confidence
interval of the
difference
Lower Upper
ATTC Equal
variances
assumed
Equal
variances
not
assumed
.046 .831 1.018 739 .309 .08963 .08806 -
.08324
.26250
1.018 690.159 .309 .08963 .08806 -
.08329
.29256
The figure 12 assuming equal variance that the t-test showed that the difference the means for
male and female was not significant at .309. This indicates that the .309 is higher than 0.05
meaning there is no significant difference between male and female.
4.4 Analysis for Objective 2
4.4.1 Correlation
Table 2: Individual Characteristics
Price Consciousness Pearson Correlation
Sig. (2-tailed)
N
.024
.512
741
Convenience Seeking Pearson Correlation
Sig. (2-tailed)
N
.321**
.000
741
*Correlation is significant at the 0.05 level (2-tailed).
**Correlation is significant at the 0.01 level (2-tailed).
Correlation is measure of the relationship between two variables showed the result that it is a
moderate positive significant of price consciousness and convenience seeking which it is
indicates as attitude toward online retail shopping.

Jenny Chan n8738254
13
4.4.2 Regression
Figure 13: Price consciousness model summary
Model* R R Square Adjusted R
Square
Std. Error of the
Estimate
1 .024ᵃ .001 -.001 1.18867
a. Predictors: (Constant), PC
Figure 13 shows that the R indicates correlation between predicted values and observed data
is .024². R square is the proportion of the variance in the dependent variable explained by the
regression equation which it is .001 and the adjusted R Square is the value at -.001 which
means it is 1% of the dependent variable by the model.
Figure 14: Price Consciousness Coefficients Regression
Model*
Unstandardized Coefficients Standardized
Coefficients
t Sig. B Std. Error Beta
1 (Constant) 4.965 .228
0.24
21.818 .000
PC .030 0.45 .656 .512
a. Dependent Variables: ATTC
Figure 14 display that the individual characteristic of price consciousness is significant of
dependent variable of 0.24 and to predict the estimate of a person’s attitude toward online
shopping to give the good estimate for the ATTC. The predict estimate is 3 x 4.965+0.30=
15.195. The predict estimate is 15.195.
Figure 15: Convenience Seeking Model Summary
Model* R R Square Adjusted R
Square
Std. Error of the
Estimate
1 .321ᵃ .103 .102 1.12604
a. Predictors: (Constant), CS

Jenny Chan n8738254
14
Figure 15 for R is indicates that the correlation of the values and observed data is .321. The
proportion of R Square of the variance in the dependent variable regression equation is .103
and the adjusted R Square is the value at .102 which means it is 1.02%.
Figure 16: Convenience Seeking Coefficients Regression
Model*
Unstandardized Coefficients Standardized
Coefficients
t Sig. B Std. Error Beta
1 (Constant) 2.811 .253
.321
11.117 .000
CS .481 .052 9.217 .000
a. Dependent Variable: ATTC
Figure 16 show that the individual characteristic of convenience seeking is significant of .321
which it is below 0.05 to predict the estimate of a person’s attitude toward online shopping to
give the estimate for ATTC. The predict equation is 2 x .481+2.811= 3.773. The predict
estimate is 3.773.
5.0 Discussion and Recommendations
5.1 Objective 1
The objective 1 is to examine on the different population of the age cohort and gender
variables if attitudes toward online retail shopping differ across population segments on two
segmentation variables are age cohort and gender. In figure 9 and 11 shows that the males
and female have different behaviour attitudes toward online shopping, therefore that male in
older cohort have the most population. Figure 10 and 12 have the equal variance for gender
and age cohort. The recommendation is that the two segmentations variables is to have male
and female similar result with their behaviour towards shopping online.
5.1 Objective 2
The objective 2 is to determine the impact of individual characteristics on attitudes toward
online retail shopping based on two individual characteristics variables are price
consciousness and convenience seeking (appendix 8.1). The behaviour of the two variables
behaviour in table 2 for the correlation show that the attitude is moderate positive and the
regression in figure 14 and 16 is the coefficient with their attitude of how it is convenience

Jenny Chan n8738254
15
and the price for online shopping. The recommendation for the two variables for correlation
and the regression to make strong positive instead of moderate positive with their attitudes
toward online shopping.
6.0 Limitations
In figure 8 Frequency of Ages demonstrates is that the 18 to 23 years has the highest
frequency and compare to 31 to 38 years old has the lowest frequency. Whilst the frequency
of ages is that the sample is not representative which it is impacts on the accuracy and
generalisability of the result. Random sampling error result may occur through statistical
fluctuation due of chance variation (Zikmund, et al, 2011, p329). To improve the random
sampling error by using the sample frame which relate to the target population to subset the
list of infeasible is highly of how representative the subset (Zikumnd et al, 2014, p349).
Interviewer cheating occurs when an interviewer falsifies the entire questionnaires or filled in
the answers to intentionally skipped (Zikumnd, et al, 2014, p133). To improve for the future
research by telling the interviewers with a small number of respondents will be called back to
confirm whether the survey was conducted (Zikumd et al. 2011, p 133).

Jenny Chan n8738254
16
7.0 References
AMSRS. (2015) Code of Professional Behaviour. Retrieved from
http://www.amsrs.com.au/documents/item/194
Malhotra, N., Hall, J., Shaw, M., & Oppenheim, P. (2006). Marketing Research: An
applied orientation (3rd
ed). French Forest, New South Wales: Pearson Australia.
QUT. (2016). D/2.6 QUT Code of Conduct for Research. Retrieved from Queensland
University of Technology: http://www.mopp.qut.edu.au/D/D_02_06.jsp
Wilson, A. (2003). Marketing Research. An Integrated Approach. Harlow, England, Pearson.
Zikmund, W., D'Alessandro, S., Winzar, H., Lowe, B., & Babin, B. (2014). Marketing
Research (3rd
ed). South Melbourne, Victoria: Cengage Learning Australia.
Zikmund, W.G., Ward, S., Lowe, B., Winzar, H., & Babin, B. J. (2011). Marketing
Research (2nd
ed.). South Melbourne, Victoria: Cengage Learning.

Jenny Chan n8738254
17
8.0 Appendices
8.1 Objective 2 definition for two variables
Convenience Seeking – refers to searching for ways of achieving tasks with minimal
difficulty
1. I hate to spend time gathering information on products
2. I do not like complicated things
3. It is convenient to shop from home
4. It is important to me that I can shop anytime I choose
5. It is important to me that I can shop no matter where I am
6. The ability to quickly compare products is important to me
7. When shopping, I like to find what I want quickly
Price consciousness – refers to having a vigilance for difference in price among available
options and avoiding those purchases that are too expensive.
1. I usually buy the cheapest product available
2. I usually purchase items on sale
3. I often find myself checking prices
4. A person can save a lot of money by shopping for bargains
8.2 Surveys