Embed Size (px)
Citation preview

MARYLAND DEPARTMENT OF THE ENVIRONMENT 1800 Washington Boulevard | Baltimore, MD 21230 | www.mde.maryland.gov
410-537-3000 | 800-633-6101 | TTY Users: 800-735-2258 Lawrence J. Hogan, Jr., Governor | Boyd K. Rutherford, Lt. Governor
Ben Grumbles, Secretary
DEPARTMENT OF THE ENVIRONMENT
AMBIENT AIR MONITORING NETWORK PLAN for CALENDAR YEAR 2022
Prepared for: U.S. Environmental Protection Agency
Prepared by:
Ambient Air Monitoring Program Air and Radiation Administration
Maryland Department of the Environment
March 17, 2021

Ambient Air Monitoring Network Plan for Calendar Year 2022 2
This page is intentionally blank.

Ambient Air Monitoring Network Plan for Calendar Year 2022 3
TABLE OF CONTENTS Section Page
1. INTRODUCTION ..................................................................................................................8
2. REQUIREMENTS FOR MONITORING NETWORK DESCRIPTIONS .........................12
3. MARYLAND AIR MONITORING NETWORK ...............................................................13 3.1 General Network Information .....................................................................................17
4. SPECIFIC POLLUTANT NETWORK DESCRIPTIONS AND REQUIREMENTS ........28 4.1 Carbon Monoxide (CO) – General Description and Sampling Method .....................28
4.1.1 Monitoring Requirements ...............................................................................29 4.1.2 Sources ...........................................................................................................29 4.1.3 Changes Planned for 2021-2022 ....................................................................29
4.2 Lead (Pb) – General Description and Sampling Method ............................................30 4.2.1 Monitoring Requirements ...............................................................................30 4.2.2 Sources ...........................................................................................................30 4.2.3 Changes Planned for 2021-2022 ....................................................................30
4.3 Nitrogen Dioxide (NO2) – General Description and Sampling Method ....................31 4.3.1 Monitoring Requirements ...............................................................................31 4.3.2 Sources ...........................................................................................................33 4.3.3 Changes Planned for 2021-2022 ....................................................................33
4.4 Ozone (O3) – General Description and Sampling Method .........................................34 4.4.1 Monitoring Requirements ...............................................................................34 4.4.2 Sources ...........................................................................................................36 4.4.3 Changes Planned for 2021-2022 ....................................................................36
4.5 Particulate Matter (PM10) – General Description and Sampling Method ..................38 4.5.1 Monitoring Requirements ...............................................................................38 4.5.2 Sources ...........................................................................................................39 4.5.3 Changes Planned for 2021-2022 ....................................................................39
4.6 Fine Particulate Matter (PM2.5) – General Description and Sampling Method .........40 4.6.1 Monitoring Requirements ...............................................................................40 4.6.2 Sources ...........................................................................................................42 4.6.3 Applicability of FEM Data for Comparison to the NAAQS and
Reporting the AQI ..........................................................................................43 4.6.4 Changes Planned for 2021-2022 ....................................................................43
4.7 Sulfur Dioxide (SO2) – General Description and Sampling Method .........................44 4.7.1 Monitoring Requirements ...............................................................................46 4.7.2 Sources ...........................................................................................................46 4.7.3 Changes Planned for 2021-2022 ....................................................................47
4.8 Photochemical Assessment Monitoring Stations (PAMS) – General Description and Sampling Method ................................................................................................48 4.8.1 Monitoring Requirements and Locations for Revised PAMS
Monitoring Rule .............................................................................................50 4.8.2 Sources ...........................................................................................................51 4.8.3 Changes Planned for 2021-2022 ....................................................................51
Ambient Air Monitoring Network Plan for Calendar Year 2022 4
4.8.4 MDE Enhanced Monitoring Plan ...................................................................52 4.9 Air Toxics – General Description and Sampling Method ..........................................53
4.9.1 Monitoring Requirements ...............................................................................54 4.9.2 Monitoring Locations .....................................................................................54 4.9.3 Sources ...........................................................................................................54 4.9.4 Changes Planned for 2021-2022 ....................................................................54
4.10 NCore – General Description and Sampling Method .................................................55 4.10.1 Monitoring Requirements ...............................................................................56 4.10.2 Monitoring Locations .....................................................................................56 4.10.3 Sources ...........................................................................................................57 4.10.4 Changes Planned for 2021-2022 ....................................................................57
Appendix A – Topographic and Areal Maps and Site Descriptions of Air Monitoring Stations in Maryland Appendix B – EPA Approval Letter for Maryland Ambient Air Monitoring Network Plan for Calendar Year 2021 (dated October 14, 2020)
TABLE OF FIGURES Title Page
Figure 1-1 Map showing MSA's in Maryland. ..............................................................................10
Figure 3-1 Maryland's current air monitoring network map ..........................................................14
Figure 4-1 Maryland's CO monitoring network. ...........................................................................28
Figure 4-2 Maryland's NO2 monitoring network...........................................................................32
Figure 4-3 Maryland's O3 monitoring network. ............................................................................35
Figure 4-4 New Lake Montebello monitoring site. .......................................................................36
Figure 4-5 Maryland's PM10 monitoring network. ........................................................................39
Figure 4-6 Maryland's PM2.5 monitoring network. ........................................................................41
Figure 4-7 Maryland's SO2 monitoring network ...........................................................................44
Figure 4-8 Maryland's PAMS monitoring network. ......................................................................48
Figure 4-9 Maryland's Air Toxics monitoring network. ................................................................53
Figure 4-10 Maryland's NCore monitoring network. ....................................................................56

Ambient Air Monitoring Network Plan for Calendar Year 2022 5
TABLE OF TABLES Title Page
Table 1-1 Maryland’s MSA’s. Source: Maryland Dept. of Planning, 2012 estimates. ...................9
Table 3-1 General Information for Current Maryland Ambient Air Monitoring Sites ..................18
Table 3-2 Monitor Information for Current Maryland Ambient Air Monitoring Sites .................20
Table 3-3 Monitor Counts by Site (Cross-reference to Table 3-2) ................................................24
Table 3-4 Count of Meteorological Parameters Measured in the Maryland Network ..................25
Table 3-5 Monitoring Methods and AQS Codes used in the Maryland Ambient Air Monitoring Network ..........................................................................................................26
Table 3-6 Constituent Compounds and Species Measured in Maryland .......................................27
Table 4-1 CO Monitoring Requirements .......................................................................................29
Table 4-2 Lead Monitoring Requirements .....................................................................................30
Table 4-3 NO2 Monitoring Requirements .....................................................................................31
Table 4-4 Number of Ozone SLAMS Sites Required ...................................................................34
Table 4-5 Number of PM10 SLAMS Sites .....................................................................................38
Table 4-6 Number of PM2.5 SLAMS Sites Required .....................................................................40
Table 4-7 Monitor Objective Types and Scales Assigned to PM2.5 Monitors in Maryland ..........43
Table 4-8 Maryland's List of Sources Subject to the Final 1-hour SO2 Data Requirements Rule. ...................................................................................................................................45
Table 4-9 Minimum SO2 Monitoring Requirements .....................................................................46
On the cover: Rockville monitoring station Photo credit – Adam Reese

Ambient Air Monitoring Network Plan for Calendar Year 2022 6
ACRONYMS AND DEFINITIONS
AADT Annual Average Daily Traffic AQS Air Quality System AQS ID 9-digit site identification number in AQS database ARA MDE’s Air and Radiation Administration BAM Beta Attenuation [Mass] Monitor-for measuring continuous particulate matter CAA Clean Air Act CAAA Clean Air Act Amendments CAPS Cavity Attenuated Phase Shift (Direct NO2 method) CASTNET Clean Air Status and Trends Network CBSA Core Based Statistical Area CFR Code of Federal Regulations CSA Combined Statistical Area CSN Chemical Speciation Network CO Carbon Monoxide DRR Data Requirement Rule DPW Department of Public Works (Baltimore City) EGU Electrical Generating Unit EMP Enhanced Monitoring Plan EPA United States Environmental Protection Agency ERG Eastern Research Group, Research Triangle Park, NC (Carbonyls lab) FE-AADT Fleet Equivalent Annual Average Daily Traffic FEM Federal Equivalent Method-EPA approved method designated as equivalent to the
Federal Reference Method (FRM) for a specific pollutant to compared to the applicable NAAQS
FID Flame Ionization Detector FRM Federal Reference Method-EPA approved reference method necessary for a
specific pollutant to be compared to the applicable NAAQS GC Gas Chromatograph HAPS Hazardous Air Pollutants IMPROVE Interagency Monitoring of PROtected Visual Environments IR Infrared (radiation) MDE Maryland Department of the Environment MSA Metropolitan Statistical Area NAA Non-Attainment Area NAAQS National Ambient Air Quality Standards-used for determining attainment status NCore National Core multi-pollutant monitoring stations NEI National Emissions Inventory NESCAUM Northeast States for Coordinated Air Use Management nm Nanometer, measure of length; 1 nm equals 10-9 meter µm Micrometer, measure of length; 1 µm equals 10-6 meter NO Nitrogen Oxide NO2 Nitrogen Dioxide NOx Oxides of Nitrogen (ozone precursor) NOy Total Reactive Nitrogen Species (ozone precursor)

Ambient Air Monitoring Network Plan for Calendar Year 2022 7
O3 Ozone OAQPS EPA’s Office of Air Quality Planning & Standards PAMS Photochemical Assessment Monitoring Station Pb Lead PM2.5 Particulate matter with an aerodynamic diameter less than or equal to 2.5 µm PM10 Particulate matter with an aerodynamic diameter less than or equal to 10 µm PM10-2.5 Pronounced “PM coarse” - Particulate matter with an aerodynamic diameter less
than or equal to 10 µm minus particulate matter with an aerodynamic diameter less than or equal to 2.5 µm
PQAO Primary Quality Assurance Organization QA Quality Assurance QAPP Quality Assurance Project Plan SIP State Implementation Plan SLAMS State or Local Air Monitoring Stations SO2 Sulfur Dioxide SOP Standard Operating Procedure SPM Special Purpose Monitor STN PM2.5 Speciation Trends Network TSP Total suspended particulate UV Ultraviolet VOCs Volatile Organic Compounds

Ambient Air Monitoring Network Plan for Calendar Year 2022 8
1. INTRODUCTION
In 1970, Congress passed the Clean Air Act (CAA) that authorized the Environmental Protection Agency (EPA) to establish National Ambient Air Quality Standards (NAAQS) for pollutants shown to threaten human health and welfare. Primary standards were set according to criteria designed to protect public health, including an adequate margin of safety to protect sensitive populations such as children and asthmatics. Secondary standards were set according to criteria designed to protect public welfare (decreased visibility, damage to crops, vegetation, buildings, etc.). As part of the CAA, both local and state air quality agencies are required to maintain and operate ambient air quality monitoring networks.
The six pollutants that currently have NAAQS are: ozone (O3), carbon monoxide (CO), sulfur dioxide (SO2), nitrogen dioxide (NO2), particulate matter (PM2.5 and PM10), and lead (Pb). They are commonly called the "criteria" pollutants. When air quality does not meet the NAAQS for one of the criteria pollutants, the area is said to be in “non-attainment” with the NAAQS for that pollutant.
On October 26, 2015, EPA promulgated a rule (80 Fed. Reg. 65292) strengthening the primary and secondary NAAQS for ground-level ozone to 70 parts per billion (ppb), based on extensive scientific evidence about ozone’s effects on public health and welfare. The updated standards will improve public health protection, particularly for at-risk groups including children, older adults, people of all ages who have lung diseases such as asthma, and people who are active outdoors, especially outdoor workers. They also will improve the health of trees, plants, and ecosystems. On June 4, 2018, EPA promulgated a rule (83 Fed. Reg. 25776) establishing attainment designations for the strengthened 2015 primary and secondary NAAQS for ozone. The following Maryland counties have been designated Marginal Nonattainment: Anne Arundel, Carroll, Harford, Howard, Cecil, Calvert, Charles, Frederick, Montgomery, Prince George’s, Baltimore County, and the City of Baltimore. All other Maryland counties have been designated Attainment/Unclassifiable.
On December 16, 2014, EPA approved Maryland's request to re-designate the Baltimore Non-attainment Area to “Attainment” for the 1997 annual PM2.5 NAAQS. This Area also attains the 2008 PM2.5 annual standard and continues to attain that standard. The Baltimore Attainment Area includes the following: Anne Arundel, Baltimore, Carroll, Harford, and Howard Counties, and Baltimore City.
Ambient Air Monitoring Network Plan for Calendar Year 2022 9
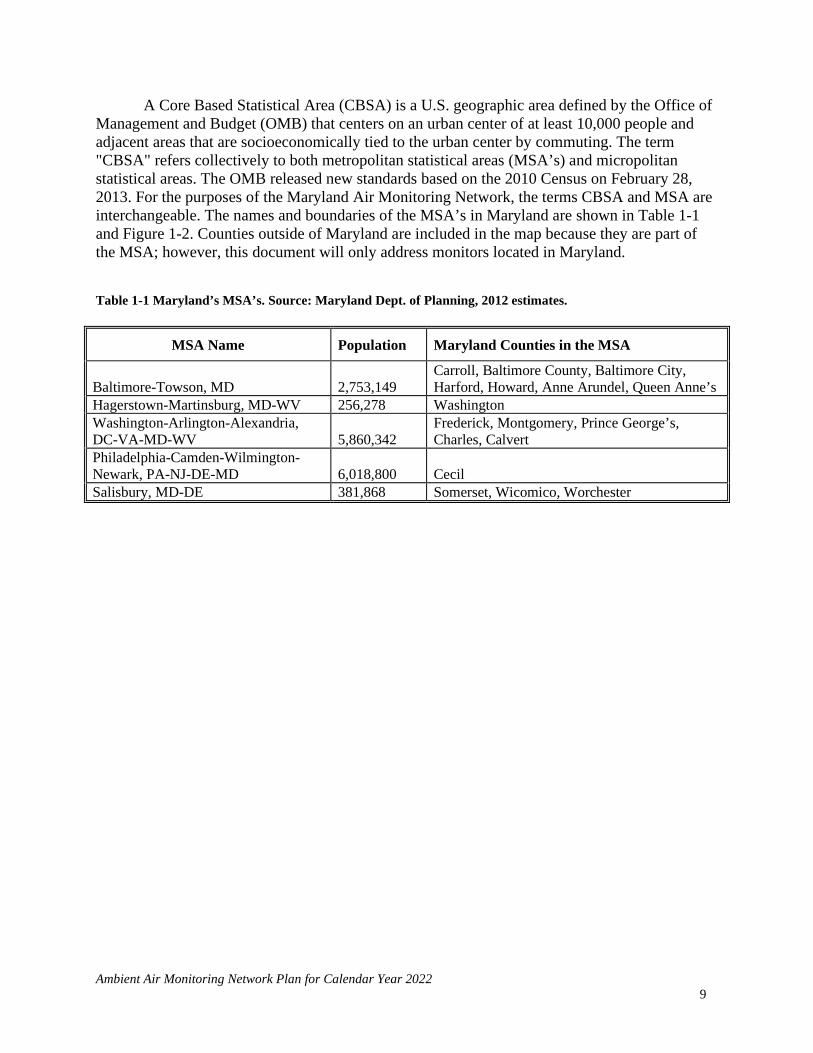
A Core Based Statistical Area (CBSA) is a U.S. geographic area defined by the Office of Management and Budget (OMB) that centers on an urban center of at least 10,000 people and adjacent areas that are socioeconomically tied to the urban center by commuting. The term "CBSA" refers collectively to both metropolitan statistical areas (MSA’s) and micropolitan statistical areas. The OMB released new standards based on the 2010 Census on February 28, 2013. For the purposes of the Maryland Air Monitoring Network, the terms CBSA and MSA are interchangeable. The names and boundaries of the MSA’s in Maryland are shown in Table 1-1 and Figure 1-2. Counties outside of Maryland are included in the map because they are part of the MSA; however, this document will only address monitors located in Maryland.
Table 1-1 Maryland’s MSA’s. Source: Maryland Dept. of Planning, 2012 estimates.
MSA Name Population Maryland Counties in the MSA
Baltimore-Towson, MD 2,753,149 Carroll, Baltimore County, Baltimore City, Harford, Howard, Anne Arundel, Queen Anne’s
Hagerstown-Martinsburg, MD-WV 256,278 Washington Washington-Arlington-Alexandria, DC-VA-MD-WV 5,860,342
Frederick, Montgomery, Prince George’s, Charles, Calvert
Philadelphia-Camden-Wilmington-Newark, PA-NJ-DE-MD 6,018,800 Cecil Salisbury, MD-DE 381,868 Somerset, Wicomico, Worchester

Ambient Air Monitoring Network Plan for Calendar Year 2022 10
Figure 1-1 Map showing MSA's in Maryland.
The original EPA ozone precursor revisions to the air monitoring regulations (40 CFR
Part 58) required by Title 1, Section 182 of the 1990 Clean Air Act Amendments (CAAA) were promulgated on February 12, 1993. The CAAA requires that the States incorporate enhanced monitoring for ozone, speciated volatile organic compounds (VOC’s), oxides of nitrogen (NOx), carbonyls, and surface as well as upper air meteorological parameters (MET) into their State Implementation Plan (SIP). The Part 58 regulations refer to these enhanced monitoring stations as photochemical assessment monitoring stations (PAMS). The PAMS monitoring rules were revised along with the new 2015 ozone NAAQS in 2015. The final rule streamlines and modernizes the PAMS network to use monitoring resources most efficiently. States are required to comply with revised PAMS monitoring by June 1, 2021. There are no ambient standards for any of the VOC’s.

Ambient Air Monitoring Network Plan for Calendar Year 2022 11
Section 112 of the CAA currently identifies 187 hazardous air pollutants (HAPS), also referred to as air toxics, and requires EPA to regulate facilities that emit one or more of these air toxics. EPA Region III has developed a Cooperative Air Toxics Monitoring Program, and MDE operates several air toxics sites as part of the program. MDE also provides analytical support for other sampling sites in EPA Region III.
As part of the CAA, states are required to submit an annual network plan to the U.S. EPA
for review and approval. Since 2007, EPA has required State and Local Air Pollution Control Agencies to make this plan available for public inspection at least thirty days prior to formal submission to EPA.
MDE is also required to certify the air quality monitoring data by May 1 for the previous
calendar year’s data. MDE’s 2020 air quality monitoring data were certified on March 25, 2021.

Ambient Air Monitoring Network Plan for Calendar Year 2022 12
2. REQUIREMENTS FOR MONITORING NETWORK DESCRIPTIONS
In October 2006, the U.S. EPA issued final regulations concerning state and local agency ambient air monitoring networks. These regulations require an annual monitoring network plan that includes the information described below. The annual monitoring network plan as described in §58.10 must contain the following information for existing and proposed sites:
• The Air Quality System (AQS) site identification number
• The location, including street address and geographical coordinates
• The sampling and analysis method(s) for each measured parameter
• The operating schedules for each monitor
• Any proposals to remove or move a monitoring station within a period of 18 months following plan submittal
• The identification of sites that are suitable and sites that are non-suitable for comparison against the annual PM2.5 NAAQS as described in §58.30
• The monitoring objective and spatial representative scale for each monitor
• The Metropolitan Statistical Area (MSA), Core Based Statistical Area (CBSA), Combined Statistical Area (CSA) or other area represented by the monitor

Ambient Air Monitoring Network Plan for Calendar Year 2022 13
3. MARYLAND AIR MONITORING NETWORK Maryland currently operates 24 air monitoring sites around the state that measure ground-
level concentrations of criteria pollutants, air toxics, meteorological parameters, and research-oriented parameters (Tables 3-1 and 3-2). This total includes two ‘Haze Cams’, cameras exclusively used to monitor visibility, and one IMPROVE network monitor. The IMPROVE (Interagency Monitoring of Protected Visual Environments) network monitor is operated near the Piney Run monitoring station (Figure 3-1). The IMPROVE network monitors measure PM2.5, PM10, PM10-2.5, and speciated PM2.5.
In support of the SO2 Data Requirements Rule (DRR), three SO2 monitors were deployed in January 2017 by Verso Luke Paper Mill in western Maryland (for details, please see MDE’s 2021 Air Monitoring Network Plan). These sites were being operated by AECOM, under contract to Verso Luke Mill. MDE was the Primary Quality Assurance Organization (PQAO) for these sites, which included performing annual instrument audits and reporting the data to AQS. The paper mill shut down operations in May 2019, and Verso instructed their contractor to remove the monitoring equipment on June 8, 2020. Verso Luke Mill subsequently surrendered their Permit to Operate. No further monitoring at this location is planned.
Although monitoring takes place statewide, most of the stations are concentrated in the urban/industrial areas that have the highest population and number of pollutant sources. This network is maintained and operated by the Ambient Air Monitoring Program, Air and Radiation Administration (ARA), Maryland Department of the Environment (MDE). A comprehensive air monitoring network map is shown in Fig 3-1. Pollutant-specific network maps are included in each section. Additional topographic and area maps and site descriptions are provided in Appendix A.

Ambient Air Monitoring Network Plan for Calendar Year 2022 14
Figure 3-1 Maryland's current air monitoring network map

Ambient Air Monitoring Network Plan for Calendar Year 2022 15
In addition to the ambient air monitoring stations operated and quality assured by MDE, two CASTNET sites are located in Maryland: Blackwater National Wildlife Refuge and Beltsville (Figure 3-1). CASTNET, the Clean Air Status and Trends Network, is a long-term environmental monitoring network with 90 sites located throughout the US and Canada. The sites are managed and operated by EPA’s Clean Air Markets Division (CAMD) in cooperation with the National Parks Service (NPS) and other federal, state, and local partners. The network was established under the 1991 Clean Air Act Amendments (CAAA) to assess trends in acidic deposition due to emission reduction programs, such as the Acid Rain Program, NOx Budget Trading Program, and the Clean Air Interstate Rule (CAIR). CASTNET measures ambient concentrations of sulfur and nitrogen species as well as rural ozone concentrations. Results from CASTNET are used to report on geographic patterns and temporal trends in acidic pollutants, deposition, and regional ozone concentrations.
Maryland’s 2021 Annual Network Plan was approved by EPA on October 14, 2020 (see Appendix B.) The 2022 Network Plan continues some of the changes begun in previous years’ plans, reflecting a shift in monitoring emphasis, with some pollutants becoming less of a concern and others becoming a higher priority. Detailed explanations of these proposals can be found in the “Changes Proposed” sections for the individual pollutants. This plan includes proposals for the following changes:
• Discontinue monitoring for SO2 at Riviera Beach. In 2016, the EPA designated portions of Anne Arundel County and Baltimore County as non-attainment for the 2010 1-hour SO2 NAAQS. This designation was based on modeled, not monitored, SO2 concentrations. In order to better evaluate actual ambient SO2 concentrations, a source-oriented SO2 monitor was established at Riviera Beach Elementary School as a Special Purpose Monitor on January 12, 2018. Over three years of operation, the SO2 concentrations measured at this site have never exceeded the 1-hour standard (75 ppb). The preliminary 2020 Design Value is 24 ppb, less than 33% of the Standard. As of June 1, 2020, one of the Wagner Units at the Fort Smallwood Complex has been removed from supplying electricity to the grid and fuel switched from coal to natural gas. It is only permitted to operate to supply heat to the plant when necessary. Effective under a consent order as of January 1, 2021, the other Wagner and Brandon Shores Units at the complex have had many emissions and operational limits imposed and will cease combustion of coal by 2026. For these reasons MDE proposes to terminate SO2 monitoring at Riviera Beach at the end of 2021.
• Consolidation of Furley and Oldtown stations, located in Baltimore City, to one comprehensive site, to be located at 3900 Hillen Road at the Lake Montebello Water Filtration Plant in Baltimore City. Monitoring at this station will include ozone, air toxics, NO2, PM2.5, and PM10. Approval for this move and consolidation was granted by EPA Region III. MDE is currently negotiating terms of an access agreement and electrical installation at the site with the Baltimore City Department of Public Works (DPW). We hope to have the new site operational by Spring 2021. Since ozone season begins March 1 in Maryland, the ozone monitor at Furley will run until the shelter at Lake Montebello is ready. The move will be carefully coordinated to minimize instrument down time.

Ambient Air Monitoring Network Plan for Calendar Year 2022 16
• Fair Hill monitoring station is required to move. The Maryland Department of Natural Resources owns the property where our Fair Hill monitoring station is located, and they required us to move the shelter. The new Fair Hill air monitoring station location was approved by EPA Region III on Feb 4, 2021. The shelter move will occur during the 2021 Ozone Season and will be carefully planned to minimize down time. The new location is approximately 440 meters to the west of the original location, and situated about 24 meters north of Rt. 273, Telegraph Road. The shelter will continue to be used to measure regional transport of ozone at the urban measurement scale, and general/background PM2.5 at the regional scale, in a rural setting. Please see Figure A-10, the area map in Appendix A for more information.

Ambient Air Monitoring Network Plan for Calendar Year 2022 17
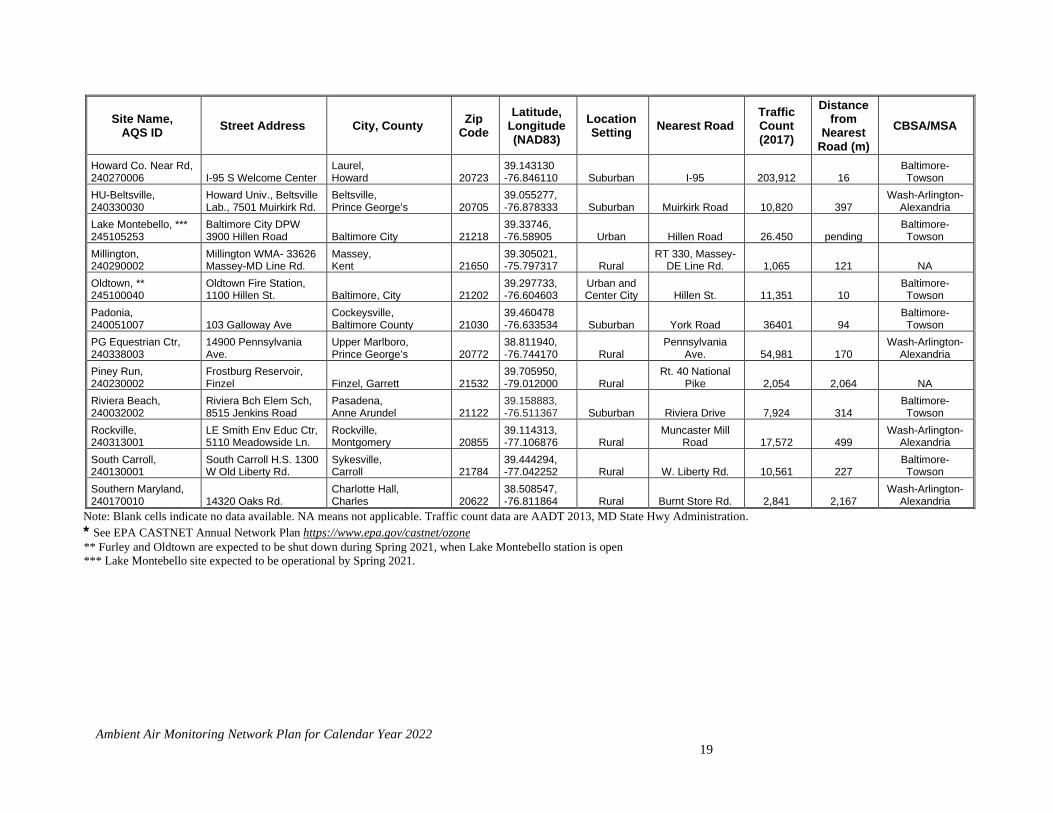
3.1 General Network Information The following tables include information required as part of the monitoring network
description. General information (e.g. site name, AQS identification number, latitude, longitude, etc.) can be found in Table 3-1. Specific information related to each parameter measured at air monitoring sites is given in Tables 3-2 and 3-3. Meteorological parameters measured are included in Table 3-4. Monitoring method descriptions can be found in Table 3-5. Parameters measured as part of the air toxics, PAMS, IMPROVE, and speciated PM2.5 mass are listed in Table 3-6.

Ambient Air Monitoring Network Plan for Calendar Year 2022 18
Table 3-1 General Information for Current Maryland Ambient Air Monitoring Sites
Site Name, AQS ID Street Address City, County Zip
Code Latitude,
Longitude (NAD83)
Location Setting Nearest Road
Traffic Count (2017)
Distance from
Nearest Road (m)
CBSA/MSA
Aldino, 240259001 3538 Aldino Rd. Churchville, Harford 21028
39.563333, -76.203889 Suburban Aldino Rd. 1,411 156
Baltimore-Towson
Baltimore County Near Road 240050009 4380 Old Court Rd.
Pikesville, Baltimore County 21208
39.371679, -76.746814 Suburban I-695/I-795 190,812 20
Baltimore-Towson
Baltimore Haze Cam Raven Power, 1000 Brandon Shores Dr.
Curtis Bay, Anne Arundel 21226
39.181513, -76.537625 Urban NA NA NA NA
Beltsville CASTNET, 240339991 Powder Mill Rd. Laurel, Prince George’s 20708
39.0284, -76.8171 * * * * *
Blackwater NWR CASTNET, 240199991
Blackwater National Wildlife Refuge Cambridge, Dorchester 21613
38.445, -76.1114 * * * * *
Calvert, 240090011 350 Stafford Rd. Barstow, Calvert 20610
38.536722, -76.617194 Rural
Hallowing Pt. Rd. – Rt. 231 20,690 789
Wash-Arlington-Alexandria
Edgewood, 240251001
Edgewood Chemical Biological Center (APG), Waehli Rd. Edgewood, Harford 21010
39.410191, -76.296946 Rural Wise Rd. 4,532 210
Baltimore-Towson
Essex, 240053001 600 Dorsey Ave.
Essex, Baltimore County 21221
39.310833, -76.474444 Suburban Woodward Dr. 2,190 16
Baltimore-Towson
Fair Hill, 240150003
Fair Hill Natural Resource Mgmt. Area 4493 Telegraph Rd. Elkton, Cecil 21921
39.702982, -75.864771 Rural
Telegraph Rd. (RT 273) 8,173 24
Philadelphia-Camden-
Wilmington Frederick Airport, 240210037
180 E. Treatment Plant Rd. Frederick, Frederick 21701
39.422760, -77.375190 Suburban Monocacy Blvd. 11,923 809
Wash-Arlington-Alexandria
Frostburg Haze-Cam E. Garrett Co. Vol. Fire Dept. 401 Finzel Rd. Finzel, Garrett 21532
39.686467, -78.966917 Rural NA NA NA NA
Frostburg IMPROVE Frostburg Reservoir Finzel, Garrett 21532
39.705896, -79.012117 Rural
Rt. 40 National Pike 2,054 2,064 NA
Furley, ** 245100054
Furley Recreational Ctr. 4633 Furley Ave. Baltimore, City 21206
39.328807, -76.553075
Urban and Center City Sipple Ave. 2,465 110
Baltimore-Towson
Glen Burnie, 240031003
AA Co. Public Works 7409 Balt-Annap. Blvd.
Glen Burnie, Anne Arundel 21061
39.169533, -76.627933 Suburban
Baltimore-Annapolis Blvd. 17,725 89
Baltimore-Towson
Hagerstown, 240430009 18530 Roxbury Rd.
Hagerstown, Washington 21740
39.564178, -77.720244 Rural Sharpsburg Pike 9,161 910
Hagerstown-Martinsburg
Horn Point, 240190004
UMd Horn Point Lab 2020 Horns Point Rd
Cambridge, Dorchester 21613
38.587525, -76.141006 Rural Hudson Road 3,990 1,185
Cambridge (Micro)
Ambient Air Monitoring Network Plan for Calendar Year 2022 19
Site Name, AQS ID Street Address City, County Zip
Code Latitude,
Longitude (NAD83)
Location Setting Nearest Road
Traffic Count (2017)
Distance from
Nearest Road (m)
CBSA/MSA
Howard Co. Near Rd, 240270006 I-95 S Welcome Center
Laurel, Howard 20723
39.143130 -76.846110 Suburban I-95 203,912 16
Baltimore-Towson
HU-Beltsville, 240330030
Howard Univ., Beltsville Lab., 7501 Muirkirk Rd.
Beltsville, Prince George’s 20705
39.055277, -76.878333 Suburban Muirkirk Road 10,820 397
Wash-Arlington-Alexandria
Lake Montebello, *** 245105253
Baltimore City DPW 3900 Hillen Road Baltimore City 21218
39.33746, -76.58905 Urban Hillen Road 26.450 pending
Baltimore-Towson
Millington, 240290002
Millington WMA- 33626 Massey-MD Line Rd.
Massey, Kent 21650
39.305021, -75.797317 Rural
RT 330, Massey-DE Line Rd. 1,065 121 NA
Oldtown, ** 245100040
Oldtown Fire Station, 1100 Hillen St. Baltimore, City 21202
39.297733, -76.604603
Urban and Center City Hillen St. 11,351 10
Baltimore-Towson
Padonia, 240051007 103 Galloway Ave
Cockeysville, Baltimore County 21030
39.460478 -76.633534 Suburban York Road 36401 94
Baltimore-Towson
PG Equestrian Ctr, 240338003
14900 Pennsylvania Ave.
Upper Marlboro, Prince George’s 20772
38.811940, -76.744170 Rural
Pennsylvania Ave. 54,981 170
Wash-Arlington-Alexandria
Piney Run, 240230002
Frostburg Reservoir, Finzel Finzel, Garrett 21532
39.705950, -79.012000 Rural
Rt. 40 National Pike 2,054 2,064 NA
Riviera Beach, 240032002
Riviera Bch Elem Sch, 8515 Jenkins Road
Pasadena, Anne Arundel 21122
39.158883, -76.511367 Suburban Riviera Drive 7,924 314
Baltimore-Towson
Rockville, 240313001
LE Smith Env Educ Ctr, 5110 Meadowside Ln.
Rockville, Montgomery 20855
39.114313, -77.106876 Rural
Muncaster Mill Road 17,572 499
Wash-Arlington-Alexandria
South Carroll, 240130001
South Carroll H.S. 1300 W Old Liberty Rd.
Sykesville, Carroll 21784
39.444294, -77.042252 Rural W. Liberty Rd. 10,561 227
Baltimore-Towson
Southern Maryland, 240170010 14320 Oaks Rd.
Charlotte Hall, Charles 20622
38.508547, -76.811864 Rural Burnt Store Rd. 2,841 2,167
Wash-Arlington-Alexandria
Note: Blank cells indicate no data available. NA means not applicable. Traffic count data are AADT 2013, MD State Hwy Administration. * See EPA CASTNET Annual Network Plan https://www.epa.gov/castnet/ozone ** Furley and Oldtown are expected to be shut down during Spring 2021, when Lake Montebello station is open *** Lake Montebello site expected to be operational by Spring 2021.

Ambient Air Monitoring Network Plan for Calendar Year 2022 20
Table 3-2 Monitor Information for Current Maryland Ambient Air Monitoring Sites
Site Name & AQS ID Parameter Start Date
Method Code Pr
obe
Hei
ght
(m) Measurement
Scale Monitor Objective Monitor
Network/Type Sche
dule
Aldino, 240259001 Ozone (O3) 04/20/1990 047 4.4 Urban Highest Concentration SLAMS H, S
Baltimore County Near Road 240050009
Direct NO2 (CAPS) 01/01/2019 212 4.4 Microscale Source Oriented/Highest Conc SLAMS H
Baltimore Haze Cam Brandon Shores Visibility 04/01/2007 NA NA NA Public Notification NA NA
Beltsville CASTNET, 240339991
Ozone (O3) 04/01/2011 047 10 Regional Regional Transport CASTNET H
Sulfur Dioxide (SO2) 04/01/2011 560 10 Regional Highest Concentration CASTNET F Blackwater NWR CASTNET, 240199991 Ozone (O3) 01/01/2011 047 10 Regional Regional Transport CASTNET H
Calvert, 240090011 Ozone (O3) 04/01/2005 087 4.6 Urban Population Exposure SLAMS H, S
Edgewood, 240251001
Ozone (O3) 03/10/1980 047 4.5 Urban Highest Concentration SLAMS H, S
PM2.5 - Hourly 09/01/2011 170 5.1 Neighborhood Population Exposure SLAMS H
Essex, 240053001
Air Toxics 01/01/1990 150 4 Neighborhood Population Exposure Other 6
Carbon Monoxide (CO) 02/15/2006 593 4.4 Middle Highest Concentration SLAMS H
Direct NO2 (CAPS) 08/10/2017 212 4.4 Neighborhood Population Exposure SLAMS H
Nitric Oxide (NO) 11/16/2017 699 10 Neighborhood Maximum Precursor PAMS H
Reactive Oxides of Nitrogen (NOY) 11/16/2017 699 10 Neighborhood Maximum Precursor PAMS H
NOY - NO 11/16/2017 699 4.4 Neighborhood Maximum Precursor PAMS H
Ozone (O3) 01/01/1972 087 4.4 Neighborhood Highest Conc, Pop. Expos SLAMS H
PM2.5 - Local Conditions 01/01/1999 145 5.1 Neighborhood Population Exposure SLAMS 6
PM2.5 - Speciation 07/08/2004 812 5.0 Neighborhood Population Exposure Trends Speciation 3
Sulfur Dioxide (SO2) 07/01/2003 600 4.4 Neighborhood Highest Concentration SLAMS R
PAMS VOCS 01/01/1992 126, 142, 102* 4 Neighborhood Max Precursor, Highest Conc PAMS / SLAMS 6;
S:H,3 Fair Hill, 240150003
Ozone (O3) 01/01/1992 087 4.5 Urban Regional Transport SLAMS H, S PM2.5 - Hourly 07/01/2010 170 4.7 Neighborhood Population Exposure SLAMS H
Frederick Airport, 240210037 Ozone (O3) 07/09/1998 087 4.6 Urban Population Exposure SLAMS H, S

Ambient Air Monitoring Network Plan for Calendar Year 2022 21
Site Name & AQS ID Parameter Start Date
Method Code Pr
obe
Hei
ght
(m) Measurement
Scale Monitor Objective Monitor
Network/Type Sche
dule
Frostburg IMPROVE, 240239000 IMPROVE Parameters 03/01/2004 NA 4.0 Regional Public Notification NA 3
Frostburg Haze Cam Visibility 10/01/2005 NA NA NA Public Notification NA NA
Furley, 245100054 Ozone (O3) 08/20/2006 087 7.5 Neighborhood Population Exposure SLAMS H, S
Ozone (O3) 04/01/2016 087 5 Neighborhood Population Exposure SLAMS H, S
Glen Burnie, 240031003
PM10 - STP 08/22/2008 127 2.1 Neighborhood Population Exposure SLAMS 6
PM10 - STP 08/22/2008 127 2.1 Neighborhood Population Exposure QA-Collocated 6
Hagerstown, 240430009
Ozone (O3) 04/01/1999 087 4.6 Urban Highest Conc/ Population Exposure SLAMS H, S
PM2.5 - Hourly 07/01/2010 170 5.1 Urban Highest Conc SLAMS H
Horn Point, 240190004
Ozone (O3) 04/01/2012 087 4 Regional General/Background SLAMS H
PM2.5 - Hourly 04/01/2012 170 4 Regional General/Background SLAMS H
Sulfur Dioxide (SO2) 04/01/2012 600 4 Regional General/ Background SLAMS R
Howard County Near Road, 240270006
Air Toxics 04/01/2014 150 4 Microscale Source Oriented/Highest Conc SLAMS 6
Black Carbon 08/01/2015 894 4 Microscale Source Oriented/Highest Conc SPM H
Ultrafine Particle Counter 01/01/2017 173 4 Microscale Source Oriented/Highest Conc SPM H
Carbon Monoxide (CO) 04/01/2014 593 4 Middle Scale Source Oriented/Highest Conc SLAMS H
Nitric Oxide (NO) 04/01/2014 599 4 Microscale Source Oriented/Highest Conc SLAMS H
Nitrogen Dioxide (NO2) 04/01/2014 599 4 Microscale Source Oriented/Highest Conc SLAMS H
Oxides of Nitrogen (NOX) 04/01/2014 599 4 Microscale Source Oriented/Highest Conc SLAMS H
PM2.5 - Hourly 04/01/2014 170 4.5 Microscale Source Oriented/Highest Conc SLAMS H
HU-Beltsville, 240330030
Carbon Monoxide (CO) 01/01/2007 593 4.6 Urban General/Background SLAMS/NCore H
Air Toxics 05/05/2005 150 4 Neighborhood Population Exposure Other 6

Ambient Air Monitoring Network Plan for Calendar Year 2022 22
Site Name & AQS ID Parameter Start Date
Method Code Pr
obe
Hei
ght
(m) Measurement
Scale Monitor Objective Monitor
Network/Type Sche
dule
Direct NO2 (CAPS) 11/1/2019 212 4.6 Urban General/Background SLAMS/NCore H
Ozone (O3) 05/01/2005 087 4.6 Urban Highest Conc./ Population Exposure SLAMS/NCore H
PM2.5 Speciation 12/05/2004 812 4.6 Urban Population Exposure General/Background SLAMS/NCore 3
PM10 – STP 07/25/2010 127 4.6 Neighborhood Population Exposure SLAMS/NCore 3
PM10-2.5 - Local Conditions 07/25/2010 176 4.6 Neighborhood Population Exposure SLAMS/NCore 3
PM2.5 - Local Conditions 07/10/2004 145 4.6 Urban Population Exposure SLAMS/NCore 3
PM2.5 - Local Conditions 07/31/2010 145 4.6 Urban Population Exposure QA-Collocated 12
PM2.5 – Hourly 07/01/2010 170 4.5 Urban Population Exposure SLAMS/NCore H
Black Carbon 12/01/2007 894 4 NA NA SPM H
Sulfur Dioxide (SO2) 09/29/2006 560 4.6 Urban General/Background SLAMS/NCore R
VOCS 05/05/2005 126 4 Urban Upwind/Background Old PAMS/EMP 6; S: 3
Millington, 240290002
Ozone (O3) 06/19/1989 087 4.5 Urban Population Exposure SLAMS H, S
PM2.5 - Hourly 07/01/2010 170 5 Neighborhood Population Exposure SLAMS H
Oldtown, 245100040
Air Toxics 01/01/1990 150 4 Neighborhood Population Exposure Other 6
Nitric Oxide (NO) 01/01/1994 599 4.2 Middle Highest Concentration SLAMS H
Nitrogen Dioxide (NO2) 11/05/1981 599 4.4 Middle Highest Concentration SLAMS H
Oxides of Nitrogen (NOX) 01/01/1982 599 4.4 Middle Highest Concentration SLAMS H
PM10 – STP 01/01/2017 127 4.9 Middle Population Exposure SLAMS 6
PM2.5 - Local Conditions 01/01/1999 145 4.9 Middle Highest Concentration SLAMS 3
PM2.5 - Hourly 07/01/2010 170 5.1 Middle Highest Concentration SLAMS H
Padonia, 240051007
Ozone (O3) 01/01/1979 087 4.4 Neighborhood Population Exposure SLAMS H, S
PM2.5 - Hourly 01/01/2016 170 4.8 Neighborhood Population Exposure SLAMS H
PM2.5 - Local Conditions 01/01/1999 145 4.8 Neighborhood Population Exposure SLAMS 12
PG Equestrian Center, 240338003 Ozone (O3) 04/01/2002 087 4.4 Urban Population Exposure SLAMS H, S
Piney Run, 240230002
Carbon Monoxide (CO) 09/01/2007 593 4.4 Regional Regional Transport SLAMS/NCore H
Direct NO2 (CAPS) 07/12/2019 212 4.6 Regional Regional Transport SLAMS/NCore H

Ambient Air Monitoring Network Plan for Calendar Year 2022 23
Site Name & AQS ID Parameter Start Date
Method Code Pr
obe
Hei
ght
(m) Measurement
Scale Monitor Objective Monitor
Network/Type Sche
dule
Nitric Oxide (NO) 05/01/2004 699 10 Regional Regional Transport SLAMS/NCore H
NOY – NO 05/01/2004 699 10 Regional Regional Transport SLAMS/NCore H
Reactive Oxides of Nitrogen (NOY) 05/01/2004 699 10 Regional Regional Transport SLAMS/NCore H
Ozone (O3) 04/01/2004 087 4.4 Regional Regional Transport SLAMS/NCore H
PM2.5 – Hourly 07/01/2010 170 4.9 Regional Regional Transport SLAMS/NCore H
Sulfur Dioxide (SO2) 04/01/2004 600 4.6 Regional Population Exposure SLAMS/NCore R
Riviera Beach, 240032002 Sulfur Dioxide (SO2) 1/12/2018 060 4 Neighborhood Highest Concentration SLAMS R
Rockville, 240313001
Ozone (O3) 01/01/1980 087 4.6 Urban Population Exposure SLAMS H, S
PM2.5 - Hourly 07/01/2010 170 5.3 Neighborhood Population Exposure SLAMS H
South Carroll, 240130001 Ozone (O3) 07/14/1983 087 4.5 Urban Population Exposure SLAMS H, S
Southern Maryland, 240170010 Ozone (O3) 10/02/1984 087 4.6 Regional General Background SLAMS H, S
Sampling Schedule is coded as follows: 1 – every day, 2 – every 2 hours, 3 – every 3rd day, 6 - every 6th day, 12 – every 12th day, H – every hour, every day, R – both every hour and every five minutes every day, S – seasonally measured only. F means passive filter collected every 2 weeks. NA means not applicable for the cell. *Method Code 102 refers to carbonyl analyses performed by ERG.
Ambient Air Monitoring Network Plan for Calendar Year 2022 24
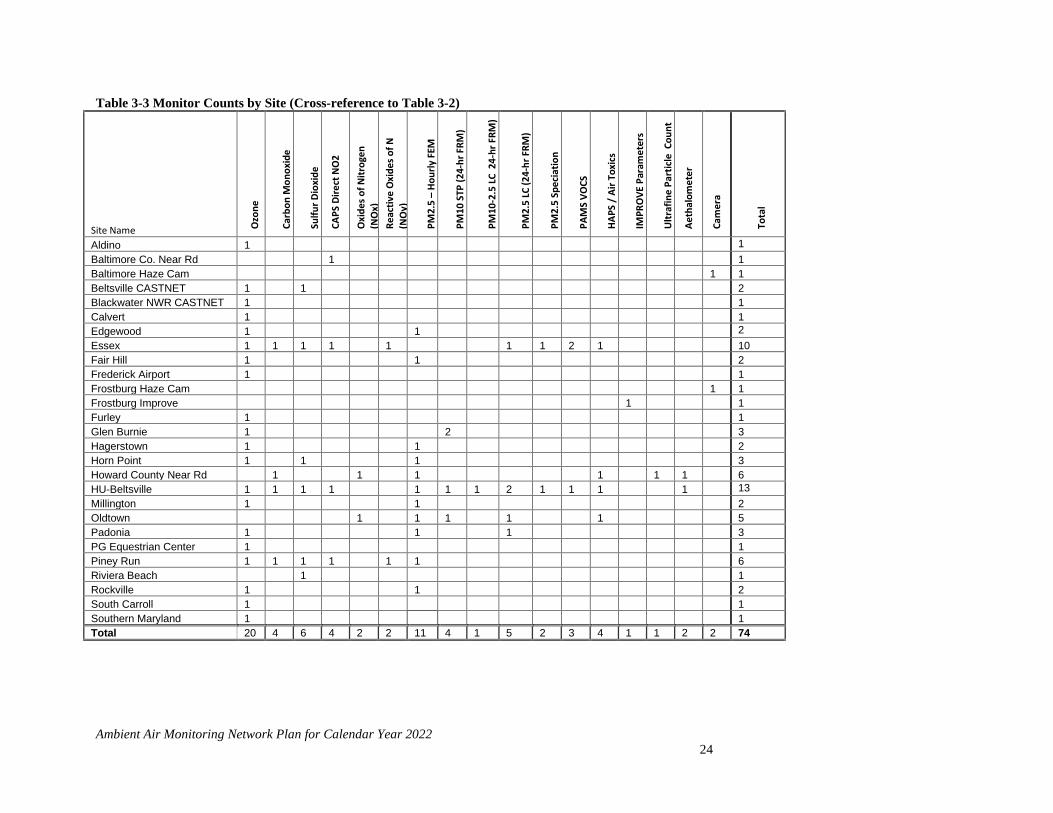
Table 3-3 Monitor Counts by Site (Cross-reference to Table 3-2)
Site Name Ozo
ne
Carb
on M
onox
ide
Sulfu
r Dio
xide
CAPS
Dire
ct N
O2
Oxi
des o
f Nitr
ogen
(N
Ox)
Re
activ
e O
xide
s of N
(N
Oy)
PM2.
5 –
Hour
ly F
EM
PM10
STP
(24-
hr F
RM)
PM10
-2.5
LC
24-
hr F
RM)
PM2.
5 LC
(24-
hr F
RM)
PM2.
5 Sp
ecia
tion
PAM
S VO
CS
HAPS
/ A
ir To
xics
IMPR
OVE
Par
amet
ers
Ultr
afin
e Pa
rtic
le C
ount
Aeth
alom
eter
Cam
era
Tota
l
Aldino 1 1 Baltimore Co. Near Rd 1 1
Baltimore Haze Cam 1 1 Beltsville CASTNET 1 1 2 Blackwater NWR CASTNET 1 1 Calvert 1 1 Edgewood 1 1 2
Essex 1 1 1 1 1 1 1 2 1 10 Fair Hill 1 1 2 Frederick Airport 1 1 Frostburg Haze Cam 1 1 Frostburg Improve 1 1 Furley 1 1 Glen Burnie 1 2 3 Hagerstown 1 1 2 Horn Point 1 1 1 3 Howard County Near Rd 1 1 1 1 1 1 6 HU-Beltsville 1 1 1 1 1 1 1 2 1 1 1 1 13
Millington 1 1 2 Oldtown 1 1 1 1 1 5 Padonia 1 1 1 3 PG Equestrian Center 1 1 Piney Run 1 1 1 1 1 1 6 Riviera Beach 1 1 Rockville 1 1 2 South Carroll 1 1 Southern Maryland 1 1 Total 20 4 6 4 2 2 11 4 1 5 2 3 4 1 1 2
2 74

Ambient Air Monitoring Network Plan for Calendar Year 2022 25
Table 3-4 Count of Meteorological Parameters Measured in the Maryland Network
AQS State County Site Local Site Name
Barometric Pressure-64101
Temp- 62101
Rain-65102
Relative Humidity-62201
Solar Radiation-63301
Ultraviolet Radiation-63302
Wind Direction-61104
Wind Speed-61103
Radar Wind
Profiler
Total
240259001 Aldino 1 1 1 1 1 1 6 240050009 Baltimore County Near Rd 1 1 1 1 1 1 6 240251001 Edgewood 1 1 1 1 1 1 6 240053001 Essex 1 1 1 1 1 1 1 1 8 240150003 Fair Hill 1 1 1 1 1 1 6 240031003 Glen Burnie 1 1 1 1 1 1 6 240430009 Hagerstown 1 1 1 1 1 1 6 240190004 Horn Point 1 1 1 1 1 1 1 7 240270006 Howard County Near Rd 1 1 1 1 1 1 6 240330030 HU-Beltsville 1 1 1 1 1 1 1 1 8 240290002 Millington 1 1 1 1 1 1 6 240051007 Padonia 1 1 1 1 1 1 6 240338003 PG Equestrian Center 1 1 1 1 1 1 6 240230002 Piney Run 1 1 1 1 1 1 1 1 8 240032002 Riviera Beach 1 1 1 1 1 1 6 240313001 Rockville 1 1 1 1 1 1 6 240130001 South Carroll 1 1 1 1 1 1 6 Total 17 17 17 17 3 1 17 17 3 109
Ambient Air Monitoring Network Plan for Calendar Year 2022 26
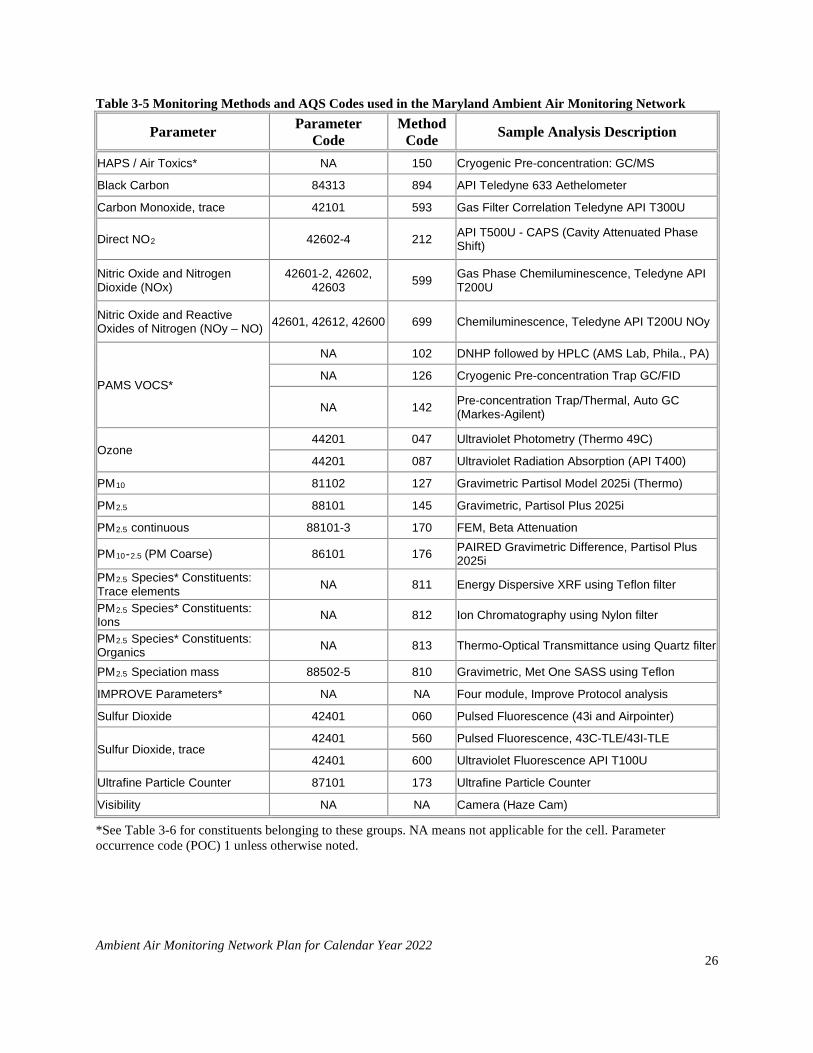
Table 3-5 Monitoring Methods and AQS Codes used in the Maryland Ambient Air Monitoring Network
Parameter Parameter Code
Method Code Sample Analysis Description
HAPS / Air Toxics* NA 150 Cryogenic Pre-concentration: GC/MS
Black Carbon 84313 894 API Teledyne 633 Aethelometer
Carbon Monoxide, trace 42101 593 Gas Filter Correlation Teledyne API T300U
Direct NO2 42602-4 212 API T500U - CAPS (Cavity Attenuated Phase Shift)
Nitric Oxide and Nitrogen Dioxide (NOx)
42601-2, 42602, 42603 599 Gas Phase Chemiluminescence, Teledyne API
T200U
Nitric Oxide and Reactive Oxides of Nitrogen (NOy – NO) 42601, 42612, 42600 699 Chemiluminescence, Teledyne API T200U NOy
PAMS VOCS*
NA 102 DNHP followed by HPLC (AMS Lab, Phila., PA)
NA 126 Cryogenic Pre-concentration Trap GC/FID
NA 142 Pre-concentration Trap/Thermal, Auto GC (Markes-Agilent)
Ozone 44201 047 Ultraviolet Photometry (Thermo 49C)
44201 087 Ultraviolet Radiation Absorption (API T400)
PM10 81102 127 Gravimetric Partisol Model 2025i (Thermo)
PM2.5 88101 145 Gravimetric, Partisol Plus 2025i
PM2.5 continuous 88101-3 170 FEM, Beta Attenuation
PM10-2.5 (PM Coarse) 86101 176 PAIRED Gravimetric Difference, Partisol Plus 2025i
PM2.5 Species* Constituents: Trace elements NA 811 Energy Dispersive XRF using Teflon filter
PM2.5 Species* Constituents: Ions NA 812 Ion Chromatography using Nylon filter
PM2.5 Species* Constituents: Organics NA 813 Thermo-Optical Transmittance using Quartz filter
PM2.5 Speciation mass 88502-5 810 Gravimetric, Met One SASS using Teflon
IMPROVE Parameters* NA NA Four module, Improve Protocol analysis
Sulfur Dioxide 42401 060 Pulsed Fluorescence (43i and Airpointer)
Sulfur Dioxide, trace 42401 560 Pulsed Fluorescence, 43C-TLE/43I-TLE
42401 600 Ultraviolet Fluorescence API T100U
Ultrafine Particle Counter 87101 173 Ultrafine Particle Counter
Visibility NA NA Camera (Haze Cam)
*See Table 3-6 for constituents belonging to these groups. NA means not applicable for the cell. Parameter occurrence code (POC) 1 unless otherwise noted.

Ambient Air Monitoring Network Plan for Calendar Year 2022 27
Table 3-6 Constituent Compounds and Species Measured in Maryland
CONSTITUENT GROUP COMPOUNDS IN THE CONSTITUENT GROUP
HAPS / Air Toxics
Dichlorodifluoromethane, Chloromethane, 1,2-Dichloro-1,1,2,2,tetrafluorolethane, Chloroethene, 1,3-Butadiene, Trichlorofluoromethane, Acrolein, Acetone, Methylene Chloride, 1,1,2-Trichloro-1,2,2-trifluoroethane, 2-methoxy-2-methyl-Propane, Hexane, Chloroform, Tetrahydrofuran, 1,2-Dichloroethane, 1,1,1-Trichloroethane, Benzene, Carbon tetrachloride, Cyclohexane, 1,2-Dichloropropane, Trichloroethene, Heptane, Cis-1,3-Dichloro-1-Propene, Trans-1,3-Dichloro-1-Propene, Toluene, 1,2-Dibromoethane, Tetrachloroethylene, Chlorobenzene, Ethylbenzene, m & p- Xylene, Styrene, 1,1,2,2-Tetrachloroethane, o-Xylene, 1-Ethyl-4-Methylbenzene, 1,3,5-Trimethylbenzene, 1,2,4-Trimethylbenzene, 1,4-Dichlorobenzene
IMPROVE Parameters
Air temperature, Aluminum, Ammonium ion, Ammonium Nitrate, Ammonium sulfate, Arsenic, Bromine, Calcium, Chloride, Chlorine, Chromium, Copper, Elemental carbon, Humidity, Hydrogen, Iron, Lead, Magnesium, Manganese, Molybdenum, Nickel, Nitrate, Nitrite, Organic carbon, Phosphorus, PM10, PM2.5, Potassium, Relative Humidity, Rubidium, Selenium, Silicon, Sodium, Strontium, Sulfate, Sulfur Dioxide, Sulfur, Titanium, Vanadium, Zinc, and Zirconium
PAMS VOC’s
Acetaldehyde, Acetone, Acrolein, Formaldehyde, Methyl Ethyl Ketone, Methyl Isobutyle Ketone, Propionaldehyde, Ethene, Ethyne, Ethane, Propene, Propane, Isobutane, 1-Butene, Butane, T-2-Butene, C-2-Butene, Isopentane, 1-Pentene, Pentane, Isoprene, T-2-Pentene, C-2-Pentene, 2,2-Dimethylbutane, Cyclopentane, 2,3-Dimethylbutane, 2-Methylpentane, 3-Methylpentane, 1-Hexene, Hexane, Methylcyclopentane, 2,4dimethylpentane, Benzene, Cyclohexane, 2-Methylhexane, 2,3dimethylpentane, 3-Methylhexane, 2,2,4tmpentane, Heptane, Methylcyclohexane, 2,3,4-Tmpentane, Toluene, 2-Methylheptane, 3-Methylheptane, Octane, Ethylbenzene, M&P-Xylene, Styrene, O-Xylene, Nonane, Isopropylbenzene, Propylbenzene, 1-Ethyl-3-Mbenzene, 1-Ethyl-4-Mbenzene, 135tmbenzene, 1-Ethyl-2-Mbenzene, 124tmbenzene, Decane, 1,2,3-Trimbenzene, M-Diethylbenzene, P-Diethylbenzene, Undecane, Dodecane, Total HC, PAMSHC, 1,3-Butadiene, Alpha-pinene, Beta-pinene
PM2.5 Chemical Species
Aluminum, Ammonium Ion, Antimony, Arsenic, Barium, Bromine, Cadmium, Calcium, Cerium, Cesium, Chloride, Chlorine, Chromium, Cobalt, Copper, Elemental Carbon, Indium, Iron, Lead, Magnesium, Manganese, Nickel, Organic Carbon, Phosphorus, Potassium, Potassium Ion, Rubidium, Selenium, Silicon, Silver, Sodium, Sodium Ion, Strontium, Sulfate, Sulfur, Tin, Titanium, Total Nitrate, Vanadium, Zinc, Zirconium

Ambient Air Monitoring Network Plan for Calendar Year 2022 28
4. SPECIFIC POLLUTANT NETWORK DESCRIPTIONS AND REQUIREMENTS
4.1 Carbon Monoxide (CO) – General Description and Sampling Method
Carbon monoxide is measured by infrared absorption photometry. Air is drawn continuously through a sample cell where infrared light passes through it. Carbon monoxide molecules in the air absorb part of the infrared light, reducing the intensity of the light reaching a light sensor. The light is converted into an electrical signal related to the concentration of carbon monoxide in the sample cell. The Maryland CO monitoring network is shown in Figure 4.1.
Figure 4-1 Maryland's CO monitoring network.

Ambient Air Monitoring Network Plan for Calendar Year 2022 29
4.1.1 Monitoring Requirements EPA revised the minimum monitoring requirements for CO on August 12, 2011. One CO
monitor is required to be collocated with a near-road NO2 in urban areas having a population of 1 million or more. MDE added a CO monitor to the near road NO2 monitoring site at the Interstate 95 South (I-95S) rest area between MD-32 and MD-216. This monitor began collecting data April 1, 2014. Operation of the existing CO sites in Maryland is required until MDE requests discontinuation of a site in the Annual Network Plan and the EPA Regional Administrator approves the request.
Table 4-1 CO Monitoring Requirements
Requirement Appendix D 40 CFR Part 58
Required in Maryland
Number of monitors active in Maryland
One CO monitor collocated with a Near Road NO2 monitor in an urban area with a population > 1 million
4.2.1 1 1
One CO monitor at each NCore site 3(b) 2 2 In addition to the three CO monitors referenced in the table above, Maryland operates a CO monitor at Essex, as part of the PAMS monitoring requirements. 4.1.2 Sources
CO is formed when carbon in fuel is not completely burned. The EPA estimates that approximately 60% of all CO emissions are from motor vehicle exhaust. Other sources include waste incinerators, wood stoves, furnaces, and some industrial processes. Concentrations are highest along heavily traveled highways and decrease significantly the further away the monitor is from traffic. Therefore, CO monitors are usually located close to roadways or in urban areas.
4.1.3 Changes Planned for 2021-2022
No changes planned.

Ambient Air Monitoring Network Plan for Calendar Year 2022 30
4.2 Lead (Pb) – General Description and Sampling Method Lead is collected by gravimetric PM10 samplers as described in Section 4.5; then the
filters are sent to a lab to be analyzed for lead by the x-ray fluorescence method. If a lead-PM10 monitor measures three-month average levels greater than or equal to 0.10 μg/m3, then MDE must install and operate a lead-TSP monitor within six months.
4.2.1 Monitoring Requirements The latest revision to the lead (Pb) NAAQS was finalized on October 15, 2008, lowering the primary and secondary standards from 1.5 µg/m3 to 0.15 µg/m3. Revisions to the lead monitoring regulations were finalized on December 27, 2010 as follows: Table 4-2 Lead Monitoring Requirements
Requirement Appendix D 40 CFR Part 58
Required in MD
Number in MD
One source-oriented SLAMS site located to measure the maximum Pb concentration resulting from each non-airport Pb source which emits 0.50 or more tons per year (tpy)
4.5(a) 0 0
One source-oriented SLAMS site located to measure the maximum Pb concentration resulting from airport which emits 1.0 or more tpy 4.5(a) 0 0
On March 28, 2016, EPA published 40 CFR Part 58 Revisions to Ambient Monitoring
Quality Assurance and Other Requirements; Final Rule. This rule revision eliminated the requirement in section 3 of appendix D to measure Pb at urban NCore sites either as Pb in Total Suspended Particles (Pb-TSP) or as Pb PM10. In order to discontinue Pb measurements at urban NCore sites, Part II.I Network Design Requirements of the publication states:
“With specific regard to Pb monitoring at urban NCore sites, monitoring agencies should request permission from the EPA Regional Administrator to discontinue non-source oriented monitoring following the collection of at least 3 years of complete data at each affected site.”
MDE terminated the Pb monitor at HU-Beltsville due to low concentrations (see the 2018 Monitoring Network Plan.)
4.2.2 Sources Pb is a metal found naturally in the environment as well as in manufactured products. The major sources of lead emissions have historically been motor vehicles and industrial sources. As a result of EPA's regulatory efforts to remove lead from gasoline, emissions of lead from the transportation sector dramatically declined by 95 percent between 1980 and 1999, and levels of lead in the air decreased by 94 percent between 1980 and 1999. Today, the highest levels of lead in air are usually found near lead smelters. Other stationary sources are waste incinerators, utilities, lead-acid battery manufacturers and general aviation airports. Soil can pick up lead from exterior paint, or other sources such as past use of leaded gas in cars. There are no sources in Maryland that emit more than ½ ton (1,000 pounds) of lead per year. 4.2.3 Changes Planned for 2021-2022
No changes planned.
Ambient Air Monitoring Network Plan for Calendar Year 2022 31
4.3 Nitrogen Dioxide (NO2) – General Description and Sampling Method
Nitrogen dioxide is produced during high-temperature burning of fuels. Sources include motor vehicles and stationary sources that burn fossil fuels such as power plants and industrial boilers. Until recently, it has only been possible to measure NO2 indirectly. First, nitrogen oxide (NO) is measured using the chemiluminescence reaction of nitric oxide (NO) with ozone (O3). Air is drawn into a reaction chamber where it is mixed with a high concentration of ozone from an internal ozone generator. Any NO in the air reacts with the ozone to produce NO2. Light emitted from this reaction is detected with a photomultiplier tube and converted to an electrical signal proportional to the NO concentration. Total nitrogen oxides (NOx) are measured by passing the air through a converter where any NO2 in the air is reduced to NO before the air is passed to the reaction chamber. By alternately passing the air directly to the reaction chamber, and through the converter before the reaction chamber, the analyzer alternately measures NO and NOx. The NO2 concentration is equal to the difference between NOx and NO. Reactive oxides of nitrogen (NOy) are measured in a similar manner to NOx, except that NO is measured by bypassing the converter. The combination of NO2 and NOz can be then determined by difference. This procedure is similar to the current methodology used to measure NOx, however, the converter temperature is higher in order to more completely convert NOz species, and the converter has been moved to very near the sample inlet to avoid line losses of “sticky” NOy species such as HNO3. Direct NO2 monitoring using cavity-attenuated phase shift (CAPS) technology has been deployed to the Baltimore County Near Road, Essex, HU-Beltsville, and Piney Run sites. CAPS NO2 monitors provide a direct absorption measurement of nitrogen dioxide. Unlike standard chemiluminescence-based monitors, these instruments require no conversion of NO2 to another species and thus are not sensitive to other nitrogen-containing species. As resources allow, CAPS technology will replace the remaining NOx analyzer at the Oldtown site. 4.3.1 Monitoring Requirements
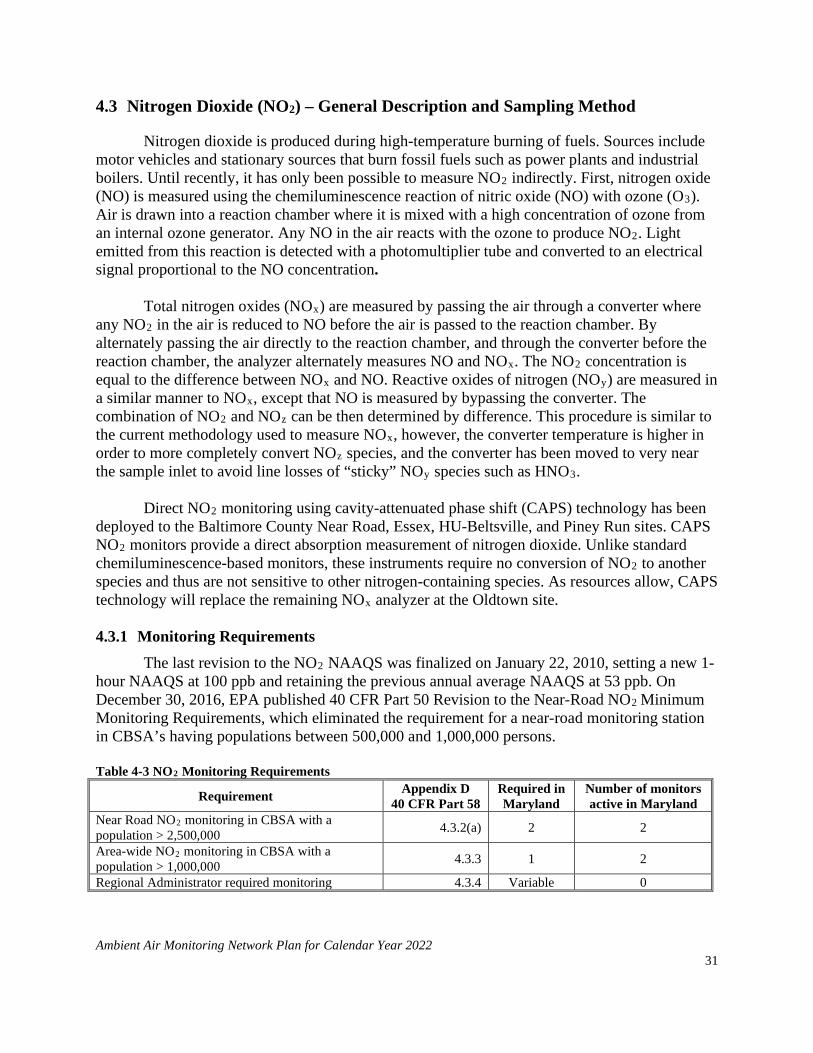
The last revision to the NO2 NAAQS was finalized on January 22, 2010, setting a new 1-hour NAAQS at 100 ppb and retaining the previous annual average NAAQS at 53 ppb. On December 30, 2016, EPA published 40 CFR Part 50 Revision to the Near-Road NO2 Minimum Monitoring Requirements, which eliminated the requirement for a near-road monitoring station in CBSA’s having populations between 500,000 and 1,000,000 persons.
Table 4-3 NO2 Monitoring Requirements
Requirement Appendix D 40 CFR Part 58
Required in Maryland
Number of monitors active in Maryland
Near Road NO2 monitoring in CBSA with a population > 2,500,000 4.3.2(a) 2 2
Area-wide NO2 monitoring in CBSA with a population > 1,000,000 4.3.3 1 2
Regional Administrator required monitoring 4.3.4 Variable 0

Ambient Air Monitoring Network Plan for Calendar Year 2022 32
The Maryland NO2 monitoring network is shown in Figure 4-2.
Figure 4-2 Maryland's NO2 monitoring network.
Near Road Monitoring There are three MSA’s with populations greater than 2,500,000 that are either wholly in Maryland, or that Maryland is a part of, that each qualify for two near road NO2 monitors (Table 1-1). For the Baltimore-Towson, MD MSA, MDE is currently operating two near road NO2 monitoring stations: the Howard County Near Road site, located on I-95 S between Routes 32 and 216, and the Baltimore County Near Road site, located at the Maryland Transit Administration maintenance facility at the interchange of I-695 and I-795.
For the Washington-Arlington-Alexandria, DC-VA-MD-WV MSA, the requirements will be met by monitors installed in Washington, DC by the District of Columbia Department of the Environment (DOEE) and in Virginia by the Virginia Department of Environmental Quality (VADEQ). For the Philadelphia-Camden-Wilmington-Newark, PA-NJ-DE-MD MSA, the requirements are being met by monitors installed by the Philadelphia Air Management Service (AMS).

Ambient Air Monitoring Network Plan for Calendar Year 2022 33
Area Wide Monitoring There are three MSA’s with populations greater than 1,000,000 that are either wholly in Maryland, or that Maryland is a part of, that each qualify for one community wide NO2 monitor (Table 1-1). MDE’s NO2 monitors at the Essex and Oldtown sites fulfill this requirement for the Baltimore-Towson, MD MSA.
For the Washington-Arlington-Alexandria, DC-VA-MD-WV MSA, the requirements are met by monitors installed in Washington, DC by the District of Columbia Department of the Environment (DOEE) and in Virginia by VADEQ. For the Philadelphia-Camden-Wilmington-Newark, PA-NJ-DE-MD MSA, the requirements are met by monitors installed by Philadelphia AMS.
Sensitive and Vulnerable Populations
EPA Region III has not required MDE to install any additional monitors to meet this requirement. Additional NO2 Monitoring Requirements
Each State is required to operate one NCore site. This is discussed in more detail in Section 4.10. Maryland runs two NCore stations, Piney Run and HU-Beltsville, both of which monitor NO2. 4.3.2 Sources Oxides of nitrogen are produced during high-temperature burning of fuels. Sources of NOx include motor vehicles and stationary sources that burn fossil fuels such as power plants and industrial boilers. 4.3.3 Changes Planned for 2021-2022 The NO2 instrumentation currently being run at Oldtown will be replaced by NO2 instrumentation at Lake Montebello when it is operational.

Ambient Air Monitoring Network Plan for Calendar Year 2022 34
4.4 Ozone (O3) – General Description and Sampling Method Ozone is measured by ultraviolet absorption photometry. Air is drawn continuously
through a sample cell where ultraviolet light passes through it. O3 molecules in the air absorb part of the ultraviolet light, reducing the intensity of the light reaching a light sensor. The light is converted into an electrical signal related to the concentration of O3 in the sample cell.
On October 1, 2015, EPA strengthened the NAAQS for ground-level ozone to 70 parts per billion (ppb), based on extensive scientific evidence about ozone’s effects on public health and welfare. The updated standard improves public health protection, particularly for at-risk groups including children, older adults, people of all ages who have lung diseases such as asthma, and people who are active outdoors, especially outdoor workers. They also will improve the health of trees, plants, and ecosystems. The implementation of the 2015 Ozone NAAQS included expanding the ozone season in Maryland from March 1 through October 31, beginning March 1, 2017. 4.4.1 Monitoring Requirements Ozone monitoring requirements are determined by the MSA population and design value, as specified in Table D-2 of 40 CFR Part 58 Appendix D. Table 4-4 shows that the MDE monitoring network meets or exceeds the minimum requirements. Since ozone levels decrease significantly in the colder periods of the year in many areas, ozone is only required to be monitored during the designated “ozone season”. The implementation of the 2015 Ozone NAAQS includes expanding the ozone season in Maryland from March 1 through October 31 starting in 2017.
Table 4-4 Number of Ozone SLAMS Sites Required
MSA Name
Popu
latio
n
Monitors Deployed by StateA
Tot
al M
onito
rs
Req
uire
d ≥
85%
NA
AQ
S
DE DC MD VA WV PA
Baltimore-Towson, MD 2,753,149 0 0 7 0 0 0 7 4 Hagerstown-Martinsburg, MD-WV 256,278 0 0 1 0 1 0 2 1 Washington-Arlington-Alexandria, DC-VA-MD-WV 5,860,342 0 3 7 6 0 0 16 3 Philadelphia-Camden-Wilmington-Newark, PA-NJ-DE-MD 6,018,800 4 0 1 0 0 7 12 3 Salisbury, MD-DE 381,868 2 0 0 0 0 0 2 2 Total 6 3 16 6 1 7 39 13
A - Based on tables available at https://www.epa.gov/air-trends/air-quality-design-values. All areas had their maximum site >= 85% Ozone NAAQS.

Ambient Air Monitoring Network Plan for Calendar Year 2022 35
The Maryland O3 monitoring network is shown in Figure 4-3.
Figure 4-3 Maryland's O3 monitoring network.
Within an O3 network, at least one O3 site for each MSA must be designed to record the maximum concentration for that particular metropolitan area. More than one maximum concentration site may be necessary in some areas. Since O3 requires appreciable formation time, the mixing of reactants and products occurs over large volumes of air, and this reduces the importance of monitoring small-scale spatial variability. The appropriate spatial scales for O3 sites are neighborhood, urban, and regional.
The prospective maximum concentration monitor site should be selected in a direction from the city that is most likely to observe the highest O3 concentrations, more specifically, downwind during periods of photochemical activity. For the Baltimore-Towson, MD MSA, Essex, Edgewood, and Aldino are assigned this designation. For the Washington-Arlington-Alexandria, DC-MD-VA-WV MSA, HU-Beltsville, Beltsville-CASTNET and PG Equestrian Center are assigned this designation for the Maryland portion of the MSA. For the Martinsburg-Hagerstown, MD-WV MSA, Hagerstown is assigned this designation.
Ambient Air Monitoring Network Plan for Calendar Year 2022 36
Additional O3 Monitoring Requirements Additional O3 monitoring stations are located throughout Maryland to characterize
population exposure to ozone. For the Baltimore-Towson, MD MSA, Padonia, Glen Burnie, Furley, and South Carroll are assigned this designation. For the Washington-Arlington-Alexandria, DC-MD-VA-WV MSA, Rockville, Frederick, and Calvert are assigned this designation, while the Southern Maryland site is in place to characterize the general background concentration. Piney Run, the rural NCore site, helps characterize regional ozone transport. On the Eastern Shore, Horn Point is in place to characterize the general background concentration and help notify the public about poor AQI conditions; Blackwater CASTNET is designated as a highest concentration monitor; and the Millington ozone monitor is not required at all but serves as an important tool in notifying the public of AQI forecasts.
4.4.2 Sources
Ozone is not emitted directly from a pollution source but is formed in the lower atmosphere by the reaction of nitrogen oxides (NOx) and volatile organic compounds (VOC’s) in the presence of sunlight and warm temperatures. Sources of nitrogen oxides include automobiles, power plants and other combustion activities. VOC’s can come from automobiles, gasoline vapors, and a variety of large and small commercial and industrial sources that use chemical solvents, paint thinners, and other chemical compounds. NOx and VOC’s or “precursors of ozone” can travel for many miles before chemical reactions in the atmosphere form O3.
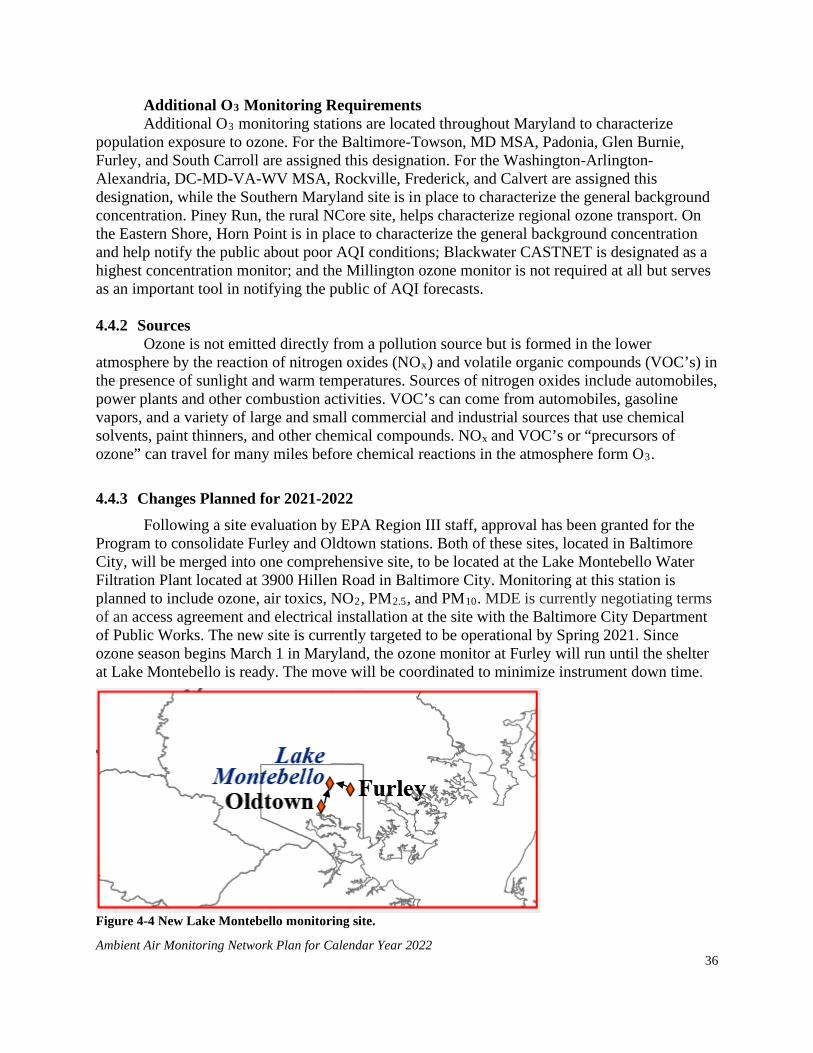
4.4.3 Changes Planned for 2021-2022 Following a site evaluation by EPA Region III staff, approval has been granted for the Program to consolidate Furley and Oldtown stations. Both of these sites, located in Baltimore City, will be merged into one comprehensive site, to be located at the Lake Montebello Water Filtration Plant located at 3900 Hillen Road in Baltimore City. Monitoring at this station is planned to include ozone, air toxics, NO2, PM2.5, and PM10. MDE is currently negotiating terms of an access agreement and electrical installation at the site with the Baltimore City Department of Public Works. The new site is currently targeted to be operational by Spring 2021. Since ozone season begins March 1 in Maryland, the ozone monitor at Furley will run until the shelter at Lake Montebello is ready. The move will be coordinated to minimize instrument down time.
Figure 4-4 New Lake Montebello monitoring site.

Ambient Air Monitoring Network Plan for Calendar Year 2022 37
The Maryland Department of Natural Resources owns the property where the Fair Hill
monitoring station is located and are requiring MDE to move the shelter. The new Fair Hill air monitoring station location was approved by EPA Region III on Feb 4, 2021. The shelter move will occur during the 2021 Ozone Season and will be carefully planned to minimize down time. The new location is approximately 440 meters to the west of the original location, and situated about 24 meters north of Rt. 273, Telegraph Road. The shelter will continue to be used to measure regional transport of ozone at the urban measurement scale, and general/background PM2.5 at the regional scale, in a rural setting. Please see Figure A-10, the area map in Appendix A for more information.

Ambient Air Monitoring Network Plan for Calendar Year 2022 38
4.5 Particulate Matter (PM10) – General Description and Sampling Method
MDE uses manual gravimetric monitors to measure PM10 mass concentrations. Gravimetric samplers draw air through a specially designed inlet that excludes particles larger than 10 microns in diameter for a period of 24 hours. The particles are collected on a Teflon filter that is weighed to determine the particulate mass. These samplers report the air volume measured during the sampling period allowing the concentration (mass/volume) to be calculated. 4.5.1 Monitoring Requirements
The number of required PM10 monitors in each CBSA is determined by the CBSA population and design value, as specified in Table D-5 of Appendix D to 40 CFR Part 58. Table 4-5 shows that the MDE monitoring network meets or exceeds the minimum requirements. Table 4-5 Number of PM10 SLAMS Sites
MSA Name Population Monitors RequiredA
Active Monitors in MD/TotalB
Baltimore-Towson, MD 2,753,149 2-4 2/2 Hagerstown-Martinsburg, MD-WV 256,278 0-1 0/0 Washington-Arlington-Alexandria, DC-VA-MD-WV 5,860,342 2-4 1/5 Philadelphia-Camden-Wilmington-Newark, PA-NJ-DE-MD 6,018,800 2-4 0/2 Salisbury, MD-DE 381,868 0-1 0/0
A – All of the listed MSA’s have PM10 ambient concentrations well below 80% of the PM10 NAAQS. B –Based on tables available at https://www.epa.gov/air-trends/air-quality-design-values.
Minimum Requirements for Collocated PM10
A minimum of 15% (round up), or at least one of the PM10 monitors must be collocated as specified in 40 CFR Part 58 Appendix A 3.3.1. MDE has 3 PM10 monitors and two are collocated (at Glen Burnie), thereby meeting this requirement. The Maryland PM10 monitoring network is shown in Figure 4-4.

Ambient Air Monitoring Network Plan for Calendar Year 2022 39
Figure 4-5 Maryland's PM10 monitoring network. 4.5.2 Sources
Major sources of PM10 include steel mills, power plants, motor vehicles, industrial plants, unpaved roads, and agricultural tilling. The wide variety of PM10 sources means that the chemical and physical composition of coarse particles is highly variable.
4.5.3 Changes Planned for 2021-2022
The PM10 instrumentation currently being run at Oldtown will be replaced by PM10 instrumentation at Lake Montebello when it is operational.

Ambient Air Monitoring Network Plan for Calendar Year 2022 40
4.6 Fine Particulate Matter (PM2.5) – General Description and Sampling Method
MDE uses both FRM manual gravimetric and FEM automated monitors (BAM’s) to measure PM2.5 mass concentrations. For the FRM manual gravimetric sampling, a very sharp cut cyclone (VSSC) is attached to the inlets of these monitors to exclude particles having diameters greater than 2.5 microns. Otherwise, the monitors work as described for PM10 gravimetric monitoring. Some of the gravimetric monitors are specially equipped to collect PM2.5 samples, which are later analyzed into concentrations of the samples’ chemical constituents or species. See Table 3-6 for list of speciated PM2.5 mass. MetOne Super SAAS samplers, URG 3000N, and IMPROVE samplers are used for the collection of samples for the chemical speciation of PM2.5. The samplers collect 3 to 4 filter samples simultaneously every third day for a period of 24 hours. These samples are then sent to an EPA contract laboratory for chemical analyses. There are over 50 species consisting of ions, metals, and carbon species quantified by the analyses (Table 3-6).
For the FEM continuous monitoring, the PM2.5 Beta Attenuation Monitor (BAM) automatically measures and records dust concentrations with built-in data logging. The principal of beta ray attenuation is used to provide a simple determination of mass concentration. An external pump pulls a measured amount of air through a filter tape for a one-hour period. The filter tape, impregnated with ambient dust, is placed between the source and the detector thereby causing the attenuation of the measured beta-particle signal. The degree of attenuation of the beta-particle signal is used to determine the mass concentration of particulate matter on the filter tape and hence the hourly volumetric concentration of particulate matter in the ambient air. 4.6.1 Monitoring Requirements The number of required PM2.5 monitors in each MSA is determined by the MSA population and design value, as specified in Table D-5 of Appendix D to 40 CFR Part 58. Table 4-6 shows that the MDE monitoring network meets or exceeds the minimum requirements. Table 4-6 Number of PM2.5 SLAMS Sites Required
MSA Name Population
2019 Annual Design Value (µg/m3)
2019 Daily
Design Value (µg/m3)
Required SLAMS
Monitors
Monitors Active in
MD/TotalA,B Req
uire
d ≥
85%
N
AA
QS
Baltimore-Towson, MD 2,753,149 8.4 23 3 5/5 3 Hagerstown-Martinsburg, MD-WV 256,278 7.4 20 1 1/2 1 Washington-Arlington-Alexandria, DC-VA-MD-WV 5,860,342 6.9 17 2 2/11 3 Philadelphia-Camden-Wilmington-Newark, PA-NJ-DE-MD 6,018,800 7.4 18 3 1/21 2 Salisbury, MD-DE 381,868 6.5 15 0 0/1 0
A - Based on tables available at https://www.epa.gov/air-trends/air-quality-design-values. B- Total number of monitors includes those located in other States. The Maryland PM2.5 monitoring network is shown in in Figure 4-5.

Ambient Air Monitoring Network Plan for Calendar Year 2022 41
Figure 4-6 Maryland's PM2.5 monitoring network. Minimum Requirements for Collocated PM2.5
Collocation requirements for PM2.5 are based on the number of PM2.5 monitors within a Primary Quality Assurance Organization (PQAO) and by measurement method (FRM or FEM) as specified in 40 CFR Part 58 Appendix A 3.2.5 and Appendix D 4.7.2. MDE is its own PQAO so all monitors in Maryland are counted in the collocation requirements. A minimum of 15% (round up) of the monitors must be collocated. MDE has 12 PM2.5 monitoring stations; therefore 2 must be collocated. MDE currently operates three collocated PM2.5 monitors, one FRM-FRM (Howard U), one FRM-FEM, where the FRM is primary, (Oldtown), and one FEM-FRM, where the FEM is primary, (Padonia).

Ambient Air Monitoring Network Plan for Calendar Year 2022 42
Requirements for Continuous PM2.5 Monitoring At least one-half (round up) of the minimum number of sites per MSA must operate
continuous PM2.5 monitors. MDE operates 11 continuous PM2.5 monitors, four in the Baltimore-Towson, MD MSA; two in the Washington-Arlington-Alexandria, DC-VA-MD-WV MSA; one in the Philadelphia-Camden-Wilmington-Newark, PA-NJ-DE-MD MSA; and one in the Hagerstown-Martinsburg, MD-WV MSA. The other three are in areas not designated as MSA’s (Figure 3-1; Tables 3-1 and 3-2).
Requirements for Near Road PM2.5 Monitoring
For MSA’s with a population of one million or greater, at least one PM2.5 monitor is to be located at a near road NO2 station. The Howard County near road site fulfills this requirement for the Baltimore-Towson, MD MSA. MDE does not operate near road NO2 stations in any other MSA (Section 4.3.1).
Requirements for PM2.5 Chemical Speciation
Each state shall continue to conduct chemical speciation monitoring and analyses at sites designated to be part of the PM2.5 Chemical Speciation Network (CSN) consisting of PM2.5 sites and supplemental sites. MDE conducts chemical speciation monitoring at Essex and HU-Beltsville, but only HU-Beltsville is designated as part of the CSN.
Other Requirements for PM2.5 Monitoring
The required monitoring sites must be located to represent area-wide air quality. These will typically be either neighborhood or urban scale, although micro or middle scale may be appropriate in some urban areas. At least one monitoring site must be neighborhood scale or greater in an area of expected maximum concentration and one site must be sited in an area of poor air quality. Each State shall have at least one PM2.5 site to monitor for regional background and at least one PM2.5 site to monitor for regional transport. Each NCore station must operate a PM2.5 monitor. Table 4-7 shows that MDE meets all of these additional requirements. 4.6.2 Sources
PM2.5 pollution is emitted from combustion activities, such as industrial and residential fuel burning and motor vehicles. PM2.5 can also form in the atmosphere from precursor compounds through various physical and chemical processes.

Ambient Air Monitoring Network Plan for Calendar Year 2022 43
Table 4-7 Monitor Objective Types and Scales Assigned to PM2.5 Monitors in Maryland
Site Name Measurement
Scale Monitor
Objective MSA Oldtown Middle Scale Highest Concentration Baltimore-Towson, MD
Howard Co. Near Rd Microscale Highest Concentration/
Source Oriented Baltimore-Towson, MD Padonia Neighborhood Population Exposure Baltimore-Towson, MD Essex (FRM only) Neighborhood Population Exposure Baltimore-Towson, MD Edgewood Neighborhood Population Exposure Baltimore-Towson, MD
Hagerstown Urban Scale Population Exposure/ Highest Concentration Hagerstown-Martinsburg, MD-WV
Fair Hill Regional Scale Population Exposure Philadelphia-Camden-Wilmington, PA-DE-MD Rockville Neighborhood Population Exposure Washington-Arlington-Alexandria, DC-VA-MD-WV HU-Beltsville Urban Scale Population Exposure Washington-Arlington-Alexandria, DC-VA-MD-WV Horn Point Regional Scale Population Exposure NA Millington Neighborhood Population Exposure NA Piney Run Regional Scale Regional Transport NA
4.6.3 Applicability of FEM Data for Comparison to the NAAQS and Reporting the AQI
MDE operates both FRM and FEM PM2.5 monitors (Table 3-2). Pursuant to the January 15, 2013 revisions to PM2.5 monitoring requirements, MDE recommends that all of the FEM monitors currently operating in the MDE monitoring network remain eligible for comparison to the PM2.5 NAAQS and for reporting the AQI. This recommendation applies retrospectively to FEM data collected since the first quarter of 2012, and prospectively for data collected in 2020 and 2021. MDE will re-evaluate this recommendation for FEM data collected in the 36 months prior to January 1, 2020 and 2021 in next year’s Annual Network Plan.
4.6.4 Changes Planned for 2021-2022
The PM2.5 instrumentation currently being run at Oldtown will be replaced by PM2.5 instrumentation at Lake Montebello when it is operational.
Ambient Air Monitoring Network Plan for Calendar Year 2022 44
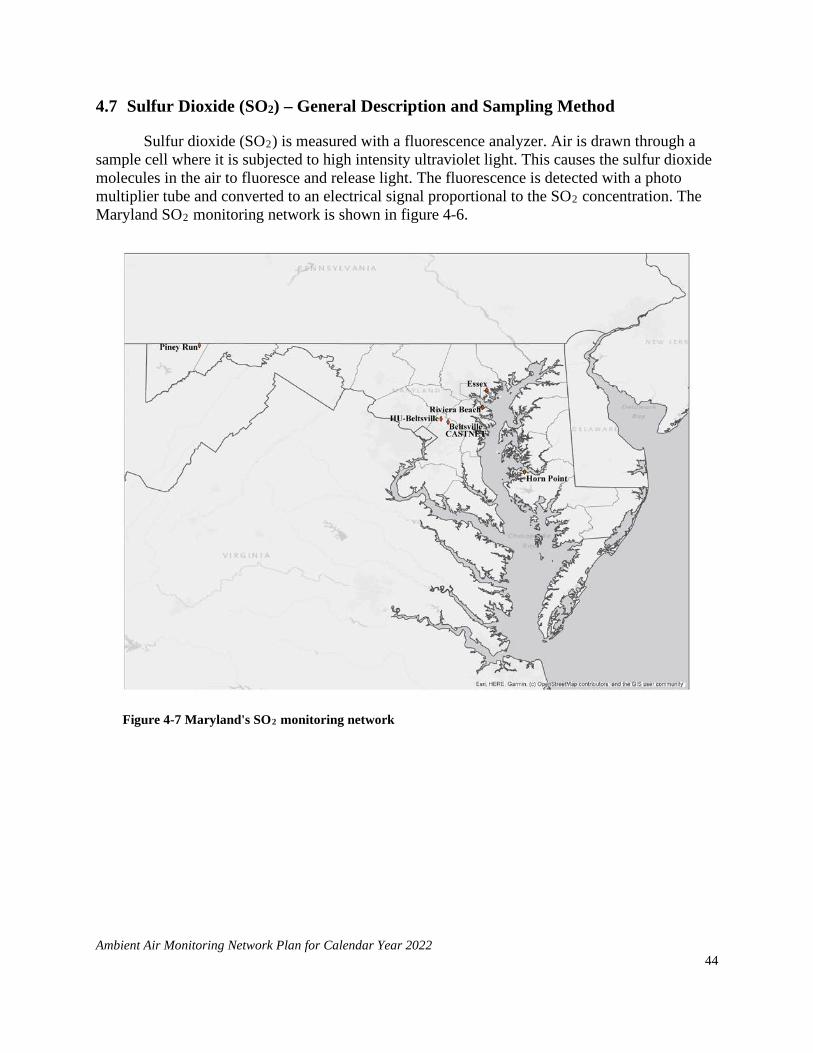
4.7 Sulfur Dioxide (SO2) – General Description and Sampling Method
Sulfur dioxide (SO2) is measured with a fluorescence analyzer. Air is drawn through a sample cell where it is subjected to high intensity ultraviolet light. This causes the sulfur dioxide molecules in the air to fluoresce and release light. The fluorescence is detected with a photo multiplier tube and converted to an electrical signal proportional to the SO2 concentration. The Maryland SO2 monitoring network is shown in figure 4-6.
Figure 4-7 Maryland's SO2 monitoring network

Ambient Air Monitoring Network Plan for Calendar Year 2022 45
On August 10, 2015, the U.S. EPA finalized the SO2 Data Requirements Rule (DRR) for air agencies to characterize air quality around sources that emit 2,000 tons per year (tpy) or more of SO2. On January 5, 2016, MDE notified EPA Region III of six SO2 emissions sources located in Maryland for which air quality will be characterized. These sources are listed in Table 4-8, along with 2014 emissions data, which were the basis for the application of the DRR. Table 4-8 Maryland's List of Sources Subject to the Final 1-hour SO2 Data Requirements Rule.
Facility Name CAMD SO2 (tons) MDE Data System (TEMPO) SO2 (tons)
Brandon Shores 3,145.09 12,757.31* CP Crane 1,887.16 1,890.04 Chalk Point 3,928.48 3,933.20 Herbert A Wagner 9,610.26 12,757.31* Verso Luke Mill N/A 16,999.39 Morgantown 2,961.76 3,134.47 Note that every other source in Maryland emits less than 1,000 tpy of SO2, per TEMPO 2014 data. * This is the total for Ft. Smallwood, including both Brandon Shores and HA Wagner CAMD: Clean Air Markets Division
In support of the SO2 Data Requirements Rule (DRR), three SO2 monitors were deployed in January 2017 by Verso Luke Paper Mill in western Maryland (for details, please see MDE’s 2021 Air Monitoring Network Plan). These sites were being operated by AECOM, under contract to Verso Luke Mill. MDE was the Primary Quality Assurance Organization (PQAO) for these sites, which included performing annual instrument audits and reporting the data to AQS. The paper mill shut down operations in May 2019. On May 7, 2020 Verso Luke Mill surrendered all air quality operating permits and EPA Region III subsequently approved termination of the SO2 monitoring requirements. Monitoring ended on June 8, 2020 and the equipment was removed. No further monitoring at this location is planned.
On June 30, 2016, the EPA designated portions of Maryland’s Anne Arundel County and Baltimore County as non-attainment for the 2010 1-hour SO2 NAAQS. The NAA extends approximately 26.8 kilometers (16.6 miles) from the Herbert A. Wagner’s Unit 3 stack, which is located at 39.17765N latitude and 76.52752W longitude (see Maryland 2018 Monitoring Network Plan.) This designation was based on modeled, not monitored, SO2 concentrations. In order to better evaluate actual ambient SO2 concentrations, a source-oriented SO2 monitor was established at Riviera Beach Elementary School as a Special Purpose Monitor on January 12, 2018.

Ambient Air Monitoring Network Plan for Calendar Year 2022 46
4.7.1 Monitoring Requirements The minimum number of required SO2 monitors in each MSA is proportional to the product of the total amount of SO2 emissions in the MSA and its population, as specified in 40 CFR Part 58, Appendix D, Section 4.4. The resulting value is defined as the Population Weighted Emissions Index (PWEI). SO2 emissions shown in Table 4-9 are from the 2011 National Emissions Inventory (NEI). Table 4-9 Minimum SO2 Monitoring Requirements
MSA Name 2016 Population EstimateA
2014 NEI SO2
(tons/year)B
PWEI (millions of people-tons per year)
Monitors Required
Monitors Active in
MD/TotalC
Baltimore-Towson, MD 2,798,886 18,452 51,644 1 1/1 Hagerstown-Martinsburg, MD-WV 263,817 2,096 553 0
0/0
Washington-Arlington-Alexandria, DC-VA-MD-WV 6,131,977 13,237 81,170 1
1/5
Salisbury, MD-DE 400,200 1,252 501 0 0/1 Philadelphia-Camden-Wilmington-Newark, PA-NJ-DE-MD 6,070,500 12,934 78,518 1
0/7 APopulation from US census https://factfinder.census.gov/faces/nav/jsf/pages/index.xhtml BNEI from 2014 Sector summaries https://www.epa.gov/air-emissions-inventories/2014-national-emissions-inventory-nei-data CTotal monitors in an MSA is based on tables available at https://www.epa.gov/air-trends/air-quality-design-values
Other SO2 Monitoring Requirements The Regional Administrator may require additional SO2 monitoring stations above the minimum in areas where the minimum requirements are not deemed sufficient to meet monitoring objectives. There are no additional monitors required in Maryland by the Regional Administrator. Each NCore station must operate a SO2 monitor. This requirement is met at both the HU-Beltsville and Piney Run monitoring stations. 4.7.2 Sources
The main sources of SO2 are combustion of coal and oil (mostly from electrical generating units (EGUs), refineries, smelters, and industrial boilers). Nationally, two-thirds of all SO2 emissions are from EGUs. Coal operated EGUs account for 95% of these emissions.

Ambient Air Monitoring Network Plan for Calendar Year 2022 47
4.7.3 Changes Planned for 2021-2022 MDE proposes to discontinue monitoring for SO2 at Riviera Beach. In 2016, the EPA
designated portions of Anne Arundel County and Baltimore County as non-attainment for the 2010 1-hour SO2 NAAQS. This designation was based on modeled, not monitored, SO2 concentrations. In order to better evaluate actual ambient SO2 concentrations, a source-oriented SO2 monitor was established at Riviera Beach Elementary School as a Special Purpose Monitor on January 12, 2018. Over three years of operation, the SO2 concentrations measured at this site have never exceeded the 1-hour standard (75 ppb). The preliminary 2020 Design Value is 24 ppb, less than 33% of the Standard.
As of June 1, 2020, one of the Wagner Units at the Fort Smallwood Complex has been removed from supplying electricity to the grid and fuel switched from coal to natural gas. It is only permitted to operate to supply heat to the plant when necessary. Effective under a consent order as of January 1, 2021, the other Wagner and Brandon Shores Units at the complex have had many emissions and operational limits imposed and will cease combustion of coal by 2026. For these reasons MDE proposes to terminate SO2 monitoring at Riviera Beach at the end of 2021.
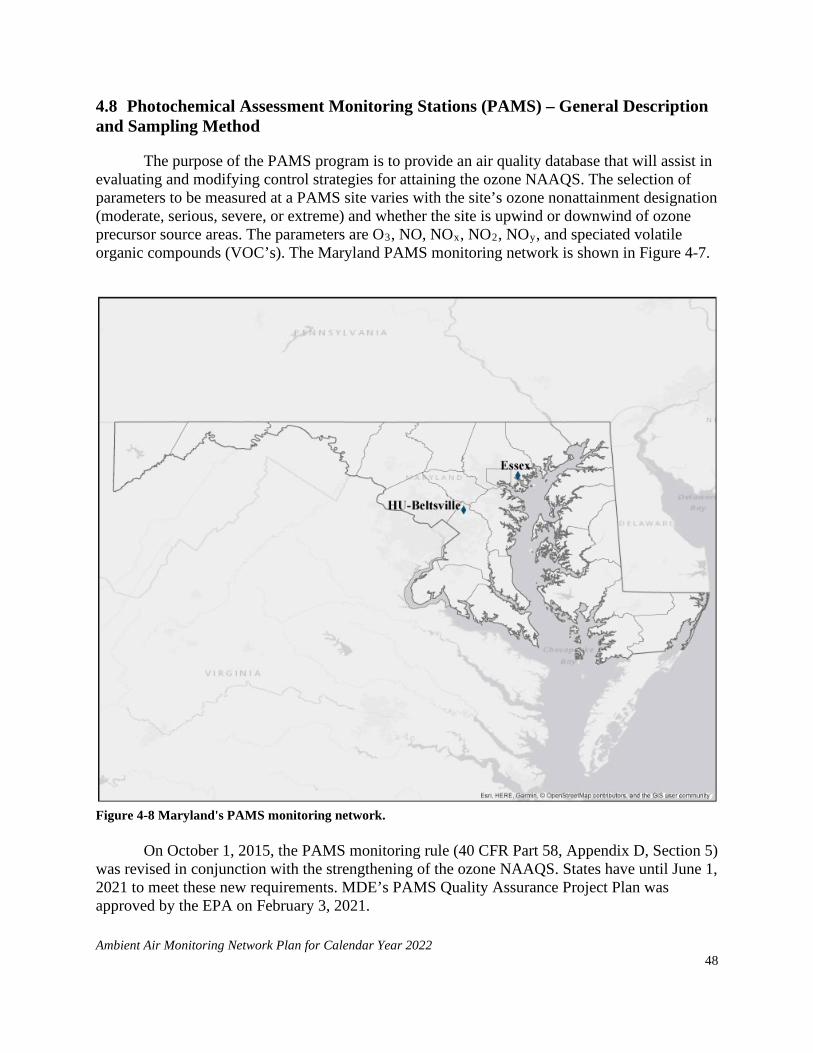
Ambient Air Monitoring Network Plan for Calendar Year 2022 48
4.8 Photochemical Assessment Monitoring Stations (PAMS) – General Description and Sampling Method
The purpose of the PAMS program is to provide an air quality database that will assist in evaluating and modifying control strategies for attaining the ozone NAAQS. The selection of parameters to be measured at a PAMS site varies with the site’s ozone nonattainment designation (moderate, serious, severe, or extreme) and whether the site is upwind or downwind of ozone precursor source areas. The parameters are O3, NO, NOx, NO2, NOy, and speciated volatile organic compounds (VOC’s). The Maryland PAMS monitoring network is shown in Figure 4-7.
Figure 4-8 Maryland's PAMS monitoring network.
On October 1, 2015, the PAMS monitoring rule (40 CFR Part 58, Appendix D, Section 5) was revised in conjunction with the strengthening of the ozone NAAQS. States have until June 1, 2021 to meet these new requirements. MDE’s PAMS Quality Assurance Project Plan was approved by the EPA on February 3, 2021.

Ambient Air Monitoring Network Plan for Calendar Year 2022 49
Based on 40 CFR part 58, Appendix D, State air monitoring agencies were required to begin making the revised PAMS measurements at their NCore location(s) by June 1, 2019. EPA proposed a two-year extension to this deadline on May 31, 2019 because many states had not yet received the equipment and training needed to implement the new requirements. A final rule extending the start date from June 1, 2019 to June 1, 2021 was signed on December 20, 2019 and published in the Federal Register on January 8, 2020. Agencies may elect to start the revised PAMS requirements sooner if they so choose. MDE has all the necessary equipment and began collecting the required PAMS measurements June 1, 2020. A CL51 ceilometer is in the process of being relocated to the Essex site.
MDE was granted a waiver (Appendix D to the 2018 Monitoring Network Plan) to terminate the collection of PAMS data at HU-Beltsville in support of enhanced PAMS monitoring at Essex. This change, which included relocating the Total Reactive Nitrogen Species (NOy) monitor from Howard U to Essex, was approved on May 31, 2017. Methods used to sample and analyze VOC’s and NOy follow (NO/NOx and O3 have already been described in Sections 4.3 and 4.4, respectively):
• Ambient air is collected in three 8-hour canister samples every 3rd day during PAMS season (June – August) using a XonTech Model 910A Canister Sampler with a Model 912 multi-canister sampling adapter. The canisters are returned to the laboratory for analysis on an EnTech/Agilent GC/FID system.
• Ambient air is collected year round in 24-hour canister samples every sixth day using a XonTech Model 910A/Atec Model 2200 Canister Sampler. The canisters are returned to the laboratory for analysis on an EnTech/Agilent GC/FID system. These are the same canister samples listed in section 4.9 below but analyzed for the PAMS list of compounds.
• Ambient air is collected and analyzed on-site every hour (June – August) using a Markes-Agilent auto GC.
• Ambient air is sampled hourly for NOy using an API T200U NOy low level oxides of nitrogen analyzer.

Ambient Air Monitoring Network Plan for Calendar Year 2022 50
4.8.1 Monitoring Requirements and Locations for Revised PAMS Monitoring Rule Under the October 1, 2015 revisions to the PAMS monitoring rule, state and local
monitoring agencies are required to collect and report PAMS measurements at each NCore site with a population of 1,000,000 or more beginning June 1, 2021. PAMS measurements include: (1) Hourly averaged speciated volatile organic compounds (VOCs); (2) Three 8-hour averaged carbonyl samples per day on a 1 in 3 day schedule, or hourly averaged formaldehyde; (3) Hourly averaged O3; (4) Hourly averaged nitrogen oxide (NO), true nitrogen dioxide (NO2), and total reactive nitrogen (NOy); (5) Hourly averaged ambient temperature; (6) Hourly vector-averaged wind direction; (7) Hourly vector-averaged wind speed; (8) Hourly averaged atmospheric pressure; (9) Hourly averaged relative humidity; (10) Hourly precipitation; (11) Hourly averaged mixing-height; (12) Hourly averaged solar radiation; and (13) Hourly averaged ultraviolet radiation.
MDE has been granted a waiver from the EPA Region III Administrator to collect the required PAMS measurements at the Essex site in lieu of the HU-Beltsville site in order to maintain the 25 year historical record of ozone precursor trends collected at the Essex site, located in the Baltimore-Towson, MD CBSA.
MDE adopted the national PAMS Quality Assurance Project Plan (QAPP) and Standard Operating Procedures (SOP’s), with minor modifications. EPA approval was granted on Feb 3, 2021.

Ambient Air Monitoring Network Plan for Calendar Year 2022 51
With respect to PAMS instrumentation at the Essex site, MDE utilizes the following:
Hourly Speciated VOC’s Hourly averaged speciated VOC’s will be measured, at a minimum, from June through August with a Markes-Agilent Auto GC. Carbonyls Carbonyl sampling will be made at a frequency of three 8-hour on a one-in-three day basis from June through August annually using an ATEC Model 8000-2 Eight Channel Automated Carbonyl sampler with co-located independent channel. Samples will be analyzed by ERG laboratory services (RTP, NC) using EPA Method TO-11A, as used in the National Air Toxics Trends (NATTS) program. Nitrogen Oxides Hourly averaged NO, NOy and true NO2 will be measured, at a minimum, from June through August. True NO2 will be measured with a TeledyneAPI Model T500U CAPS NO2 analyzer. NO and NOy will be measured using an API T200U NOy analyzer. Meterological Parameters Hourly averaged temperature, vector-averaged wind speed, vector-averaged wind direction, atmospheric pressure, relative humidity, and precipitation will be measured with a Vaisala Model WXT520. Hourly averaged solar radiation will be measured with a Kipp and Zonen SPLite instrument. Hourly averaged ultraviolet radiation will be measured with a Kipp and Zonen SUV-5 instrument. Hourly averaged mixing height will be measured with a Viasala Model CL51 ceilometer. 4.8.2 Sources
PAMS VOC’s can come from automobiles, gasoline vapors, and a vast variety of large and small commercial, and industrial sources that use chemical solvents, paint thinners and other chemical compounds.
4.8.3 Changes Planned for 2021-2022 No changes planned.

Ambient Air Monitoring Network Plan for Calendar Year 2022 52
4.8.4 MDE Enhanced Monitoring Plan
EPA developed a Technical Note “Guidance for Photochemical Assessment Monitoring Stations (PAMS) Required Network Implementation Plans and Enhanced Monitoring Plans (EMP’s)” that recommended monitoring organizations submit the EMP by July 1, 2018 along with the annual network plan. In addition to the requirements listed in Section 4.8.1, the October 1, 2015 revisions to the PAMS monitoring rule also require states with moderate and above 8-hour ozone nonattainment areas and states in the Ozone Transport Region to develop and implement an Enhanced Monitoring Plan (EMP) detailing enhanced ozone and ozone precursor monitoring activities to be performed. The regulatory requirement for EMP contained in 50CFR58, Appendix D.5(h) states that “the EMP shall be submitted to the EPA Regional Administrator no later than October 1, 2019” for states in the Ozone Transport Region.
MDE has implemented the following measurements as basic elements of the required
EMP:
• Year round ozone monitoring at Piney Run, Essex, HU-Beltsville, and Horn Point as of 2020.
• Additional VOC measurements at HU-Beltsville, as of June 2019, consisting of eight 3-hour canister samples collected every third day June through August.
• PAMS analysis performed on air toxics canisters collected at HU-Beltsville, Essex, Oldtown, and Howard County Near Road.
• Operation of radar wind profilers at Piney Run, HU-Beltsville, and Horn Point as of 2020.
Collection and reporting of these measurements will be contingent on receipt of sufficient
additional EPA funding directed specifically towards these EMP activities. In addition to the activities listed above, MDE is considering the use of low cost sensors
to measure ozone at higher spatial resolution as a means to investigate concentration gradients and spatial variability. MDE is also exploring the possibility of pooling future EMP funding with other states within the OTR. The goal in mind is to develop an OTR-wide approach to special intensive studies possibly utilizing aircraft, ozonesondes, LIDAR, unmanned aerial vehicles (UAVs), low cost sensors, and other research measurement platforms.

Ambient Air Monitoring Network Plan for Calendar Year 2022 53
4.9 Air Toxics – General Description and Sampling Method
Air toxics, or hazardous air pollutants (HAPS), are those pollutants which are known or suspected to cause cancer or other serious health effects, such as reproductive or birth defects, or adverse environmental effects. MDE’s air toxics network measures the toxic VOCs listed in Table 3-6. Air toxics samples are collected for 24 hours in canisters with a XonTech 910A or Atec 2200 canister sampler on an every sixth day schedule. The canisters are returned to the MDE laboratory for analysis on an Entech/Agilent gas chromatograph mass spectrometer system. Maryland’s air toxics monitoring network is show in Figure 4-8.
Figure 4-9 Maryland's Air Toxics monitoring network.

Ambient Air Monitoring Network Plan for Calendar Year 2022 54
4.9.1 Monitoring Requirements As part of the EPA Region III Cooperative Toxic Monitoring Program, MDE operates
four air toxic monitoring stations to assess general urban levels. Toxics are sampled every sixth day year-round. 4.9.2 Monitoring Locations
There are four monitors measuring air toxics in Maryland: Essex, Baltimore County; Oldtown, Baltimore City; Howard County Near Road, Howard County; and HU-Beltsville, Prince George’s County. Refer back to Table 3-2 Monitor Information for Current Maryland Ambient Air Monitoring Sites, for parameter information and monitoring objective at each monitoring site. For a map of monitoring locations in Maryland refer to Figure 3-1. 4.9.3 Sources
Toxics can come from automobiles, gasoline vapors, and a large variety of large and small commercial and industrial sources that use chemical solvents, paint thinners and other chemical compounds. 4.9.4 Changes Planned for 2021-2022
The air toxics instrumentation currently being run at Oldtown will be replaced by air toxics instrumentation at Lake Montebello when it is operational.

Ambient Air Monitoring Network Plan for Calendar Year 2022 55
4.10 NCore – General Description and Sampling Method
NCore, or National Core multi-pollutant monitoring stations, is the National monitoring network required in the October 17, 2006 revisions to the air monitoring regulations (40 CFR, Part 58). NCore sites are required to measure, at a minimum, PM2.5 particle mass using continuous and integrated/filter-based samplers, PM10-2.5 particle mass, O3, SO2, CO, NO/NOy, wind speed, wind direction, barometric pressure, rain, relative humidity, and ambient temperature.
Sampling methods for PM2.5, O3, SO2, NO/ NOy are described under the individual pollutant sections throughout this document. Trace level measurement of CO and SO2 is performed at NCore sites. PM10-2.5 is determined by the difference between collocated PM10 and PM2.5 FRM samplers. The meteorological parameters (Table 3-4) are measured as follows:
• The Vaisala WXT530 PTU module contains separate sensors for pressure, temperature and humidity measurements. The measurement principle of the pressure, temperature and humidity sensors is based on an advanced RC oscillator and two reference capacitors against which the capacitance of the sensors is continuously measured. The microprocessor of the transmitter performs compensation for the temperature dependency of the pressure and humidity sensors.
• The Vaisala WXT530 uses RAINCAP Sensor 2- technology in precipitation measurement. The precipitation sensor comprises a steel cover and a piezoelectrical sensor mounted on the bottom surface of the cover. The precipitation sensor detects the impact of individual raindrops. Hence, the signal of each drop can be converted directly to accumulated rainfall. An advanced noise filtering technique is used to filter out signals originating from other sources and not raindrops.
• The Vaisala WXT530 uses WINDCAP sensor technology in wind measurement. The wind sensor has an array of three equally spaced ultrasonic transducers on a horizontal plane. Wind speed and wind directions are determined by measuring the time it takes the ultrasound to travel from each transducer to the other two. The wind sensor measures the transit time (in both directions) along the three paths established by the array of transducers. This transit time depends on the wind speed along the ultrasonic path. For zero wind speed, both the forward and reverse transit times are the same. With wind along the sound path, the up-wind direction transit time increases and the down-wind transit time decreases.
MDE operates other meteorological parameters not required by the NCore network, and
they are measured as follows:
• The Kipp and Zonen SMP3 instrument is used to measure solar radiation at the Piney Run and HU-Beltsville NCore sites, as well as at Essex. It uses a photodiode detector, which creates a voltage output that is proportional to the incoming radiation. Ultraviolet (UV) radiation is measured at Essex using a Kipp and Zonen SUV-5 instrument.
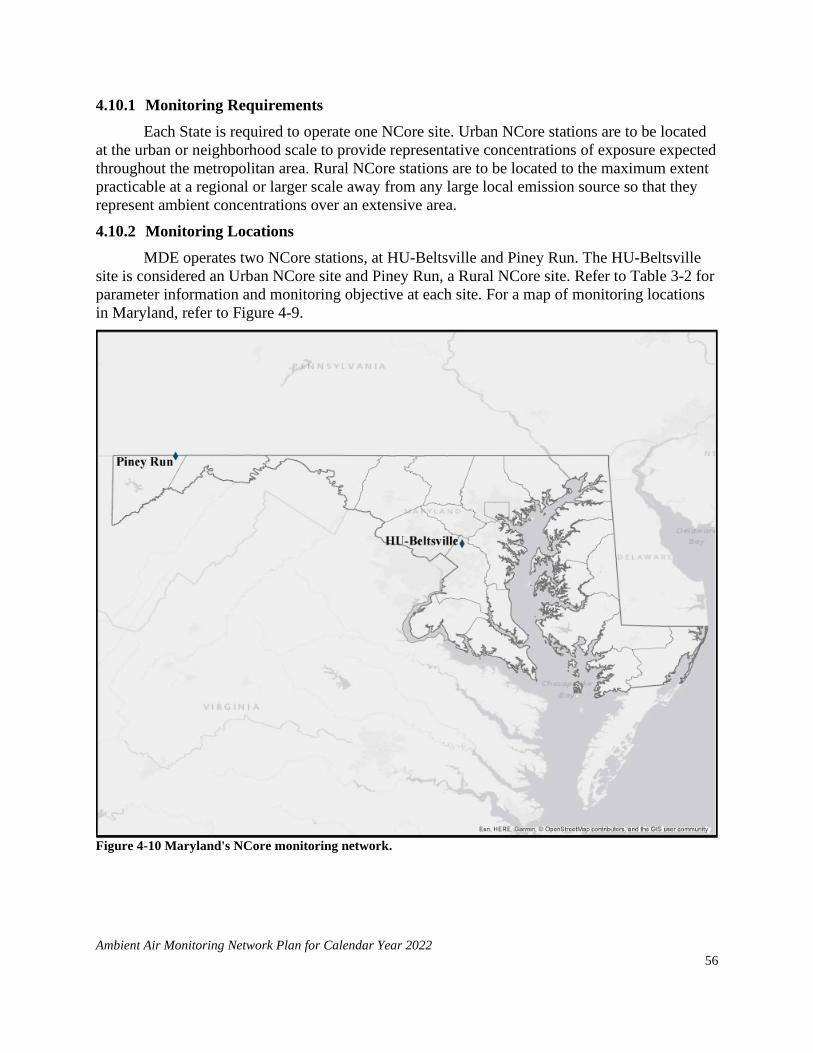
Ambient Air Monitoring Network Plan for Calendar Year 2022 56
4.10.1 Monitoring Requirements Each State is required to operate one NCore site. Urban NCore stations are to be located
at the urban or neighborhood scale to provide representative concentrations of exposure expected throughout the metropolitan area. Rural NCore stations are to be located to the maximum extent practicable at a regional or larger scale away from any large local emission source so that they represent ambient concentrations over an extensive area. 4.10.2 Monitoring Locations
MDE operates two NCore stations, at HU-Beltsville and Piney Run. The HU-Beltsville site is considered an Urban NCore site and Piney Run, a Rural NCore site. Refer to Table 3-2 for parameter information and monitoring objective at each site. For a map of monitoring locations in Maryland, refer to Figure 4-9.
Figure 4-10 Maryland's NCore monitoring network.

Ambient Air Monitoring Network Plan for Calendar Year 2022 57
4.10.3 Sources Sources have already been addressed under the individual pollutant sections throughout
this document. 4.10.4 Changes Planned for 2021-2022
No changes planned.
MARYLAND DEPARTMENT OF THE ENVIRONMENT 1800 Washington Boulevard | Baltimore, MD 21230 | www.mde.maryland.gov
410-537-3000 | 800-633-6101 | TTY Users: 800-735-2258 Lawrence J. Hogan, Jr., Governor | Boyd K. Rutherford, Lt. Governor
Ben Grumbles, Secretary
DEPARTMENT OF THE ENVIRONMENT
APPENDIX A To the Maryland 2022 Air Monitoring Network Plan
TOPOGRAPHIC MAP AND AREA MAPS
with SITE DESCRIPTIONS of AIR MONITORING STATIONS IN MARYLAND
Prepared for: U.S. Environmental Protection Agency
Prepared by:
Ambient Air Monitoring Program Air and Radiation Management Administration
Maryland Department of the Environment
March 17, 2021

Appendix A – Topographic and Area Maps with Site Descriptions of Air Monitoring Stations in Maryland 2022 2
This page is intentionally blank.

Appendix A – Topographic and Area Maps with Site Descriptions of Air Monitoring Stations in Maryland 2022 3
TABLE of FIGURES Title Page
Figure A- 1. Topographic map of air monitoring sites in Maryland………………………...……5
Figure A- 2. Areal map of Aldino air monitoring site in Harford County, MD. .............................6
Figure A- 3. Areal map of the Baltimore County Near Road air monitoring site in Baltimore County, MD. ........................................................................................................................7
Figure A- 4. Areal map of Baltimore Haze Cam site at Brandon Shores in Anne Arundel County, MD. ......................................................................................................................................8
Figure A- 5. Areal map of Beltsville CASTNET air monitoring site in Prince George;s, MD. ......9
Figure A- 6. Areal map of Blackwater NWR CASTNET air monitoring site in Dorchester County, MD .......................................................................................................................10
Figure A- 7. Areal map of Calvert air monitoring site in Calvert County, MD. ...........................11
Figure A- 8. Areal map of Edgewood air monitoring site in Harford County, MD.. ....................12
Figure A- 9. Areal Map of the Essex air monitoring site in Baltimore County, MD. ...................13
Figure A- 10. Areal map of Fair Hill air monitoring site in Cecil County, MD.. ..........................14 Figure A- 10a. Areal map of new Fair Hill air monitoring site in Cecil County, MD ..................15
Figure A- 11. Areal map of Frederick Airport air monitoring site in Frederick County, MD ......16
Figure A- 12. Areal map of Frostburg Haze Cam site in Garrett County, MD. ............................17
Figure A- 13. Areal map of Furley air monitoring site in Baltimore City, MD. ...........................18
Figure A- 14. Areal map of Glen Burnie air monitoring site in Anne Arundel County, MD. ......19
Figure A- 15. Areal map of Hagerstown air monitoring site in Washington County, MD.. .........20 Figure A- 16. Areal map of the Horn Point air monitoring site in Dorchester County, MD…….21
Figure A- 17. Areal map of the Howard County Near Road air monitoring site in Howard County, MD.. .....................................................................................................................22
Figure A- 18. Areal map of HU-Beltsville air monitoring site in Prince George’s Co., MD. .......23
Figure A- 19. Areal map of Millington air monitoring site in Kent County, MD.. .......................24
Figure A- 20. Areal map of Oldtown air monitoring site in Baltimore City, MD. ........................25

Appendix A – Topographic and Area Maps with Site Descriptions of Air Monitoring Stations in Maryland 2022 4
Figure A- 21. Areal map of new Padonia air monitoring site in Baltimore County, MD. ............26
Figure A- 22. Areal map of PG Equestrian Center air monitoring site in Prince George’s County, MD. ....................................................................................................................................27
Figure A- 23. Areal map of Piney Run air monitoring site in Garrett County, MD. .....................28
Figure A- 24. Areal map of Riviera Beach air monitoring site in Anne Arundel County, MD.. ..30
Figure A- 25. Areal map of Rockville air monitoring site in Montgomery County, MD.. ...........30
Figure A- 26. Areal map of South Carroll air monitoring site in Carroll County, MD. ................31
Figure A- 27. Areal map of Southern Maryland air monitoring site in Charles Co., MD. ............32

Appendix A – Topographic and Area Maps with Site Descriptions of Air Monitoring Stations in Maryland 2022 5
Figure A- 1. Topographic map of air monitoring sites in Maryland.

Appendix A – Topographic and Area Maps with Site Descriptions of Air Monitoring Stations in Maryland 2022 6
Figure A- 2. Areal map of Aldino air monitoring site in Harford County, MD. Aldino was chosen as a seasonal ozone monitoring site because of the potential to measure the highest concentration of ozone at an urban measurement scale in a suburban setting. As a result of construction activities at the airport, the Aldino station needed to be moved a short distance from its original location. Due to a runway reconfiguration, the station was moved approximately 237 meters to the north east, away from the roadway into a field on the property. There are several small airplanes and several hangars behind the office building. To the south is a large flat grassy field containing a grass/dirt runway and another small hangar. To the west is the end of the runway, a house just past the runway, and the continuation of Aldino Road and the sod farm.

Appendix A – Topographic and Area Maps with Site Descriptions of Air Monitoring Stations in Maryland 2022 7
Figure A- 3. Areal map of the Baltimore County Near Road air monitoring site in Baltimore County, MD. BCNR, located in a suburban setting, was chosen as a site for monitoring air quality near roads, including NO, NO2, and NOx, source-oriented/highest concentration at the microscale. The BCNR site is in the back left corner of a Metro Station parking lot next to a gazebo that is to the left of the site.

Appendix A – Topographic and Area Maps with Site Descriptions of Air Monitoring Stations in Maryland 2022 8
Figure A- 4. Areal map of Baltimore Haze Cam site at Brandon Shores in Anne Arundel County, MD. Brandon Shores was chosen as a Haze Cam site for the purpose of providing public notification of visibility in an urban setting. The location provides an excellent vista of downtown Baltimore City.

Appendix A – Topographic and Area Maps with Site Descriptions of Air Monitoring Stations in Maryland 2022 9
Figure A- 5. Areal map of Beltsville CASTNET air monitoring site in Prince George’s County, MD. Beltsville was chosen as an ozone monitoring site in the CASTNET network because of the potential to measure the highest concentration of ozone at a regional measurement scale.

Appendix A – Topographic and Area Maps with Site Descriptions of Air Monitoring Stations in Maryland 2022 10
Figure A- 6. Areal map of Blackwater NWR CASTNET air monitoring site in Dorchester County, MD. Blackwater was chosen as an ozone monitoring site in the CASTNET network because of the potential to measure the highest concentration of ozone at a regional measurement scale.

Appendix A – Topographic and Area Maps with Site Descriptions of Air Monitoring Stations in Maryland 2022 11
Figure A- 7. Areal map of Calvert air monitoring site in Calvert County, MD. Calvert was chosen as a seasonal ozone monitoring site because of the potential to measure the population exposure of ozone at the urban measurement scale in a rural setting. The site is located at a recycling facility on a paved parking lot adjacent to a large radio tower that is several hundred feet high.
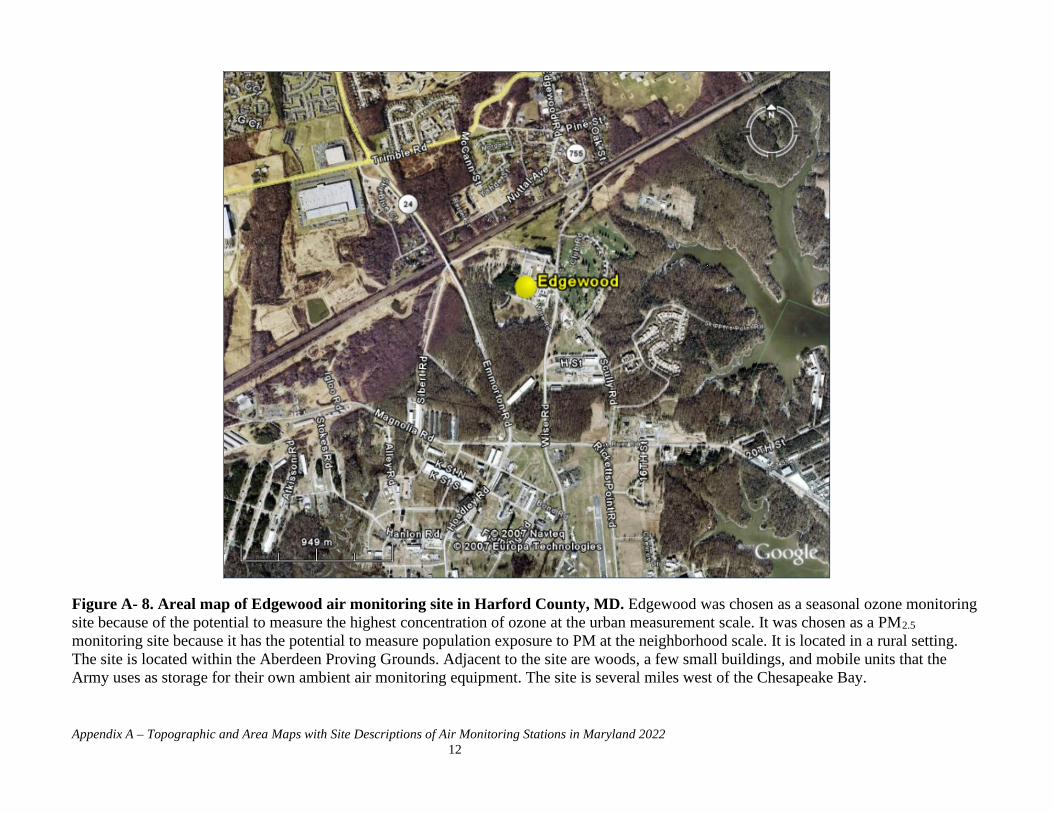
Appendix A – Topographic and Area Maps with Site Descriptions of Air Monitoring Stations in Maryland 2022 12
Figure A- 8. Areal map of Edgewood air monitoring site in Harford County, MD. Edgewood was chosen as a seasonal ozone monitoring site because of the potential to measure the highest concentration of ozone at the urban measurement scale. It was chosen as a PM2.5 monitoring site because it has the potential to measure population exposure to PM at the neighborhood scale. It is located in a rural setting. The site is located within the Aberdeen Proving Grounds. Adjacent to the site are woods, a few small buildings, and mobile units that the Army uses as storage for their own ambient air monitoring equipment. The site is several miles west of the Chesapeake Bay.

Appendix A – Topographic and Area Maps with Site Descriptions of Air Monitoring Stations in Maryland 2022 13
Figure A- 9. Areal Map of the Essex air monitoring site in Baltimore County, MD. Essex, located in a suburban setting, was chosen as a site for monitoring air toxics population exposure at the neighborhood scale; CO highest concentration at the middle scale; NO population exposure and maximum precursor at the neighborhood scale; NOx and NO2 maximum precursor at the neighborhood scale; year-round ozone highest concentration and population exposure at the neighborhood scale; PM2.5 (local conditions and hourly) population exposure at the neighborhood scale; SO2 highest concentration at the neighborhood scale; and Type 2 PAMS VOC’s maximum precursor and highest concentration at the neighborhood scale. Essex is located in the parking lot of the Essex Senior Center, two blocks from a four-lane road going through the town. To the north of the monitoring station is a small patch of grass, a sidewalk, and Woodward Road, a two-lane road. To the south and west of the monitoring shelter is parking lot for the senior center, which can hold about 50 cars. The senior center is located just beyond the parking lot. The surrounding area is a neighborhood with one or two-story houses on less than quarter acre lots, power lines, and sparse trees.

Appendix A – Topographic and Area Maps with Site Descriptions of Air Monitoring Stations in Maryland 2022 14
Figure A- 10. Areal map of Fair Hill air monitoring site in Cecil County, MD. Fair Hill was chosen as a seasonal ozone monitoring site because of the potential to measure the regional transport of ozone at the urban measurement scale. It was chosen as a PM2.5 monitoring site because of the potential to measure general/background PM at the regional scale. It is located in a rural setting. Maryland DNR owns the property where the Fair Hill shelter is located, and they want us to move about 500 meters to the west (Fig A-10a). This relocation request was granted by EPA Region III on February 4, 2021.To the north of the Fair Hill monitoring site lies a flat grass field and a steeplechase and turf track. In the far distance are a few single story office buildings, and a riding ring with bleachers. To the east continues the grass field and single paved lane. To the south passes Rt. 273, a two lane road,. Past the road is a grass field leading to several racing barns and a couple of mature trees with a training track in the background. To the west continues Rt. 273. Just beyond the road is a gravel parking lot for day horse trailer parking. On the near side of the road in the distance are several one story office and land management buildings.
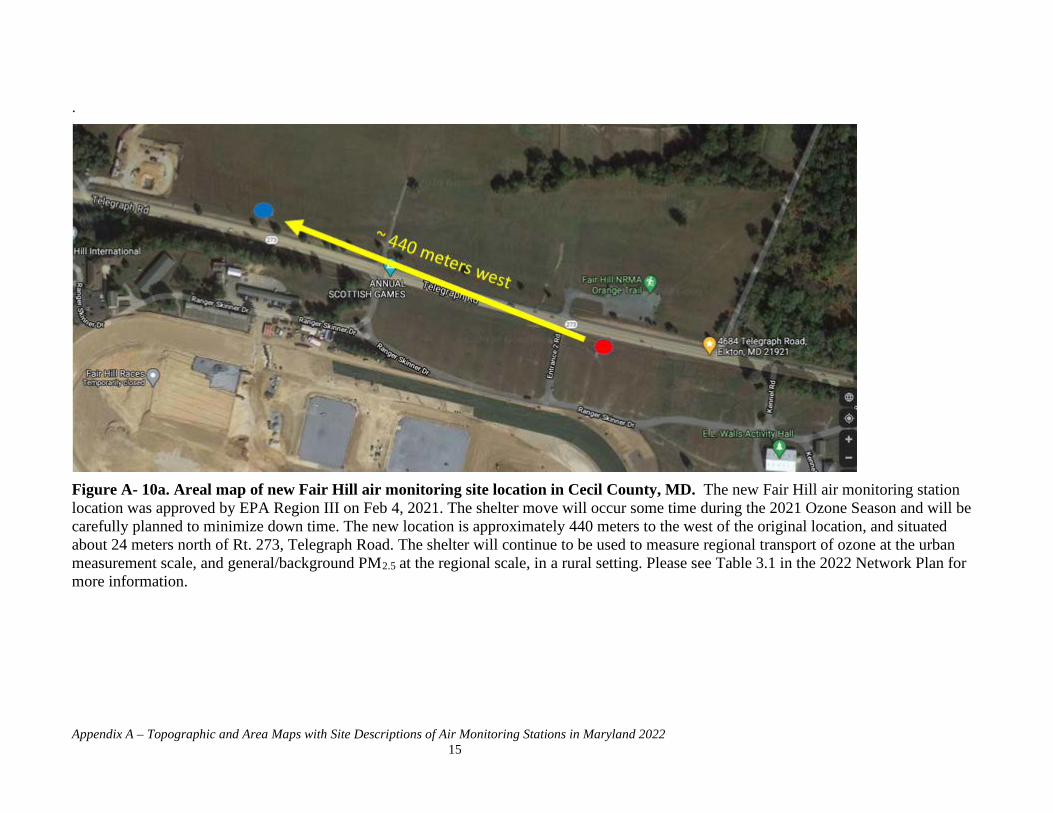
Appendix A – Topographic and Area Maps with Site Descriptions of Air Monitoring Stations in Maryland 2022 15
.
Figure A- 10a. Areal map of new Fair Hill air monitoring site location in Cecil County, MD. The new Fair Hill air monitoring station location was approved by EPA Region III on Feb 4, 2021. The shelter move will occur some time during the 2021 Ozone Season and will be carefully planned to minimize down time. The new location is approximately 440 meters to the west of the original location, and situated about 24 meters north of Rt. 273, Telegraph Road. The shelter will continue to be used to measure regional transport of ozone at the urban measurement scale, and general/background PM2.5 at the regional scale, in a rural setting. Please see Table 3.1 in the 2022 Network Plan for more information.

Appendix A – Topographic and Area Maps with Site Descriptions of Air Monitoring Stations in Maryland 2022 16
Figure A- 11. Areal map of Frederick Airport air monitoring site in Frederick County, MD. Frederick was chosen as a seasonal ozone monitoring site because of the potential to measure the population exposure of ozone at an urban measurement scale in a suburban setting. The Frederick trailer sits off to the side of a road that passes through a Wastewater Treatment Facility. The trailer sits a few feet from a building and airplanes can frequently be observed taking off from the airport in the distance.

Appendix A – Topographic and Area Maps with Site Descriptions of Air Monitoring Stations in Maryland 2022 17
Figure A- 12. Areal map of Frostburg Haze Cam site in Garrett County, MD. Frostburg was chosen as a Haze Cam site for the purpose of providing public notification of visibility in a rural setting. The location provides a view of the Piney Run air monitoring station.
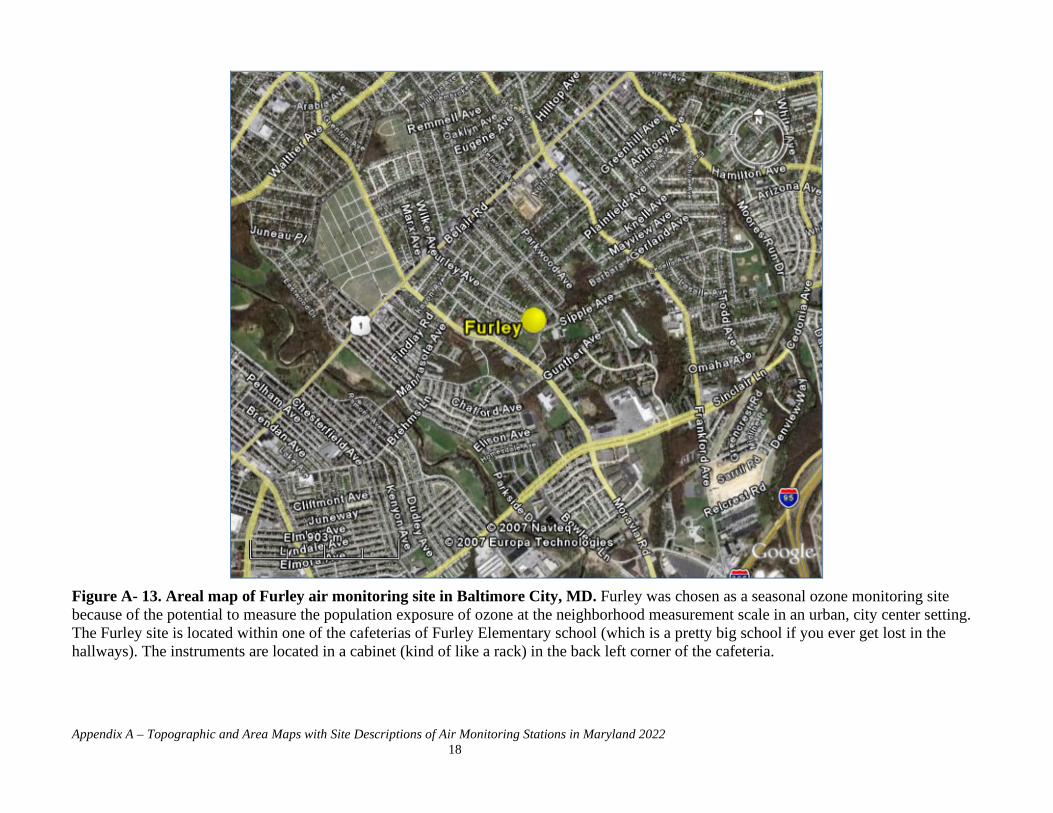
Appendix A – Topographic and Area Maps with Site Descriptions of Air Monitoring Stations in Maryland 2022 18
Figure A- 13. Areal map of Furley air monitoring site in Baltimore City, MD. Furley was chosen as a seasonal ozone monitoring site because of the potential to measure the population exposure of ozone at the neighborhood measurement scale in an urban, city center setting. The Furley site is located within one of the cafeterias of Furley Elementary school (which is a pretty big school if you ever get lost in the hallways). The instruments are located in a cabinet (kind of like a rack) in the back left corner of the cafeteria.
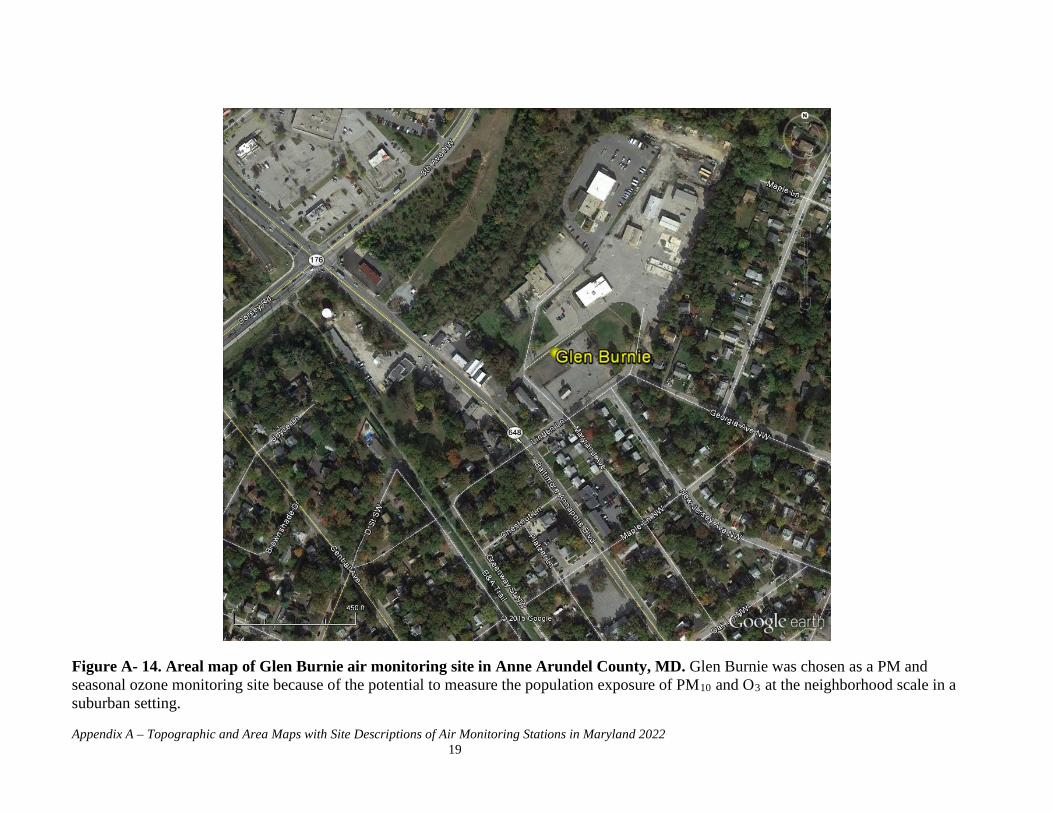
Appendix A – Topographic and Area Maps with Site Descriptions of Air Monitoring Stations in Maryland 2022 19
Figure A- 14. Areal map of Glen Burnie air monitoring site in Anne Arundel County, MD. Glen Burnie was chosen as a PM and seasonal ozone monitoring site because of the potential to measure the population exposure of PM10 and O3 at the neighborhood scale in a suburban setting.

Appendix A – Topographic and Area Maps with Site Descriptions of Air Monitoring Stations in Maryland 2022 20
Figure A- 15. Areal map of Hagerstown air monitoring site in Washington County, MD. Hagerstown was chosen as a seasonal ozone monitoring site because of the potential to measure the highest concentration and population exposure of ozone at the urban scale. It was chosen as a PM2.5 monitoring site because of the potential to measure population exposure to PM2.5 at the urban scale. It is located in a rural setting. The Hagerstown trailer sits right by a blue water tower on rolling hills a few hundred feet from a correctional facility. You can see two parking lots - one lot that is passed to get to the trailer and one lot that is across the road from the trailer.

Appendix A – Topographic and Area Maps with Site Descriptions of Air Monitoring Stations in Maryland 2022 21
Figure A- 16. Areal map of the Horn Point air monitoring site in Dorchester County, MD. Horn Point, located in a rural setting, was chosen as a site for monitoring CO population exposure at the regional scale; NO population exposure at the regional scale; NOy-NO population exposure at the regional scale; year-round ozone population exposure at the regional scale; PM2.5 (hourly) population exposure at the regional scale; Reactive oxides of Nitrogen (NOy) population exposure at the regional scale; and SO2 population exposure at the regional scale. The site is located on the lower eastern shore and sits in an open field with pine trees in the distance surrounding the site. The University of Maryland Center for Environmental and Estuarine Studies is next door to the site.
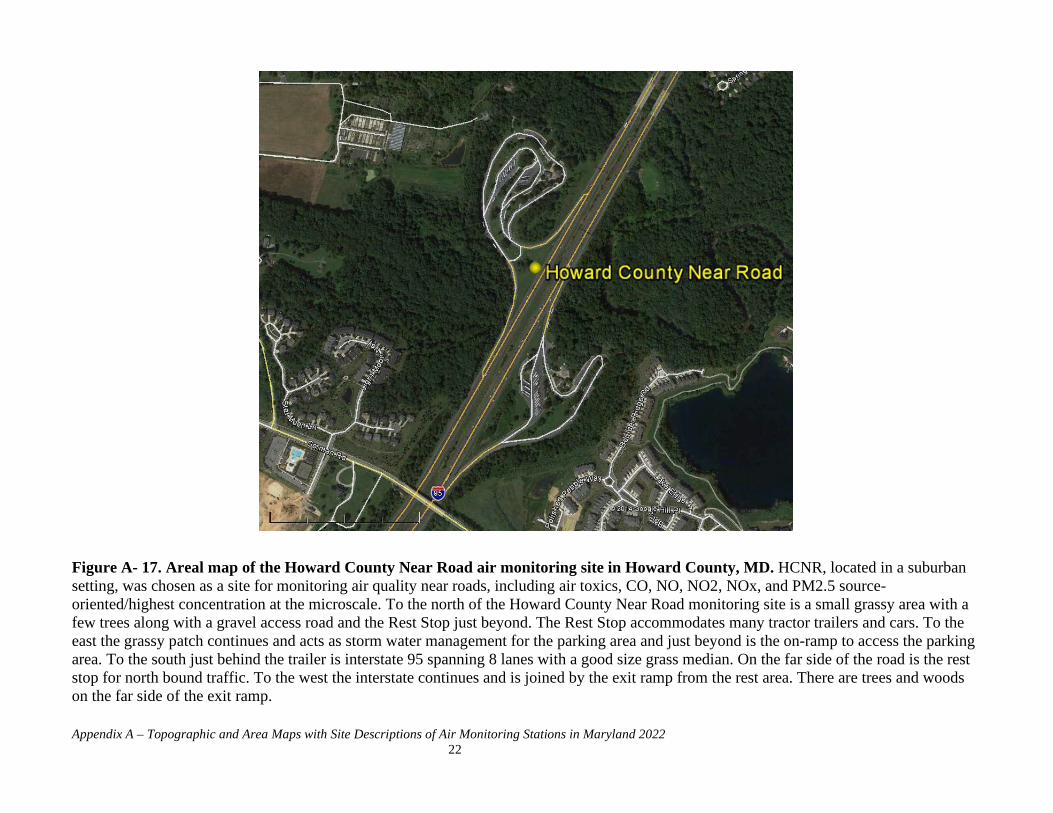
Appendix A – Topographic and Area Maps with Site Descriptions of Air Monitoring Stations in Maryland 2022 22
Figure A- 17. Areal map of the Howard County Near Road air monitoring site in Howard County, MD. HCNR, located in a suburban setting, was chosen as a site for monitoring air quality near roads, including air toxics, CO, NO, NO2, NOx, and PM2.5 source-oriented/highest concentration at the microscale. To the north of the Howard County Near Road monitoring site is a small grassy area with a few trees along with a gravel access road and the Rest Stop just beyond. The Rest Stop accommodates many tractor trailers and cars. To the east the grassy patch continues and acts as storm water management for the parking area and just beyond is the on-ramp to access the parking area. To the south just behind the trailer is interstate 95 spanning 8 lanes with a good size grass median. On the far side of the road is the rest stop for north bound traffic. To the west the interstate continues and is joined by the exit ramp from the rest area. There are trees and woods on the far side of the exit ramp.

Appendix A – Topographic and Area Maps with Site Descriptions of Air Monitoring Stations in Maryland 2022 23
Figure A- 18. Areal map of HU-Beltsville air monitoring site in Prince George’s County, MD. HU-Beltsville, an NCore station located in a suburban setting, was chosen as a site for monitoring air toxics population exposure at the neighborhood scale; CO, NO, NO2, NOy-NO, NOx, and NOy general/background at the urban scale; year-round ozone highest concentration and population exposure at the urban scale; PM population exposure at the urban scale for PM2.5 and neighborhood scale for PM10; SO2 general/background at the urban scale; and Type 3 PAMS VOC’s upwind/background at the urban scale. The site is in an open yard surrounded by trees.

Appendix A – Topographic and Area Maps with Site Descriptions of Air Monitoring Stations in Maryland 2022 24
Figure A- 19. Areal map of Millington air monitoring site in Kent County, MD. Millington was chosen as a seasonal ozone monitoring site because of the potential to measure the population exposure of ozone at the urban scale. It was chosen as a PM2.5 monitoring site because it has the potential to measure population exposure to PM2.5 at the neighborhood scale. It is located in a rural setting. The site is located on the upper eastern shore in a wildlife management area and is adjacent to fields and woods. A few hundred yards away is a small use airport.
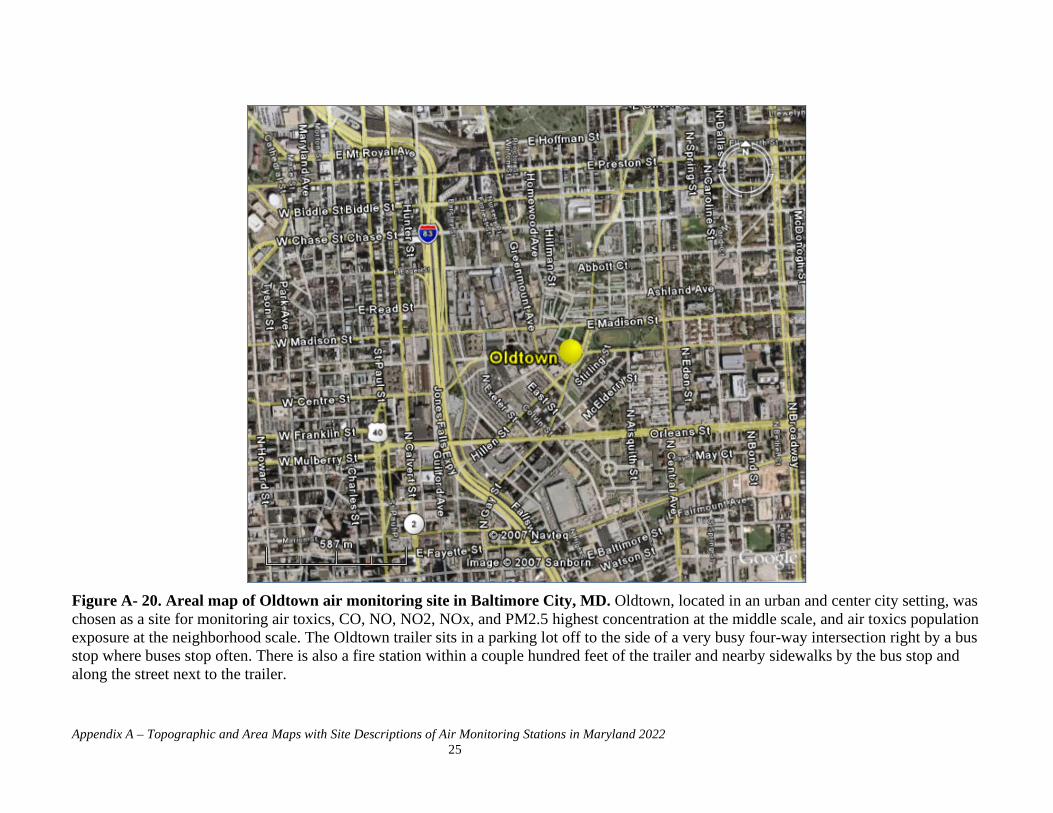
Appendix A – Topographic and Area Maps with Site Descriptions of Air Monitoring Stations in Maryland 2022 25
Figure A- 20. Areal map of Oldtown air monitoring site in Baltimore City, MD. Oldtown, located in an urban and center city setting, was chosen as a site for monitoring air toxics, CO, NO, NO2, NOx, and PM2.5 highest concentration at the middle scale, and air toxics population exposure at the neighborhood scale. The Oldtown trailer sits in a parking lot off to the side of a very busy four-way intersection right by a bus stop where buses stop often. There is also a fire station within a couple hundred feet of the trailer and nearby sidewalks by the bus stop and along the street next to the trailer.

Appendix A – Topographic and Area Maps with Site Descriptions of Air Monitoring Stations in Maryland 2022 26
Figure A- 21. Areal map of new Padonia air monitoring site in Baltimore County, MD. Padonia was chosen as a seasonal ozone and PM2.5 monitoring site because of the potential to measure the population exposure of ozone and PM2.5 at the neighborhood scale. It is located in a suburban setting. The Padonia trailer was on an elementary school grounds near a small parking lot until March 1, 2017, when MDE was forced by the school to remove it due to construction activities. The station was restarted at the new location on December 15, 2017. There is a gravel pit, a landfill, and a spice company all off Beaver Dam Road, to the west and slightly north of the site.

Appendix A – Topographic and Area Maps with Site Descriptions of Air Monitoring Stations in Maryland 2022 27
Figure A- 22. Areal map of PG Equestrian Center air monitoring site in Prince George’s County, MD. PG Equestrian Center was chosen as a seasonal ozone monitoring site because of the potential to measure the population exposure of ozone at the urban scale. It was chosen as a PM2.5 monitoring site because it has the potential to measure population exposure to PM2.5 at the neighborhood scale. It is located in a rural setting. The site sits in the parking lot of the Ranger office. Surrounding the site are parking lots and a horse track.

Appendix A – Topographic and Area Maps with Site Descriptions of Air Monitoring Stations in Maryland 2022 28
Figure A- 23. Areal map of Piney Run air monitoring site in Garrett County, MD. Piney Run, an NCore station located in a rural setting, is located on a mountain top at an elevation of 777 meters (2,548 feet). It was chosen as a site for monitoring year-round ozone, CO, NO, NO2, NOy-NO, NOx, NOy, SO2, and PM2.5 regional transport at the regional scale.

Appendix A – Topographic and Area Maps with Site Descriptions of Air Monitoring Stations in Maryland 2022 29
Figure A- 24. Areal map of Riviera Beach air monitoring site in Anne Arundel County, MD. Riviera Beach, a Special Purpose Monitor located in a suburban setting, is situated on the premises of Riviera Beach Elementary School. It was chosen as a site for monitoring SO2 highest concentration at the neighborhood scale.
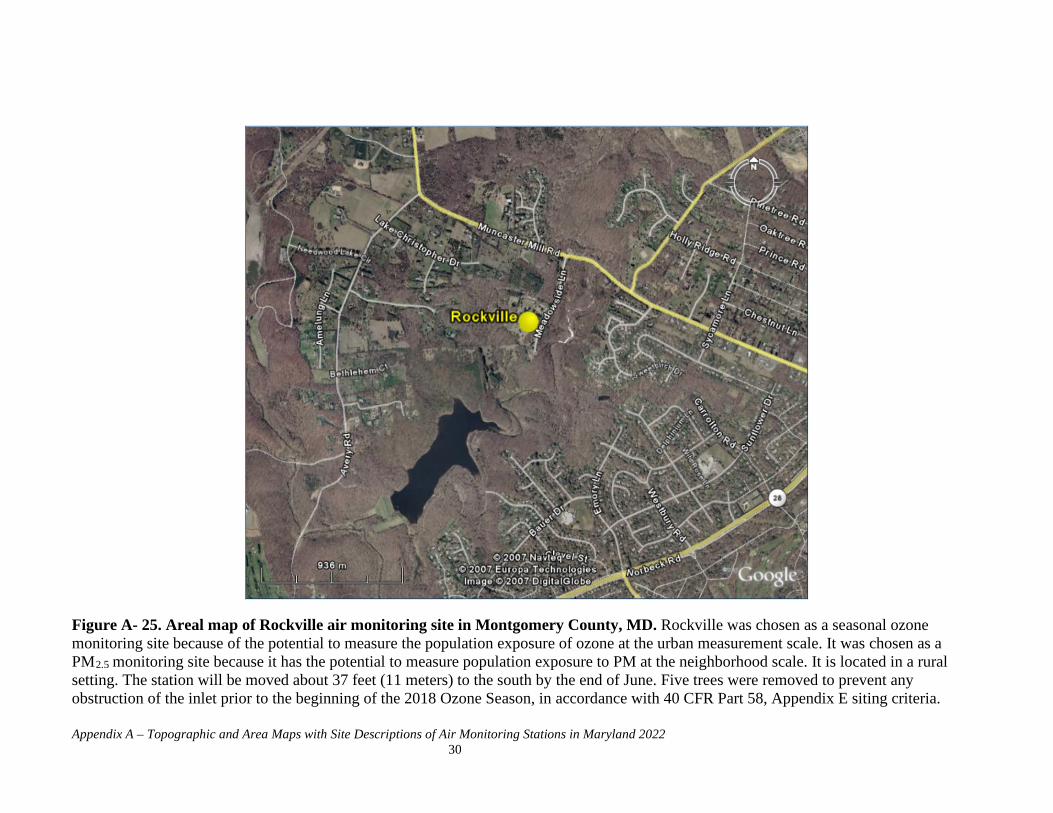
Appendix A – Topographic and Area Maps with Site Descriptions of Air Monitoring Stations in Maryland 2022 30
Figure A- 25. Areal map of Rockville air monitoring site in Montgomery County, MD. Rockville was chosen as a seasonal ozone monitoring site because of the potential to measure the population exposure of ozone at the urban measurement scale. It was chosen as a PM2.5 monitoring site because it has the potential to measure population exposure to PM at the neighborhood scale. It is located in a rural setting. The station will be moved about 37 feet (11 meters) to the south by the end of June. Five trees were removed to prevent any obstruction of the inlet prior to the beginning of the 2018 Ozone Season, in accordance with 40 CFR Part 58, Appendix E siting criteria.

Appendix A – Topographic and Area Maps with Site Descriptions of Air Monitoring Stations in Maryland 2022 31
Figure A- 26. Areal map of South Carroll air monitoring site in Carroll County, MD. South Carroll was chosen as a seasonal ozone monitoring site because of the potential to measure the population exposure of ozone at the urban measurement scale. It is located in a rural setting. The South Carroll trailer sits a few yards from South Carroll High School on the grounds of the school. There is a fence right alongside the trailer as well as ball playing fields within sight of the trailer.
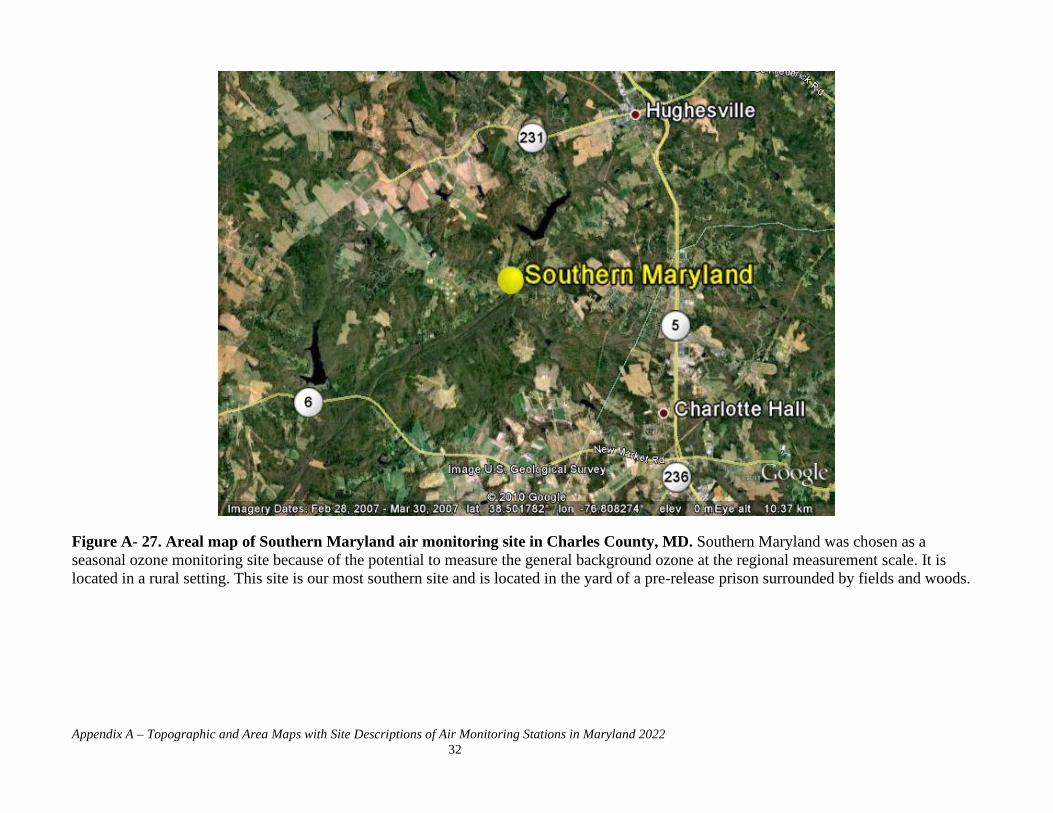
Appendix A – Topographic and Area Maps with Site Descriptions of Air Monitoring Stations in Maryland 2022 32
Figure A- 27. Areal map of Southern Maryland air monitoring site in Charles County, MD. Southern Maryland was chosen as a seasonal ozone monitoring site because of the potential to measure the general background ozone at the regional measurement scale. It is located in a rural setting. This site is our most southern site and is located in the yard of a pre-release prison surrounded by fields and woods.
MARYLAND DEPARTMENT OF THE ENVIRONMENT 1800 Washington Boulevard | Baltimore, MD 21230 | www.mde.maryland.gov
410-537-3000 | 800-633-6101 | TTY Users: 800-735-2258 Lawrence J. Hogan, Jr., Governor | Boyd K. Rutherford, Lt. Governor
Ben Grumbles, Secretary
DEPARTMENT OF THE ENVIRONMENT
APPENDIX B To the Maryland 2022 Air Monitoring Annual Network Plan
EPA Approval Letter (OCTOBER 14, 2020)
for the 2021 Air Monitoring Annual Network Plan
Prepared for: U.S. Environmental Protection Agency
Prepared by:
Ambient Air Monitoring Program Air and Radiation Management Administration
Maryland Department of the Environment
Spring 2021

Printed on 100% recycled/recyclable paper with 100% post-consumer fiber and process chlorine free. Customer Service Hotline: 1-800-438-2474
Mr. Ben H. Grumbles, Secretary Maryland Department of the Environment 1800 Washington Blvd., Baltimore, Maryland 21230 Dear Secretary Grumbles:
By letter and enclosures dated June 9, 2020, the Maryland Department of the Environment (MDE) submitted to the U.S. Environmental Protection Agency (EPA) an annual ambient air monitoring network plan in accordance with the regulatory requirements of 40 CFR Part 58 - Ambient Air Quality Surveillance. Based on our review, EPA hereby approves MDE’s June 9, 2020 annual ambient air monitoring network plan on the basis that the plan and request meet the requirements of 40 CFR Part 58.
Additionally, 40 CFR Section 58.11(c) requires any changes to the air monitoring network or design of
the Particulate Matter Speciation Trends Network (STN) and the National Core Monitoring Network (NCore) air monitoring systems to be approved by the EPA Administrator. However, since there have been no changes to either of these two air monitoring systems, EPA has determined that MDE’s 2020 annual ambient air monitoring network plan does not require further review and approval from the EPA Administrator.
If you have any questions please do not hesitate to contact me or have your staff contact Ms. Cristina
Fernandez, Director, Air and Radiation Division, at (215) 814-2178. Sincerely,
Cosmo Servidio Regional Administrator
cc: Mr. George S. Aburn, Jr., MDE David Krask, MDE