Embed Size (px)
Citation preview
AMCS / CS 247 – Scientific VisualizationLecture 5: Data Representation, Pt. 1
Markus Hadwiger, KAUST

2
Reading Assignment #3 (until Sep 14)
Read (required):• Data Visualization book, Chapter 3 until 3.5 (inclusive)
• Data Visualization book, Chapter 5.3 until 5.3.1 (inclusive):Contouring and Marching Squares

3
Programming Assignments Schedule (tentative)
Lab sign-up• Setup bitbucket account, fork repository until Aug 30
Assignment 1: • Volume slice viewer due: Sep 6
Assignment 2:• Iso-contours and iso-surface rendering due: Oct 4
Assignment 3:• Volume ray-casting due: Oct 25
Assignment 4:• Flow vis 1 (hedgehog plots, streamlines, pathlines) due: Nov 15
Assignment 5:• Flow vis 2 (LIC with color coding) due: Dec 6

Programming Assignment #2

5
Data – General Information
Data:• Focus of visualization,
everything is centered around the data
• Driving factor (besides user) in choice and attribution of the visualization technique
• Important questions:– Where do the data “live” (data space)– Type of the data– Which representation makes sense
(secondary aspect)

6
Data Space
Where do the data “live”? • Inherent spatial domain (SciVis):
– 2D/3D data space given– examples: medical data, flow simulation data, GIS data, etc.
• No inherent spatial reference (InfoVis):– abstract data,
spatial embedding through visualization– example: data bases
• Aspects: dimensionality, domain, coordinates,region of influence (local, global)

7
Data Type
What type of data?• Data types:
– Scalar = numerical value(natural, integer, rational, real, complex numbers)
– Non-numerical (categorical) values– Multi-dimensional values (n-dim. vectors, n×n-dim.
tensors of data from same type)– Multi-modal values (vectors of data with varying type
[e.g., row in a table])
• Aspects: dimensionality, co-domain (range)

8
Data Space vs. Data Type
1D 2D 3D
1D
2D
3D
y=f(x)
CT data d(x)
2D flow v(x)
spatial curve x(t)
Examples

9
Visualization Examples
data description visualization example
N1R1 value series bar chart, pie chart, etc.
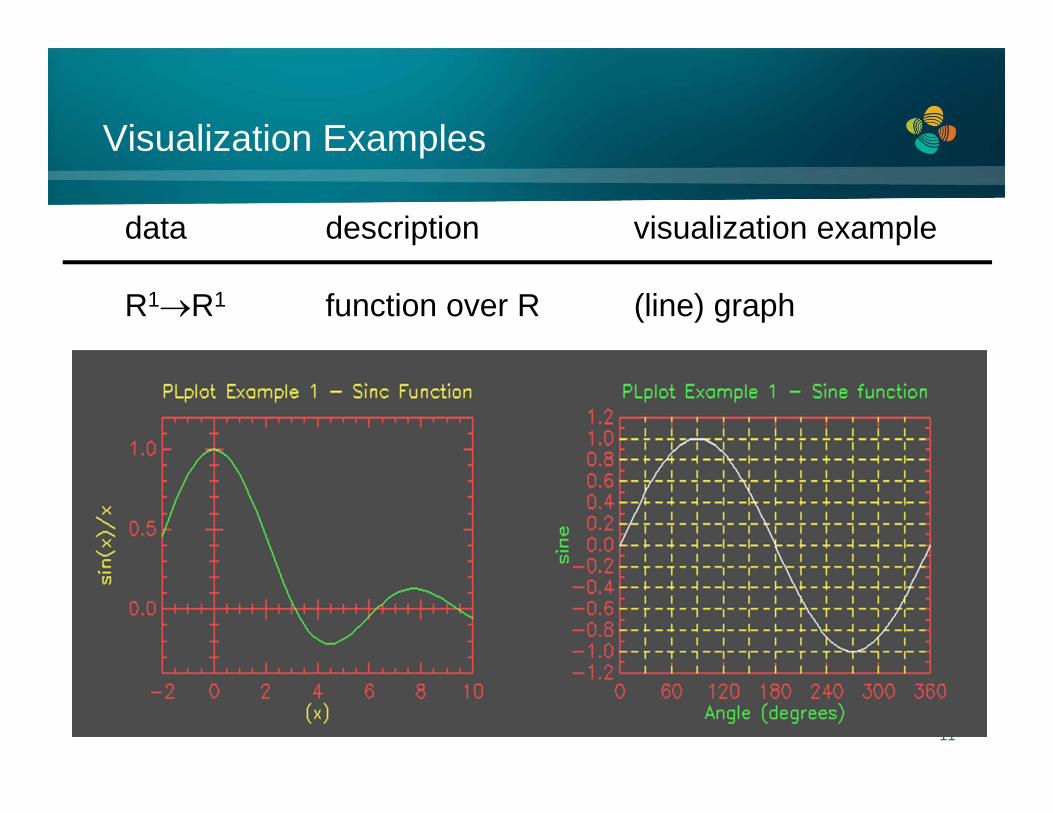
R1R1 function over R (line) graph
R2R1 function over R2 2D-height map in 3D,contour lines in 2D,false color map
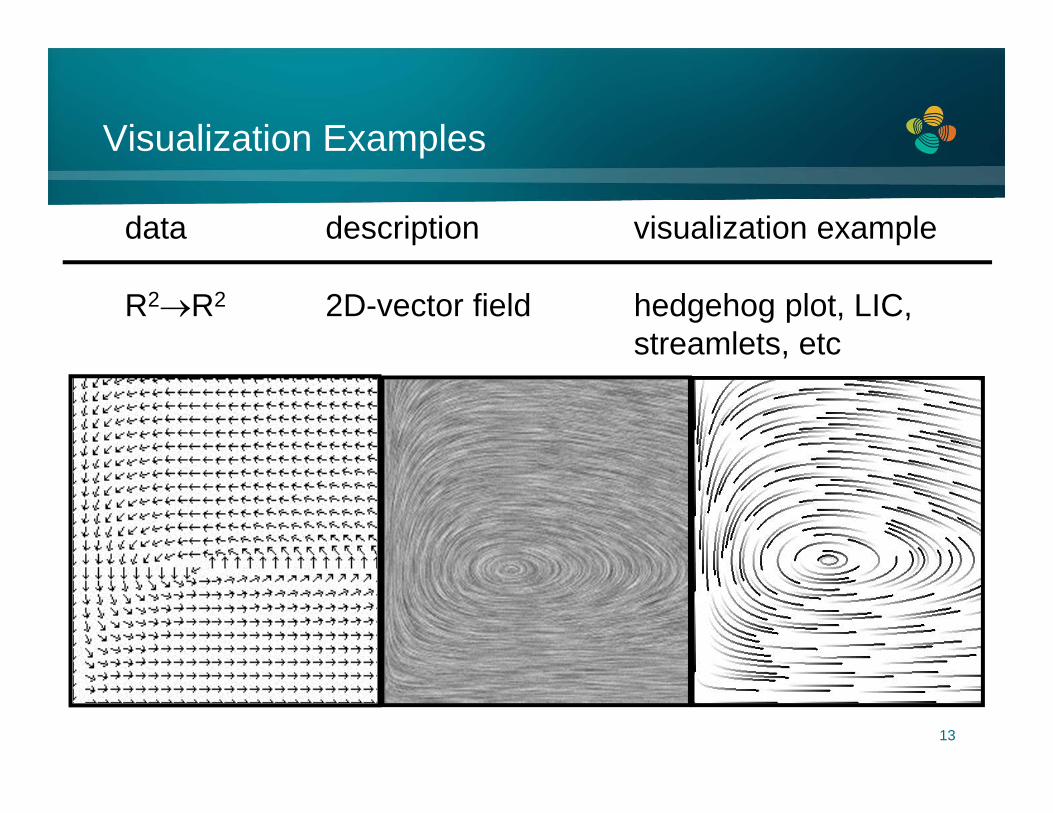
R2R2 2D vector field hedgehog plot, LIC,streamlets, etc.
R3R1 3D densities iso-surfaces in 3D, volume rendering

Eduard Gröller, Helwig Hauser 10
data description visualization example
N1R1 value series bar chart, pie chart, etc.
Visualization Examples
11
data description visualization example
R1R1 function over R (line) graph
Visualization Examples

12
data description visualization example
R2R1 function over R2 2D-height map in 3D,contour lines in 2D,false color map
Visualization Examples
13
data description visualization example
R2R2 2D-vector field hedgehog plot, LIC, streamlets, etc
Visualization Examples
14
Visualization Examples
data description visualization example
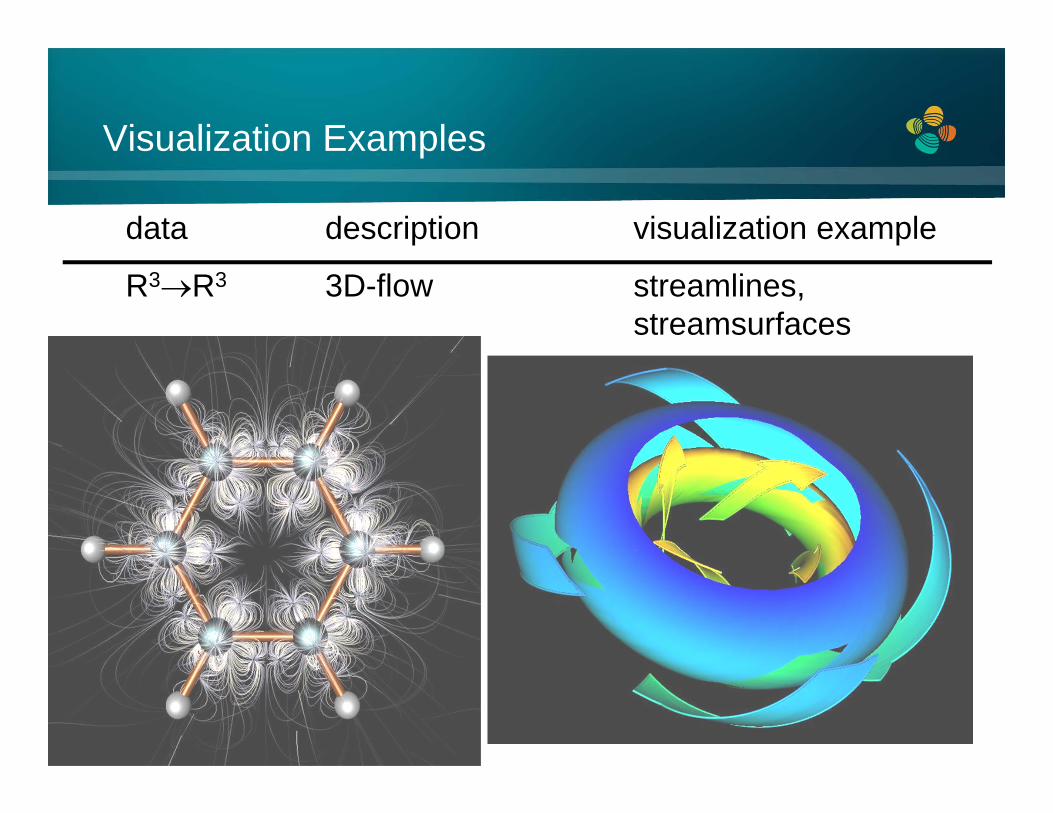
R3R3 3D-flow streamlines,streamsurfaces

15
data description visualization example
R3R1 3D-densities iso-surfaces in 3D, volume rendering
Visualization Examples

© Weiskopf/Machiraju/Möller
Data Representation
domain
independentvariables
Rn
data values
Xdependentvariables
Rm
scientific data Rn+m

© Weiskopf/Machiraju/Möller
Data Representation• Discrete (sampled) representations
– The objects we want to visualize are often ‘continuous’– But in most cases, the visualization data is given only at
discrete locations in space and/or time– Discrete structures consist of samples, from which
grids/meshes consisting of cells are generated
• Primitives in different dimensions
dimension cell mesh
0D1D2D3D
pointslines (edges)triangles, quadrilaterals (rectangles)tetrahedra, prisms, hexahedra
polyline(–gon)2D mesh3D mesh

18
Grids – General Questions
Important questions:• Which data organization is optimal?
• Where do the data come from?
• Is there a neighborhood relationship?
• How is the neighborhood info stored?
• How is navigation within the data possible?
• What calculations with the data are possible ?
• Are the data structured (regular/irregular topology)?

© Weiskopf/Machiraju/Möller
Domain• The (geometric) shape of the domain is determined
by the positions of sample points • Domain is characterized by
– Dimensionality: 0D, 1D, 2D, 3D, 4D, …– Influence: How does a data point influence its
neighborhood?– Structure: Are data points connected? How? (Topology)

© Weiskopf/Machiraju/Möller
Domain• Influence of data points
– Values at sample points influence the data distribution in a certain region around these samples
– To reconstruct the data at arbitrary points within the domain, the distribution of all samples has to be calculated
• Point influence– Only influence on point itself
• Local influence– Only within a certain region
• Voronoi diagram• Cell-wise interpolation (see later in course)
• Global influence– Each sample might influence any other point within the
domain• Material properties for whole object• Scattered data interpolation

© Weiskopf/Machiraju/Möller
Domain • Voronoi diagram
– Construct a region around each sample point that covers all points that are closer to that sample than to every other sample
– Each point within a certain region gets assigned the value of the sample point
– Nearest-neighbor interpolation

© Weiskopf/Machiraju/Möller
Domain
• Scattered data interpolation– At each point the weighted average of all sample
points in the domain is computed– Weighting functions determine the support of each
sample point• Radial basis functions simulate decreasing influence
with increasing distance from samples
– Schemes might be non-interpolating and expensive in terms of numerical operations
interpolate here

© Weiskopf/Machiraju/Möller
Data Structures• Requirements:
– Efficiency of accessing data– Space efficiency– Lossless vs. lossy– Portability
• Binary – less portable, more space/time efficient• Text – human readable, portable, less space/time efficient
• Definition – If points are arbitrarily distributed and no connectivity exists
between them, the data is called scattered– Otherwise, the data is composed of cells bounded by grid
lines– Topology specifies the structure (connectivity) of the data – Geometry specifies the position of the data

© Weiskopf/Machiraju/Möller
Data Structures• Some definitions concerning topology and geometry
– In topology, qualitative questions about geometrical structures are the main concern
• Does it have any holes in it?• Is it all connected together?• Can it be separated into parts?
• Underground map does not tell you how far one station is from the other, but rather how the lines are connected (topological map)

© Weiskopf/Machiraju/Möller
Data Structures
• Topology– Properties of geometric shapes that remain
unchanged even when under distortion
Same geometry (vertex positions), different topology (connectivity)

© Weiskopf/Machiraju/Möller
Data Structures
• Topologically equivalent– Things that can be transformed into each other by
stretching and squeezing, without tearing or sticking together bits which were previously separated
topologically equivalent

Thank you.
Thanks for material• Helwig Hauser
• Eduard Gröller
• Daniel Weiskopf
• Torsten Möller
• Ronny Peikert
• Philipp Muigg
• Christof Rezk-Salama