Embed Size (px)
Citation preview

AMD/TIMEA SIMPLE SPREADSHEET FOR PREDICTING ACID
MINE DRAINAGEPRESENTED TO
THEWEST VIRGINIA ACID MINE DRAINAGE TASK FORCE
ANNUAL MEETING
27,28 APRIL 1993MORGANTOWN, WEST VIRGINIA
PAUL ZIEMKIEWICZ
NATIONAL MINE LAND RECLAMATION CENTERWEST VIRGINIA UNIVERSITY
ABSTRACT
Prediction of acid mine drainage has been a primary regulatory and industrial planning need fordecades, yet there still is no satisfactory method. The most widely accepted method is acidbase accounting (ABA) which only estimates whether there will or will not be a problem. It doesnot estimate ultimate acid loading, treatment costs nor duration of acid mine drainage.
However, the principles behind acid base accounting are reasonable: that there is arelationship between the acid generation and neutralization potentials of a given rock mass.This paper presents a spreadsheet which uses ABA data in a dynamic fashion to predict acidgeneration, loading, concentration and duration. The spreadsheet uses conventional variablesplus three new ones: sulfur flux (%Sf), net deliverable neutralization (NDN) and net deliverableacidity (NDA).
The spreadsheet and preliminary validation is presented though it is recognized that a greatdeal of work is needed before this becomes a reliable prediction tool.
INTRODUCTION
Acid Base Accounting.
Acid Base Accounting (ABA) was developed in the early 1970's by researchers at West VirginiaUniversity to identify and classify geologic strata encountered during mining (West VirginiaUniversity, 1971). A history of Acid Base Account is provided by Skousen et al. (1990).
Since its development, ABA has been used extensively in the United States and several othercountries for premining coal overburden analysis. Its popularity largely stems from itssimplicity. However, it has been subject to criticism since it does not account for the differentrates of acid and alkali‐generating reactions in rock. Modifications to ABA have been

recommended (Smith and Brady, 1990; and diPretoro, 1986). Other methods have developedwhich accelerate or otherwise control the oxidation and leaching process in rock samples. Onesuch procedure, that of Renton et al. (1988), was employed in this study to simulate the rate ofweathering of acid‐producing rock samples alone and in combination with alkalineamendments. The results are compared with traditional ABA parameters
Recent Studies.
diPretoro and Rauch (11988) found poor correlations (reported R squared = 0. 16) between avolume‐weighted acid base net neutralization potential (NP) and net drainage alkalinity nearthirty mine sites in West Virginia. Erickson and Hedin (1988) showed similar poor correlationbetween maximum potential acidity (MPA), NP, net NP from ABA and net alkalinity fromdrainage water. Both papers related that factors other than overburden characteristics wereinvolved in predicting post‐mining water quality.
diPretoro and Rauch (1988) found that sites which had greater than 3% calcium carbonateequivalent (NP) in overburden produced alkaline drainages while at 1 % or less acidic drainageresulted. Erickson and Hedin's results indicate that 2% calcium carbonate or less producedacidic drainage while 8% or more produced alkaline drainage. (in this later study there were nosampling points between 2% and 8%).
O'Hagan and Caruccio (1986) found that the addition of calcium carbonate at 5% by weight to acoal refuse containing 1% S produced alkaline drainage. In Minnesota, Lapakko (1988) foundthat 3% calcium carbonate neutralized an overburden material with 1.17%S.
Hedin and Erickson (1988) compared water quality from rocks weathered in humidity cells toABA values. Cumulative sulfate from humidity cells was strongly correlated with total sulfur (Rsquared = 0.69), while cumulative acidity/alkalinity was correlated with net NP (R squared =0.37). They also showed sulfate from humidity cells was significantly correlated to sulfate fromdrainage water (R squared = 0.17), but the correlation was not strong enough to predict post‐mining drainage quality.
Bradham and Caruccio (1991) conducted several overburden analytical tests on pyritic wastesfrom Canada. They found water quality resulting from column leachings, ABA projections, andsoxhlets correctly predicted eight out of ten sites where drainage was monitored from refusepiles, with weathering cells predicting ten out of ten results.
There have been several modifications in using ABA in predicting drainage quality. ThePennsylvania Department of Environmental Resources (PaDER) (Smith and Brady, 1990)developed a spreadsheet which calculates mass‐weighted maximum potential acidity (MPA),NIP, and net NIP. The spreadsheet also summarizes the overburden analysis in terms of theratio of NP/MPA and the percent sandstone. The spreadsheet of ABA data can be compared tosignificant thresholds or numerical limits for NP and %S and other factors can be changed toestimate the impact on drainage quality. For example, Brady and Hornberger (1989) suggestedthreshold values of NP equal to or greater than 3% and %S less than 0.5 as guidelines fordelineating alkaline‐producing strata.
In the development of its spreadsheet, PaDER (Cravotta et al., 1990) reviewed the calculationof NP in ABA. In current ABA usage, 3.125 g calcium carbonate equivalent is required toneutralize acidity resulting from oxidation of 1 g S. Cravotta et al. (1990) argue that this ratio

should double to 6.25:1. Volume‐weighted maximum acidities are subtracted from NP giving apositive or negative net NP for the mined area. A negative, or deficient, net NP is interpretedto indicate the amount of calcite that must be added to equalize the deficiency and preventAMD formation.
Other alkaline materials have higher NP's than calcite. Quicklime, kiln dust and hydrated limeall have higher activities than calcite, though it is not clear that the kinetics of pyrite oxidationfavor readily soluble sources of alkalinity.
Brady et al. (1990) conducted a study of 12 sites where ABA data were available. Theycomputed net NP based on both 3.125% and 6.25% to 1 % S. Alkaline addition on the sites wasconducted to abate potential AMD problems. When using 6.25%, the sign of the net NP (+ or ‐)matched the sign of the overall net alkalinity of water at 11 of 12 sites.
The results of their study concluded that NP and traditional estimates of MPA (e.g. 3.125% to1% S) were not equivalent and that overburden NP must be twice the MPA to produce alkalinemine drainage. They also concluded that mining practices (such as alkaline addition, selectivehandling, and concurrent reclamation) enhanced the effect of alkaline addition on reducingacidity. Lastly, they concluded additional studies are needed to determine the rates,application and placement of alkaline material during mining.
Brady and Hornberger (1990), after summarizing the work on AMD prediction by ABA made thefollowing conclusions in a recent PaDER Mining and Reclamation Manual. First, NP from ABAshows the strongest relationship with actual post‐mining water quality. This relationship is onlyqualitative (e.g. acid vs. non‐acid), and NP must significantly exceed MPA in order to producealkaline water. If NP and MPA are similar, AMD will most likely result. Sites with less than 0.5%S will not be significant AMD producers, except where little or no NP exists. High sandstonecomposition in the overburden (greater than 65%) will almost always result in acid drainage.
Factors Which Induce Error in Acid Base Accounting.
The foregoing discussion makes it clear that interpretations of ABA are diverse. Given thepolicy and economic implications of ABA it is considered useful to better understand the basisfor ABA predictions and, where acid problems are identified, to generate cost‐effectivesolutions.
Errors in conventional application of ABA result from variance in total S content (Rymer et al.1991), and perhaps more significantly, non‐homogeneous placement of spoils. For exampleSchueck (1990) reported AMD generation from a surface mine site in Pennsylvania resultedlargely from buried refuse and pit cleanings within an otherwise neutral to alkaline spoil matrixas identified by ABA.
Acid neutralization in spoil dumps‐a paradigm '. Obviously, some spoils will be composedentirely of acid forming rocks. Others such as refuse tend to have little NP at all. But in caseswhere AMD forms despite significant alkalinity in the overburden, it appears to originate fromlocalized sites within the backfill. While finding the path of least resistance to the downstreamside of the dump, the acidity is influenced only the alkalinity directly in its path. Once this isovercome, AMD flows freely to the nearest stream while the remaining alkalinity persists as aspectator to the process. This is to be expected since dissolution of calcite is controlled by pHand the partial pressure of carbon dioxide. Where pore water gas is confined, and exposed to

mineral acidity, its pH will remain around 6.2 the‐buffering point of bicarbonate and carbonicacid. In the absence of mineral acidity, its pH will reflect bicarbonate saturation ‐ 8.3. Ineither case, additional calcite will dissolve only upon addition of acidity and outgassing ofcarbon dioxide. So, unless contacted directly by acidity, most of the spoil calcite will simplyremain in solid form. So, the presence of alkalinity in the clump does not ensure that it will bea factor in neutralizing acidity. To be an efficient process, the acid‐forming and alkaline rockmust be thoroughly mixed.
This largely becomes a materials handling issue. Where there is insufficient alkalinity availableit would be necessary to add it to the rock. Otherwise, if one relies on random spoil dumpingthe system would need an overwhelming supply of alkaline rock. This probably accounts for theabove reported field observations that twice or more NP is required for each unit of MPA.
THE AMD/TIME SPREADSHEET
The above introductory remarks are a necessary background for development and applicationof the AMD/TIME spreadsheet. For example, without good mixing of acid producing and alkalinerock, neither ABA nor AMD/TIME will correctly estimate the outcome. Without reliableestimates of %pyrite sulfur and neutralization potential, neither ABA nor AMD/TIME willcorrectly estimate the outcome.
In developing AMD/TIME the following assumptions were made:
1. Within fairly narrow limits pyrite oxidizes at a nearly fixed rate. It is about 7% per year.2. The pyrite oxidation rate is the rate limiting step.3. Rock geometry and porosity are simple multipliers. For example the following factors
might be multiplied against 7%.
sandstone 100%shale 50%refuse with fines 20%
4. The resulting value is called sulfur flux.
AMD/TIME uses conventional variables plus the following:
%Sf/yr Percentage of remaining pyritic sulfur oxidized and leached per year.FLOW Annual rainfall (inches) X 102970 X surface area (acres) X net infiltration (%)‐
yielding liters per year.NDN Net deliverable neutralization potential. This is the proportion of NP that is
exposed to acid water and is able to react with it.NDA Net deliverable acidity. This is the proportion of MPA that oxidizes.
AMD/TIME operates on the Quatro Pro spreadsheet developed by Borland International, Inc.Quatro Pro is similar to Lotus 1,2,3 and, except for the graphics would probably work equallywell. The spreadsheet only uses several hundred KRAM so it will work on nearly all IBMcompatible desktop computers. Naturally, machine power and higher order Intel chips willmake it work more quickly.
AMD/TIME was developed for simplicity, not elegance. It uses simple, empirical rather than

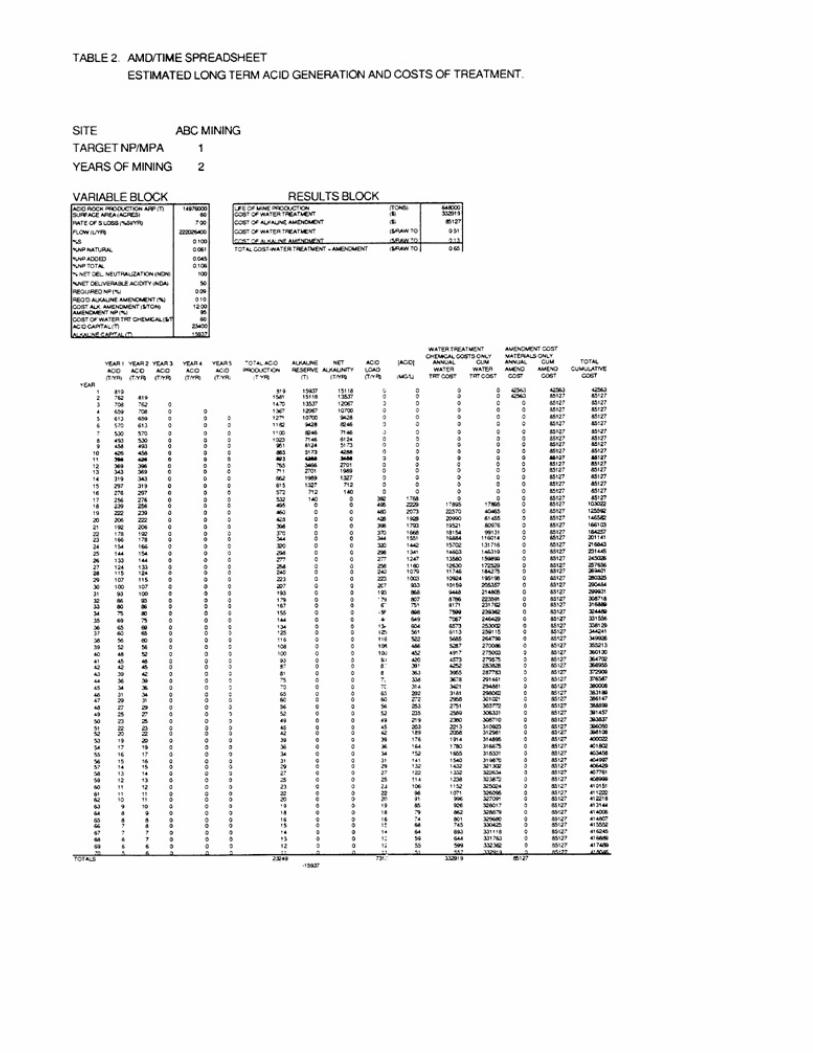
deterministic variables. Table 1 shows the working end of AMD/TIME indicating where data isinput through the variable block. The user only needs to enter the following data:
target NP/MPA ratioyears of miningacid rock production (tons of rock produced in mining)surface area (acres)%Sf/yr%S pyritic (from ABA)%NP natural (from ABA)%NP added%NDN%NDAcost of alkaline amendment $amendment NP (%)
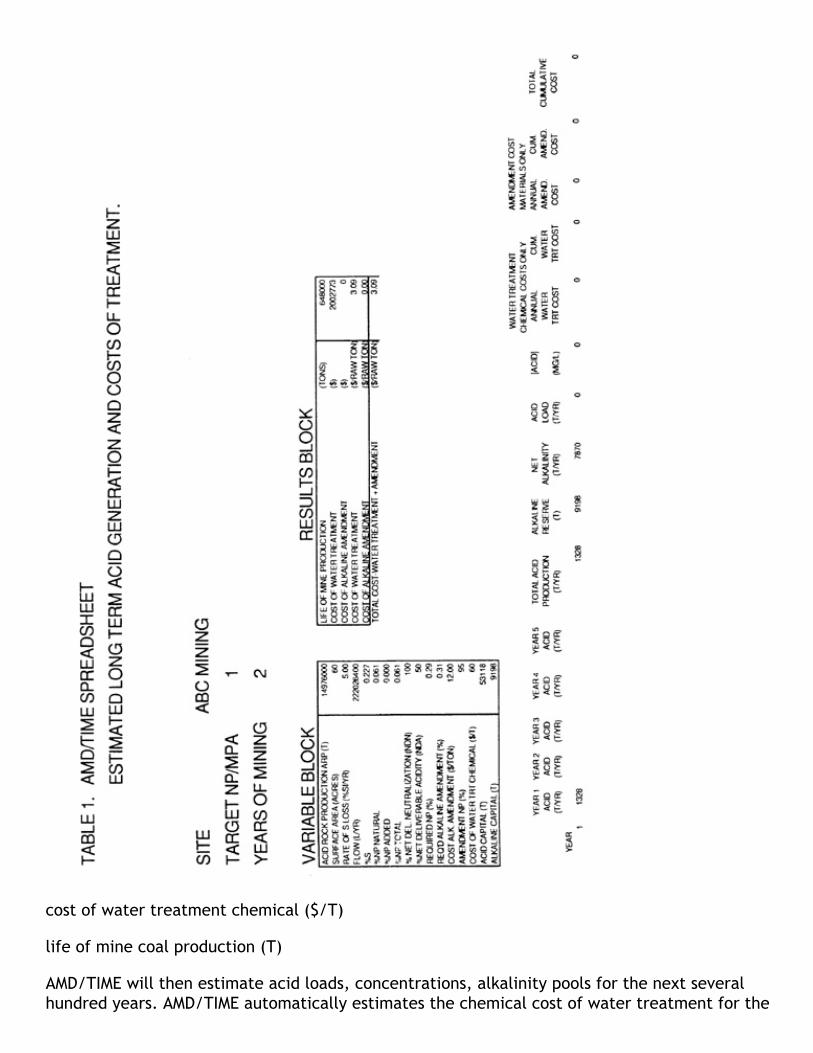
cost of water treatment chemical ($/T)
life of mine coal production (T)
AMD/TIME will then estimate acid loads, concentrations, alkalinity pools for the next severalhundred years. AMD/TIME automatically estimates the chemical cost of water treatment for the

life of amd production. It also automatically estimates the required amount of alkalineamendment needed to reach a target NP/MPA ratio. If you enter that amount at the "%NPadded" block the spreadsheet will estimate the cumulative cost of amendment. Costs in currentdollars are given in absolute amounts and in dollars per raw ton of coal.
Table 2. shows the complete AMD/TIME spreadsheet extended to 70 years. In the scenario givenroughly one half of the required alkaline amendment was added to the rock so the costs reflectcombined amendment and chemical treatment costs.
COMPARISON OF ESTIMATES TO SMALL SCALE FIELD DATA:
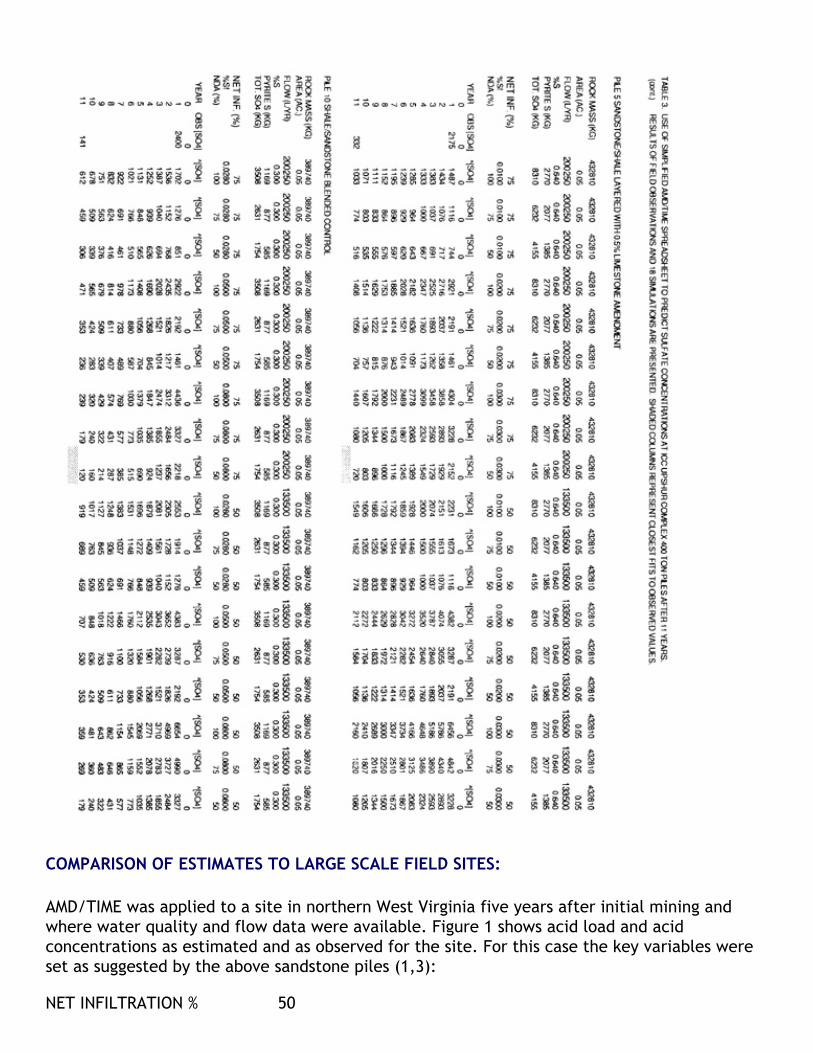
As configured AMD/TIME is an acidity model. It can also be simplified to a sulfate model. Thiswas used to compare various variable combinations to 11 year old 400 ton test pile data atIsland Creek's Upshur Complex (Table 3). Two net infiltration values and three %Sf and %NDArates were tested a factorial arrangement. %Sf was calculated for each pile between each twoweek sampling period. In each pile, %Sf was very slow during the first six months, thenaccelerated rapidly to a maximum within about 10 months. Three estimates of %Sf wereevaluated in this study: 1) low‐%Sf integrated over one year, 2) medium‐%Sf integrated over thelast 7 months and 3) high‐%Sf integrated over the last 5 months.
The column on the left of the table indicates observed sulfate concentrations at the end ofyear one and at the end of year 11. The best fit for each pile and variable combination waschosen and is indicated by the shading.
The best fits were either of the two variable combinations:
PILES: 1,3 2,4,5,10NET INFILTRATION % 50 75%Sf low highNDA(%) 100 50
It was surprising that only two scenarios captured the best fits for all of the test piles.Additionally, piles 1 and 3 were primarily sandstone while the other piles were mainly shale. Itis logical that high NDA fits better with the sandstones given its greater porosity. Why netinfiltration appeared higher on the shale than on the sandstone is a mystery unless this actuallyestimates residence time of water. This analysis is far from definitive. It is just the beginningof what will be a rigorous process of identifying NDA, NDN, %Sf and net infiltrations for variousrock types.


COMPARISON OF ESTIMATES TO LARGE SCALE FIELD SITES:
AMD/TIME was applied to a site in northern West Virginia five years after initial mining andwhere water quality and flow data were available. Figure 1 shows acid load and acidconcentrations as estimated and as observed for the site. For this case the key variables wereset as suggested by the above sandstone piles (1,3):
NET INFILTRATION % 50

%Sf/yr 6%NDA(%) 100
This didn't work very well, estimated acid concentrations and loads were about 4 times higherthan observed in the field. Eventually a good fit (the one shown in figure 1) was found with thefollowing settings:
NET INFILTRATION % 80%Sf/yr 4%NDA(%) 50
Figure 1 shows a shortcoming with AMD/TIME as presently configured: alkalinity is presumed tobe consumed with 100% efficiency until it is exhausted, the acid load curve then leaps fromzero to a high number in the following year. In reality this is, doubtless, a more gradual processthough the net result is likely to be the same.
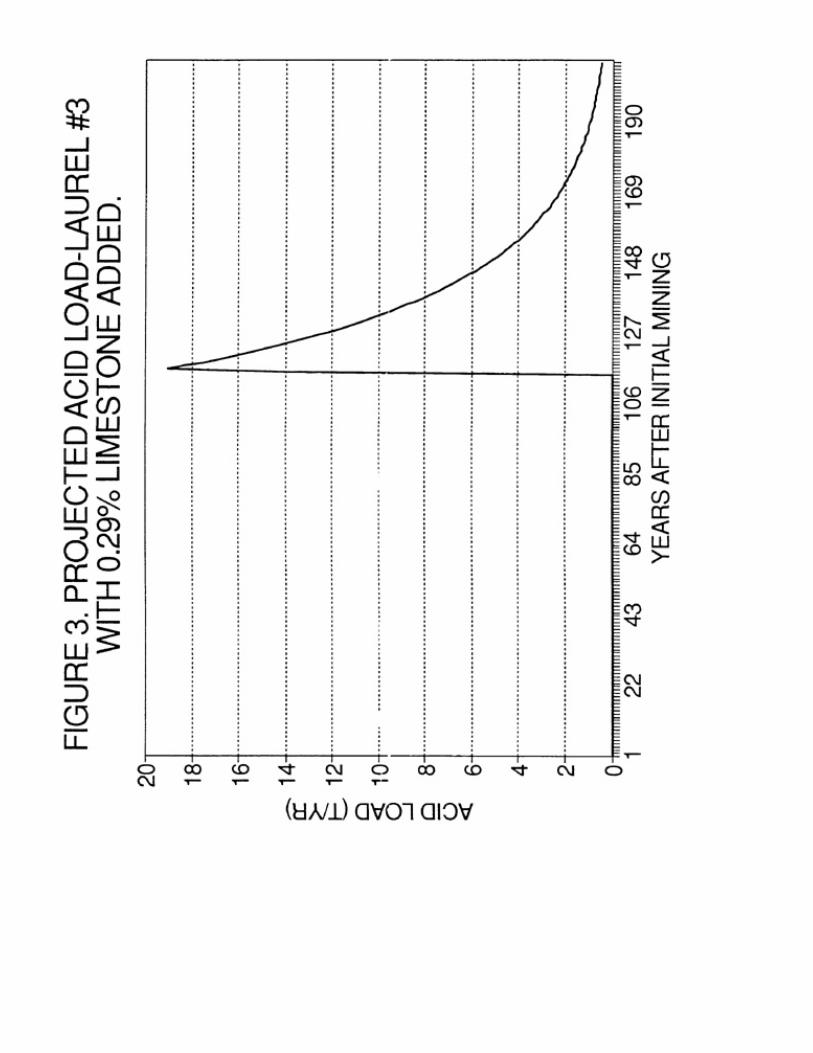
Extension of the curves in figure 1 to the point of acid exhaustion indicates that at year 113acid loading will be 10 tons per year (figure 2.). Long before that, however, it will be negligibleor easily treated in a passive system. AMD/TIME was used to estimate the required amount ofalkaline amendment arid the effects on acid generation. Figure 3 shows that AMD/TIME slightlyunderestimated the required amount (probably by a roundoff error) such that at year 115 theadded limestone was exhausted and a small (19 T/yr) peak in acid load appeared for a fewyears.
Treatment costs are automatically estimated. by AMD/TIME. Figure 4 shows the cumulativecosts of limestone amendment versus 113 years of water treatment using hydrated lime. Withalkaline amendment all costs were incurred during mining.
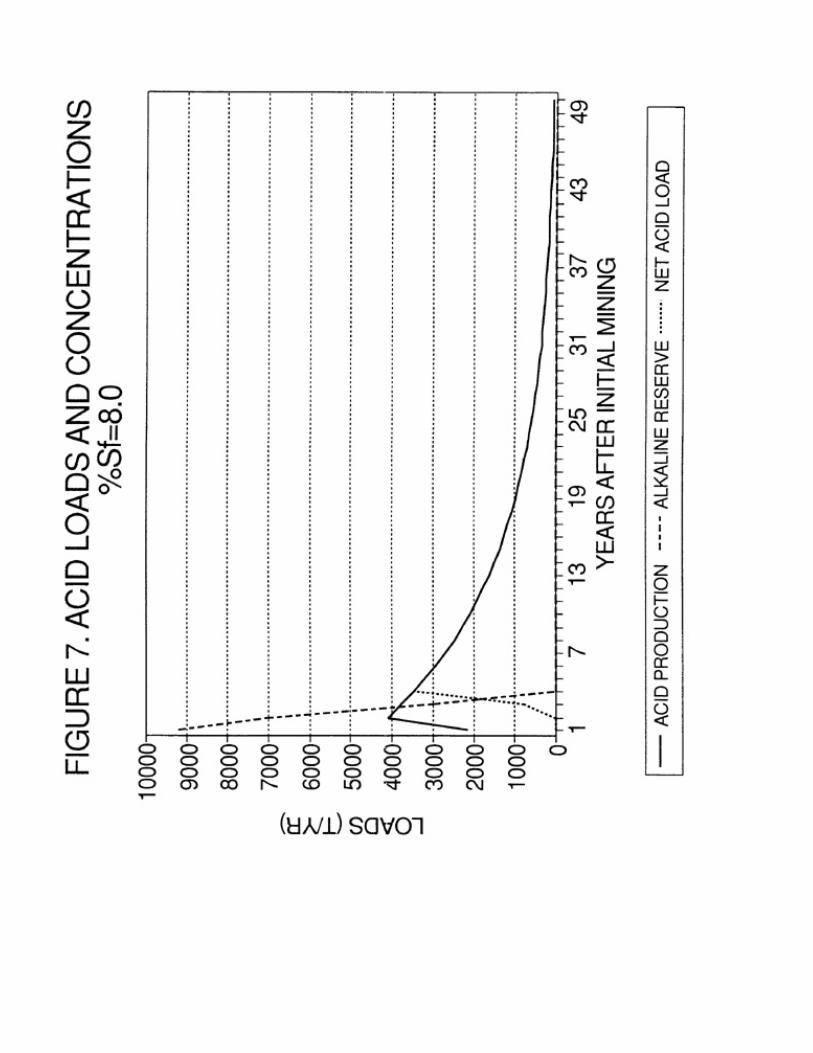
AMD/TIME is extremely sensitive to application of the wrong key variables. Figure 5, 6 and 7show the effects of holding all variables constant while varying %Sf from 1 to 8. It is likely thatmany refuse piles resemble figure 5 (without the alkalinity) while most spoils are closer tofigure 6. An annual sulfur flux such as the 8% shown in figure 7 is unlikely to occur outside thelaboratory. Figure 8 shows a very unhappy situation where, due to poor mixing of alkalinematerials, NDN :s only 75% while NDA is 100%. This is otherwise the same scenario as figure 6.Things get much worse much more quickly, however.


VALIDATION OF AMD/TIME
Like all predictive tools, AMD/TIME is only as good as the variables which make it run. Since ituses empirical variables it is useful to compare predictions within set boundary conditions tofield observations.
The spreadsheet is not proprietary. A copy of the codes is attached in the appendix. Feel freeto copy it and use it. I only ask two favors:

1. let me know if it works for your situation. I will be happy to work with you and your datato zero in on the right variable settings.
2. If it works, I would appreciate acknowledgement, if it does not work, don't bother.
Let me know either way. My phone number is (304) 293 2867.
LITERATURE CITED
Bradham, W.F., and FT Caruccio. 1991. A comparative study of tailings analysis using acid/baseaccounting, cells, columns and soxhlets. pp. 157‐174. In: Proceedings of the SecondInternational Conference on the Abatement of Acidic Drainage. Montreal, P.Q.
Brady, K., and R.J. Hornberger. 1989. Mine drainage prediction and overburden analysis inPennsylvania. In: Proceedings of the 1989 West Virginia Surface Mine Drainage Task ForceSymposium. West Virginia Mining and Reclamation Association, Charleston, WV.
Brady, K., and R.J. Hornberger. 1990. A manual for premining prediction of coal mine drainagequality. Pennsylvania Department of Environmental Resources, Harrisburg, PA.
Brady, K., M.W. Smith, R.L. Beam and C.A. Cravotta. 1990. Effectiveness of the use of alkalinematerials at surface coal mines in preventing or abating acid mine drainage: Part 2. Mine sitecase studies. pp. 227‐241. In: Proceedings of the 1990 Mining and Reclamation Conference,West Virginia University, Morgantown, WV.
Cravotta, C.A., K. Brady, M.W. Smith, and R.L. Beam. 1990. Effectiveness of the addition ofalkaline materials at surface coal mines in preventing or abating acid mine drainage: Part 1.Geochernical considerations. pp. 221‐225. In: Proceedings of the 1990 Mining and ReclamationConference. West Virginia University, Morgantown, WV.
diPretoro, R.S. 1986. Premining prediction of acid drainage potential from surface coal mines innorthern West Virginia. M.S. Thesis, Geology Department, West Virginia University. 217 pp.
diPretoro, R.S. and H.W. Rauch. 1988. Use of acid‐base accounts in premining prediction ofacid drainage potential: a new approach from northern West Virginia. pp. 2‐10. In: MineDrainage and Surface Mine Reclamation. USDI Bureau of Mines Information Circular 9183.
Erickson, P.M., and R.S. Hedin. 1988. Evaluation of overburden analytical methods as means topredict post‐mining coal mine drainage quality. pp. 11‐19. In: Mine Drainage and Surface MineReclamation. USDI Bureau of Mines Information Circular 9183.
Hedin, R.S., and P.M. Erickson. 1988. Relationships between the initial geochemistry andleachate chemistry of weathering overburden samples. pp. 21‐28. In: Mine Drainage andSurface Mine Reclamation. USDI Bureau of Mines Information Circular 9183.
Lapakko, K. 1988. Prediction of acid mine drainage from Duluth Complex mining wastes innortheastern Minnesota. pp. 180‐190. In: Mine Drainage and Surface Mine Reclamation. USDIBureau of Mines Information Circular 9183.
O'Hagan, M., and F.T. Caruccio. 1986. The effect of admixed limestone on rates of pyriteoxidation in low, medium, and high sulfur rocks. In: 1986 National Symposium on Mining,

Hydrology, Sedimentology, and Reclamation. University of Kentucky, Lexington, KY.
Renton, JJ, Rymer, T.E. and Stiller, A.H. 1988 A laboratory procedure to evaluate the acidproducing potential of coal associated rocks. Mining Science and Technology, 7 (1988) 227‐235.
Rich, D.H. and Hutchison, K.R. 1990 Neutralization and stabilization of combined refuse usinglime kiln dust at High Power Mountain. In: Proceedings of the 1990 Mining and ReclamationConference. 2 vols. West Virginia University, Morgantown, WV.
Rymer, T.E., Renton, J.J., and Ziemkiewicz, P.F. 1991, Isolation of critical predictive acidproducing parameters from variable field data using advanced computer technology. In:Proceedings of the Second International Conference on the Abatement of Acidic Drainage,Montreal, P.O.
Shueck, J. 1990 Using a magnetometer for investigating underground coal mine fires, burningcoal refuse banks and for locating AMD source areas in surface mines. In: Proceedings of the1990 Mining and Reclamation Conference and Exhibition. 2 vols. West Virginia University,Morgantown, WV.
Skousen, J., R.M. Smith, and J. Sencindiver. 1990. Development of the Acid‐Base Account.Green Lands 20(l): 32‐37.
Smith, M.W., and K. Brady. 1990. Evaluation of acid base accounting data using computerspreadsheets. pp. 213‐219. In: , Proceedings of the 1990 Mining and Reclamation Conference.West Virginia University, Morgantown, WV.
West Virginia University. 1971. Mine spoil potentials for water quality and controlled erosion.14010 EJE 12/71. Contract with, West Virginia University by the U.S. Environmental ProtectionAgency, Washington D.C.
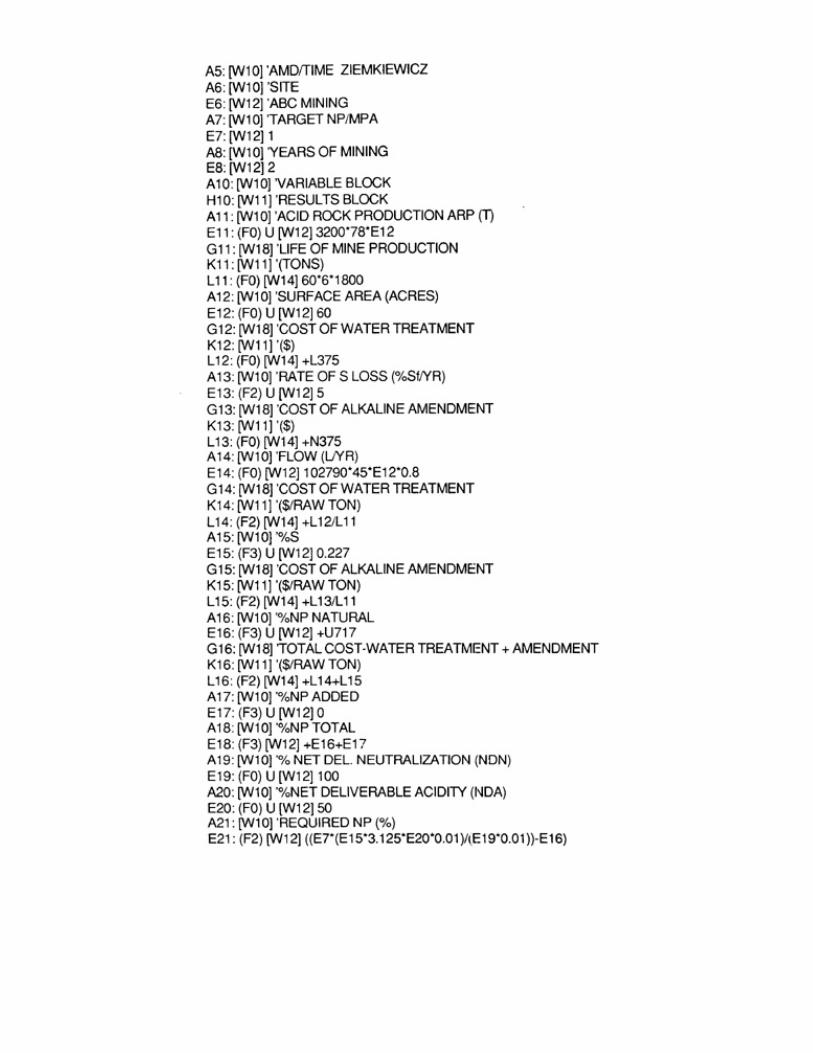
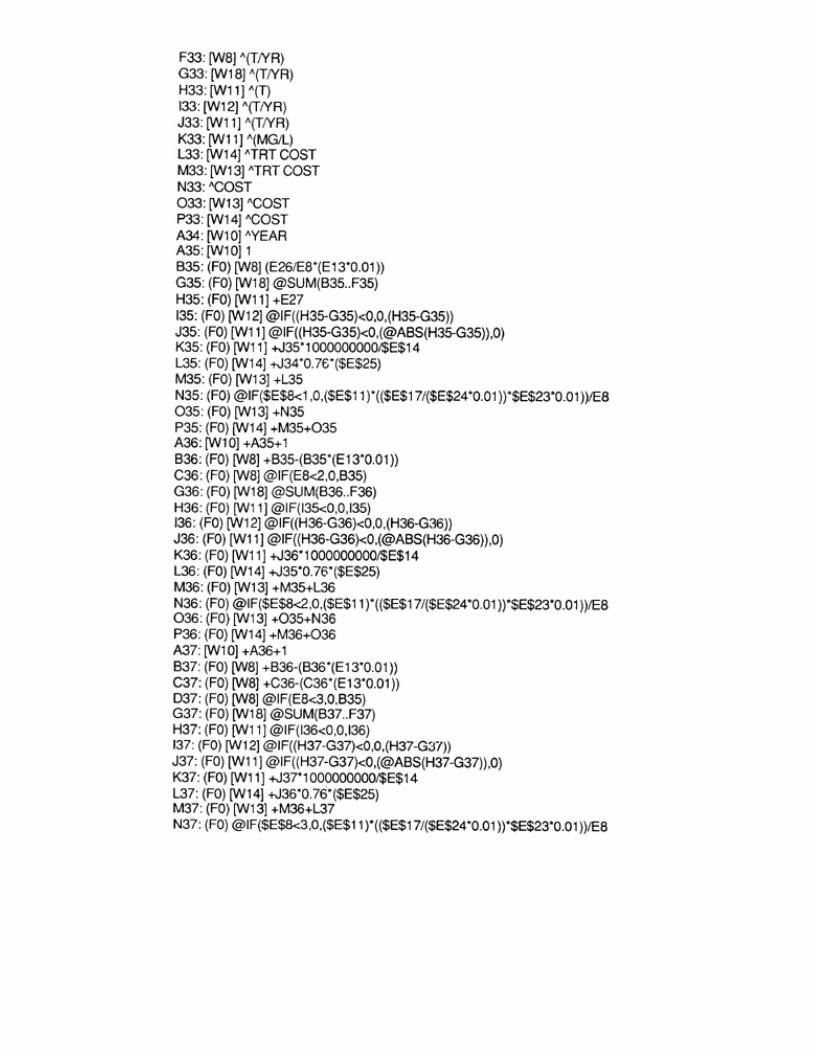
APPENDIX
CODES FOR CONSTRUCTING THE AMD/TIME SPREADSHEET
THE COLUMN ON THE LEFT INDICATES THE CELL ADDRESS
DESIGNATIONS SUCH AS [W10] AND (F0)
ONLY REFER TO CELL WIDTHS AND FONTS. THEY ARE NOT IMPORTANT.