Embed Size (px)
Citation preview

Ameren Missouri Heating
and Cooling Program
Impact and Process
Evaluation: Program Year
2015 Final May 13, 2016
Ameren Missouri 1901 Chouteau Avenue
St. Louis, MO 63103


This page left blank.

Prepared by:
John Walczyk
Andrew Carollo
Byron Boyle
Trent Hardman
Bitsy Broughton
Jane Colby
M. Sami Khawaja, Ph.D.
Cadmus

This page left blank.


Table of Contents Executive Summary ....................................................................................................................................... 1
Program Description ............................................................................................................................... 1
Key Impact Evaluation Findings .............................................................................................................. 1
Key Process Evaluation Findings ............................................................................................................. 4
Key Conclusions ...................................................................................................................................... 4
Introduction .................................................................................................................................................. 8
Program Description ............................................................................................................................... 8
Program Activity ..................................................................................................................................... 8
Evaluation Methodology ............................................................................................................................. 10
Impact Evaluation Priorities ................................................................................................................. 10
Process Evaluation Priorities ................................................................................................................ 10
Data Tracking Review ........................................................................................................................... 11
Stakeholder Interviews ......................................................................................................................... 12
Contractor Interviews ........................................................................................................................... 12
Distributor Interviews........................................................................................................................... 13
Participant Surveys ............................................................................................................................... 13
Engineering Analysis ............................................................................................................................. 14
Cost-Effective Analysis.......................................................................................................................... 16
Impact CSR ............................................................................................................................................ 16
Process Evaluation Findings ........................................................................................................................ 18
Heating and Cooling Program Design and Delivery .............................................................................. 18
CSR Summary ....................................................................................................................................... 32
Gross Impact Evaluation Results ................................................................................................................. 35
Cooling Savings Estimates .................................................................................................................... 35
Heating Savings Estimates .................................................................................................................... 35
Measure-Specific Gross Savings ........................................................................................................... 35
Summary............................................................................................................................................... 45
Net Impact Evaluation Results .................................................................................................................... 47
Free Ridership–Ground Source and Air Source Heat Pumps ............................................................... 48
Free Ridership: Tune-Ups ..................................................................................................................... 50

Participant Spillover ............................................................................................................................. 53
Nonparticipant Spillover ....................................................................................................................... 54
HVAC Nonparticipant Spillover Data Collection ................................................................................... 62
Data Summary ...................................................................................................................................... 63
HVAC Nonparticipant Spillover ............................................................................................................. 65
NTG Summary ....................................................................................................................................... 67
Cost-Effectiveness Results .......................................................................................................................... 68
Appendix A. Ex Post Demand Reductions ................................................................................................... 70
Appendix B. Stakeholder Interview Guide .................................................................................................. 72
Appendix C. Detailed Engineering Calculations and Explanations .............................................................. 74
Appendix D. Free Ridership Scoring Tables ................................................................................................ 77
Appendix E. Participant Survey Instruments .............................................................................................. 84
Appendix F. Contractor Interview Guide .................................................................................................... 85
1
Executive Summary
Ameren Missouri engaged Cadmus and Nexant (the Cadmus team) to perform annual process and
impact evaluations of the Heating and Cooling Program for a three-year period, from 2013 through
2015. This annual report covers the impact and process evaluation findings for Program Year 2015
(PY15), the period from January 1, 2015, through December 31, 2015, the final year of the three-year
program cycle.
Program Description The Heating and Cooling Program offered Ameren Missouri customers living in single-family homes,
condos, or townhomes incentives for installing high-efficiency central air conditioners (CAC) or heat
pumps (HP) through a participating program contractor. The program also offered incentives for
diagnostic testing and tuning of existing HVAC systems to manufacturer specifications and for
installation of variable-speed fan motors. ICF International (ICF) implemented the Heating and Cooling
Program.
Key Impact Evaluation Findings This section presents the Cadmus team’s key impact findings for PY15.
Gross Impacts
Through an engineering analysis and PY13 meter data results, we determined the PY15 program realized
93.5% of the expected (ex ante) gross savings assumed in Ameren Missouri’s Technical Resource Manual
(TRM)1. The evaluation determined a gross realization rate of 86.4% in PY13 and 90.5% in PY14. The
realization rate increased from year-to-year primarily because ground source heat pump participation
increased each year and ground source heat pump ex post savings were more than 160% of ex ante
savings.
Net Savings
To estimate Heating and Cooling Program PY15 net-to-gross (NTG) ratios, the Cadmus team used the
following formula:
NTG = 1.0 – Free Ridership + Participant Spillover + Nonparticipant Spillover + HVAC Nonparticipant
Spillover + Market Effects
For the PY15 evaluation, we estimated free ridership and participant spillover through participant
surveys and contractor interviews. We conducted a nonparticipant spillover (NPSO) survey to determine
NPSO for all of Ameren Missouri’s programs. Program staff worked closely with local contractors and
distributors to improve installation and stocking practices, which could generate a change in the
efficiency of HVAC systems sold in the market. Cadmus interviewed HVAC contractors and equipment
1 “Appendix A - Ameren Missouri Technical Resource Manual” Online: https://www.efis.psc.mo.gov/mpsc/commoncomponents/viewdocument.asp?DocId=935658483

2
distributors to determine the impact of the program over time and to quantify HVAC nonparticipant
spillover (HVAC NPSO). We did not compute market effects because we believe additional program
effects were all captured in the spillover calculations as described in the Net Impact section. Table 1
shows a summary of PY15 participation, realization rate, and ex post evaluated savings for each measure
type.
Table 1. PY15 Participation, Per-Unit Ex Post Gross Savings, Realization Rate
Measure PY15
Participation
Per-Unit Ex Post
Savings (kWh/yr)
Realization
Rate
Total Ex Post
Savings3
(kWh/yr)
HPs
Air Source HP (ASHP)—Early
Replacement of ASHP1
729 5,101 109.6% 3,718,745
ASHP—Early Replacement of Electric
Furnace1
1005 14,405 93.6% 14,476,863
ASHP—Replace at failure of ASHP1 406 1,595 89.9% 647,581
ASHP—Replace at failure of Electric
Furnace1
68 12,840 92.5% 873,111
Dual Fuel HP (DFHP) 1 102 1,184 99.3% 120,734
Ground Source HP (GSHP) 330 21,340 163.2% 7,042,243
CAC—Early Replacement1 9,619 1,799 87.7% 17,305,994
CAC—Replace on Burnout1 300 355 68.7% 106,576
HVAC Systems Receiving Condenser
Cleaning2
9,250 258 50.0% 2,383,997
HVAC Systems Receiving Refrigerant
Charge Adjustment2
1,028 856 448.4% 880,460
HVAC Systems Receiving Evaporator
Cleaning2
359 117 18.3% 41,998
HVAC Systems Receiving General
Maintenance
196 174 100.0% 34,084
ECM Auto Mode, Early Replacement 8,234 649 69.9% 5,346,006
ECM Auto Mode, Replace at failure 376 662 71.3% 248,898
ECM Continuous Mode 400 3,487 375.5% 1,394,769
Thermostat Installed with Setback
Programmed (Discontinued in PY14)
5 83 15.2% 414
Total 32,407 n/a 93.5% 54,622,474 1 Combined incentive tiers (SEER 14, SEER 15, SEER 16). 2Savings adjusted assuming 18% of tune-ups were ASHPs, which have additional savings in heating mode.
3
3Per-unit ex post savings rounded to the nearest integer; therefore, total ex post savings do not exactly equal
the product of per-unit ex post and participation quantity.
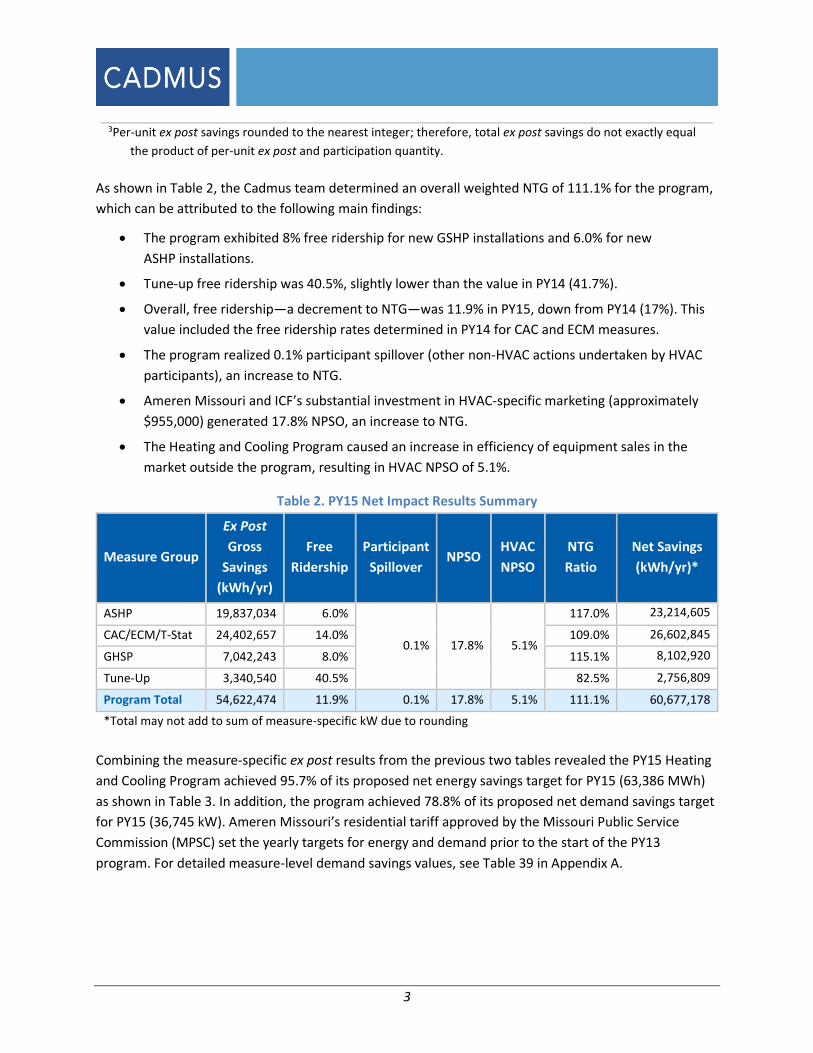
As shown in Table 2, the Cadmus team determined an overall weighted NTG of 111.1% for the program,
which can be attributed to the following main findings:
The program exhibited 8% free ridership for new GSHP installations and 6.0% for new
ASHP installations.
Tune-up free ridership was 40.5%, slightly lower than the value in PY14 (41.7%).
Overall, free ridership—a decrement to NTG—was 11.9% in PY15, down from PY14 (17%). This
value included the free ridership rates determined in PY14 for CAC and ECM measures.
The program realized 0.1% participant spillover (other non-HVAC actions undertaken by HVAC
participants), an increase to NTG.
Ameren Missouri and ICF’s substantial investment in HVAC-specific marketing (approximately
$955,000) generated 17.8% NPSO, an increase to NTG.
The Heating and Cooling Program caused an increase in efficiency of equipment sales in the
market outside the program, resulting in HVAC NPSO of 5.1%.
Table 2. PY15 Net Impact Results Summary
Measure Group
Ex Post
Gross
Savings
(kWh/yr)
Free
Ridership
Participant
Spillover NPSO
HVAC
NPSO
NTG
Ratio
Net Savings
(kWh/yr)*
ASHP 19,837,034 6.0%
0.1% 17.8% 5.1%
117.0% 23,214,605
CAC/ECM/T-Stat 24,402,657 14.0% 109.0% 26,602,845
GHSP 7,042,243 8.0% 115.1% 8,102,920
Tune-Up 3,340,540 40.5% 82.5% 2,756,809
Program Total 54,622,474 11.9% 0.1% 17.8% 5.1% 111.1% 60,677,178
*Total may not add to sum of measure-specific kW due to rounding
Combining the measure-specific ex post results from the previous two tables revealed the PY15 Heating
and Cooling Program achieved 95.7% of its proposed net energy savings target for PY15 (63,386 MWh)
as shown in Table 3. In addition, the program achieved 78.8% of its proposed net demand savings target
for PY15 (36,745 kW). Ameren Missouri’s residential tariff approved by the Missouri Public Service
Commission (MPSC) set the yearly targets for energy and demand prior to the start of the PY13
program. For detailed measure-level demand savings values, see Table 39 in Appendix A.

4
Table 3. PY15 Savings Comparisons
Metric
MPSC-
Approved
Target1
Ex Ante Gross
Savings Utility
Reported2
Ex Post Gross
Savings Determined
by EM&V3
Ex Post Net Savings
Determined by
EM&V4
Percent of
Goal
Achieved5
Energy (MWh) 63,386 58,451 54,622 60,677 95.7%
Demand (kW) 36,745 19,435 26,949 28,951 78.8% 1 https://www.ameren.com/-/media/missouri-site/Files/Rates/UECSheet191EEResidential.pdf 2 Calculated by applying tracked program activity to TRM savings values. 3 Calculated by applying tracked program activity to Cadmus’ evaluated savings values. Includes line loss factor of
5.72%. 4 Calculated by multiplying Cadmus’ evaluated gross savings and the NTG ratio, which accounted for free ridership,
participant spillover, NPSO, and HVAC NPSO. 5 Compares MPSC-approved target and ex post net savings, determined by evaluation, measurement, and
verification (EM&V).
Key Process Evaluation Findings Stakeholders (Ameren Missouri and ICF), program participants, and participating HVAC contractors were
generally satisfied with the Heating and Cooling Program. Stakeholders believed the program was
largely successful in PY15 in terms of savings, satisfaction, and meeting participation goals. Greater than
90% of program participants were satisfied or very satisfied with the program and with their
participating HVAC contractor. HVAC contractors generally felt that since PY13, the program had
become much more streamlined. Though contractors commonly express displeasure with HVAC
incentive application process requirements of utility energy efficiency programs, PY15 Ameren Missouri
participating contractors offered few complaints about the program requirements. In fact, many claimed
that some requirements benefitted both their customers and their businesses.
Ameren Missouri aggressively marketed the Heating and Cooling Program in PY15, allocating more than
50% of its entire energy efficiency marketing budget to the Heating and Cooling Program. Participation
of nearly all measures increased in PY15. ASHPs save more energy than CACs; so Ameren Missouri
specifically promoted these systems in various ways. As a result, heat pump incentives increased
significantly, relative to other measures.
Key Conclusions Based on the preceding findings, the Cadmus team presents the following conclusions.
Conclusion 1. Free ridership of high-efficiency equipment measures decreased each year, from PY13 to
PY15. In PY13, Cadmus found free ridership (25%) similar to or lower than other residential heating and
cooling efficiency programs. Free ridership in PY14 declined to 17% overall for the Heating and Cooling
Program and declined again to 11.9% in PY15. The decline from PY14 to PY15 was attributed entirely to
the updated free ridership rates of HP participants.

5
The increase in program familiarity and high satisfaction leading to promotion by word of mouth
appeared to be factors helping to promote the program to Ameren Missouri customers, who otherwise
would not have chosen to participate. Ameren Missouri program staff increased incentives and
encouraged HVAC contractors to promote HP measures, which also likely contributed to the decrease in
free ridership rates.
Recommendation: Continue to perform targeted marketing, especially to Ameren Missouri customers
with high electric energy consumption (i.e., weather-related heat load) during the heating season and
who are eligible for an HP early replacement measure.
Conclusion 2. The program’s presence affected the volume and efficiency of HVAC systems sold in
Ameren Missouri service territory. According to the contractor and distributor sales data, the
distribution of 13 SEER units decreased from 2012 to 2015. Contractors reported that 39% of 2012
installs were 13 SEER, compared to only 9% in 2015. Distributors reported a similar drop in 13 SEER
units, from 76% of all sales in 2012 to only 53% in 2015. It is noteworthy that distributors estimated that
their 2016 share of 13 SEER units will increase to 68% of all sales (absent the program); this reflects a
decrease in energy-efficient units from current levels, but still remains higher than in 2012. The team
found that HVAC NPSO is 5.1% of total Heating and Cooling Program energy savings. The distributor
estimates of 13 SEER sales in absence of a heating and cooling program is anecdotal evidence that the
HVAC NPSO estimate is reasonable.
Conclusion 3. Heating and Cooling Program implementers, managers, and participants are generally
satisfied with the program. Through interviews and surveys of contractors, stakeholder, and program
participants, Cadmus identified various complaints and issues in PY13 and PY14. These included the
following:
The application process was too cumbersome and time-consuming;
The tune-up testing requirements were cost-prohibitive
HP eligibility criteria precluded participation of systems that could save energy.
In PY15, Cadmus interviewed HVAC contractors, participants, stakeholders, and distributors and did not
identify substantial or common issues with the program process or measures offered. In PY15, the
program operated smoothly and successfully.
Conclusion 4. HVAC contractors are the key to the program’s success, but it takes time to build a
successful program with them. ICF held contractor advisory sessions (started midway through PY14),
working directly with contractors to better understand their needs and to find ways to ensure a
successful program. Ameren Missouri and ICF continued to use the advisory sessions to make various
types of program improvements. ICF also employed five service account managers, who were dedicated
to working directly with contractors. Contractors claimed the program interaction, web application
process, and marketing tools in PY15 improved substantially and helped to drive the sale of high-

6
efficiency equipment. Most participants claimed their contractor was very influential in their decision-
making process, implicitly implying that HVAC contractors were key to program successes.
Recommendation: To the extent possible, continue positive and regular communications, even prior to
launching any new energy efficiency program offerings; this keeps contractors informed and interested
in future participation.
PY14 Recommendation Tracking
Cadmus also examined actions taken on the PY14 evaluation’s recommendations to track which of these
were or were not implemented. Ameren Missouri implemented all PY14 recommendations, as shown in
Table 4.
Table 4. PY14 Evaluation Recommendation Tracking
PY14 Recommendation Cadmus Findings
Explanation
ICF should develop a systematic methodology for screening reported data. Although ICF already works directly with contractors who report erroneous data or who fail post-measure M&V tests, they could continue to improve the effectiveness of this process. ICF should consider using engineering values and limits to instantly flag bad data, so they can efficiently report this to the contractor. Examples of automatic screening include permissible maximum and minimum values of recorded measurements, such as CFM/ton, Watts/CFM, kW/ton, and the supply and return temperature differential.
Implemented
ICF implemented a screening of several factors, in consultation with Cadmus. These were tracked in conjunction with tune-up data collection requirements for contractors.
Recommendation 2. Consider including additional multifamily-style buildings. Currently, the Heating and Cooling Program precludes multifamily style buildings larger than four units. Such buildings may offer substantial savings opportunities for both the program’s tune-up and replacement elements, especially those with electric resistance heat.
Implemented
This change was made in February 2015. Program guidelines were changed to allow “rowhouses” (greater than four units) into the program.
Recommendation 3. Continue marketing efforts, especially targeted marketing of homes with high-propensity electric energy consumption data. The replacement of electric resistance heat results in the highest savings of all Heating and Cooling Program measure offerings. If customers with electric heat are targeted by the program, the free ridership rate could continue to decline in PY15.
Implemented
Marketing to all-electric customers has been underway throughout the program cycle. The fall-targeted marketing was coupled with a contractor contest to drive HP production to 250% of that attained in 2014.
Recommendation 4. Continue marketing efforts and consider offering a focus group to solicit feedback from contractors. The Evaluation Team did not perform contractor interviews in PY14. Continued participation and stakeholder feedback indicates contractors are relatively satisfied with the program. If Ameren Missouri or ICF hosts a focus group of the largest participating contractors and those who choose not to participate, they may uncover invaluable information for future
Implemented
This was implemented in 2014. A Contractor Advisory Group was initiated, including quarterly in-person meetings and ad-hoc communications. Input from this group was used when implementing design changes, marketing campaigns, and

7
PY14 Recommendation Cadmus Findings
Explanation
program design changes. Contractors also offer unique perspectives that could be used to inform future program measure planning decisions. Contractors are well-positioned to discuss the current measure offerings, assess the impact of new technology entering the market (e.g., ductless mini-split HPs), or assess the impact of the changing efficiency standards.
measure mix and availability. The group included not only the largest contractors, but regional representation as well.

8
Introduction
Ameren Missouri engaged Cadmus and Nexant (the Cadmus team) to perform a process evaluation and
an impact evaluation of the Heating and Cooling Program for a three-year period. This annual report
covers impact and process evaluation findings for Program Year 2014 (PY15), the period from January 1,
2015, through December 31, 2015, the final year of the three-year program cycle.
Program Description The Heating and Cooling Program offered Ameren Missouri customers living in single-family homes,
condos, or townhomes incentives for installing high-efficiency central air conditioners (CAC) or heat
pumps (HP) through a participating program contractor. The program also offered incentives for the
installation of variable-speed fan motors. In addition to equipment incentives, the program offered an
incentive for diagnostic testing and tuning of existing HVAC systems to manufacturer specifications
through the Tune-Up Plus Ameren Missouri Efficiency Analysis (TEA).
To participate, a residential customer must have had a measure installation performed by a participating
contractor. The participating contractor submitted all required paperwork for incentive processing. To
become a participating contractor, an HVAC company representative needed to attend a program
training session conducted by ICF International (ICF), the implementer.
Program Activity In PY15, 20,233 participants received a total of 32,407 measures through the Heating and Cooling
Program (many program participants received multiple rebates). This represented a 31% increase in
rebates from PY14. Table 5 summarizes results from the four primary measure types. The process
evaluation findings section explains the factors contributing to the increase in participation. Key factors
include:
Increased program marketing efforts
Additional contractor training options
Mid-year incentive increases
Contractor promotional sales bonuses
Contractor familiarity with the program
Incentive application process improvements

9
Table 5. PY14 and PY15 Program Activity of the Measures with Highest Participation
Measure Number of Systems/
Measures in PY14
Number of Systems/
Measures in PY15
ASHPs 1,362 2,310
GSHPs 138 330
CACs 7,288 9,919
Tune-Ups* 8,894 10,833
*Total number of HVAC systems receiving a tune-up. Total does not match total
number of tune-up measures as some systems received multiple tune-up measures.
10
Evaluation Methodology
In evaluating Ameren Missouri’s Heating and Cooling Program, the Cadmus team identified the following
objectives for PY15.
Impact Evaluation Priorities Conduct a detailed engineering review of Tune-Up Plus Ameren Missouri Efficiency Analysis
(TEA) measurements to determine savings from HVAC system tune-ups;
Assess free ridership;
Assess spillover;
Determine effects from the Heating and Cooling program changing the efficiency of HVAC
equipment sold in Ameren Missouri Service territory.
Process Evaluation Priorities Assess the impacts from program design changes, marketing activities, and program processes.
Assess the program’s achievements against goals.
Examine participants’ experiences, satisfaction with various program design elements, and
decision-making motivations.
Examine participating HVAC contractors’ experiences with the program, satisfaction with the
program, and their assessments of the Heating and Cooling Program’s impact.
Identify primary market barriers, and offer suggestions for effectively overcoming barriers
through program design and delivery improvements.
Table 6 lists evaluation activities conducted in PY15 to reach the above objectives, followed by brief
summaries of each activity.

11
Table 6.PY15 Process and Impact Evaluation Activities and Rationale
Evaluation Activity Process Impact Rationale
Review the Tracking Data • •
Provide ongoing support to ensure tracking of all necessary
program data; identify gaps for evaluation, measurement,
and verification (EM&V) purposes.
Interview Stakeholders • Obtain an in-depth understanding of the program and
identify its successes and challenges.
Survey Participants
(Phone) • •
Verify measure installation; collect data to inform the net-
to-gross (NTG) ratio; collect process-related data and
resident satisfaction.
Interview Participating
HVAC Contractors • •
Obtain an in-depth understanding of the program and
identify its successes and challenges, and determine
recommendations for improvement from a contractor’s
perspective. Collect data on recent sales and efficiency of
equipment installed to determine HVAC NPSO.
Interview HVAC
Distributors •
Collect data on recent sales and efficiency of equipment
installed to determine HVAC NPSO.
Conduct an Engineering
Analysis • Determine gross kWh savings for each measure.
Conduct a Cost-
Effectiveness Analysis •
Measure the program’s cost-effectiveness through five
standard perspectives: total resource cost, utility cost,
societal cost test, participant cost test, and ratepayer
impact test.
Data Tracking Review The Ameren Missouri Technical Resource Manual (TRM) provides deemed savings estimates, rather than
savings algorithms, for each measure. In PY13, the Cadmus team performed a detailed engineering
review of the TRM’s ex ante savings estimates for each measure. The PY13 Evaluation Report describes
the Cadmus team’s observations and findings of the deemed savings value for each measure.2 In
conjunction with the TRM review, the Cadmus team reviewed the program’s online reporting database
(Vision Analytics) used by ICF. Specifically, we assessed whether ICF gathered the data necessary for an
accurate evaluation; this included an assessment of data quality and completeness.
ICF provided two databases: Vision and the “OCC Savings”3 database—an Excel file used to track
diagnostic tune-up data from each tune-up performed.
2 “Ameren Missouri CoolSavers Impact and Process Evaluation: Program Year 2013”. Online: https://www.efis.psc.mo.gov/mpsc/commoncomponents/viewdocument.asp?DocId=935842419 CAC measures: pg. 40. ASHP and GSHP measures: pg. 45. Tune-up measures: pg. 46-47. ECM measures: pg. 50-51.
3 ICF’s nomenclature for this database.

12
The Vision database, which was continuously updated, contained information such as the following:
Incentive amount
Measure type
Customer information
New HVAC equipment information
Existing (replaced) equipment information
The OCC savings database (transmitted electronically) contained diagnostic information regarding
program tune-ups and tracked the following information:
Qualitative information about the work performed (e.g., refrigerant was adjusted,
condenser was cleaned)
Outdoor air temperature
Pre and post HVAC cooling capacity
Pre and post HVAC system power
HVAC system type (AC or HP)
HVAC system serial number
HVAC system size
Stakeholder Interviews For the Heating and Cooling Program PY15 evaluation, the Cadmus team interviewed Ameren Missouri
and ICF program managers. We designed these interviews to accomplish the following:
Gather information on how effectively the program operated;
Identify challenges encountered by program staff and the implementer; and
Determine appropriate solutions.
Appendix B provides a copy of the guide used.
Contractor Interviews In December 2015, the Cadmus team completed interviews with 11 participating contractors inside
Ameren Missouri’s territory. From a list of 310 actively participating contractors, we generated a
random sample of 30 for contacts. Our probability of selecting a contractor was weighted by the volume
of participation. The random sample of 11 contractors interviewed were responsible for 70% of all tune-
ups and 37% of CAC and ASHP installations. We also used interviews to capture data on recent sales and
on the efficiency of equipment installed. We focused the data collection from PY15 participating
contractors on the number of sales of various efficiency levels before and during the 2013–2015 Heating
and Cooling Program (PY15 data), which we then compared to similar data collected from PY13
participating contractors in February and March 2014 (PY13 data). Appendix F provides a copy of the
interview guide used.

13
Distributor Interviews In December 2015 and January 2016, Cadmus interviewed and collected data from HVAC equipment
distributors operating within Ameren Missouri’s service territory to capture data on recent sales and on
the efficiency of equipment installed. We focused the data collection from PY15 distributors on the
number of sales of various efficiency levels before and during the 2013–2015 Heating and Cooling
Program (PY15 data), which we then compared to similar data collected from PY13 distributors in
February and March 2014 (PY13 data). In total, we interviewed seven distributors, and four offered sales
data.
Participant Surveys In December 2015, the Cadmus team conducted two telephone surveys of Heating and Cooling Program
participants, completing 140 surveys, as shown in Table 7. A total of 70 TEA participants were surveyed.
Another 70 Heat Pump participants were surveyed, with this group made up of 22 customers that
installed GSHPs and 48 customers that installed ASHPs.
This process evaluation refers to the two groups of Heating and Cooling Program surveyed participants
as TEA participants (n=70) and Heat Pump participants (n=70). Except where noted, answers to survey
questions do not include participants that responded “don't know” or refused to respond.
The surveys covered topics for both the impact and process evaluations. These included: measure
verification, free ridership, spillover, participant awareness and decision making, and satisfaction.
Appendix E provides copies of the survey instruments used. The average participation month for
respondents who received a tune-up rebate was July; the average participation month for respondents
who received an HVAC replacement rebate was late August. This resulted in a time lapse of four to five
months between participation and survey.
Table 7. Heating and Cooling Program Participant Survey Summary
Target Audience Survey Method Field Dates Completed Surveys
HVAC - GSHP Phone 12/15 – 12/17 22
HVAC - ASHP Phone 12/15 – 12/17 48
TEA Participants Phone 12/14 – 12/17 70
Total - - 140
Survey results may be influenced by the time elapsed between a participants’ engagement with a
program and a survey’s administration. Logic implies that a participant’s memory will be more accurate
(i.e., greater recall) closer to the time of participation and less accurate (i.e., recall bias) further from the
participation time. With greater recall, survey results most accurately reflect a participant’s experience
with a program and with installation activities.
However, allowing greater elapsed time between program participation and survey administration
enhances a study’s ability able to capture: installations over time, measure retention, and spillover
14
estimates. Inadequate evidence exists to determine whether recall bias increases or decreases free
ridership estimates.
Optimally, participant surveys will be administered immediately after participation to capture greater
recall and further from the participation time to capture later installations, retention, and spillover.
Conducting multiple participant surveys, however, depends on program and evaluation timelines as well
as budget constraints.
Engineering Analysis To estimate per-unit gross savings for each HVAC measure, the Cadmus team used engineering
algorithms and assumptions with all Ameren Missouri-specific inputs available. These algorithms yielded
estimates of the difference between the energy usage of rebated products and the usage of similar
products meeting the minimum federal standard for efficiency. Table 8 provides a brief overview of the
engineering methodology used to estimate savings.

15
Table 8. Engineering Analysis Summary by Measure
Measure Baseline (Cooling) Baseline (Heating) Type of Savings Calculation
ASHP—Early
Replacement of ASHP
7.2 SEER from
Cadmus meter data
(PY10), adjusted by
age of existing system
6.3 HSPF estimated from
SEER and database
correlating HSPF to SEER
Metered cooling from PY13
updated with PY15 tracking
data; engineering estimate of
heating savings for PY15
ASHP—Early
Replacement of Electric
Furnace
7.2 SEER from
Cadmus meter data
(PY10), adjusted by
age of existing system
Electric furnace
(HSPF =3.412)
Metered cooling from PY13
updated with PY15 tracking
data; engineering estimate of
heating savings for PY15
ASHP—Replace at
Failure of ASHP
13 SEER—federal
minimum
7.7 HSPF—federal
minimum
Metered cooling from PY13
updated with PY15 tracking
data; engineering estimate of
heating savings for PY15
ASHP—Replace at
Failure of Electric
Furnace
13 SEER—federal
minimum
Electric furnace
(HSPF =3.412; COP = 1)
Metered cooling from PY13
updated with PY15 tracking
data; engineering estimate of
heating savings for PY15
GSHP – Replaces Electric
Resistance Heat
7.2 SEER from
Cadmus meter data
(PY10), adjusted by
age of existing system
Electric furnace
(HSPF =3.412; COP = 1)
Metered cooling from PY13
updated with PY15 tracking
data; engineering estimate of
heating savings for PY15
GSHP – Replaces ASHP
7.2 SEER from
Cadmus meter data
(PY10), adjusted by
age of existing system
6.3 HSPF estimated from
SEER and database
correlating HSPF to SEER
Metered cooling from PY13
updated with PY15 tracking
data; engineering estimate of
heating savings for PY15
CAC—Early
Replacement
7.2 SEER from
Cadmus meter data
(PY10), adjusted by
age of existing system
N/A
Metered cooling from PY13
updated with PY15 tracking
data
CAC—Replace on
Burnout
13 SEER –federal
minimum N/A
Metered cooling from PY13
updated with PY15 tracking
data
HVAC Systems Receiving
Condenser Cleaning
Pre tune-up EER from
contractor reported
measurements
Apply % EER improvement
to HSPF for HPs
Apply ΔEER to metered cooling
consumption
HVAC Systems Receiving
Refrigerant Charge
Adjustment
Pre tune-up EER from
contractor reported
measurements
Apply % EER improvement
to HSPF for HPs
Apply ΔEER to metered cooling
consumption from PY13
metering
HVAC Systems Receiving
Evaporator Cleaning
Pre tune-up EER from
contractor reported
measurements
Pre tune-up EER from
contractor reported
measurements
Apply ΔEER to metered cooling
consumption
16
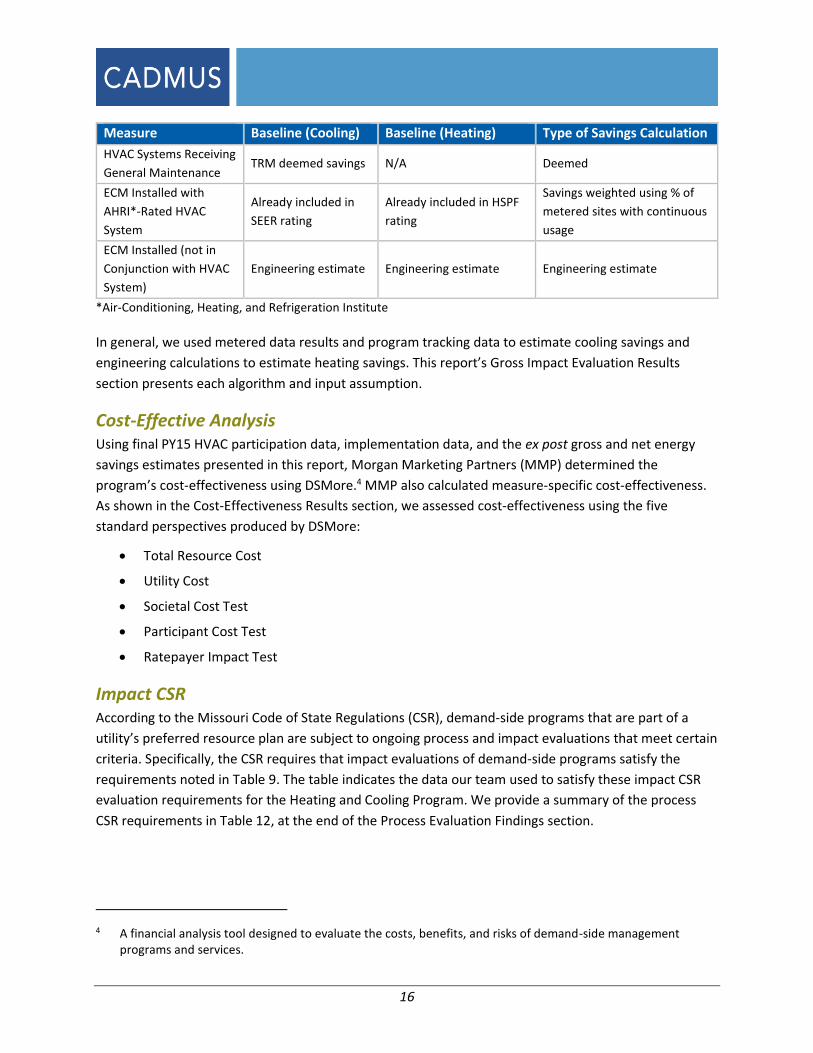
Measure Baseline (Cooling) Baseline (Heating) Type of Savings Calculation
HVAC Systems Receiving
General Maintenance TRM deemed savings N/A Deemed
ECM Installed with
AHRI*-Rated HVAC
System
Already included in
SEER rating
Already included in HSPF
rating
Savings weighted using % of
metered sites with continuous
usage
ECM Installed (not in
Conjunction with HVAC
System)
Engineering estimate Engineering estimate Engineering estimate
*Air-Conditioning, Heating, and Refrigeration Institute
In general, we used metered data results and program tracking data to estimate cooling savings and
engineering calculations to estimate heating savings. This report’s Gross Impact Evaluation Results
section presents each algorithm and input assumption.
Cost-Effective Analysis Using final PY15 HVAC participation data, implementation data, and the ex post gross and net energy
savings estimates presented in this report, Morgan Marketing Partners (MMP) determined the
program’s cost-effectiveness using DSMore.4 MMP also calculated measure-specific cost-effectiveness.
As shown in the Cost-Effectiveness Results section, we assessed cost-effectiveness using the five
standard perspectives produced by DSMore:
Total Resource Cost
Utility Cost
Societal Cost Test
Participant Cost Test
Ratepayer Impact Test
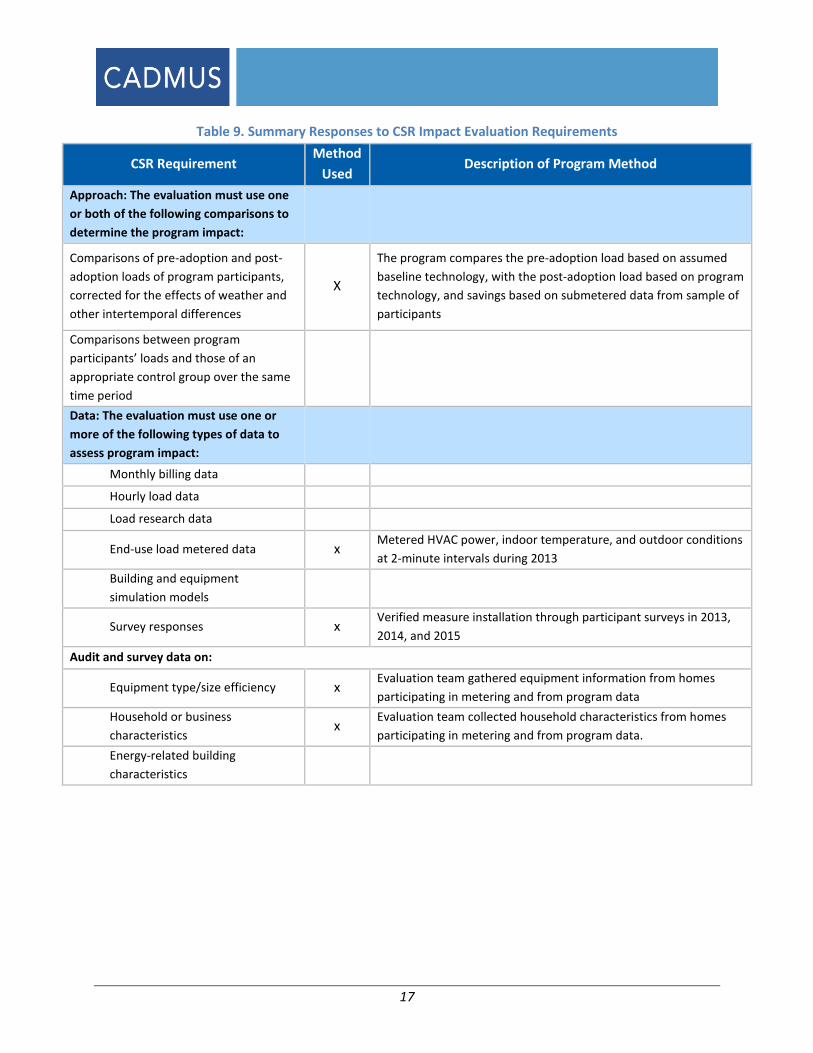
Impact CSR According to the Missouri Code of State Regulations (CSR), demand-side programs that are part of a
utility’s preferred resource plan are subject to ongoing process and impact evaluations that meet certain
criteria. Specifically, the CSR requires that impact evaluations of demand-side programs satisfy the
requirements noted in Table 9. The table indicates the data our team used to satisfy these impact CSR
evaluation requirements for the Heating and Cooling Program. We provide a summary of the process
CSR requirements in Table 12, at the end of the Process Evaluation Findings section.
4 A financial analysis tool designed to evaluate the costs, benefits, and risks of demand-side management programs and services.
17
Table 9. Summary Responses to CSR Impact Evaluation Requirements
CSR Requirement Method
Used Description of Program Method
Approach: The evaluation must use one
or both of the following comparisons to
determine the program impact:
Comparisons of pre-adoption and post-
adoption loads of program participants,
corrected for the effects of weather and
other intertemporal differences
X
The program compares the pre-adoption load based on assumed
baseline technology, with the post-adoption load based on program
technology, and savings based on submetered data from sample of
participants
Comparisons between program
participants’ loads and those of an
appropriate control group over the same
time period
Data: The evaluation must use one or
more of the following types of data to
assess program impact:
Monthly billing data
Hourly load data
Load research data
End-use load metered data x Metered HVAC power, indoor temperature, and outdoor conditions
at 2-minute intervals during 2013
Building and equipment
simulation models
Survey responses x Verified measure installation through participant surveys in 2013,
2014, and 2015
Audit and survey data on:
Equipment type/size efficiency x Evaluation team gathered equipment information from homes
participating in metering and from program data
Household or business
characteristics x
Evaluation team collected household characteristics from homes
participating in metering and from program data.
Energy-related building
characteristics

18
Process Evaluation Findings
This section presents the Cadmus team’s process evaluation findings for Ameren Missouri’s
Heating and Cooling Program.
Heating and Cooling Program Design and Delivery According to stakeholders, Ameren Missouri and ICF collaborated to design the Heating and Cooling
Program to achieve three main objectives:
Broaden the market supply for high-efficiency HVAC equipment and diagnostic tune-up
services;
Educate customers about Ameren Missouri’s full suite of residential energy-efficiency
offerings; and
Minimize NTG impacts.
Ameren Missouri and ICF implemented several changes in PY15, including the following:
Adding an incentive for a geothermal HP that replaces an ASHP;
Increasing various incentives for most types of CAC, ASHP, and GSHP installations;
Requiring contractors to provide tune-up participants with an Ameren Missouri Efficiency
Analysis form that provides the results of the diagnostic test of their HVAC system (this
included options for replacement incentives);
Including a $100 additional incentive for early replacement CAC and ASHP equipment in
August and September 2015; and
Offering a tiered financial incentive to HVAC contractors installing ASHP in the fall (October 15–
December 15).
Program Marketing
According to the Cadmus team’s assessment of PY15 marketing expenditures, Ameren Missouri
marketed the Heating and Cooling Program more aggressively than all of its residential energy-efficiency
programs combined (58% of total PY15 marketing). Ameren Missouri increased marketing spending
from $882,000 in PY14 to $955,000 in PY15. The following list represents some of the primary methods
Ameren Missouri and ICF used to market the Heating and Cooling Program to Ameren Missouri
customers in PY15:
Targeted direct-mail postcards to customers with low-efficiency systems (determined
through performance testing from tune-up measure)
Targeted direct-mail postcards to customers in areas of the highest participation propensity
Target direct-mail postcards to customers identified as all electric
Fall Heat Pump Promotion marketing

19
Increased rebates marketing
E-mails to customers
Website banners and Ameren Missouri’s website
Gas pump toppers
Newspaper advertisements
Utility bill inserts, including personal energy reports
Newspaper advertisements
Radio advertisements
Radio live reads
Internet radio ads (e.g., Pandora)
Television commercials
Television “taggables” (e.g., Weather Channel)
Stakeholders believed ongoing outreach to and positive relationships with participating contractors
proved invaluable and necessary to ensure the program met its savings goals. ICF hosted various
luncheons for contractors as well as an appreciation dinner in February, which recognized contractors
with the highest participation rates. ICF employed five dedicated account managers to work closely with
contractors throughout the year.
To better understand the needs of contractors, stakeholders held quarterly contractor advisory
meetings. The advisory group included contractors of varying participation rates and sizes. The
stakeholders used the feedback from the contractor advisory group to inform marketing to customers
and to develop marketing materials for all contractors. More than one-half of the contractors Cadmus
interviewed said the program itself served as a good marketing tool: simply being a qualified contractor
proved beneficial to their business. In addition to the Ameren Missouri name, ICF created a contractor
marketing toolkit, which included templates that provided guidance on co-branding, co-op marketing,
radio, TV, and social media.
Additionally, ICF continued to work with distributors, encouraging them to sell high-efficiency
equipment. In doing so, ICF hired a dedicated account manager to work directly with distributors. The
account manager provided promotional flyers, program information, and a marketing toolkit to
distributors serving Ameren Missouri’s market area. Distributors provided access to their facilities, and,
with help from their territory managers, trained local contractors. Distributors also provided AHRI
certificate information, making the rebate application process easier for contractors. The impact that an
account manager dedicated to working with distributors may have is difficult to quantify. However,
using data provided by distributors, the Cadmus team found that HVAC NPSO resulted in energy savings
equivalent to 5.1% of the total Heating and Cooling Program savings in 2015 (See Section “HVAC
Nonparticipant Spillover” and Table 35). The Cadmus team has attempted to collect sales data from
distributors for numerous evaluations of other utility HVAC programs and has had limited or no success
20
in obtaining useful sales data. With relatively minimal effort, in PY15 Cadmus was able to successfully
interview seven distributors and collect sales data from four (See PY15 Distributor and Contractor Data
section). This success indicates that distributors are willing to support the Heating and Cooling Program.
In addition, the relationship that the ICF dedicated account manager developed, undoubtedly helped to
produce sales data which improved accuracy of the net energy savings estimates attributable to HVAC
NPSO.
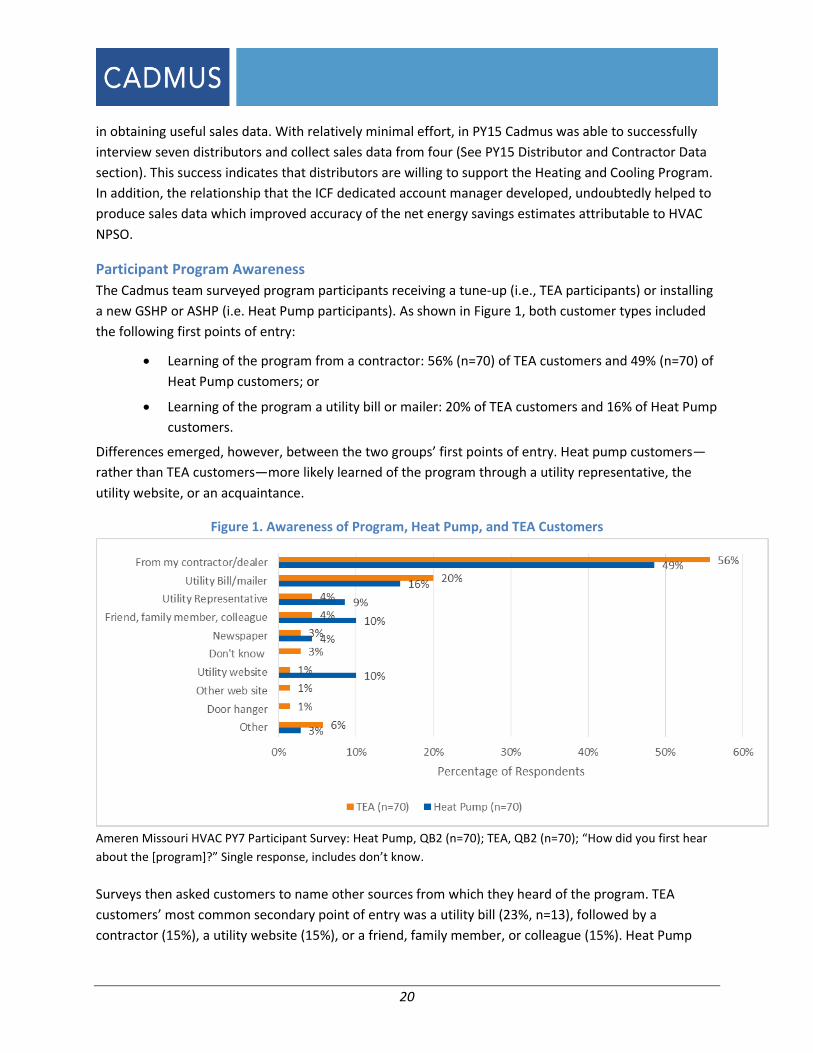
Participant Program Awareness
The Cadmus team surveyed program participants receiving a tune-up (i.e., TEA participants) or installing
a new GSHP or ASHP (i.e. Heat Pump participants). As shown in Figure 1, both customer types included
the following first points of entry:
Learning of the program from a contractor: 56% (n=70) of TEA customers and 49% (n=70) of
Heat Pump customers; or
Learning of the program a utility bill or mailer: 20% of TEA customers and 16% of Heat Pump
customers.
Differences emerged, however, between the two groups’ first points of entry. Heat pump customers—
rather than TEA customers—more likely learned of the program through a utility representative, the
utility website, or an acquaintance.
Figure 1. Awareness of Program, Heat Pump, and TEA Customers
Ameren Missouri HVAC PY7 Participant Survey: Heat Pump, QB2 (n=70); TEA, QB2 (n=70); “How did you first hear
about the [program]?” Single response, includes don’t know.
Surveys then asked customers to name other sources from which they heard of the program. TEA
customers’ most common secondary point of entry was a utility bill (23%, n=13), followed by a
contractor (15%), a utility website (15%), or a friend, family member, or colleague (15%). Heat Pump
21
participants’ three most common additional sources of program information included a contractor (29%,
n=28), a television ad (29%), or a friend, family member, or colleague (18%).
HVAC Equipment Installation Measures
Table 10 summarizes incentives offered by the Heating and Cooling Program for installations of AHRI-
rated air conditioner and heat pump systems. To further promote participation, the implementers
increased many incentives midway through the year. The table shows incentive amounts for all
measures and for changes made after June 2015. For CAC and ASHP systems installed in the months of
August and September, the program offered an additional $100 incentive if replacing an existing,
operating system before its end of life (early replacement).
Table 10 also shows the majority of installations in PY15 were early replacements. A low proportion of
new CAC installations (3%) and new ASHP installations (21%) received an incentive after failure of a
previous HVAC system.
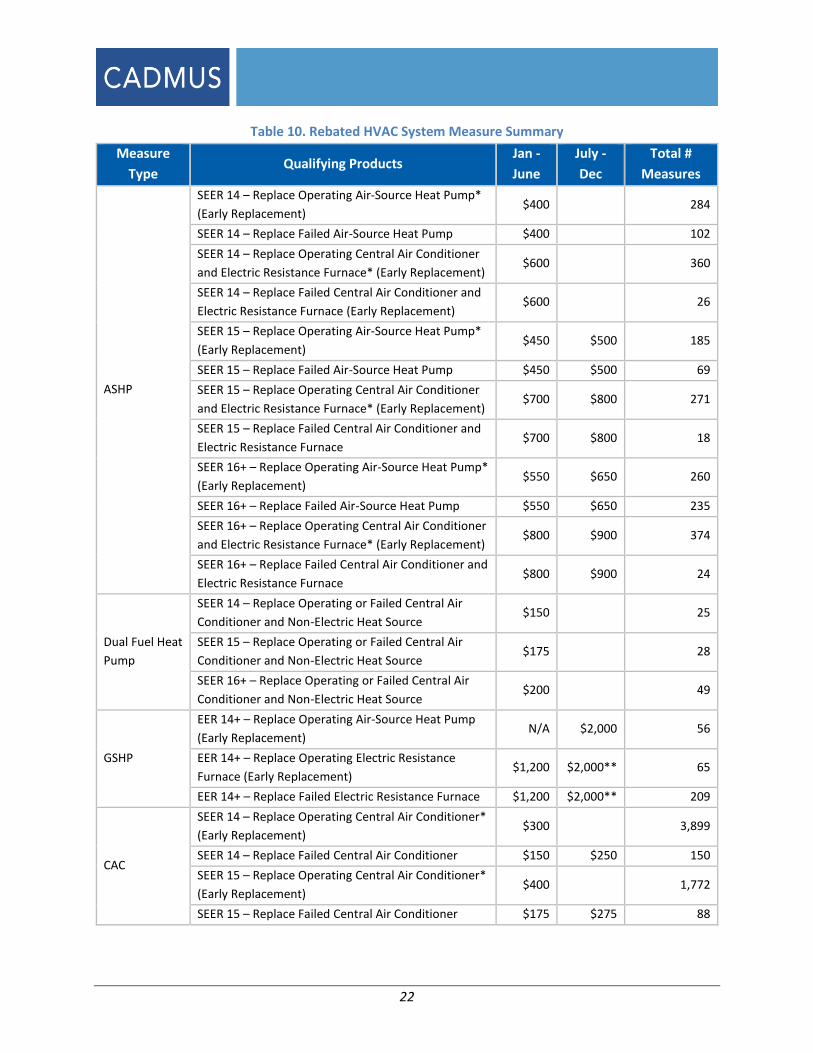
22
Table 10. Rebated HVAC System Measure Summary
Measure
Type Qualifying Products
Jan -
June
July -
Dec
Total #
Measures
ASHP
SEER 14 – Replace Operating Air-Source Heat Pump*
(Early Replacement) $400 284
SEER 14 – Replace Failed Air-Source Heat Pump $400 102
SEER 14 – Replace Operating Central Air Conditioner
and Electric Resistance Furnace* (Early Replacement) $600 360
SEER 14 – Replace Failed Central Air Conditioner and
Electric Resistance Furnace (Early Replacement) $600 26
SEER 15 – Replace Operating Air-Source Heat Pump*
(Early Replacement) $450 $500 185
SEER 15 – Replace Failed Air-Source Heat Pump $450 $500 69
SEER 15 – Replace Operating Central Air Conditioner
and Electric Resistance Furnace* (Early Replacement) $700 $800 271
SEER 15 – Replace Failed Central Air Conditioner and
Electric Resistance Furnace $700 $800 18
SEER 16+ – Replace Operating Air-Source Heat Pump*
(Early Replacement) $550 $650 260
SEER 16+ – Replace Failed Air-Source Heat Pump $550 $650 235
SEER 16+ – Replace Operating Central Air Conditioner
and Electric Resistance Furnace* (Early Replacement) $800 $900 374
SEER 16+ – Replace Failed Central Air Conditioner and
Electric Resistance Furnace $800 $900 24
Dual Fuel Heat
Pump
SEER 14 – Replace Operating or Failed Central Air
Conditioner and Non-Electric Heat Source $150 25
SEER 15 – Replace Operating or Failed Central Air
Conditioner and Non-Electric Heat Source $175 28
SEER 16+ – Replace Operating or Failed Central Air
Conditioner and Non-Electric Heat Source $200 49
GSHP
EER 14+ – Replace Operating Air-Source Heat Pump
(Early Replacement) N/A $2,000 56
EER 14+ – Replace Operating Electric Resistance
Furnace (Early Replacement) $1,200 $2,000** 65
EER 14+ – Replace Failed Electric Resistance Furnace $1,200 $2,000** 209
CAC
SEER 14 – Replace Operating Central Air Conditioner*
(Early Replacement) $300 3,899
SEER 14 – Replace Failed Central Air Conditioner $150 $250 150
SEER 15 – Replace Operating Central Air Conditioner*
(Early Replacement) $400 1,772
SEER 15 – Replace Failed Central Air Conditioner $175 $275 88

23
Measure
Type Qualifying Products
Jan -
June
July -
Dec
Total #
Measures
SEER 16+ – Replace Operating Central Air
Conditioner* (Early Replacement) $475 $500 3,941
SEER 16+ – Replace Failed Central Air Conditioner $200 $300 61
*$100 bonus for installations occurring in August and September.
**Incentive increase in September.
Five of 11 contractors said the program training improved their ability to convince customers of the
benefits of high-efficiency equipment, particularly in explaining the concept of their home as a whole-
house system in which all components need to be in place and functioning. All contractors said the early
replacement incentives proved influential in encouraging their customers to make decisions to install
new units in 2015. Eight of the eleven contractors said the incentive had been very influential. Based on
their recollection of historical sales data, contractors estimated the rebates also drove customers to
install higher-efficiency systems than they would have otherwise, with responses averaging about 50%
of the time and ranging from 20% to 80%.
In PY14, ASHPs and GSHPs represented 17% of HVAC equipment incentives. In PY15, the proportion of
HPs increased to 21%. To increase participation, stakeholders reported implementing the following
changes:
Midyear increase in incentives for all 15 SEER and 16+ SEER ASHPs;
Additional August and September $100 bonus incentive; and
Fall heat pump promotion that paid incentives to contractors coupled with a customer-
facing marketing campaign.
While heat pump sales remained unchanged or were not a significant component for six contractors, the
other five contractors said they saw an increase in these sales. The incentive moved customers “on-the-
fence” to purchase the higher-efficiency heat pump. One contractor said they sold 15 times the number
of HPs sold before the program.
All contractors said the program was accomplishing its purpose of increasing demand for energy-
efficient equipment. Nine contractors said customers were more interested in purchasing energy-
efficient options than before the program began; they did not, however, attribute this change
exclusively to the program, explaining most customers wanted energy-efficient equipment. Though the
contractors credited the program rebates, which made the decision for higher-efficiency equipment a
“no-brainer,” they also credited: the population with educating itself through the Internet; people
becoming more aware in general of the importance and benefits of higher-efficiency equipment; and
Ameren Missouri’s “great job” in marketing the program and raising customer awareness.
Contractors offered some additional opinions and insights about the impact of the presence of the
Heating and Cooling Program and the forthcoming absence of the incentive offerings. Nine of 11
contractors said they would sell fewer high-efficiency systems as a result of the program ending,

24
anticipating customers will drop back to SEER 13 equipment. Contractors expected early replacement
sales of existing, functional equipment to diminish or take longer to close. Several contractors said the
program ending was a significant or huge disappointment, and the impacts would not be fully known
until summer 2016. One dreaded what could happen to the business. Only one contractor did not
anticipate negative impacts, saying their equipment manufacturer did a good job of training them to sell
high-efficiency equipment, and they did not expect that to change.
Heating and Cooling Program Tune-Ups and Furnace Fan (ECM) Measures
Table 11 shows tune-up and ECM measures offered through the Heating and Cooling Program. The vast
majority (93%) of ECM installations occurred in conjunction with a new HVAC system installation (i.e., an
incentive was also provided for installation of the AC or HP).
Table 11. HVAC Tune-up
Measure Rebate Participation
TEA $75 10,778*
ECM included in AHRI Efficiency Rating of Incented CAC, ASHP, or GSHP $50 8,344
ECM Retrofit or not included in AHRI $100 666
*Number of incentives paid does not match total number of tune-up measures for two reasons. 1) Some HVAC systems
receive multiple measures. 2) Some HVAC systems receive only a diagnostic test only and no tune-up work is required;
system efficiency will not benefit from tune-up service work.
Both stakeholders and participating contractors characterized current measure offerings in the Heating
and Cooling Program as appropriate, based on recent evaluation results and program participation.
In PY15, Ameren Missouri changed the tune-up measure slightly, requiring a form that contractors
showed to their customers; this displayed the results of the diagnostic test of their HVAC systems and,
when deemed necessary, provided recommendations for improvements (as shown in Figure 2). To assist
contractors in messaging the TEA measure, Ameren Missouri also created a video explaining the TEA
process of diagnosing an HVAC system.
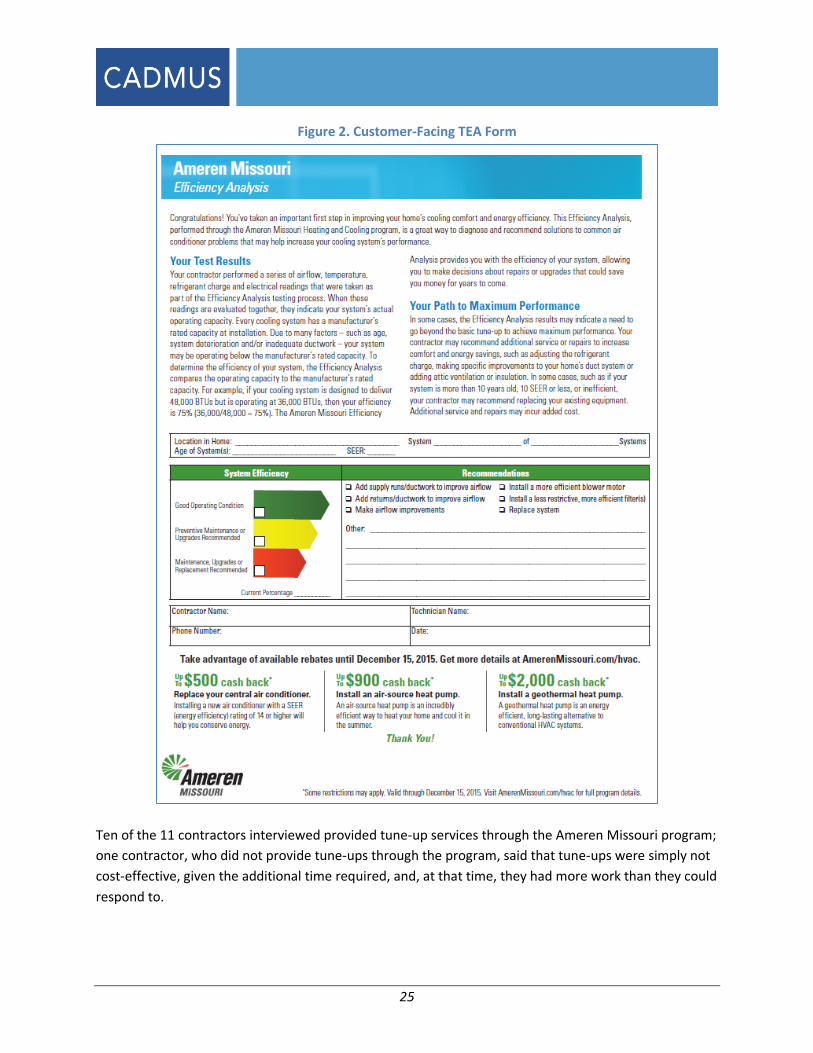
25
Figure 2. Customer-Facing TEA Form
Ten of the 11 contractors interviewed provided tune-up services through the Ameren Missouri program;
one contractor, who did not provide tune-ups through the program, said that tune-ups were simply not
cost-effective, given the additional time required, and, at that time, they had more work than they could
respond to.
26
Among the contractors who provide program tune-ups, an average of more than half of the tune-ups
were performed on equipment with existing service contracts as part of an annual maintenance plan. A
majority of the contractors (n=7) said the TEA testing requirements and report were useful. This process
helped identify underperforming systems (particularly those with poor ductwork), and it helped
contractors talk with customers about the benefits of maintenance and the efficiency of older systems
vs. new high-efficiency systems.
Six of the seven contractors also agreed the TEA requirements helped them upsell or diagnose and
correct system issues they might not have found prior to using the program protocol. When asked how
often the form helped them convince customers to purchase a new system, four contractors said this
occurred from 5% to 50% of the time. The higher percentages (30% and 50%) were given by two
contractors who, combined, performed more than 3,000 program tune-ups in 2015. The two contractors
citing the lower range (5% to 10%), combined, performed 179 program tune-ups in 2015. One
contractor who did not find the form useful cited the subjectivity of the system efficiency rating and
requested Ameren Missouri provide efficiency ranges for each green, yellow, or red rating.
All of the contractors (n=11) said the program tune-up required more time to perform and gave ranges
of 15 minutes to 1 hour longer, with the largest group (n=5) saying 30 to 45 minutes longer. They
reported the time spent on pre- and post-inspection testing, taking static pressure readings, running the
necessary calculations, and completing the paperwork. All said it took longer when they began the
program, but, over time, they became more efficient.
Three contractors provided the Ameren Missouri program tune-up and a less-rigorous tune-up option;
one contractor eliminated the static pressure measurements, one did not include tests to calculate the
efficiency of the unit; and one was not exactly sure how the tune-ups varied. Two charged more for the
program tune-up (20% and 50%) than for a non-program tune-up.
Seven of the 10 contractors providing tune-up services said they would continue to use a tune-up
process similar to Ameren Missouri’s Efficiency Analysis protocol after the program ended. Six of these
would use it without making changes; one would provide a similar but less extensive tune-up.
Only one contractor was familiar with the TEA video, a short video that explained the TEA process and
benefits of diagnosing an HVAC system. The TEA video, which was a relatively new additional marketing
piece, was produced and distributed to contractors about two months prior to Cadmus conducting the
interviews.
Motivation of TEA Participants
As shown in Figure 3, the majority of TEA participants (52% [n=85]) participated in the program for
reasons related to equipment maintenance. These reasons included the following:
Time for a check-up (16%);
Scheduled check-up as part of maintenance contract (14%);
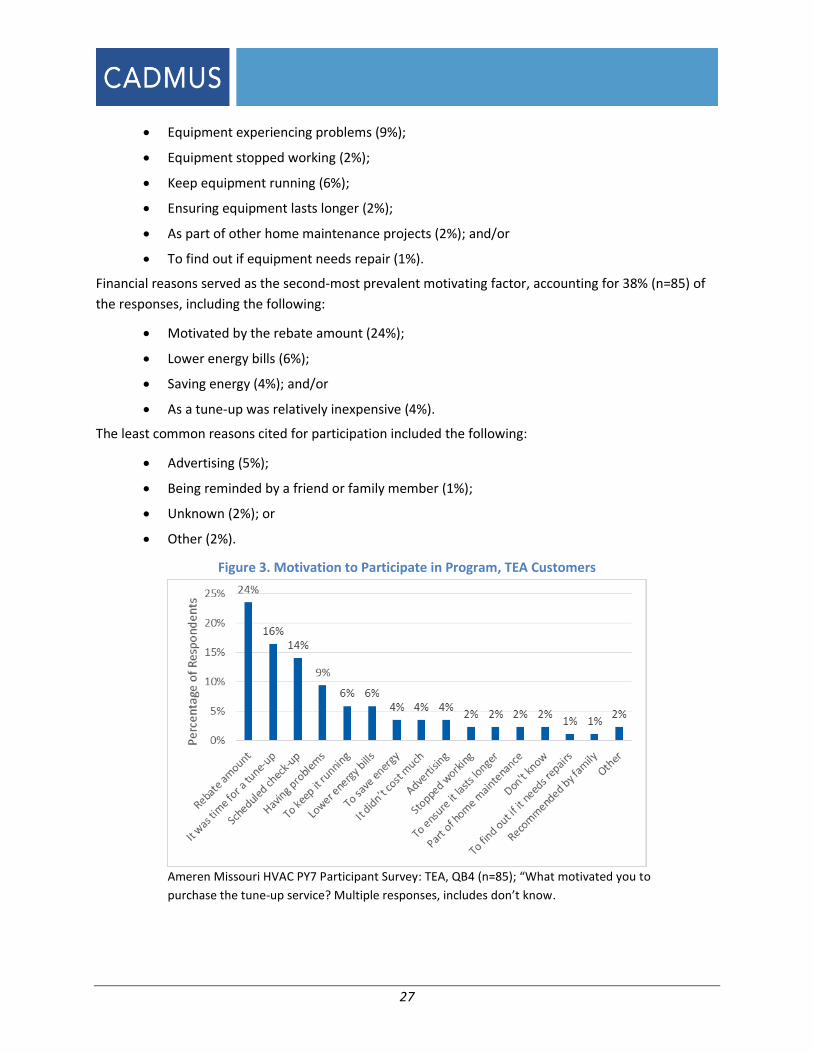
27
Equipment experiencing problems (9%);
Equipment stopped working (2%);
Keep equipment running (6%);
Ensuring equipment lasts longer (2%);
As part of other home maintenance projects (2%); and/or
To find out if equipment needs repair (1%).
Financial reasons served as the second-most prevalent motivating factor, accounting for 38% (n=85) of
the responses, including the following:
Motivated by the rebate amount (24%);
Lower energy bills (6%);
Saving energy (4%); and/or
As a tune-up was relatively inexpensive (4%).
The least common reasons cited for participation included the following:
Advertising (5%);
Being reminded by a friend or family member (1%);
Unknown (2%); or
Other (2%).
Figure 3. Motivation to Participate in Program, TEA Customers
Ameren Missouri HVAC PY7 Participant Survey: TEA, QB4 (n=85); “What motivated you to
purchase the tune-up service? Multiple responses, includes don’t know.
28
Communication and Program Processes
The Cadmus team found stakeholders generally agreed on most issues and found the program ran
effectively during PY15.
ICF sent bimonthly newsletters to contractors; these included program updates and reminders. For
communication of crucial information, ICF sent e-mails as necessary and would resend and even follow
up with phone calls if an e-mail was unopened by a contractor.
ICF used a website called the “Online Intake Tool” to relay information to and to collect information
from participating HVAC contractors. This tool hosted recent updates, archived all communications, and
provided live chat help. Contractors could access co-branding resources and obtain advertising
schedules to coordinate their own advertising with the program’s advertising. Stakeholders believed the
tool worked very well in PY15.
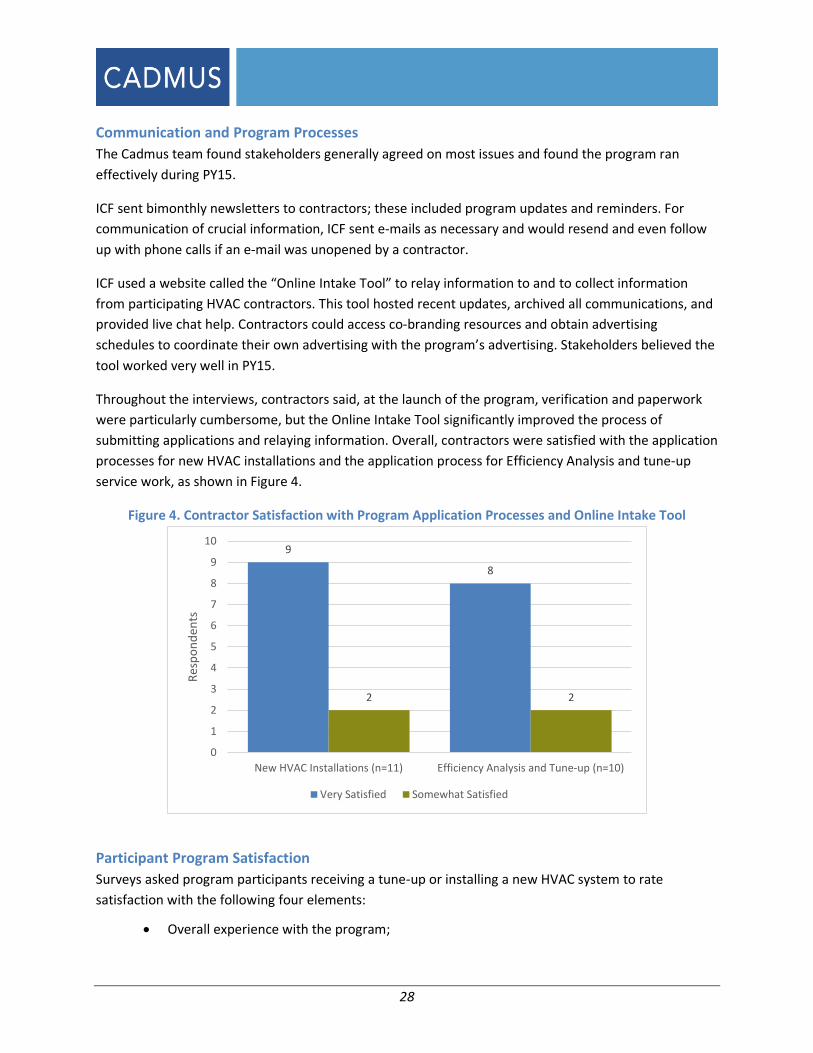
Throughout the interviews, contractors said, at the launch of the program, verification and paperwork
were particularly cumbersome, but the Online Intake Tool significantly improved the process of
submitting applications and relaying information. Overall, contractors were satisfied with the application
processes for new HVAC installations and the application process for Efficiency Analysis and tune-up
service work, as shown in Figure 4.
Figure 4. Contractor Satisfaction with Program Application Processes and Online Intake Tool
Participant Program Satisfaction
Surveys asked program participants receiving a tune-up or installing a new HVAC system to rate
satisfaction with the following four elements:
Overall experience with the program;
9
8
2 2
0
1
2
3
4
5
6
7
8
9
10
New HVAC Installations (n=11) Efficiency Analysis and Tune-up (n=10)
Res
po
nd
ents
Very Satisfied Somewhat Satisfied

29
The service and quality of work provided by the program contractor;
The performance of the new or tuned-up HVAC system; and
Overall satisfaction with Ameren Missouri.
Figure 5 shows that customers of both programs expressed high satisfaction levels with each program
overall and with the components of each program. Responses of both programs’ customers followed a
similar pattern, where the percentage of customers very satisfied with the program overall—81% (n=69)
of TEA customers and 80% (n=70) of Heat Pump customers—was smaller than the percentage of those:
Very satisfied with their contractors—90% (n=70) of TEA customers and 91% (n=70) of Heat
Pump customers; and
Very satisfied with their systems’ performance—84% (n=67) of TEA customers and 86%
(n=65) of Heat Pump customers.
Figure 5. TEA and Heat Pump Customers Satisfaction with Program Overall, with Contractor, and with System Performance
Ameren Missouri HVAC PY7 Participant Survey: Heat Pump, QD5 (n=70), TEA, QD5 (n=69); “Thinking back over the
scheduling, servicing, available rebates, and rebate processes, how satisfied are you with the overall [program]?
Heat Pump, QD1 (n=70); TEA, QD1 (n=70); “How satisfied are you with the contractor you worked with?” Heat
Pump QD3 (n=65); TEA, QD2 (n=67); “How satisfied are you with the performance of your [new heat pump/system
since the tune-up]?”

30
Overall Program Satisfaction and Suggested Program Improvements
TEA participants described themselves as very satisfied with the program overall (81%, n=69), while the
remaining participants (19%) were somewhat satisfied; no customers described themselves as unhappy
with the program. Most Heat Pump participants described themselves as very satisfied with the
program overall (80%, n=70), while 17% were somewhat satisfied, and 2% described themselves as not
too satisfied or not at all satisfied.
Most survey participants—70% (n=69) of TEA participants and 51% (n=70) of Heat Pump participants—
did not think the program could be improved. Some participants, however, had suggestions for program
improvements. Figure 6 shows suggestions for each type of customer. Prevalent suggestions from TEA
customers included the following:
Better advertising of the program (17%);
Larger rebates (3%); and
Faster rebate processing times (3%).
Heat Pump customers suggested the following:
Better advertising (14%);
Larger rebates (11%); and
Clearer program information (7%).
A notable number of Heat Pump participants (13%) offered the following suggestions that fell into the
“other” category:
Four suggested energy rates be lowered (n=4);
Two suggested extending the program (n=2);
One didn't know if the program was cancelled or not (n=1);
One cited rebates in Illinois and suggested that Ameren Missouri offer the same rebates
(n=1); and
One suggested that customers be allowed to fill in their rebate themselves (n=1).

31
Figure 6. Suggestions for How to Improve the Programs, TEA and Heat Pump Participants
Ameren Missouri HVAC PY7 Heat Pump Participant Survey: Heat Pump, QD8 (n=70); TEA, QD7 (n=69) “What
suggestions, if any, do you have for improving the program?” (n=70)
Satisfaction with the Participating Contractor
A great majority of participants for both programs described themselves as very satisfied with their
contractors. Of participants having their HVAC systems tuned-up, 90% (n=70) described themselves as
very satisfied with their contractor; 91% (n=70) of Heat Pump customers were very satisfied with the
contractor performing the installation.
The majority of TEA customers worked with contractors with whom they had previously worked (66% of
customers, n=70). Heat Pump customers proved less reliant on contractors with whom they had
previously worked (36%, n=76), also commonly finding contractors through referrals from family,
friends, or neighbors (28%).
Satisfaction with the System/Measure Performance
Most TEA participants described themselves as very satisfied with the performance of their HVAC
systems following a tune-up (84%, n=67), while 13% of remaining participants described themselves as
somewhat satisfied, and 3% described themselves as not at all satisfied. Despite the majority’s
satisfaction with post tune-up system performance, when asked if they experienced benefits, many
surveyed customers said they had not experienced benefits (56%, n=64). Of those perceiving benefits,
over one-fifth noticed increased energy savings and lower monthly utility bills (23%); smaller numbers of
customers experienced increased comfort in their home (6%), increased convenience or productivity
(3%), lowered maintenance costs (3%), and improved air quality in the home (6%). One respondent said
they had experienced “peace of mind” (2%).

32
Most customers installing a new heat pump (86%, n=65) were very satisfied with the new equipment;
11% of remaining participants were somewhat satisfied; and 4% of participants were not too satisfied or
not at all satisfied. Participants cited three top reasons for satisfaction with their new HPs: a decrease in
their monthly utility bills (36%, n=76); improved comfort in the home due to the system heating or
cooling more effectively than the previous system (20%); and a quieter system (16%).
Satisfaction with Ameren Missouri
The majority of surveyed Ameren Missouri customers for both programs expressed satisfaction with
Ameren Missouri as their utility. Of TEA customers surveyed, 70% (n=66) were very satisfied with
Ameren Missouri; 29% were somewhat satisfied; and 2% were not at all satisfied. Of customers installing
HP systems, 60% (n=70) said they were very satisfied with Ameren Missouri; 36% were somewhat
satisfied; 1% were not too satisfied; and 3% were not at all satisfied.
A higher percentage of customers installing new HPs increased their opinion of Ameren Missouri
through program participation than customers receiving a tune-up: 56% (n=68) of Heat Pump customers
in comparison to 48% (n=65) of TEA customers.
Program Implementation Challenges
Contractors reported they were very satisfied with the program and found it easy to participate; they
explained that stakeholders were responsive to issues identified by contractors in the program’s early
days, and that they streamlined the program forms and processes. No significant barriers were
identified by HVAC contractors in the 2015 program delivery. Only one contractor cited any barriers with
the program as it functioned today, saying the 30-day limit on the rebate request was somewhat tight
and 45 days would be better.
According to stakeholders, the two most common complaints from Ameren Missouri residential
customers addressed timeliness of the incentive payment (“where’s my rebate check”) and a compliant
about program eligibility (“why can’t I get a rebate—my contractor told me I could”). Combined, these
complaints represented less than 1% of the total number of rebates and generally were due to HVAC
contractor errors.
Cadmus’ review of participant survey responses, contractor interviews, and stakeholder interviews
indicates only a small number of insignificant implementation barriers and no major implementation
barriers that inhibit participation.
CSR Summary According to the Missouri CSR,5 demand-side programs that are part of a utility’s preferred resource
plan are subject to ongoing process evaluations that address, at a minimum, the five questions listed in
Table 12 (which offers a summary response for each specified CSR requirement).
5 http://sos.mo.gov/adrules/csr/current/4csr/4c240-22.pdf
33
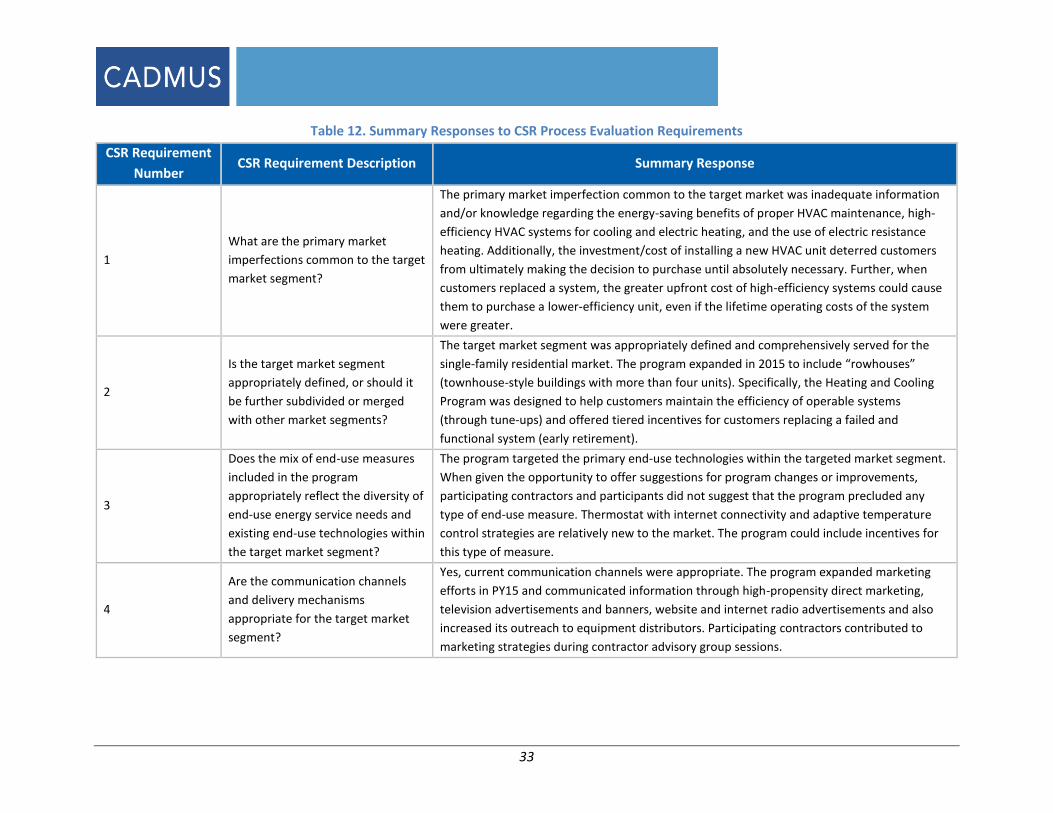
Table 12. Summary Responses to CSR Process Evaluation Requirements
CSR Requirement
Number CSR Requirement Description Summary Response
1
What are the primary market
imperfections common to the target
market segment?
The primary market imperfection common to the target market was inadequate information
and/or knowledge regarding the energy-saving benefits of proper HVAC maintenance, high-
efficiency HVAC systems for cooling and electric heating, and the use of electric resistance
heating. Additionally, the investment/cost of installing a new HVAC unit deterred customers
from ultimately making the decision to purchase until absolutely necessary. Further, when
customers replaced a system, the greater upfront cost of high-efficiency systems could cause
them to purchase a lower-efficiency unit, even if the lifetime operating costs of the system
were greater.
2
Is the target market segment
appropriately defined, or should it
be further subdivided or merged
with other market segments?
The target market segment was appropriately defined and comprehensively served for the
single-family residential market. The program expanded in 2015 to include “rowhouses”
(townhouse-style buildings with more than four units). Specifically, the Heating and Cooling
Program was designed to help customers maintain the efficiency of operable systems
(through tune-ups) and offered tiered incentives for customers replacing a failed and
functional system (early retirement).
3
Does the mix of end-use measures
included in the program
appropriately reflect the diversity of
end-use energy service needs and
existing end-use technologies within
the target market segment?
The program targeted the primary end-use technologies within the targeted market segment.
When given the opportunity to offer suggestions for program changes or improvements,
participating contractors and participants did not suggest that the program precluded any
type of end-use measure. Thermostat with internet connectivity and adaptive temperature
control strategies are relatively new to the market. The program could include incentives for
this type of measure.
4
Are the communication channels
and delivery mechanisms
appropriate for the target market
segment?
Yes, current communication channels were appropriate. The program expanded marketing
efforts in PY15 and communicated information through high-propensity direct marketing,
television advertisements and banners, website and internet radio advertisements and also
increased its outreach to equipment distributors. Participating contractors contributed to
marketing strategies during contractor advisory group sessions.

34
CSR Requirement
Number CSR Requirement Description Summary Response
5
What can be done to more
effectively overcome the identified
market imperfections and to
increase the rate of customer
acceptance and implementation of
each end-use measure included in
the program?
The marketing materials allocated a significant proportion of resources specific to the
targeted market. In the first program year, the most common suggestion for improvement
from program participants surveyed was the need to increase program awareness and
benefits, an indication that marketing efforts should continue or increase. The program could
continue to perform billing data analysis to market to customers with relatively high apparent
heating and cooling energy consumption.

35
Gross Impact Evaluation Results
This section details how the Cadmus team calculated gross savings and determined realization rates for
each measure’s per-unit energy savings.
Cooling Savings Estimates In PY13, the Cadmus team metered 83 HVAC systems that received tune-ups and 78 new, high-efficiency
HVAC systems installed through the program. We used detailed submeter data, collected in conjunction
with PY13 program tracking data, to estimate per-unit savings for all program measures. This year, we
used the PY13 metering data and the program’s detailed tracking data for PY15 to estimate evaluated
(ex post) per-unit savings. Table 13 summarizes the PY13 meter data results.
Table 13. Summary of Metering Results
Measure Type PY13
Population
Metered
Sample
Size
Seasonal
Metered
Weather
Normalized
kWh
Coefficient
of Variation
(cv)
Relative
Precision at
90% Confidence
Interval
New HVAC System Installations 6,738 73 1,892 0.56 10.9%
Tune-Up HVAC Systems 2,800 81 2,836 0.57 10.6%
*The ratio of Base 65° CDD Metered/CDD 2013.
Heating Savings Estimates Some measures offered in the Heating and Cooling Program required cooling and heating savings
estimates. The Cadmus team assumed the U.S. Department of Energy’s6 equivalent full load hour (EFLH)
value for St. Louis (2,009 hours) provided a reasonable estimate of heating savings. Where necessary
(e.g., dual fuel HPs [DFHPs]), we performed engineering analysis to adjust the EFLH heating value.
Measure-Specific Gross Savings Using the engineering algorithms, data from the program tracking database, and results from the PY13
metering study, the Cadmus team estimated measure-specific gross savings for all program measures.
SEER 14, 15, and 16+ CAC Installations
We calculated early-replacement savings for each metered interval (i) (either two or four minutes) using
the following algorithm:
𝑘𝑊ℎ𝑖𝑠𝑎𝑣𝑒𝑑 = 𝑚𝑒𝑡𝑒𝑟𝑒𝑑 𝑘𝑊ℎ𝑖 ×𝐸𝐸𝑅𝑒𝑓𝑓𝑖𝑐𝑖𝑒𝑛𝑡(𝑇)
𝐸𝐸𝑅𝑏𝑎𝑠𝑒(𝑇)− 𝑚𝑒𝑡𝑒𝑟𝑒𝑑 𝑘𝑊ℎ𝑖
6 Environmental Protection Agency’s ENERGY STAR Calculator.

36
Using detailed manufacturer data (shown in Figure 7), we developed an energy efficiency ratio (EER)
versus an outdoor temperature correlation for each new high-efficiency HVAC system metered. We
used a synthetic baseline curve (described in Appendix C), representing a 7.2 seasonal energy efficiency
ratio (SEER) HVAC unit. If the measure was replace on burnout, we used the federal minimum efficiency
rating of 13 SEER.7
Figure 7. Example Manufacturer Cut Sheet
Using the engineering algorithm, the Cadmus team determined the ex post savings values shown in
Table 15. Savings calculated were based on reported, nameplate-rated efficiency (SEER) and unit
capacity information (tons). Metered new HVAC units averaged 3.1 tons and 15.1 SEER, similar to the
HVAC units reported in PY15 (shown in Table 14).
Table 14. PY15 SEER and Tons Averages
Measure SEER Tons PY13 Metered
SEER
PY13 Metered
Tons
CAC—SEER 14 14.2 3.01
CAC—SEER 15 15.2 3.28
CAC—SEER 16+ 16.3 3.06
ASHP—SEER 14 14.2 2.88
ASHP—SEER 15 15.1 3.02
ASHP—SEER 16+ 17.9 2.80
Average (All Systems) 15.4 3.04 15.1 3.1
We adjusted the weather-normalized cooling savings for these systems, determined through PY13
metering and analysis (1,805 kWh average cooling energy saved for early replacement ASHPs and CACs),
by a ratio of reported SEER and tons for each of the measure levels (SEER 14, SEER 15, and SEER 16+).
The resulting ex post savings estimates in PY15 were within 2-3% of the PY13 and PY14 estimates
because the average efficiency and system sizes were very similar.
7 Federal Standards Document: CFR-2012-title10-vol3-sec430-32. Online: https://www.gpo.gov/fdsys/pkg/CFR-2012-title10-vol3/pdf/CFR-2012-title10-vol3-sec430-32.pdf

37
Table 15. Ex Ante and Ex Post Comparison for CACs
Measure Ex Ante
Savings/Unit
Ex Post
Savings/Unit
Realization
Rate
PY14
Participants
CAC—SEER 14 ER 1,900 1,631 85.9% 3,901
CAC—SEER 14 Replace at Fail 409 329 80.6% 150
CAC—SEER 15 ER 2,057 1,907 92.7% 1,773
CAC—SEER 15 Replace at Fail 566 380 67.2% 88
CAC—SEER 16+ ER 2,202 1,917 87.1% 3,945
CAC—SEER 16+ Replace at Fail 710 382 53.8% 62
Central HP Installations
The Cadmus team used a similar methodology to estimate CAC cooling savings from the installation of
high-efficiency HPs.
All ASHP and GSHP savings used the same general algorithm to estimate heating savings:
∆𝑘𝑊ℎ = 𝑟𝑎𝑡𝑖𝑛𝑔𝑜𝑓𝑢𝑛𝑖𝑡(𝑡𝑜𝑛𝑠) × 12𝑘𝐵𝑇𝑈
𝑡𝑜𝑛⌈𝐸𝐹𝐿𝐻ℎ𝑒𝑎𝑡𝑖𝑛𝑔 × (
1
𝐻𝑆𝑃𝐹𝑏𝑎𝑠𝑒−
1
𝐻𝑆𝑃𝐹𝑒𝑓𝑓𝑖𝑐𝑖𝑒𝑛𝑡)⌉
Table 16 shows HP measures, baseline assumptions for HPs installed through the Heating and Cooling
Program, and participation totals for each measure.
Table 16. Ex Ante and Ex Post Comparison for ASHPs
Measure
Measure
Baseline
Description:
Cooling
Measure
Baseline
Description:
Heating
Notes
PY15
Participants
(Quantity)
ASHP—SEER 14 ER with ASHP Early
Replacement 7.2 SEER 6.3 HSPF
HSPF estimated
from SEER
284
ASHP—SEER 14 Replace at Fail with
ASHP 13 SEER 7.7 HSPF
102
ASHP—SEER 14 ER Elec Resist Furnace
Early Replacement* 7.2 SEER
3.4 HSPF
(COP=1)
360
ASHP—SEER 14 Replace at Fail Elec
Resist Furnace* 7.2 SEER
3.4 HSPF
(COP=1)
26
ASHP—SEER 15 ER with ASHP Early
Replacement 7.2 SEER 6.3 HSPF
HSPF estimated
from SEER
185
ASHP—SEER 15 Replace at Fail with
ASHP 13 SEER 7.7 HSPF
69
ASHP—SEER 15 ER Elec Resist Furnace
Early Replacement * 7.2 SEER
3.4 HSPF
(COP=1)
271
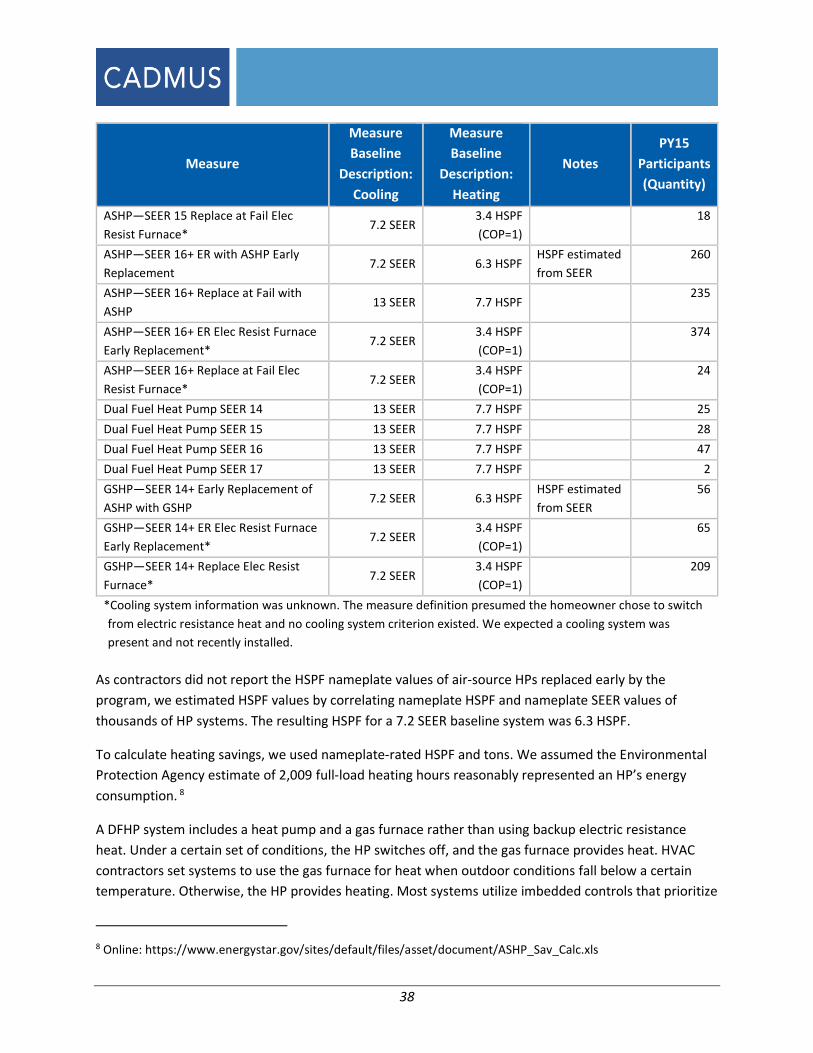
38
Measure
Measure
Baseline
Description:
Cooling
Measure
Baseline
Description:
Heating
Notes
PY15
Participants
(Quantity)
ASHP—SEER 15 Replace at Fail Elec
Resist Furnace* 7.2 SEER
3.4 HSPF
(COP=1)
18
ASHP—SEER 16+ ER with ASHP Early
Replacement 7.2 SEER 6.3 HSPF
HSPF estimated
from SEER
260
ASHP—SEER 16+ Replace at Fail with
ASHP 13 SEER 7.7 HSPF
235
ASHP—SEER 16+ ER Elec Resist Furnace
Early Replacement* 7.2 SEER
3.4 HSPF
(COP=1)
374
ASHP—SEER 16+ Replace at Fail Elec
Resist Furnace* 7.2 SEER
3.4 HSPF
(COP=1)
24
Dual Fuel Heat Pump SEER 14 13 SEER 7.7 HSPF 25
Dual Fuel Heat Pump SEER 15 13 SEER 7.7 HSPF 28
Dual Fuel Heat Pump SEER 16 13 SEER 7.7 HSPF 47
Dual Fuel Heat Pump SEER 17 13 SEER 7.7 HSPF 2
GSHP—SEER 14+ Early Replacement of
ASHP with GSHP 7.2 SEER 6.3 HSPF
HSPF estimated
from SEER
56
GSHP—SEER 14+ ER Elec Resist Furnace
Early Replacement* 7.2 SEER
3.4 HSPF
(COP=1)
65
GSHP—SEER 14+ Replace Elec Resist
Furnace* 7.2 SEER
3.4 HSPF
(COP=1)
209
*Cooling system information was unknown. The measure definition presumed the homeowner chose to switch
from electric resistance heat and no cooling system criterion existed. We expected a cooling system was
present and not recently installed.
As contractors did not report the HSPF nameplate values of air-source HPs replaced early by the
program, we estimated HSPF values by correlating nameplate HSPF and nameplate SEER values of
thousands of HP systems. The resulting HSPF for a 7.2 SEER baseline system was 6.3 HSPF.
To calculate heating savings, we used nameplate-rated HSPF and tons. We assumed the Environmental
Protection Agency estimate of 2,009 full-load heating hours reasonably represented an HP’s energy
consumption. 8
A DFHP system includes a heat pump and a gas furnace rather than using backup electric resistance
heat. Under a certain set of conditions, the HP switches off, and the gas furnace provides heat. HVAC
contractors set systems to use the gas furnace for heat when outdoor conditions fall below a certain
temperature. Otherwise, the HP provides heating. Most systems utilize imbedded controls that prioritize
8 Online: https://www.energystar.gov/sites/default/files/asset/document/ASHP_Sav_Calc.xls

39
gas furnace use if the HP fails to meet the thermostat setpoint in a certain amount of time.
Consequently, DFHPs run less than standard ASHPs measures as the gas furnace provides a portion of
heating savings.
To calculate savings for DFHPs, the Cadmus team conducted detailed analysis to estimate an
appropriate EFLH value for the DFHP measure. Analysis of this value used the following methodology:
The DFHP provided all heating BTUs above 34°F.
The total seasonal heating capacity was 82 MMBtus (2009 EFLH x reported capacity of
DFHP).
Heat load on a home was linear from the peak heating load at the TMY3 minimum bin
temperature (-3°F) to no heating required (at 64°F).
Using these stated assumptions, we determined the amount of heating capacity required above 34°F,
assuming the DFHP provided 100% of this heating capacity. Specifically, we found a DFHP would provide
about 38 MMBTUs of heat, resulting in an updated EFLH heating value of 930 hours.
Table 17 shows ex ante9 and ex post values for all HP measures reported in PY15.
9 In PY13, the Cadmus team performed a detailed engineering review of the TRM’s ex ante savings estimates for each measure. The PY13 Evaluation Report describes the Cadmus team’s observations and findings of the deemed savings value for each measure. See: “Ameren Missouri CoolSavers Impact and Process Evaluation: Program Year 2013”. Online: https://www.efis.psc.mo.gov/mpsc/commoncomponents/viewdocument.asp?DocId=935842419 CAC measures: pg. 40. ASHP and GSHP measures: pg. 45. Tune-up measures: pg. 46-47. ECM measures: pg. 50-51.

40
Table 17. Ex Ante and Ex Post Comparison for HPs
Measure Ex Ante
Savings/Unit
Ex Post
Savings/Unit
Realization
Rate
PY15
Participants
ASHP—SEER 14 ER with ASHP Early
Replacement 4,201 4,189 99.7% 284
ASHP—SEER 14 Replace at Fail with ASHP 1,158 1,005 86.8% 102
ASHP—SEER 14 ER Elec Resist Furnace
Early Replacement* 14,917 13,581 91.0% 360
ASHP—SEER 14 Replace at Fail Elec Resist
Furnace* 13,426 12,105 90.2% 26
ASHP—SEER 15 ER with ASHP Early
Replacement 4,683 4,785 102.2% 185
ASHP—SEER 15 Replace at Fail with ASHP 1,639 1,470 89.7% 69
ASHP—SEER 15 ER Elec Resist Furnace
Early Replacement * 15,398 14,445 93.8% 271
ASHP—SEER 15 Replace at Fail Elec Resist
Furnace* 13,907 13,528 97.3% 18
ASHP—SEER 16+ ER with ASHP Early
Replacement 5,126 6,322 123.3% 260
ASHP—SEER 16+ Replace at Fail with
ASHP 2,082 1,888 90.7% 235
ASHP—SEER 16+ ER Elec Resist Furnace
Early Replacement* 15,841 15,169 95.8% 374
ASHP—SEER 16+ Replace at Fail Elec
Resist Furnace* 14,350 13,120 91.4% 24
DFHP SEER 14 650 637 98.0% 25
DFHP SEER 15 1,230 1,006 81.8% 28
DFHP SEER 16 1,439 1,552 107.8% 47
DFHP SEER 17 1,651 1,849 112.0% 2
GSHP - SEER 14+ Early Replacement of
ASHP with GSHP 5,126 11,657 227.4% 56
GSHP—SEER 14+ ER Elec Resist Furnace
Early Replacement* 15,841 24,308 153.5% 65
GSHP—SEER 14+ Replace Elec Resist
Furnace* 14,350 23,011 160.4% 209
*The Cadmus team relied on contractor-reported data to estimate the baseline efficiency and did not perform
independent verifications of the baseline assumption, given the relatively low participation total.
HPs represented 21% of the new HVAC installation measures, and CACs accounted for the remainder of
new HVAC installations. Although measure counts of HP installations were lower, total savings
attributed to HP measures were higher, with HPs representing approximately 55% of the total new
HVAC system installation savings.

41
The Cadmus team calculated similar ex ante and ex post savings estimates for ASHPs, with an overall
realization rate of 96%. The GSHP ex post savings were much higher than ex ante savings (realization
rate of 163%) as we calculated savings using the nameplate reported system size and efficiency. GSHP
systems averaged 4.1 tons, with an average efficiency of 21.8 EER. (MML savings assumed efficiency of
14 EER and 3 tons.)
Tune-Up Savings
The PY13 evaluation used post-only verification and metering of tune-ups to confirm whether units were
correctly tuned up and to determine energy consumption. The PY13 evaluation found metered cooling
energy consumption of 2,836 kWh, normalized for TMY-3 weather. The Cadmus team used the following
formula to calculate tune-up savings:
𝑘𝑊ℎ 𝑆𝑎𝑣𝑒𝑑 =𝑘𝑊ℎ 𝑚𝑒𝑡𝑒𝑟𝑒𝑑
1 − % 𝐸𝐸𝑅 𝑖𝑚𝑝𝑟𝑜𝑣𝑒𝑚𝑒𝑛𝑡− 𝑘𝑊ℎ 𝑚𝑒𝑡𝑒𝑟𝑒𝑑
To determine the % EER improvement, we performed an extensive engineering review of all reported
test-in and test-out contractor measurements contained in the PY15 tracking data. This used the same
methodology detailed in the PY13 evaluation report, with the general methodology as follows:
Calculate pre and post enthalpy from temperature and wet bulb measurements.
Review pre- and post-airflow measurements for reasonableness.
Review power estimates for reasonableness (including comparison of fan power to
airflow estimate).
Calculate pre and post EER.
Review test conditions and remove tests below 70°F.
Remove reported tune-ups with erroneous data.
PY15 Tune-Up Savings
In PY15, HVAC contractors did not have to perform test-in measurements for every tune-up. HVAC
contractors performed TEA analysis of 10,778 HVAC systems and reported 2,213 unique sets of pre-
(test-in) and post (test-out) measurements. The sample of pre- and post-tune-up test measurements
exceeded the sample size recommended by the Cadmus team in PY14 (10% of all tune-ups). The team
used actual test measurements reported by HVAC contractors to independently estimate pre- and post-
EER for each HVAC system. To determine an overall average EER change due to tune-ups, the Cadmus
team sought to use a sample of pre- and post-diagnostic tune-up measurements performed at average
operating conditions for an HVAC system operating in Ameren Missouri’s service territory.
For example if a tune-up was performed below 65 °F, we removed the pre- and post-EER measurements
from the sample as the apparent efficiency improvement due to the tune-up work at that condition did
not provide a good indication of actual efficiency improvement at more normal operating conditions

42
(i.e., when the heat load on the HVAC system and the outdoor temperature are both sufficient for
performance testing). 10
Table 18 shows EER percent improvements from contractors’ reported measurements. Ultimately, we
used approximately 1,200 reported measurements to determine savings.
Table 18. Tune-Up Savings Summary
Measure % Improvement Ex Post Savings
(kWh)
Ex Ante
(kWh)
PY15
Measures*
Refrigerant charge adjustment 28.4% 856 191 1,028
Condenser Cleaning Only 7.9% 258 515 9,250
Indoor coil cleaning 3.8% 117 638 359
*One tune-up may have multiple measures performed.
The tune-up tracking database contained a significant number of systems just receiving condenser
cleaning as well as a significant number of systems receiving refrigerant charge adjustments with
condenser cleaning. The Cadmus team chose to show the efficiency improvement for each treatment
type included in Table 18; so the implementation team could understand typical savings estimates for
the most common tune-up measures.
Evaluated energy savings estimates represented weighted savings for CACs and ASHPs. Although ICF’s
Optimizer Tool included a data collection field for heat system types (e.g., AC or HP), the program
tracking database for tune-up measures did not discern HPs from CACs. Thus, we made the following
assumptions to estimate savings for an average tune-up, which included savings from HPs in
heating mode:
18% of system tune-ups were HPs (based on the mix of known HP and CAC installations);
The efficiency improvement was the same in heating and cooling mode; and
The average HSPF after the tune-up was 6.3.
Tune-Ups Performed on Systems with a Maintenance Agreement
The tracking database included a data field with the option “yes”, “no”, or “no entry” that indicated
whether a system receiving a tune-up had an existing maintenance agreement (MA). The work
performed by an HVAC contractor as part of an MA may vary, but services generally entail seasonal or
annual functional testing and cleaning. Presumably, systems with an MA receiving a tune-up through the
Heating and Cooling Program could have different savings potential from systems that are not regularly
serviced by an HVAC contractor. To determine whether differences in savings exist, Cadmus reviewed
the % EER improvement for both. Approximately 50% of the systems receiving a tune-up had “no entry”.
10 This does not indicate that these tune-ups should not have been performed. A tune-up can be successfully performed at this condition. The accuracy of the measured pre- and post- tune-up EER, however, declines at this condition.

43
When data were available, Cadmus reviewed the % efficiency improvement. 75% of the systems had an
MA and 25% did not. For comparison, we found that 62% of the participants surveyed (see Free
Ridership: Tune-Ups section) claimed they had an existing MA. This variance indicates that a higher
proportion of the “blank” data fields may have been “no” but both data sources show that a larger
proportion of program tune-ups were performed on systems with existing maintenance agreements.
Table 19. % Efficiency Improvement for Tune-Ups with and without Existing MA
Measure No Existing Maintenance
Agreement
Has Existing Maintenance
Agreement
Test-in Efficiency 10.50 EER 11.44 EER
Test-Out Efficiency 11.56 EER 12.67 EER
% Improvement 9.9% 10.7%
% Requiring Refrigerant Charge Adjustment 22.5% 19.4%
Table 19 shows that systems with an existing MA had higher savings than systems without an MA. As
evident by the percentage of systems that required refrigerant charge adjustment, a system with an MA
was not more likely to be correctly charged than a system that did not have an MA. One might also infer
from these data that an MA does not ensure optimal system performance.
Table 19 also shows that the test-in and test-out efficiency of systems with an MA was on average
higher than systems without. Presumably, this occurred because maintenance agreements (e.g. 5 years
from date of purchase) are often included with the sale of new equipment, newer equipment has higher
nameplate efficiency than older equipment.
Intuitively, a system with an MA in place has lower energy savings potential than a system that does not
receive regular maintenance; the findings presented in Table 19 indicate savings potential is similar for
both system types.
“General” Tune-Ups and Tune-Ups with No Savings
A small number of tune-ups (n=196) reported described tune-up service work performed as “airflow
correction through a filter change, fan speed adjustment, or by some other means” (e.g., cutting a hole
in a return duct to increase airflow). The evaluation team categorized these as “general” tune-ups. The
MML measure claimed a deemed value for this type of tune-up measure of 174 kWh. The Cadmus team
accepted the TRM value for this measure as participation was low, making evaluation a low priority.
In addition, approximately 8% (n=878) of units that received a tune-up incentive received a diagnostic
test, but the contractor did not perform any maintenance work. Consequently, these tune-ups received
0 ex post savings (but did not report ex ante savings). The evaluated savings values in Table 18 have
been weighted, and the savings values include a proportional amount of tune-ups that did not receive
savings; thus, these values include the impact of the 878 tune-ups with no work performed.

44
ECM Savings
The Cadmus team used a Wisconsin study11 to estimate savings for electronically commutated furnace
fan motors (ECMs) installed through the Ameren Missouri Heating and Cooling Program. ECM fans are
able to reduce fan speed and power to save energy in three ways:
Cooling mode savings
Heating mode savings
Circulation mode savings
The majority of ECMs (93%) were installed in conjunction with an HVAC system. An AHRI SEER rating of a
cooling system often includes ECM savings in cooling mode. ICF tracked when ECMs were installed as
part of the AHRI SEER rating of a new HVAC system and when they were not. If an ECM was not installed
with a new HVAC system, the tracking database indicated whether it was installed into an existing HVAC
system. In this instance, the Cadmus team assumed a 1 SEER efficiency improvement (~10%),
attributable to installation of the ECM.12
The Cadmus team calculated savings in heating mode using savings estimates from the Wisconsin study.
We adjusted savings by estimating the proportion of heating runtimes in Wisconsin to heating runtimes
in Missouri. We assumed the HSPF rating of HPs included the benefit of the ECM fan, and we adjusted
heating savings by the percentage of HPs to CACs.
The final estimate of ECM savings accounted for weather differences between Wisconsin and Missouri.
Table 20 contains a summary of ECM savings. 13
Table 20. ECM Savings Summary
Measure Ex Ante
(kWh)
Ex Post
(kWh)
Number of
Participants Explanation
Concept 3 Installations Auto Fan Early
Replacement 929 649 8,234 The fan replaced an existing fan.
Concept 3 Installations Auto Fan
Replace at Fail 929 662 376
The fan did not replace an
existing, operating fan.
Concept 3 Installations Continuous
Fan Early Replacement 929 3,487 400
The fan replaced an existing fan
that was on continuously.
11 Electricity Use by New Furnaces, A Wisconsin Field Study: Energy Center of Wisconsin. Page 41.
12 Review of 13 SEER systems in the AHRI tracking database showed a 1 EER improvement due to presence of an ECM fan.
13 Concept 3 is a specific type of variable speed fan. The TRM measure name is “Concept 3” but the Heating and Cooling Program offers incentives for any central furnace ECM installation.

45
Summary Table 21 lists per-unit ex ante and ex post gross savings by measure and total ex post savings for each
measure. To estimate the program’s total gross energy savings, the Cadmus team applied the per-unit
values in to the program’ PY15 participation rates.
Table 21. PY15 Ex Ante and Ex Post Per-Unit Gross Savings and Total Ex Post Measure Savings
Measure PY15
Participation
Per-Unit Ex Post
Savings (kWh/yr)
Realization
Rate
Total Ex Post
Savings3
(kWh/yr)
HPs
ASHP—Early Replacement of ASHP1 729 5,101 109.6% 3,718,745
ASHP—Early Replacement of Electric
Furnace1
1005 14,405 93.6% 14,476,863
ASHP—Replace at failure of ASHP1 406 1,595 89.9% 647,581
ASHP—Replace at failure of Electric
Furnace1
68 12,840 92.5% 873,111
Dual Fuel HP (DFHP) 1 102 1,184 99.3% 120,734
GSHP 330 21,340 163.2% 7,042,243
CAC—Early Replacement1 9,619 1,799 87.7% 17,305,994
CAC—Replace on Burnout1 300 355 68.7% 106,576
HVAC Systems Receiving Condenser
Cleaning2
9,250 258 50.0% 2,383,997
HVAC Systems Receiving Refrigerant
Charge Adjustment2
1,028 856 448.4% 880,460
HVAC Systems Receiving Evaporator
Cleaning2
359 117 18.3% 41,998
HVAC Systems Receiving General
Maintenance
196 174 100.0% 34,084
ECM Auto Mode, Early Replacement 8,234 649 69.9% 5,346,006
ECM Auto Mode, Replace at failure 376 662 71.3% 248,898
ECM Continuous Mode 400 3,487 375.5% 1,394,769
Thermostat Installed with Setback
Programmed (Discontinued in PY14)
5 83 15.2% 414
Total 32,407 n/a 93.5% 54,622,474 1Combined incentive tiers (SEER 14, SEER 15, SEER 16). 2Savings adjusted assuming 18% of tune-ups were ASHPs which have additional savings in heating mode. 3Per-Unit ex post savings rounded to the nearest integer; therefore, total ex post savings did not exactly equal
the product of per unit ex post and participation quantity.

46
The demand savings calculation methodology and results are presented in Appendix A.

47
Net Impact Evaluation Results
The Cadmus team determined total programs net impacts by calculating total gross savings by measure
and then by applying the following:
Participant Free Ridership
Participant Spillover
NPSO
HVAC NPSO
Cadmus determined participant free ridership and participant spillover ratios using 140 participant
surveys completed in December 2015. We also used information from our interviews with 18
participating contractors from PY13 and 11 interviews in PY15, which served in our free ridership scoring
adjustments for all Heating and Cooling Program measures. Our experience indicates contractor
interview data about a participant’s intent proves important, as program participants often rely on their
contractor’s professional judgment and knowledge.
To determine NPSO, we conducted a random survey of 175 nonparticipating Ameren Missouri
customers (from Ameren Missouri’s residential customer database) to assess the influence of the
program on their decision to purchase or implement energy-efficient measures that received no
program incentive.
To determine spillover specifically attributable to the presence of the Heating and Cooling Program, we
surveyed and collected data from HVAC contractors and distributors to compare recent and historical
sales data.
This section discusses the Cadmus team’s methodology for calculating net savings by measure. Table 22
presents our estimates of the program’s net impacts.
Table 22. PY15 Heating and Cooling Program NTG Summary
Measure Group
Ex Post Gross
Savings
(kWh/yr)
Free
Ridership
Participant
Spillover NPSO
HVAC
NPSO
NTG
Ratio
Net Savings
(kWh/yr)*
ASHP 19,837,034 6.0%
0.1% 17.8% 5.1%
117.0% 23,214,605
CAC/ECM/T-Stat 24,402,657 14.0% 109.0% 26,602,845
GHSP 7,042,243 8.0% 115.1% 8,102,920
Tune-Up 3,340,540 40.5% 82.5% 2,756,809
Program Total 54,622,474 11.9% 0.1% 17.8% 5.1% 111.1% 60,677,178
*Total may not add to sum of measure-specific kW due to rounding

48
Free Ridership–Ground Source and Air Source Heat Pumps The Cadmus team used a participant self-report approach to determine free ridership ratios of
70 participants who chose to install a GSHP or ASHP. This approach relied on a standard battery of
questions that defined whether the participant completed the following:
Had already purchased the product before learning about the incentive.
Planned to purchase the same product before learning about the incentive.
Gave weight to advice from the contractor to purchase the equipment.
Would have purchased equipment just as energy efficient without the incentive.
Would have purchased the equipment at the same time as they did when going through the
Heating and Cooling Program.
Based on participant responses, we applied a free ridership score ranging from 0% to 100% to each
participant individually, based on their collective responses to the set of survey questions. We used the
following process for determining an incentive-based measure’s free ridership score:
We categorized customers as 0% free riders if:
They had no plans to install the measure in the absence of the program’s incentives and
would not have installed the measure within one year in the program’s absence;
They considered installing the measure before learning about the program, but would not
have done so without program incentives; or
In the absence of program incentives, they would have purchased or installed less-efficient
equipment.
We categorized customers as 100% free riders if they would have installed the same measure at
the same time without the program.
We assigned a partial free ridership score (ranging from 12.5% to 75%) to customers who
already had plans to install the measure, but who said their decisions about which product to
purchase or when they would purchase it was influenced by the program. For customers highly
likely to install the energy-efficient equipment right away and for whom the program had less
influence over their decisions, we assigned a higher free ridership percentage than for those
whom the program may not have had as large an influence (or whose purchases may have
occurred later in the program’s absence).
After translating survey responses into each participant’s free ridership score, we calculated an average
free ridership estimate, weighted by evaluated savings, for both ASHP and GSHP participants. (Appendix
D, Table 41 shows the conversion of each raw survey response option into free ridership scoring matrix
values; and the free ridership score combinations and scoring legend we used to categorize customer
survey responses for incentive-based measures.)
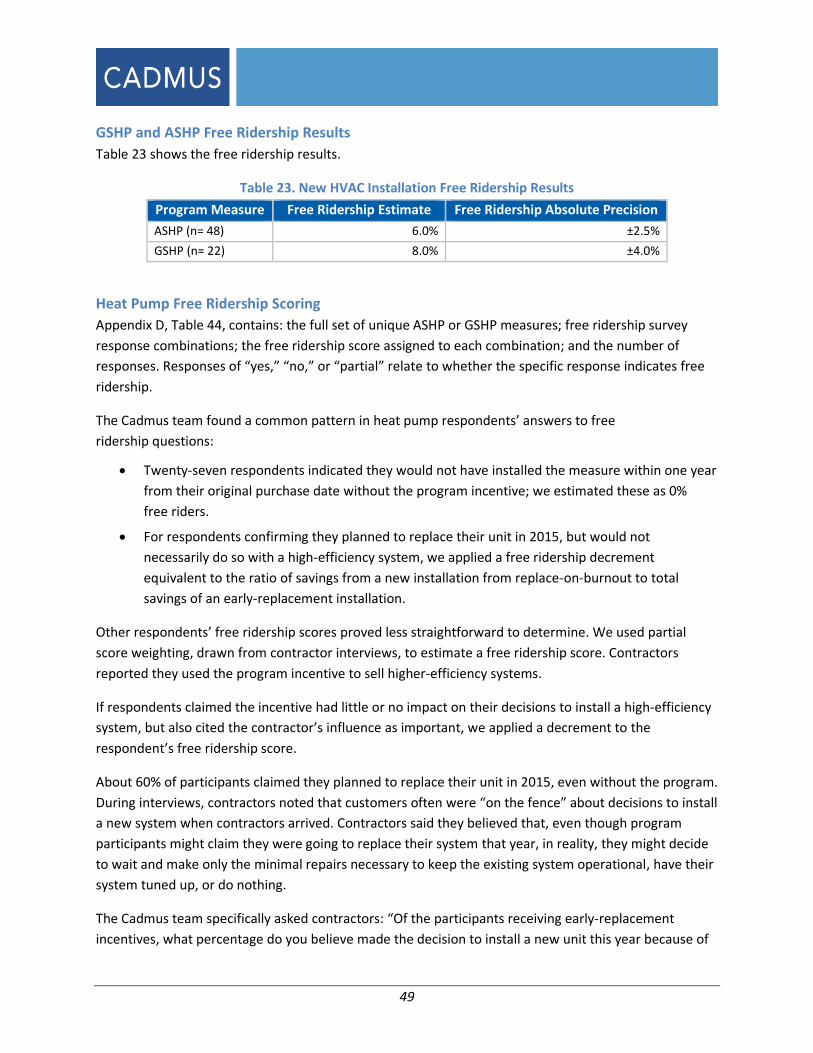
49
GSHP and ASHP Free Ridership Results
Table 23 shows the free ridership results.
Table 23. New HVAC Installation Free Ridership Results
Program Measure Free Ridership Estimate Free Ridership Absolute Precision
ASHP (n= 48) 6.0% ±2.5%
GSHP (n= 22) 8.0% ±4.0%
Heat Pump Free Ridership Scoring
Appendix D, Table 44, contains: the full set of unique ASHP or GSHP measures; free ridership survey
response combinations; the free ridership score assigned to each combination; and the number of
responses. Responses of “yes,” “no,” or “partial” relate to whether the specific response indicates free
ridership.
The Cadmus team found a common pattern in heat pump respondents’ answers to free
ridership questions:
Twenty-seven respondents indicated they would not have installed the measure within one year
from their original purchase date without the program incentive; we estimated these as 0%
free riders.
For respondents confirming they planned to replace their unit in 2015, but would not
necessarily do so with a high-efficiency system, we applied a free ridership decrement
equivalent to the ratio of savings from a new installation from replace-on-burnout to total
savings of an early-replacement installation.
Other respondents’ free ridership scores proved less straightforward to determine. We used partial
score weighting, drawn from contractor interviews, to estimate a free ridership score. Contractors
reported they used the program incentive to sell higher-efficiency systems.
If respondents claimed the incentive had little or no impact on their decisions to install a high-efficiency
system, but also cited the contractor’s influence as important, we applied a decrement to the
respondent’s free ridership score.
About 60% of participants claimed they planned to replace their unit in 2015, even without the program.
During interviews, contractors noted that customers often were “on the fence” about decisions to install
a new system when contractors arrived. Contractors said they believed that, even though program
participants might claim they were going to replace their system that year, in reality, they might decide
to wait and make only the minimal repairs necessary to keep the existing system operational, have their
system tuned up, or do nothing.
The Cadmus team specifically asked contractors: “Of the participants receiving early-replacement
incentives, what percentage do you believe made the decision to install a new unit this year because of

50
the incentive?” All contractors agreed the timing of many customers’ decisions to install a new unit was
influenced by the early replacement incentive.
When asked what percentage of their customers chose to replace that year, contractors typically
reported about one-half to two-thirds replaced their systems due to the incentive when they otherwise
would have deferred replacement. As these responses did not agree with the participants’ self-reported
responses (about 60% claimed they planned to replace that year, even without the incentive), we
adjusted the free ridership scores. If a participant claimed an intention to install that year, but also said
their contractor had an important influence on their decision to install the new system, we applied a
decrement to the free ridership score; so the results would more closely align.14
Distribution of Heat Pump Free Ridership Scores
Figure 8 shows the distribution of assigned free ridership scores. Approximately 67% of new HVAC
installation survey respondents received scores as 0% free riders, while we estimated 30% at low free
ridership levels (12.5% and 25%). We assigned a moderate free ridership level (50%) for 3% of
respondents, while we estimated no respondents as true free riders (100%).
Figure 8. Overall Distribution of Heat Pump Installation Free Ridership Scores
Free Ridership: Tune-Ups The Cadmus team determined tune-up free ridership via a participant self-report approach, based on a
standard battery of questions that defined whether the participant:
Would have purchased a tune-up that was just as energy-efficient without the incentive.
Would not have purchased the Heating and Cooling Program tune-up with the $75 discount.
14 From 60% of participants claiming they would have replaced units this year, those noting the importance of contractors’ influence received this decrement.
51
Would have purchased a tune-up at the same time as they did when they went through the
Heating and Cooling Program.
We then applied a free ridership score, ranging from 0% to 100%, to all participants individually, based
on their collective responses to the set of survey questions. Using the following process, we determined
an incentive-based measure, free ridership score:
We categorized customers as 0% free riders in the following instances:
They did not plan to purchase the tune-up in the absence of program incentives, and would
not have had the tune-up performed within one year, in the program’s absence;
In the absence of program incentives, they would have a less-efficient tune-up
performed; or
They would not have had the Heating and Cooling Program tune-up performed within the
same year without the discount.
We categorized customers as 100% free riders if we determined no differences occurred
between the Heating and Cooling Program tune-up and their standard tune-up, and if they
would have purchased the same Heating and Cooling Program tune-up without the discount
sooner or at the same time. This could only be applied to customers receiving the “condenser
cleaning only” measure. If a customer was assessed as a 100% free-rider and their HVAC system
required refrigerant charge or airflow adjustment, Cadmus applied a 50% decrement to the free
ridership score (see below).
We assigned a partial free ridership score (ranging from 12.5% to 75%) to customers saying they
already had planned to have a tune-up performed, but the program influenced the tune-up. For
customers highly likely to have a comparable tune-up performed right away and for whom the
program discount had less influence over their decision, we assigned a higher free ridership
percentage than those whom the program may not have influenced as greatly (or whose tune-
up purchases may have occurred later, in the absence of the discount).
The Cadmus team made scoring adjustments (50% decrement to free ridership score) for anyone with a
refrigerant charge adjustment or an airflow adjustment. Although we did not have a quantitative basis
for this adjustment, we considered it reasonable due to statements (such as the following) made by
interviewed contractors:
“We weren’t ever checking airflow for tune-up service calls. Now that this is a requirement of
the program; we check airflow every time and have realized there were issues with units we
would not have discovered before.”
“Before the tune-up program, we generally did check refrigerant charge (by subcooling or
superheat), but admittedly we might not have always done this, especially if we’re busy and the
system appears to be operating correctly.”
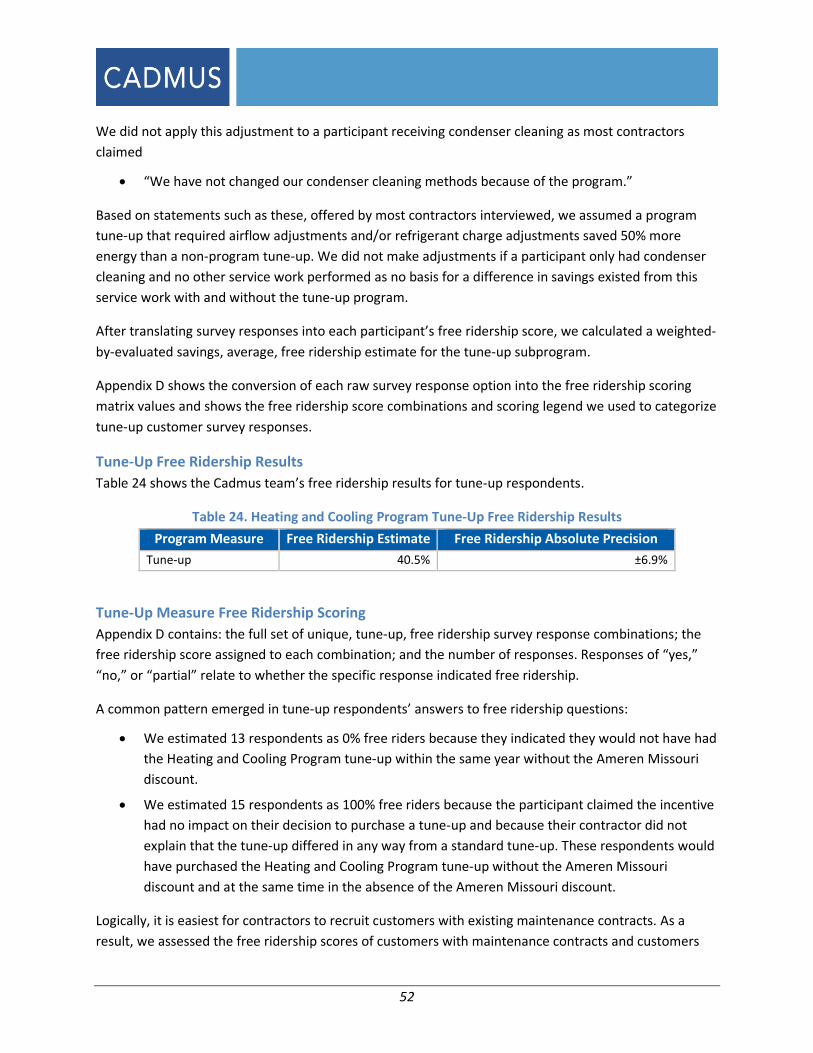
52
We did not apply this adjustment to a participant receiving condenser cleaning as most contractors
claimed
“We have not changed our condenser cleaning methods because of the program.”
Based on statements such as these, offered by most contractors interviewed, we assumed a program
tune-up that required airflow adjustments and/or refrigerant charge adjustments saved 50% more
energy than a non-program tune-up. We did not make adjustments if a participant only had condenser
cleaning and no other service work performed as no basis for a difference in savings existed from this
service work with and without the tune-up program.
After translating survey responses into each participant’s free ridership score, we calculated a weighted-
by-evaluated savings, average, free ridership estimate for the tune-up subprogram.
Appendix D shows the conversion of each raw survey response option into the free ridership scoring
matrix values and shows the free ridership score combinations and scoring legend we used to categorize
tune-up customer survey responses.
Tune-Up Free Ridership Results
Table 24 shows the Cadmus team’s free ridership results for tune-up respondents.
Table 24. Heating and Cooling Program Tune-Up Free Ridership Results
Program Measure Free Ridership Estimate Free Ridership Absolute Precision
Tune-up 40.5% ±6.9%
Tune-Up Measure Free Ridership Scoring
Appendix D contains: the full set of unique, tune-up, free ridership survey response combinations; the
free ridership score assigned to each combination; and the number of responses. Responses of “yes,”
“no,” or “partial” relate to whether the specific response indicated free ridership.
A common pattern emerged in tune-up respondents’ answers to free ridership questions:
We estimated 13 respondents as 0% free riders because they indicated they would not have had
the Heating and Cooling Program tune-up within the same year without the Ameren Missouri
discount.
We estimated 15 respondents as 100% free riders because the participant claimed the incentive
had no impact on their decision to purchase a tune-up and because their contractor did not
explain that the tune-up differed in any way from a standard tune-up. These respondents would
have purchased the Heating and Cooling Program tune-up without the Ameren Missouri
discount and at the same time in the absence of the Ameren Missouri discount.
Logically, it is easiest for contractors to recruit customers with existing maintenance contracts. As a
result, we assessed the free ridership scores of customers with maintenance contracts and customers
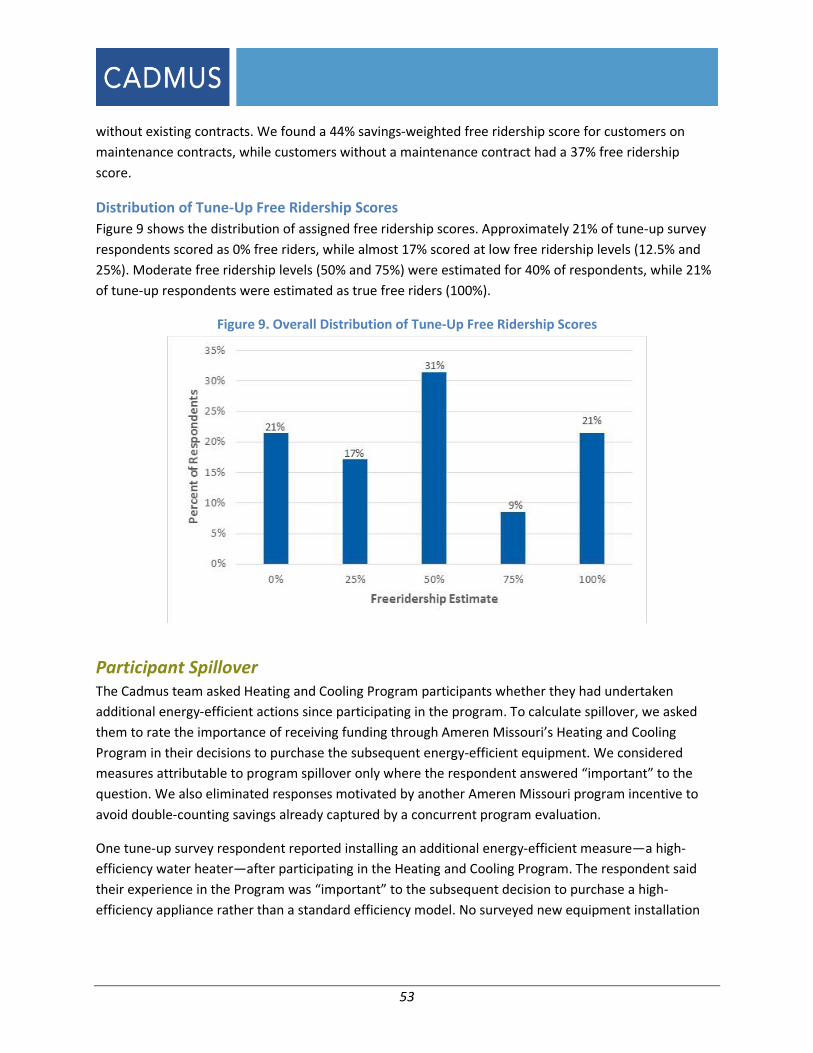
53
without existing contracts. We found a 44% savings-weighted free ridership score for customers on
maintenance contracts, while customers without a maintenance contract had a 37% free ridership
score.
Distribution of Tune-Up Free Ridership Scores
Figure 9 shows the distribution of assigned free ridership scores. Approximately 21% of tune-up survey
respondents scored as 0% free riders, while almost 17% scored at low free ridership levels (12.5% and
25%). Moderate free ridership levels (50% and 75%) were estimated for 40% of respondents, while 21%
of tune-up respondents were estimated as true free riders (100%).
Figure 9. Overall Distribution of Tune-Up Free Ridership Scores
Participant Spillover The Cadmus team asked Heating and Cooling Program participants whether they had undertaken
additional energy-efficient actions since participating in the program. To calculate spillover, we asked
them to rate the importance of receiving funding through Ameren Missouri’s Heating and Cooling
Program in their decisions to purchase the subsequent energy-efficient equipment. We considered
measures attributable to program spillover only where the respondent answered “important” to the
question. We also eliminated responses motivated by another Ameren Missouri program incentive to
avoid double-counting savings already captured by a concurrent program evaluation.
One tune-up survey respondent reported installing an additional energy-efficient measure—a high-
efficiency water heater—after participating in the Heating and Cooling Program. The respondent said
their experience in the Program was “important” to the subsequent decision to purchase a high-
efficiency appliance rather than a standard efficiency model. No surveyed new equipment installation

54
participants attributed spillover measures to their experiences or to participating in the Heating and
Cooling Program.
We estimated energy savings for the tune-up participant’s refrigerator spillover response, and then
divided total Heating and Cooling Program sample spillover savings by the total Heating and Cooling
Program gross savings, drawn from the survey sample, and as described in the following equation:
This yielded a spillover estimate of 0.1% for the new HVAC aspect of the program and 0.9% spillover
estimate for the HVAC tune-up. Table 25 and Table 26 present the spillover details for the new HVAC
installations and HVAC tune-ups, respectively.
Table 25. New HVAC Installation Participant Spillover
Spillover Measure Participant Spillover
kWh/year Savings*
Total Survey Sample Program
kWh/year Savings Spillover
Recycled refrigerator or freezer 998* 1,009,787 0.1%
Electric Water Heater 175**
Overall 1,173 1,009,787 0.1%
*Savings based on PY15 Refrigerator Recycling evaluation.
**Savings based on PY15 Efficient Products evaluation.
Table 26. HVAC Tune-Up Participant Spillover
Spillover Measure Participant Spillover
kWh/year Savings*
Total Survey Sample Program
kWh/year Savings Spillover
Electric Water Heater 175 18,514 0.9%
Overall 175 18,514 0.9%
*Savings based on PY15 Efficient Products evaluation.
Nonparticipant Spillover Effective program marketing and outreach generates program participation and increases general
energy efficiency awareness among customers. The cumulative effect of sustained utility program
marketing (which often occurs concurrently for multiple programs) can affect customers’ perceptions of
their energy usage and, in some cases, motivates customers to take efficiency actions outside of the
utility’s program. This phenomenon—called nonparticipant spillover (NPSO)—results in energy savings
caused by but not rebated through a utility’s demand-side management (DSM) activity.
During PY15, Ameren Missouri spent over $1.91 million dollars to market individual residential efficiency
programs (excluding low-income) and the portfolio-wide Act on Energy campaign—an amount more
than Ameren Missouri’s PY14 marketing expenditure ($1.53M).

55
To understand whether Ameren Missouri’s program-specific and general Act On Energy marketing
efforts generated energy efficiency improvements outside of Ameren Missouri’s incentive programs, the
Cadmus team implemented a general population survey of residential customers in PY15 to determine
the general population’s energy efficiency awareness and non-program participants energy efficiency
actions. This approach is consistent with the Uniform Methods Project protocols. 15
Methodology
In PY15, the Cadmus team selected and surveyed 200 customers, based on a randomly generated
sample frame of approximately 20,000 of Ameren Missouri’s residential customers. Through screening
survey respondents, we determined that the sample contained a number of customers (n=23) self-
reporting that they participated in an Ameren Missouri residential program during PY15. When
estimating NPSO, we excluded these customers from analysis, focusing on the 177 remaining random
nonparticipants; this avoided potential double-counting of program savings and/or program-specific
spillover. The sample of 200 is valid at 90% confidence level and within +-6% for estimating proportions.
We also limited the NPSO analysis to the same efficiency measures rebated through Ameren Missouri
programs (known as “like” spillover) because Ameren Missouri focuses its marketing primarily on
promoting the program portfolio, rather than through broad energy efficiency education. Program
specific marketing doesn’t preclude customers from implementing other energy efficiency
improvements as a result of their exposure to the programs, however since spillover estimates are
somewhat uncertain, restricting spillover to “like” measures adds a degree of conservativeness.16
Examples of “like” spillover included removing a secondary refrigerator and installing a programmable
thermostat. We did, however, exclude one notable category of “like” measures: lighting products. This
precluded double-counting NPSO lighting savings already captured through the upstream Lighting
program market affects analysis.
To ensure the responses included in the analysis represented electric spillover savings, Cadmus asked
customers questions about fuel type for water heaters, heating systems, and cooling systems. The
analysis only counted savings associated with measures where there was a corresponding electric water
heater, electric heat, or central air conditioning as spillover.
To confirm a relationship between Ameren Missouri’s energy efficiency programs, Ameren Missouri’s
awareness campaign, and actions taken by nonparticipants, our survey asked about nonparticipants’
familiarity with Ameren Missouri’s energy-efficiency programs and associated campaign. To be included
in the NPSO analysis, nonparticipating respondents had to indicate the following:
They were familiar with Ameren Missouri’s campaign; and
15 http://energy.gov/sites/prod/files/2015/02/f19/UMPChapter23-estimating-net-savings_0.pdf
16 Ameren Missouri promoted the portfolio of programs in a number of channels including pre-game shows at St. Louis Cardinals games, an outfield sign at Busch Stadium, digital banners, key word searches, metro link signs, social media, and Cardinals sweepstakes.
56
Ameren Missouri’s efficiency messaging motivated their purchasing decisions.
If a reported spillover measure type was offered under an Ameren Missouri rebate program,
respondents were asked why they or their contractor did not apply for a rebate through Ameren
Missouri. We did not count measures towards spillover if respondents reported applying for an Ameren
Missouri rebate but did not receive one because their product did not qualify. We compared the names,
addresses, and phone numbers of respondents to tracking databases to ensure that the respondents
were not confused by the questions and had, in fact, participated in the program. We did not find any,
which would have eliminate the measure as nonparticipant spillover. Since it was the largest savings
measure, we further investigated the logic of refrigerator recycling as a spillover measure—i.e. why
would someone find out about the program, then recycle the refrigerator own their own? Although
motivations aren’t known, Ameren Missouri staff indicate that in PY15, and similar to other years, 18.2%
of customers who originally sign up for recycling, cancel the pickup. Possible reasons might be inability
to agree upon a schedule or a perceived opportunity to earn more money for parts. Thus it is logical
that due to Ameren Missouri’s marketing efforts, customers may recycle on their own.
For measure types where it applied, we also asked respondents how they know their product is energy
efficient. Examples of answers that would keep reported measures in consideration for spillover are:
It’s ENERGY STAR rated
The retailer/dealer/contractor told me it was
We eliminated two measures from spillover consideration because the respondents ‘did not know’ how
to justify their product was energy efficient.
Results
Of 177 nonparticipants surveyed, 12 cited Ameren Missouri’s marketing as “very important” or
“somewhat important” in their decisions to purchase non-rebated, high-efficiency measures during
2015:17
Among nonparticipants citing their knowledge of Ameren Missouri’s energy efficiency programs
or the Ameren Missouri’s campaign as “very important,” we counted ex post, gross, per-unit
savings, determined through the PY15 evaluation towards the NPSO analysis.
17 This translates to approximately 7% of the general population, with a range of 90% confidence of 4% to 10%. Despite the range, the 7% middle point remains the most likely value. With 7% of the population undertaking actions on their own, a sample size of nearly 5,000 surveys would be needed to detect such a level with ±10% (6.3% to 7.7%) —clearly a prohibitive undertaking.
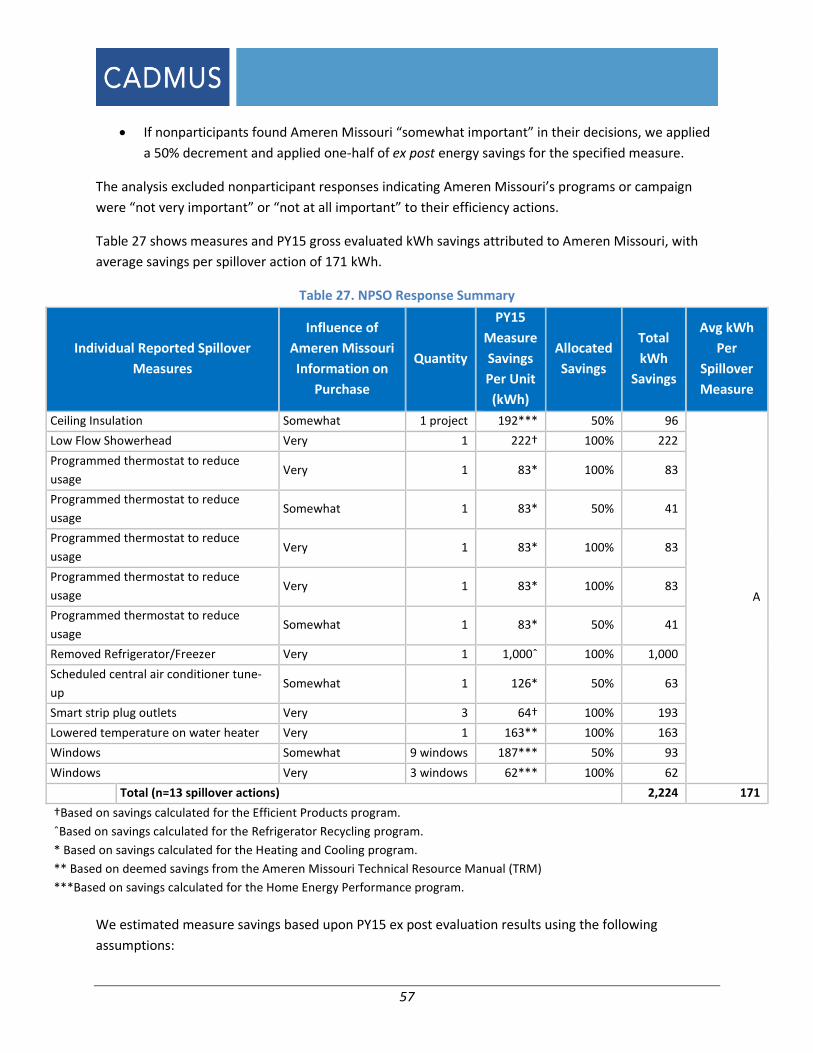
57
If nonparticipants found Ameren Missouri “somewhat important” in their decisions, we applied
a 50% decrement and applied one-half of ex post energy savings for the specified measure.
The analysis excluded nonparticipant responses indicating Ameren Missouri’s programs or campaign
were “not very important” or “not at all important” to their efficiency actions.
Table 27 shows measures and PY15 gross evaluated kWh savings attributed to Ameren Missouri, with
average savings per spillover action of 171 kWh.
Table 27. NPSO Response Summary
Individual Reported Spillover
Measures
Influence of
Ameren Missouri
Information on
Purchase
Quantity
PY15
Measure
Savings
Per Unit
(kWh)
Allocated
Savings
Total
kWh
Savings
Avg kWh
Per
Spillover
Measure
Ceiling Insulation Somewhat 1 project 192*** 50% 96
A
Low Flow Showerhead Very 1 222† 100% 222
Programmed thermostat to reduce
usage Very 1 83* 100% 83
Programmed thermostat to reduce
usage Somewhat 1 83* 50% 41
Programmed thermostat to reduce
usage Very 1 83* 100% 83
Programmed thermostat to reduce
usage Very 1 83* 100% 83
Programmed thermostat to reduce
usage Somewhat 1 83* 50% 41
Removed Refrigerator/Freezer Very 1 1,000ˆ 100% 1,000
Scheduled central air conditioner tune-
up Somewhat 1 126* 50% 63
Smart strip plug outlets Very 3 64† 100% 193
Lowered temperature on water heater Very 1 163** 100% 163
Windows Somewhat 9 windows 187*** 50% 93
Windows Very 3 windows 62*** 100% 62
Total (n=13 spillover actions) 2,224 171
†Based on savings calculated for the Efficient Products program.
ˆBased on savings calculated for the Refrigerator Recycling program.
* Based on savings calculated for the Heating and Cooling program.
** Based on deemed savings from the Ameren Missouri Technical Resource Manual (TRM)
***Based on savings calculated for the Home Energy Performance program.
We estimated measure savings based upon PY15 ex post evaluation results using the following
assumptions:
58
For ceiling insulation measure we used the ex post weighted average ceiling insulation savings
per home from the Home Energy Performance program.
For the low flow showerhead measure we used the ex post average savings per showerhead
from the Efficient Products program.
For the programmed thermostat to reduce usage measure we used the ex post weighted
average per setback savings from the Heating and Cooling program.
For the removed refrigerator or freezer measure we used the ex post population weighted
average of the part-use adjusted refrigerator and freezer per-unit savings estimates.
For tune-ups we assumed the system was a central air conditioner receiving a condenser
cleaning (the most common program tune-up measure). We applied the Heating and Cooling
program ex post savings for this measure of 251.4 kWh. For purposes of NPSO, we
conservatively de-rated the estimated savings by 50% to get 125.7 kWh savings considering that
a non-program tune-up may not meet the program quality standards and would save less.
For smart strip plug outlets we used the ex post average savings for smart strips from the
Efficient Products program.
For the lowered temperature on water heater measure we used the deemed savings from the
Ameren Missouri Technical Resource Manual which assumes a 40 gallon residential tank and a
current typical existing market baseline of electric water heater thermostat set at 135 degrees F
and a minimum threshold for savings credit of a post set point at 120 degrees F.
For the respondent who installed 9 energy efficient windows we used the ex post average
window savings per home from the Home Energy Performance program of 186.9 kWh.
For the windows respondent who installed 3 energy efficient windows we applied one-third of
the ex post average window savings per home from the Home Energy Performance Program.
To arrive at a single savings estimate (Variable A in Table 27), the Cadmus team used numbers in the
Total kWh Savings column to calculate an average for the 15 measures assessed for NPSO. Thus, the 171
kWh estimate represented average nonparticipant energy savings, per respondent attributing spillover
to Ameren Missouri’s residential programs.
To determine the total NPSO generated by Ameren Missouri marketing in 2015, we used the following
variables (as shown in Table 28):
A is the average kWh savings per NPSO response.
B is the number of NPSO measures attributed to the program.
C is the number of nonparticipants contacted by the survey implementer.
D is Ameren Missouri’s total residential customer population (excluding PY15 participants).
E is NPSO energy savings, extrapolated to the customer population, and calculated by dividing B
by C, and then multiplying the result by A and D.
59
F is Ameren Missouri’s total reported 2015 program year ex post gross savings for Refrigerator
Recycling, Heating and Cooling, Lighting, Home Energy Performance, and Efficient Products.
(Similarly to PY14, the PY15 analysis did not include the Low Income program.)18
G (representing NPSO as a percentage of total evaluated savings) is the nonparticipant
percentage used in the NTG calculations.
Using this information, the Cadmus team estimated overall, portfolio-level NPSO at 8.6% of total PY15
reported ex post gross savings, as shown in Table 28Error! Reference source not found.. Smaller NPSO
savings were reported in PY14
(7,592 MWH) than in PY15 (12,247 MWH). This combined with lower total ex post residential portfolio
savings in PY15 (142,016 MHW) than in PY14 (210,530 MH). Consequently, this resulted in a higher
NPSO as a percent of total ex post residential portfolio savings values in PY15 (8.6%) than estimated for
PY14 (3.6%). Both years identified a similar list of measures installed. A growing proportion of
nonparticipant spillover is consistent with what we would expect from long running marketing of a
program portfolio.
18 We excluded the Low Income program as it exclusively worked directly with property managers of low-income buildings; so marketing for this program would likely generate little NPSO.
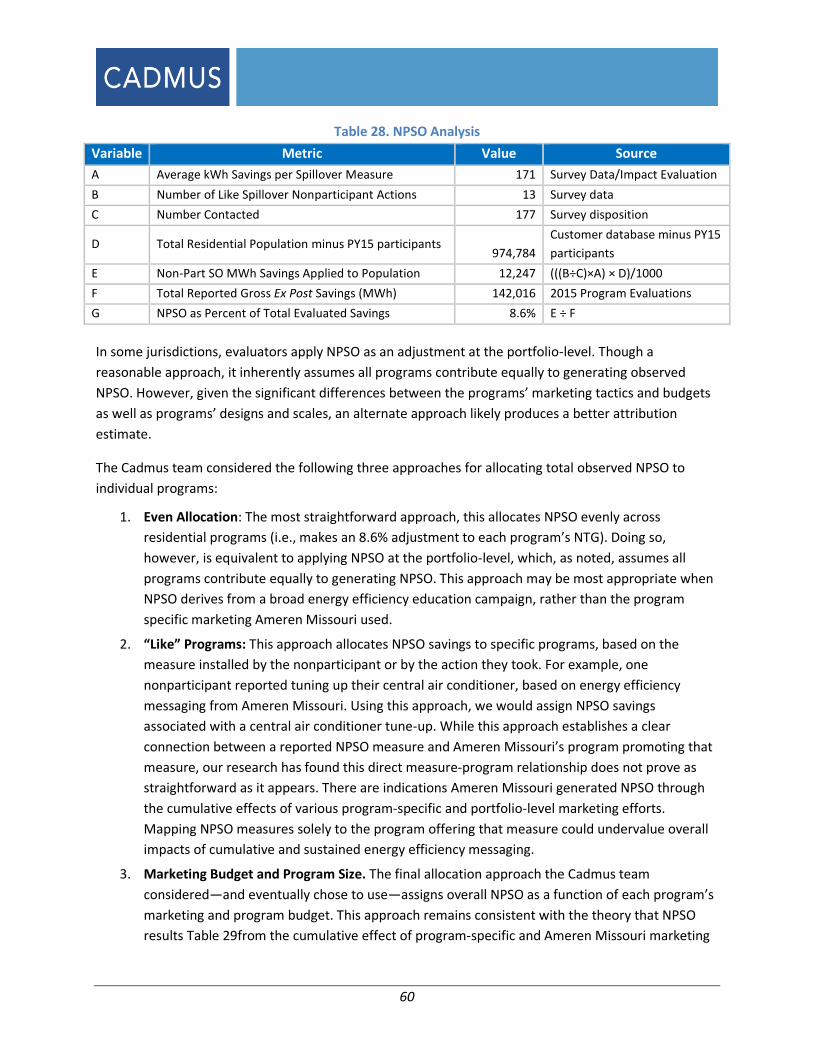
60
Table 28. NPSO Analysis
Variable Metric Value Source
A Average kWh Savings per Spillover Measure 171 Survey Data/Impact Evaluation
B Number of Like Spillover Nonparticipant Actions 13 Survey data
C Number Contacted 177 Survey disposition
D Total Residential Population minus PY15 participants 974,784
Customer database minus PY15
participants
E Non-Part SO MWh Savings Applied to Population 12,247 (((B÷C)×A) × D)/1000
F Total Reported Gross Ex Post Savings (MWh) 142,016 2015 Program Evaluations
G NPSO as Percent of Total Evaluated Savings 8.6% E ÷ F
In some jurisdictions, evaluators apply NPSO as an adjustment at the portfolio-level. Though a
reasonable approach, it inherently assumes all programs contribute equally to generating observed
NPSO. However, given the significant differences between the programs’ marketing tactics and budgets
as well as programs’ designs and scales, an alternate approach likely produces a better attribution
estimate.
The Cadmus team considered the following three approaches for allocating total observed NPSO to
individual programs:
1. Even Allocation: The most straightforward approach, this allocates NPSO evenly across
residential programs (i.e., makes an 8.6% adjustment to each program’s NTG). Doing so,
however, is equivalent to applying NPSO at the portfolio-level, which, as noted, assumes all
programs contribute equally to generating NPSO. This approach may be most appropriate when
NPSO derives from a broad energy efficiency education campaign, rather than the program
specific marketing Ameren Missouri used.
2. “Like” Programs: This approach allocates NPSO savings to specific programs, based on the
measure installed by the nonparticipant or by the action they took. For example, one
nonparticipant reported tuning up their central air conditioner, based on energy efficiency
messaging from Ameren Missouri. Using this approach, we would assign NPSO savings
associated with a central air conditioner tune-up. While this approach establishes a clear
connection between a reported NPSO measure and Ameren Missouri’s program promoting that
measure, our research has found this direct measure-program relationship does not prove as
straightforward as it appears. There are indications Ameren Missouri generated NPSO through
the cumulative effects of various program-specific and portfolio-level marketing efforts.
Mapping NPSO measures solely to the program offering that measure could undervalue overall
impacts of cumulative and sustained energy efficiency messaging.
3. Marketing Budget and Program Size. The final allocation approach the Cadmus team
considered—and eventually chose to use—assigns overall NPSO as a function of each program’s
marketing and program budget. This approach remains consistent with the theory that NPSO
results Table 29from the cumulative effect of program-specific and Ameren Missouri marketing

61
and program activity over a period of time, not necessarily by a single, program-specific
marketing effort and not by a broad education campaign. In addition, while NPSO most
commonly is associated with mass media marketing campaigns, the scale of program activity
proves to be a factor. For example, even without a significant marketing campaign, a program’s
size can drive NPSO through word-of-mouth and in-store program messaging. We find this
approach accurately reflects and attributes NPSO to programs, ensuring proper accounting for
total costs (including marketing) and total benefits (net savings, including NPSO) when assessing
overall program cost-effectiveness.
The Cadmus team distributed the portfolio-level result of 12,247 MWh NPSO to Ameren Missouri’s
residential programs (excluding Low Income). As noted, we considered the PY15 program size (in terms
of total gross ex post MWh savings) and each program’s marketing budget (as shown in Error! Reference
source not found.) when allocating NPSO across programs.
Table 29. Program-Specific Savings and Marketing
Program Program Ex Post
Gross Savings (MWh)
Percentage of
Portfolio Savings
Total
Marketin
g
Percentage of
Total Marketing
Refrigerator Recycling 10,774 7.6% $630,194 32.9%
Heating and Cooling 54,622 38.5% $955,454 49.9%
Lighting 68,326 48.1% $71,804 3.8%
Home Energy Performance 385 0.3% $46,670 2.4%
Efficient Products 7,908 5.6% $209,907 11.0%
Total 142,016 100% $1,914,029 100%
The results of this approach—shown in Table 30 and Table 31—reflect each program’s impact on the
nonparticipant population, based on marketing expenditures and the magnitude of the program’s
intervention in the regional marketplace.
Table 30. Combined Savings and Marketing Allocation Approach
Program
Ex Post Gross
Energy Savings
(A)
Marketing
Spending (B)
Combined
Savings/
Marketing
(AxB)
Percentage of
Combined
Savings/
Marketing
Refrigerator Recycling 7.6% 32.9% 2.5% 10.4%
Heating and Cooling 38.5% 49.9% 19.2% 79.6%
Lighting 48.1% 3.8% 1.8% 7.5%
Home Energy Performance 0.3% 2.4% 0.01% 0.03%
Efficient Products 5.6% 11.0% 0.6% 2.5%
Total 100% 100% 24.1% 100%
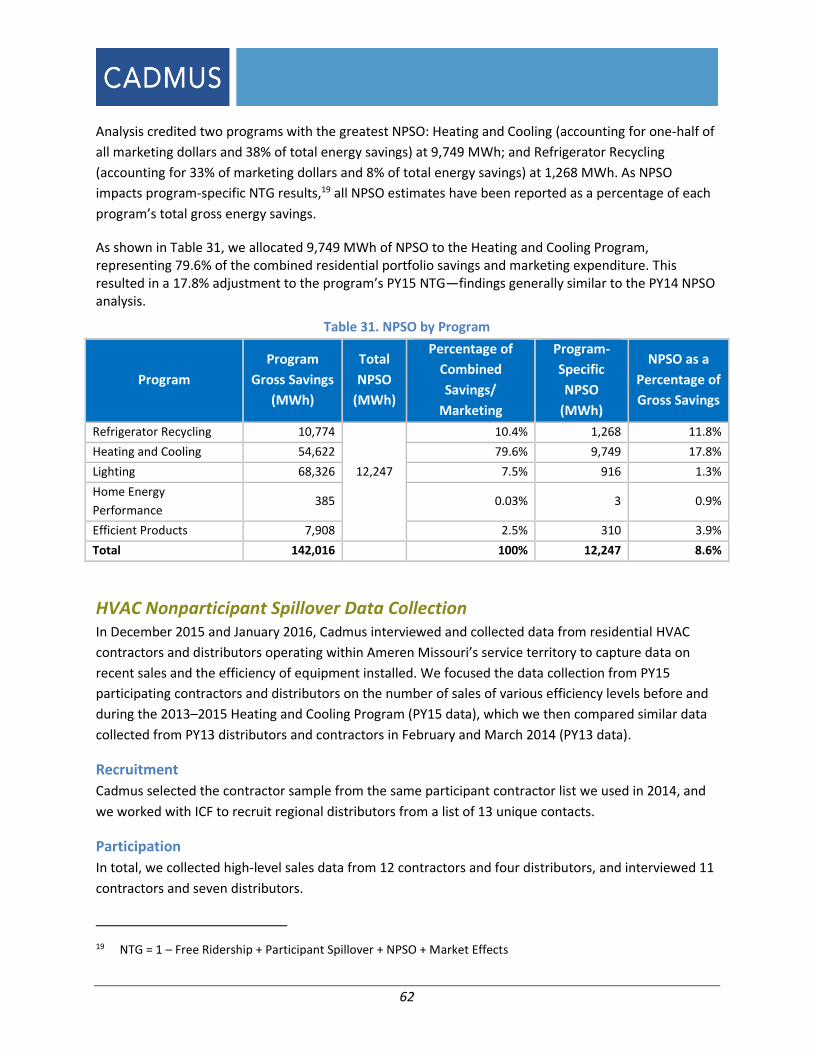
62
Analysis credited two programs with the greatest NPSO: Heating and Cooling (accounting for one-half of
all marketing dollars and 38% of total energy savings) at 9,749 MWh; and Refrigerator Recycling
(accounting for 33% of marketing dollars and 8% of total energy savings) at 1,268 MWh. As NPSO
impacts program-specific NTG results,19 all NPSO estimates have been reported as a percentage of each
program’s total gross energy savings.
As shown in Table 31, we allocated 9,749 MWh of NPSO to the Heating and Cooling Program, representing 79.6% of the combined residential portfolio savings and marketing expenditure. This resulted in a 17.8% adjustment to the program’s PY15 NTG—findings generally similar to the PY14 NPSO analysis.
Table 31. NPSO by Program
Program
Program
Gross Savings
(MWh)
Total
NPSO
(MWh)
Percentage of
Combined
Savings/
Marketing
Program-
Specific
NPSO
(MWh)
NPSO as a
Percentage of
Gross Savings
Refrigerator Recycling 10,774
12,247
10.4% 1,268 11.8%
Heating and Cooling 54,622 79.6% 9,749 17.8%
Lighting 68,326 7.5% 916 1.3%
Home Energy
Performance 385 0.03% 3 0.9%
Efficient Products 7,908 2.5% 310 3.9%
Total 142,016 100% 12,247 8.6%
HVAC Nonparticipant Spillover Data Collection In December 2015 and January 2016, Cadmus interviewed and collected data from residential HVAC
contractors and distributors operating within Ameren Missouri’s service territory to capture data on
recent sales and the efficiency of equipment installed. We focused the data collection from PY15
participating contractors and distributors on the number of sales of various efficiency levels before and
during the 2013–2015 Heating and Cooling Program (PY15 data), which we then compared similar data
collected from PY13 distributors and contractors in February and March 2014 (PY13 data).
Recruitment
Cadmus selected the contractor sample from the same participant contractor list we used in 2014, and
we worked with ICF to recruit regional distributors from a list of 13 unique contacts.
Participation
In total, we collected high-level sales data from 12 contractors and four distributors, and interviewed 11
contractors and seven distributors.
19 NTG = 1 – Free Ridership + Participant Spillover + NPSO + Market Effects

63
Data Summary The following section summarizes the sales data collected from 12 HVAC contractors and four
distributors as well as interview results from seven distributors.
PY15 Distributor and Contractor Data
As shown in Table 32 and Figure 10, contractors reported that the share of 13 SEER units declined from
39% of their overall sales in 2012 to only 9% in 2015, while sales of both 14–15 SEER and 16–18+ SEER
units increased over the same period. Distributor sales data shows a similar trend, with the reported
share of 13 SEER units decreasing from 76% of overall sales in 2012 to 53% in 2015. Contractors
reported higher market shares of high-efficiency equipment sales than distributors. This likely resulted
from distributor sales data including sales to both participating and nonparticipating contractors,
reflecting a much larger number of sales than those represented by contractors (although we asked
both groups only to provide data relevant to Ameren Missouri service territory).
Table 32. Distributor and Contractor Sales by SEER Level and Year for PY15
SEER 2012*
Distributor
2012
Contractor
2015
Distributor
2015
Contractor
13 76% (n=15,235) 39% (n=898) 53% (n=11,573) 9% (n=196)
14-15 15% (n=3,015) 40% (n=915) 25% (n=5,346) 49% (n=1,026)
16-18+ 9% (n=1,893) 21% (n=470) 23% (n=4,870) 42% (n=870)
Total Yearly HVAC Sales
(split ACs and HPs) 100% (n=20,143) 100% (n=2,283) 100% (n=21,789) 100% (n=2,092)
*One out of the four distributors did not estimate their total number of sales for 2012. We extrapolated the
incomplete values for this distributor from their 2015 sales data based on the average SEER distributions
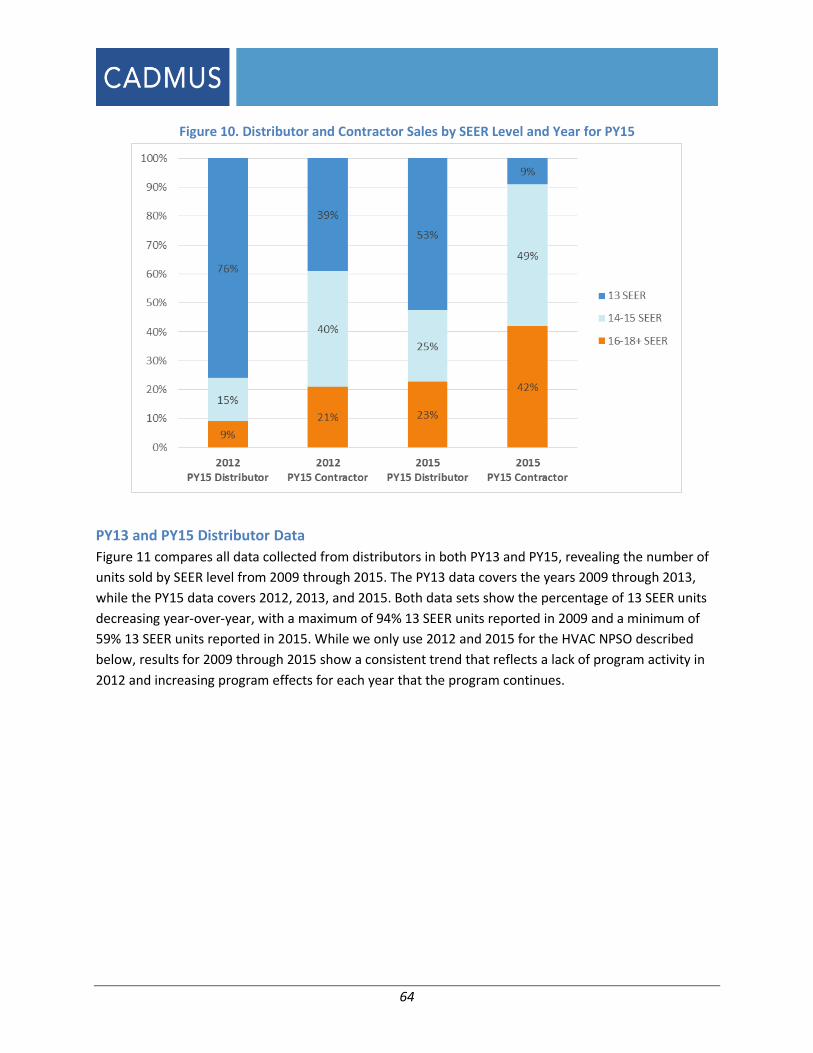
64
Figure 10. Distributor and Contractor Sales by SEER Level and Year for PY15
PY13 and PY15 Distributor Data
Figure 11 compares all data collected from distributors in both PY13 and PY15, revealing the number of
units sold by SEER level from 2009 through 2015. The PY13 data covers the years 2009 through 2013,
while the PY15 data covers 2012, 2013, and 2015. Both data sets show the percentage of 13 SEER units
decreasing year-over-year, with a maximum of 94% 13 SEER units reported in 2009 and a minimum of
59% 13 SEER units reported in 2015. While we only use 2012 and 2015 for the HVAC NPSO described
below, results for 2009 through 2015 show a consistent trend that reflects a lack of program activity in
2012 and increasing program effects for each year that the program continues.
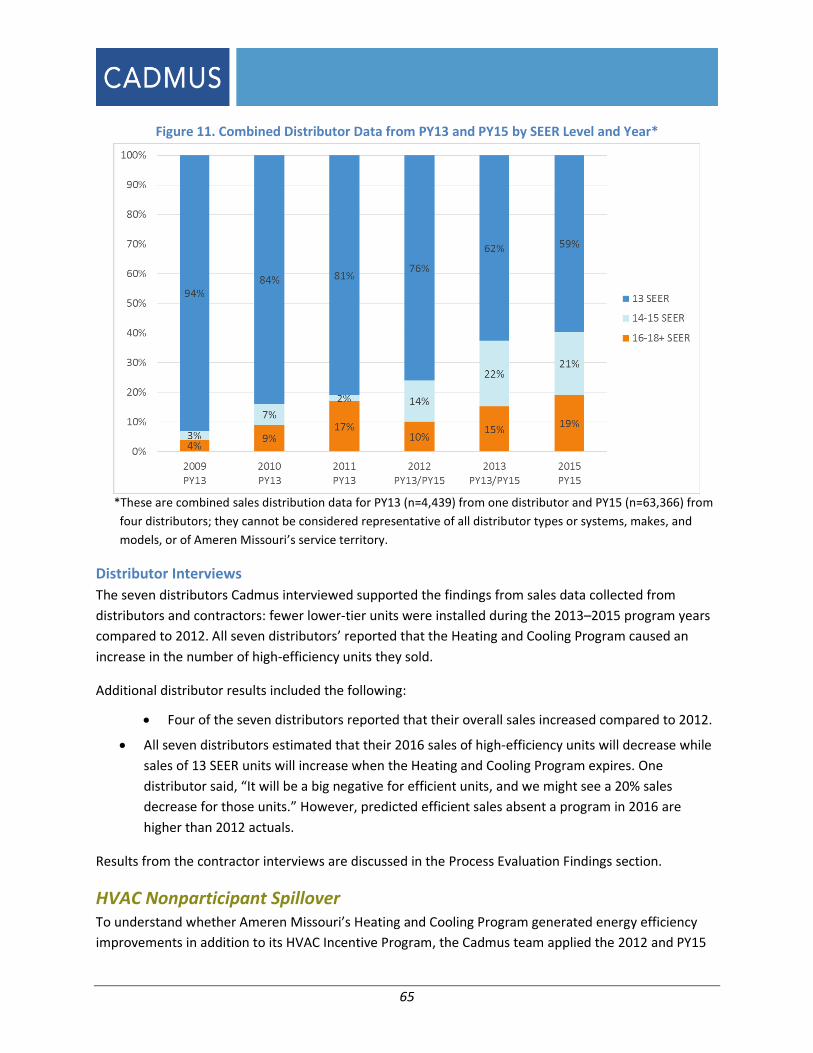
65
Figure 11. Combined Distributor Data from PY13 and PY15 by SEER Level and Year*
*These are combined sales distribution data for PY13 (n=4,439) from one distributor and PY15 (n=63,366) from
four distributors; they cannot be considered representative of all distributor types or systems, makes, and
models, or of Ameren Missouri’s service territory.
Distributor Interviews
The seven distributors Cadmus interviewed supported the findings from sales data collected from
distributors and contractors: fewer lower-tier units were installed during the 2013–2015 program years
compared to 2012. All seven distributors’ reported that the Heating and Cooling Program caused an
increase in the number of high-efficiency units they sold.
Additional distributor results included the following:
Four of the seven distributors reported that their overall sales increased compared to 2012.
All seven distributors estimated that their 2016 sales of high-efficiency units will decrease while
sales of 13 SEER units will increase when the Heating and Cooling Program expires. One
distributor said, “It will be a big negative for efficient units, and we might see a 20% sales
decrease for those units.” However, predicted efficient sales absent a program in 2016 are
higher than 2012 actuals.
Results from the contractor interviews are discussed in the Process Evaluation Findings section.
HVAC Nonparticipant Spillover To understand whether Ameren Missouri’s Heating and Cooling Program generated energy efficiency
improvements in addition to its HVAC Incentive Program, the Cadmus team applied the 2012 and PY15

66
distributors’ sales data to estimate HVAC NPSO. We considered the survey responses as described in
the previous sections as anecdotal evidence supporting the analysis and results.
Methodology
Using Ameren Missouri’s total customer count and the CAC/HP saturation percentage, we estimated the
market for CAC and HP units replaced annually by assuming burnout occurred linearly throughout the
effective useful life of all the units. As shown in Table 33, Cadmus estimated the market size for CACs
and HPs as approximately 50,312 units.
Table 33. Total CAC and HP Market
Line Input Value Source
1 Residential Customers 1,040,928 Provided by Ameren Missouri, June 2013 (used in
LightSavers ME analysis)
2 CAC/HP Saturation 87% Provided by Ameren Missouri
3 Effective Useful Life 18 Ameren Missouri TRM (for New Systems, pg. 11)
4 Annual Turnover Percentage - 1/EUL
(# of units that burn out each year) 5.6% 1/Line 3
5 "Replaceable" Units/Year 50,312 Line 1 * Line 2 * Line 4
To determine the total NPSO generated by the program between 2012 and 2015, we used the input
variables shown in Table 34.
Table 34. NPSO Input Variables Summary
Variable Input Value Notes
A Annual CAC Market per Year 50,312 See Table 33
B Annual Change in Distributor
Sales Above 13 SEER 36.0% 2012-2015 Distributor Data
C PY12 CAC/HP Participation (early
replacement and burnout) 0- No Program in 2012
D PY15 Program Sales 11,046
Cadmus, Ameren Missouri Heating and Cooling
Program Impact and Process Evaluation: Program
Year 2015, May 15, 2015 (Table 1)
E
Weighted Average CAC/HP
Naturally Occurring Free
Ridership
16.5%
Cadmus, Ameren Missouri Heating and Cooling
Program Impact and Process Evaluation: Program
Year 2015, May 15, 2015 (Table 1)
F Weighted Average CAC/HP Unit
Savings for Burnout(kWh/unit) 482
Cadmus, Ameren Missouri Heating and Cooling
Program Impact and Process Evaluation: Program
Year 2015, May 15, 2015 (Table 1)
H Overall Program Savings (kWh) 54,622,474
Cadmus, Ameren Missouri Heating and Cooling
Program Impact and Process Evaluation: Program
Year 2015 (Table 1).
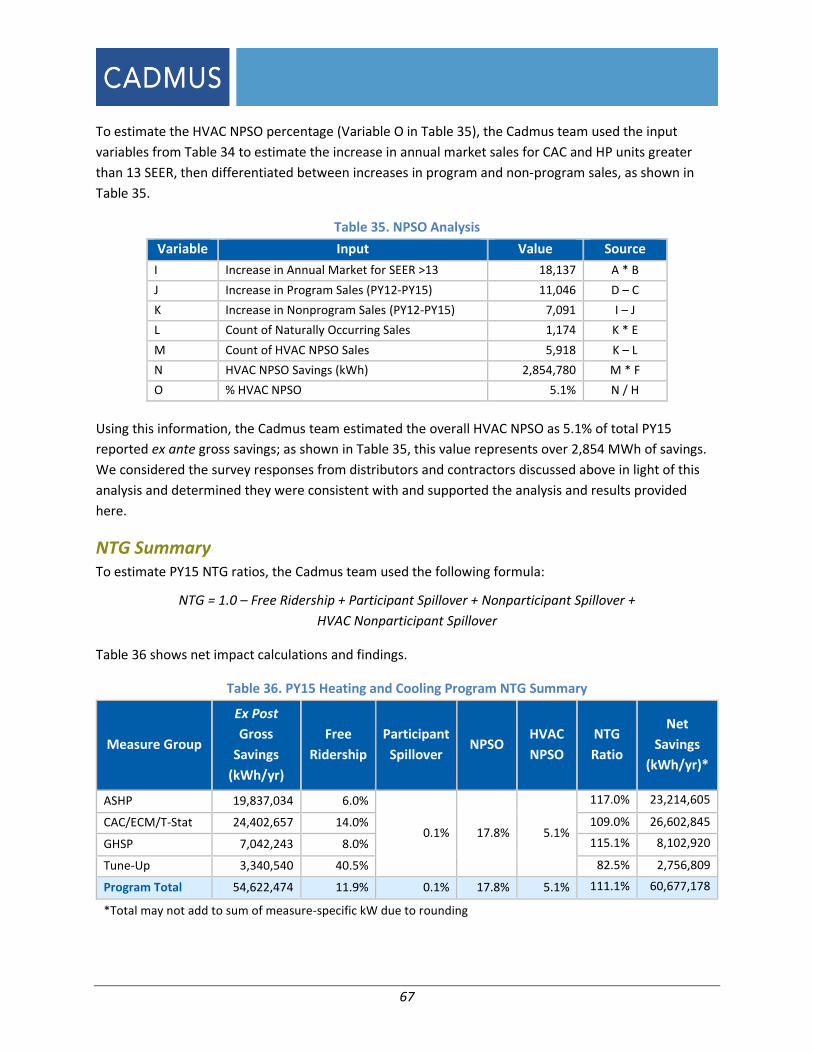
67
To estimate the HVAC NPSO percentage (Variable O in Table 35), the Cadmus team used the input
variables from Table 34 to estimate the increase in annual market sales for CAC and HP units greater
than 13 SEER, then differentiated between increases in program and non-program sales, as shown in
Table 35.
Table 35. NPSO Analysis
Variable Input Value Source
I Increase in Annual Market for SEER >13 18,137 A * B
J Increase in Program Sales (PY12-PY15) 11,046 D – C
K Increase in Nonprogram Sales (PY12-PY15) 7,091 I – J
L Count of Naturally Occurring Sales 1,174 K * E
M Count of HVAC NPSO Sales 5,918 K – L
N HVAC NPSO Savings (kWh) 2,854,780 M * F
O % HVAC NPSO 5.1% N / H
Using this information, the Cadmus team estimated the overall HVAC NPSO as 5.1% of total PY15
reported ex ante gross savings; as shown in Table 35, this value represents over 2,854 MWh of savings.
We considered the survey responses from distributors and contractors discussed above in light of this
analysis and determined they were consistent with and supported the analysis and results provided
here.
NTG Summary To estimate PY15 NTG ratios, the Cadmus team used the following formula:
NTG = 1.0 – Free Ridership + Participant Spillover + Nonparticipant Spillover +
HVAC Nonparticipant Spillover
Table 36 shows net impact calculations and findings.
Table 36. PY15 Heating and Cooling Program NTG Summary
Measure Group
Ex Post
Gross
Savings
(kWh/yr)
Free
Ridership
Participant
Spillover NPSO
HVAC
NPSO
NTG
Ratio
Net
Savings
(kWh/yr)*
ASHP 19,837,034 6.0%
0.1% 17.8% 5.1%
117.0% 23,214,605
CAC/ECM/T-Stat 24,402,657 14.0% 109.0% 26,602,845
GHSP 7,042,243 8.0% 115.1% 8,102,920
Tune-Up 3,340,540 40.5% 82.5% 2,756,809
Program Total 54,622,474 11.9% 0.1% 17.8% 5.1% 111.1% 60,677,178
*Total may not add to sum of measure-specific kW due to rounding
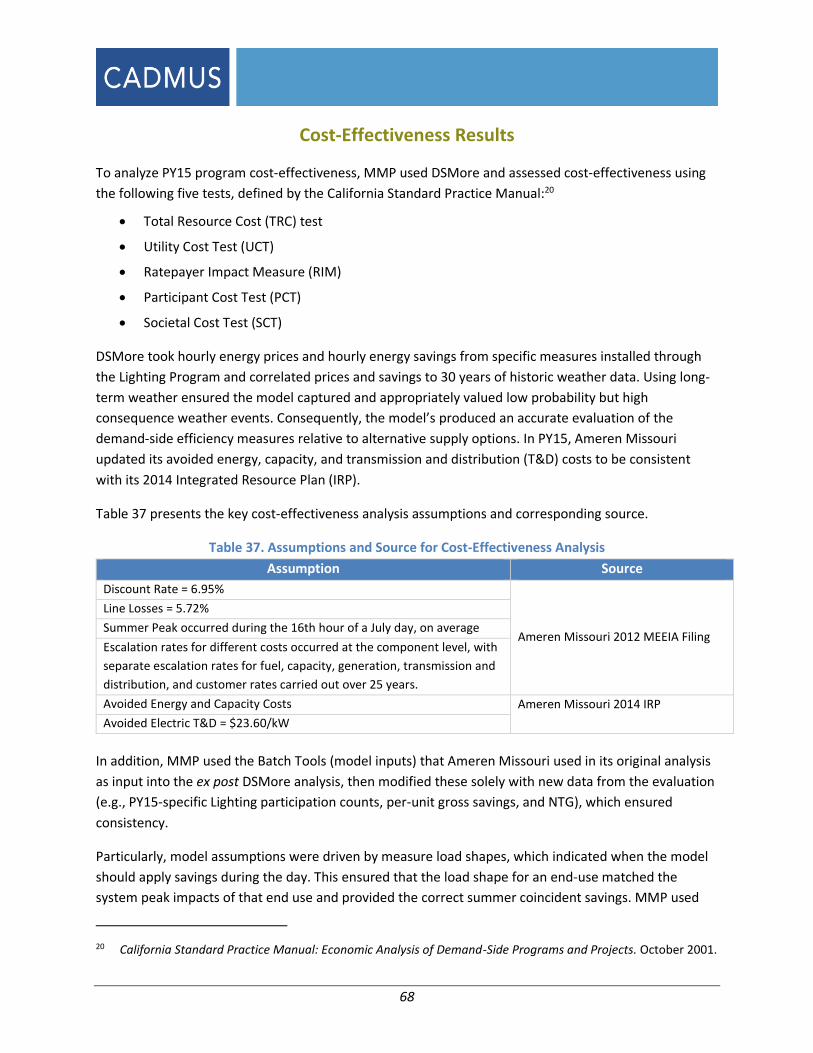
68
Cost-Effectiveness Results
To analyze PY15 program cost-effectiveness, MMP used DSMore and assessed cost-effectiveness using
the following five tests, defined by the California Standard Practice Manual:20
Total Resource Cost (TRC) test
Utility Cost Test (UCT)
Ratepayer Impact Measure (RIM)
Participant Cost Test (PCT)
Societal Cost Test (SCT)
DSMore took hourly energy prices and hourly energy savings from specific measures installed through
the Lighting Program and correlated prices and savings to 30 years of historic weather data. Using long-
term weather ensured the model captured and appropriately valued low probability but high
consequence weather events. Consequently, the model’s produced an accurate evaluation of the
demand-side efficiency measures relative to alternative supply options. In PY15, Ameren Missouri
updated its avoided energy, capacity, and transmission and distribution (T&D) costs to be consistent
with its 2014 Integrated Resource Plan (IRP).
Table 37 presents the key cost-effectiveness analysis assumptions and corresponding source.
Table 37. Assumptions and Source for Cost-Effectiveness Analysis
Assumption Source
Discount Rate = 6.95%
Ameren Missouri 2012 MEEIA Filing
Line Losses = 5.72%
Summer Peak occurred during the 16th hour of a July day, on average
Escalation rates for different costs occurred at the component level, with
separate escalation rates for fuel, capacity, generation, transmission and
distribution, and customer rates carried out over 25 years.
Avoided Energy and Capacity Costs Ameren Missouri 2014 IRP
Avoided Electric T&D = $23.60/kW
In addition, MMP used the Batch Tools (model inputs) that Ameren Missouri used in its original analysis
as input into the ex post DSMore analysis, then modified these solely with new data from the evaluation
(e.g., PY15-specific Lighting participation counts, per-unit gross savings, and NTG), which ensured
consistency.
Particularly, model assumptions were driven by measure load shapes, which indicated when the model
should apply savings during the day. This ensured that the load shape for an end-use matched the
system peak impacts of that end use and provided the correct summer coincident savings. MMP used
20 California Standard Practice Manual: Economic Analysis of Demand-Side Programs and Projects. October 2001.
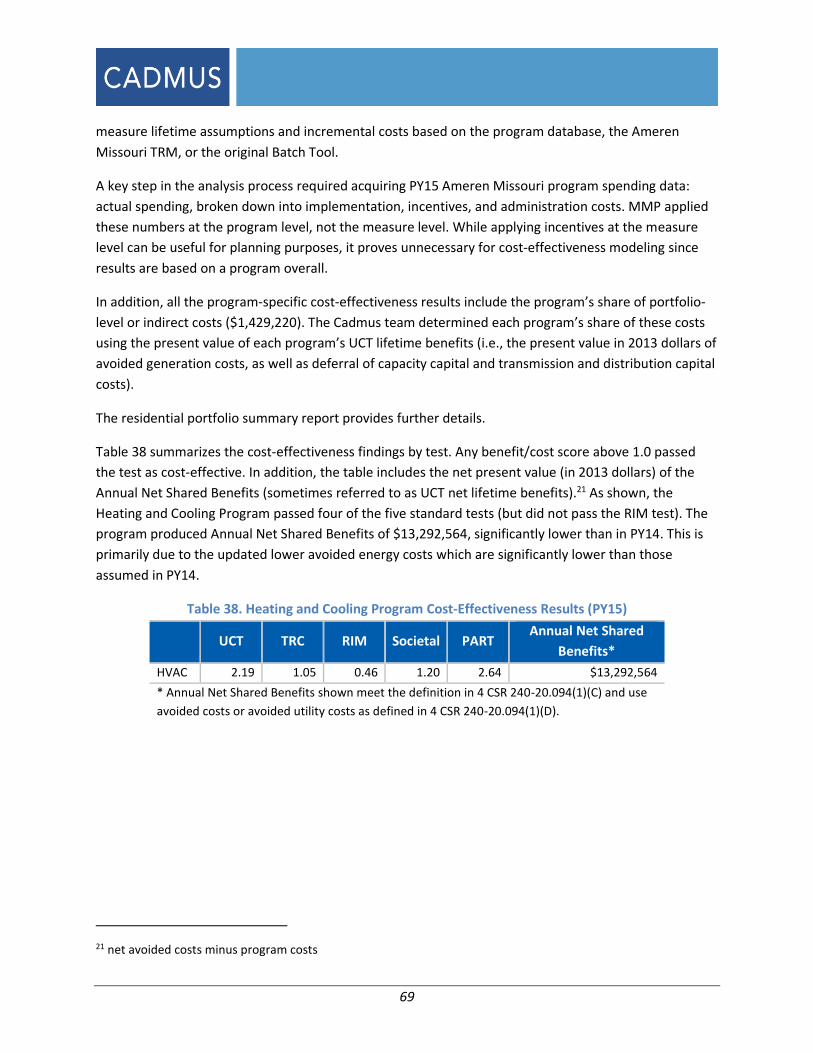
69
measure lifetime assumptions and incremental costs based on the program database, the Ameren
Missouri TRM, or the original Batch Tool.
A key step in the analysis process required acquiring PY15 Ameren Missouri program spending data:
actual spending, broken down into implementation, incentives, and administration costs. MMP applied
these numbers at the program level, not the measure level. While applying incentives at the measure
level can be useful for planning purposes, it proves unnecessary for cost-effectiveness modeling since
results are based on a program overall.
In addition, all the program-specific cost-effectiveness results include the program’s share of portfolio-
level or indirect costs ($1,429,220). The Cadmus team determined each program’s share of these costs
using the present value of each program’s UCT lifetime benefits (i.e., the present value in 2013 dollars of
avoided generation costs, as well as deferral of capacity capital and transmission and distribution capital
costs).
The residential portfolio summary report provides further details.
Table 38 summarizes the cost-effectiveness findings by test. Any benefit/cost score above 1.0 passed
the test as cost-effective. In addition, the table includes the net present value (in 2013 dollars) of the
Annual Net Shared Benefits (sometimes referred to as UCT net lifetime benefits).21 As shown, the
Heating and Cooling Program passed four of the five standard tests (but did not pass the RIM test). The
program produced Annual Net Shared Benefits of $13,292,564, significantly lower than in PY14. This is
primarily due to the updated lower avoided energy costs which are significantly lower than those
assumed in PY14.
Table 38. Heating and Cooling Program Cost-Effectiveness Results (PY15)
UCT TRC RIM Societal PART Annual Net Shared
Benefits*
HVAC 2.19 1.05 0.46 1.20 2.64 $13,292,564
* Annual Net Shared Benefits shown meet the definition in 4 CSR 240-20.094(1)(C) and use
avoided costs or avoided utility costs as defined in 4 CSR 240-20.094(1)(D).
21 net avoided costs minus program costs
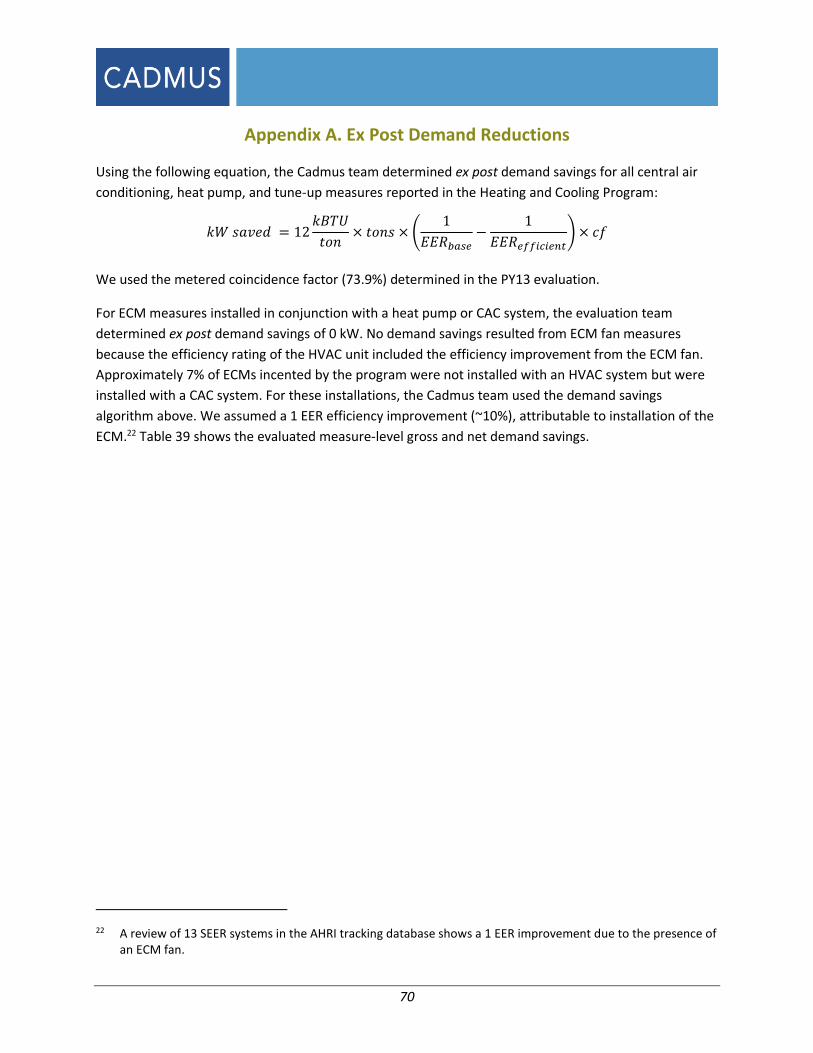
70
Appendix A. Ex Post Demand Reductions
Using the following equation, the Cadmus team determined ex post demand savings for all central air
conditioning, heat pump, and tune-up measures reported in the Heating and Cooling Program:
𝑘𝑊 𝑠𝑎𝑣𝑒𝑑 = 12𝑘𝐵𝑇𝑈
𝑡𝑜𝑛× 𝑡𝑜𝑛𝑠 × (
1
𝐸𝐸𝑅𝑏𝑎𝑠𝑒−
1
𝐸𝐸𝑅𝑒𝑓𝑓𝑖𝑐𝑖𝑒𝑛𝑡) × 𝑐𝑓
We used the metered coincidence factor (73.9%) determined in the PY13 evaluation.
For ECM measures installed in conjunction with a heat pump or CAC system, the evaluation team
determined ex post demand savings of 0 kW. No demand savings resulted from ECM fan measures
because the efficiency rating of the HVAC unit included the efficiency improvement from the ECM fan.
Approximately 7% of ECMs incented by the program were not installed with an HVAC system but were
installed with a CAC system. For these installations, the Cadmus team used the demand savings
algorithm above. We assumed a 1 EER efficiency improvement (~10%), attributable to installation of the
ECM.22 Table 39 shows the evaluated measure-level gross and net demand savings.
22 A review of 13 SEER systems in the AHRI tracking database shows a 1 EER improvement due to the presence of an ECM fan.

71
Table 39. PY15 Summary: Demand Savings
Measure PY15
Participation
Per-Unit Ex
Post Savings
(kW/yr)
Total Net
Savings **
(kW/yr)
HPs
Air Source HP (ASHP)—Early Replacement of ASHP* 729 2.045 1,744.4
ASHP—Early Replacement of Electric Furnace* 1005 1.458 1,714.4
ASHP—Replace at failure of ASHP* 406 0.143 68.0
ASHP—Replace at failure of Electric Furnace* 68 0.200 15.9
Dual Fuel HP (DFHP)* 102 0.262 31.2
Ground Source HP (GSHP) 330 2.514 954.5
CACs
CAC—Early Replacement* 9,619 2.095 21,967.5
CAC—Replace on Burnout* 300 0.227 74.1
Tune-ups
HVAC Systems Receiving Condenser Cleaning 9,250 0.208 1,590.7
HVAC Systems Receiving Refrigerant Charge
Adjustment
1,028 0.721 611.6
HVAC Systems Receiving Evaporator Cleaning 359 0.103 30.5
HVAC Systems Receiving General Maintenance 196 0.103 16.7
ECM
ECM Auto Mode, Early Replacement 8,234 0.013 119.6
ECM Auto Mode, Replace at failure 376 0.028 11.5
ECM Continuous Mode 400 0.002 0.8
Thermostats
Thermostat Installed with Setback Programmed
(Discontinued in PY14)
5 0.1 0.1
Total 32,407 n/a 28,951
*Combined incentive tiers (SEER 14, SEER 15, SEER 16).
** Accounts for line losses; total may not add to sum of measure-specific kW due to rounding

72
Appendix B. Stakeholder Interview Guide
Respondent name:
Respondent phone:
Interview date: Interviewer initials:
In PY15 Cadmus will interview both Ameren Missouri and ICF Heating and Cooling Program managers.
The interview will focus on changes to the program design. The interview will also assess the program at
year end and identify recommendations for improving subsequent programs.
Introduction
1. What are your main responsibilities for the Heating and Cooling Program?
2. How is communication, both formal and informal, between ICF and Ameren Missouri
conducted?
3. How does ICF communicate with HVAC contractors?
Program Design and Implementation
4. What would you say is working particularly well this year? Why is that?
5. Conversely, what is not working as well as anticipated? Why is that?
6. What are some of the other program changes from PY14 to PY15? (Incentive changes, drop of
programmable thermostat, other?)
Program Goals
7. What are the program’s participation and savings goals for PY15?
8. Does the program have any process or non-impact goals for PY15? (Probe: increased awareness,
market transformation, spillover measures such as duct sealing or insulation)?
9. In your opinion, how has the program performed in PY15 (in terms of both process and
savings/participation goals)?
10. Why do you think this is?
Contractor Training and Participation
11. ICF offers program training for contractors. Do you believe these trainings are effective? In what
way?
12. The program also offers a technical training for contractors that is not a requirement of program
participation. Do you believe this is effective?
13. Do you believe contractor participation is on track?
14. Have contractors dropped out of the program? Why?

73
15. To what extent do you believe the training, and involvement in the program, is impacting the
region’s standard HVAC diagnostic, sizing, and efficiency practices?
Quality Control
16. In your own words, please explain how the program’s quality control process works.
17. Does Ameren Missouri perform any ride-alongs or independent quality control checks?
Please explain.
Measures
18. In your opinion, should any additional measures be considered for inclusion in future programs?
If so, what measures? Did HVAC contractors regularly request a specific measure not included in
the program? If so, what measure? Did home-owners?
19. Conversely, should any current measures be excluded?
20. How were incentive amounts and changes to incentive amounts determined?
Marketing Efforts
21. What kind of marketing have you done in PY15? How does this compare to previous years?
22. We recognize that marketing methods are designed to work in concert and collectively
encourage participation, but do you feel that any of these strategies have been particularly
effective or ineffective so far?
23. Do you have any ideas for improving marketing in the future?
Customer and Contractor Feedback
24. Are there any recurring or common customer praises or complaints? If so, what are they?
25. How are customers’ problems and questions dealt with?
26. Have you had many customers or contractors dissatisfied with the program? If so, why?
27. Have any contactors elected to drop out of the program or have any contractors mentioned
they do not plan to participate? If so, why?
Summary
28. From your perspective, what are the biggest challenges facing the program in PY5?
29. Is there anything else you’d like us to know about your experience administrating/implementing
the program so far this year?
30. Cadmus main activity this year is to conduct Heating and Cooling Program participant and
participating contractor surveys. Is there anything specific you were hoping to learn from this
continued effort?
31. Is there anything else you’d like us to know?

74
Appendix C. Detailed Engineering Calculations and Explanations
Early Replacement Baseline Efficiency The Heating and Cooling Program tracking database includes SEER ratings of the replaced unit for new
HVAC installation early replacement measures. It also includes the estimated age of the unit replaced.
Following our savings methodology, which calculates savings from meter data for every metered
interval, we required a function that estimated EER at variable outdoor temperatures. Manufacturer
data does not reflect actual performance of an existing, older unit; so the team developed a new SEER
estimate to calculate early replacement savings. A baseline EER versus a temperature curve was
developed from the PY10 metering study, which metered actual EER versus outdoor temperatures of 25
existing units. Figure 12 shows two examples of manufacturer’s curves and another example of an
average SEER 8 curve from PY10 meter data. The EER of the HVAC systems metered in PY10 is plotted
versus outdoor temperatures. The resulting curve is more linear than the EER versus temperature curves
of high-efficiency systems.
Figure 12. Efficiency Curve Examples
Cadmus averaged contractor-reported SEER values to establish an early replacement average SEER
baseline.
We reviewed SEER values reported by contractors to ensure we used nameplate SEER ratings in all
cases; so we could then determine and apply a degradation factor uniformly to nameplate SEER values.
We believed some reported SEER values were estimates, which included an assumed degradation;
others were guesses or were simply erroneous. We used the following rationale to adjust reported SEER
ratings:
In 1992, the minimum-required SEER rating was set to 10. Therefore, the nameplate SEER rating
of units sold from 1992 to 2006 should be no lower than 10. If a value in this range was less than
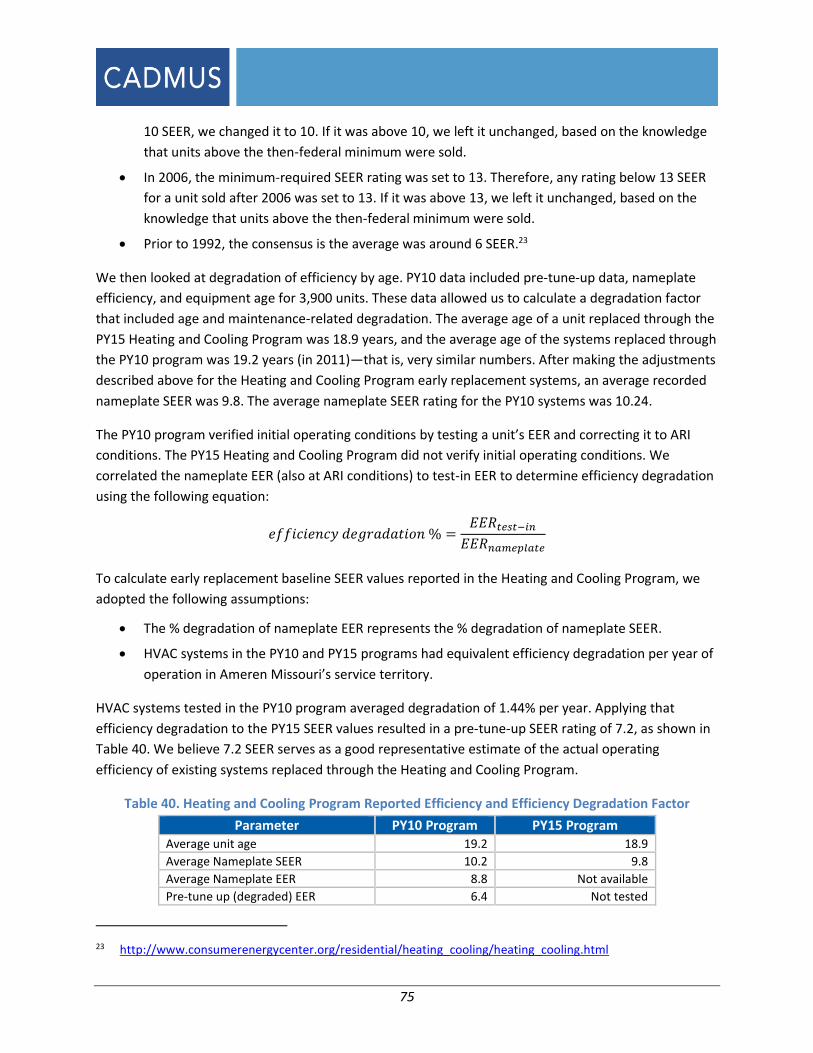
75
10 SEER, we changed it to 10. If it was above 10, we left it unchanged, based on the knowledge
that units above the then-federal minimum were sold.
In 2006, the minimum-required SEER rating was set to 13. Therefore, any rating below 13 SEER
for a unit sold after 2006 was set to 13. If it was above 13, we left it unchanged, based on the
knowledge that units above the then-federal minimum were sold.
Prior to 1992, the consensus is the average was around 6 SEER.23
We then looked at degradation of efficiency by age. PY10 data included pre-tune-up data, nameplate
efficiency, and equipment age for 3,900 units. These data allowed us to calculate a degradation factor
that included age and maintenance-related degradation. The average age of a unit replaced through the
PY15 Heating and Cooling Program was 18.9 years, and the average age of the systems replaced through
the PY10 program was 19.2 years (in 2011)—that is, very similar numbers. After making the adjustments
described above for the Heating and Cooling Program early replacement systems, an average recorded
nameplate SEER was 9.8. The average nameplate SEER rating for the PY10 systems was 10.24.
The PY10 program verified initial operating conditions by testing a unit’s EER and correcting it to ARI
conditions. The PY15 Heating and Cooling Program did not verify initial operating conditions. We
correlated the nameplate EER (also at ARI conditions) to test-in EER to determine efficiency degradation
using the following equation:
𝑒𝑓𝑓𝑖𝑐𝑖𝑒𝑛𝑐𝑦 𝑑𝑒𝑔𝑟𝑎𝑑𝑎𝑡𝑖𝑜𝑛 % =𝐸𝐸𝑅𝑡𝑒𝑠𝑡−𝑖𝑛
𝐸𝐸𝑅𝑛𝑎𝑚𝑒𝑝𝑙𝑎𝑡𝑒
To calculate early replacement baseline SEER values reported in the Heating and Cooling Program, we
adopted the following assumptions:
The % degradation of nameplate EER represents the % degradation of nameplate SEER.
HVAC systems in the PY10 and PY15 programs had equivalent efficiency degradation per year of
operation in Ameren Missouri’s service territory.
HVAC systems tested in the PY10 program averaged degradation of 1.44% per year. Applying that
efficiency degradation to the PY15 SEER values resulted in a pre-tune-up SEER rating of 7.2, as shown in
Table 40. We believe 7.2 SEER serves as a good representative estimate of the actual operating
efficiency of existing systems replaced through the Heating and Cooling Program.
Table 40. Heating and Cooling Program Reported Efficiency and Efficiency Degradation Factor
Parameter PY10 Program PY15 Program Average unit age 19.2 18.9
Average Nameplate SEER 10.2 9.8
Average Nameplate EER 8.8 Not available
Pre-tune up (degraded) EER 6.4 Not tested
23 http://www.consumerenergycenter.org/residential/heating_cooling/heating_cooling.html

76
Total degradation 27.6% Calculated from PY10 data
Average annual degradation 1.44%` Calculated from PY10 data
Extrapolated baseline operating SEER NA 7.2 SEER

77
Appendix D. Free Ridership Scoring Tables
Ground Source and Air Source Heat Pump Free Ridership Scoring Tables Table 41 illustrates how initial survey responses are translated into whether the response is “yes,” “no,”
or “partially” indicative of free ridership (in parentheses).
Table 41. Raw Survey Responses Translation to Free Ridership Scoring Matrix Terminology
Table 42 shows how the string of responses from Table 41 is then translated into a free ridership score.
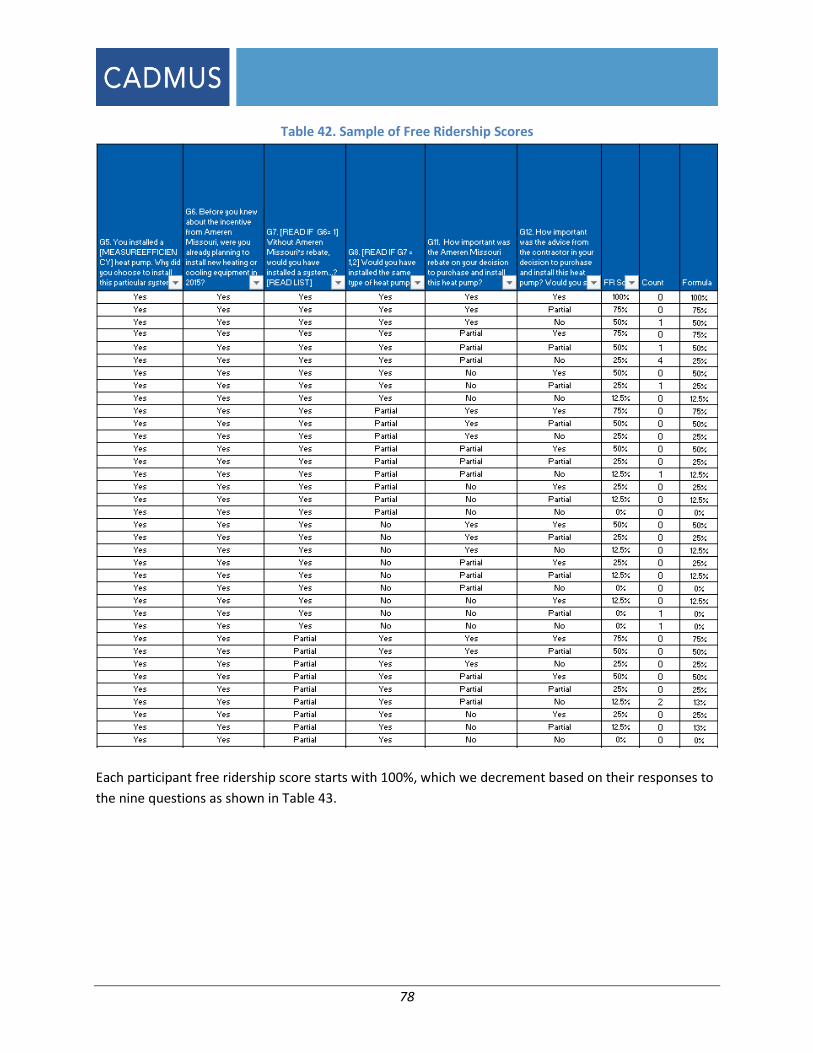
78
Table 42. Sample of Free Ridership Scores
Each participant free ridership score starts with 100%, which we decrement based on their responses to
the nine questions as shown in Table 43.

79
Table 43. Heat Pump Installation Free Ridership Scoring Legend
Q# Decrement
FR1 50% decrement for "No,” 25% decrement for "Partial"
FR2 50% decrement for "No,” 25% decrement for "Partial"
FR3 100% decrement for "No,” 25% decrement for "Partial"
FR4 50% decrement for "No,” 25% decrement for "Partial"
FR5 50% decrement for "No,” 25% decrement for "Partial"
FR6 50% decrement for "No,” 25% decrement for "Partial"
Below, we illustrate the unique response combinations from new heat pump installation applicants
answering the Ameren Missouri Heating and Cooling Program free ridership survey questions (actual
responses mapped to “yes,” “no,” or “partial,” as indicative of free ridership); the free ridership score
assigned to each combination; and the number of responses (see Table 44).
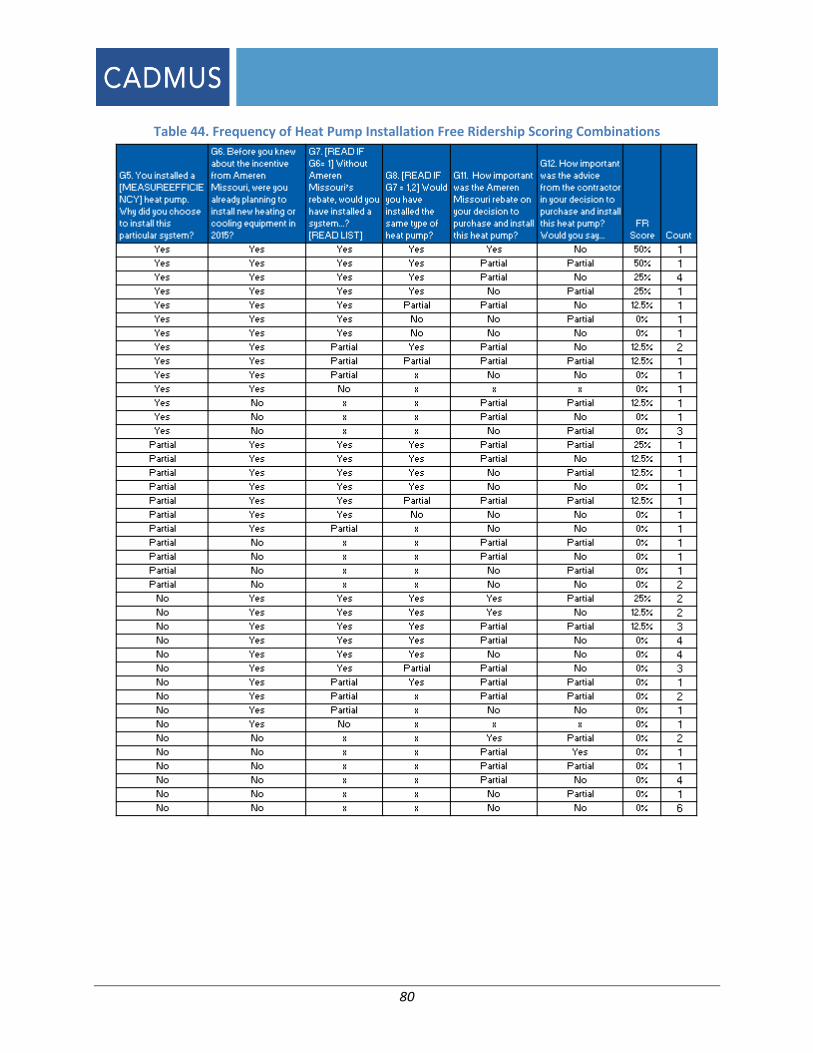
80
Table 44. Frequency of Heat Pump Installation Free Ridership Scoring Combinations
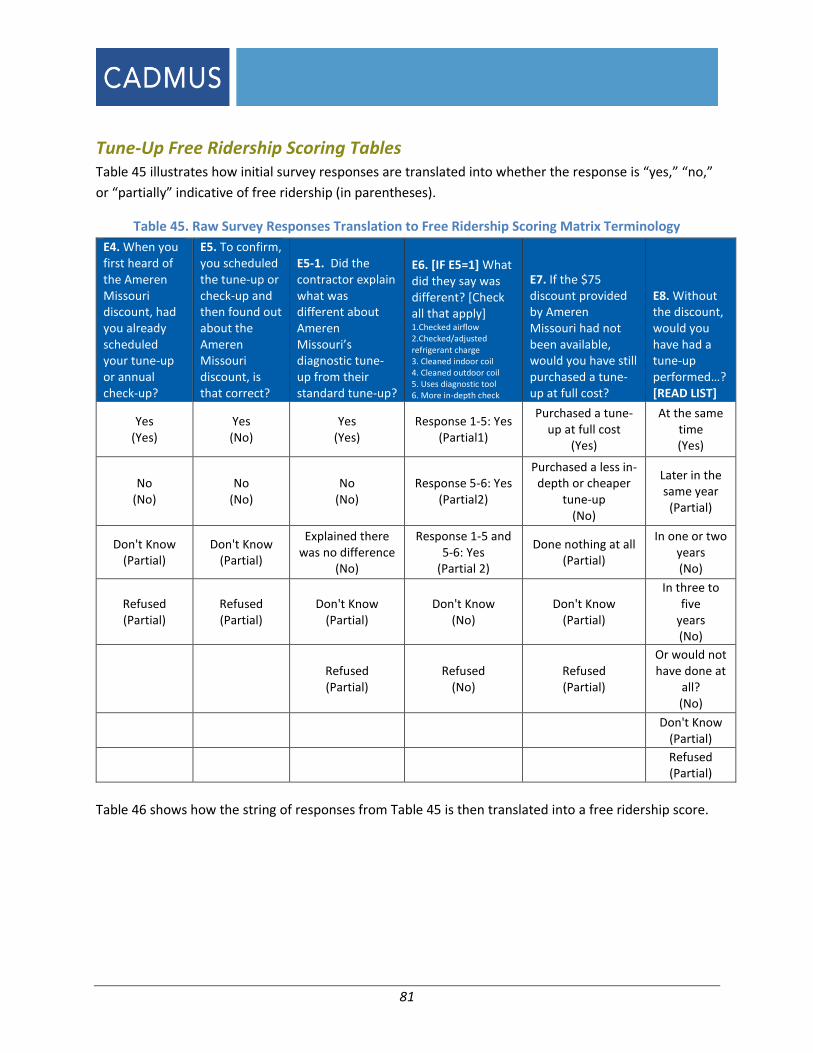
81
Tune-Up Free Ridership Scoring Tables Table 45 illustrates how initial survey responses are translated into whether the response is “yes,” “no,”
or “partially” indicative of free ridership (in parentheses).
Table 45. Raw Survey Responses Translation to Free Ridership Scoring Matrix Terminology
E4. When you first heard of the Ameren Missouri discount, had you already scheduled your tune-up or annual check-up?
E5. To confirm, you scheduled the tune-up or check-up and then found out about the Ameren Missouri discount, is that correct?
E5-1. Did the contractor explain what was different about Ameren Missouri’s diagnostic tune-up from their standard tune-up?
E6. [IF E5=1] What did they say was different? [Check all that apply] 1.Checked airflow 2.Checked/adjusted refrigerant charge 3. Cleaned indoor coil 4. Cleaned outdoor coil 5. Uses diagnostic tool 6. More in-depth check
E7. If the $75 discount provided by Ameren Missouri had not been available, would you have still purchased a tune-up at full cost?
E8. Without the discount, would you have had a tune-up performed…? [READ LIST]
Yes (Yes)
Yes (No)
Yes (Yes)
Response 1-5: Yes (Partial1)
Purchased a tune-up at full cost
(Yes)
At the same time (Yes)
No (No)
No (No)
No (No)
Response 5-6: Yes (Partial2)
Purchased a less in-depth or cheaper
tune-up (No)
Later in the same year
(Partial)
Don't Know (Partial)
Don't Know (Partial)
Explained there was no difference
(No)
Response 1-5 and 5-6: Yes
(Partial 2)
Done nothing at all (Partial)
In one or two years (No)
Refused (Partial)
Refused (Partial)
Don't Know (Partial)
Don't Know (No)
Don't Know (Partial)
In three to five
years (No)
Refused (Partial)
Refused (No)
Refused (Partial)
Or would not have done at
all? (No)
Don't Know
(Partial)
Refused (Partial)
Table 46 shows how the string of responses from Table 45 is then translated into a free ridership score.

82
Table 46. Sample of Tune-Up Free Ridership Scores
Each participant free ridership score starts with 100%, which we decrement based on the participant’s
responses to the nine questions as shown in Table 47.

83
Table 47. Tune-Up Free Ridership Scoring Legend
Q# Decrement
FR1 0% decrement for "No,” Partial level not needed
FR2 0% decrement for "No,” Partial level not needed
FR3 0% decrement for "No,” Partial level not needed
FR4 75% decrement for "Partial 2,” 25% decrement for "Partial1, 0% decrement for "No”
FR5 50% decrement for "No,” 25% decrement for "Partial"
FR6 100% decrement for "No,” 25% decrement for "Partial"
Below, we illustrate the unique response combinations from new HVAC installation applicants
answering the HVAC free ridership survey questions (actual responses mapped to “yes,” “no,” or
“partial,” as indicative of free ridership); the initial free ridership score assigned to each combination;
and the number of responses. The table does not reflect scoring adjustments that were made to
respondents who received a refrigerant charge adjustment or airflow adjustment.
Table 48. Frequency of Tune-Up Free Ridership Scoring Combinations

84
Appendix E. Participant Survey Instruments
The following survey instruments are attached:
Heat Pump PY15 Participant Survey
PY15 HVAC Heat
Pump Participant Survey
Diagnostic Tune-Up PY15 Participant Survey
PY15 HVAC Tune-up
Participant Survey

85
Appendix F. Contractor Interview Guide
The following survey instruments are attached:
HVAC PY15 Contractor Interview Guide
PY 15 HVAC
Contractor Interview Guide