Embed Size (px)
Citation preview
American Academy of Orthopaedic Surgeons
The American Academy of Orthopaedic Surgeons Outcomes Instruments:
Normative Values from the General Population, Norms Base Scoring and Original Standard Raw Scores
© 2000 AMERICAN ACADEMY OF ORTHOPAEDIC SURGEONS ® 2
AAOS Board of Directors 1999-2000
President S. Terry Canale, MD First Vice President Richard H. Gelberman, MD Second Vice President Vernon T. Tolo, MD Secretary William J. Robb, III, MD Treasurer Andrew J. Weiland, MD First Past President Robert D. D'Ambrosia, MD Second Past President James D. Heckman, MD Chair, Board of Councilors John R. Tongue, MD
Chair-Elect, Board of Councilors David A. Halsey, MD Secretary, Board of Councilors Lowry Jones, Jr., MD Chair, (COMSS) Richard B. Welch, MD Chair-Elect, (COMSS) Gary E. Friedlaender, MD Members-at-Large Joseph P. Iannotti, MD Ramon L. Jimenez, MD Darren L. Johnson, MD Thomas P. Sculco, MD (Ex-Officio) William W. Tipton, MD Executive Vice President
©2000 American Academy of Orthopaedic Surgeons® All rights reserved. No portion of this report may be reproduced without the expressed written consent of the American Academy of Orthopaedic Surgeons®.
© 2000 AMERICAN ACADEMY OF ORTHOPAEDIC SURGEONS ® 3
Table of contents: CHAPTER ONE: THE NORMATIVE DATA STUDY .................................................................................... 7
INTRODUCTION........................................................................................................................................................ 8 METHODS AND MATERIALS ................................................................................................................................... 9
Sample Design: .................................................................................................................................................10 Data Analyses: ..................................................................................................................................................11
COMORBIDITY CHECKLIST SCORING:..................................................................................................................12 RELIABILITY AND VALIDITY ANALYSES: ............................................................................................................13 RESULTS.................................................................................................................................................................14
Response Rates: ................................................................................................................................................14 Reliability and Validity Tests............................................................................................................................15
Alpha Reliability and Item-to-Scale Pearson’s Product-Moment Correlation Coefficients:....................15 Item Discriminant Validity Tests:................................................................................................................16
SCALE SCORING ....................................................................................................................................................17 CHAPTER TWO: DASH (DISABILITIES OF THE ARM, SHOULDER, & HAND)..............................19
DASH (DISABILITIES OF THE ARM, SHOULDER, & HAND) ...............................................................................20 DASH: Overall Normative and AAOS Raw Scores ........................................................................................20 Normative Scores by Demographic Markers ..................................................................................................21
Gender...........................................................................................................................................................21 Age ................................................................................................................................................................22 Ethnicity........................................................................................................................................................23 Comorbidity..................................................................................................................................................24
CHAPER THREE: SFMA (SHORT FORM MUSCULOSKELETAL FUNCTION ASSESSMENT) ..27 SFMA (SHORT FORM MUSCULOSKELETAL FUNCTION ASSESSMENT).............................................................28
SFMA: Overall Normative and AAOS Scores.................................................................................................28 AAOS Raw Scores.............................................................................................................................................28 Normative Scores by Demographic Markers ..................................................................................................29
Gender...........................................................................................................................................................29 Age ................................................................................................................................................................30 Ethnicity........................................................................................................................................................31
CHAPTER FOUR: LUMBAR & CERVICAL SPINE....................................................................................33 LUMBAR & CERVICAL SPINE.......................................................................................................................34 LUMBAR SPINE QUESTIONNAIRE .........................................................................................................................34
Lumbar Spine Overall Normative & AAOS Scores ........................................................................................34 Lumbar Spine Normative Scores by Demographic Markers..........................................................................35
Gender...........................................................................................................................................................35 Age ................................................................................................................................................................35 Ethnicity........................................................................................................................................................36 Comorbidity Conditions...............................................................................................................................37
CERVICAL SPIN QUESTIONNAIRE.........................................................................................................................39 Cervical Spine Overall Normative & AAOS Scores .......................................................................................39 Cervical Spine: Normative Scores by Demographic Markers .......................................................................40
Gender...........................................................................................................................................................40 Age ................................................................................................................................................................41 Ethnicity........................................................................................................................................................42 Comorbidity Conditions...............................................................................................................................43
CHAPTER FIVE: LOWER EXTREMITIES: (FOOT & ANKLE, HIP & KNEE, LOWER LIMB AND SPORTS KNEE ) ..........................................................................................................................................46
FOOT AND ANKLE QUESTIONNAIRE.....................................................................................................................47 Foot and Ankle Overall Normative and AAOS scores....................................................................................47
© 2000 AMERICAN ACADEMY OF ORTHOPAEDIC SURGEONS ® 4
Foot and Ankle: Normative Scores by Demographic Markers ......................................................................48 Gender...........................................................................................................................................................48 Age ................................................................................................................................................................48 Ethnicity........................................................................................................................................................49 Comorbidity Conditions...............................................................................................................................50
HIP AND KNEE QUESTIONNAIRE ..........................................................................................................................53 Hip and Knee: Overall Normative and AAOS Raw Scores............................................................................53 Hip and Knee: Normative Scores by Demographic Markers.........................................................................54
Gender...........................................................................................................................................................54 Age ................................................................................................................................................................54 Ethnicity........................................................................................................................................................55 Comorbidity Conditions...............................................................................................................................56
LOWER EXTREMITY QUESTIONNAIRE .................................................................................................................58 Lower Limb: Overall Normative and AAOS Raw Scores...............................................................................58 Lower Limb: Normative Scores by Demographic Markers............................................................................59
Gender...........................................................................................................................................................59 Age ................................................................................................................................................................60 Ethnicity........................................................................................................................................................61 Comorbidity Conditions...............................................................................................................................62
SPORTS KNEE QUESTIONNAIRE............................................................................................................................64 Sports Knee: Normative and AAOS Raw Scores.............................................................................................64 Sports Knee: Normative Scores by Demographic Markers............................................................................65
Gender...........................................................................................................................................................65 Age ................................................................................................................................................................66 Ethnicity........................................................................................................................................................67
CHAPTER SIX: THE PEDIATRIC MEASURES ...........................................................................................71 PARENT-CHILD, PARENT-ADOLESCENT & ADOLESCENT QUESTIONNAIRES...................................................72 PARENT-CHILD QUESTIONNAIRE .........................................................................................................................72
Parent-Child: Normative and AAOS Raw Scores...........................................................................................72 Parent-Child: Normative Scores by Demographic Markers..........................................................................73
Gender...........................................................................................................................................................73 Ethnicity........................................................................................................................................................73 Comorbidity Conditions...............................................................................................................................74
PARENT-ADOLESCENT QUESTIONNAIRE.............................................................................................................77 Parent-Adolescent: Overall Normative and AAOS Raw Scores ....................................................................77 Parent-Adolescent: Normative Scores by Demographic Markers.................................................................78
Gender...........................................................................................................................................................78 Ethnicity........................................................................................................................................................79 Comorbidity Conditions...............................................................................................................................80
PEDIATRIC ADOLESCENT QUESTIONNAIRE .........................................................................................................82 Adolescent: Overall Normative and AAOS Raw Scores.................................................................................83 Adolescent: Normative Scores by Demographics ...........................................................................................84
Gender...........................................................................................................................................................84 Ethnicity........................................................................................................................................................84 Comorbidity Conditions...............................................................................................................................85
CHAPTER SEVEN: COMORBITY INDEXES................................................................................................89 ADULT AND PEDIATRIC COMORBIDITY SCALES .................................................................................................90 ADULT COMORBIDITY SCALE ..............................................................................................................................90
Adult Comorbidities: Overall Normative and AAOS Raw Scores .................................................................90 Overall Adult Comorbidity Normative and AAOS Raw Scores......................................................................90 Adult Comorbidities: Normative Scores by Demographic Markers ..............................................................91
Gender...........................................................................................................................................................91 Age ................................................................................................................................................................91
© 2000 AMERICAN ACADEMY OF ORTHOPAEDIC SURGEONS ® 5
Ethnicity........................................................................................................................................................92 Comorbidity Conditions...............................................................................................................................94
PEDIATRIC COMORBIDITY SCALE ........................................................................................................................96 Pediatric Comorbidities: Overall Normative and AAOS Raw Scores...........................................................96 Adolescent Comorbidities; Normative Scores by Demographic Markers.....................................................97
Gender...........................................................................................................................................................97 Age ................................................................................................................................................................97 Ethnicity........................................................................................................................................................98 Comorbidity Condition ................................................................................................................................99
APPENDIX A: GENERAL SCORING ISSUES: ORIGINAL AAOS RAW SCALE SCORES ......................................102 Obtaining Original AAOS Raw Scale Scores................................................................................................102
APPENDIX B: SF-36™ 2.0 STANDARD VERSION..............................................................................................103 APPENDIX C: SCORING THE CURRENT HEALTH ASSESSMENT RAW SCALE SCORES:....................................104
Comorbidity Index ..........................................................................................................................................104 Comorbidity Sub-scales..................................................................................................................................104
Sub-scale 1 'Do you have the problem'......................................................................................................104 Sub-scale 2 'Do you receive treatment for it'.............................................................................................104 Sub-scale 3 'Does it limit your activity' .....................................................................................................105
Physical Health and Pain...............................................................................................................................105 Treatment expectations...................................................................................................................................105 Treatment expectations met............................................................................................................................105
APPENDIX D: SCORING THE DASH (DISABILITIES OF THE ARM SHOULDER AND HAND) RAW SCALE SCORES: ...............................................................................................................................................................106
Function/Symptoms Score ..............................................................................................................................106 Sports/Music Optional Module ......................................................................................................................106 Work Optional Module...................................................................................................................................106 Missing items...................................................................................................................................................107
APPENDIX E: SCORING THE SMFA RAW SCALE SCORES:...............................................................................108 Short Form Musculoskeletal Function Assessment (SMFA) Scoring ..........................................................108
I. SCORE VALUES..................................................................................................................................108 II. HANDLING OF MISSING RESPONSES .........................................................................................108 III. CALCULATION OF SCORES..........................................................................................................108
SMFA CATEGORIES, ITEM NUMBERS AND ITEM NAMES..................................................................109 SMFA CATEGORIES, ITEM NUMBERS AND ITEM NAMES..................................................................110
APPENDIX F: SCORING THE SPINE QUESTIONNAIRE RAW SCALE SCORES: ....................................................111 Lumbar Spine and Cervical Spine Scales......................................................................................................111
Neurogenic symptoms................................................................................................................................111 Pain/disability..............................................................................................................................................111 Cervical Spine Myelopathy Scale..............................................................................................................111
APPENDIX G: SCORING THE LOWER EXTREMITY QUESTIONNAIRES RAW SCALE SCORES:..........................112 Lower Limb Questionnaire Scales .................................................................................................................112
Lower Limb Core Scale .............................................................................................................................112 Foot and Ankle Module Scales.......................................................................................................................112
Global Foot and Ankle Scale .....................................................................................................................112 Shoe comfort...............................................................................................................................................113
Hip and Knee Questionnaire Scales ..............................................................................................................114 Hip/Knee Core Scale..................................................................................................................................114 Right Hip Pain Scale ..................................................................................................................................114 Left Hip Pain Scale.....................................................................................................................................115 Right Knee Pain Scale................................................................................................................................115 Left Knee Pain Scale ..................................................................................................................................115
Sports Knee Questionnaire Scales .................................................................................................................115 Lower Limb Core Scale .............................................................................................................................115 Knee giving way on activity ......................................................................................................................116 Knee locking or catching on activity .........................................................................................................116
© 2000 AMERICAN ACADEMY OF ORTHOPAEDIC SURGEONS ® 6
Pre-injury activity limitations due to the knee...........................................................................................116 Current activity limitations due to the knee...............................................................................................117 Pain on activity due to knee .......................................................................................................................117
APPENDIX H: SCORING THE PEDIATRICS OUTCOME DATA COLLECTION QUESTIONNAIRES RAW SCALE SCORES: ...............................................................................................................................................................118
All Pediatrics Questionnaires.........................................................................................................................118 Pediatric Comorbidity Index......................................................................................................................118 Comorbidity Sub-scales .............................................................................................................................118
Parent (Child) Questionnaire.........................................................................................................................119 Upper extremity and physical function......................................................................................................119 Transfers and basic mobility ......................................................................................................................119 Sports and physical function ......................................................................................................................120 Pain/comfort................................................................................................................................................120 Expectations................................................................................................................................................121 Happiness....................................................................................................................................................121 Satisfaction with symptoms .......................................................................................................................121 Global function and symptoms..................................................................................................................121
Parent (Adolescent) Questionnaire................................................................................................................121 Upper extremity and physical function......................................................................................................121 Transfers and basic mobility ......................................................................................................................122 Sports and physical function ......................................................................................................................122 Pain/comfort................................................................................................................................................123 Expectations................................................................................................................................................123 Happiness....................................................................................................................................................123 Satisfaction with symptoms .......................................................................................................................123 Global function and symptoms..................................................................................................................124
Adolescent Questionnaire...............................................................................................................................124 Upper extremity and physical function......................................................................................................124 Transfers and basic mobility ......................................................................................................................124 Sports and physical function ......................................................................................................................125 Pain/comfort................................................................................................................................................125 Expectations................................................................................................................................................126 Happiness....................................................................................................................................................126 Satisfaction with symptoms .......................................................................................................................126 Global function and symptoms..................................................................................................................126
INDEX OF TABLES:...............................................................................................................................................127

© 2000 AMERICAN ACADEMY OF ORTHOPAEDIC SURGEONS ® 7
CHAPTER ONE: THE NORMATIVE DATA STUDY
© 2000 AMERICAN ACADEMY OF ORTHOPAEDIC SURGEONS ® 8
Introduction
Using a panel mail methodology, self-report data were collected from the general non-
institutionalized U.S. population for 11 musculoskeletal measures designed by researchers from the
American Academy of Orthopaedic Surgeons. These data are to serve as comparative normative
scores in clinical and research settings. The overall response rate of 67.5% for all the surveys met
study expectations. For each of the 11 measures, the overall confidence interval of ± 3% set a priori
was exceeded. Using a Multitrait/Multi-item Analysis Program, all of the sub-scales within each of 11
measures exhibited high internal reliability as well as discriminant and convergent validity. Items
within each of the sub-scales contributed roughly equal proportions of information to the total scale
scores.
The American Academy of Orthopaedic Surgeons (AAOS) Outcomes Studies Committee, in
collaboration with the Council of Musculoskeletal Specialty Societies (COMSS) and the Council of
Spine Societies (COSS), has developed and pre-tested eleven functional outcomes assessment
measurement instruments. These AAOS measurement instruments are directed at patient
populations comprised of individuals diagnosed with a specific musculoskeletal disorder or disorders.
The instruments were designed to collect patient-based data for use in clinical practices to assess the
effectiveness of treatment regimens and in musculoskeletal research settings to study the clinical
outcomes of treatment.
Reflecting the desire of medical practitioners for more rigorous verification of the effects of
various interventions and treatments, normative data comparisons have been incorporated into a
variety of treatment outcome studies. Comparing pre- and post- treatment clinical data to normative
data from the general population serving as a reference group allows medical practitioners to assess
whether treated individuals meet established criteria for a specific disorder. In considering the clinical
significance of treatment-outcome studies, Kendall et al. forward two basic questions: (1) is the pre –
post treatment change large enough to be considered significant and (2) can treated individuals be
© 2000 AMERICAN ACADEMY OF ORTHOPAEDIC SURGEONS ® 9
distinguished from “normal individuals”∗ serving as a reference group? Clinical measures address the
first question, while normative comparisons address the other. Specifically, the method of normative
comparison addresses the issue of whether or not patients treated for specific maladies or conditions
have returned to critical normative ranges of functioning on important outcome measures.
The collection of normative data is thus a necessary step in the standardization process for
the AAOS outcome measures. The study was conducted to collect such normative data from the
general non-institutionalized United States population. These data will serve as a national orthopedic
normative outcome database for the series of eleven musculoskeletal functional outcomes
assessment instruments developed through AAOS.
Methods and Materials
The eleven AAOS instruments are designed to assess the degree to which a patient’s
condition(s) affects his or her physical and emotional functioning, self-image, and symptom status.
These measures are self-reporting and cover five general areas of musculoskeletal care: lower
extremity, upper extremity, pediatrics, spine and general musculoskeletal care. For risk assessment
purposes, each of the instruments includes a three-response option comorbidity checklist of 14
conditions or disorders. In addition, 7 of the eleven instruments include the Short-Form-36 (SF-36™)
Health Status questionnaire. The study collected normative data for the lower limb, sports knee, foot
and ankle, hip and knee, upper extremity (DASH), cervical spine, lumbar spine, and general
musculoskeletal function (SMFA) measures. For this study, in addition to the 8 adult surveys, three
different pediatric surveys were administered. These consisted of a pediatric-child survey (completed
by parents with children ages 2-10), and two adolescent surveys (one to be filled out by adolescents
ages 11-18 and one by the parent of that adolescent). Parents who were surveyed were instructed to
respond by proxy about a specified child or adolescent. Adolescents who were surveyed were
* In this context, the operational definition of normal individuals is the random sample of individuals from the general, non-institutionalized U.S. population from whom scale scores are derived.
© 2000 AMERICAN ACADEMY OF ORTHOPAEDIC SURGEONS ® 10
matched to parents receiving proxy surveys and instructed to respond for themselves. As an
inducement to complete the survey, adolescents received $5.00.
Sample Design:
The sampling methodology for this project was designed to garner data representative of the
non-institutionalized, general United States population stratified by the following demographic
markers: gender, comorbid conditions, ethnicity and specific age groups. To meet this requirement, a
panel methodology was selected. The panel, in this instance, is a group of households recruited by
National Family Opinion to be representative of individuals and the families in which they reside for
the general, non-institutionalized United States population. This approach to sampling, using a single-
wave mail questionnaire, was deemed appropriate for a number of reasons.
First, an assumption was made that the information provided by respondents would be valid
and reliable. Each of the musculoskeletal measures required replying individuals to provide
information about their physical, emotional, and social functioning capabilities as well as symptom
status. There were no items included intended to elicit sensitive or highly personal information such
as self-disclosure about alcohol or drug misuse, feelings or beliefs about other people, or attitudes
about controversial social issues. Requiring respondents to reveal this type of information can trigger
a “social desirability effect ”, i.e., the tendency for individuals to respond to personal questions with
answers they believe are socially acceptable. Previous research has found that including items that
ask subjects to disclose information they would not typically discuss in casual conversation not only
reduces response rates dramatically, but also calls into question the validity of the responses
provided. Given that no such items are present in the AAOS measures, an assumption was made
that responses to questions included in these measures would be both candid and truthful.
Second, the size and scope of the study required a cost-efficient and expeditious
methodology. Compared to random samples generated through census tract data or other methods
which typically produce low response rates in the 20%-25% range using a multiple-wave mailing
strategy, panel studies yield response rates of 60% or higher with a single-wave mailing6.
© 2000 AMERICAN ACADEMY OF ORTHOPAEDIC SURGEONS ® 11
Additionally, with the exception of comorbid conditions, the demographic markers required for post-
stratification (age, gender, etc.) were known for the panel before selection. This information, along
with the high response rate associated with panel studies, facilitated sampling and permitted careful
targeting of respondents to increase the likelihood that the margin of error set a priori for each
measure (± 3 points on a 100-point metric) would be met, as well as assuring acceptable sample
representation within strata.
Finally, by monitoring response rates within strata, decisions regarding additional sampling
could be made and executed promptly. This shortened the time required to complete the data
collection phase of the study. Data were collected over a six-week period in the spring of 1999.
As stated previously, the sample frame consisted of a panel of respondents recruited and
maintained by National Family Opinion Research (NFO). NFO’s panel is a reliable panel of over
475,000 households representative of the non-institutionalized United States population.
Respondents are matched to the US Census data on geographical region, market size, age, income
(SES), and household size. The panel is managed to maintain additional demographic information
such as the gender of household members. Panel households are not only balanced
demographically in the four Census Regions and nine Census Divisions, but also in correct
proportion by state within each Division. Households are identified by frequently used geographic
classifications to provide complete sampling and identification flexibility.
Data Analyses:
The first phase of data manipulation involved running frequencies on all data points. This was
done in order to identify the percentages of missing or out-of-range values. All out-of-range values
were assigned to a missing value category. Scoring algorithms and validity tests on all scaled items
required item completion criteria to be met before scoring could be completed. Each of the AAOS
instruments contains items that are scored individually. However, the majority of the questionnaire
items are aggregated into conceptually distinct scales designed to measure patient physical and
mental functioning and symptom status. With the exception of the comorbidities scale (described
© 2000 AMERICAN ACADEMY OF ORTHOPAEDIC SURGEONS ® 12
below) and single-item measures, each scale is composed of the summated mean scores from
related items.
Summative scale scores were calculated only for individuals who answered at least half of
the items comprising a scale (half plus one for scales with an odd number of items). With the
exception of the Hip and Knee “function and limitation scale”, the Foot and Ankle “global foot and
ankle” scale, and the DASH module, items that were not completed by respondents within scales
were computed into the mean score for that scale. For the DASH instrument, if 10% or more of the
items for any scale were missing, that individual’s scale scores were treated as missing values. If less
than 10% of the items were missing, the rest of the items are scored and averaged and that mean
score is imputed to the missing items rounded to the nearest integer and the scale score is then
calculated. Each scale was calibrated to a 100-point metric scored from 0 to 100. The DASH and
SMFA were scored so that 0 represents least disability or best health and 100 the most disability or
worst health. All other scales were scored so that 0 represents the worst health and 100 the best
health. Calibrating scores to this metric allows for direct comparison to SF-36™ scores and is
generally easier to interpret for diverse audiences 22. Tables 1 through 11 present the scoring for
each of the eleven measures, including sample sizes, mean scores and standard deviations.
Comorbidity Checklist Scoring:
The comorbidity check list 20 component of the surveys required respondents to answer
three “yes” or “no” responses for each comorbid condition listed, 1) “Do you have the problem?”, 2)
“Do you receive treatment for it?”, and, 3) “Does it limit your activity?” Each of these responses is
then used to compute a general comorbidity index and three sub-scales composed of scores from
related items. The comorbidity index is calculated as the sum of “yes” responses (x) across all
response options divided by the total number of possible “yes” responses, or comorbidity index =
x/42 x 100. Comorbidity scores are presented in tables 12 and 13 below.
© 2000 AMERICAN ACADEMY OF ORTHOPAEDIC SURGEONS ® 13
Reliability and Validity Analyses:
For this study, multitrait-scaling techniques were used to assess the reliability and
validity of the eleven AAOS measures. The Multitrait Analysis Program (MAP) is a
straightforward methodology for scale analysis . In multitrait scaling, scale items are
evaluated in terms of four scaling criteria: (1) convergent validity expressed in terms of
internal consistency, (2) item discriminant validity, (3) tests for equal item-total correlations
and, (4) equal variance test of scale items.
Multitrait scaling involves examining item frequencies; item and scale descriptive statistics
(e.g., mean, standard deviation, variance); scale internal consistency estimates; item-scale
correlations (corrected for overlap); and correlations among scales. Multitrait scaling goes beyond
traditional tests of internal-consistency primarily because it tests item discrimination across scales.
Thus, items are evaluated with respect to how well they represent a particular construct relative to
other constructs.
In multitrait scaling analysis, related scale items within a measurement instrument are
summated. These summated rating scales are then statistically compared to each other in order to
test assumptions of validity and reliability within the instrument. Questions are grouped into
conceptually related scales based upon the underlying concept that they are theoretically intended to
measure. In order to preserve as much of the sample for analysis as possible, mean replacement of
missing data is performed on a case-by-case basis. If an individual respondent was missing data for
less than half of the items within a given scale, that person’s mean score for the items to which he or
she responded was substituted for all missing data points within the scale. For cases where more
than half of the scale items was missing, the non-missing items were assigned to a missing value
category and thus excluded from the analysis. This mean replacement approach was used solely for
reliability and validity testing.
© 2000 AMERICAN ACADEMY OF ORTHOPAEDIC SURGEONS ® 14
Multitrait scaling analyses were then performed on the eleven survey instruments based
upon three conceptual models in order to assess scale 1) item internal consistency validity, 2) item
discriminant validity and, 3) internal consistency reliability of the AAOS measures.
Results
Response Rates:
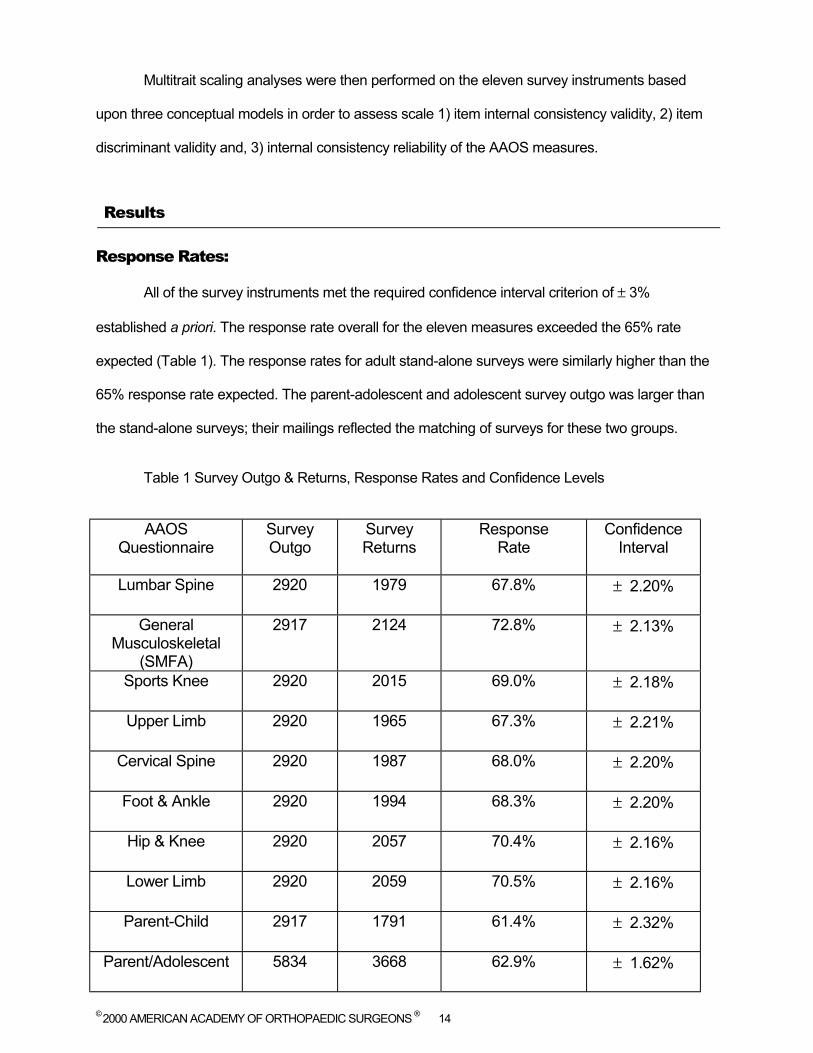
All of the survey instruments met the required confidence interval criterion of ± 3%
established a priori. The response rate overall for the eleven measures exceeded the 65% rate
expected (Table 1). The response rates for adult stand-alone surveys were similarly higher than the
65% response rate expected. The parent-adolescent and adolescent survey outgo was larger than
the stand-alone surveys; their mailings reflected the matching of surveys for these two groups.
Table 1 Survey Outgo & Returns, Response Rates and Confidence Levels
AAOS Questionnaire
Survey Outgo
Survey Returns
Response Rate
Confidence Interval
Lumbar Spine 2920 1979 67.8% ± 2.20%
General Musculoskeletal
(SMFA)
2917 2124 72.8% ± 2.13%
Sports Knee 2920 2015 69.0% ± 2.18%
Upper Limb 2920 1965 67.3% ± 2.21%
Cervical Spine 2920 1987 68.0% ± 2.20%
Foot & Ankle 2920 1994 68.3% ± 2.20%
Hip & Knee 2920 2057 70.4% ± 2.16%
Lower Limb 2920 2059 70.5% ± 2.16%
Parent-Child 2917 1791 61.4% ± 2.32%
Parent/Adolescent 5834 3668 62.9% ± 1.62%
© 2000 AMERICAN ACADEMY OF ORTHOPAEDIC SURGEONS ® 15
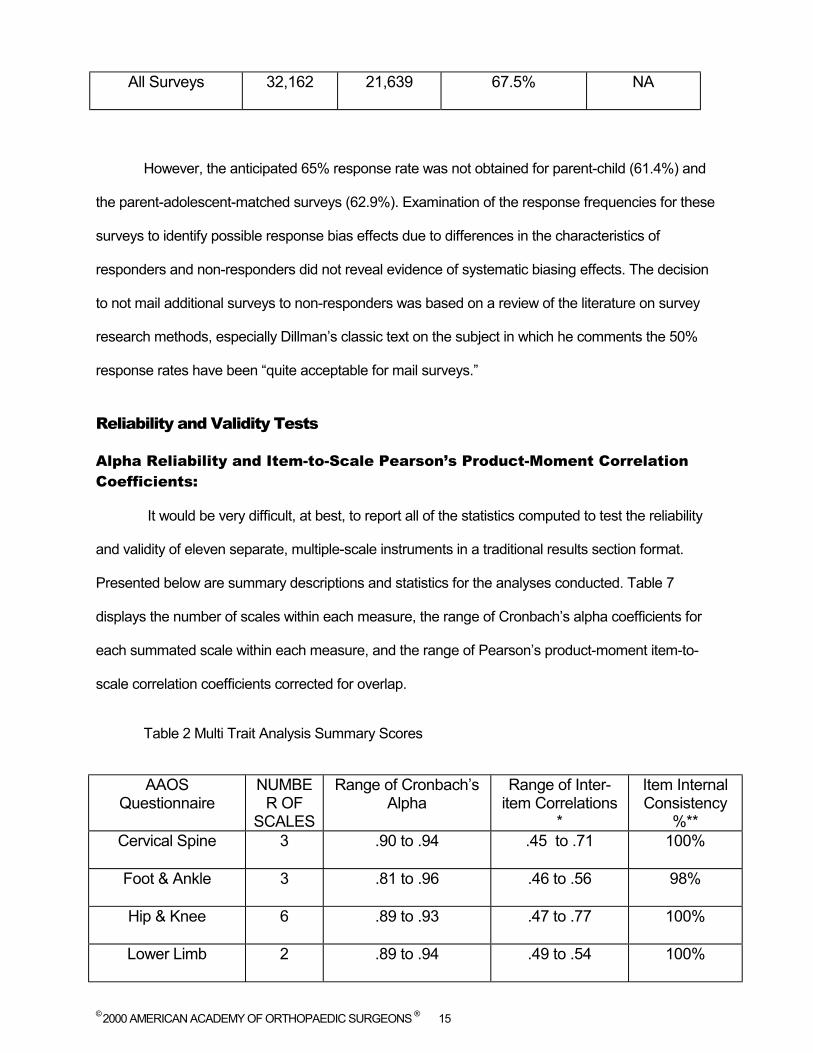
All Surveys 32,162 21,639 67.5% NA
However, the anticipated 65% response rate was not obtained for parent-child (61.4%) and
the parent-adolescent-matched surveys (62.9%). Examination of the response frequencies for these
surveys to identify possible response bias effects due to differences in the characteristics of
responders and non-responders did not reveal evidence of systematic biasing effects. The decision
to not mail additional surveys to non-responders was based on a review of the literature on survey
research methods, especially Dillman’s classic text on the subject in which he comments the 50%
response rates have been “quite acceptable for mail surveys.”
Reliability and Validity Tests
Alpha Reliability and Item-to-Scale Pearson’s Product-Moment Correlation Coefficients:
It would be very difficult, at best, to report all of the statistics computed to test the reliability
and validity of eleven separate, multiple-scale instruments in a traditional results section format.
Presented below are summary descriptions and statistics for the analyses conducted. Table 7
displays the number of scales within each measure, the range of Cronbach’s alpha coefficients for
each summated scale within each measure, and the range of Pearson’s product-moment item-to-
scale correlation coefficients corrected for overlap.
Table 2 Multi Trait Analysis Summary Scores
AAOS Questionnaire
NUMBER OF
SCALES
Range of Cronbach’s Alpha
Range of Inter-item Correlations
*
Item Internal Consistency
%** Cervical Spine 3 .90 to .94 .45 to .71 100%
Foot & Ankle 3 .81 to .96 .46 to .56 98%
Hip & Knee 6 .89 to .93 .47 to .77 100%
Lower Limb 2 .89 to .94 .49 to .54 100%
© 2000 AMERICAN ACADEMY OF ORTHOPAEDIC SURGEONS ® 16
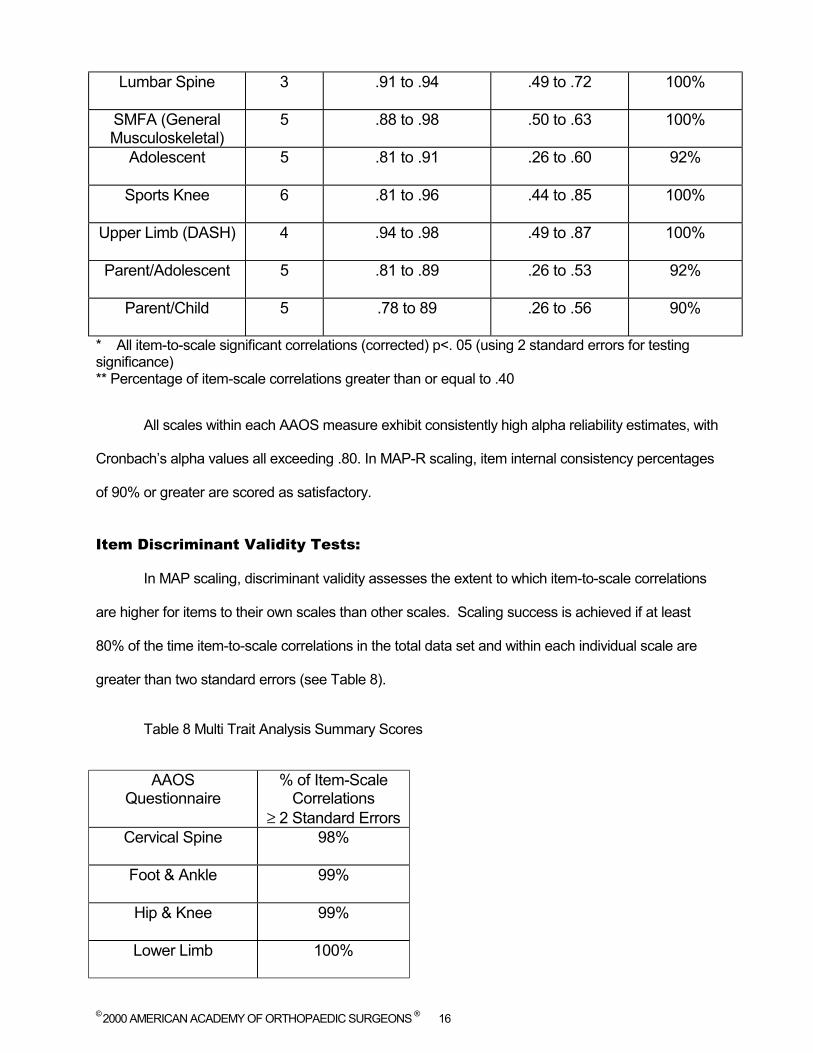
Lumbar Spine 3 .91 to .94 .49 to .72 100%
SMFA (General Musculoskeletal)
5 .88 to .98 .50 to .63 100%
Adolescent 5 .81 to .91 .26 to .60 92%
Sports Knee 6 .81 to .96 .44 to .85 100%
Upper Limb (DASH) 4 .94 to .98 .49 to .87 100%
Parent/Adolescent 5 .81 to .89 .26 to .53 92%
Parent/Child 5 .78 to 89 .26 to .56 90%
* All item-to-scale significant correlations (corrected) p<. 05 (using 2 standard errors for testing significance) ** Percentage of item-scale correlations greater than or equal to .40
All scales within each AAOS measure exhibit consistently high alpha reliability estimates, with
Cronbach’s alpha values all exceeding .80. In MAP-R scaling, item internal consistency percentages
of 90% or greater are scored as satisfactory.
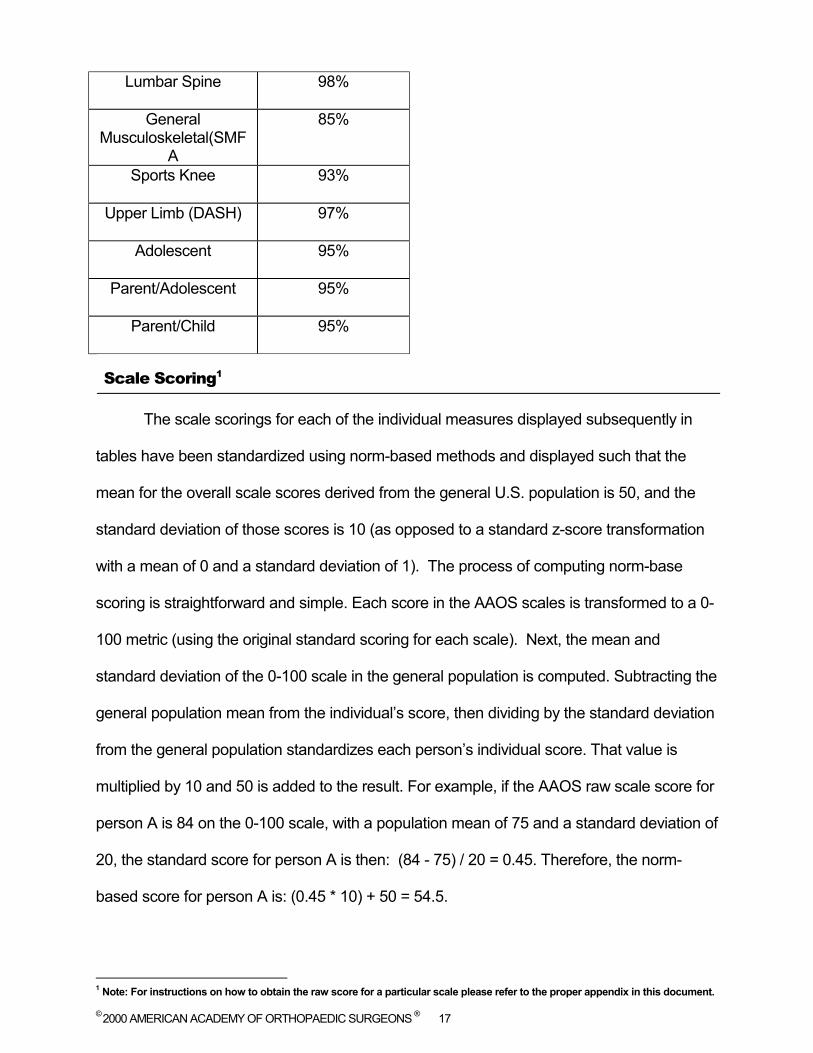
Item Discriminant Validity Tests:
In MAP scaling, discriminant validity assesses the extent to which item-to-scale correlations
are higher for items to their own scales than other scales. Scaling success is achieved if at least
80% of the time item-to-scale correlations in the total data set and within each individual scale are
greater than two standard errors (see Table 8).
Table 8 Multi Trait Analysis Summary Scores
AAOS Questionnaire
% of Item-Scale Correlations
≥ 2 Standard Errors Cervical Spine 98%
Foot & Ankle 99%
Hip & Knee 99%
Lower Limb 100%
© 2000 AMERICAN ACADEMY OF ORTHOPAEDIC SURGEONS ® 17
Lumbar Spine 98%
General Musculoskeletal(SMF
A
85%
Sports Knee 93%
Upper Limb (DASH) 97%
Adolescent 95%
Parent/Adolescent 95%
Parent/Child 95%
Scale Scoring1
The scale scorings for each of the individual measures displayed subsequently in
tables have been standardized using norm-based methods and displayed such that the
mean for the overall scale scores derived from the general U.S. population is 50, and the
standard deviation of those scores is 10 (as opposed to a standard z-score transformation
with a mean of 0 and a standard deviation of 1). The process of computing norm-base
scoring is straightforward and simple. Each score in the AAOS scales is transformed to a 0-
100 metric (using the original standard scoring for each scale). Next, the mean and
standard deviation of the 0-100 scale in the general population is computed. Subtracting the
general population mean from the individual’s score, then dividing by the standard deviation
from the general population standardizes each person’s individual score. That value is
multiplied by 10 and 50 is added to the result. For example, if the AAOS raw scale score for
person A is 84 on the 0-100 scale, with a population mean of 75 and a standard deviation of
20, the standard score for person A is then: (84 - 75) / 20 = 0.45. Therefore, the norm-
based score for person A is: (0.45 * 10) + 50 = 54.5.
1 Note: For instructions on how to obtain the raw score for a particular scale please refer to the proper appendix in this document.

© 2000 AMERICAN ACADEMY OF ORTHOPAEDIC SURGEONS ® 18
This scoring, known as the “50-10” standardization, or norm-based scoring (NBS),
makes it easier to compare scores with the mean for the general U.S. population, as well as account
for deviations from that mean in that a change of one point on a 100-point metric is a change of one-
tenth of a standard deviation. Using NBS, interpretation of results is greatly simplified.
The norm-based scores for the various measures are displayed in separate “chapters” in
table form, with specific measures listed within the general area of musculoskeletal functioning with
which they are associated. The first of the tables within each section contains the norm-based scores
for the general population for each of the scales that comprise that specific measure. Additionally, the
first table in each section also contains the mean score and standard deviation from the AAOS
measures. These values are necessary to compute a patient’s (or a group of patients’) norm-based
score value (see the example discussed above).
Chapter Two focuses on the upper extremity and includes the DASH data. Chapter Three
presents the general musculoskeletal or SMFA results. Chapter Four holds both the lumbar and
cervical spine outcomes. Chapter Five displays the NBS for the lower extremities and includes the
hip and knee, foot and ankle, lower limb, and sports knee measures. Chapter Six exhibits the
population norms for the three pediatric measures; pediatric child, pediatric adolescent and pediatric
adolescent-parent measures. Finally, scores for the general comorbidity index and the three sub-
scale scores from which it is derived are displayed in Chapter Seven for adults and pediatrics. The
comorbidity scores represent the aggregated scores from all measures. Additionally, NBS by gender
(male and female), age categories (19-34, 35-44, 45-54, 55-64, 65-74, and 75 and older), and
ethnicity (white, black, Hispanic, Asian, native American, and other) are presented in additional tables
for each of the measures.
© 2000 AMERICAN ACADEMY OF ORTHOPAEDIC SURGEONS ® 19
CHAPTER TWO: DASH (Disabilities of the Arm, Shoulder, & Hand)
© 2000 AMERICAN ACADEMY OF ORTHOPAEDIC SURGEONS ® 20
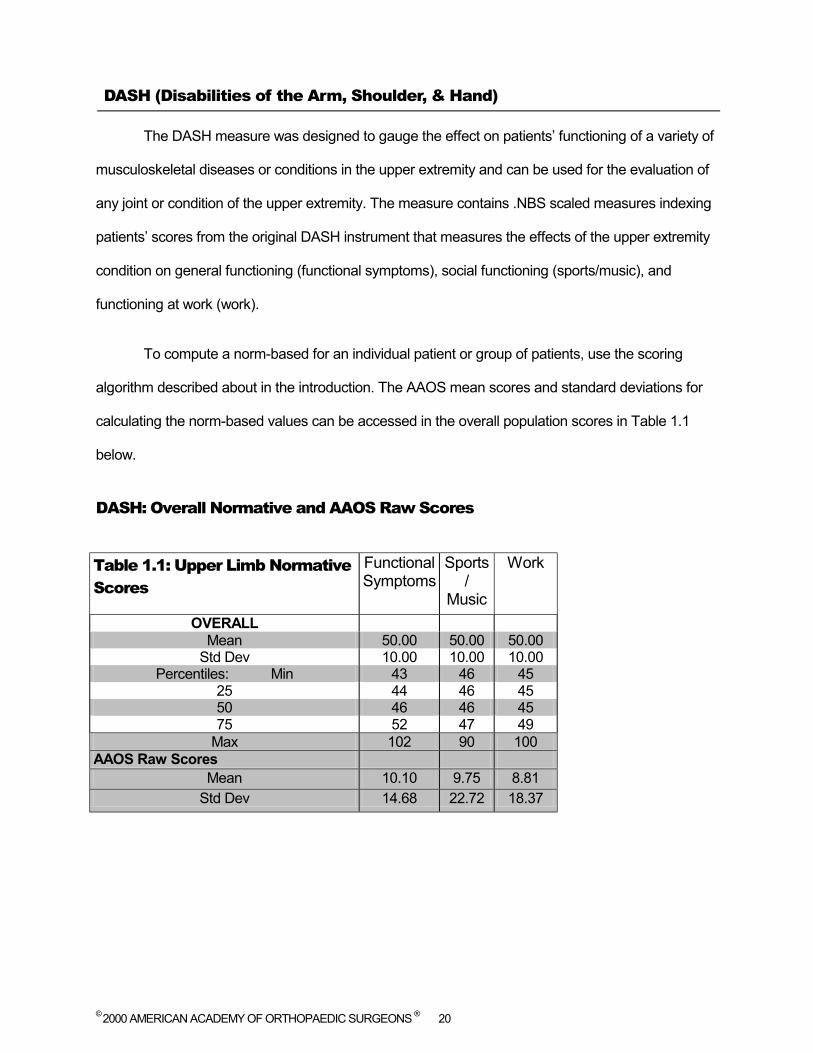
DASH (Disabilities of the Arm, Shoulder, & Hand)
The DASH measure was designed to gauge the effect on patients’ functioning of a variety of
musculoskeletal diseases or conditions in the upper extremity and can be used for the evaluation of
any joint or condition of the upper extremity. The measure contains .NBS scaled measures indexing
patients’ scores from the original DASH instrument that measures the effects of the upper extremity
condition on general functioning (functional symptoms), social functioning (sports/music), and
functioning at work (work).
To compute a norm-based for an individual patient or group of patients, use the scoring
algorithm described about in the introduction. The AAOS mean scores and standard deviations for
calculating the norm-based values can be accessed in the overall population scores in Table 1.1
below.
DASH: Overall Normative and AAOS Raw Scores
Table 1.1: Upper Limb Normative Scores
Functional Symptoms
Sports/
Music
Work
OVERALL Mean 50.00 50.00 50.00
Std Dev 10.00 10.00 10.00 Percentiles: Min 43 46 45
25 44 46 45 50 46 46 45 75 52 47 49
Max 102 90 100 AAOS Raw Scores
Mean 10.10 9.75 8.81 Std Dev 14.68 22.72 18.37
© 2000 AMERICAN ACADEMY OF ORTHOPAEDIC SURGEONS ® 21
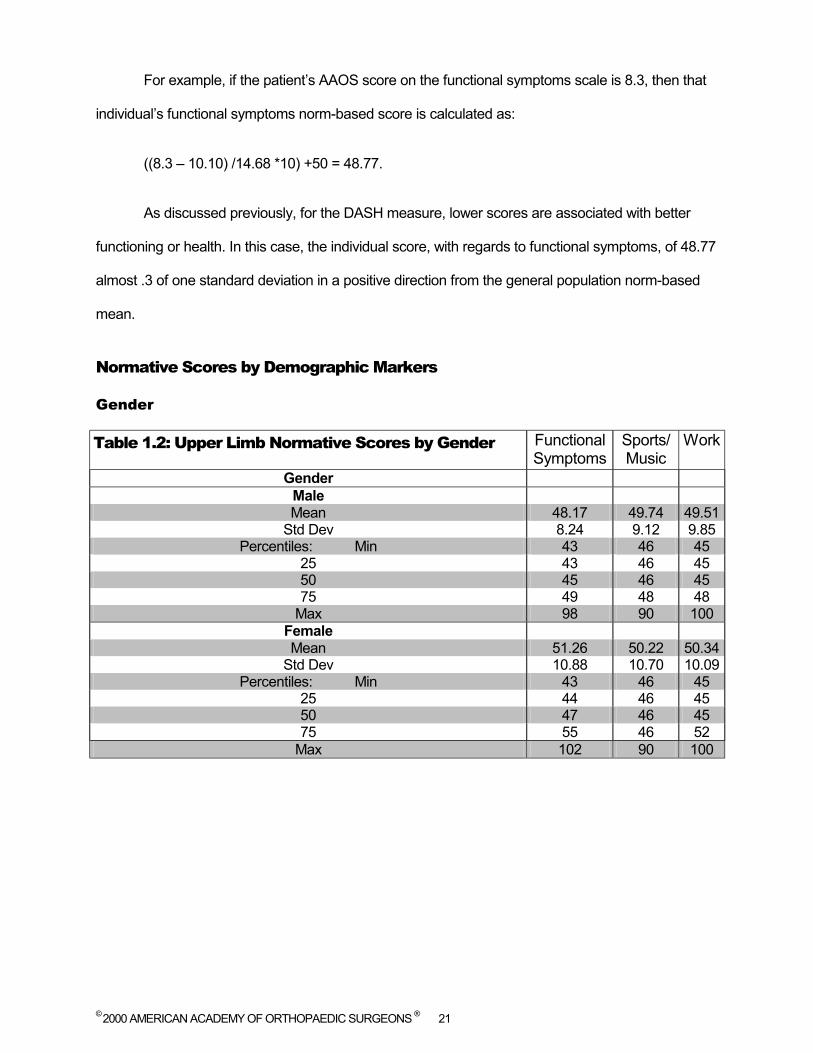
For example, if the patient’s AAOS score on the functional symptoms scale is 8.3, then that
individual’s functional symptoms norm-based score is calculated as:
((8.3 – 10.10) /14.68 *10) +50 = 48.77.
As discussed previously, for the DASH measure, lower scores are associated with better
functioning or health. In this case, the individual score, with regards to functional symptoms, of 48.77
almost .3 of one standard deviation in a positive direction from the general population norm-based
mean.
Normative Scores by Demographic Markers
Gender
Table 1.2: Upper Limb Normative Scores by Gender Functional Symptoms
Sports/ Music
Work
Gender Male Mean 48.17 49.74 49.51
Std Dev 8.24 9.12 9.85 Percentiles: Min 43 46 45
25 43 46 45 50 45 46 45 75 49 48 48
Max 98 90 100 Female Mean 51.26 50.22 50.34
Std Dev 10.88 10.70 10.09 Percentiles: Min 43 46 45
25 44 46 45 50 47 46 45 75 55 46 52
Max 102 90 100

© 2000 AMERICAN ACADEMY OF ORTHOPAEDIC SURGEONS ® 22
Age
Table 1.3: Upper Limb Normative Scores by Age Functional
Symptoms Sports/ Music
Work
Age Group 19-34 Years
Mean 47.13 47.96 47.92 Std Dev 7.69 6.82 7.81
Percentiles: Min 43 46 45 25 43 46 45 50 44 46 45 75 47 46 45
Max 102 90 100 35-44 Years
Mean 47.85 49.07 49.33 Std Dev 7.95 8.43 8.92
Percentiles: Min 43 46 45 25 43 46 45 50 44 46 45 75 49 46 48
Max 98 90 100 45-54 Years
Mean 49.38 49.55 49.40 Std Dev 9.91 9.62 9.65
Percentiles: Min 43 46 45 25 43 46 45 50 45 46 45 75 51 46 48
Max 100 90 100 55-64 Years
Mean 50.98 50.70 51.21 Std Dev 10.13 10.74 11.82
Percentiles: Min 43 46 45 25 44 46 45 50 47 46 45 75 54 51 52
Max 94 90 100 65-74 Years
Mean 52.69 51.63 50.84 Std Dev 10.48 10.97 9.97
Percentiles: Min 43 46 45 25 45 46 45 50 49 46 45 75 57 54 56
Max 98 90 96 75+ Years
Mean 56.72 55.58 54.06 Std Dev 13.05 15.53 12.42
Percentiles: Min 43 46 45 25 47 46 45 50 53 46 48 75 62 57 59
Max 100 90 100
© 2000 AMERICAN ACADEMY OF ORTHOPAEDIC SURGEONS ® 23
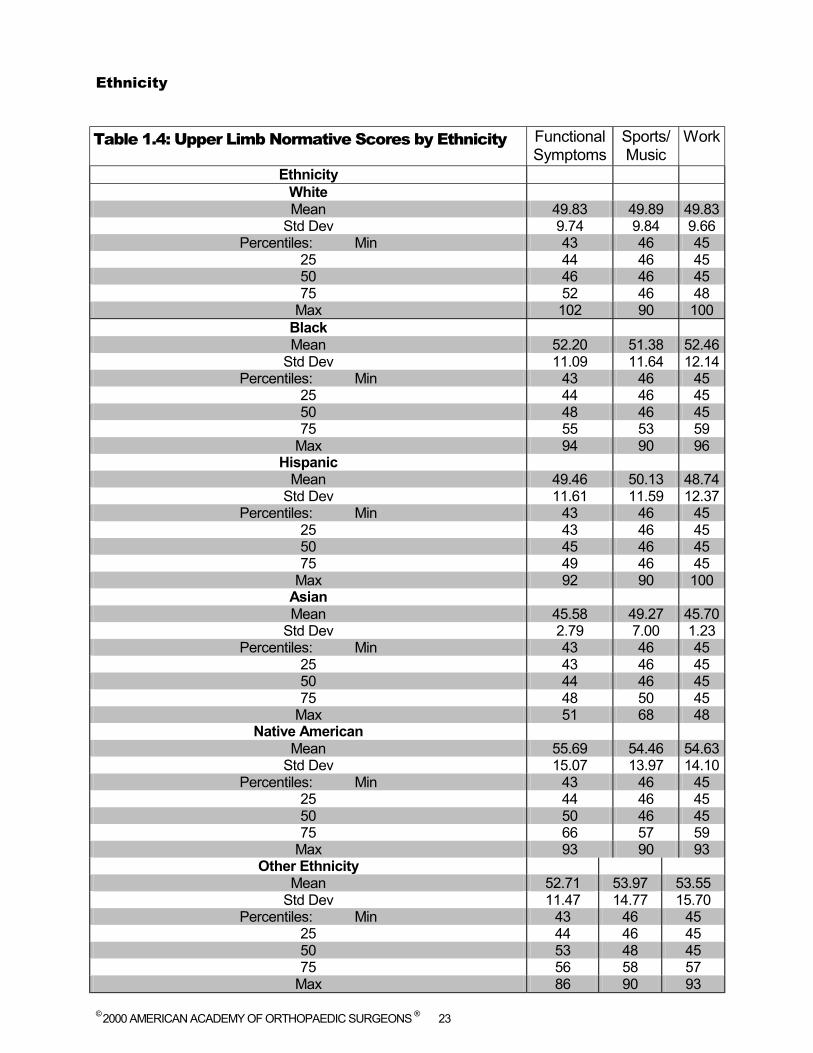
Ethnicity
Table 1.4: Upper Limb Normative Scores by Ethnicity Functional
Symptoms Sports/ Music
Work
Ethnicity White Mean 49.83 49.89 49.83
Std Dev 9.74 9.84 9.66 Percentiles: Min 43 46 45
25 44 46 45 50 46 46 45 75 52 46 48
Max 102 90 100 Black Mean 52.20 51.38 52.46
Std Dev 11.09 11.64 12.14 Percentiles: Min 43 46 45
25 44 46 45 50 48 46 45 75 55 53 59
Max 94 90 96 Hispanic
Mean 49.46 50.13 48.74 Std Dev 11.61 11.59 12.37
Percentiles: Min 43 46 45 25 43 46 45 50 45 46 45 75 49 46 45
Max 92 90 100 Asian Mean 45.58 49.27 45.70
Std Dev 2.79 7.00 1.23 Percentiles: Min 43 46 45
25 43 46 45 50 44 46 45 75 48 50 45
Max 51 68 48 Native American
Mean 55.69 54.46 54.63 Std Dev 15.07 13.97 14.10
Percentiles: Min 43 46 45 25 44 46 45 50 50 46 45 75 66 57 59
Max 93 90 93 Other Ethnicity
Mean 52.71 53.97 53.55 Std Dev 11.47 14.77 15.70
Percentiles: Min 43 46 45 25 44 46 45 50 53 48 45 75 56 58 57
Max 86 90 93

© 2000 AMERICAN ACADEMY OF ORTHOPAEDIC SURGEONS ® 24
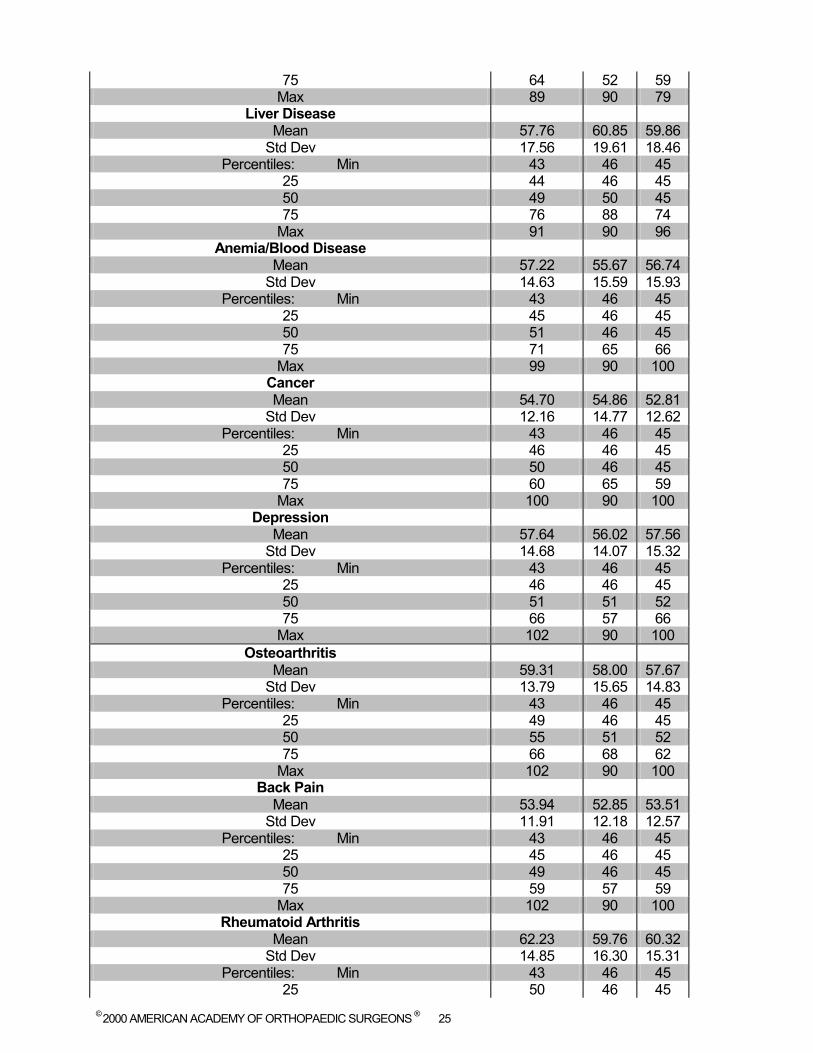
Comorbidity
Table 1.5: Upper Limb Normative Scores by Comorbidity
Functional Symptoms
Sports/
Music
Work
Comorbidity Condition Heart Disease
Mean 56.37 56.26 54.37 Std Dev 12.40 14.51 12.49
Percentiles: Min 43 46 45 25 47 46 45 50 52 46 45 75 63 62 59
Max 100 90 100 High Blood Pressure
Mean 53.72 52.07 52.81 Std Dev 11.85 11.98 11.98
Percentiles: Min 43 46 45 25 45 46 45 50 49 46 45 75 59 54 59
Max 102 90 100 Lung Disease
Mean 58.73 57.42 57.26 Std Dev 13.50 14.73 14.77
Percentiles: Min 43 46 45 25 48 46 45 50 55 51 52 75 64 70 66
Max 98 90 100 Diabetes
Mean 55.72 55.89 54.50 Std Dev 12.27 15.66 12.95
Percentiles: Min 43 46 45 25 47 46 45 50 51 46 48 75 63 62 59
Max 100 90 100 Ulcer/Stomach Disease
Mean 49.75 50.31 49.94 Std Dev 9.89 10.55 10.19
Percentiles: Min 43 46 45 25 43 46 45 50 45 46 45 75 52 48 48
Max 102 90 100 Kidney Disease
Mean 57.12 53.19 54.16 Std Dev 11.78 15.69 10.01
Percentiles: Min 43 46 45 25 47 46 45 50 57 46 54
© 2000 AMERICAN ACADEMY OF ORTHOPAEDIC SURGEONS ® 25
75 64 52 59 Max 89 90 79
Liver Disease Mean 57.76 60.85 59.86
Std Dev 17.56 19.61 18.46 Percentiles: Min 43 46 45
25 44 46 45 50 49 50 45 75 76 88 74
Max 91 90 96 Anemia/Blood Disease
Mean 57.22 55.67 56.74 Std Dev 14.63 15.59 15.93
Percentiles: Min 43 46 45 25 45 46 45 50 51 46 45 75 71 65 66
Max 99 90 100 Cancer Mean 54.70 54.86 52.81
Std Dev 12.16 14.77 12.62 Percentiles: Min 43 46 45
25 46 46 45 50 50 46 45 75 60 65 59
Max 100 90 100 Depression
Mean 57.64 56.02 57.56 Std Dev 14.68 14.07 15.32
Percentiles: Min 43 46 45 25 46 46 45 50 51 51 52 75 66 57 66
Max 102 90 100 Osteoarthritis
Mean 59.31 58.00 57.67 Std Dev 13.79 15.65 14.83
Percentiles: Min 43 46 45 25 49 46 45 50 55 51 52 75 66 68 62
Max 102 90 100 Back Pain
Mean 53.94 52.85 53.51 Std Dev 11.91 12.18 12.57
Percentiles: Min 43 46 45 25 45 46 45 50 49 46 45 75 59 57 59
Max 102 90 100 Rheumatoid Arthritis
Mean 62.23 59.76 60.32 Std Dev 14.85 16.30 15.31
Percentiles: Min 43 46 45 25 50 46 45

© 2000 AMERICAN ACADEMY OF ORTHOPAEDIC SURGEONS ® 26
50 59 57 59 75 72 72 72
Max 102 90 100 Other Medical Problem
Mean 53.93 53.16 53.35 Std Dev 12.84 12.86 12.97
Percentiles: Min 43 46 45 25 45 46 45 50 49 46 45 75 58 57 59
Max 102 90 100
© 2000 AMERICAN ACADEMY OF ORTHOPAEDIC SURGEONS ® 27
CHAPER THREE: SFMA (Short Form Musculoskeletal Function Assessment)
© 2000 AMERICAN ACADEMY OF ORTHOPAEDIC SURGEONS ® 28
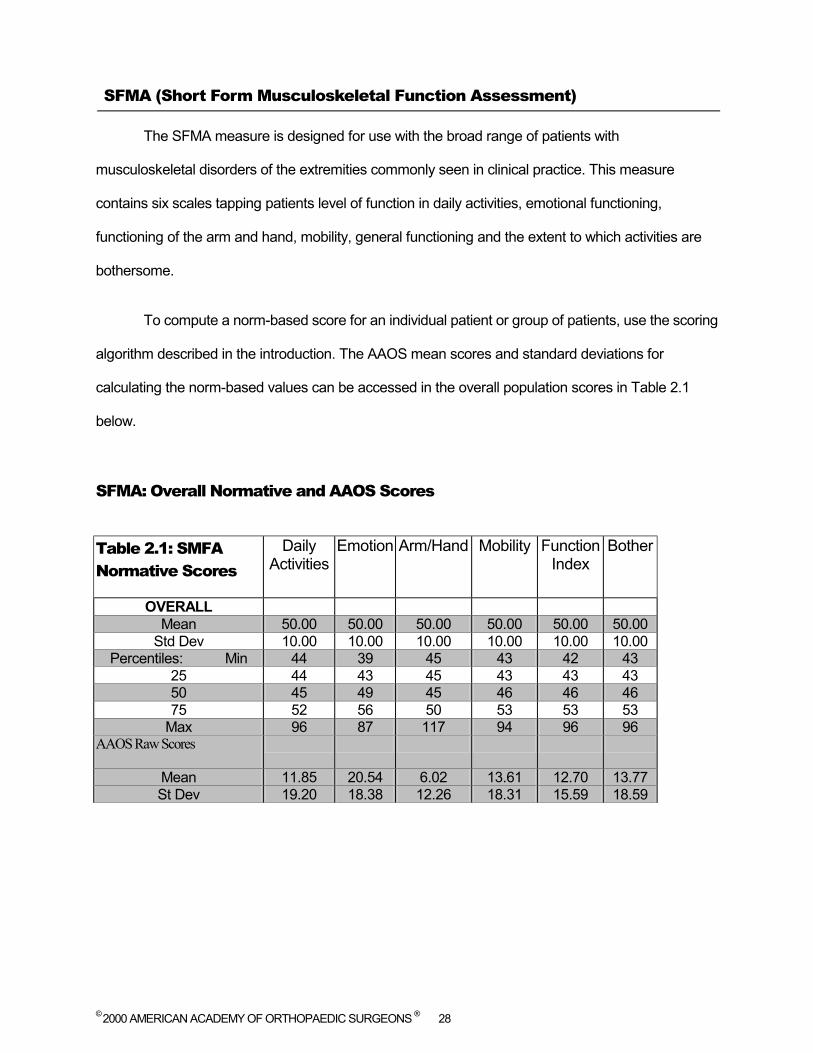
SFMA (Short Form Musculoskeletal Function Assessment)
The SFMA measure is designed for use with the broad range of patients with
musculoskeletal disorders of the extremities commonly seen in clinical practice. This measure
contains six scales tapping patients level of function in daily activities, emotional functioning,
functioning of the arm and hand, mobility, general functioning and the extent to which activities are
bothersome.
To compute a norm-based score for an individual patient or group of patients, use the scoring
algorithm described in the introduction. The AAOS mean scores and standard deviations for
calculating the norm-based values can be accessed in the overall population scores in Table 2.1
below.
SFMA: Overall Normative and AAOS Scores
Table 2.1: SMFA Normative Scores
Daily Activities
Emotion Arm/Hand Mobility Function Index
Bother
OVERALL Mean 50.00 50.00 50.00 50.00 50.00 50.00
Std Dev 10.00 10.00 10.00 10.00 10.00 10.00 Percentiles: Min 44 39 45 43 42 43
25 44 43 45 43 43 43 50 45 49 45 46 46 46 75 52 56 50 53 53 53
Max 96 87 117 94 96 96 AAOS Raw Scores
Mean 11.85 20.54 6.02 13.61 12.70 13.77 St Dev 19.20 18.38 12.26 18.31 15.59 18.59
© 2000 AMERICAN ACADEMY OF ORTHOPAEDIC SURGEONS ® 29
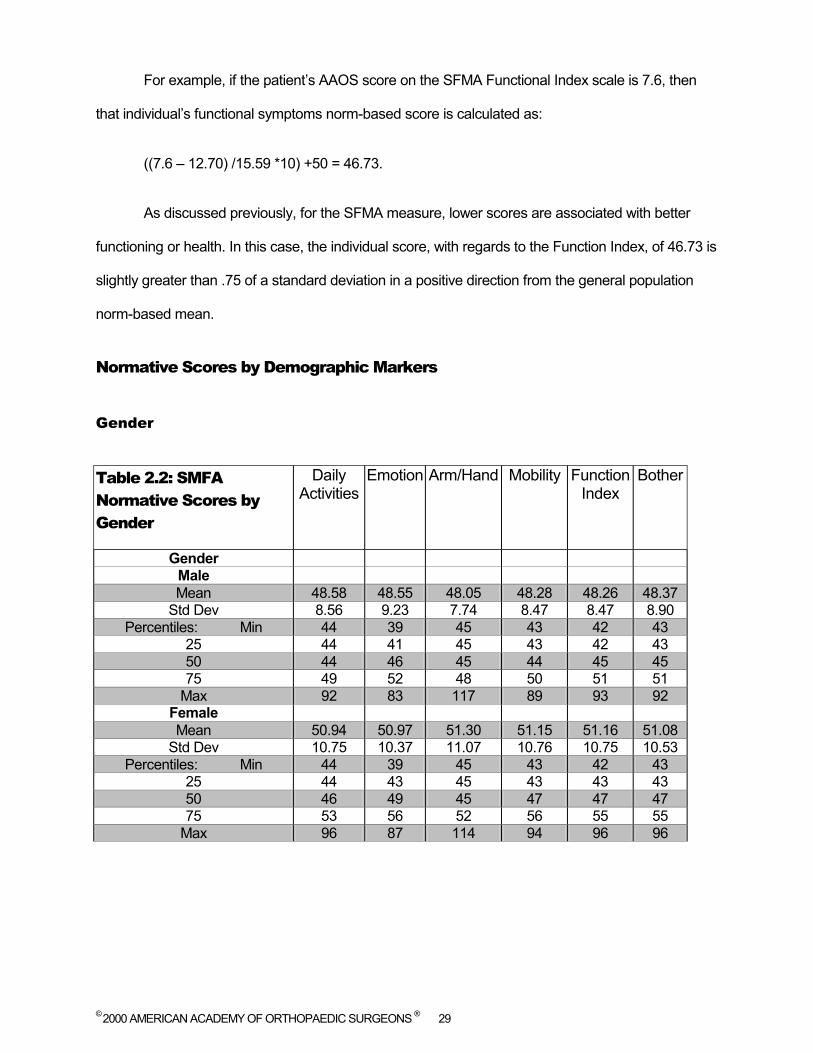
For example, if the patient’s AAOS score on the SFMA Functional Index scale is 7.6, then
that individual’s functional symptoms norm-based score is calculated as:
((7.6 – 12.70) /15.59 *10) +50 = 46.73.
As discussed previously, for the SFMA measure, lower scores are associated with better
functioning or health. In this case, the individual score, with regards to the Function Index, of 46.73 is
slightly greater than .75 of a standard deviation in a positive direction from the general population
norm-based mean.
Normative Scores by Demographic Markers
Gender
Table 2.2: SMFA Normative Scores by Gender
Daily Activities
Emotion Arm/Hand Mobility Function Index
Bother
Gender Male Mean 48.58 48.55 48.05 48.28 48.26 48.37
Std Dev 8.56 9.23 7.74 8.47 8.47 8.90 Percentiles: Min 44 39 45 43 42 43
25 44 41 45 43 42 43 50 44 46 45 44 45 45 75 49 52 48 50 51 51
Max 92 83 117 89 93 92 Female Mean 50.94 50.97 51.30 51.15 51.16 51.08
Std Dev 10.75 10.37 11.07 10.76 10.75 10.53 Percentiles: Min 44 39 45 43 42 43
25 44 43 45 43 43 43 50 46 49 45 47 47 47 75 53 56 52 56 55 55
Max 96 87 114 94 96 96
© 2000 AMERICAN ACADEMY OF ORTHOPAEDIC SURGEONS ® 30
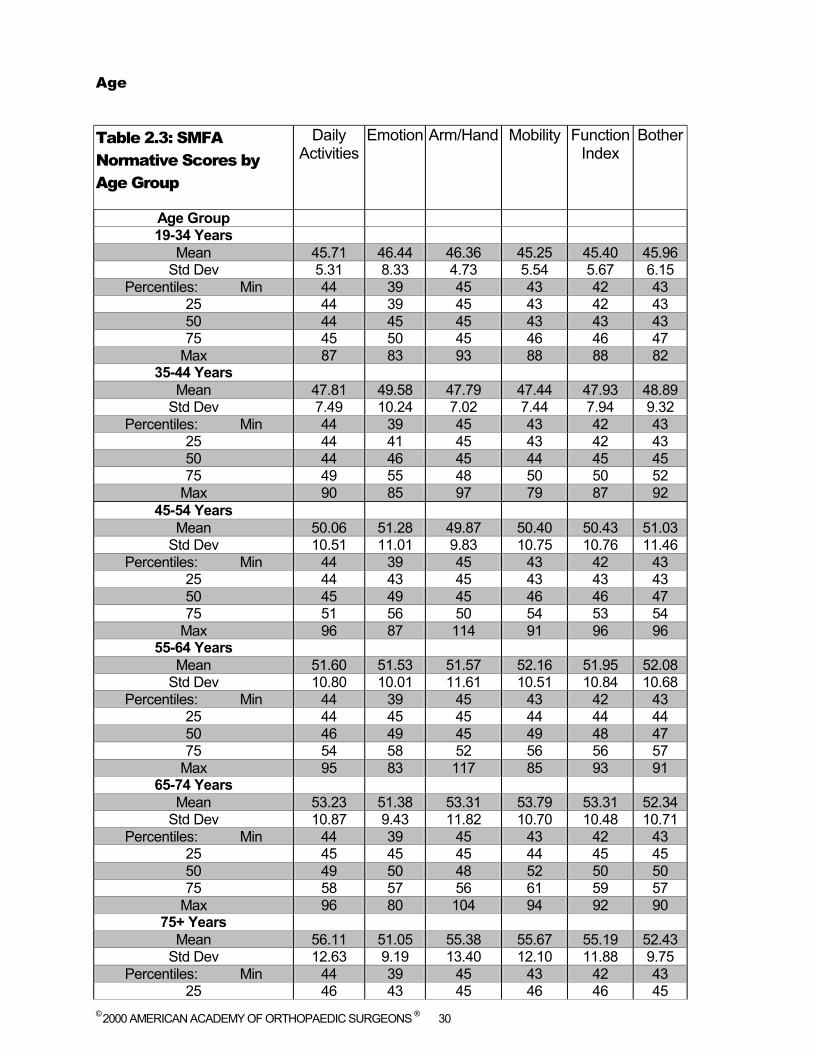
Age
Table 2.3: SMFA Normative Scores by Age Group
Daily Activities
Emotion Arm/Hand Mobility Function Index
Bother
Age Group 19-34 Years
Mean 45.71 46.44 46.36 45.25 45.40 45.96 Std Dev 5.31 8.33 4.73 5.54 5.67 6.15
Percentiles: Min 44 39 45 43 42 43 25 44 39 45 43 42 43 50 44 45 45 43 43 43 75 45 50 45 46 46 47
Max 87 83 93 88 88 82 35-44 Years
Mean 47.81 49.58 47.79 47.44 47.93 48.89 Std Dev 7.49 10.24 7.02 7.44 7.94 9.32
Percentiles: Min 44 39 45 43 42 43 25 44 41 45 43 42 43 50 44 46 45 44 45 45 75 49 55 48 50 50 52
Max 90 85 97 79 87 92 45-54 Years
Mean 50.06 51.28 49.87 50.40 50.43 51.03 Std Dev 10.51 11.01 9.83 10.75 10.76 11.46
Percentiles: Min 44 39 45 43 42 43 25 44 43 45 43 43 43 50 45 49 45 46 46 47 75 51 56 50 54 53 54
Max 96 87 114 91 96 96 55-64 Years
Mean 51.60 51.53 51.57 52.16 51.95 52.08 Std Dev 10.80 10.01 11.61 10.51 10.84 10.68
Percentiles: Min 44 39 45 43 42 43 25 44 45 45 44 44 44 50 46 49 45 49 48 47 75 54 58 52 56 56 57
Max 95 83 117 85 93 91 65-74 Years
Mean 53.23 51.38 53.31 53.79 53.31 52.34 Std Dev 10.87 9.43 11.82 10.70 10.48 10.71
Percentiles: Min 44 39 45 43 42 43 25 45 45 45 44 45 45 50 49 50 48 52 50 50 75 58 57 56 61 59 57
Max 96 80 104 94 92 90 75+ Years
Mean 56.11 51.05 55.38 55.67 55.19 52.43 Std Dev 12.63 9.19 13.40 12.10 11.88 9.75
Percentiles: Min 44 39 45 43 42 43 25 46 43 45 46 46 45
© 2000 AMERICAN ACADEMY OF ORTHOPAEDIC SURGEONS ® 31
50 52 49 50 52 51 50 75 64 56 61 63 62 57
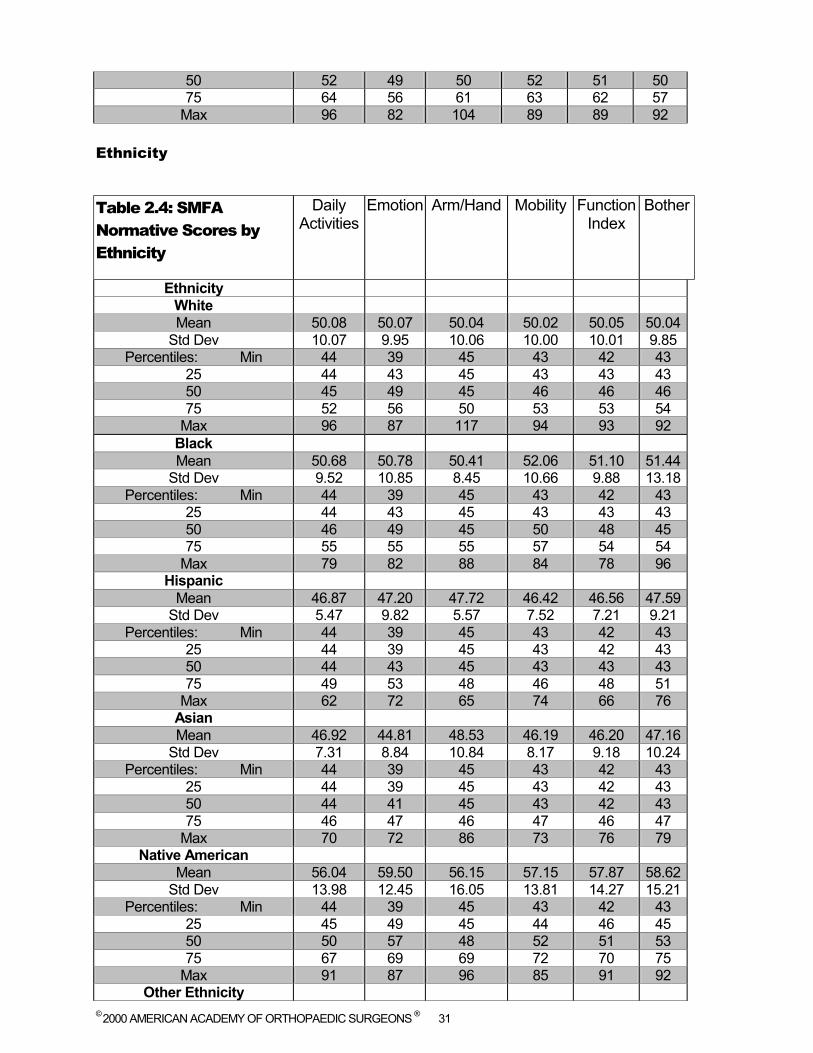
Max 96 82 104 89 89 92 Ethnicity
Table 2.4: SMFA Normative Scores by Ethnicity
Daily Activities
Emotion Arm/Hand Mobility Function Index
Bother
Ethnicity White Mean 50.08 50.07 50.04 50.02 50.05 50.04
Std Dev 10.07 9.95 10.06 10.00 10.01 9.85 Percentiles: Min 44 39 45 43 42 43
25 44 43 45 43 43 43 50 45 49 45 46 46 46 75 52 56 50 53 53 54
Max 96 87 117 94 93 92 Black Mean 50.68 50.78 50.41 52.06 51.10 51.44
Std Dev 9.52 10.85 8.45 10.66 9.88 13.18 Percentiles: Min 44 39 45 43 42 43
25 44 43 45 43 43 43 50 46 49 45 50 48 45 75 55 55 55 57 54 54
Max 79 82 88 84 78 96 Hispanic
Mean 46.87 47.20 47.72 46.42 46.56 47.59 Std Dev 5.47 9.82 5.57 7.52 7.21 9.21
Percentiles: Min 44 39 45 43 42 43 25 44 39 45 43 42 43 50 44 43 45 43 43 43 75 49 53 48 46 48 51
Max 62 72 65 74 66 76 Asian Mean 46.92 44.81 48.53 46.19 46.20 47.16
Std Dev 7.31 8.84 10.84 8.17 9.18 10.24 Percentiles: Min 44 39 45 43 42 43
25 44 39 45 43 42 43 50 44 41 45 43 42 43 75 46 47 46 47 46 47
Max 70 72 86 73 76 79 Native American
Mean 56.04 59.50 56.15 57.15 57.87 58.62 Std Dev 13.98 12.45 16.05 13.81 14.27 15.21
Percentiles: Min 44 39 45 43 42 43 25 45 49 45 44 46 45 50 50 57 48 52 51 53 75 67 69 69 72 70 75
Max 91 87 96 85 91 92 Other Ethnicity
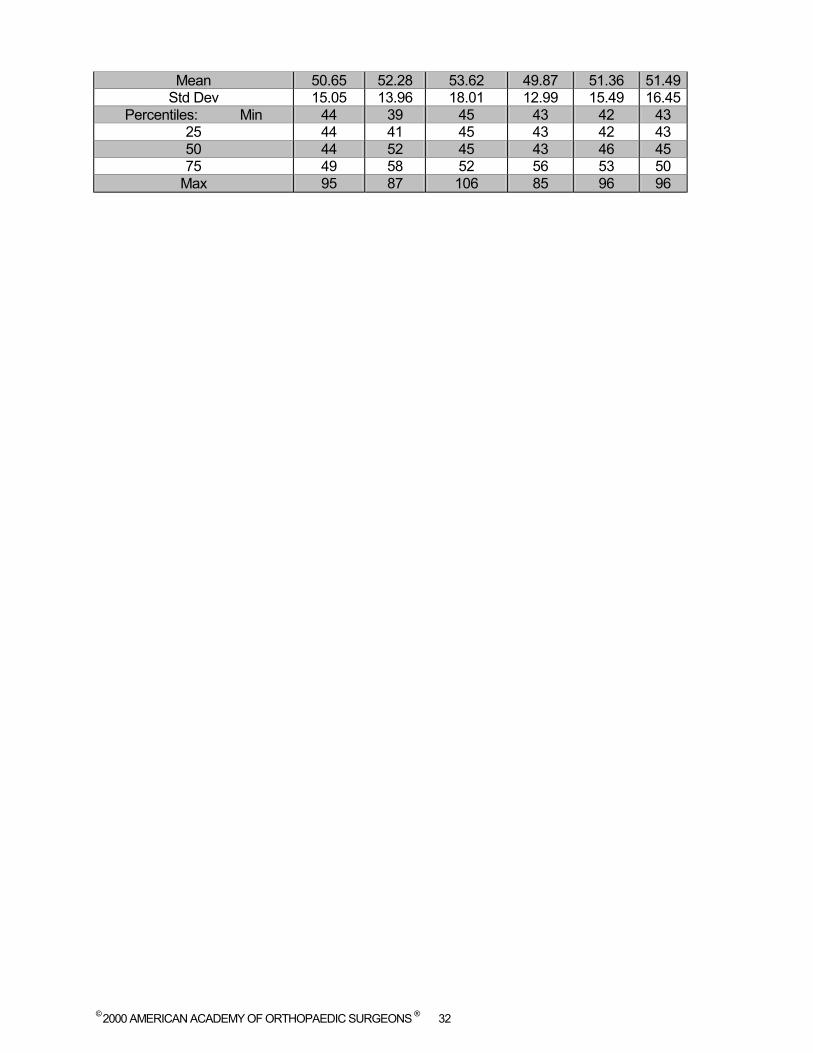
© 2000 AMERICAN ACADEMY OF ORTHOPAEDIC SURGEONS ® 32
Mean 50.65 52.28 53.62 49.87 51.36 51.49 Std Dev 15.05 13.96 18.01 12.99 15.49 16.45
Percentiles: Min 44 39 45 43 42 43 25 44 41 45 43 42 43 50 44 52 45 43 46 45 75 49 58 52 56 53 50
Max 95 87 106 85 96 96
© 2000 AMERICAN ACADEMY OF ORTHOPAEDIC SURGEONS ® 33
CHAPTER FOUR: LUMBAR & CERVICAL SPINE
© 2000 AMERICAN ACADEMY OF ORTHOPAEDIC SURGEONS ® 34
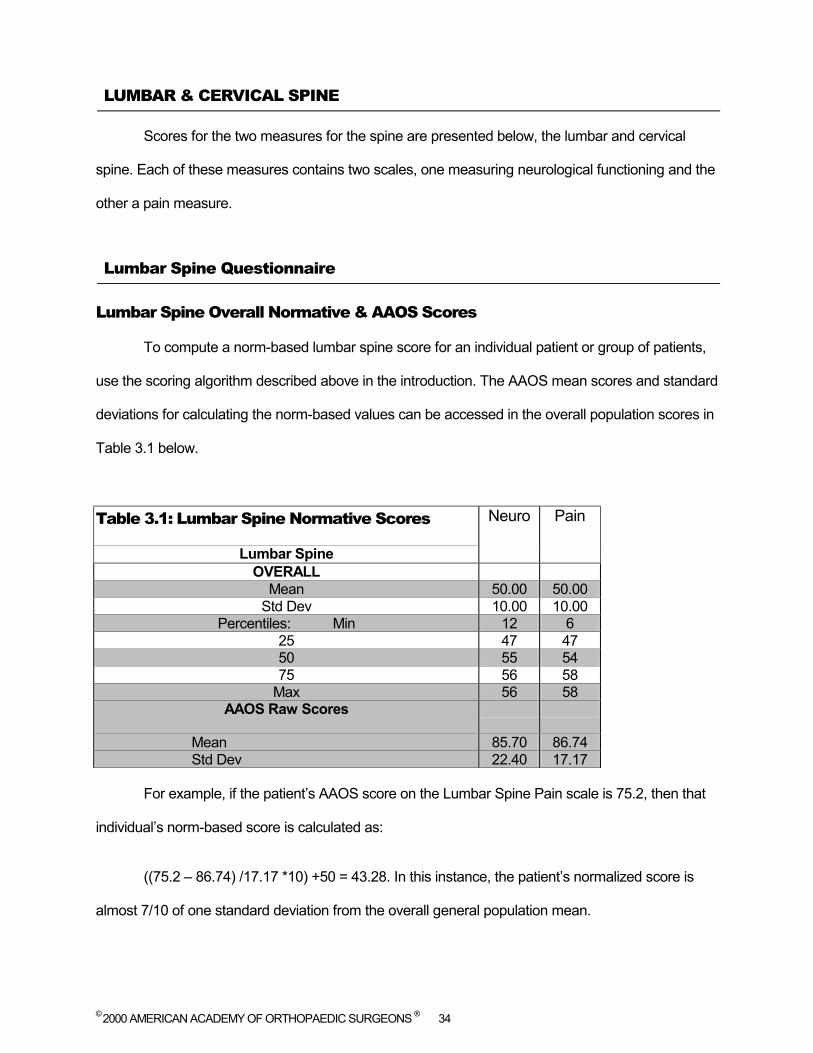
LUMBAR & CERVICAL SPINE
Scores for the two measures for the spine are presented below, the lumbar and cervical
spine. Each of these measures contains two scales, one measuring neurological functioning and the
other a pain measure.
Lumbar Spine Questionnaire
Lumbar Spine Overall Normative & AAOS Scores
To compute a norm-based lumbar spine score for an individual patient or group of patients,
use the scoring algorithm described above in the introduction. The AAOS mean scores and standard
deviations for calculating the norm-based values can be accessed in the overall population scores in
Table 3.1 below.
Table 3.1: Lumbar Spine Normative Scores Neuro Pain
Lumbar Spine OVERALL
Mean 50.00 50.00 Std Dev 10.00 10.00
Percentiles: Min 12 6 25 47 47 50 55 54 75 56 58
Max 56 58 AAOS Raw Scores
Mean 85.70 86.74 Std Dev 22.40 17.17
For example, if the patient’s AAOS score on the Lumbar Spine Pain scale is 75.2, then that
individual’s norm-based score is calculated as:
((75.2 – 86.74) /17.17 *10) +50 = 43.28. In this instance, the patient’s normalized score is
almost 7/10 of one standard deviation from the overall general population mean.
© 2000 AMERICAN ACADEMY OF ORTHOPAEDIC SURGEONS ® 35
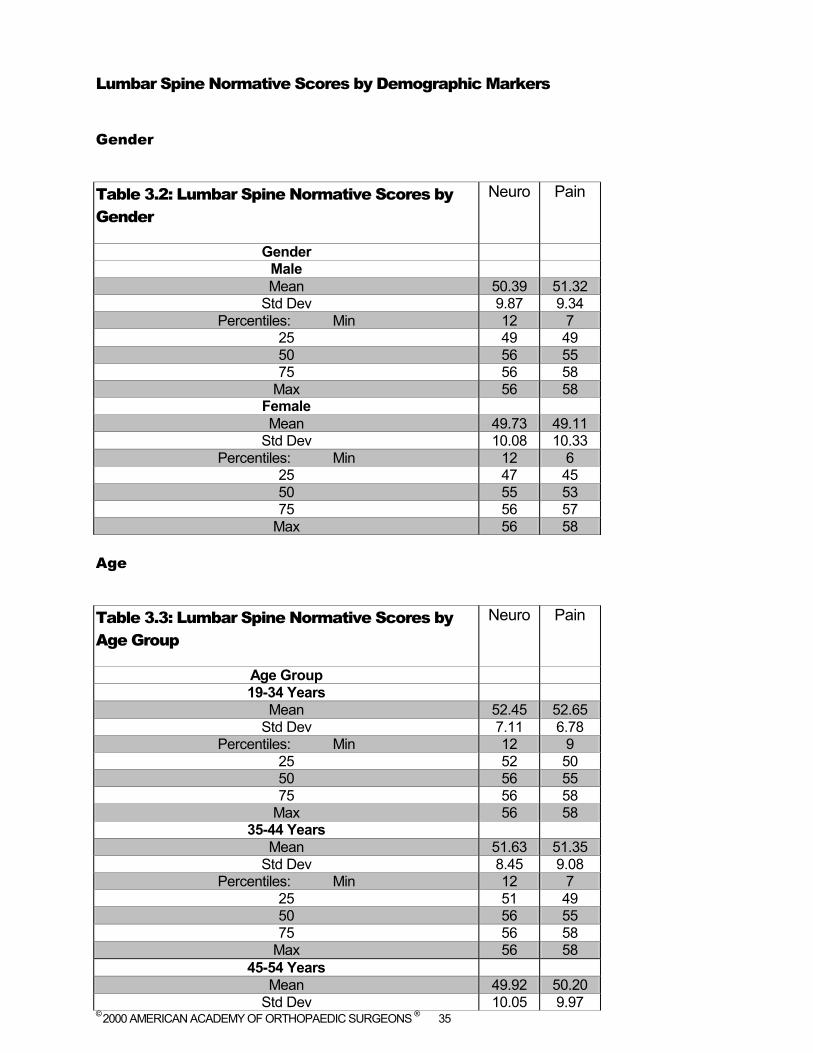
Lumbar Spine Normative Scores by Demographic Markers
Gender
Table 3.2: Lumbar Spine Normative Scores by Gender
Neuro Pain
Gender Male Mean 50.39 51.32
Std Dev 9.87 9.34 Percentiles: Min 12 7
25 49 49 50 56 55 75 56 58
Max 56 58 Female Mean 49.73 49.11
Std Dev 10.08 10.33 Percentiles: Min 12 6
25 47 45 50 55 53 75 56 57
Max 56 58 Age
Table 3.3: Lumbar Spine Normative Scores by Age Group
Neuro Pain
Age Group 19-34 Years
Mean 52.45 52.65 Std Dev 7.11 6.78
Percentiles: Min 12 9 25 52 50 50 56 55 75 56 58
Max 56 58 35-44 Years
Mean 51.63 51.35 Std Dev 8.45 9.08
Percentiles: Min 12 7 25 51 49 50 56 55 75 56 58
Max 56 58 45-54 Years
Mean 49.92 50.20 Std Dev 10.05 9.97
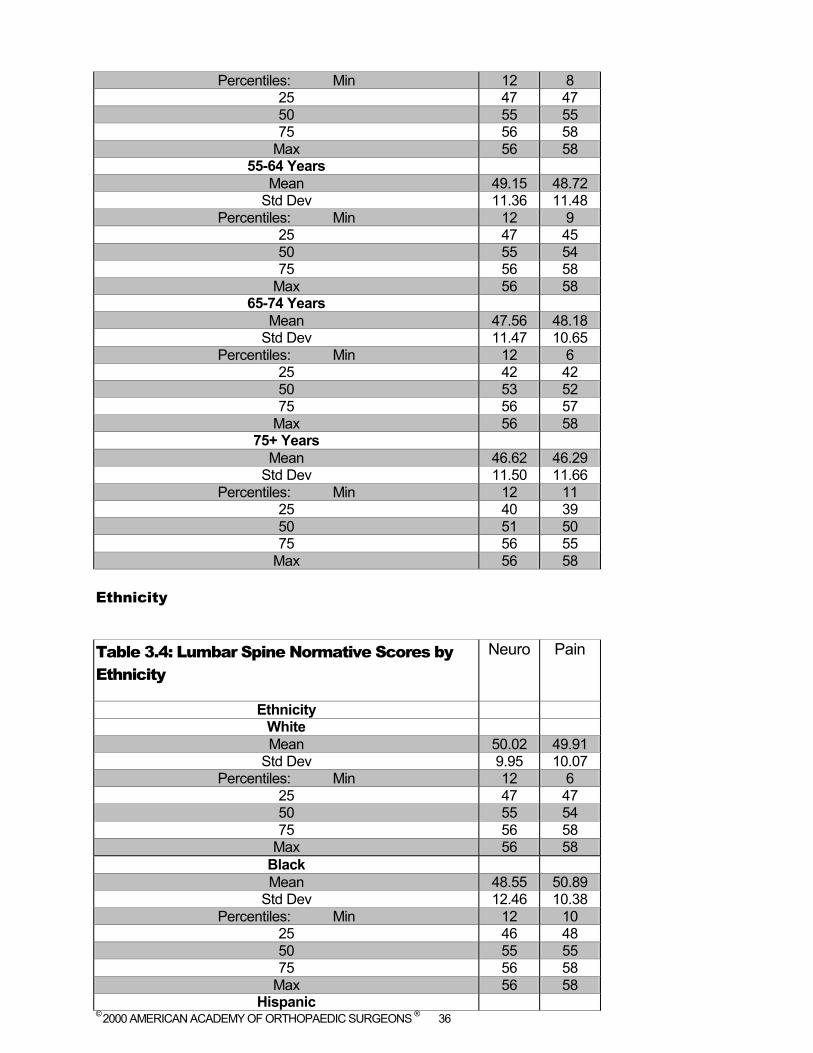
© 2000 AMERICAN ACADEMY OF ORTHOPAEDIC SURGEONS ® 36
Percentiles: Min 12 8 25 47 47 50 55 55 75 56 58
Max 56 58 55-64 Years
Mean 49.15 48.72 Std Dev 11.36 11.48
Percentiles: Min 12 9 25 47 45 50 55 54 75 56 58
Max 56 58 65-74 Years
Mean 47.56 48.18 Std Dev 11.47 10.65
Percentiles: Min 12 6 25 42 42 50 53 52 75 56 57
Max 56 58 75+ Years
Mean 46.62 46.29 Std Dev 11.50 11.66
Percentiles: Min 12 11 25 40 39 50 51 50 75 56 55
Max 56 58
Ethnicity
Table 3.4: Lumbar Spine Normative Scores by Ethnicity
Neuro Pain
Ethnicity White Mean 50.02 49.91
Std Dev 9.95 10.07 Percentiles: Min 12 6
25 47 47 50 55 54 75 56 58
Max 56 58 Black Mean 48.55 50.89
Std Dev 12.46 10.38 Percentiles: Min 12 10
25 46 48 50 55 55 75 56 58
Max 56 58 Hispanic
© 2000 AMERICAN ACADEMY OF ORTHOPAEDIC SURGEONS ® 37
Mean 50.06 51.00 Std Dev 11.62 10.38
Percentiles: Min 12 12 25 51 50 50 56 55 75 56 58
Max 56 58 Asian Mean 52.91 52.82
Std Dev 4.54 7.66 Percentiles: Min 42 27
25 52 53 50 53 55 75 56 58
Max 56 58 Native American
Mean 43.01 43.61 Std Dev 14.32 13.84
Percentiles: Min 12 10 25 33 37 50 48 47 75 55 55
Max 56 58 Other Ethnicity
Mean 53.85 49.89 Std Dev 3.07 7.58
Percentiles: Min 47 37 25 52 43 50 54 52 75 56 57
Max 56 58
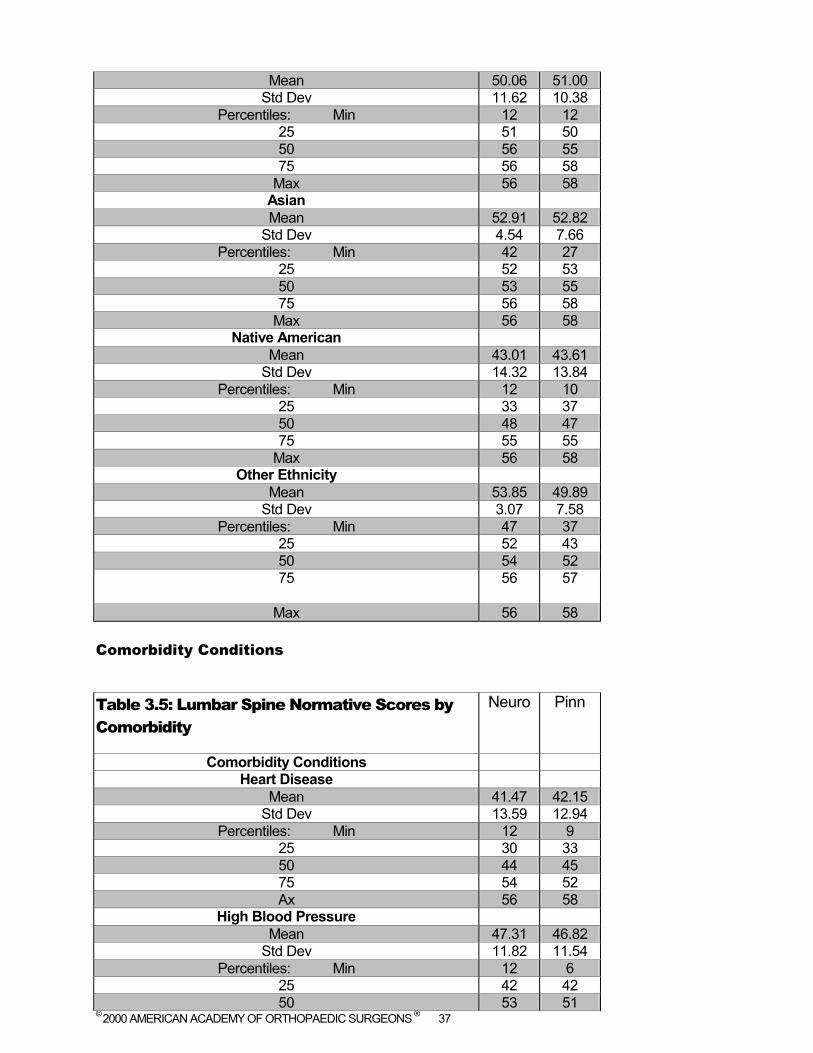
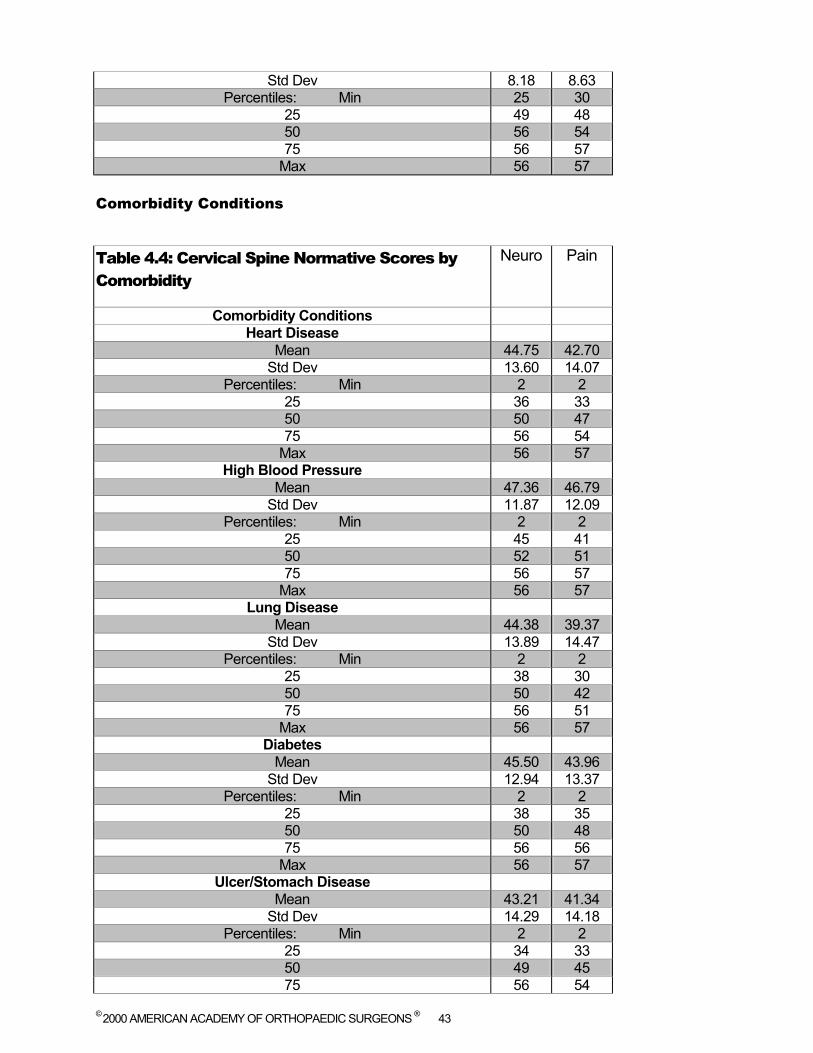
Comorbidity Conditions
Table 3.5: Lumbar Spine Normative Scores by Comorbidity
Neuro Pinn
Comorbidity Conditions Heart Disease
Mean 41.47 42.15 Std Dev 13.59 12.94
Percentiles: Min 12 9 25 30 33 50 44 45 75 54 52 Ax 56 58
High Blood Pressure Mean 47.31 46.82
Std Dev 11.82 11.54 Percentiles: Min 12 6
25 42 42 50 53 51
© 2000 AMERICAN ACADEMY OF ORTHOPAEDIC SURGEONS ® 38
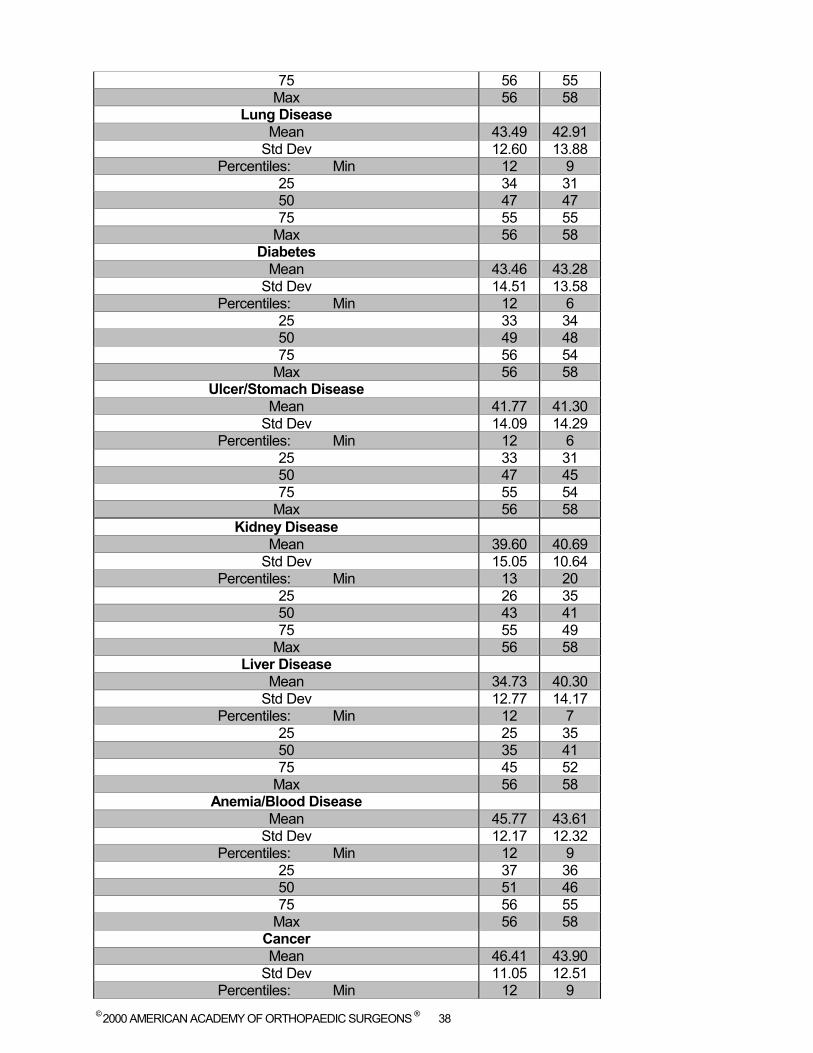
75 56 55 Max 56 58
Lung Disease Mean 43.49 42.91
Std Dev 12.60 13.88 Percentiles: Min 12 9
25 34 31 50 47 47 75 55 55
Max 56 58 Diabetes
Mean 43.46 43.28 Std Dev 14.51 13.58
Percentiles: Min 12 6 25 33 34 50 49 48 75 56 54
Max 56 58 Ulcer/Stomach Disease
Mean 41.77 41.30 Std Dev 14.09 14.29
Percentiles: Min 12 6 25 33 31 50 47 45 75 55 54
Max 56 58 Kidney Disease
Mean 39.60 40.69 Std Dev 15.05 10.64
Percentiles: Min 13 20 25 26 35 50 43 41 75 55 49
Max 56 58 Liver Disease
Mean 34.73 40.30 Std Dev 12.77 14.17
Percentiles: Min 12 7 25 25 35 50 35 41 75 45 52
Max 56 58 Anemia/Blood Disease
Mean 45.77 43.61 Std Dev 12.17 12.32
Percentiles: Min 12 9 25 37 36 50 51 46 75 56 55
Max 56 58 Cancer Mean 46.41 43.90
Std Dev 11.05 12.51 Percentiles: Min 12 9

© 2000 AMERICAN ACADEMY OF ORTHOPAEDIC SURGEONS ® 39
25 39 39 50 51 48 75 56 52
Max 56 58 Depression
Mean 43.83 42.06 Std Dev 13.17 13.21
Percentiles: Min 12 6 25 35 34 50 47 45 75 56 52
Max 56 58 Osteoarthritis
Mean 41.71 40.68 Std Dev 13.25 12.50
Percentiles: Min 12 6 25 33 32 50 46 43 75 53 51
Max 56 58 Back Pain
Mean 45.91 43.66 Std Dev 12.08 11.35
Percentiles: Min 12 6 25 40 37 50 51 47 75 56 52
Max 56 58 Rheumatoid Arthritis
Mean 41.08 40.42 Std Dev 14.35 13.84
Percentiles: Min 12 7 25 30 29 50 43 44 75 54 52
Max 56 58 Other Medical Problem
Mean 46.79 46.48 Std Dev 12.28 11.95
Percentiles: Min 12 6 25 41 42 50 52 50 75 56 55
Max 56 58
Cervical Spin Questionnaire
Cervical Spine Overall Normative & AAOS Scores
To compute a norm-based cervical spine score for an individual patient or group of patients, use the scoring algorithm described above in the introduction. The AAOS mean scores and standard deviations for calculating the norm-based values can be accessed in the overall population scores in Table 4.1 below.

© 2000 AMERICAN ACADEMY OF ORTHOPAEDIC SURGEONS ® 40
Table 4.1: Cervical Spine Normative Scores Neuro Pain
Cervical Spine OVERALL
Mean 50.00 50.00 Std Dev 10.00 10.00
Percentiles: Min 2 0 25 49 47 50 56 54 75 56 57
Max 56 57
AAOS Raw Scores
Mean 89.35 89.06 Std Dev 18.44 15.48
For example, if the patient’s AAOS score on the Cervical Spine Pain scale is 80.1, then that
individual’s functional symptoms norm-based score is calculated as:
((80.1 – 89.06) /15.48 *10) +50 = 44.21. In this instance, the patient’s normalized score is
almost 6/10 of one standard deviation from the overall general population mean.
Cervical Spine: Normative Scores by Demographic Markers
Gender
Table 4.2: Cervical Spine Normative Scores by Gender
Neuro Pain
Gender Male Mean 50.91 51.40
Std Dev 8.90 9.08 Percentiles: Min 2 1
25 49 50 50 56 54 75 56 57
Max 56 57 Female Mean 49.38 49.05
Std Dev 10.64 10.48 Percentiles: Min 2 0
25 47 45 50 56 54 75 56 57
© 2000 AMERICAN ACADEMY OF ORTHOPAEDIC SURGEONS ® 41
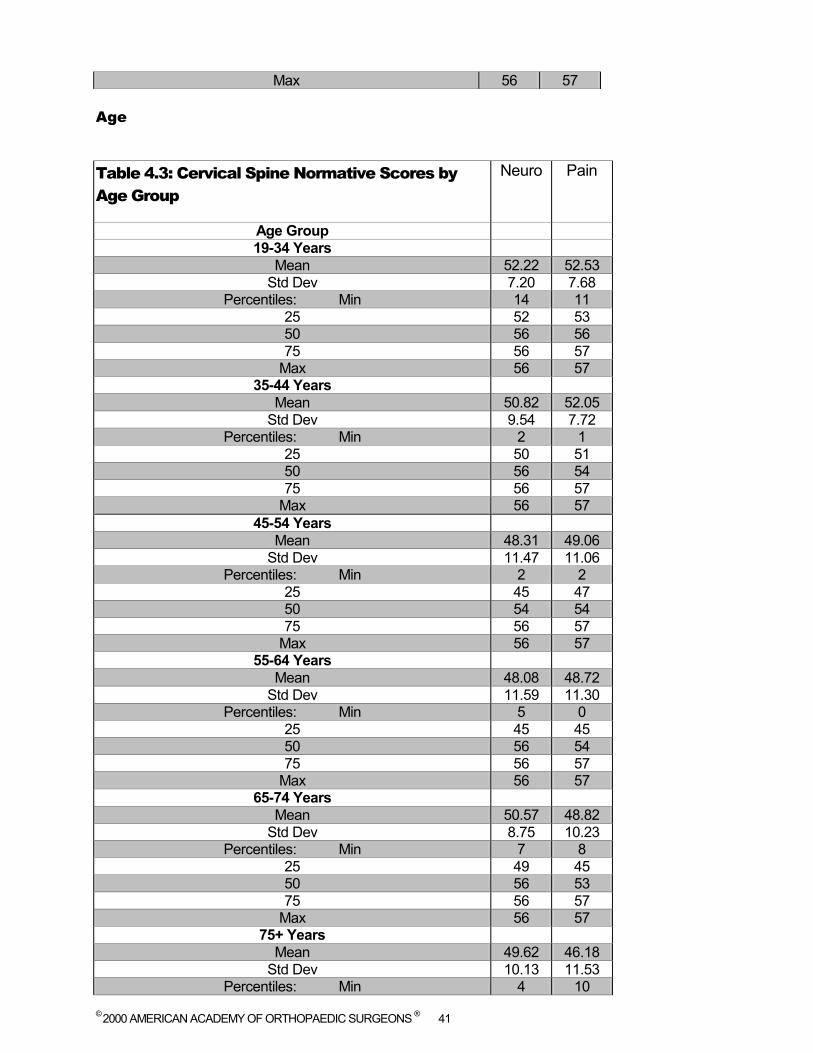
Max 56 57 Age
Table 4.3: Cervical Spine Normative Scores by Age Group
Neuro Pain
Age Group 19-34 Years
Mean 52.22 52.53 Std Dev 7.20 7.68
Percentiles: Min 14 11 25 52 53 50 56 56 75 56 57
Max 56 57 35-44 Years
Mean 50.82 52.05 Std Dev 9.54 7.72
Percentiles: Min 2 1 25 50 51 50 56 54 75 56 57
Max 56 57 45-54 Years
Mean 48.31 49.06 Std Dev 11.47 11.06
Percentiles: Min 2 2 25 45 47 50 54 54 75 56 57
Max 56 57 55-64 Years
Mean 48.08 48.72 Std Dev 11.59 11.30
Percentiles: Min 5 0 25 45 45 50 56 54 75 56 57
Max 56 57 65-74 Years
Mean 50.57 48.82 Std Dev 8.75 10.23
Percentiles: Min 7 8 25 49 45 50 56 53 75 56 57
Max 56 57 75+ Years
Mean 49.62 46.18 Std Dev 10.13 11.53
Percentiles: Min 4 10
© 2000 AMERICAN ACADEMY OF ORTHOPAEDIC SURGEONS ® 42
25 47 41 50 56 50 75 56 56
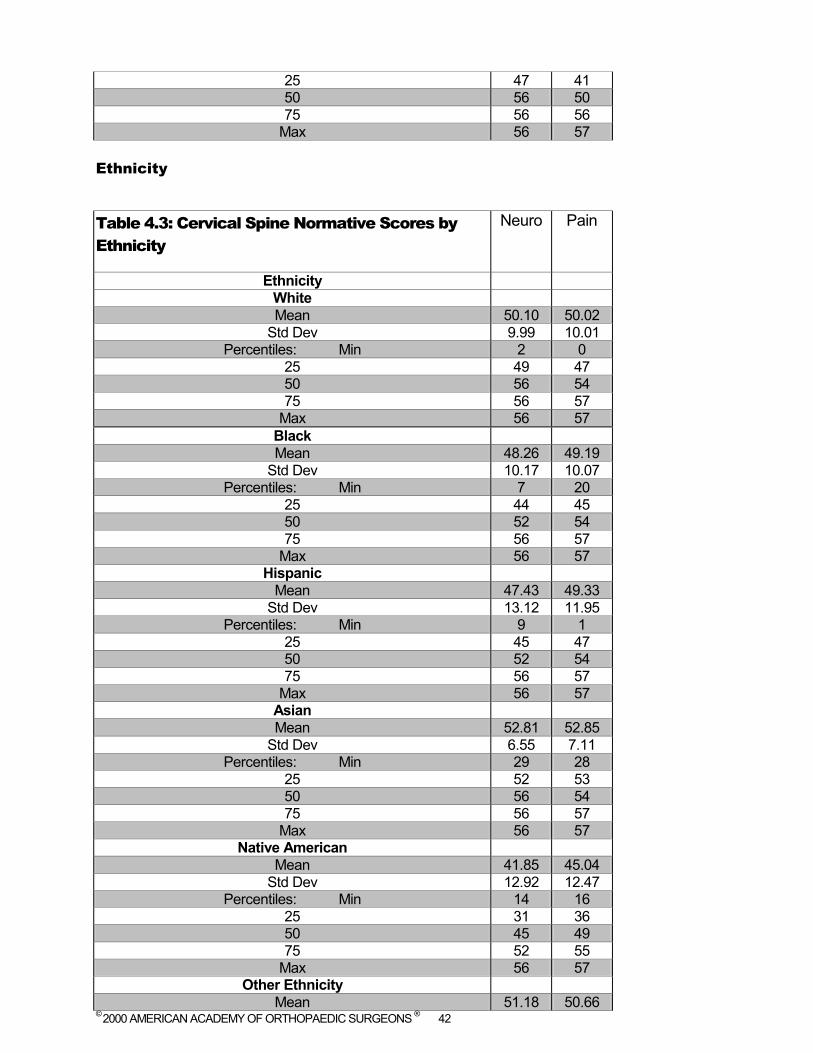
Max 56 57 Ethnicity
Table 4.3: Cervical Spine Normative Scores by Ethnicity
Neuro Pain
Ethnicity White Mean 50.10 50.02
Std Dev 9.99 10.01 Percentiles: Min 2 0
25 49 47 50 56 54 75 56 57
Max 56 57 Black Mean 48.26 49.19
Std Dev 10.17 10.07 Percentiles: Min 7 20
25 44 45 50 52 54 75 56 57
Max 56 57 Hispanic
Mean 47.43 49.33 Std Dev 13.12 11.95
Percentiles: Min 9 1 25 45 47 50 52 54 75 56 57
Max 56 57 Asian Mean 52.81 52.85
Std Dev 6.55 7.11 Percentiles: Min 29 28
25 52 53 50 56 54 75 56 57
Max 56 57 Native American
Mean 41.85 45.04 Std Dev 12.92 12.47
Percentiles: Min 14 16 25 31 36 50 45 49 75 52 55
Max 56 57 Other Ethnicity
Mean 51.18 50.66
© 2000 AMERICAN ACADEMY OF ORTHOPAEDIC SURGEONS ® 43
Std Dev 8.18 8.63 Percentiles: Min 25 30
25 49 48 50 56 54 75 56 57
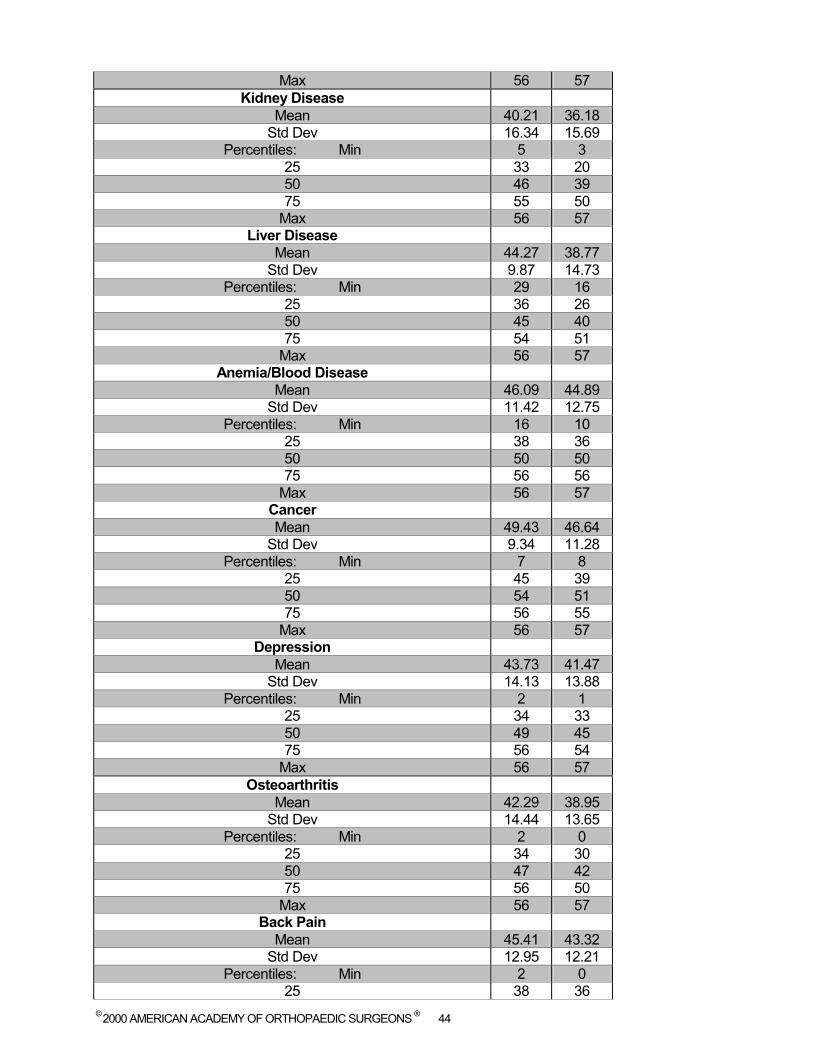
Max 56 57 Comorbidity Conditions
Table 4.4: Cervical Spine Normative Scores by Comorbidity
Neuro Pain
Comorbidity Conditions Heart Disease
Mean 44.75 42.70 Std Dev 13.60 14.07
Percentiles: Min 2 2 25 36 33 50 50 47 75 56 54
Max 56 57 High Blood Pressure
Mean 47.36 46.79 Std Dev 11.87 12.09
Percentiles: Min 2 2 25 45 41 50 52 51 75 56 57
Max 56 57 Lung Disease
Mean 44.38 39.37 Std Dev 13.89 14.47
Percentiles: Min 2 2 25 38 30 50 50 42 75 56 51
Max 56 57 Diabetes
Mean 45.50 43.96 Std Dev 12.94 13.37
Percentiles: Min 2 2 25 38 35 50 50 48 75 56 56
Max 56 57 Ulcer/Stomach Disease
Mean 43.21 41.34 Std Dev 14.29 14.18
Percentiles: Min 2 2 25 34 33 50 49 45 75 56 54
© 2000 AMERICAN ACADEMY OF ORTHOPAEDIC SURGEONS ® 44
Max 56 57 Kidney Disease
Mean 40.21 36.18 Std Dev 16.34 15.69
Percentiles: Min 5 3 25 33 20 50 46 39 75 55 50
Max 56 57 Liver Disease
Mean 44.27 38.77 Std Dev 9.87 14.73
Percentiles: Min 29 16 25 36 26 50 45 40 75 54 51
Max 56 57 Anemia/Blood Disease
Mean 46.09 44.89 Std Dev 11.42 12.75
Percentiles: Min 16 10 25 38 36 50 50 50 75 56 56
Max 56 57 Cancer Mean 49.43 46.64
Std Dev 9.34 11.28 Percentiles: Min 7 8
25 45 39 50 54 51 75 56 55
Max 56 57 Depression
Mean 43.73 41.47 Std Dev 14.13 13.88
Percentiles: Min 2 1 25 34 33 50 49 45 75 56 54
Max 56 57 Osteoarthritis
Mean 42.29 38.95 Std Dev 14.44 13.65
Percentiles: Min 2 0 25 34 30 50 47 42 75 56 50
Max 56 57 Back Pain
Mean 45.41 43.32 Std Dev 12.95 12.21
Percentiles: Min 2 0 25 38 36
© 2000 AMERICAN ACADEMY OF ORTHOPAEDIC SURGEONS ® 45
50 50 47 75 56 53
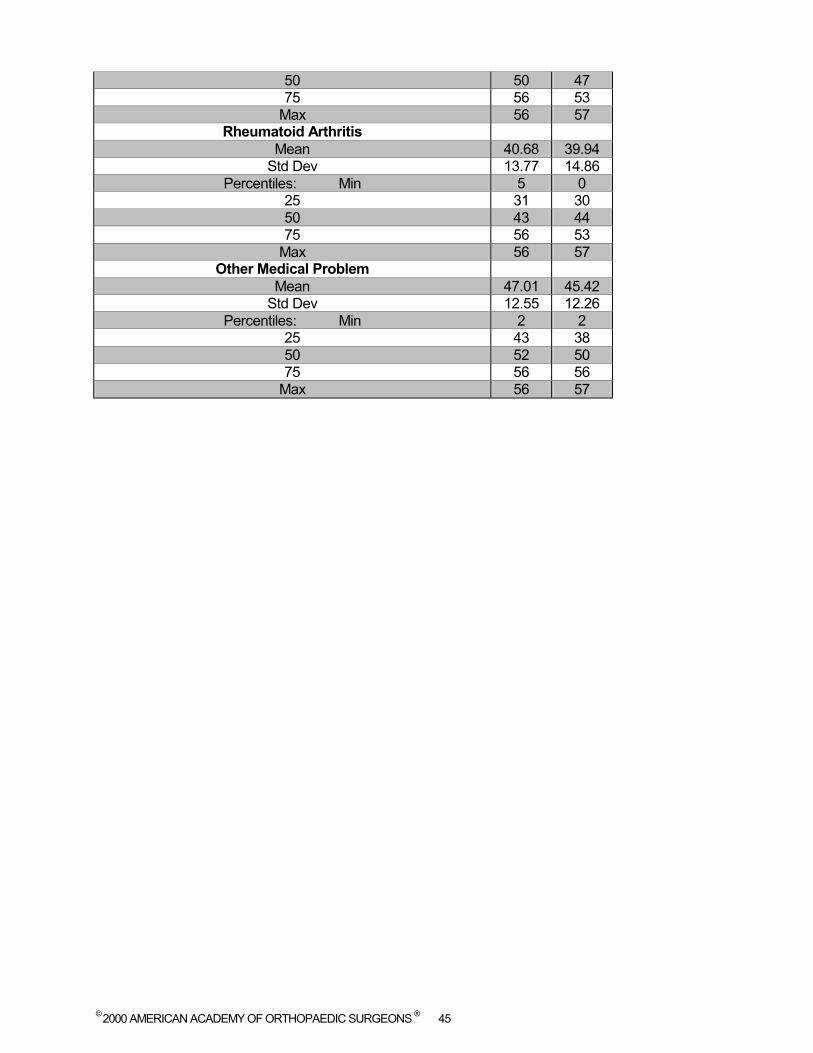
Max 56 57 Rheumatoid Arthritis
Mean 40.68 39.94 Std Dev 13.77 14.86
Percentiles: Min 5 0 25 31 30 50 43 44 75 56 53
Max 56 57 Other Medical Problem
Mean 47.01 45.42 Std Dev 12.55 12.26
Percentiles: Min 2 2 25 43 38 50 52 50 75 56 56
Max 56 57
© 2000 AMERICAN ACADEMY OF ORTHOPAEDIC SURGEONS ® 46
CHAPTER FIVE: LOWER EXTREMITIES: (Foot & Ankle, Hip & Knee, Lower Limb and Sports Knee )

© 2000 AMERICAN ACADEMY OF ORTHOPAEDIC SURGEONS ® 47
Foot and Ankle Questionnaire
The foot and ankle measure is comprised of two scales, a global measure of the function of
the foot or ankle and a second scale measuring the comfort-discomfort of the foot or ankle.
Foot and Ankle Overall Normative and AAOS scores
To compute a norm-based Foot and Ankle score for an individual patient or group of patients,
use the scoring algorithm described above in the introduction. The AAOS mean scores and standard
deviations for calculating the norm-based values can be accessed in the overall population scores in
Table 5.1 below.
Table 5.1: Foot/Ankle Normative Scores Global Comfort
Normative Scores OVERALL
Mean 50.00 50.00 Std Dev 10.00 10.00
Percentiles: Min -12 25 25 49 42 50 55 52 75 56 59
Max 56 59
AAOS Raw Scores
Mean 93.19 73.87 Std Dev 12.33 29.51
For example, if the patient’s AAOS score on the Foot and Ankle Comfort scale is 60.4, then
that individual’s norm-based Comfort scale score is calculated as:
((60.4 – 73.87) /29.51 *10) +50 = 45.56. In this instance, the patient’s normalized score is
almost .444 of one standard deviation from the overall general population mean.
© 2000 AMERICAN ACADEMY OF ORTHOPAEDIC SURGEONS ® 48
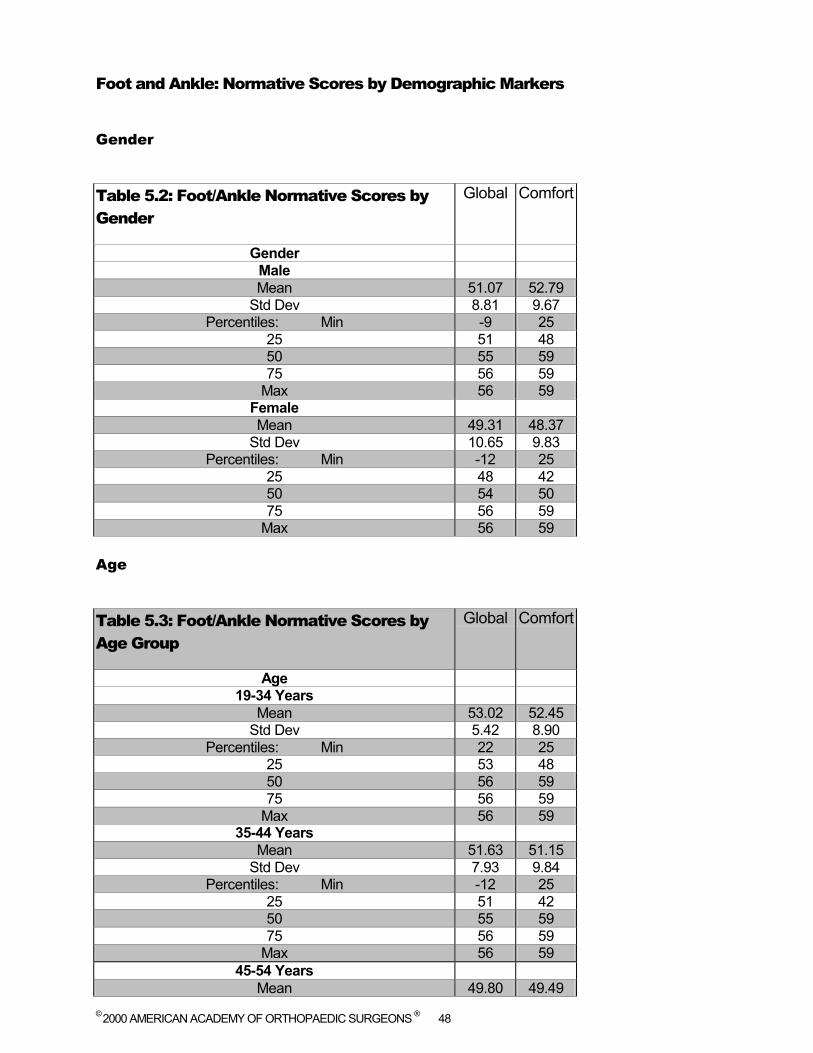
Foot and Ankle: Normative Scores by Demographic Markers
Gender
Table 5.2: Foot/Ankle Normative Scores by Gender
Global Comfort
Gender Male Mean 51.07 52.79
Std Dev 8.81 9.67 Percentiles: Min -9 25
25 51 48 50 55 59 75 56 59
Max 56 59 Female Mean 49.31 48.37
Std Dev 10.65 9.83 Percentiles: Min -12 25
25 48 42 50 54 50 75 56 59
Max 56 59 Age
Table 5.3: Foot/Ankle Normative Scores by Age Group
Global Comfort
Age 19-34 Years
Mean 53.02 52.45 Std Dev 5.42 8.90
Percentiles: Min 22 25 25 53 48 50 56 59 75 56 59
Max 56 59 35-44 Years
Mean 51.63 51.15 Std Dev 7.93 9.84
Percentiles: Min -12 25 25 51 42 50 55 59 75 56 59
Max 56 59 45-54 Years
Mean 49.80 49.49
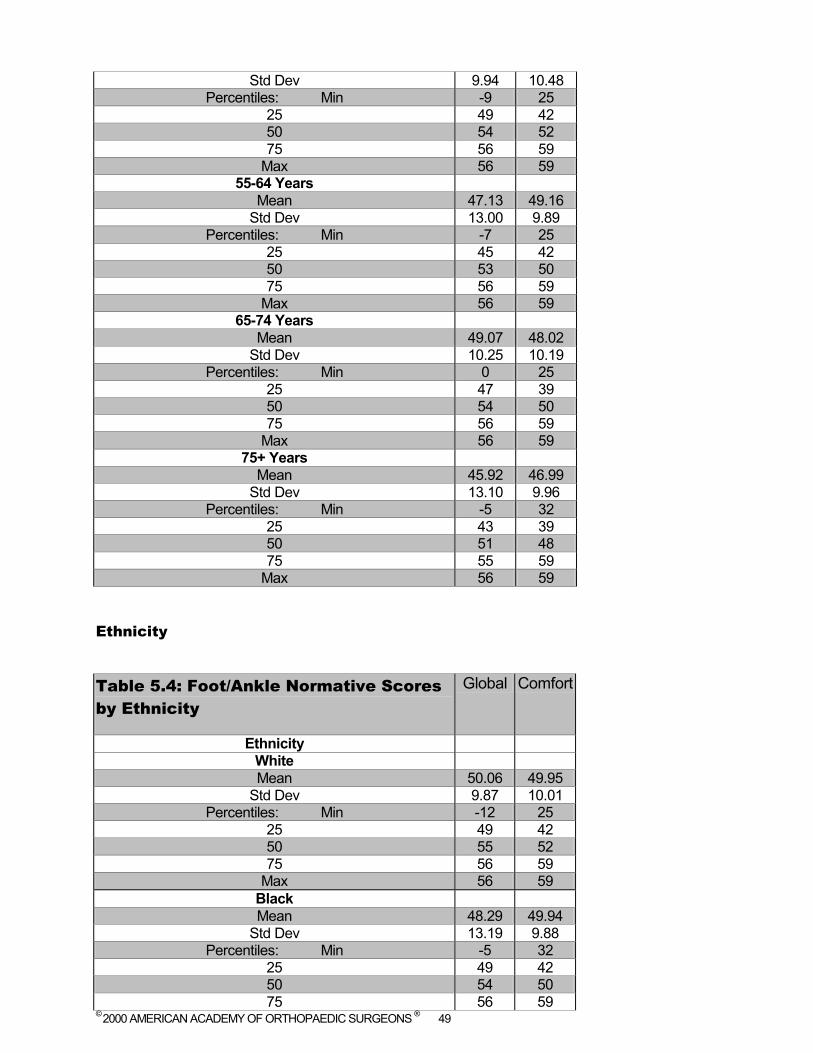
© 2000 AMERICAN ACADEMY OF ORTHOPAEDIC SURGEONS ® 49
Std Dev 9.94 10.48 Percentiles: Min -9 25
25 49 42 50 54 52 75 56 59
Max 56 59 55-64 Years
Mean 47.13 49.16 Std Dev 13.00 9.89
Percentiles: Min -7 25 25 45 42 50 53 50 75 56 59
Max 56 59 65-74 Years
Mean 49.07 48.02 Std Dev 10.25 10.19
Percentiles: Min 0 25 25 47 39 50 54 50 75 56 59
Max 56 59 75+ Years
Mean 45.92 46.99 Std Dev 13.10 9.96
Percentiles: Min -5 32 25 43 39 50 51 48 75 55 59
Max 56 59 Ethnicity
Table 5.4: Foot/Ankle Normative Scores by Ethnicity
Global Comfort
Ethnicity White Mean 50.06 49.95
Std Dev 9.87 10.01 Percentiles: Min -12 25
25 49 42 50 55 52 75 56 59
Max 56 59 Black Mean 48.29 49.94
Std Dev 13.19 9.88 Percentiles: Min -5 32
25 49 42 50 54 50 75 56 59
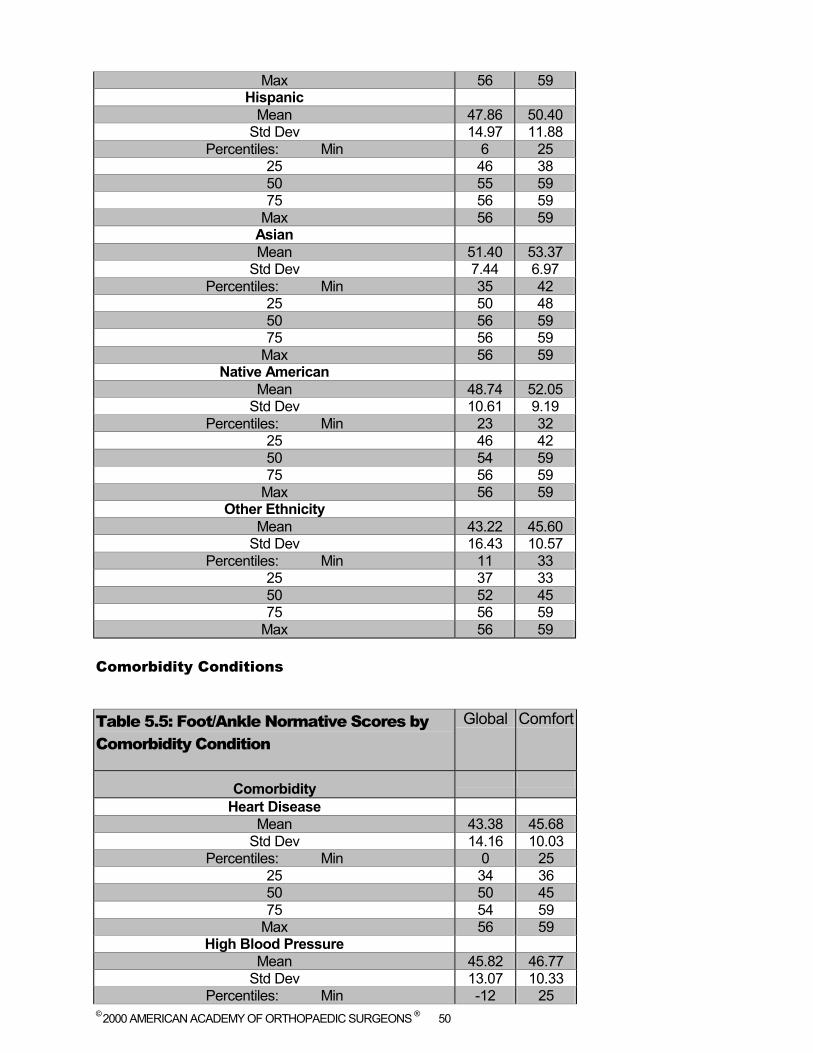
© 2000 AMERICAN ACADEMY OF ORTHOPAEDIC SURGEONS ® 50
Max 56 59 Hispanic
Mean 47.86 50.40 Std Dev 14.97 11.88
Percentiles: Min 6 25 25 46 38 50 55 59 75 56 59
Max 56 59 Asian Mean 51.40 53.37
Std Dev 7.44 6.97 Percentiles: Min 35 42
25 50 48 50 56 59 75 56 59
Max 56 59 Native American
Mean 48.74 52.05 Std Dev 10.61 9.19
Percentiles: Min 23 32 25 46 42 50 54 59 75 56 59
Max 56 59 Other Ethnicity
Mean 43.22 45.60 Std Dev 16.43 10.57
Percentiles: Min 11 33 25 37 33 50 52 45 75 56 59
Max 56 59 Comorbidity Conditions
Table 5.5: Foot/Ankle Normative Scores by Comorbidity Condition
Global Comfort
Comorbidity
Heart Disease Mean 43.38 45.68
Std Dev 14.16 10.03 Percentiles: Min 0 25
25 34 36 50 50 45 75 54 59
Max 56 59 High Blood Pressure
Mean 45.82 46.77 Std Dev 13.07 10.33
Percentiles: Min -12 25
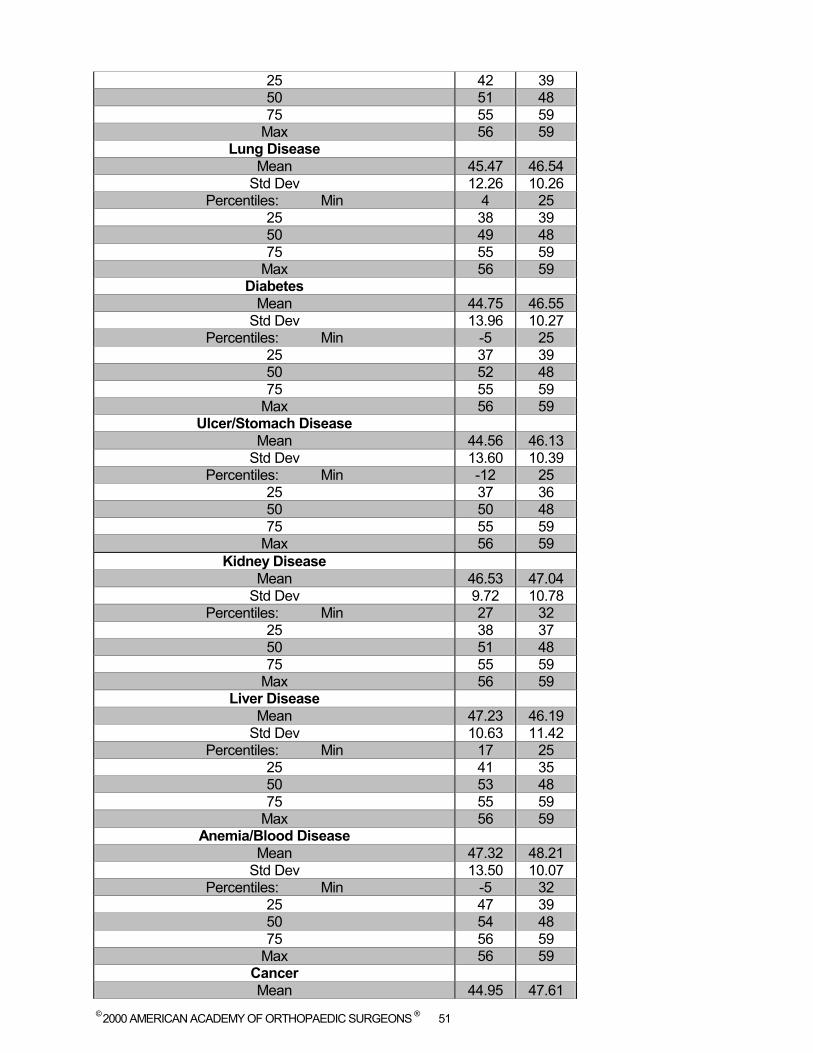
© 2000 AMERICAN ACADEMY OF ORTHOPAEDIC SURGEONS ® 51
25 42 39 50 51 48 75 55 59
Max 56 59 Lung Disease
Mean 45.47 46.54 Std Dev 12.26 10.26
Percentiles: Min 4 25 25 38 39 50 49 48 75 55 59
Max 56 59 Diabetes
Mean 44.75 46.55 Std Dev 13.96 10.27
Percentiles: Min -5 25 25 37 39 50 52 48 75 55 59
Max 56 59 Ulcer/Stomach Disease
Mean 44.56 46.13 Std Dev 13.60 10.39
Percentiles: Min -12 25 25 37 36 50 50 48 75 55 59
Max 56 59 Kidney Disease
Mean 46.53 47.04 Std Dev 9.72 10.78
Percentiles: Min 27 32 25 38 37 50 51 48 75 55 59
Max 56 59 Liver Disease
Mean 47.23 46.19 Std Dev 10.63 11.42
Percentiles: Min 17 25 25 41 35 50 53 48 75 55 59
Max 56 59 Anemia/Blood Disease
Mean 47.32 48.21 Std Dev 13.50 10.07
Percentiles: Min -5 32 25 47 39 50 54 48 75 56 59
Max 56 59 Cancer Mean 44.95 47.61
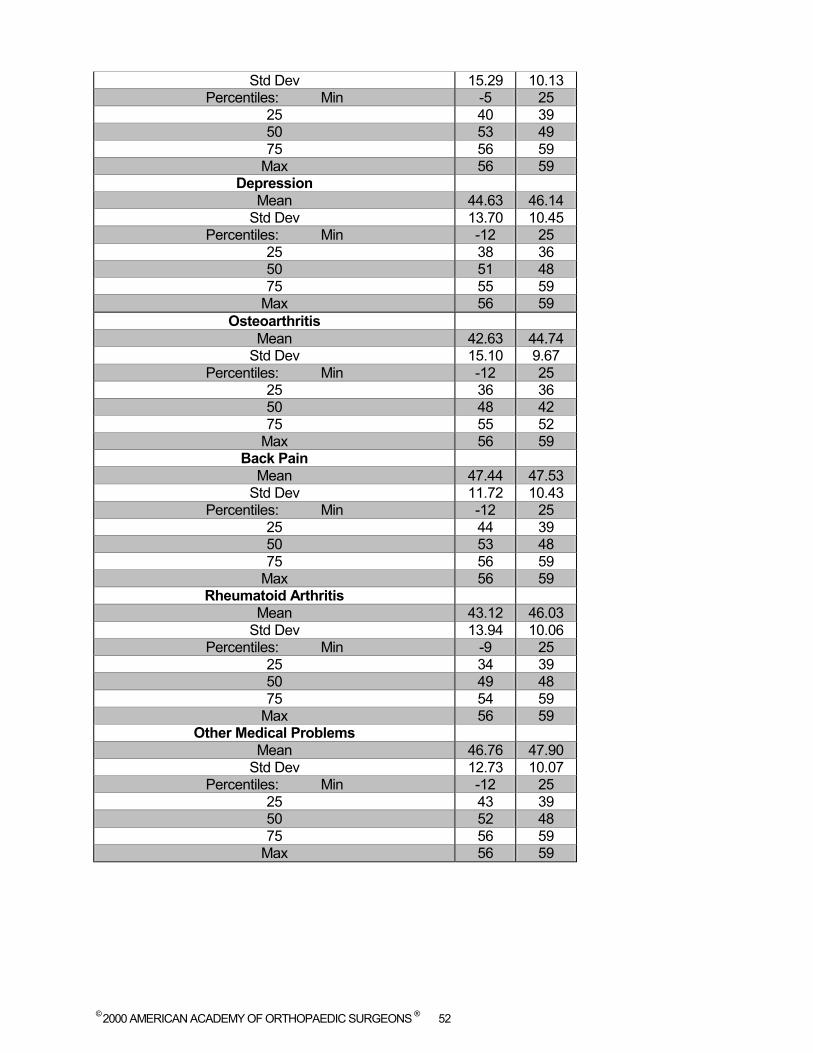
© 2000 AMERICAN ACADEMY OF ORTHOPAEDIC SURGEONS ® 52
Std Dev 15.29 10.13 Percentiles: Min -5 25
25 40 39 50 53 49 75 56 59
Max 56 59 Depression
Mean 44.63 46.14 Std Dev 13.70 10.45
Percentiles: Min -12 25 25 38 36 50 51 48 75 55 59
Max 56 59 Osteoarthritis
Mean 42.63 44.74 Std Dev 15.10 9.67
Percentiles: Min -12 25 25 36 36 50 48 42 75 55 52
Max 56 59 Back Pain
Mean 47.44 47.53 Std Dev 11.72 10.43
Percentiles: Min -12 25 25 44 39 50 53 48 75 56 59
Max 56 59 Rheumatoid Arthritis
Mean 43.12 46.03 Std Dev 13.94 10.06
Percentiles: Min -9 25 25 34 39 50 49 48 75 54 59
Max 56 59 Other Medical Problems
Mean 46.76 47.90 Std Dev 12.73 10.07
Percentiles: Min -12 25 25 43 39 50 52 48 75 56 59
Max 56 59

© 2000 AMERICAN ACADEMY OF ORTHOPAEDIC SURGEONS ® 53
Hip and Knee Questionnaire
Hip and Knee: Overall Normative and AAOS Raw Scores
The hip and knee instrument contains a core hip and knee measure of functioning, as well as
four pain measures for the left and right hip and the left and right knee.
To compute a norm-based Hip and Knee score for an individual patient or group of patients,
use the scoring algorithm described above in the introduction. The AAOS mean scores and standard
deviations for calculating the norm-based values can be accessed in the overall population scores in
Table 6.1 below.
Table 6.1: Hip and Knee Normative Scores Core Right Hip Pain
Left Hip Pain
Right Knee Pain
Left Knee Pain
Hip And Knee OVERALL
Mean 50.00 50.00 50.00 50.00 50.00 Std Dev 10.00 10.00 10.00 10.00 10.00
Percentiles: Min -11 -27 -30 -21 -22 25 48 54 53 49 54 50 54 54 53 54 54 75 56 54 53 54 54
Max 56 54 53 54 54
AAOS Raw Scores
Mean 91.02 95.58 96.09 94.24 94.68 Std Dev 14.35 12.34 12.08 13.33 13.16
For example, if the patient’s AAOS score on the Hip and Knee Core scale is 80.4, then that
individual’s core norm-based score is calculated as:
((80.4 – 91.02) /14.35 *10) +50 = 42.6. In this instance, the patient’s normalized score is
nearly .8 of one standard deviation from the overall general population mean.
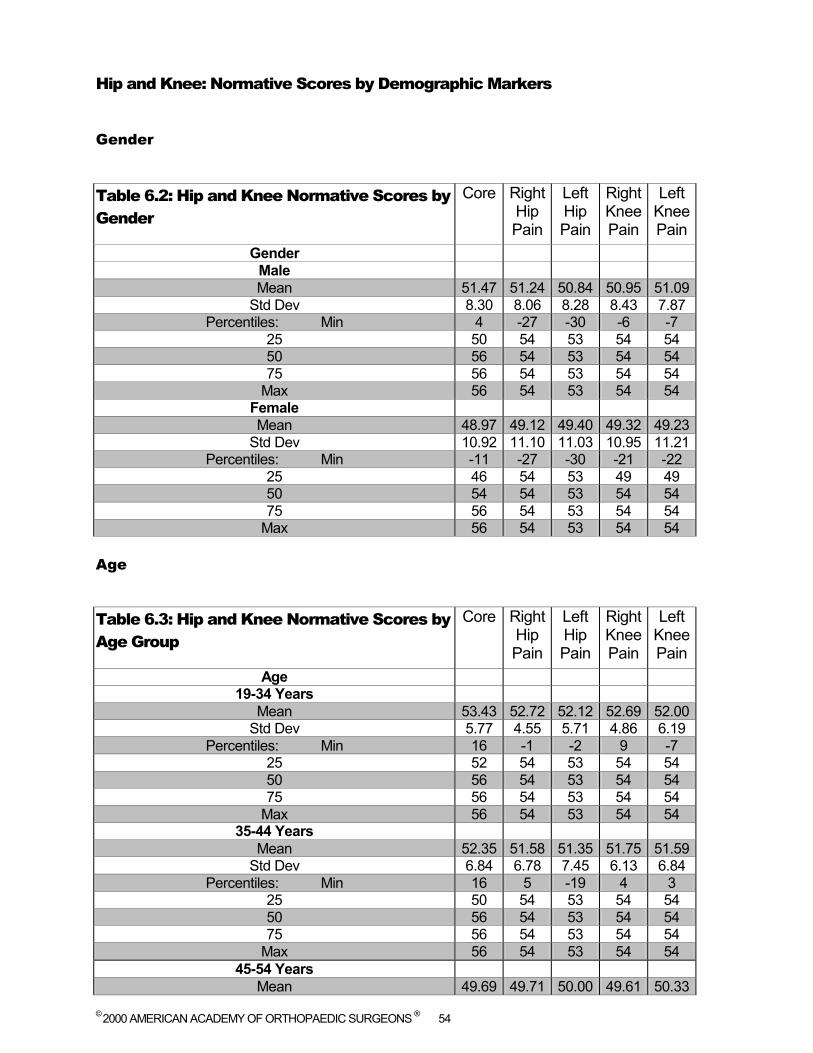
© 2000 AMERICAN ACADEMY OF ORTHOPAEDIC SURGEONS ® 54
Hip and Knee: Normative Scores by Demographic Markers
Gender
Table 6.2: Hip and Knee Normative Scores by Gender
Core Right Hip Pain
Left Hip Pain
Right Knee Pain
Left Knee Pain
Gender Male Mean 51.47 51.24 50.84 50.95 51.09
Std Dev 8.30 8.06 8.28 8.43 7.87 Percentiles: Min 4 -27 -30 -6 -7
25 50 54 53 54 54 50 56 54 53 54 54 75 56 54 53 54 54
Max 56 54 53 54 54 Female Mean 48.97 49.12 49.40 49.32 49.23
Std Dev 10.92 11.10 11.03 10.95 11.21 Percentiles: Min -11 -27 -30 -21 -22
25 46 54 53 49 49 50 54 54 53 54 54 75 56 54 53 54 54
Max 56 54 53 54 54 Age
Table 6.3: Hip and Knee Normative Scores by Age Group
Core Right Hip Pain
Left Hip Pain
Right Knee Pain
Left Knee Pain
Age 19-34 Years
Mean 53.43 52.72 52.12 52.69 52.00 Std Dev 5.77 4.55 5.71 4.86 6.19
Percentiles: Min 16 -1 -2 9 -7 25 52 54 53 54 54 50 56 54 53 54 54 75 56 54 53 54 54
Max 56 54 53 54 54 35-44 Years
Mean 52.35 51.58 51.35 51.75 51.59 Std Dev 6.84 6.78 7.45 6.13 6.84
Percentiles: Min 16 5 -19 4 3 25 50 54 53 54 54 50 56 54 53 54 54 75 56 54 53 54 54
Max 56 54 53 54 54 45-54 Years
Mean 49.69 49.71 50.00 49.61 50.33
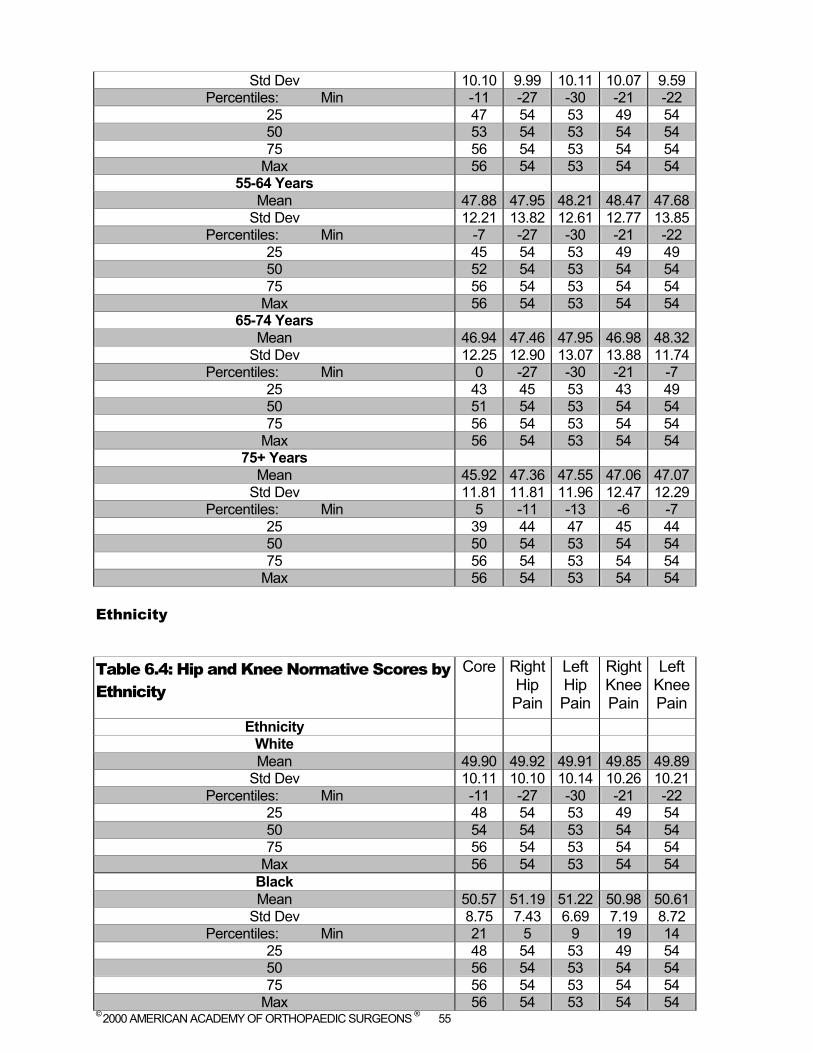
© 2000 AMERICAN ACADEMY OF ORTHOPAEDIC SURGEONS ® 55
Std Dev 10.10 9.99 10.11 10.07 9.59 Percentiles: Min -11 -27 -30 -21 -22
25 47 54 53 49 54 50 53 54 53 54 54 75 56 54 53 54 54
Max 56 54 53 54 54 55-64 Years
Mean 47.88 47.95 48.21 48.47 47.68 Std Dev 12.21 13.82 12.61 12.77 13.85
Percentiles: Min -7 -27 -30 -21 -22 25 45 54 53 49 49 50 52 54 53 54 54 75 56 54 53 54 54
Max 56 54 53 54 54 65-74 Years
Mean 46.94 47.46 47.95 46.98 48.32 Std Dev 12.25 12.90 13.07 13.88 11.74
Percentiles: Min 0 -27 -30 -21 -7 25 43 45 53 43 49 50 51 54 53 54 54 75 56 54 53 54 54
Max 56 54 53 54 54 75+ Years
Mean 45.92 47.36 47.55 47.06 47.07 Std Dev 11.81 11.81 11.96 12.47 12.29
Percentiles: Min 5 -11 -13 -6 -7 25 39 44 47 45 44 50 50 54 53 54 54 75 56 54 53 54 54
Max 56 54 53 54 54 Ethnicity
Table 6.4: Hip and Knee Normative Scores by Ethnicity
Core Right Hip Pain
Left Hip Pain
Right Knee Pain
Left Knee Pain
Ethnicity White Mean 49.90 49.92 49.91 49.85 49.89
Std Dev 10.11 10.10 10.14 10.26 10.21 Percentiles: Min -11 -27 -30 -21 -22
25 48 54 53 49 54 50 54 54 53 54 54 75 56 54 53 54 54
Max 56 54 53 54 54 Black Mean 50.57 51.19 51.22 50.98 50.61
Std Dev 8.75 7.43 6.69 7.19 8.72 Percentiles: Min 21 5 9 19 14
25 48 54 53 49 54 50 56 54 53 54 54 75 56 54 53 54 54
Max 56 54 53 54 54
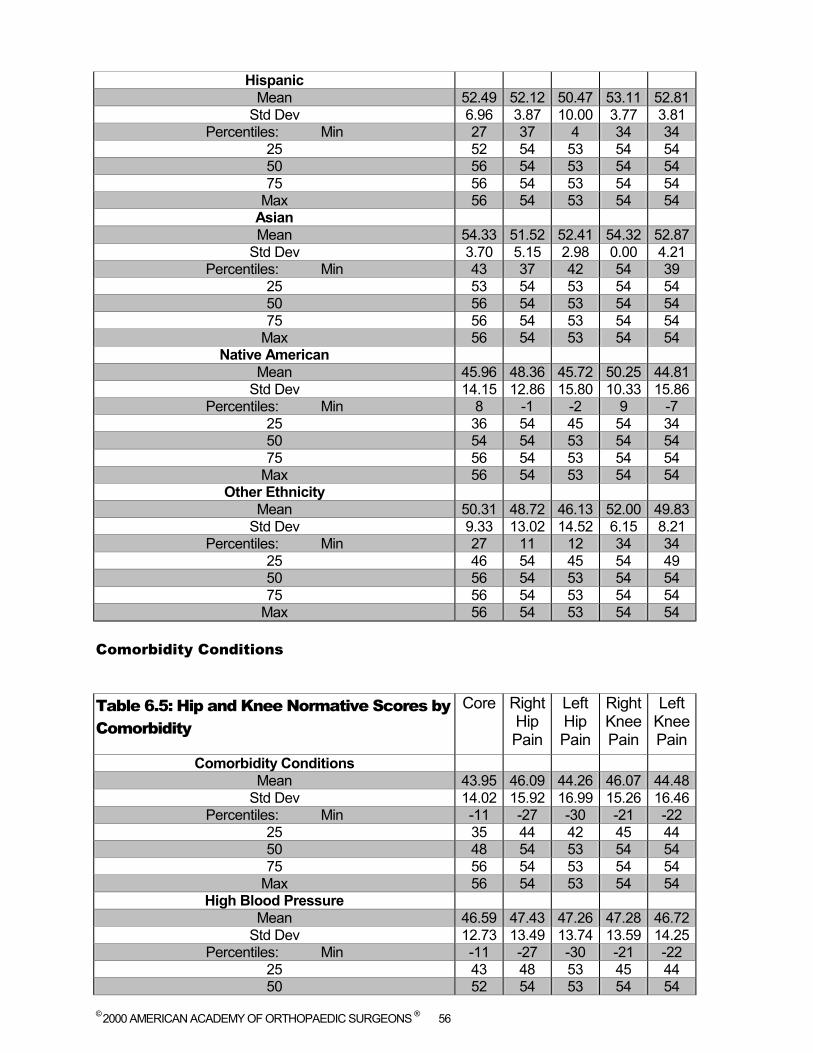
© 2000 AMERICAN ACADEMY OF ORTHOPAEDIC SURGEONS ® 56
Hispanic Mean 52.49 52.12 50.47 53.11 52.81
Std Dev 6.96 3.87 10.00 3.77 3.81 Percentiles: Min 27 37 4 34 34
25 52 54 53 54 54 50 56 54 53 54 54 75 56 54 53 54 54
Max 56 54 53 54 54 Asian Mean 54.33 51.52 52.41 54.32 52.87
Std Dev 3.70 5.15 2.98 0.00 4.21 Percentiles: Min 43 37 42 54 39
25 53 54 53 54 54 50 56 54 53 54 54 75 56 54 53 54 54
Max 56 54 53 54 54 Native American
Mean 45.96 48.36 45.72 50.25 44.81 Std Dev 14.15 12.86 15.80 10.33 15.86
Percentiles: Min 8 -1 -2 9 -7 25 36 54 45 54 34 50 54 54 53 54 54 75 56 54 53 54 54
Max 56 54 53 54 54 Other Ethnicity
Mean 50.31 48.72 46.13 52.00 49.83 Std Dev 9.33 13.02 14.52 6.15 8.21
Percentiles: Min 27 11 12 34 34 25 46 54 45 54 49 50 56 54 53 54 54 75 56 54 53 54 54
Max 56 54 53 54 54 Comorbidity Conditions
Table 6.5: Hip and Knee Normative Scores by Comorbidity
Core Right Hip Pain
Left Hip Pain
Right Knee Pain
Left Knee Pain
Comorbidity Conditions Mean 43.95 46.09 44.26 46.07 44.48
Std Dev 14.02 15.92 16.99 15.26 16.46 Percentiles: Min -11 -27 -30 -21 -22
25 35 44 42 45 44 50 48 54 53 54 54 75 56 54 53 54 54
Max 56 54 53 54 54 High Blood Pressure
Mean 46.59 47.43 47.26 47.28 46.72 Std Dev 12.73 13.49 13.74 13.59 14.25
Percentiles: Min -11 -27 -30 -21 -22 25 43 48 53 45 44 50 52 54 53 54 54
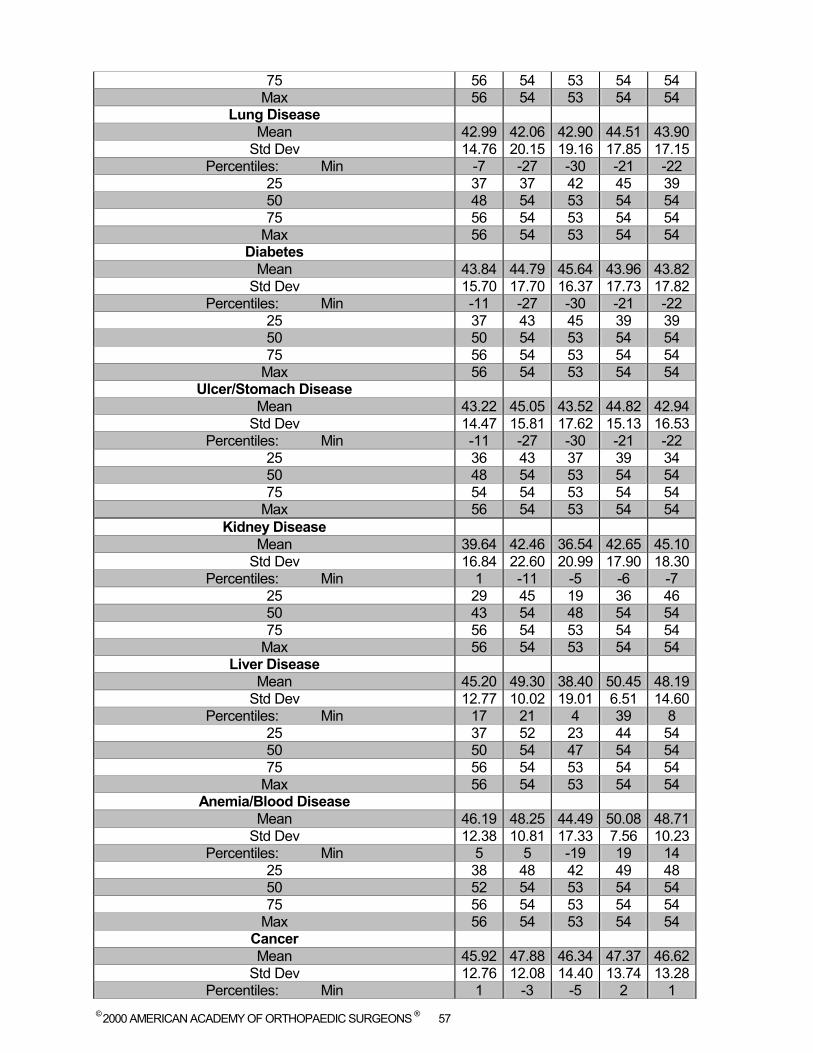
© 2000 AMERICAN ACADEMY OF ORTHOPAEDIC SURGEONS ® 57
75 56 54 53 54 54 Max 56 54 53 54 54
Lung Disease Mean 42.99 42.06 42.90 44.51 43.90
Std Dev 14.76 20.15 19.16 17.85 17.15 Percentiles: Min -7 -27 -30 -21 -22
25 37 37 42 45 39 50 48 54 53 54 54 75 56 54 53 54 54
Max 56 54 53 54 54 Diabetes
Mean 43.84 44.79 45.64 43.96 43.82 Std Dev 15.70 17.70 16.37 17.73 17.82
Percentiles: Min -11 -27 -30 -21 -22 25 37 43 45 39 39 50 50 54 53 54 54 75 56 54 53 54 54
Max 56 54 53 54 54 Ulcer/Stomach Disease
Mean 43.22 45.05 43.52 44.82 42.94 Std Dev 14.47 15.81 17.62 15.13 16.53
Percentiles: Min -11 -27 -30 -21 -22 25 36 43 37 39 34 50 48 54 53 54 54 75 54 54 53 54 54
Max 56 54 53 54 54 Kidney Disease
Mean 39.64 42.46 36.54 42.65 45.10 Std Dev 16.84 22.60 20.99 17.90 18.30
Percentiles: Min 1 -11 -5 -6 -7 25 29 45 19 36 46 50 43 54 48 54 54 75 56 54 53 54 54
Max 56 54 53 54 54 Liver Disease
Mean 45.20 49.30 38.40 50.45 48.19 Std Dev 12.77 10.02 19.01 6.51 14.60
Percentiles: Min 17 21 4 39 8 25 37 52 23 44 54 50 50 54 47 54 54 75 56 54 53 54 54
Max 56 54 53 54 54 Anemia/Blood Disease
Mean 46.19 48.25 44.49 50.08 48.71 Std Dev 12.38 10.81 17.33 7.56 10.23
Percentiles: Min 5 5 -19 19 14 25 38 48 42 49 48 50 52 54 53 54 54 75 56 54 53 54 54
Max 56 54 53 54 54 Cancer Mean 45.92 47.88 46.34 47.37 46.62
Std Dev 12.76 12.08 14.40 13.74 13.28 Percentiles: Min 1 -3 -5 2 1
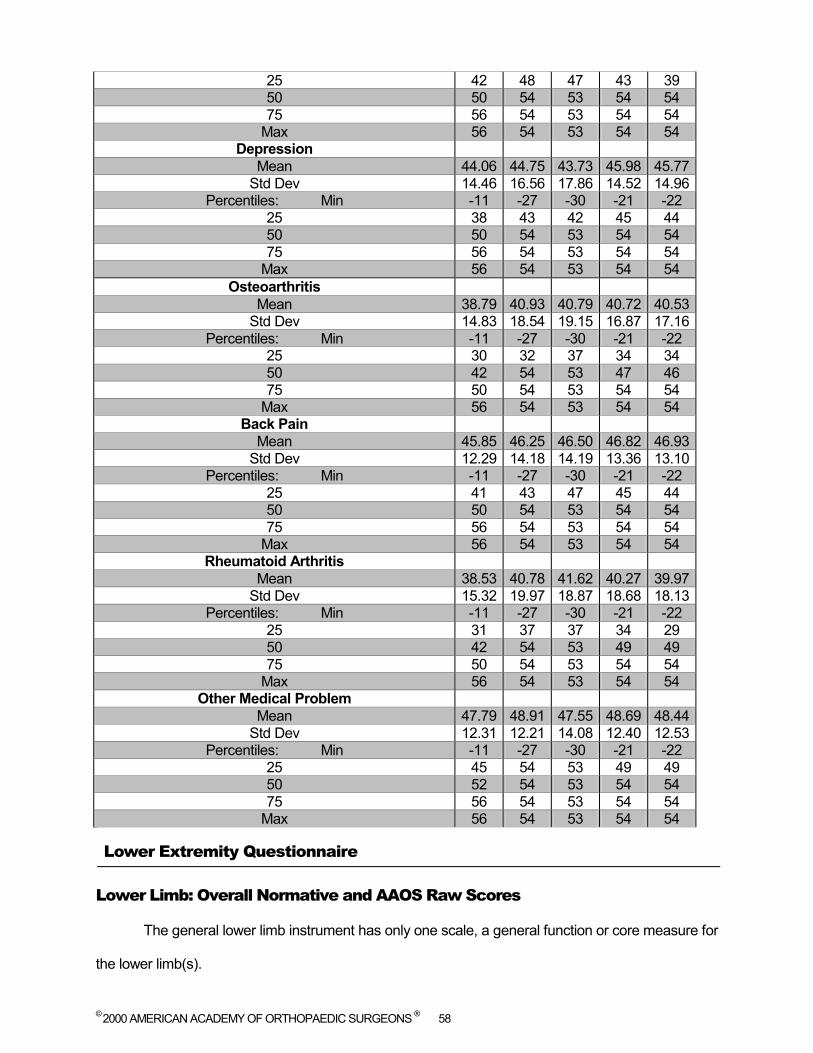
© 2000 AMERICAN ACADEMY OF ORTHOPAEDIC SURGEONS ® 58
25 42 48 47 43 39 50 50 54 53 54 54 75 56 54 53 54 54
Max 56 54 53 54 54 Depression
Mean 44.06 44.75 43.73 45.98 45.77 Std Dev 14.46 16.56 17.86 14.52 14.96
Percentiles: Min -11 -27 -30 -21 -22 25 38 43 42 45 44 50 50 54 53 54 54 75 56 54 53 54 54
Max 56 54 53 54 54 Osteoarthritis
Mean 38.79 40.93 40.79 40.72 40.53 Std Dev 14.83 18.54 19.15 16.87 17.16
Percentiles: Min -11 -27 -30 -21 -22 25 30 32 37 34 34 50 42 54 53 47 46 75 50 54 53 54 54
Max 56 54 53 54 54 Back Pain
Mean 45.85 46.25 46.50 46.82 46.93 Std Dev 12.29 14.18 14.19 13.36 13.10
Percentiles: Min -11 -27 -30 -21 -22 25 41 43 47 45 44 50 50 54 53 54 54 75 56 54 53 54 54
Max 56 54 53 54 54 Rheumatoid Arthritis
Mean 38.53 40.78 41.62 40.27 39.97 Std Dev 15.32 19.97 18.87 18.68 18.13
Percentiles: Min -11 -27 -30 -21 -22 25 31 37 37 34 29 50 42 54 53 49 49 75 50 54 53 54 54
Max 56 54 53 54 54 Other Medical Problem
Mean 47.79 48.91 47.55 48.69 48.44 Std Dev 12.31 12.21 14.08 12.40 12.53
Percentiles: Min -11 -27 -30 -21 -22 25 45 54 53 49 49 50 52 54 53 54 54 75 56 54 53 54 54
Max 56 54 53 54 54
Lower Extremity Questionnaire
Lower Limb: Overall Normative and AAOS Raw Scores
The general lower limb instrument has only one scale, a general function or core measure for
the lower limb(s).

© 2000 AMERICAN ACADEMY OF ORTHOPAEDIC SURGEONS ® 59
To compute a norm-based Lower Limb score for an individual patient or group of patients,
use the scoring algorithm described above in the introduction. The AAOS mean scores and standard
deviations for calculating the norm-based values can be accessed in the overall population scores in
Table 7.1 below.
Table 7.1: Lower Limb Normative Scores Core
Lower Limb OVERALL
Mean 50.00 Std Dev 10.00
Percentiles: Min -5 25 47 50 54 75 57
Max 57
AAOS Raw Scores
Mean 90.52 Std Dev 13.78
For example, if the patient’s AAOS score on the Lower Limb Core scale is 70.9, then that
individual’s norm-based Core scale score is calculated as:
((70.9 – 90.52) /13.78 *10) +50 = 35.76. In this instance, the patient’s normalized score is
almost 1.5 standard deviations from the overall general population mean.
Lower Limb: Normative Scores by Demographic Markers
Gender
Table 7.2: Lower Limb Normative Scores by Gender
Core
Gender Male Mean 50.88
Std Dev 9.24 Percentiles: Min -1
25 49 50 55 75 57
Max 57 Female Mean 49.36
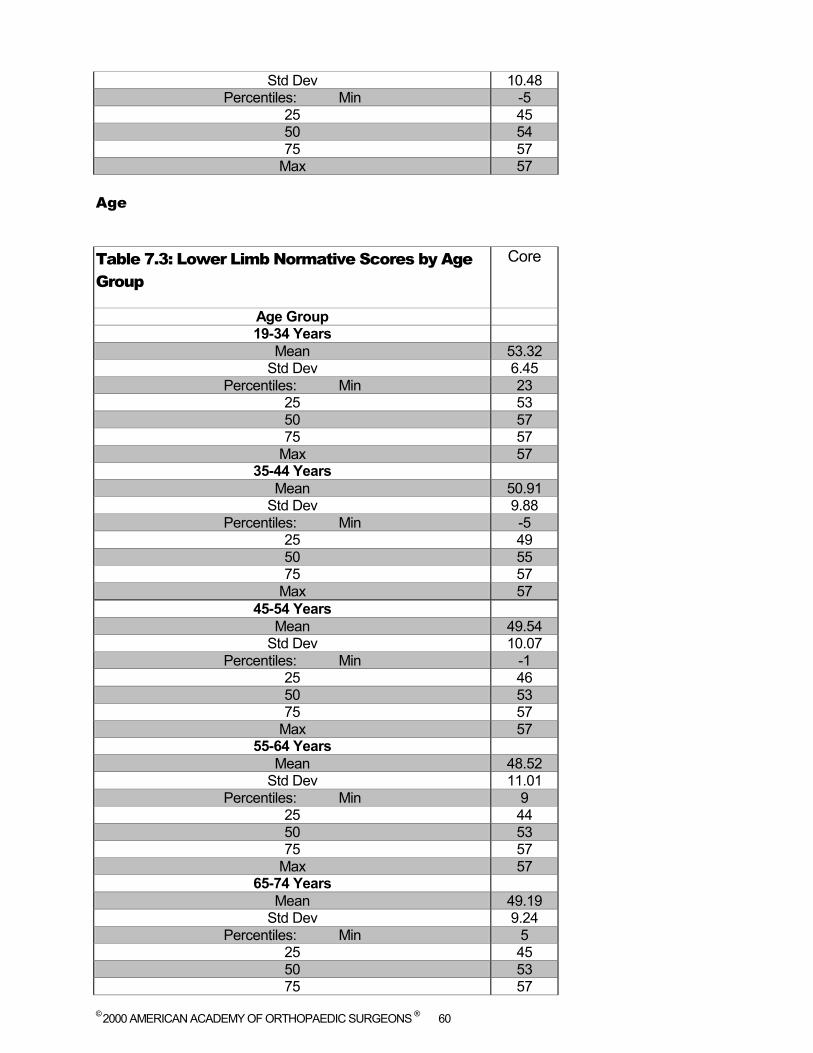
© 2000 AMERICAN ACADEMY OF ORTHOPAEDIC SURGEONS ® 60
Std Dev 10.48 Percentiles: Min -5
25 45 50 54 75 57
Max 57 Age
Table 7.3: Lower Limb Normative Scores by Age Group
Core
Age Group 19-34 Years
Mean 53.32 Std Dev 6.45
Percentiles: Min 23 25 53 50 57 75 57
Max 57 35-44 Years
Mean 50.91 Std Dev 9.88
Percentiles: Min -5 25 49 50 55 75 57
Max 57 45-54 Years
Mean 49.54 Std Dev 10.07
Percentiles: Min -1 25 46 50 53 75 57
Max 57 55-64 Years
Mean 48.52 Std Dev 11.01
Percentiles: Min 9 25 44 50 53 75 57
Max 57 65-74 Years
Mean 49.19 Std Dev 9.24
Percentiles: Min 5 25 45 50 53 75 57
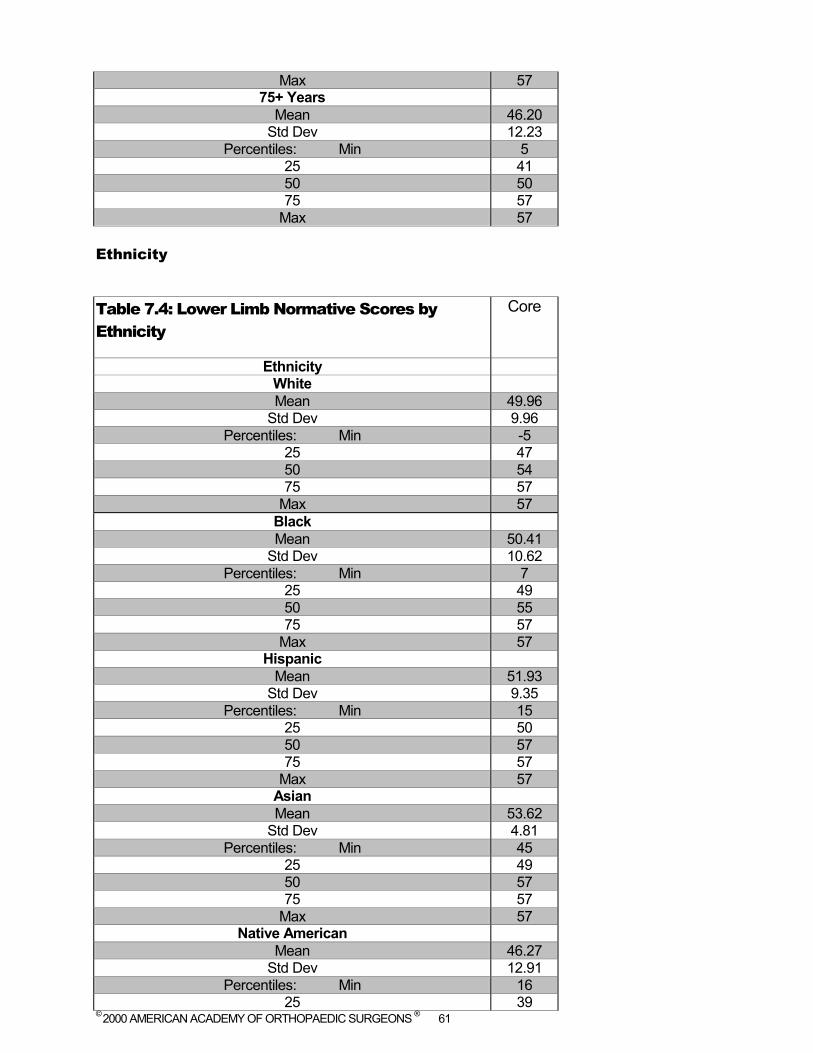
© 2000 AMERICAN ACADEMY OF ORTHOPAEDIC SURGEONS ® 61
Max 57 75+ Years
Mean 46.20 Std Dev 12.23
Percentiles: Min 5 25 41 50 50 75 57
Max 57 Ethnicity
Table 7.4: Lower Limb Normative Scores by Ethnicity
Core
Ethnicity White Mean 49.96
Std Dev 9.96 Percentiles: Min -5
25 47 50 54 75 57
Max 57 Black Mean 50.41
Std Dev 10.62 Percentiles: Min 7
25 49 50 55 75 57
Max 57 Hispanic
Mean 51.93 Std Dev 9.35
Percentiles: Min 15 25 50 50 57 75 57
Max 57 Asian Mean 53.62
Std Dev 4.81 Percentiles: Min 45
25 49 50 57 75 57
Max 57 Native American
Mean 46.27 Std Dev 12.91
Percentiles: Min 16 25 39
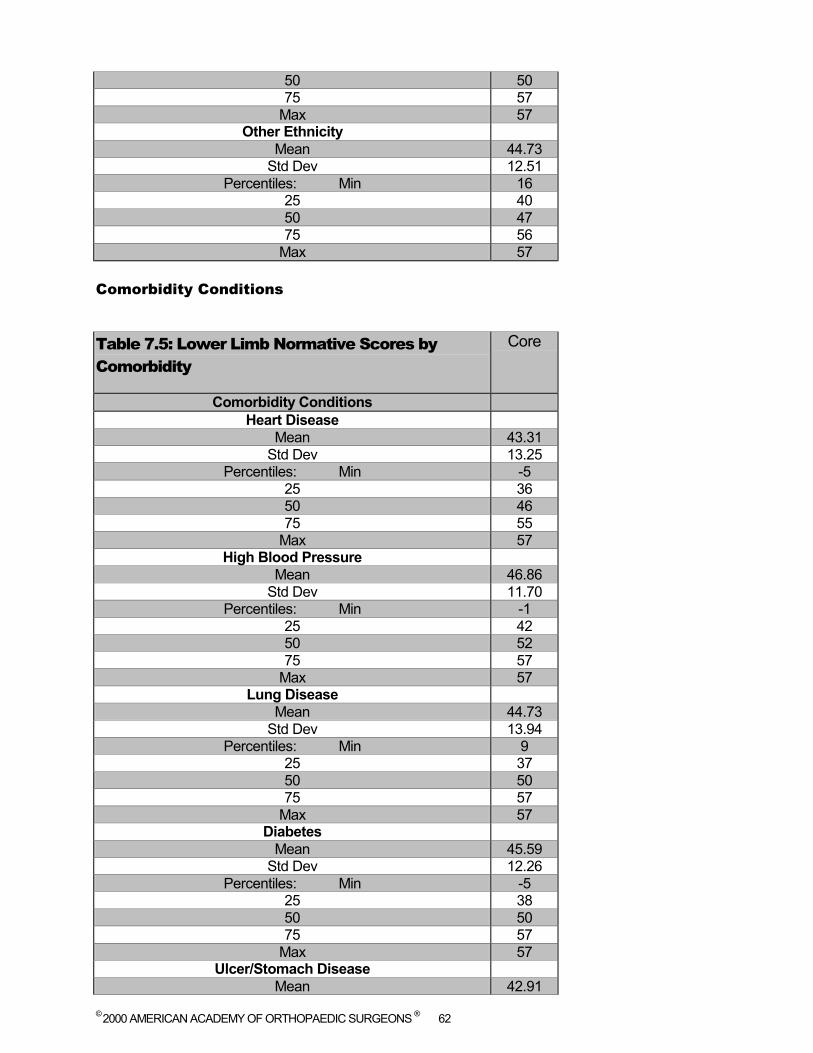
© 2000 AMERICAN ACADEMY OF ORTHOPAEDIC SURGEONS ® 62
50 50 75 57
Max 57 Other Ethnicity
Mean 44.73 Std Dev 12.51
Percentiles: Min 16 25 40 50 47 75 56
Max 57 Comorbidity Conditions
Table 7.5: Lower Limb Normative Scores by Comorbidity
Core
Comorbidity Conditions Heart Disease
Mean 43.31 Std Dev 13.25
Percentiles: Min -5 25 36 50 46 75 55
Max 57 High Blood Pressure
Mean 46.86 Std Dev 11.70
Percentiles: Min -1 25 42 50 52 75 57
Max 57 Lung Disease
Mean 44.73 Std Dev 13.94
Percentiles: Min 9 25 37 50 50 75 57
Max 57 Diabetes
Mean 45.59 Std Dev 12.26
Percentiles: Min -5 25 38 50 50 75 57
Max 57 Ulcer/Stomach Disease
Mean 42.91
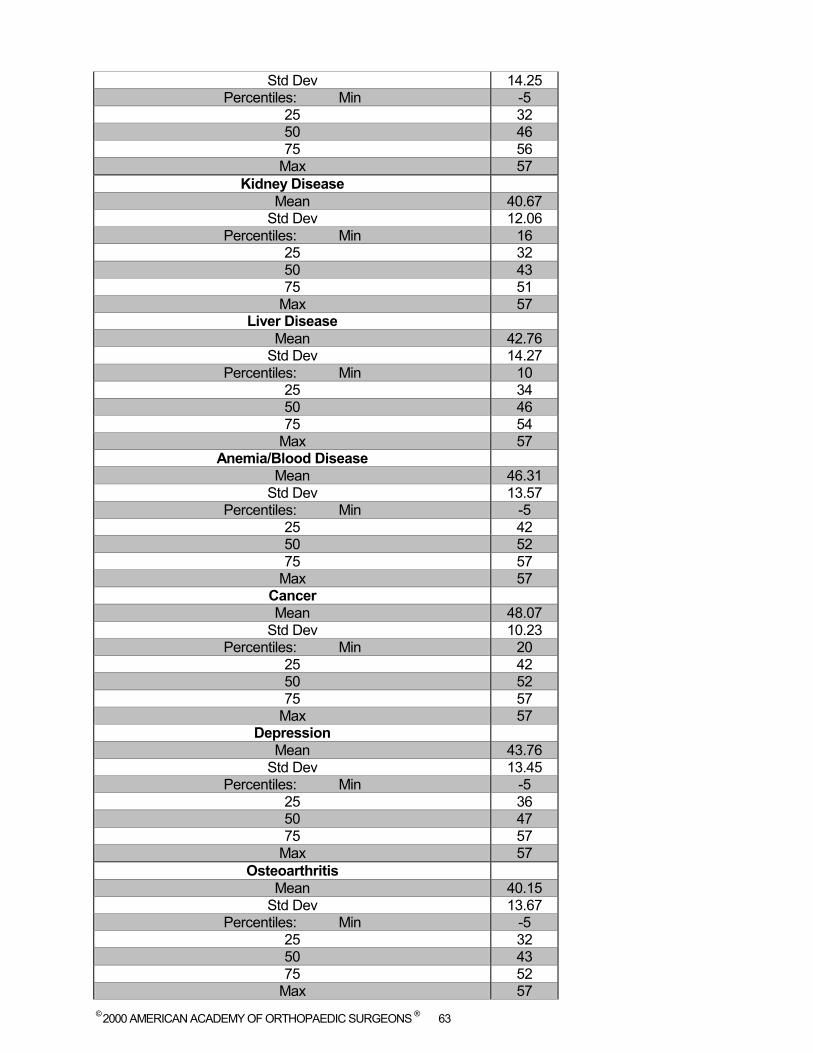
© 2000 AMERICAN ACADEMY OF ORTHOPAEDIC SURGEONS ® 63
Std Dev 14.25 Percentiles: Min -5
25 32 50 46 75 56
Max 57 Kidney Disease
Mean 40.67 Std Dev 12.06
Percentiles: Min 16 25 32 50 43 75 51
Max 57 Liver Disease
Mean 42.76 Std Dev 14.27
Percentiles: Min 10 25 34 50 46 75 54
Max 57 Anemia/Blood Disease
Mean 46.31 Std Dev 13.57
Percentiles: Min -5 25 42 50 52 75 57
Max 57 Cancer Mean 48.07
Std Dev 10.23 Percentiles: Min 20
25 42 50 52 75 57
Max 57 Depression
Mean 43.76 Std Dev 13.45
Percentiles: Min -5 25 36 50 47 75 57
Max 57 Osteoarthritis
Mean 40.15 Std Dev 13.67
Percentiles: Min -5 25 32 50 43 75 52
Max 57

© 2000 AMERICAN ACADEMY OF ORTHOPAEDIC SURGEONS ® 64
Back Pain Mean 45.67
Std Dev 12.03 Percentiles: Min -5
25 41 50 50 75 55
Max 57 Rheumatoid Arthritis
Mean 39.28 Std Dev 13.93
Percentiles: Min -5 25 31 50 42 75 52
Max 57 Other Medical Problem
Mean 47.92 Std Dev 10.85
Percentiles: Min 4 25 44 50 52 75 57
Max 57
Sports Knee Questionnaire
The sports knee instrument is comprised of a core measure of knee function as well an
assessment of the patient’s knee “gives way” during vigorous activity as well as measures of past
and current limitations of knee functioning.
Sports Knee: Normative and AAOS Raw Scores
To compute a norm-based Sports Knee score for an individual patient or group of patients,
use the scoring algorithm described above in the introduction. The AAOS mean scores and standard
deviations for calculating the norm-based values can be accessed in the overall population scores in
Table 8.1 below.
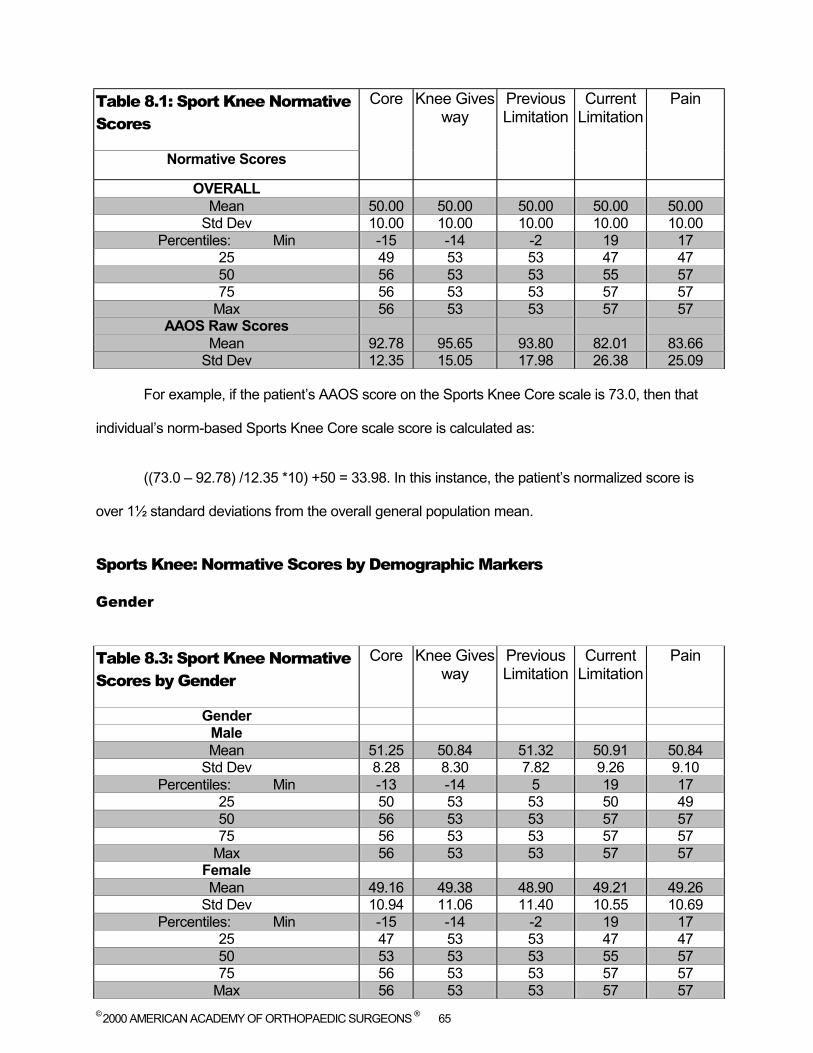
© 2000 AMERICAN ACADEMY OF ORTHOPAEDIC SURGEONS ® 65
Table 8.1: Sport Knee Normative Scores
Core Knee Gives way
Previous Limitation
Current Limitation
Pain
Normative Scores
OVERALL Mean 50.00 50.00 50.00 50.00 50.00
Std Dev 10.00 10.00 10.00 10.00 10.00 Percentiles: Min -15 -14 -2 19 17
25 49 53 53 47 47 50 56 53 53 55 57 75 56 53 53 57 57
Max 56 53 53 57 57 AAOS Raw Scores
Mean 92.78 95.65 93.80 82.01 83.66 Std Dev 12.35 15.05 17.98 26.38 25.09
For example, if the patient’s AAOS score on the Sports Knee Core scale is 73.0, then that
individual’s norm-based Sports Knee Core scale score is calculated as:
((73.0 – 92.78) /12.35 *10) +50 = 33.98. In this instance, the patient’s normalized score is
over 1½ standard deviations from the overall general population mean.
Sports Knee: Normative Scores by Demographic Markers
Gender
Table 8.3: Sport Knee Normative Scores by Gender
Core Knee Gives way
Previous Limitation
Current Limitation
Pain
Gender Male Mean 51.25 50.84 51.32 50.91 50.84
Std Dev 8.28 8.30 7.82 9.26 9.10 Percentiles: Min -13 -14 5 19 17
25 50 53 53 50 49 50 56 53 53 57 57 75 56 53 53 57 57
Max 56 53 53 57 57 Female Mean 49.16 49.38 48.90 49.21 49.26
Std Dev 10.94 11.06 11.40 10.55 10.69 Percentiles: Min -15 -14 -2 19 17
25 47 53 53 47 47 50 53 53 53 55 57 75 56 53 53 57 57
Max 56 53 53 57 57
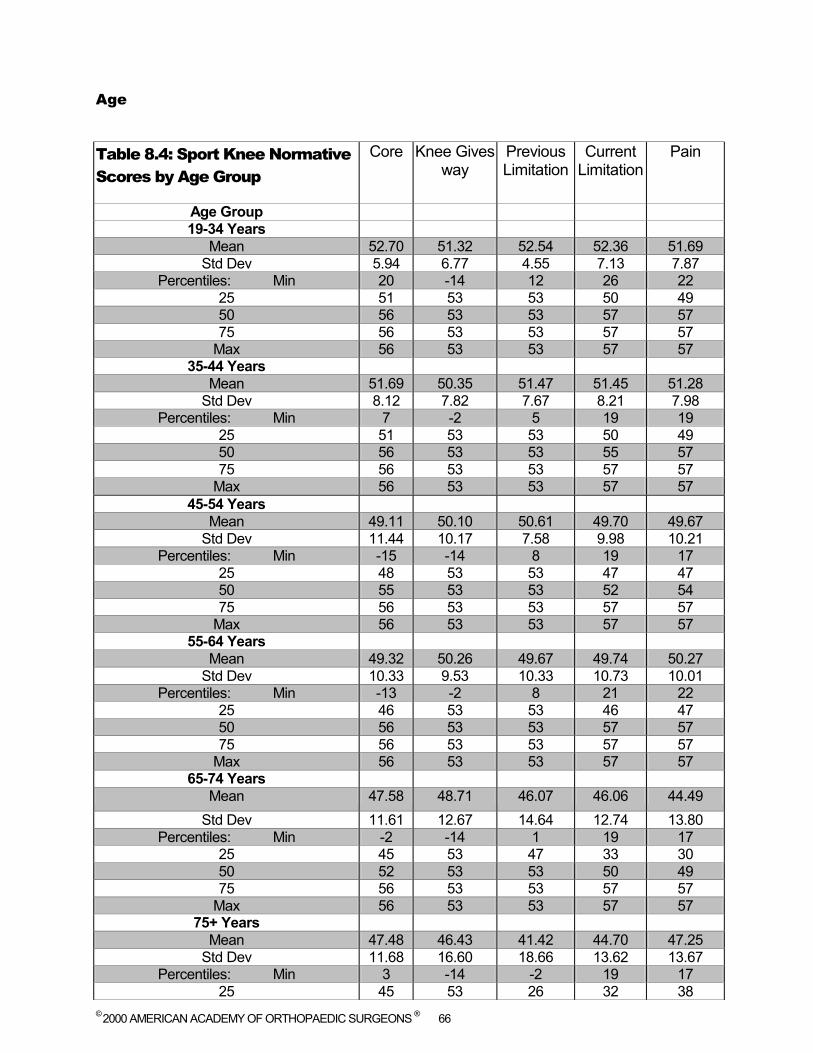
© 2000 AMERICAN ACADEMY OF ORTHOPAEDIC SURGEONS ® 66
Age
Table 8.4: Sport Knee Normative Scores by Age Group
Core Knee Gives way
Previous Limitation
Current Limitation
Pain
Age Group 19-34 Years
Mean 52.70 51.32 52.54 52.36 51.69 Std Dev 5.94 6.77 4.55 7.13 7.87
Percentiles: Min 20 -14 12 26 22 25 51 53 53 50 49 50 56 53 53 57 57 75 56 53 53 57 57
Max 56 53 53 57 57 35-44 Years
Mean 51.69 50.35 51.47 51.45 51.28 Std Dev 8.12 7.82 7.67 8.21 7.98
Percentiles: Min 7 -2 5 19 19 25 51 53 53 50 49 50 56 53 53 55 57 75 56 53 53 57 57
Max 56 53 53 57 57 45-54 Years
Mean 49.11 50.10 50.61 49.70 49.67 Std Dev 11.44 10.17 7.58 9.98 10.21
Percentiles: Min -15 -14 8 19 17 25 48 53 53 47 47 50 55 53 53 52 54 75 56 53 53 57 57
Max 56 53 53 57 57 55-64 Years
Mean 49.32 50.26 49.67 49.74 50.27 Std Dev 10.33 9.53 10.33 10.73 10.01
Percentiles: Min -13 -2 8 21 22 25 46 53 53 46 47 50 56 53 53 57 57 75 56 53 53 57 57
Max 56 53 53 57 57 65-74 Years
Mean 47.58 48.71 46.07 46.06 44.49 Std Dev 11.61 12.67 14.64 12.74 13.80
Percentiles: Min -2 -14 1 19 17 25 45 53 47 33 30 50 52 53 53 50 49 75 56 53 53 57 57
Max 56 53 53 57 57 75+ Years
Mean 47.48 46.43 41.42 44.70 47.25 Std Dev 11.68 16.60 18.66 13.62 13.67
Percentiles: Min 3 -14 -2 19 17 25 45 53 26 32 38
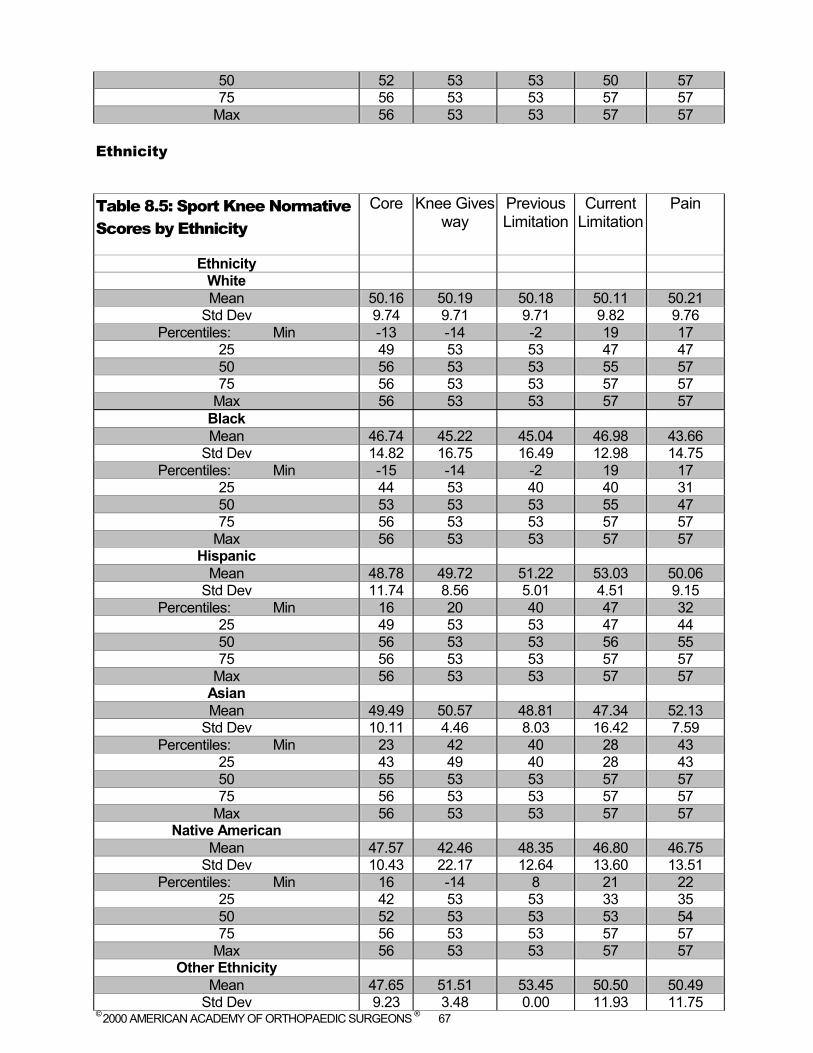
© 2000 AMERICAN ACADEMY OF ORTHOPAEDIC SURGEONS ® 67
50 52 53 53 50 57 75 56 53 53 57 57
Max 56 53 53 57 57 Ethnicity
Table 8.5: Sport Knee Normative Scores by Ethnicity
Core Knee Gives way
Previous Limitation
Current Limitation
Pain
Ethnicity White Mean 50.16 50.19 50.18 50.11 50.21
Std Dev 9.74 9.71 9.71 9.82 9.76 Percentiles: Min -13 -14 -2 19 17
25 49 53 53 47 47 50 56 53 53 55 57 75 56 53 53 57 57
Max 56 53 53 57 57 Black Mean 46.74 45.22 45.04 46.98 43.66
Std Dev 14.82 16.75 16.49 12.98 14.75 Percentiles: Min -15 -14 -2 19 17
25 44 53 40 40 31 50 53 53 53 55 47 75 56 53 53 57 57
Max 56 53 53 57 57 Hispanic
Mean 48.78 49.72 51.22 53.03 50.06 Std Dev 11.74 8.56 5.01 4.51 9.15
Percentiles: Min 16 20 40 47 32 25 49 53 53 47 44 50 56 53 53 56 55 75 56 53 53 57 57
Max 56 53 53 57 57 Asian Mean 49.49 50.57 48.81 47.34 52.13
Std Dev 10.11 4.46 8.03 16.42 7.59 Percentiles: Min 23 42 40 28 43
25 43 49 40 28 43 50 55 53 53 57 57 75 56 53 53 57 57
Max 56 53 53 57 57 Native American
Mean 47.57 42.46 48.35 46.80 46.75 Std Dev 10.43 22.17 12.64 13.60 13.51
Percentiles: Min 16 -14 8 21 22 25 42 53 53 33 35 50 52 53 53 53 54 75 56 53 53 57 57
Max 56 53 53 57 57 Other Ethnicity
Mean 47.65 51.51 53.45 50.50 50.49 Std Dev 9.23 3.48 0.00 11.93 11.75
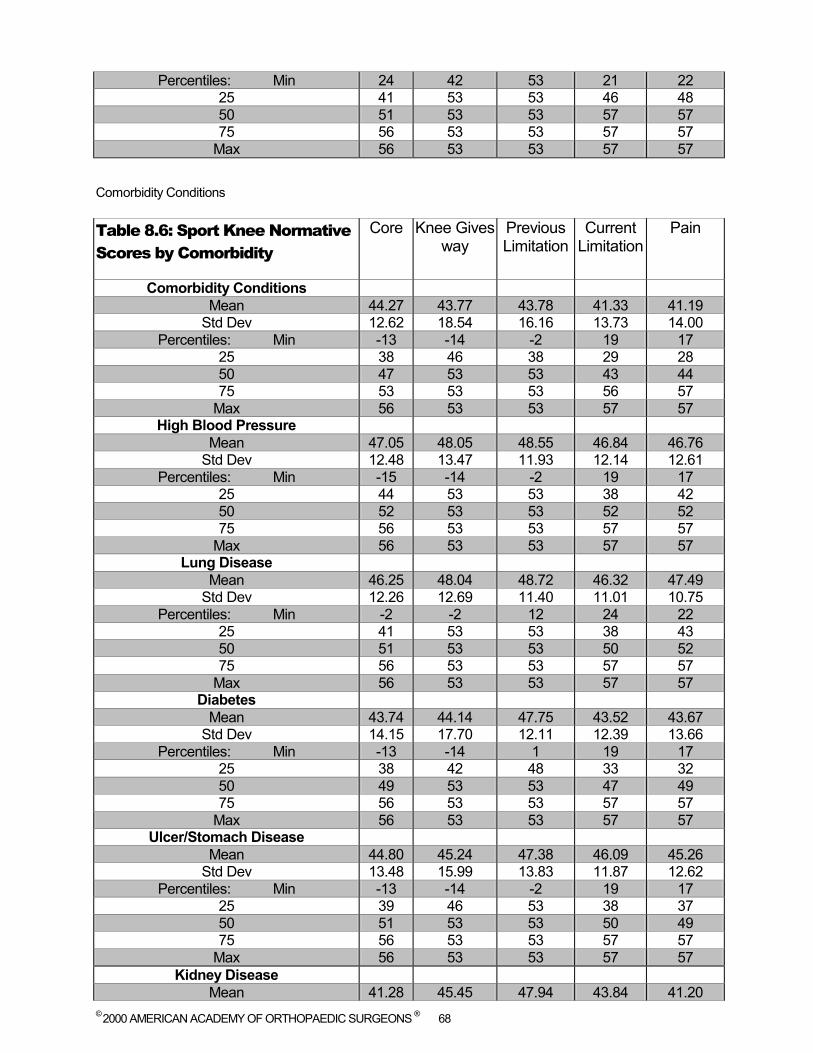
© 2000 AMERICAN ACADEMY OF ORTHOPAEDIC SURGEONS ® 68
Percentiles: Min 24 42 53 21 22 25 41 53 53 46 48 50 51 53 53 57 57 75 56 53 53 57 57
Max 56 53 53 57 57
Comorbidity Conditions Table 8.6: Sport Knee Normative Scores by Comorbidity
Core Knee Gives way
Previous Limitation
Current Limitation
Pain
Comorbidity Conditions Mean 44.27 43.77 43.78 41.33 41.19
Std Dev 12.62 18.54 16.16 13.73 14.00 Percentiles: Min -13 -14 -2 19 17
25 38 46 38 29 28 50 47 53 53 43 44 75 53 53 53 56 57
Max 56 53 53 57 57 High Blood Pressure
Mean 47.05 48.05 48.55 46.84 46.76 Std Dev 12.48 13.47 11.93 12.14 12.61
Percentiles: Min -15 -14 -2 19 17 25 44 53 53 38 42 50 52 53 53 52 52 75 56 53 53 57 57
Max 56 53 53 57 57 Lung Disease
Mean 46.25 48.04 48.72 46.32 47.49 Std Dev 12.26 12.69 11.40 11.01 10.75
Percentiles: Min -2 -2 12 24 22 25 41 53 53 38 43 50 51 53 53 50 52 75 56 53 53 57 57
Max 56 53 53 57 57 Diabetes
Mean 43.74 44.14 47.75 43.52 43.67 Std Dev 14.15 17.70 12.11 12.39 13.66
Percentiles: Min -13 -14 1 19 17 25 38 42 48 33 32 50 49 53 53 47 49 75 56 53 53 57 57
Max 56 53 53 57 57 Ulcer/Stomach Disease
Mean 44.80 45.24 47.38 46.09 45.26 Std Dev 13.48 15.99 13.83 11.87 12.62
Percentiles: Min -13 -14 -2 19 17 25 39 46 53 38 37 50 51 53 53 50 49 75 56 53 53 57 57
Max 56 53 53 57 57 Kidney Disease
Mean 41.28 45.45 47.94 43.84 41.20
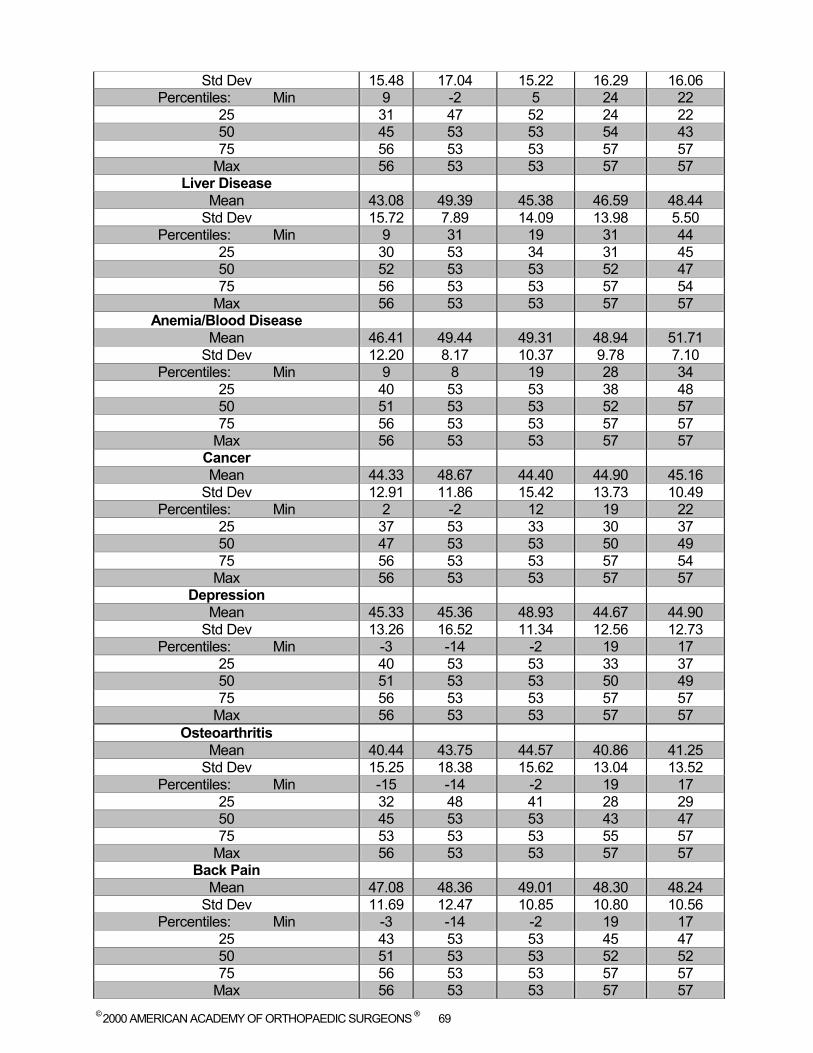
© 2000 AMERICAN ACADEMY OF ORTHOPAEDIC SURGEONS ® 69
Std Dev 15.48 17.04 15.22 16.29 16.06 Percentiles: Min 9 -2 5 24 22
25 31 47 52 24 22 50 45 53 53 54 43 75 56 53 53 57 57
Max 56 53 53 57 57 Liver Disease
Mean 43.08 49.39 45.38 46.59 48.44 Std Dev 15.72 7.89 14.09 13.98 5.50
Percentiles: Min 9 31 19 31 44 25 30 53 34 31 45 50 52 53 53 52 47 75 56 53 53 57 54
Max 56 53 53 57 57 Anemia/Blood Disease
Mean 46.41 49.44 49.31 48.94 51.71 Std Dev 12.20 8.17 10.37 9.78 7.10
Percentiles: Min 9 8 19 28 34 25 40 53 53 38 48 50 51 53 53 52 57 75 56 53 53 57 57
Max 56 53 53 57 57 Cancer Mean 44.33 48.67 44.40 44.90 45.16
Std Dev 12.91 11.86 15.42 13.73 10.49 Percentiles: Min 2 -2 12 19 22
25 37 53 33 30 37 50 47 53 53 50 49 75 56 53 53 57 54
Max 56 53 53 57 57 Depression
Mean 45.33 45.36 48.93 44.67 44.90 Std Dev 13.26 16.52 11.34 12.56 12.73
Percentiles: Min -3 -14 -2 19 17 25 40 53 53 33 37 50 51 53 53 50 49 75 56 53 53 57 57
Max 56 53 53 57 57 Osteoarthritis
Mean 40.44 43.75 44.57 40.86 41.25 Std Dev 15.25 18.38 15.62 13.04 13.52
Percentiles: Min -15 -14 -2 19 17 25 32 48 41 28 29 50 45 53 53 43 47 75 53 53 53 55 57
Max 56 53 53 57 57 Back Pain
Mean 47.08 48.36 49.01 48.30 48.24 Std Dev 11.69 12.47 10.85 10.80 10.56
Percentiles: Min -3 -14 -2 19 17 25 43 53 53 45 47 50 51 53 53 52 52 75 56 53 53 57 57
Max 56 53 53 57 57

© 2000 AMERICAN ACADEMY OF ORTHOPAEDIC SURGEONS ® 70
Rheumatoid Arthritis Mean 39.42 42.81 42.09 41.39 41.83
Std Dev 15.28 18.27 16.37 11.94 13.30 Percentiles: Min -13 -14 1 19 17
25 31 42 29 28 29 50 42 53 53 45 44 75 53 53 53 52 57
Max 56 53 53 57 57 Other Medical Problem
Mean 47.72 48.34 50.50 47.95 47.38 Std Dev 11.50 12.33 8.74 11.93 12.22
Percentiles: Min 2 -14 5 19 17 25 44 53 53 43 42 50 53 53 53 55 54 75 56 53 53 57 57
Max 56 53 53 57 57
© 2000 AMERICAN ACADEMY OF ORTHOPAEDIC SURGEONS ® 71
CHAPTER SIX: THE PEDIATRIC MEASURES
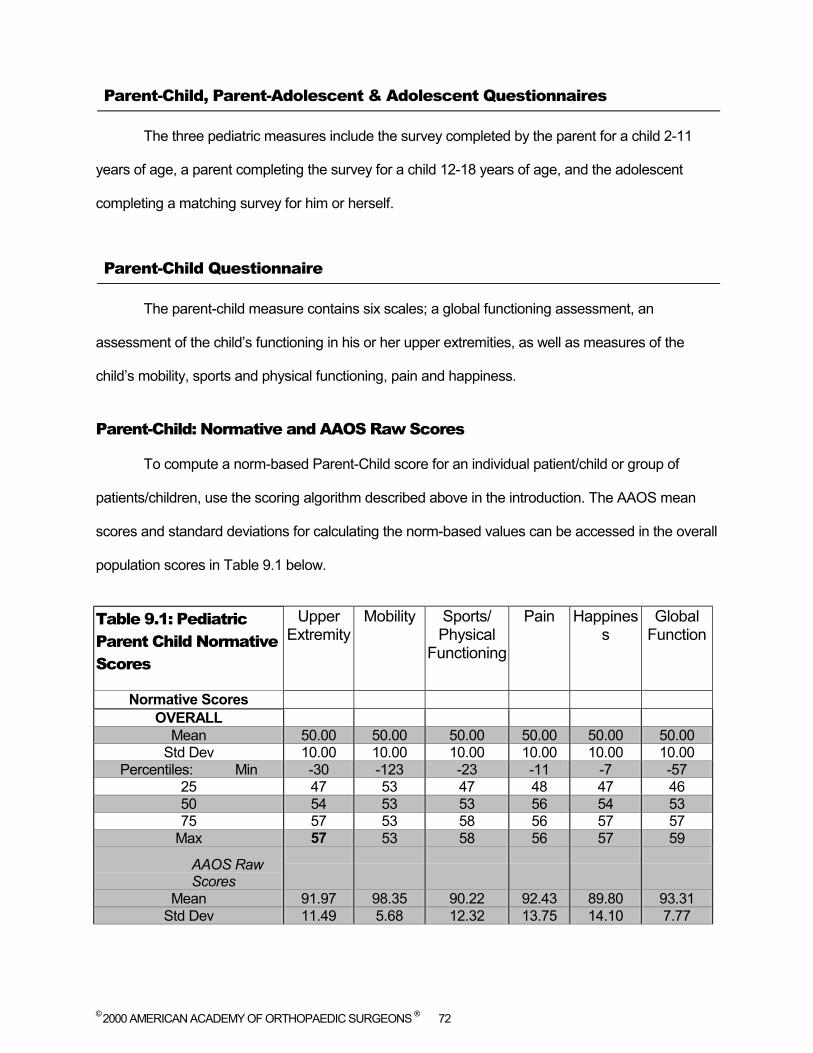
© 2000 AMERICAN ACADEMY OF ORTHOPAEDIC SURGEONS ® 72
Parent-Child, Parent-Adolescent & Adolescent Questionnaires
The three pediatric measures include the survey completed by the parent for a child 2-11
years of age, a parent completing the survey for a child 12-18 years of age, and the adolescent
completing a matching survey for him or herself.
Parent-Child Questionnaire
The parent-child measure contains six scales; a global functioning assessment, an
assessment of the child’s functioning in his or her upper extremities, as well as measures of the
child’s mobility, sports and physical functioning, pain and happiness.
Parent-Child: Normative and AAOS Raw Scores
To compute a norm-based Parent-Child score for an individual patient/child or group of
patients/children, use the scoring algorithm described above in the introduction. The AAOS mean
scores and standard deviations for calculating the norm-based values can be accessed in the overall
population scores in Table 9.1 below.
Table 9.1: Pediatric Parent Child Normative Scores
Upper Extremity
Mobility Sports/ Physical
Functioning
Pain Happiness
Global Function
Normative Scores OVERALL
Mean 50.00 50.00 50.00 50.00 50.00 50.00 Std Dev 10.00 10.00 10.00 10.00 10.00 10.00
Percentiles: Min -30 -123 -23 -11 -7 -57 25 47 53 47 48 47 46 50 54 53 53 56 54 53 75 57 53 58 56 57 57
Max 57 53 58 56 57 59
AAOS Raw Scores
Mean 91.97 98.35 90.22 92.43 89.80 93.31 Std Dev 11.49 5.68 12.32 13.75 14.10 7.77

© 2000 AMERICAN ACADEMY OF ORTHOPAEDIC SURGEONS ® 73
For example, if the patient’s AAOS score on the Parent-Child Mobility scale is 83.6, then that
individual’s norm-based Parent-Child Mobility scale score is calculated as:
((83.6 – 98.35) /5.68 *10) +50 = 24.3. In this instance, the patient’s normalized score is
approximately 2½ standard deviations from the overall general population mean.
Parent-Child: Normative Scores by Demographic Markers
Gender
Table 9.2: Pediatric Parent Child Normative Scores by Gender
Upper Extremity
Mobility Sports/ Physical
Functioning
Pain Happiness
Global Function
Gender Male Mean 49.62 49.45 49.88 49.85 49.86 49.65
Std Dev 10.43 11.77 10.34 10.40 10.15 10.69 Percentiles: Min -30 -123 -23 -11 -7 -57
25 47 52 46 50 47 46 50 54 53 53 56 54 53 75 57 53 58 56 57 57
Max 57 53 58 56 57 59 Female Mean 50.40 50.58 50.12 50.16 50.15 50.37
Std Dev 9.51 7.68 9.64 9.56 9.85 9.21 Percentiles: Min -30 -105 -14 2 -2 -39
25 47 53 47 48 47 47 50 54 53 53 56 54 53 75 57 53 58 56 57 57
Max 57 53 58 56 57 59 Ethnicity
Table 9.3: Pediatric Parent Child Normative Scores by Ethnicity
Upper Extremity
Mobility Sports/ Physical
Functioning
Pain Happiness
Global Function
Ethnicity White Mean 50.27 50.20 50.18 50.14 50.02 50.29
Std Dev 9.46 9.28 9.77 9.82 9.88 9.45 Percentiles: Min -30 -123 -22 -11 -7 -50
25 47 53 47 50 47 47 50 54 53 53 56 54 53 75 57 53 58 56 57 57
Max 57 53 58 56 57 59

© 2000 AMERICAN ACADEMY OF ORTHOPAEDIC SURGEONS ® 74
Black Mean 48.52 47.84 47.97 48.63 49.99 47.60
Std Dev 14.08 18.53 12.97 11.56 9.43 15.48 Percentiles: Min -30 -123 -23 10 15 -57
25 47 48 44 45 47 46 50 54 53 53 56 54 52 75 57 53 56 56 57 57
Max 57 53 58 56 57 59 Hispanic
Mean 49.93 48.96 49.47 50.65 50.69 49.77 Std Dev 8.63 7.76 10.06 10.07 10.81 9.80
Percentiles: Min 20 18 5 5 11 7 25 47 48 47 50 50 47 50 54 53 53 56 54 52 75 57 53 58 56 57 56
Max 57 53 58 56 57 59 Asian Mean 46.85 49.38 51.05 53.46 52.58 50.60
Std Dev 12.33 7.07 8.04 5.50 7.21 9.03 Percentiles: Min 20 21 28 29 29 23
25 36 48 48 56 49 47 50 52 53 54 56 57 55 75 57 53 58 56 57 57
Max 57 53 58 56 57 59 Native American
Mean 49.06 49.82 47.98 49.60 48.87 48.73 Std Dev 9.13 7.19 10.44 11.11 11.58 10.45
Percentiles: Min 22 18 5 5 11 7 25 45 53 42 50 43 45 50 52 53 51 56 54 52 75 57 53 55 56 57 56
Max 57 53 58 56 57 59 Other Ethnicity
Mean 46.27 47.31 47.69 45.87 43.23 45.19 Std Dev 14.56 10.63 12.88 12.11 16.44 13.58
Percentiles: Min 3 18 12 13 4 8 25 36 48 43 42 33 37 50 54 53 53 48 49 50 75 57 53 58 56 57 56
Max 57 53 58 56 57 59 Comorbidity Conditions
Table 9.4: Pediatric Parent Child Normative Scores by Comorbidity
Upper Extremity
Mobility Sports/ Physical
Functioning
Pain Happiness
Global Function
Comorbidity Conditions Juvenile Arthritis
(1-2 Joints)
Mean 54.37 52.90 44.14 38.20 34.19 43.17 Std Dev 3.59 0.00 6.42 12.02 13.11 1.82
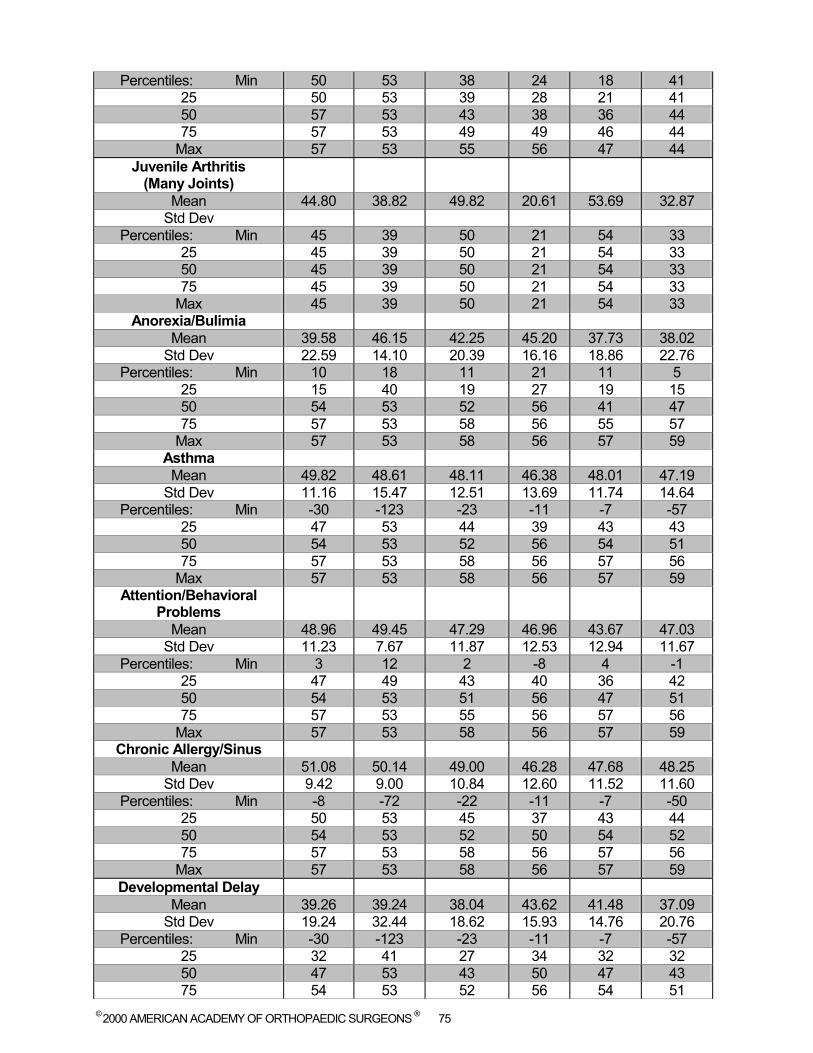
© 2000 AMERICAN ACADEMY OF ORTHOPAEDIC SURGEONS ® 75
Percentiles: Min 50 53 38 24 18 41 25 50 53 39 28 21 41 50 57 53 43 38 36 44 75 57 53 49 49 46 44
Max 57 53 55 56 47 44 Juvenile Arthritis
(Many Joints)
Mean 44.80 38.82 49.82 20.61 53.69 32.87 Std Dev
Percentiles: Min 45 39 50 21 54 33 25 45 39 50 21 54 33 50 45 39 50 21 54 33 75 45 39 50 21 54 33
Max 45 39 50 21 54 33 Anorexia/Bulimia
Mean 39.58 46.15 42.25 45.20 37.73 38.02 Std Dev 22.59 14.10 20.39 16.16 18.86 22.76
Percentiles: Min 10 18 11 21 11 5 25 15 40 19 27 19 15 50 54 53 52 56 41 47 75 57 53 58 56 55 57
Max 57 53 58 56 57 59 Asthma Mean 49.82 48.61 48.11 46.38 48.01 47.19
Std Dev 11.16 15.47 12.51 13.69 11.74 14.64 Percentiles: Min -30 -123 -23 -11 -7 -57
25 47 53 44 39 43 43 50 54 53 52 56 54 51 75 57 53 58 56 57 56
Max 57 53 58 56 57 59 Attention/Behavioral
Problems
Mean 48.96 49.45 47.29 46.96 43.67 47.03 Std Dev 11.23 7.67 11.87 12.53 12.94 11.67
Percentiles: Min 3 12 2 -8 4 -1 25 47 49 43 40 36 42 50 54 53 51 56 47 51 75 57 53 55 56 57 56
Max 57 53 58 56 57 59 Chronic Allergy/Sinus
Mean 51.08 50.14 49.00 46.28 47.68 48.25 Std Dev 9.42 9.00 10.84 12.60 11.52 11.60
Percentiles: Min -8 -72 -22 -11 -7 -50 25 50 53 45 37 43 44 50 54 53 52 50 54 52 75 57 53 58 56 57 56
Max 57 53 58 56 57 59 Developmental Delay
Mean 39.26 39.24 38.04 43.62 41.48 37.09 Std Dev 19.24 32.44 18.62 15.93 14.76 20.76
Percentiles: Min -30 -123 -23 -11 -7 -57 25 32 41 27 34 32 32 50 47 53 43 50 47 43 75 54 53 52 56 54 51

© 2000 AMERICAN ACADEMY OF ORTHOPAEDIC SURGEONS ® 76
Max 57 53 58 56 57 59 Mental Retardation
Mean 15.16 8.48 20.15 37.50 33.97 14.93 Std Dev 28.36 61.74 20.72 22.19 13.01 30.70
Percentiles: Min -30 -123 -23 -8 15 -57 25 4 14 9 22 22 3 50 13 32 22 50 38 21 75 38 50 34 56 46 37
Max 57 53 52 56 54 55 Diabetes
Mean 52.34 52.02 52.79 48.96 46.60 51.96 Std Dev 4.22 2.16 3.19 8.77 7.77 5.61
Percentiles: Min 47 48 50 34 36 43 25 49 52 50 40 41 48 50 52 53 51 53 45 52 75 57 53 56 56 55 57
Max 57 53 58 56 57 59 Epilepsy
Mean 32.58 24.20 33.00 42.61 38.76 31.82 Std Dev 26.78 53.73 23.83 20.71 17.06 30.89
Percentiles: Min -30 -123 -23 -11 -7 -57 25 20 26 19 36 27 22 50 47 48 43 56 47 42 75 54 53 51 56 54 52
Max 57 53 58 56 57 57 Hearing
Impairment/Deafness
Mean 46.61 46.23 48.63 43.68 46.60 46.27 Std Dev 16.02 25.18 10.71 15.07 10.31 12.71
Percentiles: Min -30 -123 6 -6 22 3 25 42 48 45 32 40 42 50 53 53 51 50 50 48 75 57 53 55 56 55 56
Max 57 53 58 56 57 59 Heart Problems
Mean 39.80 43.07 40.15 43.99 43.86 38.31 Std Dev 17.00 22.07 18.07 17.32 14.28 21.37
Percentiles: Min -8 -72 -22 -11 -7 -50 25 28 38 32 37 34 28 50 45 53 46 56 43 42 75 54 53 55 56 57 55
Max 57 53 58 56 57 59 Learning Problems
Mean 43.34 42.57 42.25 42.62 39.39 40.24 Std Dev 18.83 29.27 17.11 15.66 15.27 19.84
Percentiles: Min -30 -123 -23 -11 -7 -57 25 39 42 34 32 29 33 50 51 53 49 50 43 46 75 57 53 55 56 54 54
Max 57 53 58 56 57 59 Sleep Disturbance
Mean 46.31 44.00 43.70 42.71 42.11 41.54 Std Dev 15.96 25.36 16.34 15.25 15.99 19.59
Percentiles: Min -30 -123 -23 -11 -7 -57
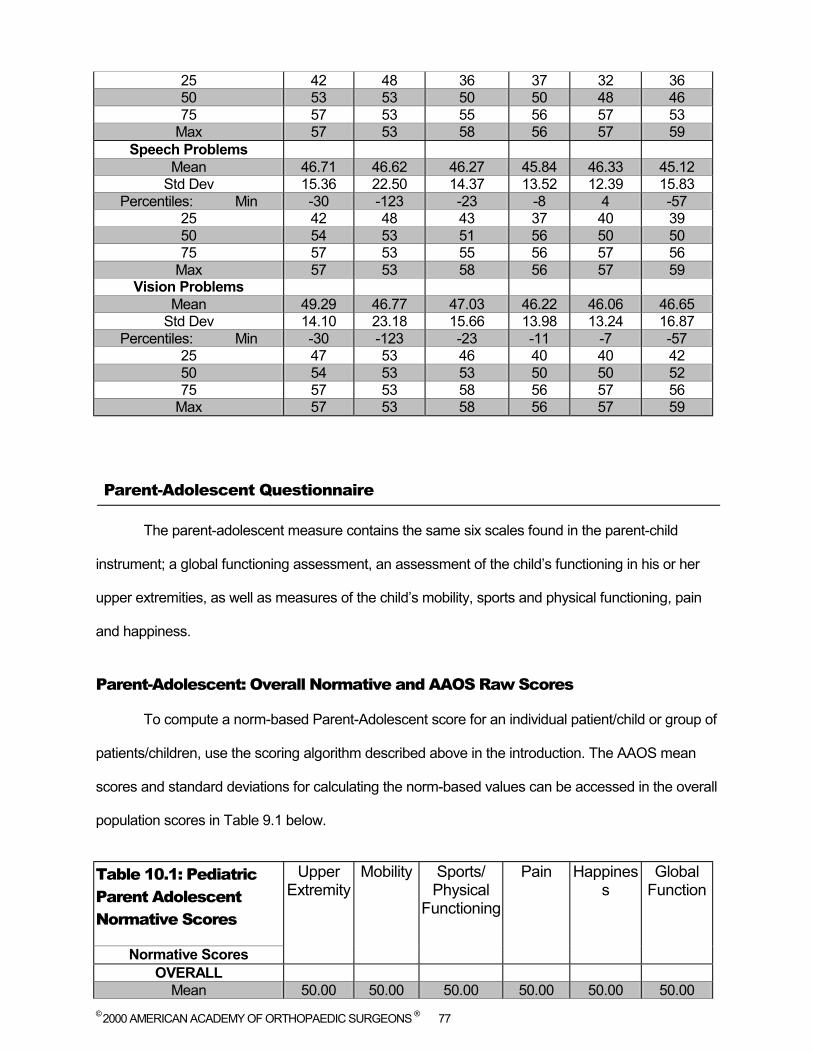
© 2000 AMERICAN ACADEMY OF ORTHOPAEDIC SURGEONS ® 77
25 42 48 36 37 32 36 50 53 53 50 50 48 46 75 57 53 55 56 57 53
Max 57 53 58 56 57 59 Speech Problems
Mean 46.71 46.62 46.27 45.84 46.33 45.12 Std Dev 15.36 22.50 14.37 13.52 12.39 15.83
Percentiles: Min -30 -123 -23 -8 4 -57 25 42 48 43 37 40 39 50 54 53 51 56 50 50 75 57 53 55 56 57 56
Max 57 53 58 56 57 59 Vision Problems
Mean 49.29 46.77 47.03 46.22 46.06 46.65 Std Dev 14.10 23.18 15.66 13.98 13.24 16.87
Percentiles: Min -30 -123 -23 -11 -7 -57 25 47 53 46 40 40 42 50 54 53 53 50 50 52 75 57 53 58 56 57 56
Max 57 53 58 56 57 59
Parent-Adolescent Questionnaire
The parent-adolescent measure contains the same six scales found in the parent-child
instrument; a global functioning assessment, an assessment of the child’s functioning in his or her
upper extremities, as well as measures of the child’s mobility, sports and physical functioning, pain
and happiness.
Parent-Adolescent: Overall Normative and AAOS Raw Scores
To compute a norm-based Parent-Adolescent score for an individual patient/child or group of
patients/children, use the scoring algorithm described above in the introduction. The AAOS mean
scores and standard deviations for calculating the norm-based values can be accessed in the overall
population scores in Table 9.1 below.
Table 10.1: Pediatric Parent Adolescent Normative Scores
Upper Extremity
Mobility Sports/ Physical
Functioning
Pain Happiness
Global Function
Normative Scores OVERALL
Mean 50.00 50.00 50.00 50.00 50.00 50.00
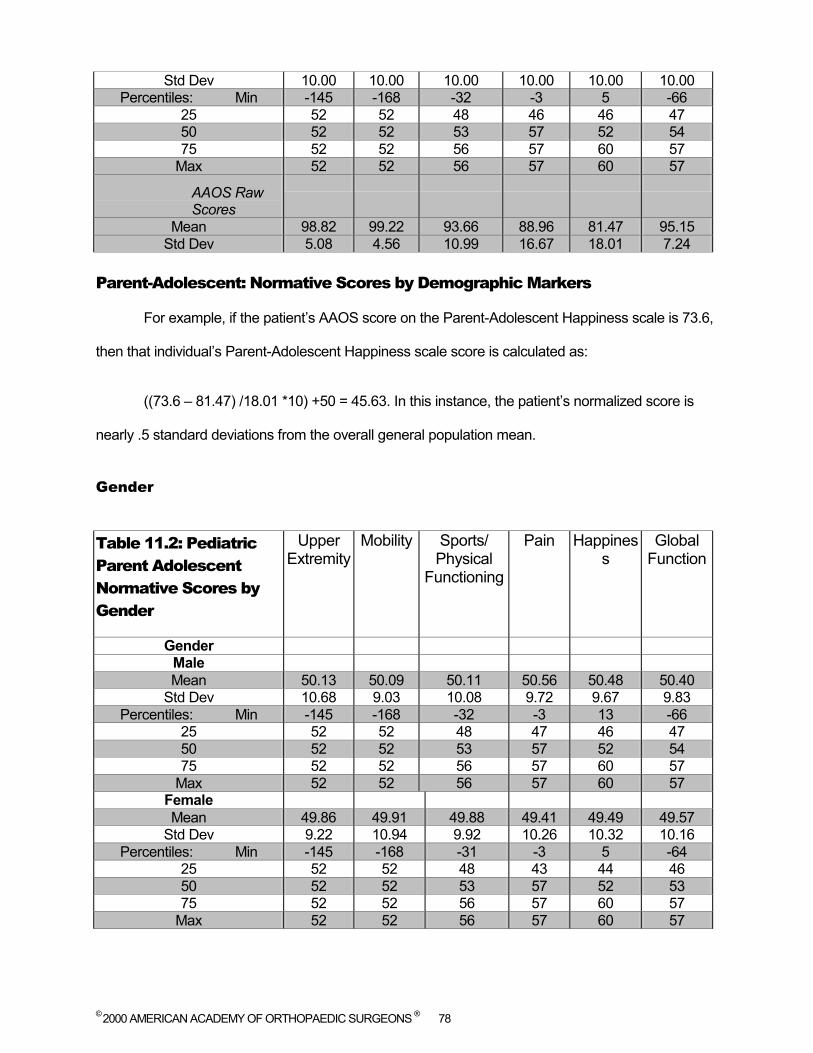
© 2000 AMERICAN ACADEMY OF ORTHOPAEDIC SURGEONS ® 78
Std Dev 10.00 10.00 10.00 10.00 10.00 10.00 Percentiles: Min -145 -168 -32 -3 5 -66
25 52 52 48 46 46 47 50 52 52 53 57 52 54 75 52 52 56 57 60 57
Max 52 52 56 57 60 57
AAOS Raw Scores
Mean 98.82 99.22 93.66 88.96 81.47 95.15 Std Dev 5.08 4.56 10.99 16.67 18.01 7.24
Parent-Adolescent: Normative Scores by Demographic Markers
For example, if the patient’s AAOS score on the Parent-Adolescent Happiness scale is 73.6,
then that individual’s Parent-Adolescent Happiness scale score is calculated as:
((73.6 – 81.47) /18.01 *10) +50 = 45.63. In this instance, the patient’s normalized score is
nearly .5 standard deviations from the overall general population mean.
Gender
Table 11.2: Pediatric Parent Adolescent Normative Scores by Gender
Upper Extremity
Mobility Sports/ Physical
Functioning
Pain Happiness
Global Function
Gender Male Mean 50.13 50.09 50.11 50.56 50.48 50.40
Std Dev 10.68 9.03 10.08 9.72 9.67 9.83 Percentiles: Min -145 -168 -32 -3 13 -66
25 52 52 48 47 46 47 50 52 52 53 57 52 54 75 52 52 56 57 60 57
Max 52 52 56 57 60 57 Female Mean 49.86 49.91 49.88 49.41 49.49 49.57
Std Dev 9.22 10.94 9.92 10.26 10.32 10.16 Percentiles: Min -145 -168 -31 -3 5 -64
25 52 52 48 43 44 46 50 52 52 53 57 52 53 75 52 52 56 57 60 57
Max 52 52 56 57 60 57

© 2000 AMERICAN ACADEMY OF ORTHOPAEDIC SURGEONS ® 79
Ethnicity
Table 11.3: Pediatric Parent Adolescent Normative Scores by Ethnicity
Upper Extremity
Mobility Sports/ Physical
Functioning
Pain Happiness
Global Function
Ethnicity White Mean 50.16 49.98 50.02 50.03 49.96 50.04
Std Dev 9.69 10.45 10.02 10.02 9.93 10.10 Percentiles: Min -145 -168 -32 -3 5 -66
25 52 52 48 46 44 47 50 52 52 53 57 52 54 75 52 52 56 57 60 57
Max 52 52 56 57 60 57 Black Mean 48.92 50.13 50.06 49.35 50.66 49.54
Std Dev 14.38 5.53 8.97 10.98 10.00 9.62 Percentiles: Min -119 12 5 7 24 8
25 52 52 48 43 44 46 50 52 52 53 57 55 54 75 52 52 56 57 60 57
Max 52 52 56 57 60 57 Hispanic
Mean 49.50 50.40 49.43 48.29 49.39 49.06 Std Dev 8.92 4.17 10.73 10.90 10.77 9.55
Percentiles: Min -13 25 -11 15 8 7 25 52 52 48 41 43 44 50 52 52 53 57 52 54 75 52 52 56 57 58 57
Max 52 52 56 57 60 57 Asian Mean 49.37 50.78 48.97 49.83 48.81 49.58
Std Dev 4.95 2.98 8.55 9.59 11.27 7.10 Percentiles: Min 37 39 13 26 13 32
25 44 52 46 46 44 47 50 52 52 52 52 52 51 75 52 52 56 57 58 55
Max 52 52 56 57 60 57 Native American
Mean 48.91 47.49 47.95 48.80 48.67 47.91 Std Dev 10.53 12.89 11.92 11.44 11.19 12.34
Percentiles: Min -5 -34 -12 10 8 -17 25 52 52 46 41 41 42 50 52 52 52 57 49 53 75 52 52 56 57 58 57
Max 52 52 56 57 60 57 Other Ethnicity
Mean 45.39 50.46 49.09 47.91 49.40 47.72 Std Dev 24.67 4.20 9.24 10.76 10.01 10.42
Percentiles: Min -119 32 17 15 24 7
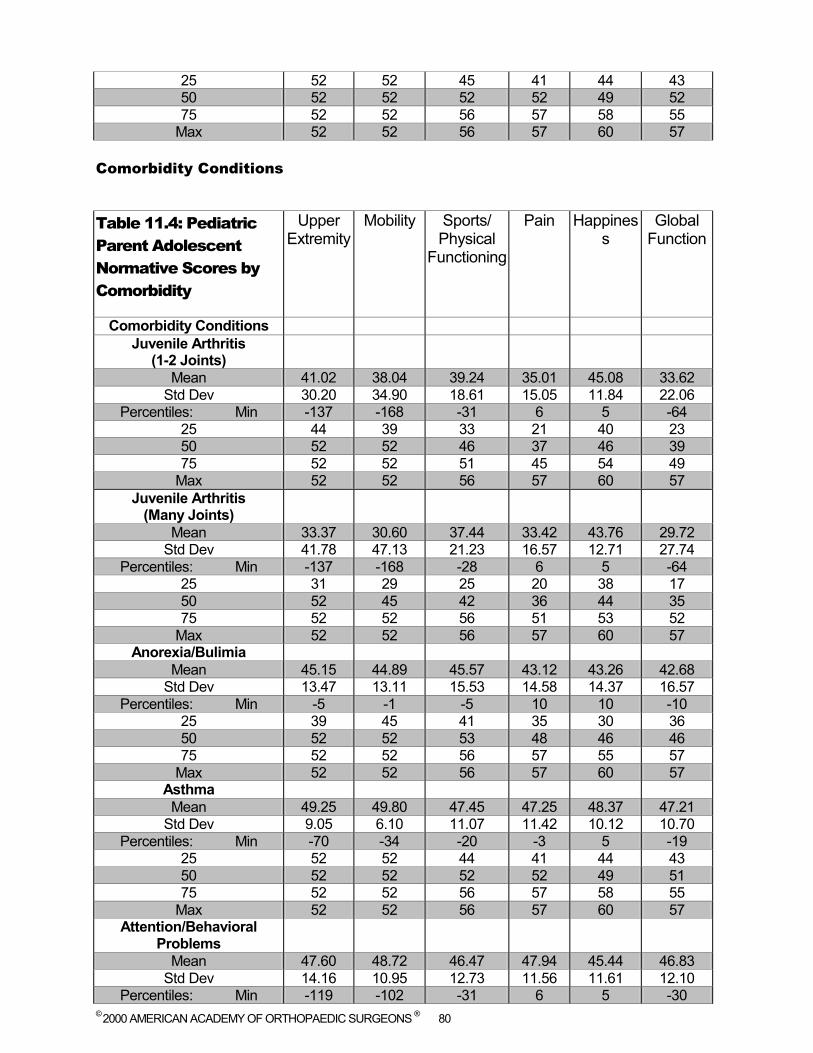
© 2000 AMERICAN ACADEMY OF ORTHOPAEDIC SURGEONS ® 80
25 52 52 45 41 44 43 50 52 52 52 52 49 52 75 52 52 56 57 58 55
Max 52 52 56 57 60 57 Comorbidity Conditions
Table 11.4: Pediatric Parent Adolescent Normative Scores by Comorbidity
Upper Extremity
Mobility Sports/ Physical
Functioning
Pain Happiness
Global Function
Comorbidity Conditions Juvenile Arthritis
(1-2 Joints)
Mean 41.02 38.04 39.24 35.01 45.08 33.62 Std Dev 30.20 34.90 18.61 15.05 11.84 22.06
Percentiles: Min -137 -168 -31 6 5 -64 25 44 39 33 21 40 23 50 52 52 46 37 46 39 75 52 52 51 45 54 49
Max 52 52 56 57 60 57 Juvenile Arthritis
(Many Joints)
Mean 33.37 30.60 37.44 33.42 43.76 29.72 Std Dev 41.78 47.13 21.23 16.57 12.71 27.74
Percentiles: Min -137 -168 -28 6 5 -64 25 31 29 25 20 38 17 50 52 45 42 36 44 35 75 52 52 56 51 53 52
Max 52 52 56 57 60 57 Anorexia/Bulimia
Mean 45.15 44.89 45.57 43.12 43.26 42.68 Std Dev 13.47 13.11 15.53 14.58 14.37 16.57
Percentiles: Min -5 -1 -5 10 10 -10 25 39 45 41 35 30 36 50 52 52 53 48 46 46 75 52 52 56 57 55 57
Max 52 52 56 57 60 57 Asthma Mean 49.25 49.80 47.45 47.25 48.37 47.21
Std Dev 9.05 6.10 11.07 11.42 10.12 10.70 Percentiles: Min -70 -34 -20 -3 5 -19
25 52 52 44 41 44 43 50 52 52 52 52 49 51 75 52 52 56 57 58 55
Max 52 52 56 57 60 57 Attention/Behavioral
Problems
Mean 47.60 48.72 46.47 47.94 45.44 46.83 Std Dev 14.16 10.95 12.73 11.56 11.61 12.10
Percentiles: Min -119 -102 -31 6 5 -30

© 2000 AMERICAN ACADEMY OF ORTHOPAEDIC SURGEONS ® 81
25 52 52 43 41 38 43 50 52 52 51 52 46 51 75 52 52 56 57 55 55
Max 52 52 56 57 60 57 Chronic Allergy/Sinus
Mean 48.97 48.90 47.69 46.57 48.27 46.81 Std Dev 13.26 14.05 12.28 11.76 10.30 12.73
Percentiles: Min -145 -168 -32 -3 5 -66 25 52 52 46 41 44 43 50 52 52 52 50 49 51 75 52 52 56 57 58 55
Max 52 52 56 57 60 57 Developmental Delay
Mean 39.53 43.76 38.45 46.63 42.81 40.82 Std Dev 28.66 28.58 18.93 12.50 13.03 19.33
Percentiles: Min -145 -168 -32 6 8 -66 25 37 52 29 37 33 36 50 52 52 46 52 46 47 75 52 52 52 57 55 53
Max 52 52 56 57 60 57 Mental Retardation
Mean 32.37 35.62 30.83 45.39 46.09 34.66 Std Dev 42.50 39.61 25.31 15.49 14.05 26.65
Percentiles: Min -145 -168 -32 6 8 -66 25 33 34 17 34 38 21 50 52 52 39 57 49 41 75 52 52 53 57 58 55
Max 52 52 56 57 60 57 Diabetes
Mean 49.48 46.90 48.26 48.22 49.80 47.77 Std Dev 11.49 10.14 10.00 13.05 8.79 12.84
Percentiles: Min -5 14 23 6 30 14 25 52 50 43 43 46 44 50 52 52 52 57 52 54 75 52 52 56 57 58 57
Max 52 52 56 57 60 57 Epilepsy
Mean 40.54 41.00 41.05 46.81 45.74 41.66 Std Dev 36.36 34.51 20.30 13.26 12.83 22.61
Percentiles: Min -145 -168 -31 16 8 -52 25 44 45 33 41 35 37 50 52 52 50 57 49 51 75 52 52 56 57 58 57
Max 52 52 56 57 60 57 Hearing
Impairment/Deafness
Mean 47.22 45.67 44.15 45.93 47.58 44.31 Std Dev 11.62 19.70 17.24 13.36 9.60 15.18
Percentiles: Min -30 -87 -26 6 19 -11 25 44 52 40 37 41 41 50 52 52 51 52 49 48 75 52 52 56 57 55 56
Max 52 52 56 57 60 57 Heart Problems
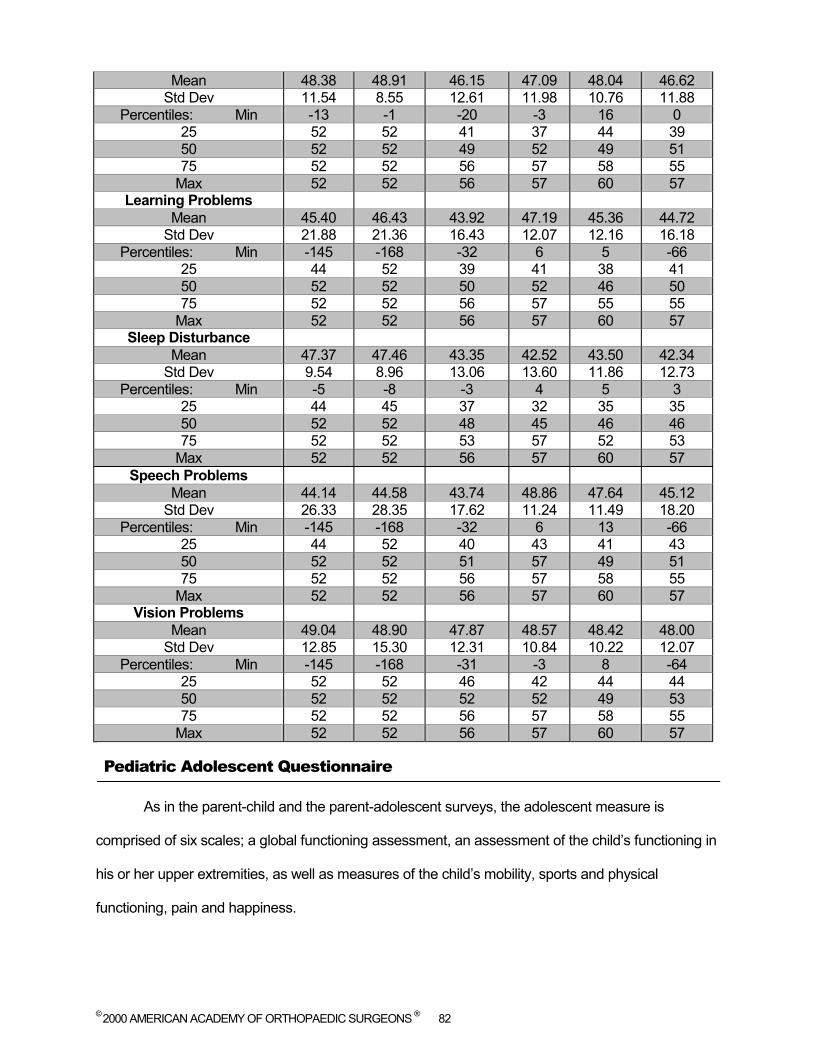
© 2000 AMERICAN ACADEMY OF ORTHOPAEDIC SURGEONS ® 82
Mean 48.38 48.91 46.15 47.09 48.04 46.62 Std Dev 11.54 8.55 12.61 11.98 10.76 11.88
Percentiles: Min -13 -1 -20 -3 16 0 25 52 52 41 37 44 39 50 52 52 49 52 49 51 75 52 52 56 57 58 55
Max 52 52 56 57 60 57 Learning Problems
Mean 45.40 46.43 43.92 47.19 45.36 44.72 Std Dev 21.88 21.36 16.43 12.07 12.16 16.18
Percentiles: Min -145 -168 -32 6 5 -66 25 44 52 39 41 38 41 50 52 52 50 52 46 50 75 52 52 56 57 55 55
Max 52 52 56 57 60 57 Sleep Disturbance
Mean 47.37 47.46 43.35 42.52 43.50 42.34 Std Dev 9.54 8.96 13.06 13.60 11.86 12.73
Percentiles: Min -5 -8 -3 4 5 3 25 44 45 37 32 35 35 50 52 52 48 45 46 46 75 52 52 53 57 52 53
Max 52 52 56 57 60 57 Speech Problems
Mean 44.14 44.58 43.74 48.86 47.64 45.12 Std Dev 26.33 28.35 17.62 11.24 11.49 18.20
Percentiles: Min -145 -168 -32 6 13 -66 25 44 52 40 43 41 43 50 52 52 51 57 49 51 75 52 52 56 57 58 55
Max 52 52 56 57 60 57 Vision Problems
Mean 49.04 48.90 47.87 48.57 48.42 48.00 Std Dev 12.85 15.30 12.31 10.84 10.22 12.07
Percentiles: Min -145 -168 -31 -3 8 -64 25 52 52 46 42 44 44 50 52 52 52 52 49 53 75 52 52 56 57 58 55
Max 52 52 56 57 60 57
Pediatric Adolescent Questionnaire
As in the parent-child and the parent-adolescent surveys, the adolescent measure is
comprised of six scales; a global functioning assessment, an assessment of the child’s functioning in
his or her upper extremities, as well as measures of the child’s mobility, sports and physical
functioning, pain and happiness.

© 2000 AMERICAN ACADEMY OF ORTHOPAEDIC SURGEONS ® 83
Adolescent: Overall Normative and AAOS Raw Scores
To compute a norm-based Adolescent score for an individual adolescent or group of
adolescents, use the scoring algorithm described above in the introduction. The AAOS mean scores
and standard deviations for calculating the norm-based values can be accessed in the overall
population scores in Table11.1 below.
Table 11.1: Pediatric Adolescent Normative Scores
Upper Extremity
Mobility Sports/ Physical
Functioning
Pain Happiness
Global Function
Adolescent
Normative Scores OVERALL
Mean 50.00 50.00 50.00 50.00 50.00 50.00 Std Dev 10.00 10.00 10.00 10.00 10.00 10.00
Percentiles: Min -150 -161 -48 23 3 11 25 53 52 51 46 46 45 50 53 52 55 57 52 56 75 53 52 55 57 57 58
Max 53 52 55 57 60 58
AAOS Raw Scores
Mean 98.71 99.05 95.51 89.31 81.83 95.88 Std Dev 4.73 4.70 9.74 14.79 17.59 5.38
For example, if the patient’s AAOS score on the Adolescent Happiness scale is 63.7, then
that individual’s Adolescent Happiness scale score is calculated as:
((63.7 – 81.83) /17.59 *10) +50 = 39.69. In this instance, the patient’s normalized score is just
greater than one standard deviations from the overall general population mean.
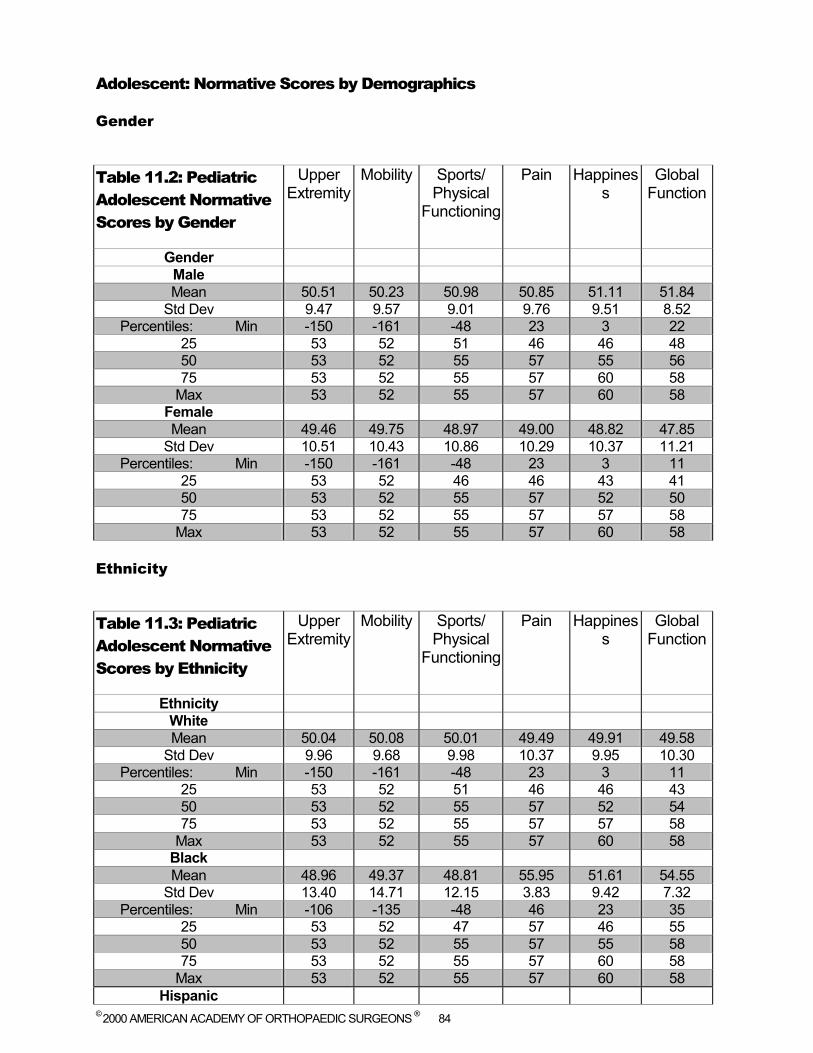
© 2000 AMERICAN ACADEMY OF ORTHOPAEDIC SURGEONS ® 84
Adolescent: Normative Scores by Demographics
Gender
Table 11.2: Pediatric Adolescent Normative Scores by Gender
Upper Extremity
Mobility Sports/ Physical
Functioning
Pain Happiness
Global Function
Gender Male Mean 50.51 50.23 50.98 50.85 51.11 51.84
Std Dev 9.47 9.57 9.01 9.76 9.51 8.52 Percentiles: Min -150 -161 -48 23 3 22
25 53 52 51 46 46 48 50 53 52 55 57 55 56 75 53 52 55 57 60 58
Max 53 52 55 57 60 58 Female Mean 49.46 49.75 48.97 49.00 48.82 47.85
Std Dev 10.51 10.43 10.86 10.29 10.37 11.21 Percentiles: Min -150 -161 -48 23 3 11
25 53 52 46 46 43 41 50 53 52 55 57 52 50 75 53 52 55 57 57 58
Max 53 52 55 57 60 58 Ethnicity
Table 11.3: Pediatric Adolescent Normative Scores by Ethnicity
Upper Extremity
Mobility Sports/ Physical
Functioning
Pain Happiness
Global Function
Ethnicity White Mean 50.04 50.08 50.01 49.49 49.91 49.58
Std Dev 9.96 9.68 9.98 10.37 9.95 10.30 Percentiles: Min -150 -161 -48 23 3 11
25 53 52 51 46 46 43 50 53 52 55 57 52 54 75 53 52 55 57 57 58
Max 53 52 55 57 60 58 Black Mean 48.96 49.37 48.81 55.95 51.61 54.55
Std Dev 13.40 14.71 12.15 3.83 9.42 7.32 Percentiles: Min -106 -135 -48 46 23 35
25 53 52 47 57 46 55 50 53 52 55 57 55 58 75 53 52 55 57 60 58
Max 53 52 55 57 60 58 Hispanic
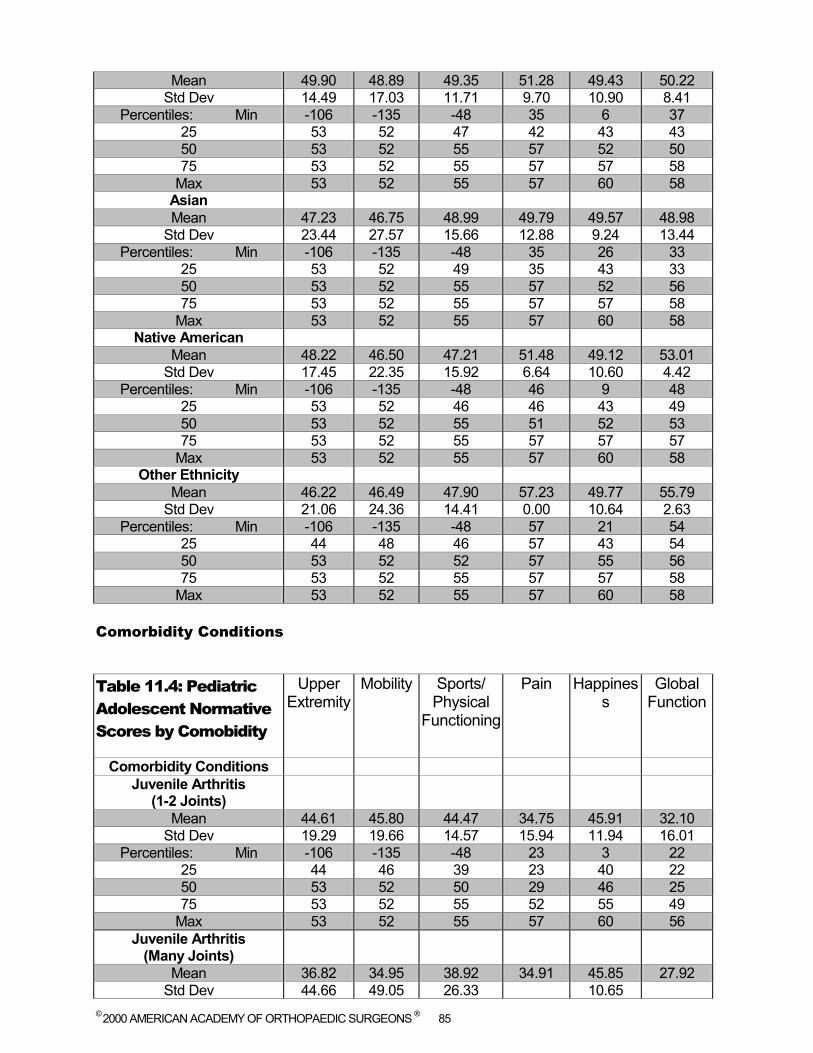
© 2000 AMERICAN ACADEMY OF ORTHOPAEDIC SURGEONS ® 85
Mean 49.90 48.89 49.35 51.28 49.43 50.22 Std Dev 14.49 17.03 11.71 9.70 10.90 8.41
Percentiles: Min -106 -135 -48 35 6 37 25 53 52 47 42 43 43 50 53 52 55 57 52 50 75 53 52 55 57 57 58
Max 53 52 55 57 60 58 Asian Mean 47.23 46.75 48.99 49.79 49.57 48.98
Std Dev 23.44 27.57 15.66 12.88 9.24 13.44 Percentiles: Min -106 -135 -48 35 26 33
25 53 52 49 35 43 33 50 53 52 55 57 52 56 75 53 52 55 57 57 58
Max 53 52 55 57 60 58 Native American
Mean 48.22 46.50 47.21 51.48 49.12 53.01 Std Dev 17.45 22.35 15.92 6.64 10.60 4.42
Percentiles: Min -106 -135 -48 46 9 48 25 53 52 46 46 43 49 50 53 52 55 51 52 53 75 53 52 55 57 57 57
Max 53 52 55 57 60 58 Other Ethnicity
Mean 46.22 46.49 47.90 57.23 49.77 55.79 Std Dev 21.06 24.36 14.41 0.00 10.64 2.63
Percentiles: Min -106 -135 -48 57 21 54 25 44 48 46 57 43 54 50 53 52 52 57 55 56 75 53 52 55 57 57 58
Max 53 52 55 57 60 58 Comorbidity Conditions
Table 11.4: Pediatric Adolescent Normative Scores by Comobidity
Upper Extremity
Mobility Sports/ Physical
Functioning
Pain Happiness
Global Function
Comorbidity Conditions Juvenile Arthritis
(1-2 Joints)
Mean 44.61 45.80 44.47 34.75 45.91 32.10 Std Dev 19.29 19.66 14.57 15.94 11.94 16.01
Percentiles: Min -106 -135 -48 23 3 22 25 44 46 39 23 40 22 50 53 52 50 29 46 25 75 53 52 55 52 55 49
Max 53 52 55 57 60 56 Juvenile Arthritis
(Many Joints)
Mean 36.82 34.95 38.92 34.91 45.85 27.92 Std Dev 44.66 49.05 26.33 10.65
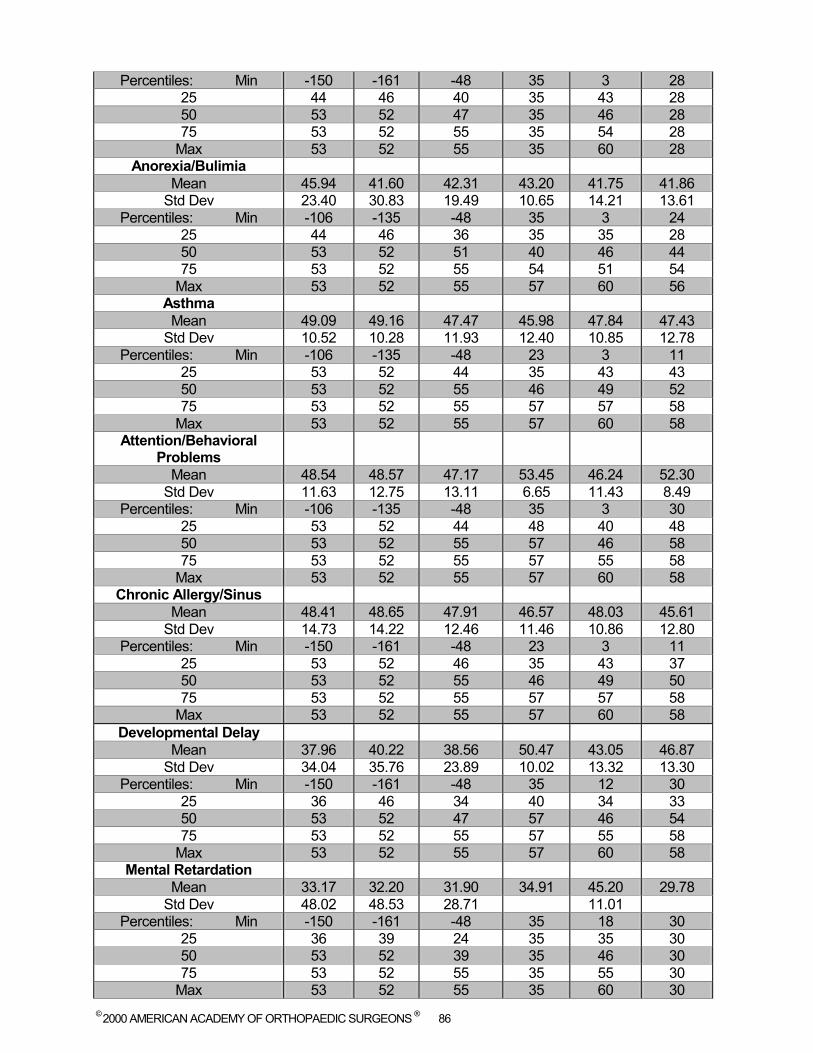
© 2000 AMERICAN ACADEMY OF ORTHOPAEDIC SURGEONS ® 86
Percentiles: Min -150 -161 -48 35 3 28 25 44 46 40 35 43 28 50 53 52 47 35 46 28 75 53 52 55 35 54 28
Max 53 52 55 35 60 28 Anorexia/Bulimia
Mean 45.94 41.60 42.31 43.20 41.75 41.86 Std Dev 23.40 30.83 19.49 10.65 14.21 13.61
Percentiles: Min -106 -135 -48 35 3 24 25 44 46 36 35 35 28 50 53 52 51 40 46 44 75 53 52 55 54 51 54
Max 53 52 55 57 60 56 Asthma Mean 49.09 49.16 47.47 45.98 47.84 47.43
Std Dev 10.52 10.28 11.93 12.40 10.85 12.78 Percentiles: Min -106 -135 -48 23 3 11
25 53 52 44 35 43 43 50 53 52 55 46 49 52 75 53 52 55 57 57 58
Max 53 52 55 57 60 58 Attention/Behavioral
Problems
Mean 48.54 48.57 47.17 53.45 46.24 52.30 Std Dev 11.63 12.75 13.11 6.65 11.43 8.49
Percentiles: Min -106 -135 -48 35 3 30 25 53 52 44 48 40 48 50 53 52 55 57 46 58 75 53 52 55 57 55 58
Max 53 52 55 57 60 58 Chronic Allergy/Sinus
Mean 48.41 48.65 47.91 46.57 48.03 45.61 Std Dev 14.73 14.22 12.46 11.46 10.86 12.80
Percentiles: Min -150 -161 -48 23 3 11 25 53 52 46 35 43 37 50 53 52 55 46 49 50 75 53 52 55 57 57 58
Max 53 52 55 57 60 58 Developmental Delay
Mean 37.96 40.22 38.56 50.47 43.05 46.87 Std Dev 34.04 35.76 23.89 10.02 13.32 13.30
Percentiles: Min -150 -161 -48 35 12 30 25 36 46 34 40 34 33 50 53 52 47 57 46 54 75 53 52 55 57 55 58
Max 53 52 55 57 60 58 Mental Retardation
Mean 33.17 32.20 31.90 34.91 45.20 29.78 Std Dev 48.02 48.53 28.71 11.01
Percentiles: Min -150 -161 -48 35 18 30 25 36 39 24 35 35 30 50 53 52 39 35 46 30 75 53 52 55 35 55 30
Max 53 52 55 35 60 30
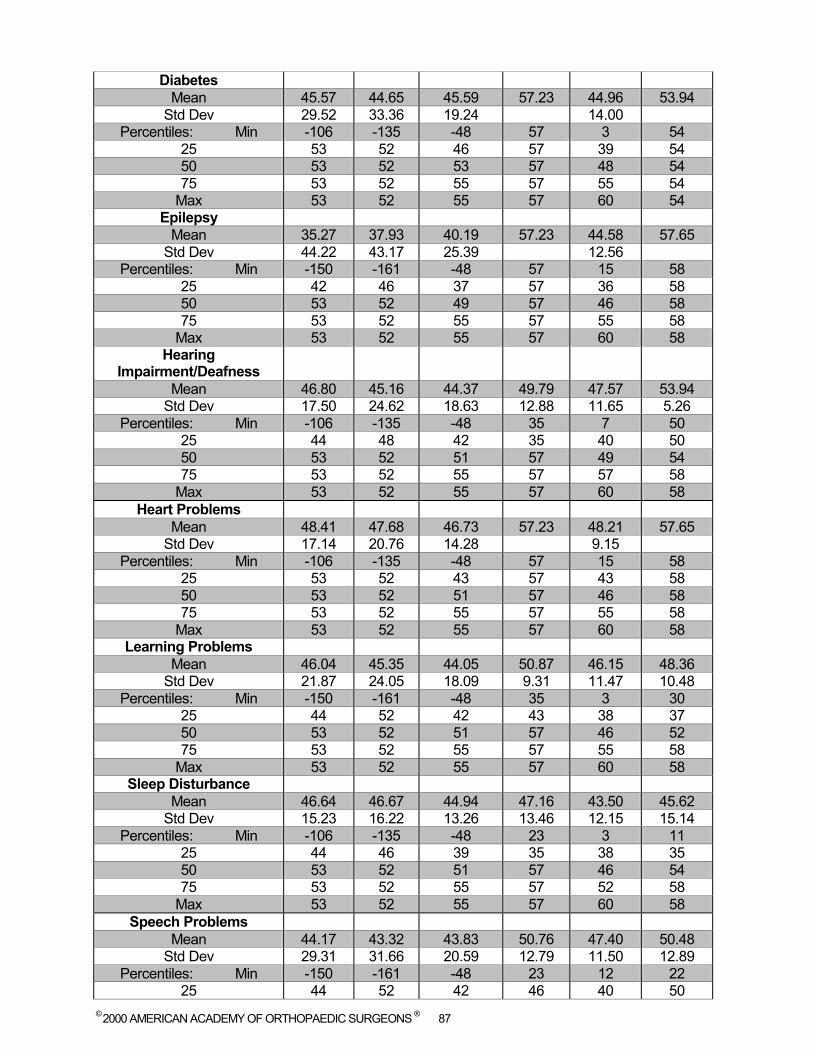
© 2000 AMERICAN ACADEMY OF ORTHOPAEDIC SURGEONS ® 87
Diabetes Mean 45.57 44.65 45.59 57.23 44.96 53.94
Std Dev 29.52 33.36 19.24 14.00 Percentiles: Min -106 -135 -48 57 3 54
25 53 52 46 57 39 54 50 53 52 53 57 48 54 75 53 52 55 57 55 54
Max 53 52 55 57 60 54 Epilepsy
Mean 35.27 37.93 40.19 57.23 44.58 57.65 Std Dev 44.22 43.17 25.39 12.56
Percentiles: Min -150 -161 -48 57 15 58 25 42 46 37 57 36 58 50 53 52 49 57 46 58 75 53 52 55 57 55 58
Max 53 52 55 57 60 58 Hearing
Impairment/Deafness
Mean 46.80 45.16 44.37 49.79 47.57 53.94 Std Dev 17.50 24.62 18.63 12.88 11.65 5.26
Percentiles: Min -106 -135 -48 35 7 50 25 44 48 42 35 40 50 50 53 52 51 57 49 54 75 53 52 55 57 57 58
Max 53 52 55 57 60 58 Heart Problems
Mean 48.41 47.68 46.73 57.23 48.21 57.65 Std Dev 17.14 20.76 14.28 9.15
Percentiles: Min -106 -135 -48 57 15 58 25 53 52 43 57 43 58 50 53 52 51 57 46 58 75 53 52 55 57 55 58
Max 53 52 55 57 60 58 Learning Problems
Mean 46.04 45.35 44.05 50.87 46.15 48.36 Std Dev 21.87 24.05 18.09 9.31 11.47 10.48
Percentiles: Min -150 -161 -48 35 3 30 25 44 52 42 43 38 37 50 53 52 51 57 46 52 75 53 52 55 57 55 58
Max 53 52 55 57 60 58 Sleep Disturbance
Mean 46.64 46.67 44.94 47.16 43.50 45.62 Std Dev 15.23 16.22 13.26 13.46 12.15 15.14
Percentiles: Min -106 -135 -48 23 3 11 25 44 46 39 35 38 35 50 53 52 51 57 46 54 75 53 52 55 57 52 58
Max 53 52 55 57 60 58 Speech Problems
Mean 44.17 43.32 43.83 50.76 47.40 50.48 Std Dev 29.31 31.66 20.59 12.79 11.50 12.89
Percentiles: Min -150 -161 -48 23 12 22 25 44 52 42 46 40 50
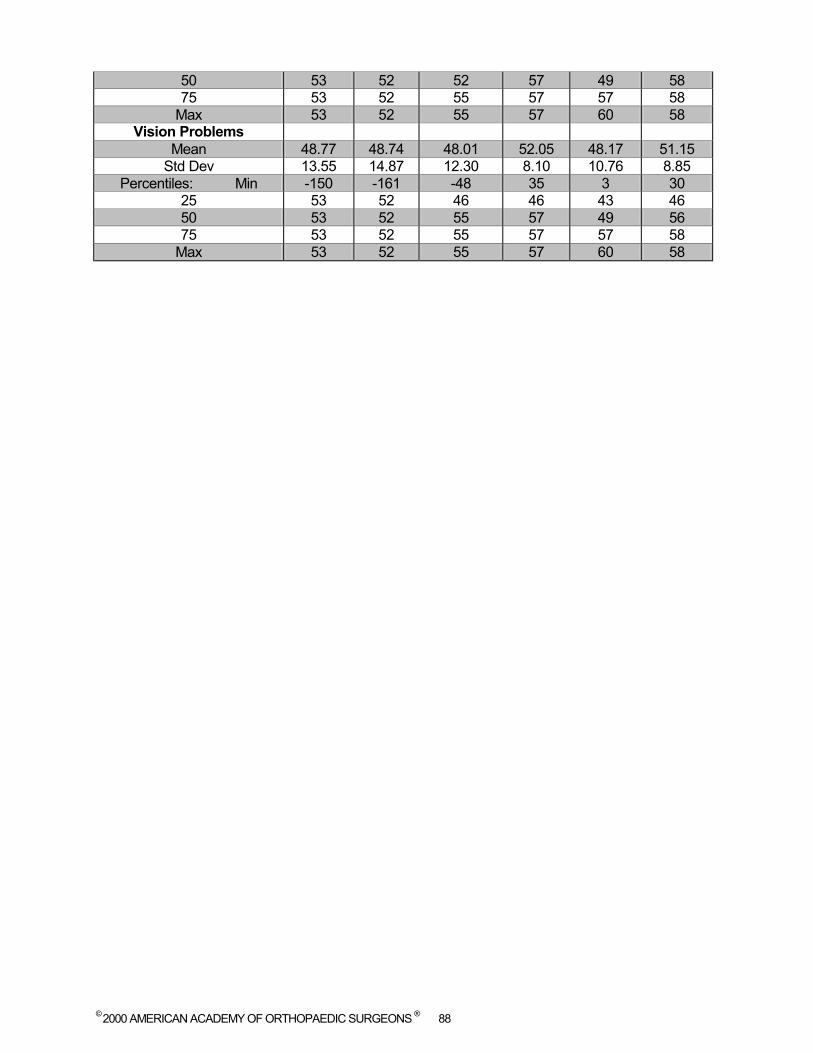
© 2000 AMERICAN ACADEMY OF ORTHOPAEDIC SURGEONS ® 88
50 53 52 52 57 49 58 75 53 52 55 57 57 58
Max 53 52 55 57 60 58 Vision Problems
Mean 48.77 48.74 48.01 52.05 48.17 51.15 Std Dev 13.55 14.87 12.30 8.10 10.76 8.85
Percentiles: Min -150 -161 -48 35 3 30 25 53 52 46 46 43 46 50 53 52 55 57 49 56 75 53 52 55 57 57 58
Max 53 52 55 57 60 58
© 2000 AMERICAN ACADEMY OF ORTHOPAEDIC SURGEONS ® 89
CHAPTER SEVEN: COMORBITY INDEXES
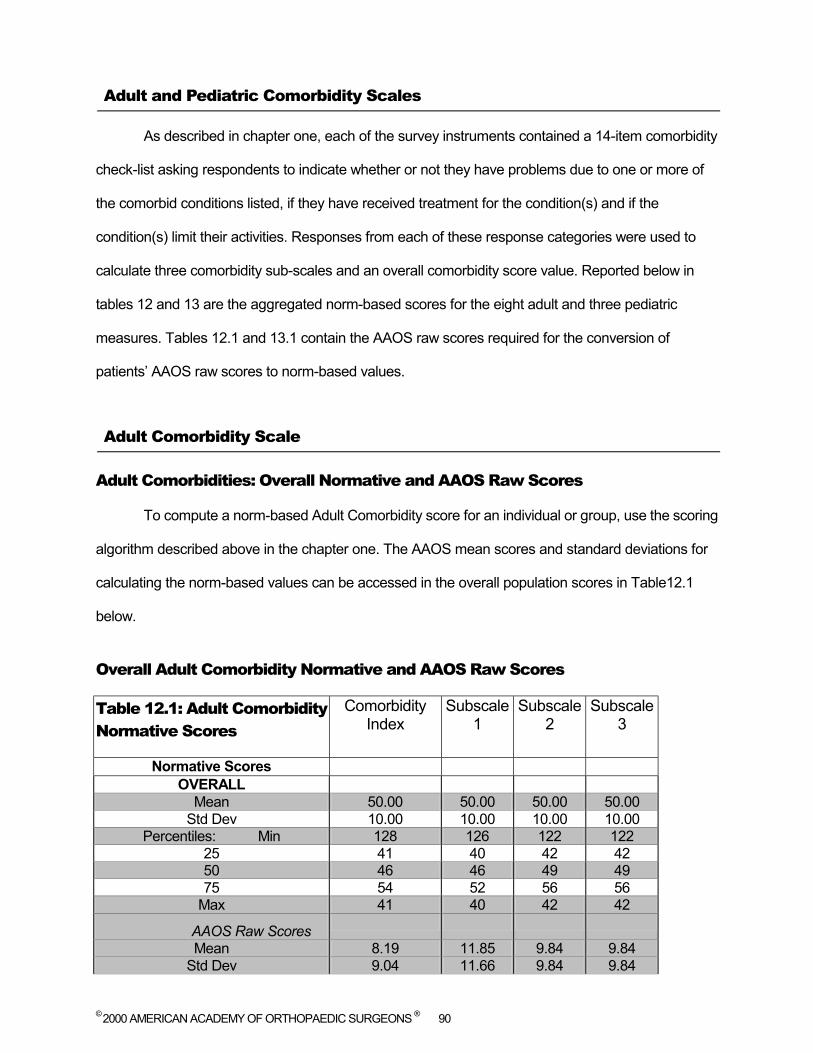
© 2000 AMERICAN ACADEMY OF ORTHOPAEDIC SURGEONS ® 90
Adult and Pediatric Comorbidity Scales
As described in chapter one, each of the survey instruments contained a 14-item comorbidity
check-list asking respondents to indicate whether or not they have problems due to one or more of
the comorbid conditions listed, if they have received treatment for the condition(s) and if the
condition(s) limit their activities. Responses from each of these response categories were used to
calculate three comorbidity sub-scales and an overall comorbidity score value. Reported below in
tables 12 and 13 are the aggregated norm-based scores for the eight adult and three pediatric
measures. Tables 12.1 and 13.1 contain the AAOS raw scores required for the conversion of
patients’ AAOS raw scores to norm-based values.
Adult Comorbidity Scale
Adult Comorbidities: Overall Normative and AAOS Raw Scores
To compute a norm-based Adult Comorbidity score for an individual or group, use the scoring
algorithm described above in the chapter one. The AAOS mean scores and standard deviations for
calculating the norm-based values can be accessed in the overall population scores in Table12.1
below.
Overall Adult Comorbidity Normative and AAOS Raw Scores
Table 12.1: Adult Comorbidity Normative Scores
Comorbidity Index
Subscale 1
Subscale 2
Subscale 3
Normative Scores OVERALL
Mean 50.00 50.00 50.00 50.00 Std Dev 10.00 10.00 10.00 10.00
Percentiles: Min 128 126 122 122 25 41 40 42 42 50 46 46 49 49 75 54 52 56 56
Max 41 40 42 42
AAOS Raw Scores
Mean 8.19 11.85 9.84 9.84 Std Dev 9.04 11.66 9.84 9.84
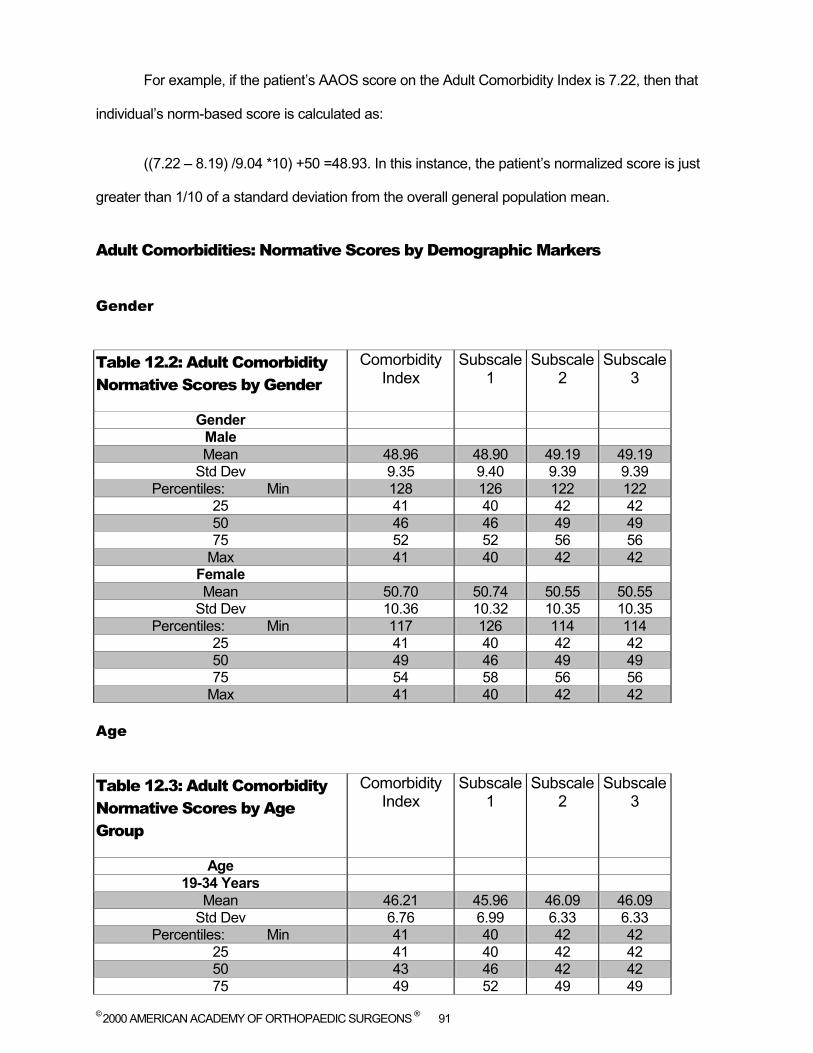
© 2000 AMERICAN ACADEMY OF ORTHOPAEDIC SURGEONS ® 91
For example, if the patient’s AAOS score on the Adult Comorbidity Index is 7.22, then that
individual’s norm-based score is calculated as:
((7.22 – 8.19) /9.04 *10) +50 =48.93. In this instance, the patient’s normalized score is just
greater than 1/10 of a standard deviation from the overall general population mean.
Adult Comorbidities: Normative Scores by Demographic Markers
Gender
Table 12.2: Adult Comorbidity Normative Scores by Gender
Comorbidity Index
Subscale 1
Subscale 2
Subscale 3
Gender Male Mean 48.96 48.90 49.19 49.19
Std Dev 9.35 9.40 9.39 9.39 Percentiles: Min 128 126 122 122
25 41 40 42 42 50 46 46 49 49 75 52 52 56 56
Max 41 40 42 42 Female Mean 50.70 50.74 50.55 50.55
Std Dev 10.36 10.32 10.35 10.35 Percentiles: Min 117 126 114 114
25 41 40 42 42 50 49 46 49 49 75 54 58 56 56
Max 41 40 42 42 Age
Table 12.3: Adult Comorbidity Normative Scores by Age Group
Comorbidity Index
Subscale 1
Subscale 2
Subscale 3
Age 19-34 Years
Mean 46.21 45.96 46.09 46.09 Std Dev 6.76 6.99 6.33 6.33
Percentiles: Min 41 40 42 42 25 41 40 42 42 50 43 46 42 42 75 49 52 49 49
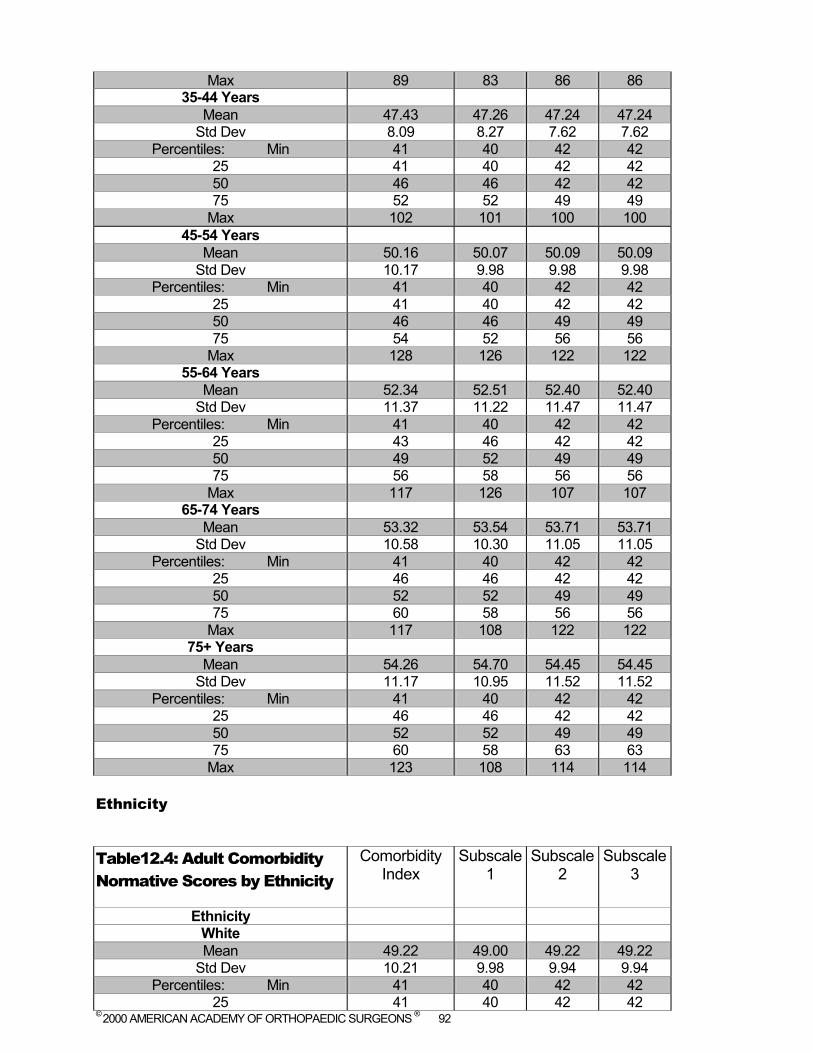
© 2000 AMERICAN ACADEMY OF ORTHOPAEDIC SURGEONS ® 92
Max 89 83 86 86 35-44 Years
Mean 47.43 47.26 47.24 47.24 Std Dev 8.09 8.27 7.62 7.62
Percentiles: Min 41 40 42 42 25 41 40 42 42 50 46 46 42 42 75 52 52 49 49
Max 102 101 100 100 45-54 Years
Mean 50.16 50.07 50.09 50.09 Std Dev 10.17 9.98 9.98 9.98
Percentiles: Min 41 40 42 42 25 41 40 42 42 50 46 46 49 49 75 54 52 56 56
Max 128 126 122 122 55-64 Years
Mean 52.34 52.51 52.40 52.40 Std Dev 11.37 11.22 11.47 11.47
Percentiles: Min 41 40 42 42 25 43 46 42 42 50 49 52 49 49 75 56 58 56 56
Max 117 126 107 107 65-74 Years
Mean 53.32 53.54 53.71 53.71 Std Dev 10.58 10.30 11.05 11.05
Percentiles: Min 41 40 42 42 25 46 46 42 42 50 52 52 49 49 75 60 58 56 56
Max 117 108 122 122 75+ Years
Mean 54.26 54.70 54.45 54.45 Std Dev 11.17 10.95 11.52 11.52
Percentiles: Min 41 40 42 42 25 46 46 42 42 50 52 52 49 49 75 60 58 63 63
Max 123 108 114 114 Ethnicity
Table12.4: Adult Comorbidity Normative Scores by Ethnicity
Comorbidity Index
Subscale 1
Subscale 2
Subscale 3
Ethnicity White Mean 49.22 49.00 49.22 49.22
Std Dev 10.21 9.98 9.94 9.94 Percentiles: Min 41 40 42 42
25 41 40 42 42
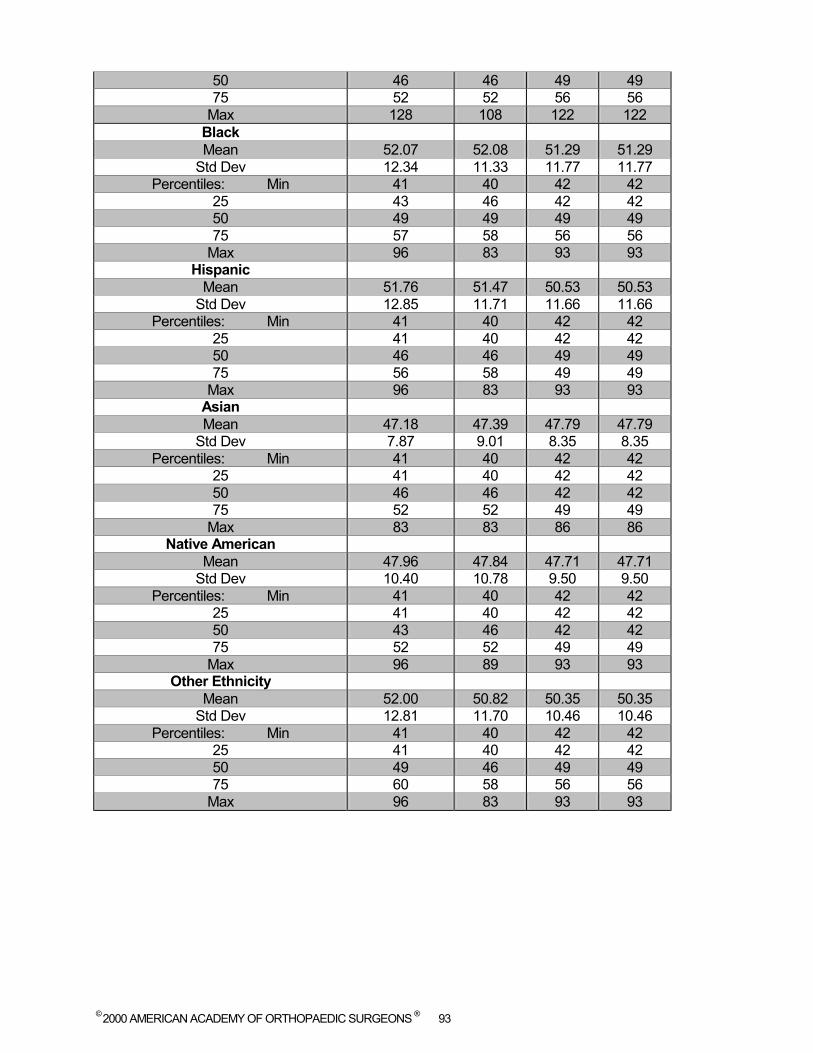
© 2000 AMERICAN ACADEMY OF ORTHOPAEDIC SURGEONS ® 93
50 46 46 49 49 75 52 52 56 56
Max 128 108 122 122 Black Mean 52.07 52.08 51.29 51.29
Std Dev 12.34 11.33 11.77 11.77 Percentiles: Min 41 40 42 42
25 43 46 42 42 50 49 49 49 49 75 57 58 56 56
Max 96 83 93 93 Hispanic
Mean 51.76 51.47 50.53 50.53 Std Dev 12.85 11.71 11.66 11.66
Percentiles: Min 41 40 42 42 25 41 40 42 42 50 46 46 49 49 75 56 58 49 49
Max 96 83 93 93 Asian Mean 47.18 47.39 47.79 47.79
Std Dev 7.87 9.01 8.35 8.35 Percentiles: Min 41 40 42 42
25 41 40 42 42 50 46 46 42 42 75 52 52 49 49
Max 83 83 86 86 Native American
Mean 47.96 47.84 47.71 47.71 Std Dev 10.40 10.78 9.50 9.50
Percentiles: Min 41 40 42 42 25 41 40 42 42 50 43 46 42 42 75 52 52 49 49
Max 96 89 93 93 Other Ethnicity
Mean 52.00 50.82 50.35 50.35 Std Dev 12.81 11.70 10.46 10.46
Percentiles: Min 41 40 42 42 25 41 40 42 42 50 49 46 49 49 75 60 58 56 56
Max 96 83 93 93
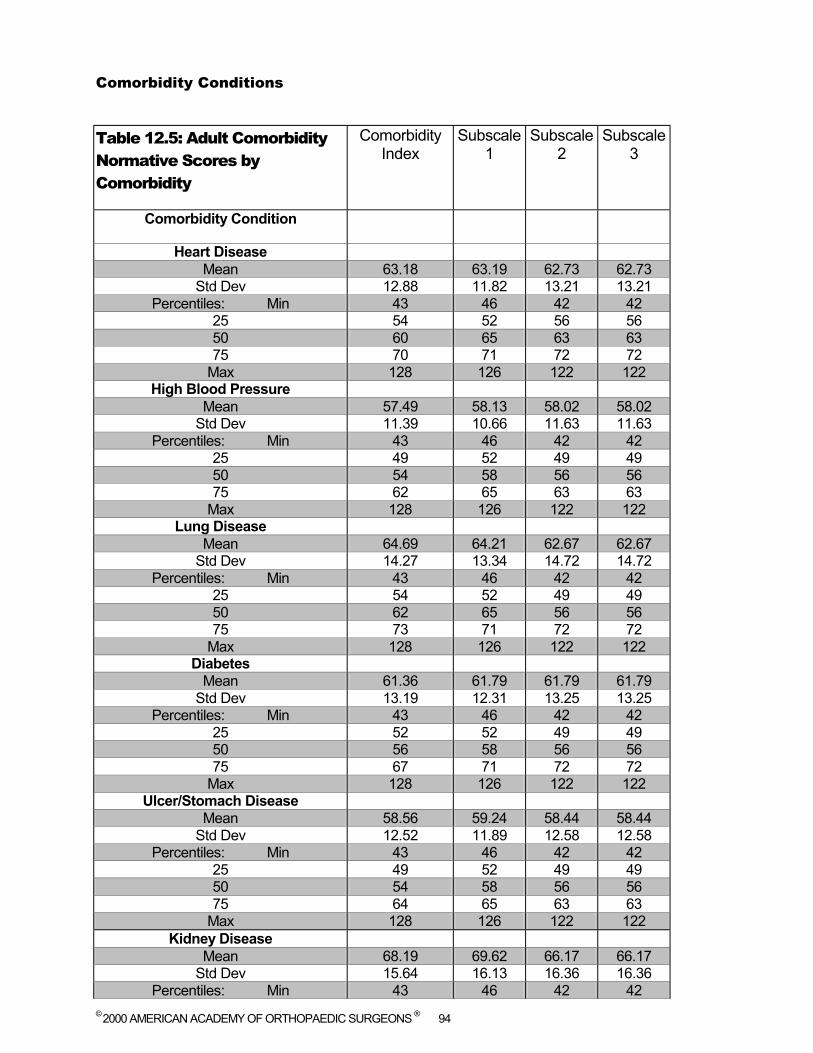
© 2000 AMERICAN ACADEMY OF ORTHOPAEDIC SURGEONS ® 94
Comorbidity Conditions
Table 12.5: Adult Comorbidity Normative Scores by Comorbidity
Comorbidity Index
Subscale 1
Subscale 2
Subscale 3
Comorbidity Condition
Heart Disease Mean 63.18 63.19 62.73 62.73
Std Dev 12.88 11.82 13.21 13.21 Percentiles: Min 43 46 42 42
25 54 52 56 56 50 60 65 63 63 75 70 71 72 72
Max 128 126 122 122 High Blood Pressure
Mean 57.49 58.13 58.02 58.02 Std Dev 11.39 10.66 11.63 11.63
Percentiles: Min 43 46 42 42 25 49 52 49 49 50 54 58 56 56 75 62 65 63 63
Max 128 126 122 122 Lung Disease
Mean 64.69 64.21 62.67 62.67 Std Dev 14.27 13.34 14.72 14.72
Percentiles: Min 43 46 42 42 25 54 52 49 49 50 62 65 56 56 75 73 71 72 72
Max 128 126 122 122 Diabetes
Mean 61.36 61.79 61.79 61.79 Std Dev 13.19 12.31 13.25 13.25
Percentiles: Min 43 46 42 42 25 52 52 49 49 50 56 58 56 56 75 67 71 72 72
Max 128 126 122 122 Ulcer/Stomach Disease
Mean 58.56 59.24 58.44 58.44 Std Dev 12.52 11.89 12.58 12.58
Percentiles: Min 43 46 42 42 25 49 52 49 49 50 54 58 56 56 75 64 65 63 63
Max 128 126 122 122 Kidney Disease
Mean 68.19 69.62 66.17 66.17 Std Dev 15.64 16.13 16.36 16.36
Percentiles: Min 43 46 42 42
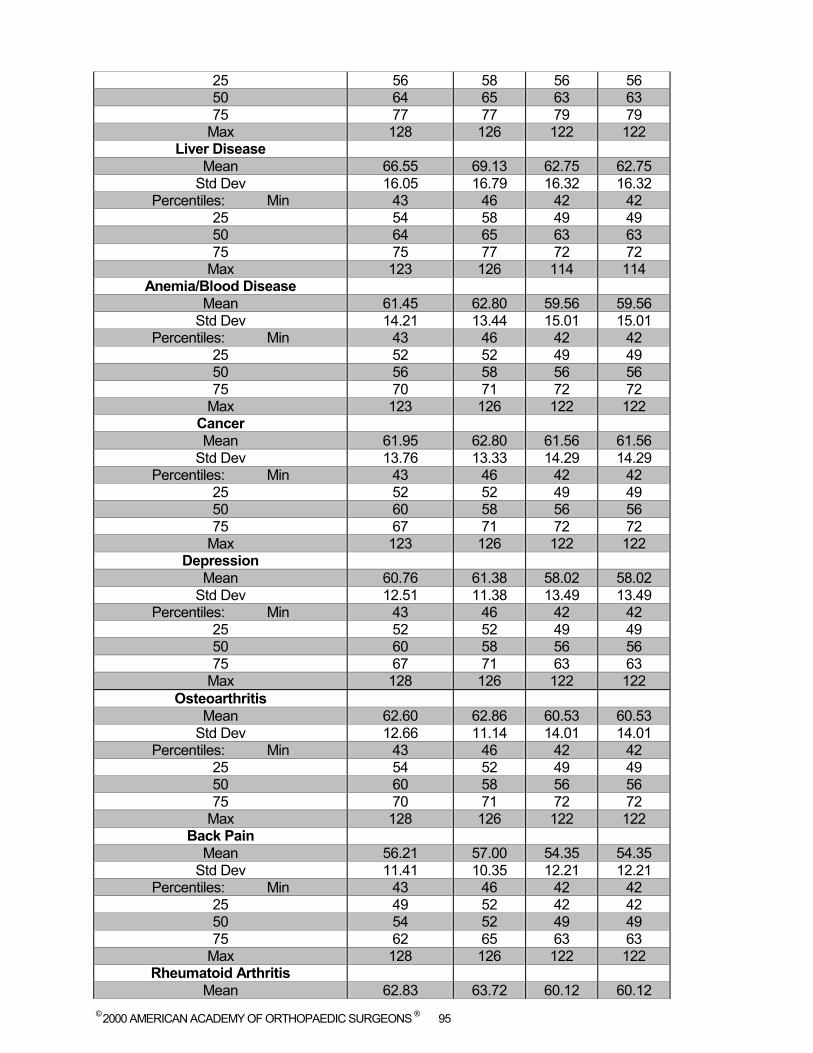
© 2000 AMERICAN ACADEMY OF ORTHOPAEDIC SURGEONS ® 95
25 56 58 56 56 50 64 65 63 63 75 77 77 79 79
Max 128 126 122 122 Liver Disease
Mean 66.55 69.13 62.75 62.75 Std Dev 16.05 16.79 16.32 16.32
Percentiles: Min 43 46 42 42 25 54 58 49 49 50 64 65 63 63 75 75 77 72 72
Max 123 126 114 114 Anemia/Blood Disease
Mean 61.45 62.80 59.56 59.56 Std Dev 14.21 13.44 15.01 15.01
Percentiles: Min 43 46 42 42 25 52 52 49 49 50 56 58 56 56 75 70 71 72 72
Max 123 126 122 122 Cancer Mean 61.95 62.80 61.56 61.56
Std Dev 13.76 13.33 14.29 14.29 Percentiles: Min 43 46 42 42
25 52 52 49 49 50 60 58 56 56 75 67 71 72 72
Max 123 126 122 122 Depression
Mean 60.76 61.38 58.02 58.02 Std Dev 12.51 11.38 13.49 13.49
Percentiles: Min 43 46 42 42 25 52 52 49 49 50 60 58 56 56 75 67 71 63 63
Max 128 126 122 122 Osteoarthritis
Mean 62.60 62.86 60.53 60.53 Std Dev 12.66 11.14 14.01 14.01
Percentiles: Min 43 46 42 42 25 54 52 49 49 50 60 58 56 56 75 70 71 72 72
Max 128 126 122 122 Back Pain
Mean 56.21 57.00 54.35 54.35 Std Dev 11.41 10.35 12.21 12.21
Percentiles: Min 43 46 42 42 25 49 52 42 42 50 54 52 49 49 75 62 65 63 63
Max 128 126 122 122 Rheumatoid Arthritis
Mean 62.83 63.72 60.12 60.12
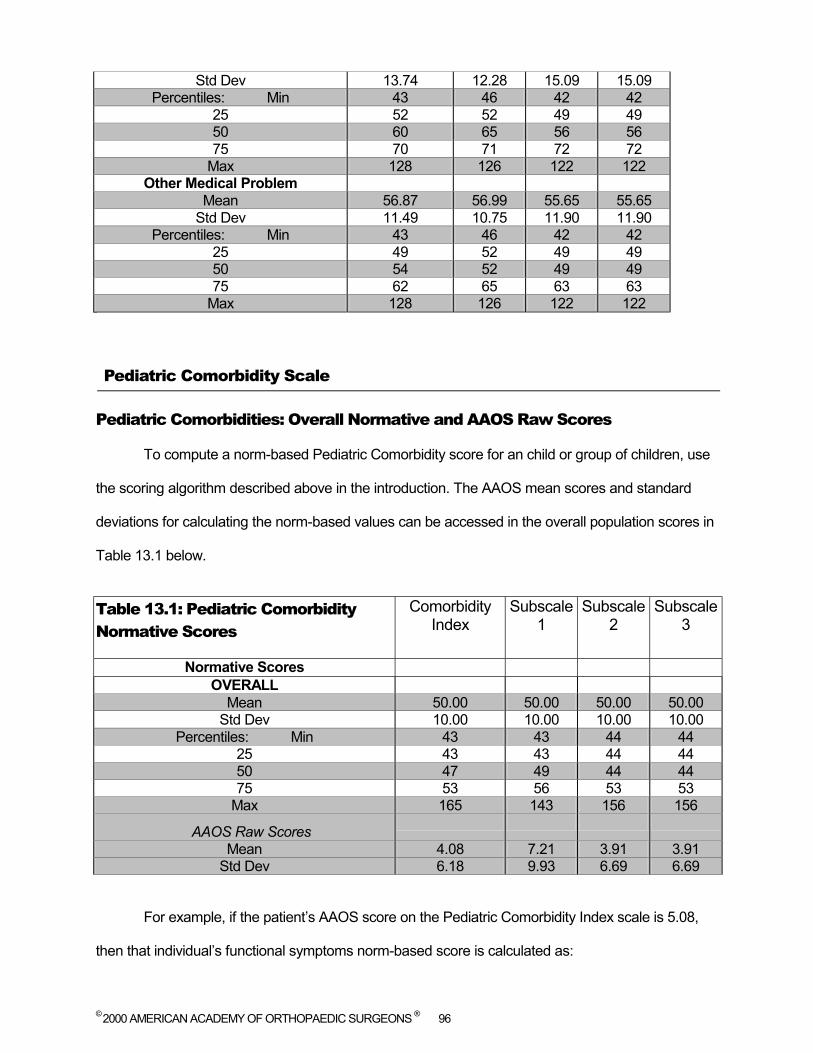
© 2000 AMERICAN ACADEMY OF ORTHOPAEDIC SURGEONS ® 96
Std Dev 13.74 12.28 15.09 15.09 Percentiles: Min 43 46 42 42
25 52 52 49 49 50 60 65 56 56 75 70 71 72 72
Max 128 126 122 122 Other Medical Problem
Mean 56.87 56.99 55.65 55.65 Std Dev 11.49 10.75 11.90 11.90
Percentiles: Min 43 46 42 42 25 49 52 49 49 50 54 52 49 49 75 62 65 63 63
Max 128 126 122 122
Pediatric Comorbidity Scale
Pediatric Comorbidities: Overall Normative and AAOS Raw Scores
To compute a norm-based Pediatric Comorbidity score for an child or group of children, use
the scoring algorithm described above in the introduction. The AAOS mean scores and standard
deviations for calculating the norm-based values can be accessed in the overall population scores in
Table 13.1 below.
Table 13.1: Pediatric Comorbidity Normative Scores
Comorbidity Index
Subscale 1
Subscale 2
Subscale 3
Normative Scores OVERALL
Mean 50.00 50.00 50.00 50.00 Std Dev 10.00 10.00 10.00 10.00
Percentiles: Min 43 43 44 44 25 43 43 44 44 50 47 49 44 44 75 53 56 53 53
Max 165 143 156 156
AAOS Raw Scores
Mean 4.08 7.21 3.91 3.91 Std Dev 6.18 9.93 6.69 6.69
For example, if the patient’s AAOS score on the Pediatric Comorbidity Index scale is 5.08,
then that individual’s functional symptoms norm-based score is calculated as:

© 2000 AMERICAN ACADEMY OF ORTHOPAEDIC SURGEONS ® 97
((5.08-4.08) /6.18 *10) +50 = 51.62. In this instance, the patient’s Comorbidity Index scale
score a little more than .15 standard deviations from the overall general population mean.
Adolescent Comorbidities; Normative Scores by Demographic Markers
Gender
Table 13.2: Pediatric Comorbidity Normative Scores by
Comorbidity Index
Subscale 1
Subscale 2
Subscale 3
Gender Male Mean 50.71 50.81 50.49 50.49
Std Dev 10.62 10.51 10.57 10.57 Percentiles: Min 43 43 44 44
25 43 43 44 44 50 47 49 44 44 75 53 56 53 53
Max 152 143 128 128 Female Mean 49.24 49.14 49.48 49.48
Std Dev 9.23 9.35 9.33 9.33 Percentiles: Min 43 43 44 44
25 43 43 44 44 50 47 49 44 44 75 50 49 53 53
Max 165 143 156 156 Age
Table 13.3: Pediatric Comorbidity Normative Scores by Age
Comorbidity Index
Subscale 1
Subscale 2
Subscale 3
Age Group 10 Years and Younger
Mean 48.69 48.44 48.95 48.95 Std Dev 9.90 9.15 10.28 10.28
Percentiles: Min 43 43 44 44 25 43 43 44 44 50 43 43 44 44 75 50 49 53 53
Max 121 131 138 138 11 - 18 Years
Mean 50.33 50.39 50.26 50.26 Std Dev 10.00 10.16 9.91 9.91
Percentiles: Min 43 43 44 44 25 43 43 44 44 50 47 49 44 44 75 53 56 53 53
Max 165 143 156 156
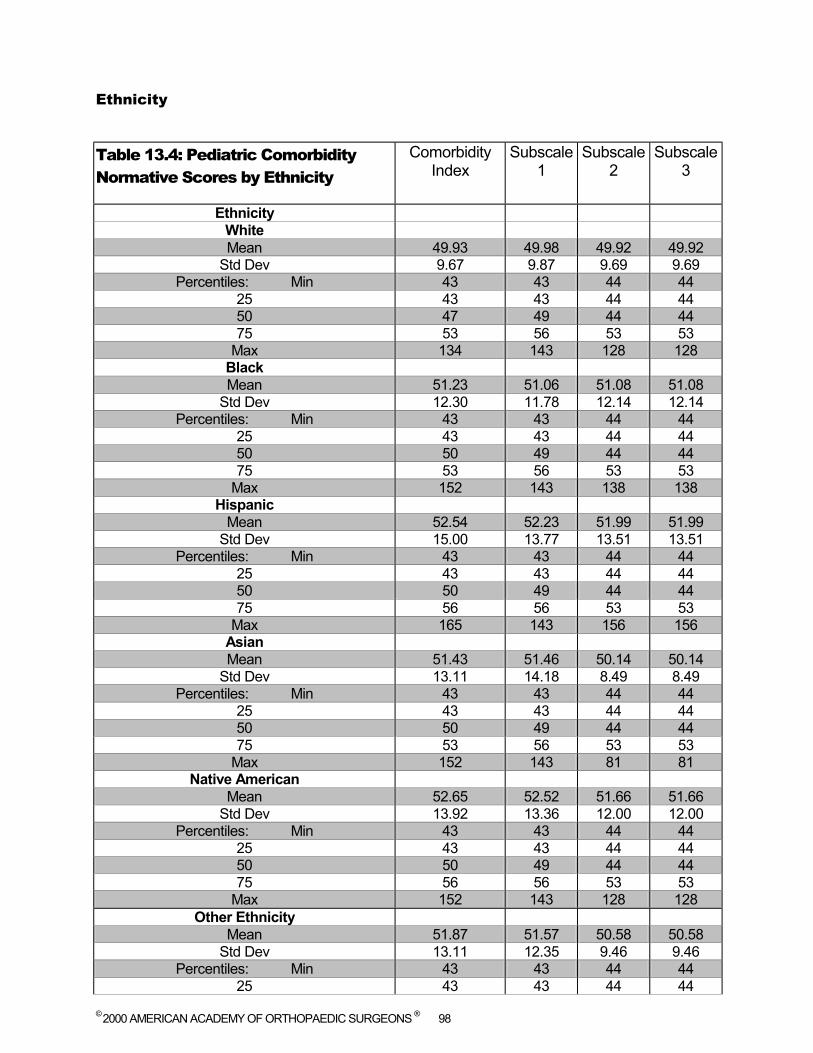
© 2000 AMERICAN ACADEMY OF ORTHOPAEDIC SURGEONS ® 98
Ethnicity
Table 13.4: Pediatric Comorbidity Normative Scores by Ethnicity
Comorbidity Index
Subscale 1
Subscale 2
Subscale 3
Ethnicity White Mean 49.93 49.98 49.92 49.92
Std Dev 9.67 9.87 9.69 9.69 Percentiles: Min 43 43 44 44
25 43 43 44 44 50 47 49 44 44 75 53 56 53 53
Max 134 143 128 128 Black Mean 51.23 51.06 51.08 51.08
Std Dev 12.30 11.78 12.14 12.14 Percentiles: Min 43 43 44 44
25 43 43 44 44 50 50 49 44 44 75 53 56 53 53
Max 152 143 138 138 Hispanic
Mean 52.54 52.23 51.99 51.99 Std Dev 15.00 13.77 13.51 13.51
Percentiles: Min 43 43 44 44 25 43 43 44 44 50 50 49 44 44 75 56 56 53 53
Max 165 143 156 156 Asian Mean 51.43 51.46 50.14 50.14
Std Dev 13.11 14.18 8.49 8.49 Percentiles: Min 43 43 44 44
25 43 43 44 44 50 50 49 44 44 75 53 56 53 53
Max 152 143 81 81 Native American
Mean 52.65 52.52 51.66 51.66 Std Dev 13.92 13.36 12.00 12.00
Percentiles: Min 43 43 44 44 25 43 43 44 44 50 50 49 44 44 75 56 56 53 53
Max 152 143 128 128 Other Ethnicity
Mean 51.87 51.57 50.58 50.58 Std Dev 13.11 12.35 9.46 9.46
Percentiles: Min 43 43 44 44 25 43 43 44 44
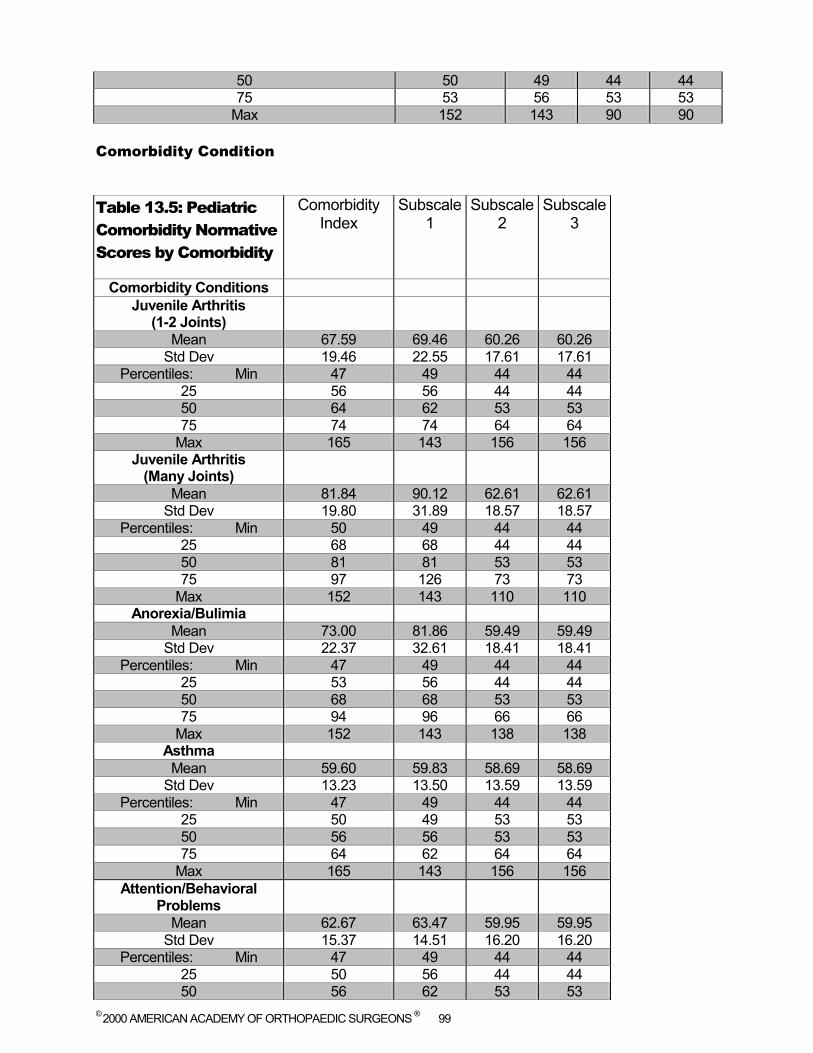
© 2000 AMERICAN ACADEMY OF ORTHOPAEDIC SURGEONS ® 99
50 50 49 44 44 75 53 56 53 53
Max 152 143 90 90 Comorbidity Condition
Table 13.5: Pediatric Comorbidity Normative Scores by Comorbidity
Comorbidity Index
Subscale 1
Subscale 2
Subscale 3
Comorbidity Conditions Juvenile Arthritis
(1-2 Joints)
Mean 67.59 69.46 60.26 60.26 Std Dev 19.46 22.55 17.61 17.61
Percentiles: Min 47 49 44 44 25 56 56 44 44 50 64 62 53 53 75 74 74 64 64
Max 165 143 156 156 Juvenile Arthritis
(Many Joints)
Mean 81.84 90.12 62.61 62.61 Std Dev 19.80 31.89 18.57 18.57
Percentiles: Min 50 49 44 44 25 68 68 44 44 50 81 81 53 53 75 97 126 73 73
Max 152 143 110 110 Anorexia/Bulimia
Mean 73.00 81.86 59.49 59.49 Std Dev 22.37 32.61 18.41 18.41
Percentiles: Min 47 49 44 44 25 53 56 44 44 50 68 68 53 53 75 94 96 66 66
Max 152 143 138 138 Asthma Mean 59.60 59.83 58.69 58.69
Std Dev 13.23 13.50 13.59 13.59 Percentiles: Min 47 49 44 44
25 50 49 53 53 50 56 56 53 53 75 64 62 64 64
Max 165 143 156 156 Attention/Behavioral
Problems
Mean 62.67 63.47 59.95 59.95 Std Dev 15.37 14.51 16.20 16.20
Percentiles: Min 47 49 44 44 25 50 56 44 44 50 56 62 53 53
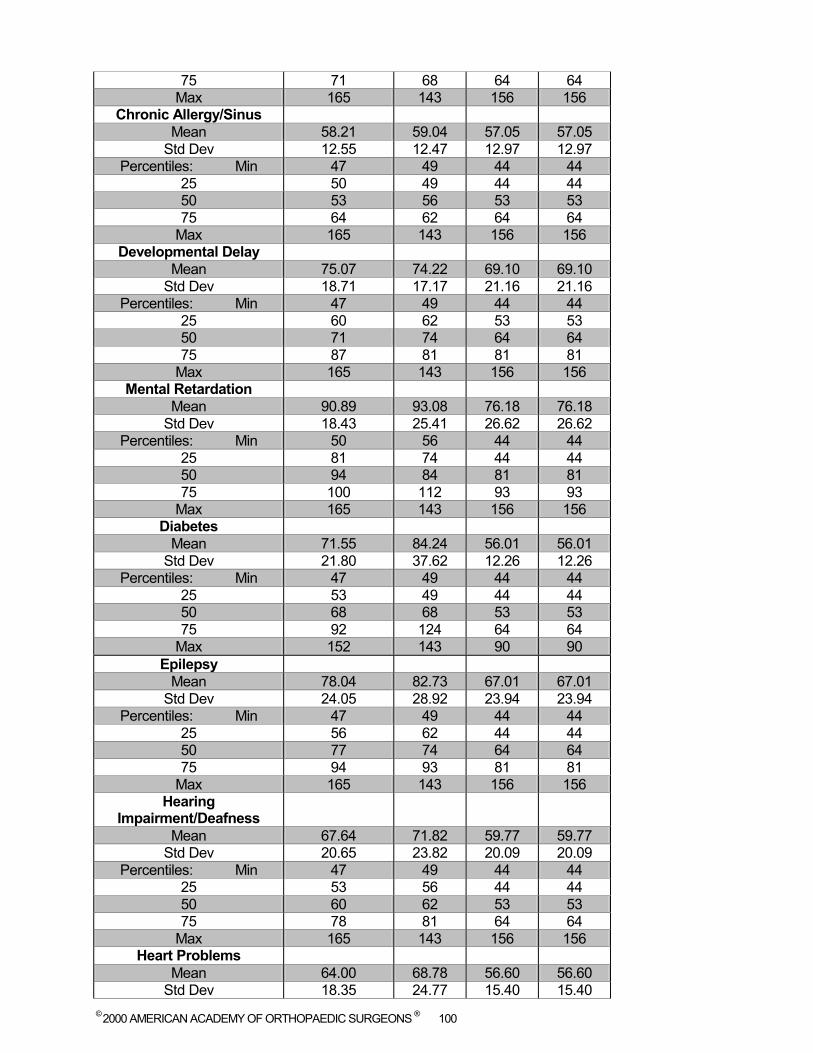
© 2000 AMERICAN ACADEMY OF ORTHOPAEDIC SURGEONS ® 100
75 71 68 64 64 Max 165 143 156 156
Chronic Allergy/Sinus Mean 58.21 59.04 57.05 57.05
Std Dev 12.55 12.47 12.97 12.97 Percentiles: Min 47 49 44 44
25 50 49 44 44 50 53 56 53 53 75 64 62 64 64
Max 165 143 156 156 Developmental Delay
Mean 75.07 74.22 69.10 69.10 Std Dev 18.71 17.17 21.16 21.16
Percentiles: Min 47 49 44 44 25 60 62 53 53 50 71 74 64 64 75 87 81 81 81
Max 165 143 156 156 Mental Retardation
Mean 90.89 93.08 76.18 76.18 Std Dev 18.43 25.41 26.62 26.62
Percentiles: Min 50 56 44 44 25 81 74 44 44 50 94 84 81 81 75 100 112 93 93
Max 165 143 156 156 Diabetes
Mean 71.55 84.24 56.01 56.01 Std Dev 21.80 37.62 12.26 12.26
Percentiles: Min 47 49 44 44 25 53 49 44 44 50 68 68 53 53 75 92 124 64 64
Max 152 143 90 90 Epilepsy
Mean 78.04 82.73 67.01 67.01 Std Dev 24.05 28.92 23.94 23.94
Percentiles: Min 47 49 44 44 25 56 62 44 44 50 77 74 64 64 75 94 93 81 81
Max 165 143 156 156 Hearing
Impairment/Deafness
Mean 67.64 71.82 59.77 59.77 Std Dev 20.65 23.82 20.09 20.09
Percentiles: Min 47 49 44 44 25 53 56 44 44 50 60 62 53 53 75 78 81 64 64
Max 165 143 156 156 Heart Problems
Mean 64.00 68.78 56.60 56.60 Std Dev 18.35 24.77 15.40 15.40

© 2000 AMERICAN ACADEMY OF ORTHOPAEDIC SURGEONS ® 101
Percentiles: Min 47 49 44 44 25 50 56 44 44 50 56 62 53 53 75 74 74 64 64
Max 152 143 119 119 Learning Problems
Mean 67.75 67.92 64.30 64.30 Std Dev 16.91 15.84 18.12 18.12
Percentiles: Min 47 49 44 44 25 56 56 53 53 50 64 62 64 64 75 77 74 73 73
Max 165 143 156 156 Sleep Disturbance
Mean 66.75 68.96 60.78 60.78 Std Dev 18.65 19.21 19.10 19.10
Percentiles: Min 47 49 44 44 25 53 56 44 44 50 60 62 53 53 75 77 74 73 73
Max 165 143 156 156 Speech Problems
Mean 65.20 66.97 61.07 61.07 Std Dev 18.05 17.72 18.83 18.83
Percentiles: Min 47 49 44 44 25 53 56 44 44 50 60 62 53 53 75 74 74 73 73
Max 165 143 156 156 Vision Problems
Mean 57.60 58.18 57.37 57.37 Std Dev 12.50 13.03 12.23 12.23
Percentiles: Min 47 49 44 44 25 50 49 53 53 50 53 56 53 53 75 60 62 64 64
Max 165 143 156 156
© 2000 AMERICAN ACADEMY OF ORTHOPAEDIC SURGEONS ® 102
Appendix A: General Scoring Issues: Original AAOS Raw Scale Scores
Obtaining Original AAOS Raw Scale Scores
Following is a description of how the raw scale scores will be scored in the AAOS/COMSS/COSS Outcomes Data Collection Questionnaires. Each instrument contains a number of questions, some of which may be assessed individually, and others, which may be combined to form scales. To convert the raw scores to the new Norms Based Scores refer to the appropriate section of this document. Each AAOS/COMSS/COSS Outcomes Data Collection Instrument contains summated scales designed to measure patient physical and mental function and symptoms (including pain). The scoring algorithms in this documentation are to be used with Version 2000 of the AAOS/COMSS/COSS Outcomes Data Collection Instruments. If you need the algorithms that are match the number of the Version 2.0 please contact the American Academy of Orthopaedic Surgeons for the separate appropriate scoring documentation. Each summated outcomes scale (excluding comorbidities and single-item scales) is composed of the scores from related items that are averaged and then re-scaled so that each is scored from 0 (poor outcome) to 100 (best possible outcome). Final scale scores should be rounded to the nearest whole number. This is based on the scaling of the Medical Outcomes Study SF-36™. The additional instruments for adults are designed to supplement the SF-36™ with items more specific to the region and activity of interest (for example, lower limb, foot and ankle). In the region and activity-specific scales we do not score answers of ‘cannot do activity due to other reason’ (e.g., besides pain, swelling, knee problems), as this preserves these scales’ focus on symptom- or region-related limitations of interest that add to the general functional ability captured by the SF-36™. In addition to the scales developed for adults, there are scales that have been developed to go along with the pediatric instruments. Note: Summative scale scores should be generated if a respondent answered at least half of the items in a multi-item scale (or half plus one in the case of scales with an odd number of items); otherwise the score should not be calculated. Missing Items: If an item contained within a scale is not answered, that item is not computed into the mean used for that scale. Exceptions to the preceding rule are the Hip/Knee module 'function and limitation' scale, the Foot and Ankle module 'global foot and ankle' scale, and the DASH module. For an explanation of these exceptions refer to the sections on scoring these modules. Please note that the above rules in this appendix do not apply to the SMFA. For the scoring rules for the SMFA refer to Appendix 5.

© 2000 AMERICAN ACADEMY OF ORTHOPAEDIC SURGEONS ® 103
Appendix B: SF-36™ 2.0 Standard Version
The 2000 edition of the AAOS Outcomes Questionnaires contain the new SF-36™ 2.0 Standard Version (questions 19 to 29 in each questionnaire). The SF-36™ is a general health status questionnaire, which has been widely used, validated, and provides a common metric for all of the instruments. The SF-36™ questions are those numbered from #18-28 in the Current Health Assessment. The SF-36™ contains eight sub-scales and two summative scales (one for physical function and one for mental health). The two summative scale-scoring algorithms are unusual in that each response category for each item is independently weighted. Scoring manuals for the SF-36™ Version 2.0 can be obtain from Quality Metric Inc. through their web site http://www.qmetric.com/.

© 2000 AMERICAN ACADEMY OF ORTHOPAEDIC SURGEONS ® 104
Appendix C: Scoring the Current Health Assessment Raw Scale Scores:
Comorbidity Index
The Comorbidities scale is composed of the scores from related items that are averaged and then re-scaled so that each is scored from 0 (no comorbidities) to 100 (highest level of comorbidities). This scale is derived from responses to questions #4-17. The algorithm for comorbidity is as follows: X = Starting at zero, add one point for each “yes” answer in the three columns (had disease, being treated for it, limits me) of questions #4-17. Note: if no “yes's” were chosen, then x= 0, as we are assuming that no “yes's” means no comorbidities. ***************Note: If the respondent has answered “yes” to either Column 2, 'Do you receive treatment for it?' or Column 3, 'Does it Limit your activities' for a given comorbidity question, then score one point for Column 1, 'Do you have the problem?' if the respondent did not answer the column for that question.******************************* X Comorbidity Index= --------------- 100
42
Comorbidity Sub-scales
The Comorbidities sub-scales are composed of the scores from related items that are averaged and then re-scaled so that each is scored from 0 (no comorbidities) to 100 (highest level of comorbidities). These scales are derived from responses to questions #4-17.
Sub-scale 1 'Do you have the problem'
This scale is derived from responses in column 1 to questions #4-17. The algorithm for the 'Do you have the problem' comorbidity sub-scale is as follows: X= Starting at zero add one point for each “yes” answer in column 1 'Do you have the problem’ of questions #4-17.
X Comorbidity Index= --------------- 100
14 Sub-scale 2 'Do you receive treatment for it'
This scale is derived from responses in column 2 to questions #4-17. The algorithm for the 'Do you receive treatment for it' comorbidity sub-scale is as follows: X= Starting at zero add one point for each “yes” answer in column 2 'Do you receive treatment for it' of questions #4-17.
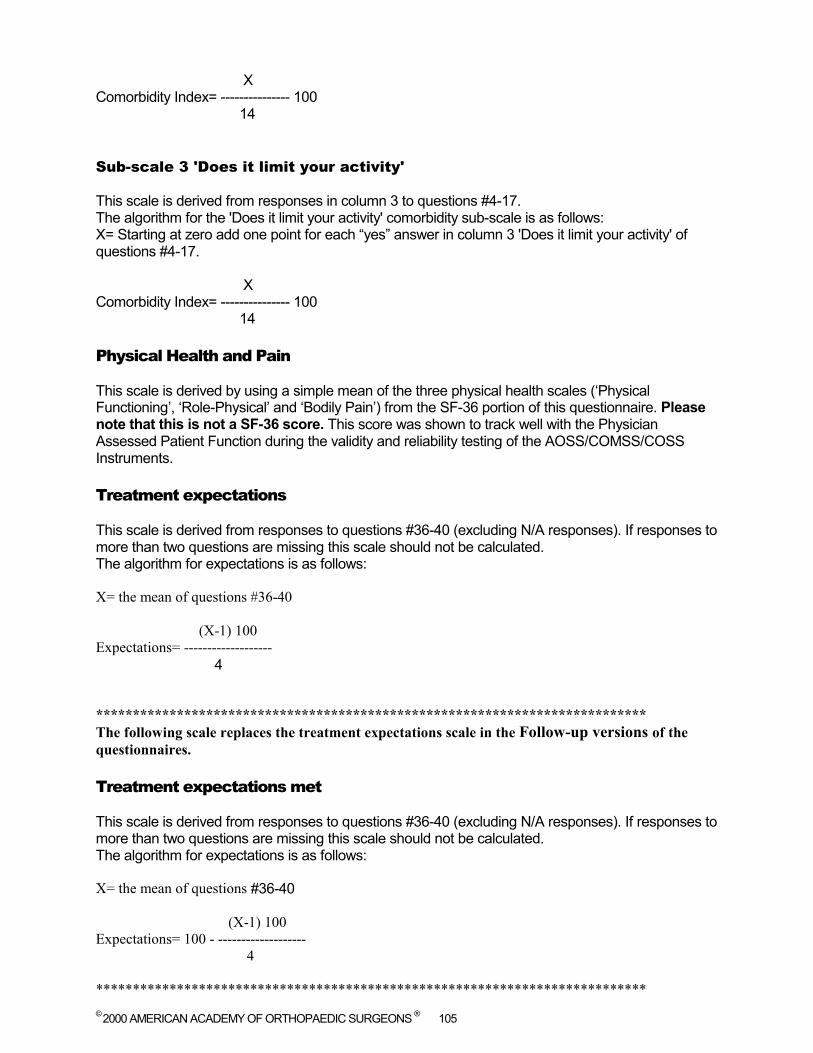
© 2000 AMERICAN ACADEMY OF ORTHOPAEDIC SURGEONS ® 105
X Comorbidity Index= --------------- 100
14
Sub-scale 3 'Does it limit your activity'
This scale is derived from responses in column 3 to questions #4-17. The algorithm for the 'Does it limit your activity' comorbidity sub-scale is as follows: X= Starting at zero add one point for each “yes” answer in column 3 'Does it limit your activity' of questions #4-17.
X Comorbidity Index= --------------- 100
14 Physical Health and Pain
This scale is derived by using a simple mean of the three physical health scales (‘Physical Functioning’, ‘Role-Physical’ and ‘Bodily Pain’) from the SF-36 portion of this questionnaire. Please note that this is not a SF-36 score. This score was shown to track well with the Physician Assessed Patient Function during the validity and reliability testing of the AOSS/COMSS/COSS Instruments. Treatment expectations
This scale is derived from responses to questions #36-40 (excluding N/A responses). If responses to more than two questions are missing this scale should not be calculated. The algorithm for expectations is as follows: X= the mean of questions #36-40
(X-1) 100 Expectations= -------------------
4
*************************************************************************** The following scale replaces the treatment expectations scale in the Follow-up versions of the questionnaires. Treatment expectations met
This scale is derived from responses to questions #36-40 (excluding N/A responses). If responses to more than two questions are missing this scale should not be calculated. The algorithm for expectations is as follows: X= the mean of questions #36-40
(X-1) 100 Expectations= 100 - -------------------
4
***************************************************************************
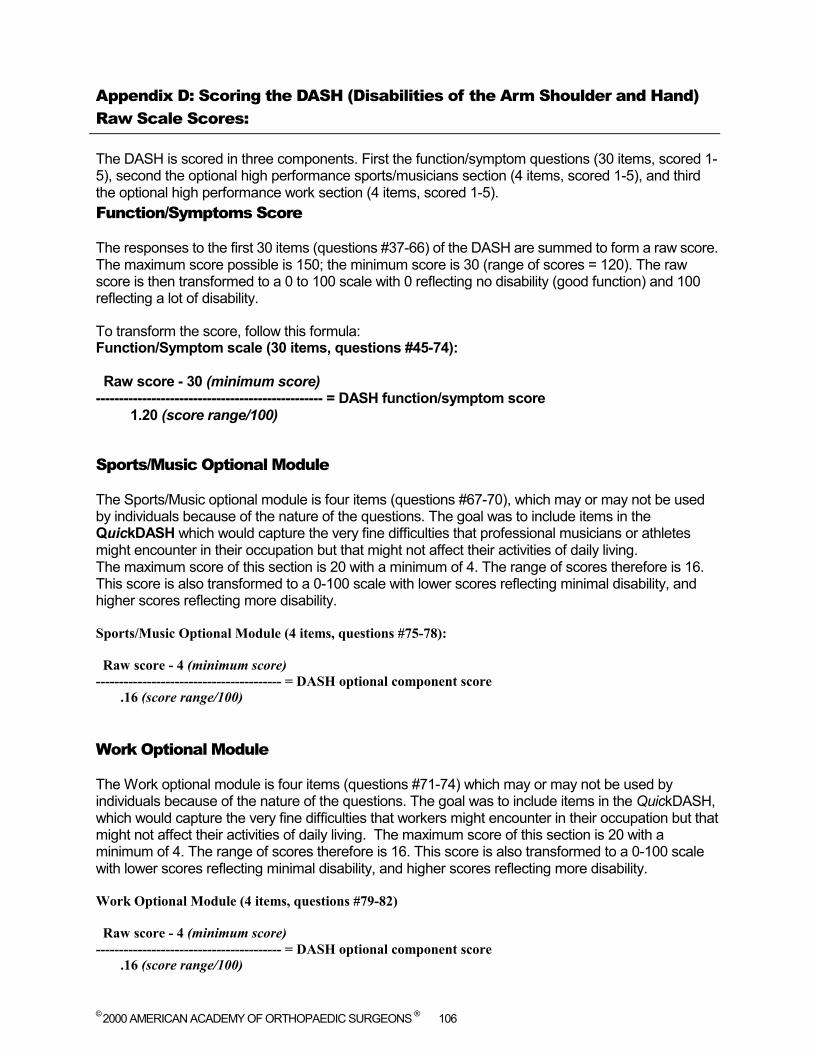
© 2000 AMERICAN ACADEMY OF ORTHOPAEDIC SURGEONS ® 106
Appendix D: Scoring the DASH (Disabilities of the Arm Shoulder and Hand) Raw Scale Scores:
The DASH is scored in three components. First the function/symptom questions (30 items, scored 1-5), second the optional high performance sports/musicians section (4 items, scored 1-5), and third the optional high performance work section (4 items, scored 1-5). Function/Symptoms Score
The responses to the first 30 items (questions #37-66) of the DASH are summed to form a raw score. The maximum score possible is 150; the minimum score is 30 (range of scores = 120). The raw score is then transformed to a 0 to 100 scale with 0 reflecting no disability (good function) and 100 reflecting a lot of disability. To transform the score, follow this formula: Function/Symptom scale (30 items, questions #45-74): Raw score - 30 (minimum score) ------------------------------------------------- = DASH function/symptom score 1.20 (score range/100)
Sports/Music Optional Module
The Sports/Music optional module is four items (questions #67-70), which may or may not be used by individuals because of the nature of the questions. The goal was to include items in the QuickDASH which would capture the very fine difficulties that professional musicians or athletes might encounter in their occupation but that might not affect their activities of daily living. The maximum score of this section is 20 with a minimum of 4. The range of scores therefore is 16. This score is also transformed to a 0-100 scale with lower scores reflecting minimal disability, and higher scores reflecting more disability. Sports/Music Optional Module (4 items, questions #75-78): Raw score - 4 (minimum score) ---------------------------------------- = DASH optional component score .16 (score range/100) Work Optional Module
The Work optional module is four items (questions #71-74) which may or may not be used by individuals because of the nature of the questions. The goal was to include items in the QuickDASH, which would capture the very fine difficulties that workers might encounter in their occupation but that might not affect their activities of daily living. The maximum score of this section is 20 with a minimum of 4. The range of scores therefore is 16. This score is also transformed to a 0-100 scale with lower scores reflecting minimal disability, and higher scores reflecting more disability. Work Optional Module (4 items, questions #79-82) Raw score - 4 (minimum score) ---------------------------------------- = DASH optional component score .16 (score range/100)
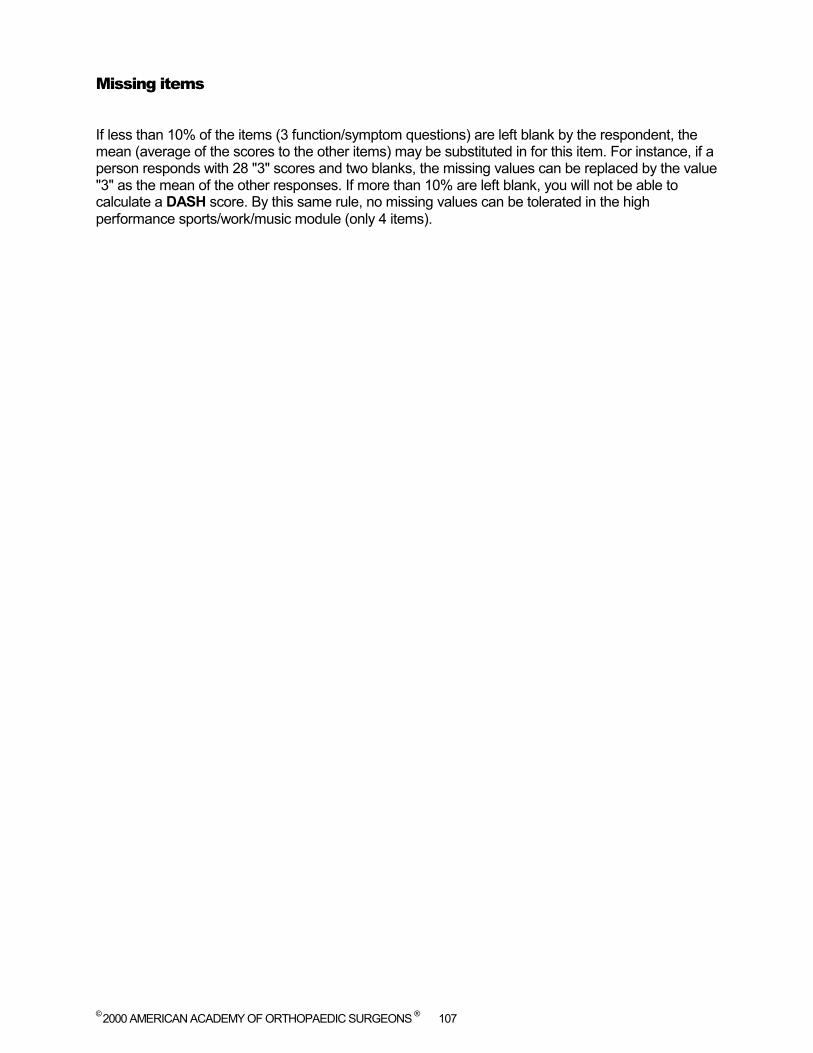
© 2000 AMERICAN ACADEMY OF ORTHOPAEDIC SURGEONS ® 107
Missing items
If less than 10% of the items (3 function/symptom questions) are left blank by the respondent, the mean (average of the scores to the other items) may be substituted in for this item. For instance, if a person responds with 28 "3" scores and two blanks, the missing values can be replaced by the value "3" as the mean of the other responses. If more than 10% are left blank, you will not be able to calculate a DASH score. By this same rule, no missing values can be tolerated in the high performance sports/work/music module (only 4 items).
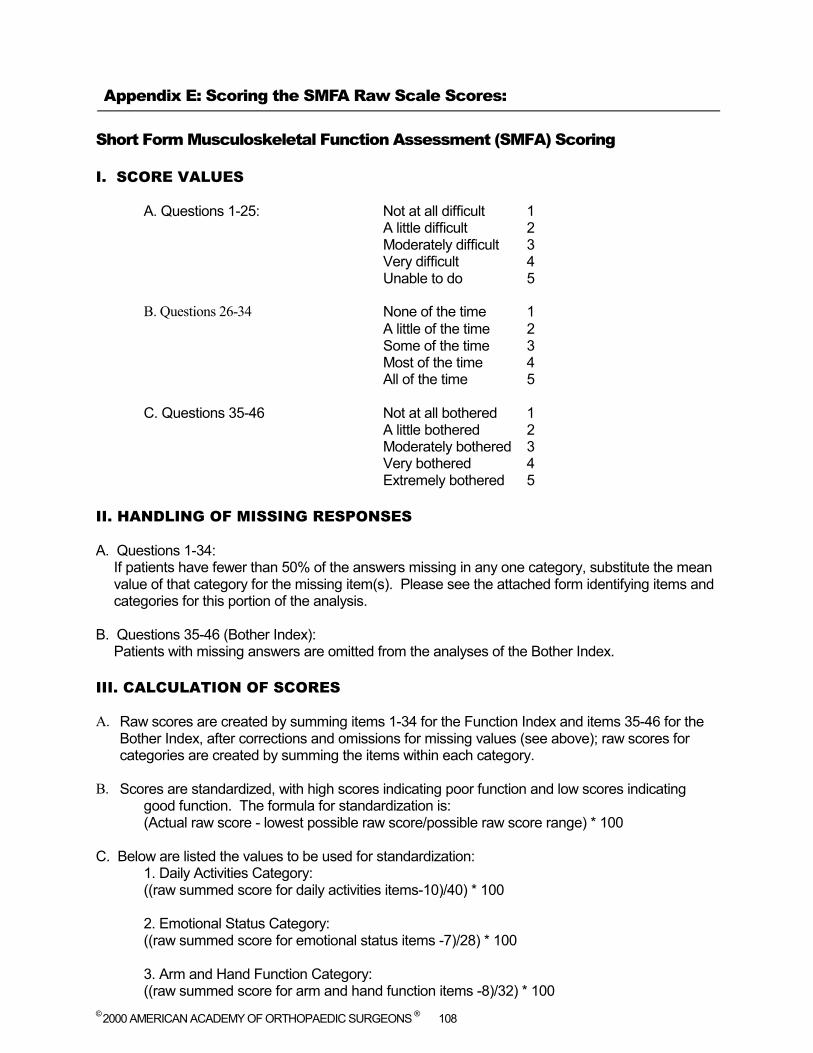
© 2000 AMERICAN ACADEMY OF ORTHOPAEDIC SURGEONS ® 108
Appendix E: Scoring the SMFA Raw Scale Scores:
Short Form Musculoskeletal Function Assessment (SMFA) Scoring
I. SCORE VALUES
A. Questions 1-25: Not at all difficult 1 A little difficult 2 Moderately difficult 3 Very difficult 4 Unable to do 5
B. Questions 26-34 None of the time 1
A little of the time 2 Some of the time 3 Most of the time 4 All of the time 5
C. Questions 35-46 Not at all bothered 1
A little bothered 2 Moderately bothered 3 Very bothered 4 Extremely bothered 5
II. HANDLING OF MISSING RESPONSES
A. Questions 1-34: If patients have fewer than 50% of the answers missing in any one category, substitute the mean value of that category for the missing item(s). Please see the attached form identifying items and categories for this portion of the analysis.
B. Questions 35-46 (Bother Index):
Patients with missing answers are omitted from the analyses of the Bother Index. III. CALCULATION OF SCORES
A. Raw scores are created by summing items 1-34 for the Function Index and items 35-46 for the Bother Index, after corrections and omissions for missing values (see above); raw scores for categories are created by summing the items within each category.
B. Scores are standardized, with high scores indicating poor function and low scores indicating
good function. The formula for standardization is: (Actual raw score - lowest possible raw score/possible raw score range) * 100 C. Below are listed the values to be used for standardization:
1. Daily Activities Category: ((raw summed score for daily activities items-10)/40) * 100 2. Emotional Status Category: ((raw summed score for emotional status items -7)/28) * 100 3. Arm and Hand Function Category: ((raw summed score for arm and hand function items -8)/32) * 100

© 2000 AMERICAN ACADEMY OF ORTHOPAEDIC SURGEONS ® 109
4. Mobility Category: ((raw summed score for mobility items - 9)/36 * 100 5. Function Index: ((raw summed score for items 1-34 - 34)/136) * 100 6. Bother Index: ((raw summed score for items 35-46 -12)/48 * 100
SMFA CATEGORIES, ITEM NUMBERS AND ITEM NAMES
Quest. # Item Question
Daily Activities Category
3 house12m How diff. to shop? 14 conf3m How difficult to go out by yourself? 15 conf5m How diff. for you to drive? 20 rec2m How diff. –usual physical recreation? 21 rec4m How diff. –usual leisure activities? 22 sex2m How diff. –sexual activity? 23 hswrk1 How diff. –light house or yard work? 24 hswrk2 How diff. –heavy house or yard work? 25 work8m How diff. –your usual work? 33 feel25m How often – feel disabled?
Emotional Status Category
7 rest8m How diff. To get comfortable to sleep? 27 feel5m How often –avoid using painful limbs? 29 thk2m How often –problems concentrating? 30 feel19m Does doing too much affect next day? 31 fam14m How often –act irritable toward others? 32 rest3m How often are you tired? 34 feel34m How often frustrated –injury/arthritis?
Arm and Hand Function Category
2 hand8m How diff. to open medicine bottles? 5 fine2m How diff. to make a tight fist? 9 self7m How diff. –buttons, snaps, zippers? 10 self14m How diff. to cut your own fingernails? 11 self11m How diff. to dress yourself? 16 self21m How diff. to clean after toilet? 17 hand5m How diff. to turn knobs or levers? 18 hand7m How diff. to write or type?
Mobility Category
1 mobil24m How difficult to get in/out of chair?
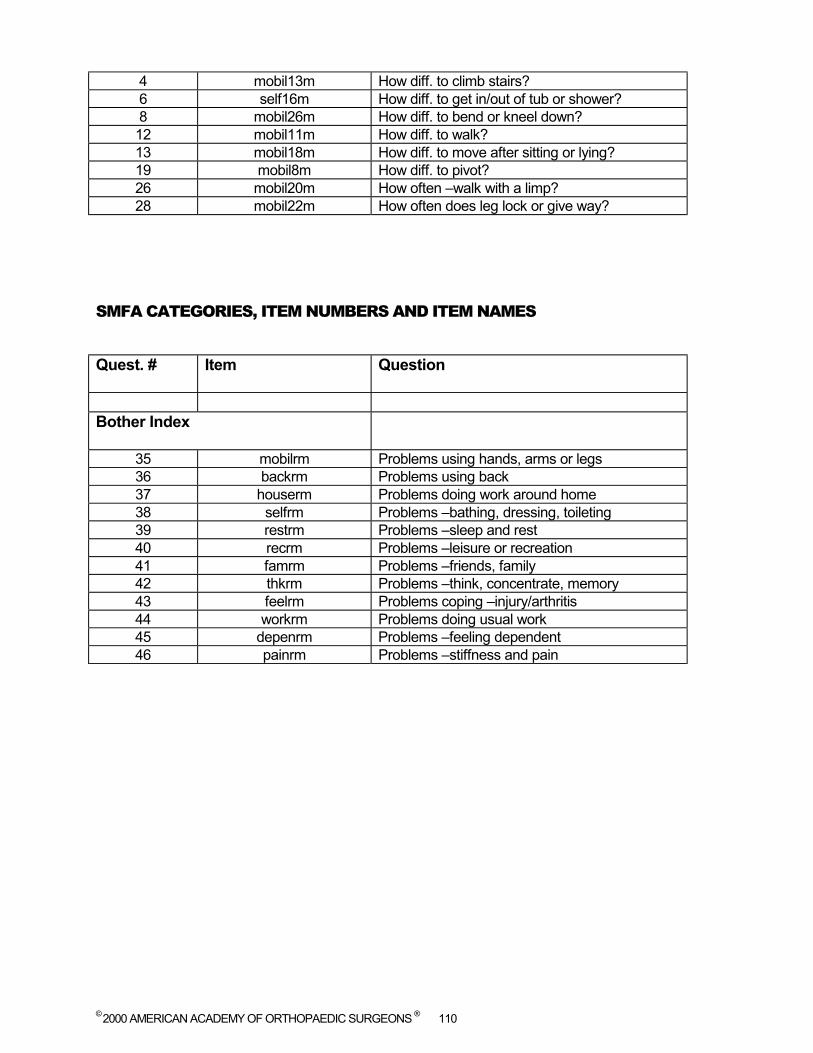
© 2000 AMERICAN ACADEMY OF ORTHOPAEDIC SURGEONS ® 110
4 mobil13m How diff. to climb stairs? 6 self16m How diff. to get in/out of tub or shower? 8 mobil26m How diff. to bend or kneel down? 12 mobil11m How diff. to walk? 13 mobil18m How diff. to move after sitting or lying? 19 mobil8m How diff. to pivot? 26 mobil20m How often –walk with a limp? 28 mobil22m How often does leg lock or give way?
SMFA CATEGORIES, ITEM NUMBERS AND ITEM NAMES
Quest. #
Item Question
Bother Index
35 mobilrm Problems using hands, arms or legs 36 backrm Problems using back 37 houserm Problems doing work around home 38 selfrm Problems –bathing, dressing, toileting 39 restrm Problems –sleep and rest 40 recrm Problems –leisure or recreation 41 famrm Problems –friends, family 42 thkrm Problems –think, concentrate, memory 43 feelrm Problems coping –injury/arthritis 44 workrm Problems doing usual work 45 depenrm Problems –feeling dependent 46 painrm Problems –stiffness and pain

© 2000 AMERICAN ACADEMY OF ORTHOPAEDIC SURGEONS ® 111
Appendix F: Scoring the Spine Questionnaire Raw Scale Scores:
Lumbar Spine and Cervical Spine Scales
Neurogenic symptoms
This scale is derived from responses to questions #47-49, #51-53. If responses to more than three questions are missing, this scale should not be calculated. The algorithm for neurogenic symptoms is as follows: X= the mean of questions #47-49 and #51-53
(X - 1) 100 Neurogenic symptoms= 100 - --------------------
5
Pain/disability
This scale is derived from responses to questions #46, 50, and 54-62. If responses to more than five questions are missing, this scale should not be calculated. The algorithm for pain/disability is as follows: X= the mean of questions #46, 50 and 54-62
(X - 1) 100 Pain/disability= 100 - -------------------- 5 Cervical Spine Myelopathy Scale
Scoring for this scale will be made available upon the completion of testing.
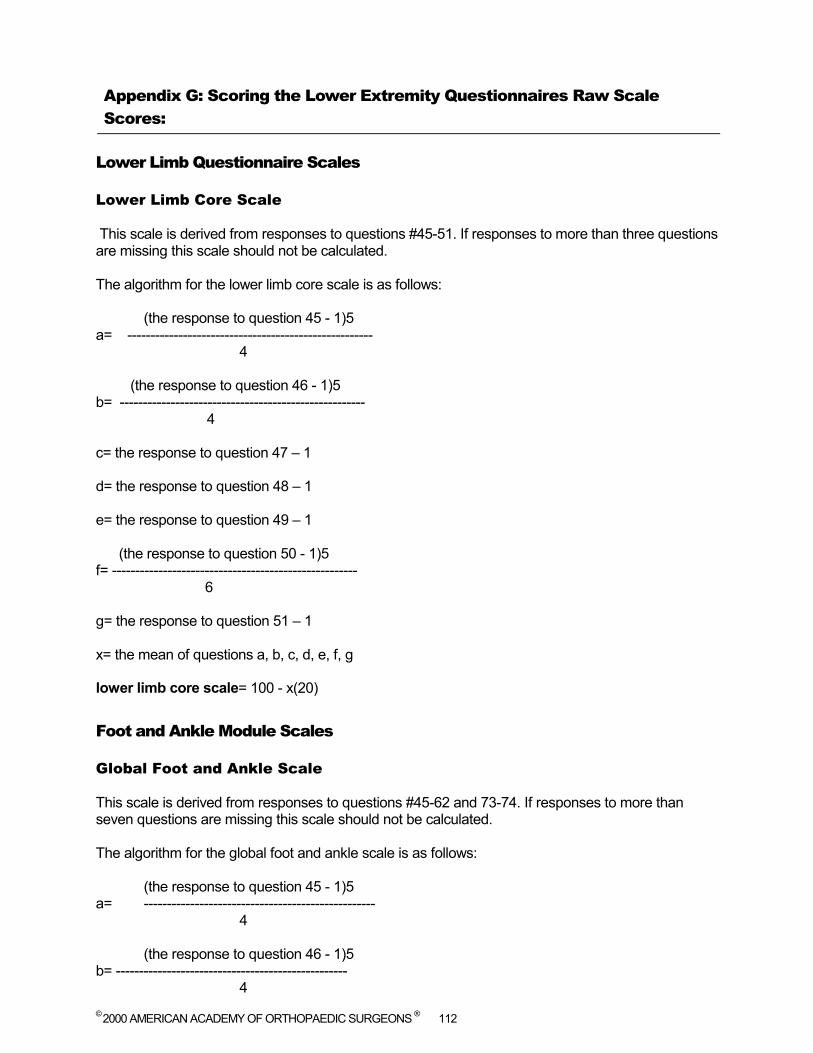
© 2000 AMERICAN ACADEMY OF ORTHOPAEDIC SURGEONS ® 112
Appendix G: Scoring the Lower Extremity Questionnaires Raw Scale Scores:
Lower Limb Questionnaire Scales
Lower Limb Core Scale
This scale is derived from responses to questions #45-51. If responses to more than three questions are missing this scale should not be calculated. The algorithm for the lower limb core scale is as follows:
(the response to question 45 - 1)5 a= -----------------------------------------------------
4
(the response to question 46 - 1)5 b= -----------------------------------------------------
4
c= the response to question 47 – 1 d= the response to question 48 – 1 e= the response to question 49 – 1 (the response to question 50 - 1)5 f= -----------------------------------------------------
6
g= the response to question 51 – 1 x= the mean of questions a, b, c, d, e, f, g lower limb core scale= 100 - x(20) Foot and Ankle Module Scales
Global Foot and Ankle Scale
This scale is derived from responses to questions #45-62 and 73-74. If responses to more than seven questions are missing this scale should not be calculated. The algorithm for the global foot and ankle scale is as follows:
(the response to question 45 - 1)5 a= --------------------------------------------------
4
(the response to question 46 - 1)5 b= --------------------------------------------------
4
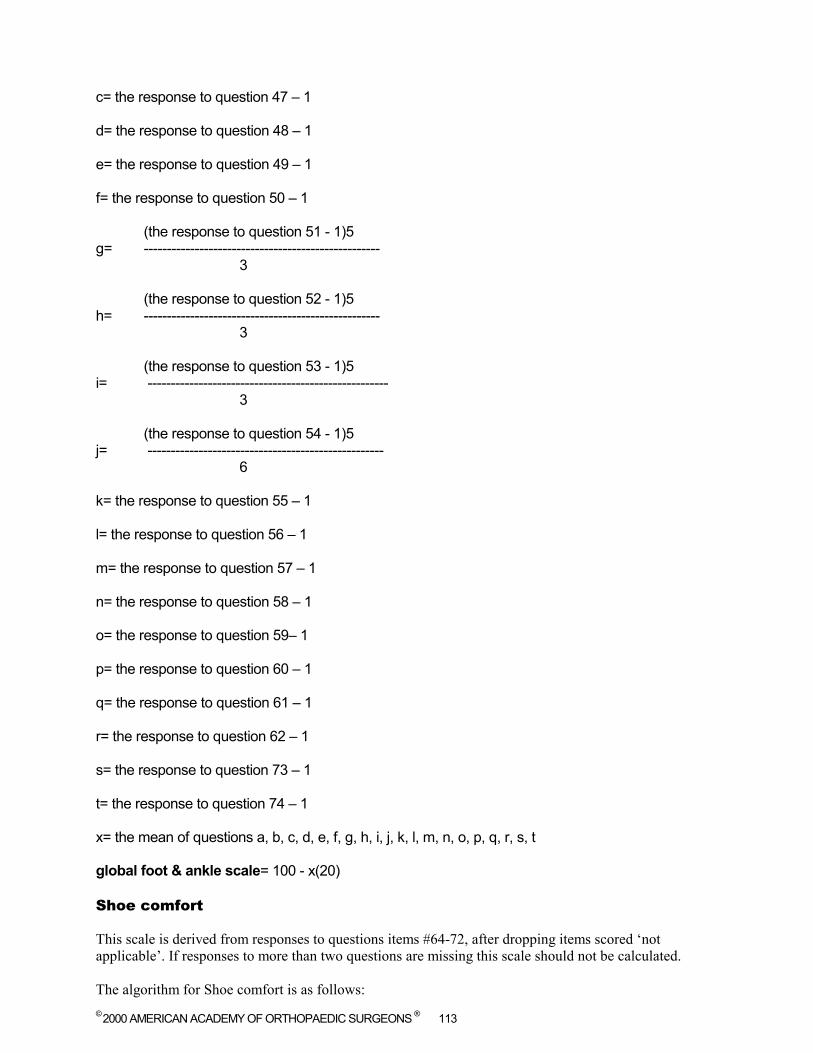
© 2000 AMERICAN ACADEMY OF ORTHOPAEDIC SURGEONS ® 113
c= the response to question 47 – 1 d= the response to question 48 – 1 e= the response to question 49 – 1 f= the response to question 50 – 1
(the response to question 51 - 1)5 g= ---------------------------------------------------
3
(the response to question 52 - 1)5 h= ---------------------------------------------------
3
(the response to question 53 - 1)5 i= ----------------------------------------------------
3
(the response to question 54 - 1)5 j= ---------------------------------------------------
6
k= the response to question 55 – 1 l= the response to question 56 – 1 m= the response to question 57 – 1 n= the response to question 58 – 1 o= the response to question 59– 1 p= the response to question 60 – 1 q= the response to question 61 – 1 r= the response to question 62 – 1 s= the response to question 73 – 1 t= the response to question 74 – 1 x= the mean of questions a, b, c, d, e, f, g, h, i, j, k, l, m, n, o, p, q, r, s, t global foot & ankle scale= 100 - x(20) Shoe comfort
This scale is derived from responses to questions items #64-72, after dropping items scored ‘not applicable’. If responses to more than two questions are missing this scale should not be calculated. The algorithm for Shoe comfort is as follows:
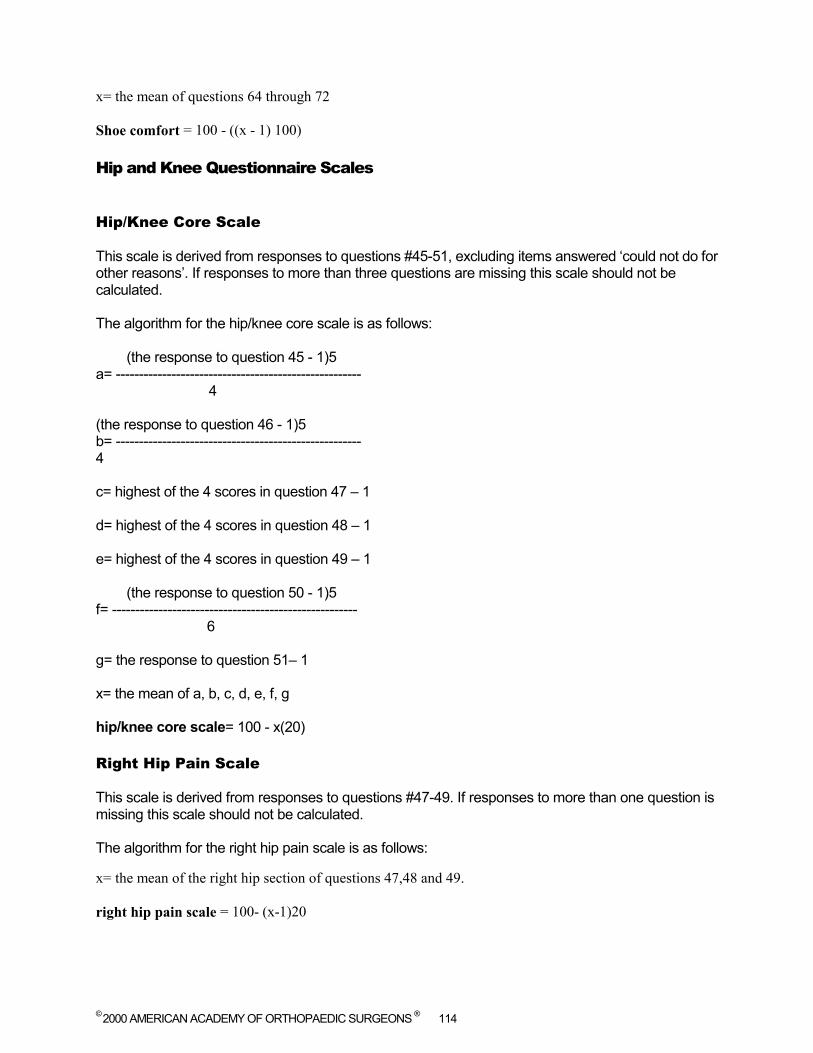
© 2000 AMERICAN ACADEMY OF ORTHOPAEDIC SURGEONS ® 114
x= the mean of questions 64 through 72 Shoe comfort = 100 - ((x - 1) 100) Hip and Knee Questionnaire Scales
Hip/Knee Core Scale
This scale is derived from responses to questions #45-51, excluding items answered ‘could not do for other reasons’. If responses to more than three questions are missing this scale should not be calculated. The algorithm for the hip/knee core scale is as follows: (the response to question 45 - 1)5 a= -----------------------------------------------------
4
(the response to question 46 - 1)5 b= ----------------------------------------------------- 4 c= highest of the 4 scores in question 47 – 1 d= highest of the 4 scores in question 48 – 1 e= highest of the 4 scores in question 49 – 1 (the response to question 50 - 1)5 f= -----------------------------------------------------
6 g= the response to question 51– 1 x= the mean of a, b, c, d, e, f, g hip/knee core scale= 100 - x(20) Right Hip Pain Scale
This scale is derived from responses to questions #47-49. If responses to more than one question is missing this scale should not be calculated. The algorithm for the right hip pain scale is as follows: x= the mean of the right hip section of questions 47,48 and 49. right hip pain scale = 100- (x-1)20

© 2000 AMERICAN ACADEMY OF ORTHOPAEDIC SURGEONS ® 115
Left Hip Pain Scale
This scale is derived from responses to questions #47-49. If responses to more than one question is missing this scale should not be calculated. The algorithm for the left hip pain scale is as follows: x= the mean of the left hip section of questions 47,48 and 49. left hip pain scale = 100- (x-1)20 Right Knee Pain Scale
This scale is derived from responses to questions #47-49. If responses to more than one question is missing this scale should not be calculated. The algorithm for the right knee pain scale is as follows: x= the mean of the right knee section of questions 47,48 and 49. right knee pain scale = 100- (x-1)20 Left Knee Pain Scale
This scale is derived from responses to questions #47-49. If responses to more than one question is missing this scale should not be calculated. The algorithm for the left knee pain scale is as follows: x= the mean of the left knee section of questions 47,48 and 49. left knee pain scale = 100- (x-1)20 Sports Knee Questionnaire Scales
Lower Limb Core Scale
This scale is derived from responses to questions #45-49, 58 and 59. If responses to more than three questions are missing this scale should not be calculated. The algorithm for the lower limb core scale is as follows: (the response to question 45 - 1)5 a= ----------------------------------------------------- 4 (the response to question 46 - 1)5 b= -----------------------------------------------------
4 c= the response to question 47 – 1 d= the response to question 48 – 1
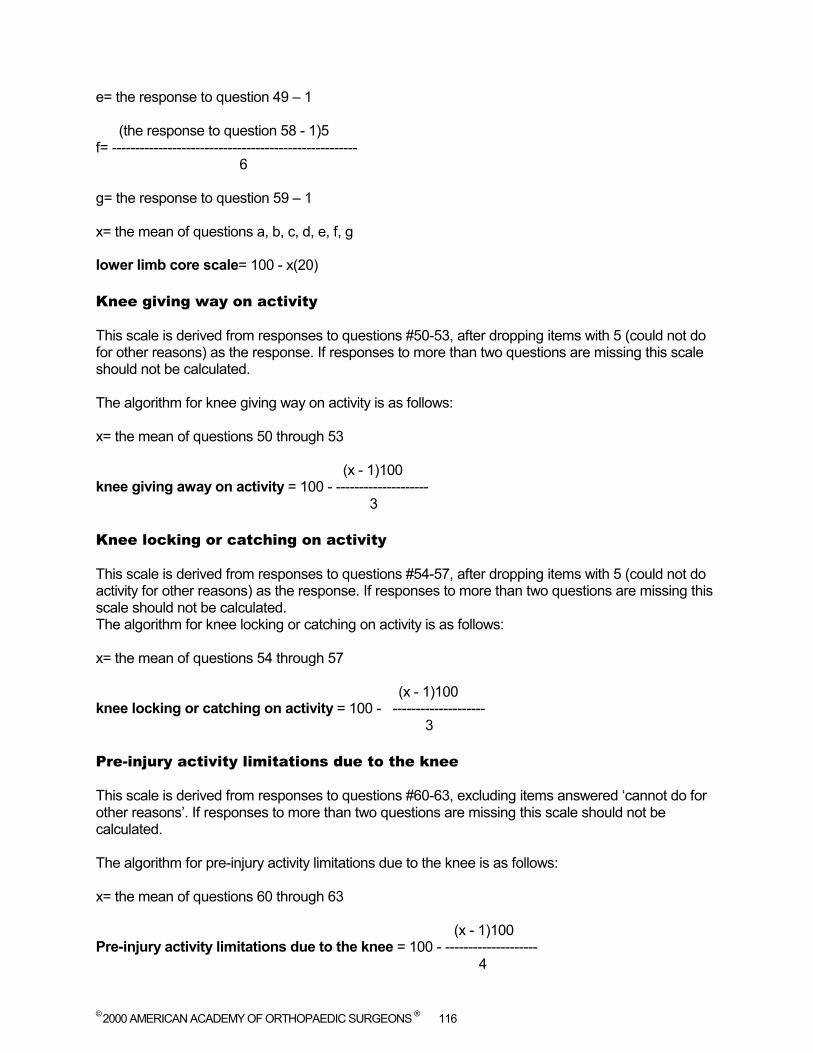
© 2000 AMERICAN ACADEMY OF ORTHOPAEDIC SURGEONS ® 116
e= the response to question 49 – 1 (the response to question 58 - 1)5 f= -----------------------------------------------------
6 g= the response to question 59 – 1 x= the mean of questions a, b, c, d, e, f, g lower limb core scale= 100 - x(20) Knee giving way on activity
This scale is derived from responses to questions #50-53, after dropping items with 5 (could not do for other reasons) as the response. If responses to more than two questions are missing this scale should not be calculated. The algorithm for knee giving way on activity is as follows: x= the mean of questions 50 through 53
(x - 1)100 knee giving away on activity = 100 - --------------------
3 Knee locking or catching on activity
This scale is derived from responses to questions #54-57, after dropping items with 5 (could not do activity for other reasons) as the response. If responses to more than two questions are missing this scale should not be calculated. The algorithm for knee locking or catching on activity is as follows: x= the mean of questions 54 through 57
(x - 1)100 knee locking or catching on activity = 100 - --------------------
3
Pre-injury activity limitations due to the knee
This scale is derived from responses to questions #60-63, excluding items answered ‘cannot do for other reasons’. If responses to more than two questions are missing this scale should not be calculated. The algorithm for pre-injury activity limitations due to the knee is as follows: x= the mean of questions 60 through 63
(x - 1)100 Pre-injury activity limitations due to the knee = 100 - --------------------
4
© 2000 AMERICAN ACADEMY OF ORTHOPAEDIC SURGEONS ® 117
Current activity limitations due to the knee
This scale is derived from responses to questions #64-67, excluding items answered ‘cannot do for other reasons’. If responses to more than two questions are missing this scale should not be calculated. The algorithm for current activity limitations due to the knee is as follows: x= the mean of questions 64 through 67
(x - 1)100 Current activity limitations due to the knee = 100 - --------------------
4
Pain on activity due to knee
This scale is derived from responses to questions #70-73, excluding items answered ‘cannot do for other reasons’. If responses to more than two questions are missing this scale should not be calculated. The algorithm for pain on activity due to knee is as follows: x= the mean of questions 70 through 73
(x - 1)100 Pain on activity due to knee = 100 - --------------------
4
© 2000 AMERICAN ACADEMY OF ORTHOPAEDIC SURGEONS ® 118
Appendix H: Scoring the Pediatrics Outcome Data Collection Questionnaires Raw Scale Scores:
All Pediatrics Questionnaires
Pediatric Comorbidity Index
The Comorbidities scale is composed of the scores from related items that are averaged and then re-scaled so that each is scored from 0 (no comorbidities) to 100 (highest level of comorbidities). This scale is derived from responses to questions #7-22. The algorithm for comorbidity is as follows: x= Starting at zero, add one point for each yes answer in the three columns (had disease, being treated for it, limits me) of questions 7 through 22. Note: if no yes's were chosen then x= 0 as we are assuming that no yes's means no comorbidities. ***************Note: If the respondent has answered yes to either Column 2 'Does your child receive treatment for it now?' or Column 3 'Are your child's activities limited by it now?' for a given comorbidity question then score one point for Column 1 'Has your child ever had it?' if the respondent did not answer the column for that question. *******************************
x Comorbidity Index= --------------- 100
48
Comorbidity Sub-scales
The Comorbidities sub-scales are composed of the scores from related items that are averaged and then re-scaled so that each is scored from 0 (no comorbidities) to 100 (highest level of comorbidities). These scales are derived from responses to questions #7-22. Sub-scale 1 'Has your child ever had it?'
This scale is derived from responses in column 1 to questions #7-22. The algorithm for the 'Has your child ever had it?' comorbidity sub-scale is as follows: x= Starting at zero add one point for each yes answer in column 1 'Has your child ever had it? of questions 7 through 22
x 'Has your child ever had it?' comorbidity sub-scale Index= --------------- 100
16 Sub-scale 2 'Does your child receive treatment for it now?'
This scale is derived from responses in column 2 to #7-22. The algorithm for the 'Does your child receive treatment for it now?' comorbidity sub-scale is as follows:
© 2000 AMERICAN ACADEMY OF ORTHOPAEDIC SURGEONS ® 119
x= Starting at zero add one point for each yes answer in column 2 'Does your child receive treatment for it now? of questions 7 through 22.
x 'Does your child receive treatment for it now?' comorbidity sub-scale Index= --------------- 100
16
Sub-scale 3 'Are your child's activities limited by it now?'
This scale is derived from responses in column 3 to questions #7-22. The algorithm for the 'Are your child's activities limited by it now?' comorbidity sub-scale is as follows: x= Starting at zero add one point for each yes answer in column 3 'Are your child's activities limited by it now?' of questions 7 through 22
x 'Are your child's activities limited by it now?' comorbidity sub-scale Index= --------------- 100
16 Parent (Child) Questionnaire
Upper extremity and physical function
This scale is derived from responses to questions #26, 27, 28, 29, 30, 31, 33, and 57, omitting those scored 'too young'. If responses to more than 4 questions are missing this scale should not be calculated. The algorithm for the upper extremity and physical function is as follows: x=mean of questions #26, 27, 28, 29, 30, 31, 33, and 57.
(4 - x) 100 Upper extremity and physical function= --------------------
3
Transfers and basic mobility
This scale is derived from responses to questions #32, 46, 49, 50, 53, 54, 55, 56, 58, 59, 60, omitting those scored 'too young'. If responses to more than 4 questions are missing this scale should not be calculated. The algorithm for the Transfers and basic mobility is as follows: (the response to question 59 - 1)3 y= --------------------------------------------------- + 1 4 (the response to question 60 - 1)3 z= ---------------------------------------------------- + 1 4
© 2000 AMERICAN ACADEMY OF ORTHOPAEDIC SURGEONS ® 120
x=mean of questions #32, 46, 49, 50, 53, 54, 55, 56, 58, y, and z. (4 - x) 100 Transfers and basic mobility = -------------------- 3 Sports and physical function
This scale is derived from responses to questions #43, 44, 45, 47, 48, 51, 52, 61, 69, 77, 85, 91, omitting those scored 'too young'. If responses to more than 6 questions are missing this scale should not be calculated. If 85 is scored 3, and 87 is scored 1, then question 85 will be treated as a missing answer, and xy should be omitted from the mean. If 91 is scored 3 and 97 or 98 are scored 1, then question 91 will be treated as a missing answer, and xz should be omitted from the mean. If 91 is scored 4, then question 91 will be treated as a missing answer, and xz should be omitted from the mean. (the response to question 51 - 1)3 y= --------------------------------------------------- + 1
4 (the response to question 52 - 1)3 z= ---------------------------------------------------- + 1 4 (the response to question 85 - 1)3 xy= -------------------------------------------------- + 1
2 (the response to question 88 - 1)3 xz= ------------------------------------------------- + 1
2 x= the mean of #43, 44, 45, 47, 48, y, z, 61, 69, 77, xy, and xz.
(4 - x) 100 Sports and physical function= ----------------------- 3 Pain/comfort
This scale is derived from responses to questions 100, 101, 42 (reversed). If responses to more than 1 question are missing this scale should not be calculated. (4 - the response to question 42) 4 y= ------------------------------------------------- +1
3 (the response to question 100 - 1)4 z= ------------------------------------------------- +1
5
x= the mean of y, z, and question #101.

© 2000 AMERICAN ACADEMY OF ORTHOPAEDIC SURGEONS ® 121
(4 - (x - 1)) 100 Pain/comfort = ----------------------------
4
Expectations
This scale is derived from responses to questions #102-110. If responses to more than 4 questions are missing this scale should not be calculated. x= the mean of questions #102-110.
(x - 1)100 Expectations=100 - --------------------
4
Happiness
This scale is derived from responses to questions #35-39. If responses to more than 2 questions are missing this scale should not be calculated; omitting those scored ‘too young’. x= the mean of questions #35-39.
(5 - x) 100 Happiness= -------------------
4 Satisfaction with symptoms
This scale is derived from the response to question #111 scaled 1-5 (reversed in order to maintain consistency between all AAOS questionnaires), where 1=very dissatisfied and 5=very satisfied. If there was no response to question #111 then this scale cannot be calculated. Global function and symptoms
This scale is derived from the scale scores from the following four scales: 'Upper extremity and physical function'; 'Transfer and basic mobility'; 'Sports and physical function'; and 'Pain/comfort'. If the scores to any of the four scales are missing then this scale should not be calculated. Global function and symptoms= take the mean of the scale scores from the following four scales: 'Upper extremity and physical function'; 'Transfer and basic mobility'; 'Sports and physical function' and 'Pain/comfort'. Parent (Adolescent) Questionnaire
Upper extremity and physical function
This scale is derived from responses to questions #26, 27, 28, 29, 30, 31, 33, and 57, omitting those scored 'too young'. If responses to more than 4 questions are missing this scale should not be calculated. The algorithm for the upper extremity and physical function is as follows: x=mean of questions #26, 27, 28, 29, 30, 31, 33, and 57.
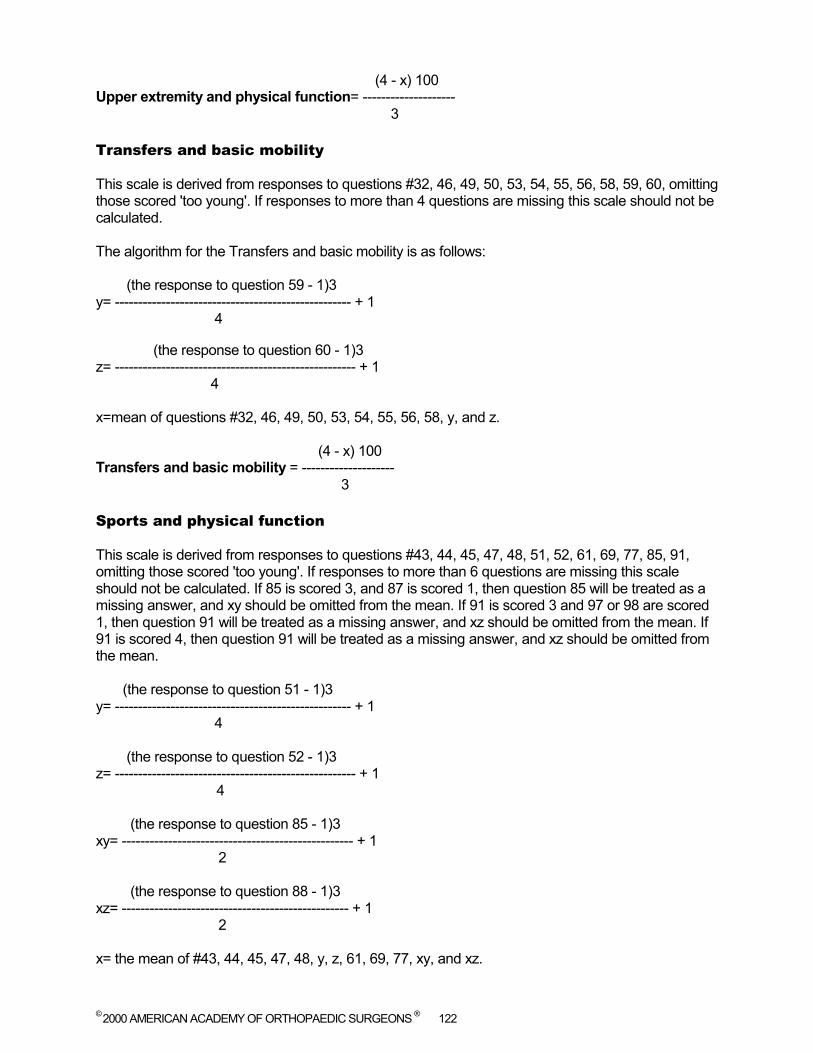
© 2000 AMERICAN ACADEMY OF ORTHOPAEDIC SURGEONS ® 122
(4 - x) 100 Upper extremity and physical function= --------------------
3
Transfers and basic mobility
This scale is derived from responses to questions #32, 46, 49, 50, 53, 54, 55, 56, 58, 59, 60, omitting those scored 'too young'. If responses to more than 4 questions are missing this scale should not be calculated. The algorithm for the Transfers and basic mobility is as follows: (the response to question 59 - 1)3 y= --------------------------------------------------- + 1 4 (the response to question 60 - 1)3 z= ---------------------------------------------------- + 1 4 x=mean of questions #32, 46, 49, 50, 53, 54, 55, 56, 58, y, and z. (4 - x) 100 Transfers and basic mobility = -------------------- 3 Sports and physical function
This scale is derived from responses to questions #43, 44, 45, 47, 48, 51, 52, 61, 69, 77, 85, 91, omitting those scored 'too young'. If responses to more than 6 questions are missing this scale should not be calculated. If 85 is scored 3, and 87 is scored 1, then question 85 will be treated as a missing answer, and xy should be omitted from the mean. If 91 is scored 3 and 97 or 98 are scored 1, then question 91 will be treated as a missing answer, and xz should be omitted from the mean. If 91 is scored 4, then question 91 will be treated as a missing answer, and xz should be omitted from the mean. (the response to question 51 - 1)3 y= --------------------------------------------------- + 1
4 (the response to question 52 - 1)3 z= ---------------------------------------------------- + 1 4 (the response to question 85 - 1)3 xy= -------------------------------------------------- + 1
2 (the response to question 88 - 1)3 xz= ------------------------------------------------- + 1
2 x= the mean of #43, 44, 45, 47, 48, y, z, 61, 69, 77, xy, and xz.
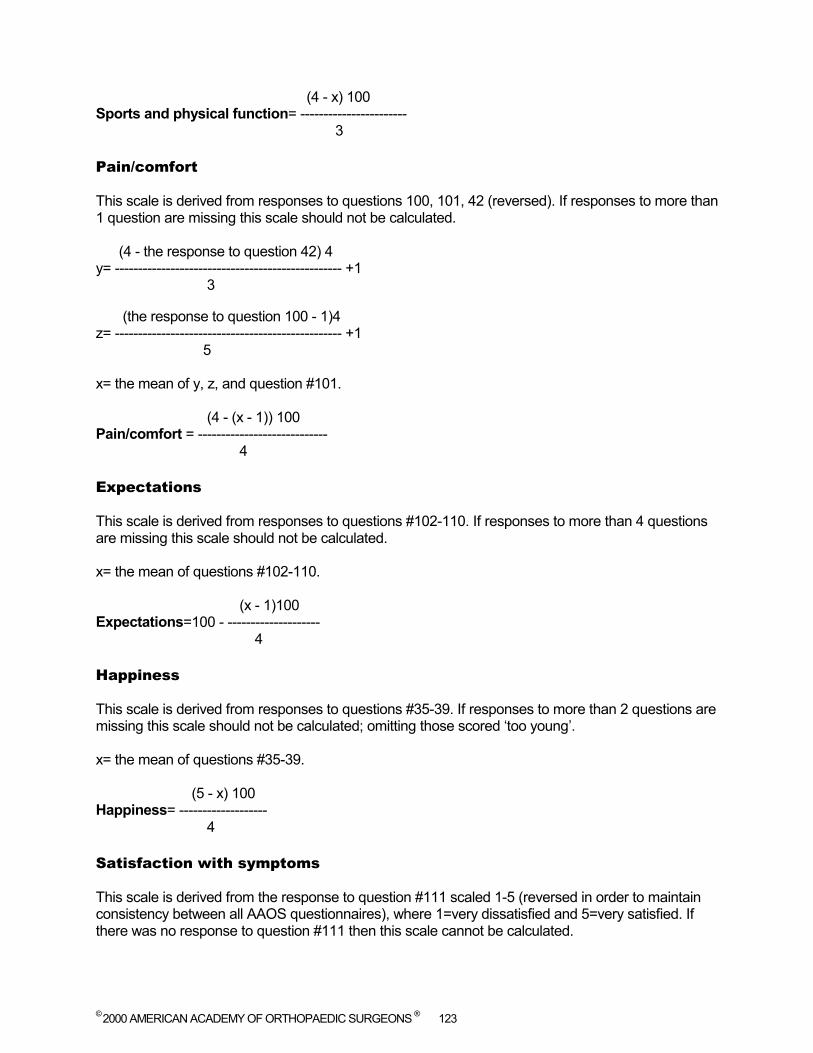
© 2000 AMERICAN ACADEMY OF ORTHOPAEDIC SURGEONS ® 123
(4 - x) 100
Sports and physical function= ----------------------- 3 Pain/comfort
This scale is derived from responses to questions 100, 101, 42 (reversed). If responses to more than 1 question are missing this scale should not be calculated. (4 - the response to question 42) 4 y= ------------------------------------------------- +1
3 (the response to question 100 - 1)4 z= ------------------------------------------------- +1
5
x= the mean of y, z, and question #101.
(4 - (x - 1)) 100 Pain/comfort = ----------------------------
4
Expectations
This scale is derived from responses to questions #102-110. If responses to more than 4 questions are missing this scale should not be calculated. x= the mean of questions #102-110.
(x - 1)100 Expectations=100 - --------------------
4
Happiness
This scale is derived from responses to questions #35-39. If responses to more than 2 questions are missing this scale should not be calculated; omitting those scored ‘too young’. x= the mean of questions #35-39.
(5 - x) 100 Happiness= -------------------
4 Satisfaction with symptoms
This scale is derived from the response to question #111 scaled 1-5 (reversed in order to maintain consistency between all AAOS questionnaires), where 1=very dissatisfied and 5=very satisfied. If there was no response to question #111 then this scale cannot be calculated.

© 2000 AMERICAN ACADEMY OF ORTHOPAEDIC SURGEONS ® 124
Global function and symptoms
This scale is derived from the scale scores from the following four scales: 'Upper extremity and physical function'; 'Transfer and basic mobility'; 'Sports and physical function'; and 'Pain/comfort'. If the scores to any of the four scales are missing then this scale should not be calculated. Global function and symptoms= take the mean of the scale scores from the following four scales: 'Upper extremity and physical function'; 'Transfer and basic mobility'; 'Sports and physical function' and 'Pain/comfort'. Adolescent Questionnaire
Upper extremity and physical function
This scale is derived from responses to questions #26, 27, 28, 29, 30, 31, 33 and 57. If responses to more than 4 questions are missing this scale should not be calculated. The algorithm for the upper extremity and physical function is as follows: x=mean of questions #26, 27, 28, 29, 30, 31, 33 and 57.
(4 - x) 100 Upper extremity and physical function= --------------------
3
Transfers and basic mobility
This scale is derived from responses to questions #32, 46, 49, 50, 53, 54, 55, 56, 58, 59, and 60. If responses to more than 4 questions are missing this scale should not be calculated. The algorithm for the Transfers and basic mobility is as follows: (the response to question 59 - 1) y= --------------------------------------------------- + 1
4
(the response to question 60 - 1)3 z= ---------------------------------------------------- + 1
4
x=mean of questions #32, 46, 49, 50, 53, 54, 55, 56, 58, y, and z.
(4 - x) 100 Transfers and basic mobility = --------------------
3
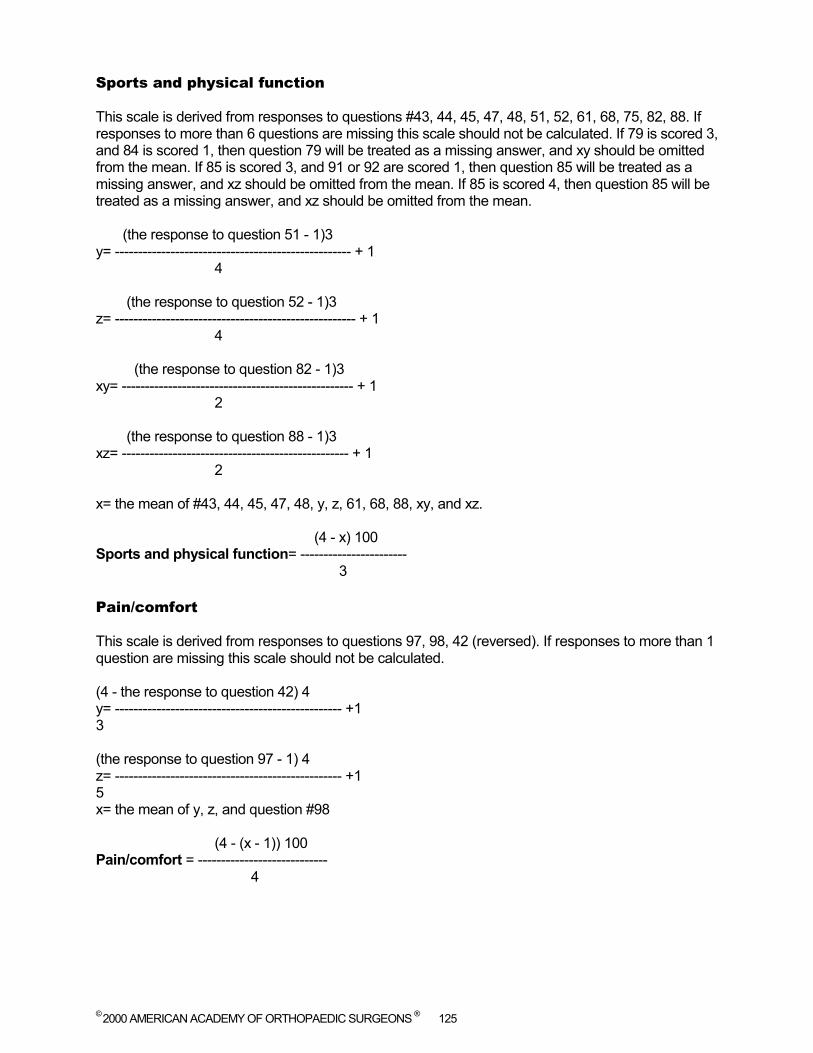
© 2000 AMERICAN ACADEMY OF ORTHOPAEDIC SURGEONS ® 125
Sports and physical function
This scale is derived from responses to questions #43, 44, 45, 47, 48, 51, 52, 61, 68, 75, 82, 88. If responses to more than 6 questions are missing this scale should not be calculated. If 79 is scored 3, and 84 is scored 1, then question 79 will be treated as a missing answer, and xy should be omitted from the mean. If 85 is scored 3, and 91 or 92 are scored 1, then question 85 will be treated as a missing answer, and xz should be omitted from the mean. If 85 is scored 4, then question 85 will be treated as a missing answer, and xz should be omitted from the mean. (the response to question 51 - 1)3 y= --------------------------------------------------- + 1
4
(the response to question 52 - 1)3 z= ---------------------------------------------------- + 1
4 (the response to question 82 - 1)3 xy= -------------------------------------------------- + 1
2
(the response to question 88 - 1)3 xz= ------------------------------------------------- + 1
2
x= the mean of #43, 44, 45, 47, 48, y, z, 61, 68, 88, xy, and xz.
(4 - x) 100 Sports and physical function= -----------------------
3 Pain/comfort
This scale is derived from responses to questions 97, 98, 42 (reversed). If responses to more than 1 question are missing this scale should not be calculated. (4 - the response to question 42) 4 y= ------------------------------------------------- +1 3 (the response to question 97 - 1) 4 z= ------------------------------------------------- +1 5 x= the mean of y, z, and question #98
(4 - (x - 1)) 100 Pain/comfort = ----------------------------
4
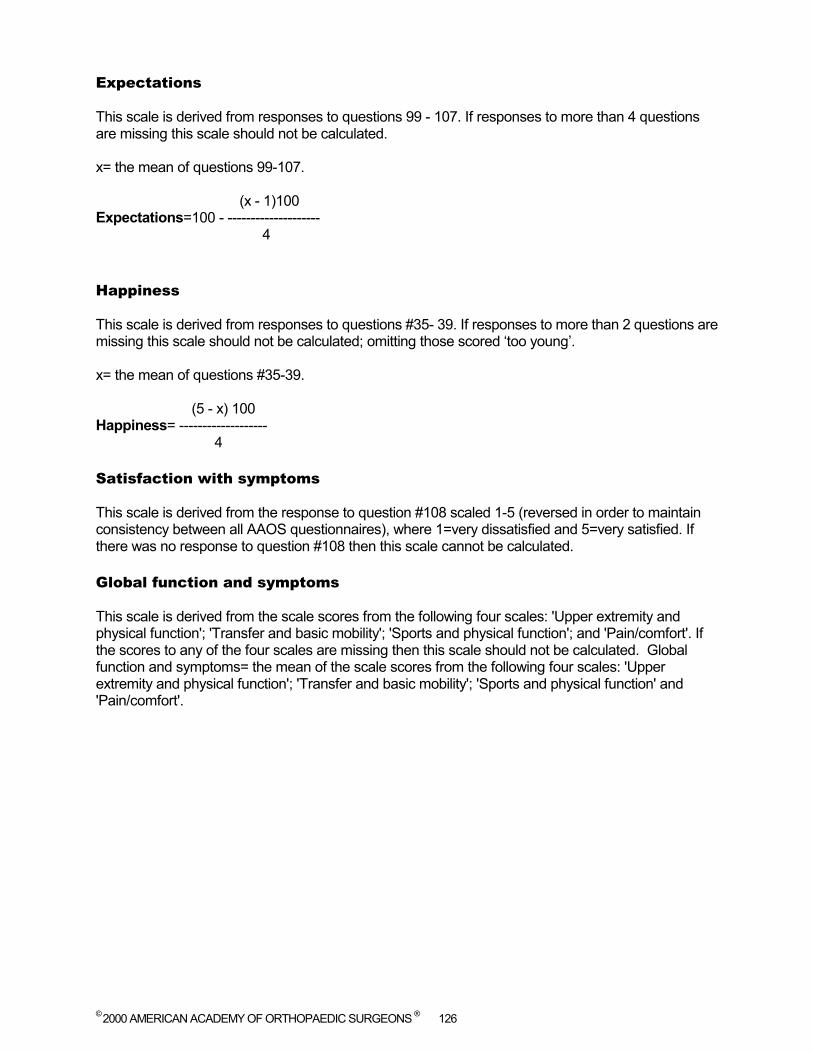
© 2000 AMERICAN ACADEMY OF ORTHOPAEDIC SURGEONS ® 126
Expectations
This scale is derived from responses to questions 99 - 107. If responses to more than 4 questions are missing this scale should not be calculated. x= the mean of questions 99-107.
(x - 1)100 Expectations=100 - --------------------
4
Happiness
This scale is derived from responses to questions #35- 39. If responses to more than 2 questions are missing this scale should not be calculated; omitting those scored ‘too young’. x= the mean of questions #35-39.
(5 - x) 100 Happiness= -------------------
4 Satisfaction with symptoms
This scale is derived from the response to question #108 scaled 1-5 (reversed in order to maintain consistency between all AAOS questionnaires), where 1=very dissatisfied and 5=very satisfied. If there was no response to question #108 then this scale cannot be calculated. Global function and symptoms
This scale is derived from the scale scores from the following four scales: 'Upper extremity and physical function'; 'Transfer and basic mobility'; 'Sports and physical function'; and 'Pain/comfort'. If the scores to any of the four scales are missing then this scale should not be calculated. Global function and symptoms= the mean of the scale scores from the following four scales: 'Upper extremity and physical function'; 'Transfer and basic mobility'; 'Sports and physical function' and 'Pain/comfort'.
© 2000 AMERICAN ACADEMY OF ORTHOPAEDIC SURGEONS ® 127
Index of Tables:
TABLE 1.1: UPPER LIMB NORMATIVE SCORES ...................................................................................................20 TABLE 1.2: UPPER LIMB NORMATIVE SCORES BY GENDER...............................................................................21 TABLE 1.3: UPPER LIMB NORMATIVE SCORES BY AGE .....................................................................................22 TABLE 1.4: UPPER LIMB NORMATIVE SCORES BY ETHNICITY ..........................................................................23 TABLE 1.5: UPPER LIMB NORMATIVE SCORES BY COMORBIDITY ....................................................................24 TABLE 2.1: SMFA NORMATIVE SCORES.............................................................................................................28 TABLE 2.2: SMFA NORMATIVE SCORES BY GENDER........................................................................................29 TABLE 2.3: SMFA NORMATIVE SCORES BY AGE GROUP..................................................................................30 TABLE 2.4: SMFA NORMATIVE SCORES BY ETHNICITY....................................................................................31 TABLE 3.1: LUMBAR SPINE NORMATIVE SCORES...............................................................................................34 TABLE 3.2: LUMBAR SPINE NORMATIVE SCORES BY GENDER..........................................................................35 TABLE 3.3: LUMBAR SPINE NORMATIVE SCORES BY AGE GROUP....................................................................35 TABLE 3.4: LUMBAR SPINE NORMATIVE SCORES BY ETHNICITY......................................................................36 TABLE 3.5: LUMBAR SPINE NORMATIVE SCORES BY COMORBIDITY................................................................37 TABLE 4.1: CERVICAL SPINE NORMATIVE SCORES............................................................................................40 TABLE 4.2: CERVICAL SPINE NORMATIVE SCORES BY GENDER .......................................................................40 TABLE 4.3: CERVICAL SPINE NORMATIVE SCORES BY AGE GROUP .................................................................41 TABLE 4.3: CERVICAL SPINE NORMATIVE SCORES BY ETHNICITY ...................................................................42 TABLE 4.4: CERVICAL SPINE NORMATIVE SCORES BY COMORBIDITY.............................................................43 TABLE 5.1: FOOT/ANKLE NORMATIVE SCORES..................................................................................................47 TABLE 5.2: FOOT/ANKLE NORMATIVE SCORES BY GENDER.............................................................................48 TABLE 5.3: FOOT/ANKLE NORMATIVE SCORES BY AGE GROUP.......................................................................48 TABLE 5.4: FOOT/ANKLE NORMATIVE SCORES BY ETHNICITY.........................................................................49 TABLE 5.5: FOOT/ANKLE NORMATIVE SCORES BY COMORBIDITY CONDITION ..............................................50 TABLE 6.1: HIP AND KNEE NORMATIVE SCORES................................................................................................53 TABLE 6.2: HIP AND KNEE NORMATIVE SCORES BY GENDER...........................................................................54 TABLE 6.3: HIP AND KNEE NORMATIVE SCORES BY AGE GROUP.....................................................................54 TABLE 6.4: HIP AND KNEE NORMATIVE SCORES BY ETHNICITY.......................................................................55 TABLE 6.5: HIP AND KNEE NORMATIVE SCORES BY COMORBIDITY.................................................................56 TABLE 7.1: LOWER LIMB NORMATIVE SCORES..................................................................................................59 TABLE 7.2: LOWER LIMB NORMATIVE SCORES BY GENDER.............................................................................59 TABLE 7.3: LOWER LIMB NORMATIVE SCORES BY AGE GROUP.......................................................................60 TABLE 7.4: LOWER LIMB NORMATIVE SCORES BY ETHNICITY.........................................................................61 TABLE 7.5: LOWER LIMB NORMATIVE SCORES BY COMORBIDITY...................................................................62 TABLE 8.1: SPORT KNEE NORMATIVE SCORES...................................................................................................65 TABLE 8.3: SPORT KNEE NORMATIVE SCORES BY GENDER..............................................................................65 TABLE 8.4: SPORT KNEE NORMATIVE SCORES BY AGE GROUP........................................................................66 TABLE 8.5: SPORT KNEE NORMATIVE SCORES BY ETHNICITY..........................................................................67 TABLE 8.6: SPORT KNEE NORMATIVE SCORES BY COMORBIDITY....................................................................68 TABLE 9.1: PEDIATRIC PARENT CHILD NORMATIVE SCORES............................................................................72 TABLE 9.2: PEDIATRIC PARENT CHILD NORMATIVE SCORES BY GENDER.......................................................73 TABLE 9.3: PEDIATRIC PARENT CHILD NORMATIVE SCORES BY ETHNICITY...................................................73 TABLE 9.4: PEDIATRIC PARENT CHILD NORMATIVE SCORES BY COMORBIDITY.............................................74 TABLE 10.1: PEDIATRIC PARENT ADOLESCENT NORMATIVE SCORES..............................................................77 TABLE 11.2: PEDIATRIC PARENT ADOLESCENT NORMATIVE SCORES BY GENDER.........................................78 TABLE 11.3: PEDIATRIC PARENT ADOLESCENT NORMATIVE SCORES BY ETHNICITY.....................................79 TABLE 11.4: PEDIATRIC PARENT ADOLESCENT NORMATIVE SCORES BY COMORBIDITY...............................80 TABLE 11.1: PEDIATRIC ADOLESCENT NORMATIVE SCORES ............................................................................83 TABLE 11.2: PEDIATRIC ADOLESCENT NORMATIVE SCORES BY GENDER .......................................................84 TABLE 11.3: PEDIATRIC ADOLESCENT NORMATIVE SCORES BY ETHNICITY ...................................................84 TABLE 11.4: PEDIATRIC ADOLESCENT NORMATIVE SCORES BY COMOBIDITY................................................85 TABLE 12.1: ADULT COMORBIDITY NORMATIVE SCORES.................................................................................90
© 2000 AMERICAN ACADEMY OF ORTHOPAEDIC SURGEONS ® 128
TABLE 12.2: ADULT COMORBIDITY NORMATIVE SCORES BY GENDER............................................................91 TABLE 12.3: ADULT COMORBIDITY NORMATIVE SCORES BY AGE GROUP......................................................91 TABLE12.4: ADULT COMORBIDITY NORMATIVE SCORES BY ETHNICITY ........................................................92 TABLE 12.5: ADULT COMORBIDITY NORMATIVE SCORES BY COMORBIDITY..................................................94 TABLE 13.1: PEDIATRIC COMORBIDITY NORMATIVE SCORES...........................................................................96 TABLE 13.2: PEDIATRIC COMORBIDITY NORMATIVE SCORES BY.....................................................................97 TABLE 13.3: PEDIATRIC COMORBIDITY NORMATIVE SCORES BY AGE.............................................................97 TABLE 13.4: PEDIATRIC COMORBIDITY NORMATIVE SCORES BY ETHNICITY..................................................98 TABLE 13.5: PEDIATRIC COMORBIDITY NORMATIVE SCORES BY COMORBIDITY............................................99