Embed Size (px)
Citation preview
AMERICAN ASSOCIATION OF WINE ECONOMISTS
AAWE WORKING PAPER No. 19
THE AGRICULTURAL AND FOOD TRADE IN THE FIRST GLOBALISATION:
SPANISH TABLE WINE EXPORTS 1871 TO 1935 – A CASE STUDY
Vicente Pinilla and Raúl Serrano
August 2008 www.wine-economics.org
THE AGRICULTURAL AND FOOD TRADE IN THE FIRST GLOBALISATION: SPANISH TABLE WINE EXPORTS 1871 TO 1935 – A CASE STUDY
Vicente Pinillaa and Raúl Serranob
a Department of Applied Economics and Economic History, University of Zaragoza, Gran Vía 4,
50005 Zaragoza (Spain) b Department of Business Administration, University of Zaragoza, Gran Vía 4, 50005 Zaragoza
(Spain)
1. Introduction
The international economy has, for several decades, undergone an intensive
process of integration, which has offered developing countries opportunities to increase
their exports and, consequently, stimulate their economic growth. Although since the
middle of the twentieth century, the greatest opportunities have emerged in the export of
manufactured goods, for some countries primary products still constitute a substantial
part of their foreign trade and the currency gained through trade. It is well known,
however, that the development of such exports faces very diverse difficulties, such as
the inelastic income demand for agricultural products, the low participation of these
goods in intra-industrial trade or the serious institutional obstacles which exist, derived
from the existence of protectionist policies, especially in the more developed countries,
which limit their the possibilities of in this direction (Serrano and Pinilla, forthcoming).
The first phase of globalisation, which occurred between the mid-nineteenth
century and the First World War, allows us to analyse, albeit in a different historical
context, the principal factors which determine the possibilities of trade growth in the
long term.
The debate regarding the causes which determined the growth of trade in the
first phase of globalisation has notable similarities to that which currently exists with
regard to the second phase, although the historical circumstances are obviously
different. There is widespread agreement that the increase in incomes has, obviously,
been a fundamental cause of its growth (Irwin, 2002; Estevadeordal et al., 2003; Jacks
and Pendakur, 2007). In addition, trade liberalization and exchange rate stability have
been very important (Jacks, 2006; Estevadeordal et al., 2003; López-Cordova and
Meissner, 2001). By contrast, the debate regarding the role of the reduction of transport
costs is by no means closed; certain authors believe that this was essential to explain the
growth of trade (O’Rourke and Williamson, 1999; Jacks et al., 2008), while others find
no evidence on this point (Jacks and Pendakur, 2007). Similarly, different positions
exist between those who consider that the stock of immigrants in a country stimulated
its trade with their country of origin (Dunlevy and Hutchinson, 1999) and those who
believe that the effects of this circumstance were neutral (Jacks, 2005). Belonging to an
empire, and therefore lower transaction costs or more favourable trade policies, has also
been considered to encourage trade growth in this period (Mitchener and Wedenmier,
2008).
Within this context, the present study concentrates on trade in agricultural
products, a group of products which played a central role in this period, maintaining
from 1870 onwards a fairly stable participation of approximately 50% of international
exchanges (Aparicio et al., 2008). However, very few studies have focused specifically
on the determinants which stimulated trade in this type of products, and even less so on
those which played such a role in this historical context.
To this end, the present study concentrates on a specific case i.e. trade in Spanish
table wine. Wine was one of the key exports produced by Spanish farmers in the mid-
nineteenth century. Together with cereals (especially wheat) and oil, it was one of the
three key products of Mediterranean agriculture, occupying a significant part of
cultivated land and agricultural production.
In the analysis of this case, the literature initially analysed the success of exports
and their subsequent collapse as the exclusive consequence of the exceptional demand
which existed in France between 1875 and 1891, due to the harm caused by the
phylloxera plague in its vineyards (Carnero, 1980). Subsequently, certain wider visions
explained the success of exports to France in the general context of the unequal
advances of Spain in other markets (Pan-Montojo, 1994), or in the consideration of
table wine as a product with low barriers to entry and therefore highly vulnerable to the
entry of new producers; moreover, it encountered difficulties in penetrating the markets
of non-producing countries (Simpson, 1995).
In recent years, various studies have attempted to study in depth the above-
mentioned research lines, broadening them or employing different approaches with the
help of econometric models which made it possible to empirically verify the proposed
hypotheses. Most notable is the consideration of the harm caused by the French tariff
policy (Pinilla and Ayuda, 2002) and the difficulties in penetrating the markets of high-
income countries (Ayuda, Aparicio and Pinilla, 1998; Pinilla and Ayuda, 2007 and
2008).
Given this background, the objective of the present study is to analyze the
overall trajectory of table wine exports and provide convincing explanations of the
pattern. Thus, we employ an approach that takes all of the possible explanatory factors
into account, instead of adopting a narrower approach which focuses on a single
principal factor. The methodology employed consists of using a gravity model to
explain trade flows in Spanish table wine.
Our results highlight the key role of trade policies in the determination of export
possibilities and the difficulties derived from the export of products which are
characterised by the low or non-existent change in demand when income changes.
These results may shed a little more light on the determinants of trade in the first phase
of globalization.
Following this introduction, the next section briefly examines Spanish exports of
table wine. Subsequently, the data used and the gravity model employed are explained.
Next, an analysis is made of the results obtained from the econometric model. Finally,
the article ends by providing some conclusions.
2. A stylized vision of the facts: the development of Spanish exports of table
wine
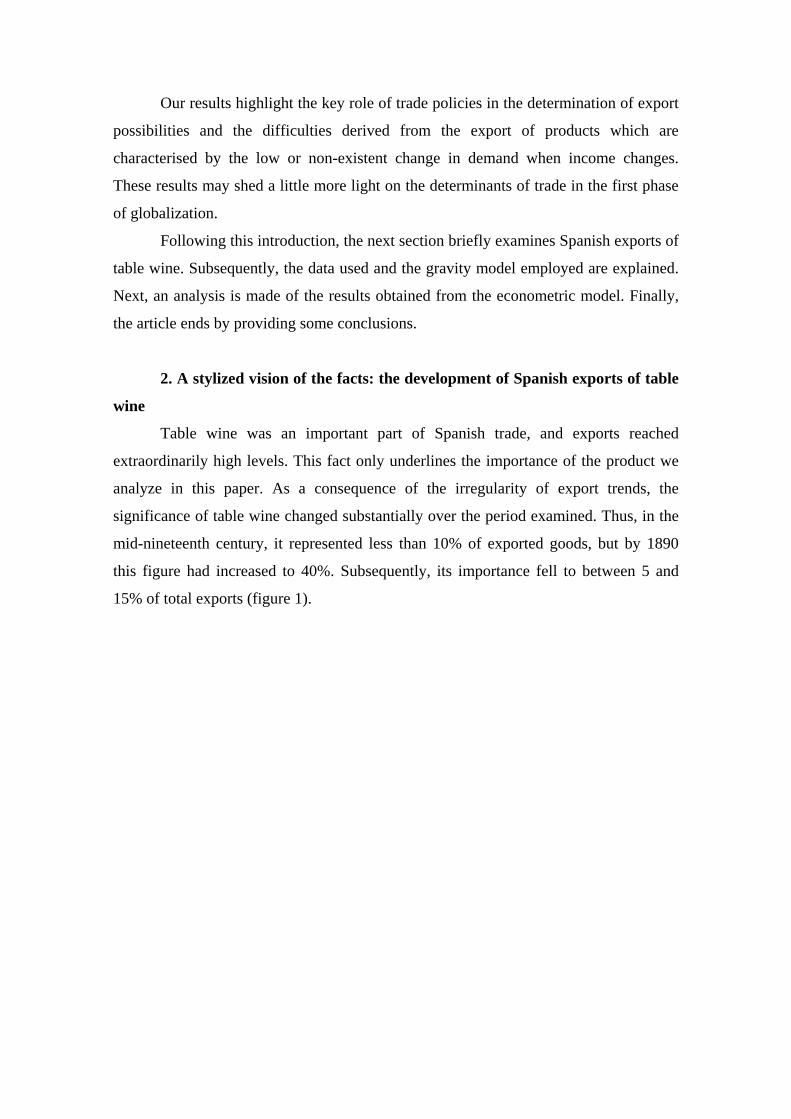
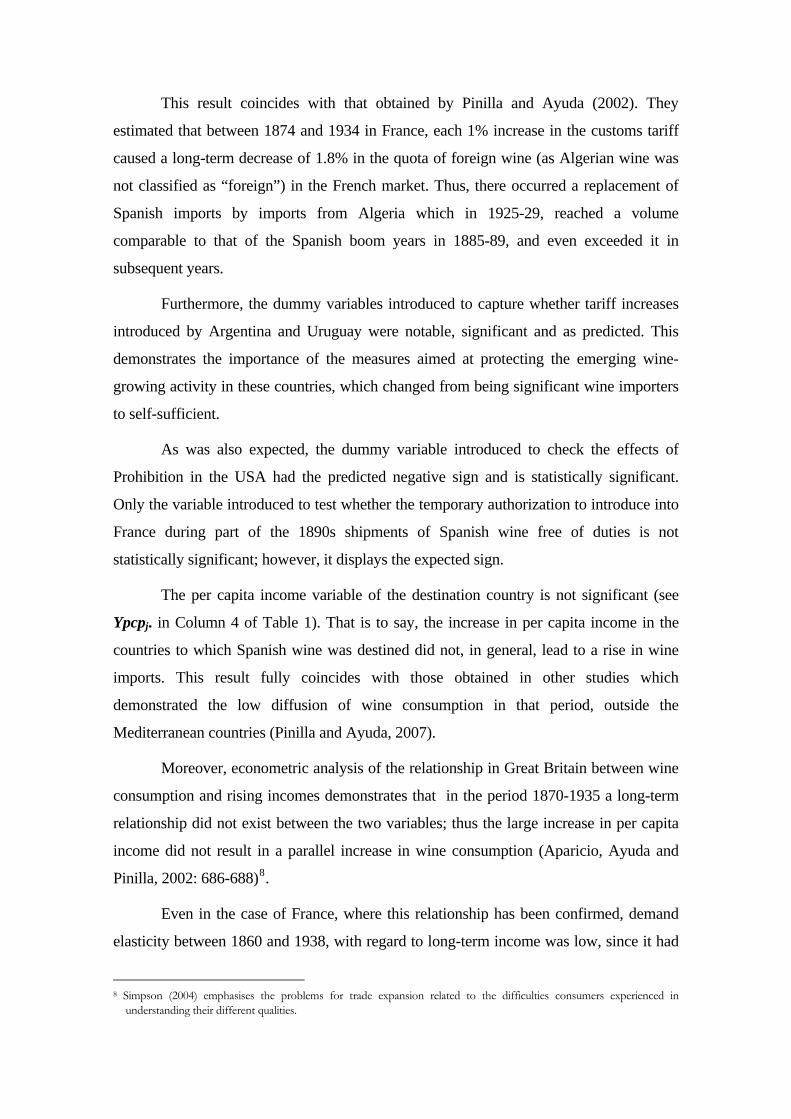
Table wine was an important part of Spanish trade, and exports reached
extraordinarily high levels. This fact only underlines the importance of the product we
analyze in this paper. As a consequence of the irregularity of export trends, the
significance of table wine changed substantially over the period examined. Thus, in the
mid-nineteenth century, it represented less than 10% of exported goods, but by 1890
this figure had increased to 40%. Subsequently, its importance fell to between 5 and
15% of total exports (figure 1).
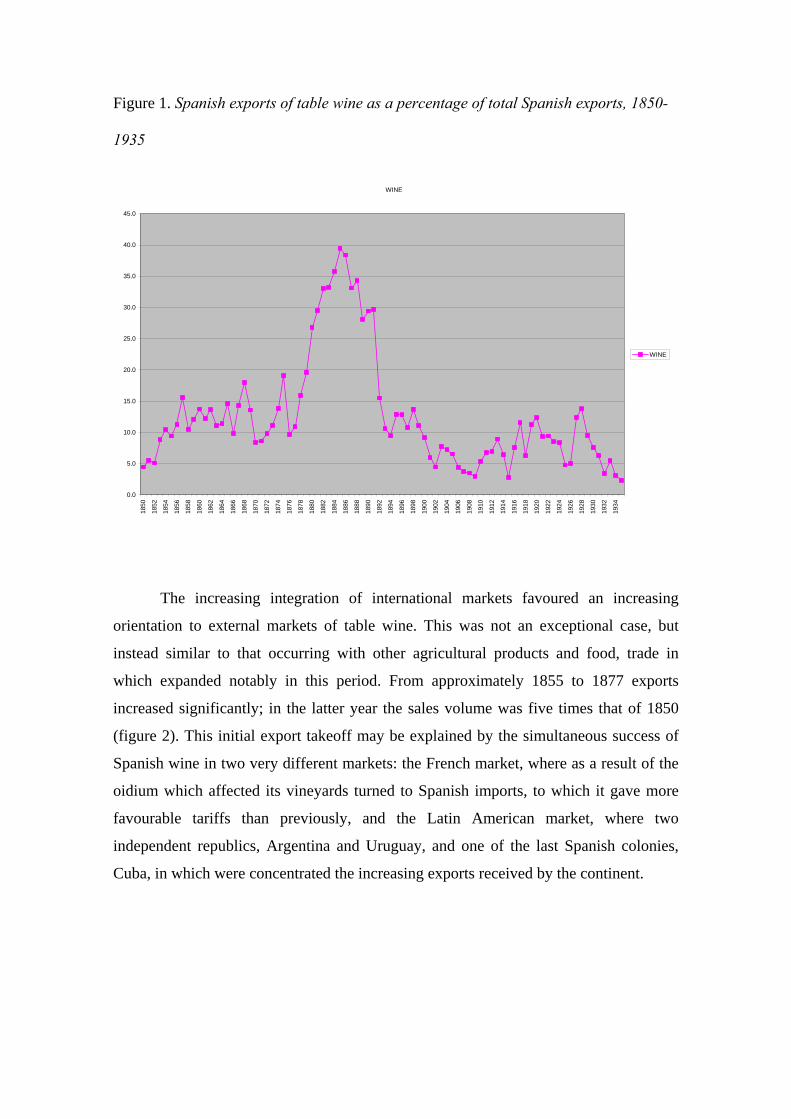
Figure 1. Spanish exports of table wine as a percentage of total Spanish exports, 1850-
1935
WINE
0.0
5.0
10.0
15.0
20.0
25.0
30.0
35.0
40.0
45.0
1850
1852
1854
1856
1858
1860
1862
1864
1866
1868
1870
1872
1874
1876
1878
1880
1882
1884
1886
1888
1890
1892
1894
1896
1898
1900
1902
1904
1906
1908
1910
1912
1914
1916
1918
1920
1922
1924
1926
1928
1930
1932
1934
WINE
The increasing integration of international markets favoured an increasing
orientation to external markets of table wine. This was not an exceptional case, but
instead similar to that occurring with other agricultural products and food, trade in
which expanded notably in this period. From approximately 1855 to 1877 exports
increased significantly; in the latter year the sales volume was five times that of 1850
(figure 2). This initial export takeoff may be explained by the simultaneous success of
Spanish wine in two very different markets: the French market, where as a result of the
oidium which affected its vineyards turned to Spanish imports, to which it gave more
favourable tariffs than previously, and the Latin American market, where two
independent republics, Argentina and Uruguay, and one of the last Spanish colonies,
Cuba, in which were concentrated the increasing exports received by the continent.
Figure 2. Exports of Spanish Table Wine (volume index, 1910=100)
Table Wine
0
100
200
300
400
500
600
1850 1853 1856 1859 1862 1865 1868 1871 1874 1877 1880 1883 1886 1889 1892 1895 1898 1901 1904 1907 1910 1913 1916 1919 1922 1925 1928 1931 1934
From 1878 onwards growth was so spectacular that the period from that year
until 1891 has been called the golden age of table wine exports or the boom years of
grape and wine-growing. Thus, in 1891, the year in which the export of table wine
reached its maximum historical volume, export figures were 32 times greater than those
of 1850 or six times those of 1877. This was almost exclusively the result of the
tremendous increase in exports to France, since the other important destinations of
Spanish table wine experienced practically no increase. In the case of France, in 1886-
90 the almost seven million hectolitres of table wine exported by Spain were in sharp
contrast to the approximately three hundred thousand at the beginning of the 1870s.
This boom in exports to France, whose vineyards were attacked by the phylloxera
plague, was made possible by the improved tariff treatment which France granted to
wine imports and the impressive effort made by Spanish producers to increase
production through the expansion of the land area dedicated to vineyards.
From 1891 onwards the fortune of Spanish exports changed dramatically. In the
1890s these were reduced by almost half, from the onset of the twentieth century they
continued to fall, to levels similar to those of the early 1870s, prior to the “golden
years”. From the commencement of the First World War until the beginning of the
Second World War, exports fluctuated dramatically, from minimum levels similar to the
1850s to maximum levels which almost equalled the figures of the boom period. As a
whole, the results for the period were not only highly irregular, but also were notably
lower than those of the final quarter of the nineteenth century.
From the point of view of the principal markets for Spanish wine, in the decades
between 1891 and 1935, France continued to be the principal destination, while the rest
of continental Europe became a secondary (but important) destination and the
American continent virtually disappeared as a significant market for Spanish wines.
This change of cycle may be attributed to the tariff barriers which Spain’s principal
trade partners erected against its imports.
In the case of France, following the recovery of its vineyards, replanted with
American vines which were immune to phylloxera, the level of imports diminished
slightly but remained high. From 1920 onwards there was a dramatic increase in the
levels at the end of the nineteenth century. As a whole, between 1890 and 1938 imports
represented between 10% and 25% of national production. However the Spanish quota
of imports fell from a maximum of over 80% at the end of the XIX century to oscillate
between 1% and 26% (i.e. highly variable levels) in the first third of the XX century,
oscillating between 1% and 26% (Pinilla and Ayuda, 2007:189). High import/export
levels were maintained partly because the replanting involved extremely productive
hybrids which nevertheless produced wines of low proof grading and colour, and
therefore it was necessary to mix them with wines of high alcoholic strength for them to
be accepted by the wine drinking public. These changes must be viewed in the context
of the development (from 1900 onwards) of mass wine production in Algeria;
developed by French colonialists, Algerian wine clearly replaced Spanish wine in many
cases; high tariffs were imposed upon foreign wine and the entry of Algerian wine
(exempt from duty) was favoured, especially after 1884, when Algeria formed a
customs union with metropolitan France1.
Spanish wine was extremely competitive in the low-quality and medium-low
quality sectors of demand; this, facilitated its expansion in certain non-traditional
markets, such as those of the European continent, although low wine consumption in
those markets placed enormous limits upon its possibilities for growth (Pinilla and
Ayuda, 2002 and 2008). Wine cannot be considered to be a mass consumption product
in those countries in this period.
1 See Isnard (1954) with regard to Algerian wine production. For French trade policy favouring it and its impact upon
imports, see Pinilla and Ayuda (2002). There is abundant literature upon the problems of the wine-producing sector in France in the first third of the XX century; see, for example, Pech (1975), Lachiver (1988) and Simpson (2005).
In Argentina, table wine constituted 80% of imports from Spain in 1880-82,
represented in 1927-29 less than 1% in 1927-29. This drastic contraction is explained by
the extreme increase in tariffs. An ad valorem protection of 25% was raised to 40% in
1876. The termination in 1885 of the railway line which linked the principal production
zone, Mendoza, to the Buenos Aires market, once more raised tariffs; between 1890 and
1930 ad valorem duties normally exceeded 80%2 (Fernández, 2004: 107-108).
Consequently, production increased by 850% between 1895 and 1925, while imports
disappeared to all intents and purposes 3.
In Uruguay as well, where wine imports met an overwhelming part of demand,
the reinforcement of protection in 1903 strongly stimulated the national industry Wine
production increased from under 35,000 hectolitres to almost 500,000 in 1930, while
imports, which exceeded 300,000 hectolitres at the end of the XIX century, virtually
vanished (Baptista, 2007: 120-126).
3. Data and model
In order to determine which factors determined Spanish exports of table wine,
we shall estimate a gravity equation, using data for Spanish table wine exports to its
principal trade partners between 1871 and 1935, constant 1910 prices are employed to
formulate a series which reflects the evolution in volume of such exports. The sample
includes exports to 19 countries4, whose trade flows were highly representative of
Spanish table wine exports. Normally, the exports in our sample exceeded 70% of those
performed, with the exception of six years in the period 1871-76, in which this figure
was 50% and 70%. The database, accordingly, consists of a “balanced data panel”,
comprising exports to 19 destination countries, multiplied by 63 years, giving a total of
1,197 observations5.
The specification of the gravity equation employed in this paper largely follows the
studies of Feenstra et al. (1998), Bergstrand (1985,1989) and Anderson and van Wincoop,
(2003). These studies provide a detailed description of their theoretical bases and thus the
2 Of the 20 principal products exported by Spain to Argentina only bottled cider enjoyed similar protection. All other
products paid considerably lower ad valorem duties (Fernández, 2004: 138).
3 The decline of Spanish and Italian exports to Argentina is quite similar, at almost equivalent levels in 1890 until their virtual extinction prior to the Second World War.
4 These were France, Germany, Italy, Great Britain, the United States, Switzerland, Argentina, Canada, Japan, Austria, Belgium, Brazil, Denmark, Finland, the Netherlands, Norway, Portugal, Sweden and Uruguay.
5 For the years 1923 and 1924 export flows disaggregated by country do not exist.
present paper merely provides a simple description of the variables and result expected.
Its functional form, applying logarithms, is:
ln Xsjt = β1 + β2 ln(Yst) + β3 ln(Yjt) + β4 ln(Ypcpst) + β5 ln(Ypcpjt) +
+ β6 lnDistsj + β7 Lanssj + β8 Barriersj + εt (1)
Where:
Xsj represents Spanish table wine export flows to 19 countries, by volume, from Spain to
country j
Ys Yj is the real GDP of both Spain and the importing country, in 1990 US dollars
Ypcps Ypcpj is the GDP per capita of both Spain and the importing country, in 1990 US
dollars
Distsj is the distance between the capital of Spain and those of the importing countries
Langsj is a dummy variable which takes the value of 1 if the countries have a common
language and 0 otherwise
Barriersj is a dummy variable which takes into account the changes in the commercial
policies of the importing countries (France, USA, Argentina, Uruguay).
The separate interpretation of the variables (Ys Yj) allows us to observe the export
potential of a country, which depends on its market size, as measured by GDP. Foreign
demand for these products will depend on the expansion of the size of the external
market. As Feenstra et al. (1998) and Fidrmur (2004) show, trade in table wine forms part
of a trade pattern of homogeneous products. This theoretical basis is coherent with trade
models of national product differentiation or reciprocal dumping6. It is logical, therefore,
that the coefficient of the market size of the importing country is greater than that of the
exporting country.
Moreover, following Bergstrand (1989), the equation includes national GDP per
capita (Ycpcs ,Ycpcj) which allows us to characterize trade in different types of goods.
Bergstrand argues that the interpretation of the coefficient of the per capita income of the
exporting country may be taken to be an approximation of its endowment factors,. The 6 In the period studied a considerable part of Spanish table wine exports was wine in bulk, used largely to mix with other wines which required greater alcoholic strength and colour in France. Thus, to a considerable degree, it was a largely undifferentiated raw material.
coefficient is positive in the case of capital-intensive goods and negative for labour-
intensive goods. The coefficient of per capita income of the importing country is useful to
characterize the type of good, and will display a positive sign for goods that are ‘luxury’
goods and a negative sign for basic ‘necessities’.
As is common in gravity models, the geographical distance among countries (Distsj)
is taken as an approximation of transport costs and is generally presented as an obstacle to
trade. Thus, a negative sign is to be expected.
The equation also includes a variable, Langsj, which represents cultural proximity
(such as the existence of cultural or historical ties between trade partners). Presumably, its
sign will be positive, as a result of immigrants’ preference for goods produced in their
home countries. Thus, a market for such goods is created when these exist in sufficient
numbers, when the market is well understood and, lastly, when there exist ‘ethnic
networks’ among immigrants and their home countries (Dunlevy and Hutchinson, 1999).
In the present case, it is a question of taking into account those countries which have
either been Spanish colonies or, in addition, are receiving significant numbers of
immigrants from the country in question7.
With regard to the institutional context, many studies have refined/modified/adjusted
the specification of the gravity equation, to take into account the factors which may limit
or bottleneck trade. Somewhat surprisingly, few pieces of research have introduced trade
policies into the gravity equations. Their inclusion in the model is difficult, owing to
scarce or non-available data. Nevertheless, many studies have introduced dummy
variables to try and resolve this question. We have introduced four institutional-type
dummy variables, to measure the effect of the implementation of trade policies which
could potentially have harmed Spanish exports.
Firstly, we included a dummy variable which takes the value of 0 for the set of the
period for France and the value of 1 between 1878 and 1891, when the Franco-Spanish
treaties provided good access to Spanish exports. The sign of the coefficient will
presumably be positive, since trade liberalization from 1878-1891 should have stimulated
imports. Furthermore, we have included a dummy variable (FRA92-98) for France, in
case the authorisation of the French government to create special customs warehouses
7 The two countries with this characteristic in our sample were Argentina and Uruguay. Spanish exports to Argentina were
heavily concentrated in “Food and drinks’, which represented a maximum of 96% of the total exports to this country in 1880-82 and a minimum of 63.6% in 1933-35 (Fernández, 2004, p.84).
which were given permission to import Spanish wine free of duties, to mix it with French
wine and subsequently re-export it, mitigated the fall in exports from 1892 until 1898.
To estimate the impact of the trade policies of new producer countries in the New
World, interested in increasing their national production, we have included two dummy
variables: one for Argentina and another for Uruguay. In the case of Argentina the
variable takes the value of 0 between 1871 and 1889 and the value of 1 between 1890 and
1935, when this country established a strict tariff system with regard to imports. In the
case of Uruguay the dummy variable takes the value of 0 between 1871 and 1902 and the
value of 1 between 1903 and 1935, when a policy with similar objectives was adopted. In
both cases coefficient is expected to be negative, as such policies, in all logic, reduced
imports.
Furthermore, to observe the effect of the North American effect of Prohibition, we
introduced a dummy variable which takes the value of 1 between 1920 and 1933 i.e. those
years in which Prohibition was in effect. Although in this case the objective of this
measure was not to stimulate national production, but rather to prevent the consumption
of alcoholic drinks, it may have had an impact upon Spanish exports. However the
protectionist measures which had been introduced since the end of the XIX century had
already converted it into an insignificant market for them. In this case, we also expect a
negative coefficient for this variable.
Lastly, in order to isolate the effect of the First World War with regard to the
behaviour of the remaining variables of the model, we introduced a dummy variable
which takes the value of 1 between 1914 and 1918 and 0 for the remaining years.
Obviously, we expect a negative coefficient.
4. Estimation and results
The panel data estimation technique was employed, which permitted both the
variation between the observation units and the time variations to be taken into
consideration. Three types of panel data estimation are employed: firstly, the estimation
of ordinary least squares (OLS) with the pooled panel; the second and third take into
account the time variation, via the election of the random effects model (REM) and the
fixed effects model (FEM), respectively, in the model.
To determine which of the three models is the most efficient, we firstly employed the
LM Breech-Pagan test for random effects, to permit us to choose between the OLS
estimation and the estimation with random effects. Subsequently, it was concluded that
the random effects are important, and thus it is preferable to use this estimation rather than
the pooled panel; the results are included in Column 2 of Table 1.
Similarly, to demonstrate that the fixed effects estimation is a more appropriate
method than that of OLS, we performed the F-test (Greene, 2000) regarding the
significance of fixed effects. This test (see Column 3, Table 1) indicates that the FEM
estimation is more appropriate than the OLS estimation. Moreover, the Hausman test
showed that the estimators of random and fixed effects have significant differences and
that the random effects model provides a better explanation of the sources of variation
and, thus, is more appropriate than the fixed effects model.
It is important to emphasise at this point, that despite having modelled the time and
spatial heterogeneity, our model, according to Wald’s test (Green, 2000), displays
problems of heteroskedascity and, according to the Wooldridge test (Wooldridge, 2001),
problems of autocorrelation (see the final rows of Column 2 of Table 1). Lastly, the
Breusch-Pagan test of contemporary correlation, heteroskedascity and autocorrelation
confirms the need to correct this problem. The above-mentioned problems of
contemporary correlation, heteroskedascity and autocorrelation may be solved jointly and
were resolved by the estimation of Panel-Corrected Standard Errors (PCSE) (Column 4,
Table 1).
The correct functioning estimation of the gravity equation was checked; all the
variables displayed the expected sign and the relevant variables are statistically
significant. In general, and as predicted, countries with large market size, geographically
proximate, with a shared language and a trade policy open to the entry of this product
were the principal destination of the exports of Spanish table wine.
In our view, the principal result is that all the dummy variables used to assess to what
extent Spanish exports were affected by the trade policies of various important trade
partners are significant. They display the predicted signs and high coefficients (see
FRA77-1, USA20-33, ARG90-35, URU02-35 in Column 4 of Table 1).
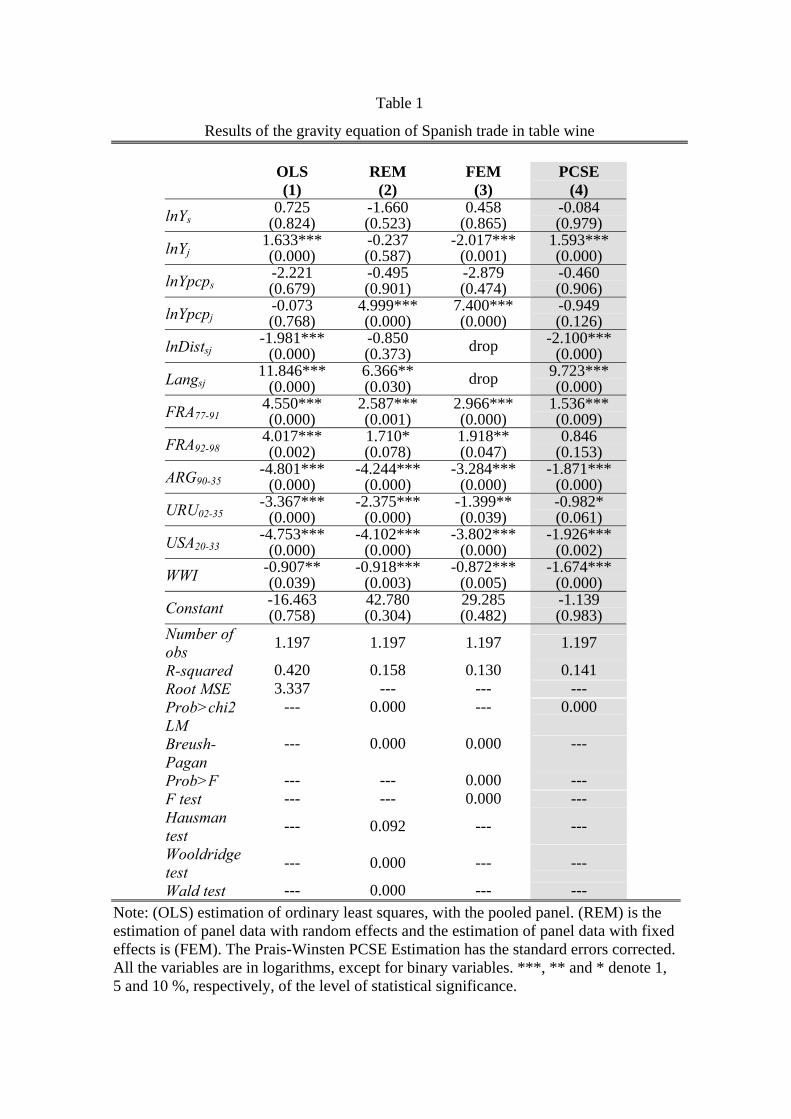
Table 1
Results of the gravity equation of Spanish trade in table wine
OLS (1)
REM (2)
FEM (3)
PCSE (4)
lnYs0.725
(0.824) -1.660 (0.523)
0.458 (0.865)
-0.084 (0.979)
lnYj1.633*** (0.000)
-0.237 (0.587)
-2.017*** (0.001)
1.593*** (0.000)
lnYpcps-2.221 (0.679)
-0.495 (0.901)
-2.879 (0.474)
-0.460 (0.906)
lnYpcpj-0.073 (0.768)
4.999*** (0.000)
7.400*** (0.000)
-0.949 (0.126)
lnDistsj-1.981***
(0.000) -0.850 (0.373) drop -2.100***
(0.000) Langsj
11.846*** (0.000)
6.366** (0.030) drop 9.723***
(0.000) FRA77-91
4.550*** (0.000)
2.587*** (0.001)
2.966*** (0.000)
1.536*** (0.009)
FRA92-984.017*** (0.002)
1.710* (0.078)
1.918** (0.047)
0.846 (0.153)
ARG90-35-4.801***
(0.000) -4.244***
(0.000) -3.284***
(0.000) -1.871***
(0.000) URU02-35
-3.367*** (0.000)
-2.375*** (0.000)
-1.399** (0.039)
-0.982* (0.061)
USA20-33-4.753***
(0.000) -4.102***
(0.000) -3.802***
(0.000) -1.926***
(0.002) WWI -0.907**
(0.039) -0.918***
(0.003) -0.872***
(0.005) -1.674***
(0.000) Constant -16.463
(0.758) 42.780 (0.304)
29.285 (0.482)
-1.139 (0.983)
Number of obs 1.197 1.197 1.197 1.197
R-squared 0.420 0.158 0.130 0.141 Root MSE 3.337 --- --- --- Prob>chi2 --- 0.000 --- 0.000 LM Breush-Pagan
--- 0.000 0.000 ---
Prob>F --- --- 0.000 --- F test --- --- 0.000 --- Hausman test --- 0.092 --- ---
Wooldridge test --- 0.000 --- ---
Wald test --- 0.000 --- --- Note: (OLS) estimation of ordinary least squares, with the pooled panel. (REM) is the estimation of panel data with random effects and the estimation of panel data with fixed effects is (FEM). The Prais-Winsten PCSE Estimation has the standard errors corrected. All the variables are in logarithms, except for binary variables. ***, ** and * denote 1, 5 and 10 %, respectively, of the level of statistical significance.
This result coincides with that obtained by Pinilla and Ayuda (2002). They
estimated that between 1874 and 1934 in France, each 1% increase in the customs tariff
caused a long-term decrease of 1.8% in the quota of foreign wine (as Algerian wine was
not classified as “foreign”) in the French market. Thus, there occurred a replacement of
Spanish imports by imports from Algeria which in 1925-29, reached a volume
comparable to that of the Spanish boom years in 1885-89, and even exceeded it in
subsequent years.
Furthermore, the dummy variables introduced to capture whether tariff increases
introduced by Argentina and Uruguay were notable, significant and as predicted. This
demonstrates the importance of the measures aimed at protecting the emerging wine-
growing activity in these countries, which changed from being significant wine importers
to self-sufficient.
As was also expected, the dummy variable introduced to check the effects of
Prohibition in the USA had the predicted negative sign and is statistically significant.
Only the variable introduced to test whether the temporary authorization to introduce into
France during part of the 1890s shipments of Spanish wine free of duties is not
statistically significant; however, it displays the expected sign.
The per capita income variable of the destination country is not significant (see
Ypcpj. in Column 4 of Table 1). That is to say, the increase in per capita income in the
countries to which Spanish wine was destined did not, in general, lead to a rise in wine
imports. This result fully coincides with those obtained in other studies which
demonstrated the low diffusion of wine consumption in that period, outside the
Mediterranean countries (Pinilla and Ayuda, 2007).
Moreover, econometric analysis of the relationship in Great Britain between wine
consumption and rising incomes demonstrates that in the period 1870-1935 a long-term
relationship did not exist between the two variables; thus the large increase in per capita
income did not result in a parallel increase in wine consumption (Aparicio, Ayuda and
Pinilla, 2002: 686-688)8.
Even in the case of France, where this relationship has been confirmed, demand
elasticity between 1860 and 1938, with regard to long-term income was low, since it had
8 Simpson (2004) emphasises the problems for trade expansion related to the difficulties consumers experienced in
understanding their different qualities.
a coefficient of 0.8 (Ayuda, Aparicio and Pinilla, 1998: 7). In conclusion, both Spanish
and other exporters were required to tackle a market in the developed countries in which
wine did not become a product enjoyed by the masses until several decades after the
Second World War (principally for cultural reasons). Consequently, rising incomes in
developed countries did not stimulate an increase in wine exports.
This result is related to the dummy Langsj, which determines the effect of cultural
proximity as a result of a common language. In this case the variable is both significant
and positive. This may mean that ex-Spanish colonies or, we believe is more important,
with significant contingents of Spanish immigrants (e.g. Argentina and Uruguay), tended
to import more Spanish wine. Our result confirms that the strong growth of wine
consumption in Argentina was linked to the arrival of thousands of Spanish or Italian
immigrants from 1880 onwards (Mateu and Stein, forthcoming)9.
As is common in any exercise using the gravity equation, the positive sign of the
coefficient and the significance of income (Yj), implies that the growth of the size of the
foreign market was also a key factor in stimulating the increase in Spanish exports
throughout that period. As expected, this coefficient exceeds that of the size of the
exporting country Ys (Spain), and this trade pattern may be included in a theoretical model
of national product differentiation.
Finally, and as foreseen, the First World War seriously harmed Spanish table wine
exports; this is clear from the high coefficient obtained and its statistical significance. This
result is both unsurprising and coincides with the recent study by Glick and Taylor
(2005), which emphasises the significant impact that the two World Wars had upon trade,
between both warring and non-warring nations.
5. Sensitivity analysis of period samples
To analyse in greater depth the factors determining Spanish exports of table wine,
we shall estimate gravity models for two sub-periods, using the same method and the
same specification employed in the previous section. The first of these is 1871-1891,
when the boom in Spanish table wine exports occurred; the second is 1892-1935, in
which a dramatic fall occurred at first, followed by a tendency to fluctuate. This exercise
9 Dunlevy and Hutchinson (1999) also found empirical evidence of the existence of a direct immigrant-import trade nexus
for the United States in the period 1870-1910. However, for exactly the same period, Jacks (2005), also for the case of the United States, concludes that the effect was neutral and that it is impossible to empirically validate this impact of immigration upon trade with the country of origin of the immigrants.
has dual objectives: not only does it permit the comparison of the sensitivity of our results
to sample variations, it also facilitates a deeper analysis of the factors which determine the
irregular trajectory of Spanish table wine exports.
This section also uses the methodology employed above, concerning the
functional form of the gravity equation, the sources and the selection process; we
therefore do not consider it necessary to reiterate the detailed explanation of the process
undertaken. As before, the estimation method selected was that of a panel with PCSE.
Table 2 presents the results of the gravity equation for the above-mentioned trade flows.
We conclude, firstly, that Spanish wine exports in both periods (see Columns 2 and 3)
were principally destined to countries with large and expanding markets and nearby
countries (both geographically and culturally). For both periods the coefficients of the
variables Yj, Langsj, and Distsj display a highly significant coefficient, the variations
between the two periods were fewer than expected, especially concerning the effect of the
geographical distance between markets, as an approximation of transport costs. As we
stated in the introduction, this question is still open to debate.
Secondly, the key factor for the understanding of each period and explaining the
trends in Spanish table wine is the trade policy of its principal partners. Between 1871 and
1891, the favourable Franco-Spanish treaty and the moderation protection practised by
other important markets (the USA, Argentina and Uruguay) meant that export success
was notable. Moreover, between 1892 and 1935, the imposition of high tariffs in
Argentina, Uruguay and France, and Prohibition in the USA, caused a significant fall in
Spanish wine exports. Consequently, we believe that the principal cause of the different
evolution between periods is based on the changes in the trade policies of the countries,
especially France, which were the principal markets for Spanish table wine.
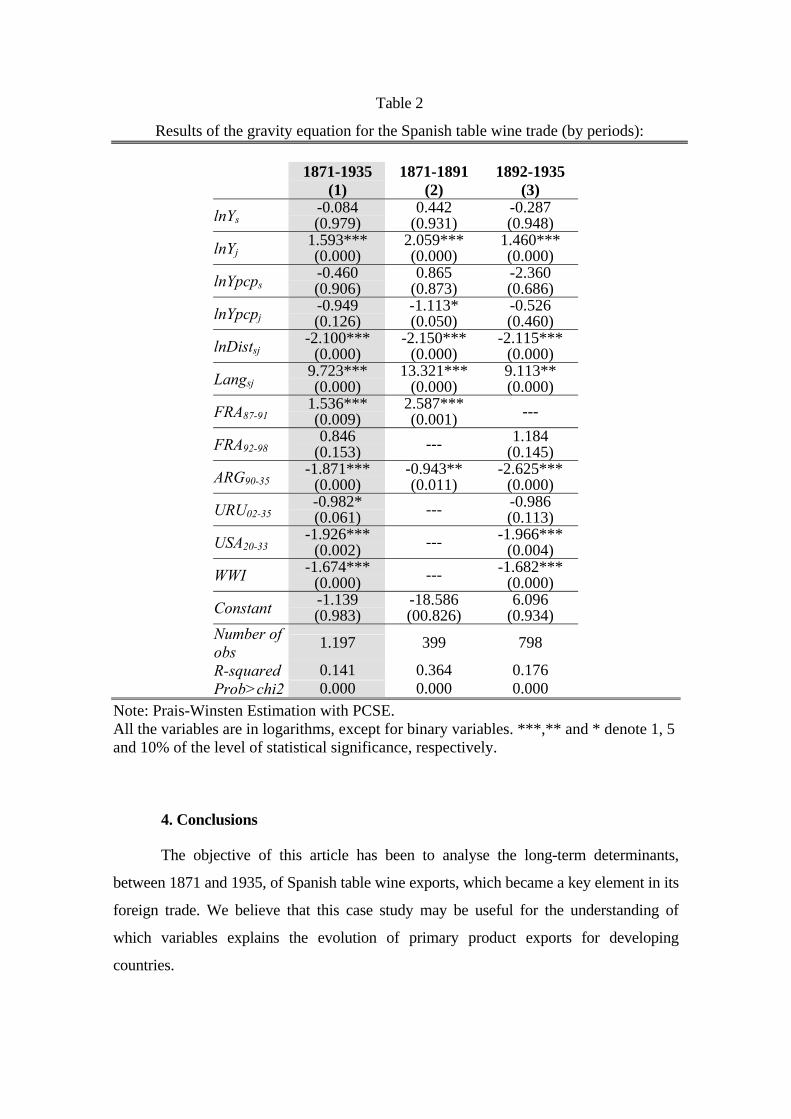
Table 2
Results of the gravity equation for the Spanish table wine trade (by periods):
1871-1935 (1)
1871-1891 (2)
1892-1935 (3)
lnYs -0.084
(0.979) 0.442
(0.931) -0.287 (0.948)
lnYj 1.593***
(0.000) 2.059*** (0.000)
1.460*** (0.000)
lnYpcps -0.460
(0.906) 0.865
(0.873) -2.360 (0.686)
lnYpcpj -0.949
(0.126) -1.113* (0.050)
-0.526 (0.460)
lnDistsj -2.100***
(0.000) -2.150***
(0.000) -2.115***
(0.000) Langsj
9.723*** (0.000)
13.321*** (0.000)
9.113** (0.000)
FRA87-91 1.536***
(0.009) 2.587*** (0.001) ---
FRA92-98 0.846
(0.153) --- 1.184 (0.145)
ARG90-35 -1.871***
(0.000) -0.943** (0.011)
-2.625*** (0.000)
URU02-35 -0.982*
(0.061) --- -0.986 (0.113)
USA20-33 -1.926***
(0.002) --- -1.966*** (0.004)
WWI -1.674*** (0.000) --- -1.682***
(0.000) Constant -1.139
(0.983) -18.586 (00.826)
6.096 (0.934)
Number of obs
1.197 399 798
R-squared 0.141 0.364 0.176 Prob>chi2 0.000 0.000 0.000
Note: Prais-Winsten Estimation with PCSE. All the variables are in logarithms, except for binary variables. ***,** and * denote 1, 5 and 10% of the level of statistical significance, respectively.
4. Conclusions
The objective of this article has been to analyse the long-term determinants,
between 1871 and 1935, of Spanish table wine exports, which became a key element in its
foreign trade. We believe that this case study may be useful for the understanding of
which variables explains the evolution of primary product exports for developing
countries.
In general, the results of the gravity equation show that Spanish table wine was
exported to countries with large growing markets that were close both culturally
(especially countries with many Spanish immigrants) and geographically. Another key
feature is the importance of the tariff barriers wine exports faced. The trade policies of
countries such as France, Argentina, Uruguay and the United States seriously affected
Spanish exports. Finally, and in line with the findings of other studies, the fact that wine
consumption was largely limited to the Mediterranean countries was a significant factor.
In general, rising per capita income in export markets did not produce overall increase in
exports.
Perhaps the most important result of the model estimated is the fundamental role
played by the trade policies of the countries which were the principal markets for
Spanish wine. This result fits well within the existing literature upon the effect of trade
liberalization during the two periods of globalization. If studies such as those by
Estevadeordal et al. (2003) and Jacks (2005) for the first wave of globalization or
Krugman (1995) and Baier and Bergstrand (2001), for the second wave, have
emphasised the importance of trade policies aimed at facilitating trade expansion, our
study has underlined the extreme vulnerability of these exports when faced with sudden
changes in trade policies, intended to stimulate national (or colonial) production.
A second important result is the inelasticity of income demand with regard to
agricultural products; this is generally seen as a serious obstacle to a greater dynamism
of trade in such items. In our case, however, the problem is even greater when the object
of trade is table wine, which during the first wave of globalization was only an item of
mass consumption in the countries of the north shore of the Mediterranean ; this limited
yet further growth in its trade. Only in those countries which received many
Mediterranean/European immigrants (e.g. Argentina or Uruguay) was it possible to
expand exports.
Lastly, and in line with various recent studies, for both the first globalization
(Jacks and Pendakar, 2007) and the second (Hummels, 1999), our results show that
throughout this period the wine trade benefited from a substantial reduction in transport
costs.
Acknowledgments
This study has received financial support from the Ministry of Education and
Science of the Spanish Government, project SEJ 2005-077556. This version has
benefited from the comments of participants in the Third International Conference on
Economics, Management Sciences and History of Wine. Wine in the World: Markets,
Tourism and Globalisation (Bordeaux, June 2008).
References
ANDERSON, J.E., and VAN WINCOOP, E. (2003): “Gravity with Gravitas: A
Solution to the Border Puzzle”, American Economic Review, 93, pp. 170-192.
APARICIO, G., PINILLA, V., and SERRANO, R. (2008): “Europe and the international
trade in agricultural and food products, 1870-2000” in Agriculture and Economic
Development in Europe since 1870 (Eds.) P. Lains, and V. Pinilla, Routledge,
London, pp. 86-110.
APARICIO, G.; AYUDA, M. I. and PINILLA, V. (2002): “World consumption of
Wine, 1859-1938: an obstacle to the growth of its production and trade?”, in J.
Maldonado (ed.), Actas del I Simposio de la Asociación Internacional de Historia
y Civilización de la Vid y el Vino, vol. II, Asociación Internacional de Historia y
Civilización de la Vid y el Vino, Puerto de Santa María, pp. 679-694.
AYUDA, M.I., APARICIO, G. and PINILLA, V., (1998): “France and the International
Wine Trade, 1850-1938”, Cahiers Scientifiques de l'Institut Europeen de
Conjoncture Viti-Vinicole , pp. 1-20.
BAIER, S. and BERGSTRAND, J. (2001): “The growth of world trade: tariffs, transport
costs, and income similarity” Journal of International Economics, 53, pp. 1-27.
BAPTISTA, B. (2008): “La temprana vitivinicultura en Uruguay: surgimiento y
consolidación (1870-1930)”, América en la Historia Económica, 29, pp. 101-129.
BERGSTRAND, J.H. (1985): “The gravity equation in international trade: some
microeconomic foundations and empirical evidence”, The Review of Economics and
Statistics 67, pp. 474-481.
BERGSTRAND, J.H. (1989): “The generalised gravity equation, monopolistic, and the
factor-proportions theory in international trade” The Review of Economics and
Statistics 71, pp. 143-153.
CARNERO, T. (1980): Expansión vinícola y atraso agrario, 1870-1900, Ministerio de
Agricultura, Madrid.
DUNLEVY, J.A. and HUTCHINSON, W.K. (1999) : “The impact of Immigration on
American Import Trade in the Late Nineteenth and Early Twentieth Centuries”,
Journal of Economic History, 59. 4, pp. 1043-1062.
ESTEVADEORDAL, A.; FRANTZ, B. and TAYLOR, A.M. (2003): “The Rise and
Fall of World Trade, 1870-1939” Quarterly Journal of Economics, CXVIII (2),
pp. 359-407.
FEENSTRA, R.C., MARKUSEN, J.A. and ROSE A.K. (1998): “Using the Gravity
Equation to Differentiate among Alternatives Theories of Trade” Canadian Journal
of Economics ,34 (4), pp. 430-447.
FERNÁNDEZ, A. (2004): Un ‘mercado étnico’ en el Plata. Emigración y
exportaciones españolas a la Argentina, 1880-1935, Consejo Superior de
Investigaciones Científicas, Madrid.
FIDRMUC, J., (2004): “The core and periphery of the world economy” The Journal of
International Trade & Economic Development, 13(1), pp. 89-106.
GLICK, R. and TAYLOR, A.M. (2005): “Collateral Damage: The Economic Impact of
War, 1870-1997”, NBER Working Paper Series, WP 11565.
GREENE, W. H., (2000): Econometric Analysis, 4th.Edit. Prentice Hall International.
London.
HUMMELS, D. (1999): “Have international transportation costs declined?” Working
Paper Graduate School of Business, University of Chicago.
IRWIN, D.A. (2002) “Long-run trends in world trade and income” World Trade Review,
1(1), pp 89-100.
ISNARD, H. (1954): La vigne en Algérie, étude géographique, Ophrys, Gap.
JACKS, D. J. (2005): “Immigrant Stocks and Trade Flows, 1870-1913”, Journal of
European Economic History, 34, 3, p. 625-649.
JACKS, D. J. (2006): “What drove 19th century commodity market integration?”
Explorations in Economic History , 43: pp. 383-412.
JACKS, D. J., MEISSNER, C.M. and NOVY, D. (2008): “Trade Costs, 1870-2000”
American Economic Review vol. 98,2.
JACKS, D. J. and PENDAKAR, K. (2007): “Global Trade and the Maritime Transport
Revolution” Working Paper, Simon Fraser University,
http://www.sfu.ca/~djacks/papers/workingpapers/transport.pdf.
KRUGMAN, P. (1995) Growing World Trade: Causes and Consequences, Brookings
Papers on Economic Activity, 1, pp. 327-377.
LACHIVER, M. (1988): Vins, vignes et vignerons. Histoire du vignoble francais,
Fayard, Lille.
LÓPEZ-CORDOVA, J.E. and MEISSNER, C.M. (2003): “Exchange-rate regimes and
international trade: Evidence from the classical gold standard era” American
Economic Review, vol. 93, 1, pp. 344-354.
MATEU, A.M. and STEIN, S. (forthcoming): “Diálogos entre sordos, los pragmáticos y
los técnicos en la época inicial de la industria vitivinícola argentina”, mimeo.
MITCHENER, K.J. and WEIDENMIER, M. (2008): “ Trade and Empire”, Working
Paper 13765 NBER.
O’ROURKE, K.H. and WILLIAMSON, J. G. (1999): Globalization and History. The
Evolution of a Nineteenth-Century Atlantic Economy, The MIT Press,
Cambridge, MA.
PAN-MONTOJO, J. (1994) La bodega del mundo. La vid y el vino en España (1800-
1936), Alianza Editorial, Madrid.
PECH, R. (1975): Enterprise viticole et capitalisme en Languedoc-Roussillon: du
Phylloxera aux crises de mevente, Publications de l’Université de Toulouse,
Toulouse.
PINILLA, V. y AYUDA, M.I., (2002): “The Political Economy of the Wine Trade:
Spanish Exports and the International Market, 1890-1935”, European Review of
Economic History , 6, pp. 51-85.
PINILLA, V., and AYUDA, M.I., (2008): "Market dynamism and international trade: a
case study of Mediterranean agricultural products, 1850-1935”, Applied
Economics, 40, 5, pp. 583-595.
SERRANO, R., and PINILLA, V., (Forthcoming): “Causes of World Trade Growth in
Agricultural and Food Products, 1951-2000: A Demand Function Approach”
Applied Economics.

SIMPSON, J. (1995): Spanish agriculture: the long Siesta, 1765-1965, Cambridge
University Press, Cambridge.
SIMPSON, J. (2004): “Selling to reluctant drinkers: the British wine market, 1860-
1914”, Economic History Review, LVII, 1, pp. 80-108.
SIMPSON, J. (2005): “Cooperation and Conflicts: Institutional Innovation in France’s
Wine Markets, 1870-1911”, Business History Review, 79, pp. 527-558.
WOOLDRIDGE, J., (2001): Econometric Analysis of Cross Section and Panel Data.
Cambridge MA:MIT Press