Embed Size (px)
Citation preview
_____________________________________________________________________________________________
_____________________________________________________________________________________________
American Bible Society
THE STATE OF THE BIBLE 2011
Analysis and Data Tables Research commissioned by: American Bible Society New York, New York Research conducted by: Barna Group Ventura, California
American Bible Society
THE STATE OF THE BIBLE 2012
Analysis and Data Tables
Research commissioned by: American Bible Society New York, New York
Research conducted by: Barna Group Ventura, California
TheStateof theBible2012
The State of the Bible 2012
_____________________________________________________________________________________________ American Bible Society | Barna Group | The State of the Bible 2012 page 2
© 2012 This information has been produced by the Barna Group for American Bible Society of New York, New York. The information is confidential and copyrighted information that belongs to American Bible Society and may not be reproduced without the written permission of ABS.
The State of the Bible 2012
_____________________________________________________________________________________________ American Bible Society | Barna Group | The State of the Bible 2012 page 3
I N T R O D U C T I O N This report contains the findings from a nationwide study commissioned by American Bible Society and conducted by Barna Research (a division of the Barna Group). Two research methodologies were used for the study; one included 1,016 telephone interviews with adults in the continental U.S., while the other consisted of online surveys conducted using a nationally representative panel. All questions were asked in the telephone survey while a set of core questions were included online. The use of two methodologies provided a larger sample size for key questions and ensured even greater representation among all age groups. The telephone interviews were conducted February 24 through March 5, 2012, included U.S. adults 18 years of age or older. The online surveys were conducted between March 14 and March 21, 2012.
The State of the Bible 2012
_____________________________________________________________________________________________ American Bible Society | Barna Group | The State of the Bible 2012 page 4
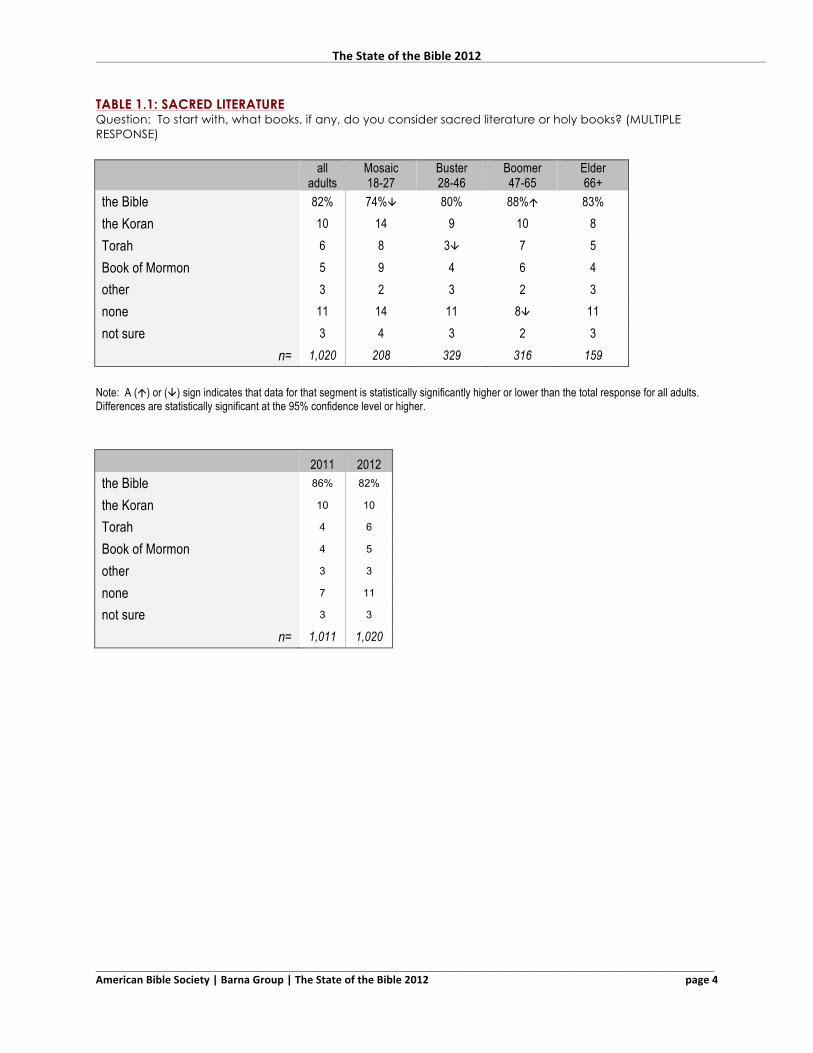
TABLE 1.1: SACRED LITERATURE Question: To start with, what books, if any, do you consider sacred literature or holy books? (MULTIPLE RESPONSE)
all
adults Mosaic 18-27
Buster 28-46
Boomer 47-65
Elder 66+
the Bible 82% 74%â 80% 88%á 83% the Koran 10 14 9 10 8 Torah 6 8 3â 7 5 Book of Mormon 5 9 4 6 4 other 3 2 3 2 3 none 11 14 11 8â 11 not sure 3 4 3 2 3
n= 1,020 208 329 316 159 Note: A (á) or (â) sign indicates that data for that segment is statistically significantly higher or lower than the total response for all adults. Differences are statistically significant at the 95% confidence level or higher.
2011 2012 the Bible 86% 82%
the Koran 10 10
Torah 4 6
Book of Mormon 4 5
other 3 3
none 7 11
not sure 3 3
n= 1,011 1,020
The State of the Bible 2012
_____________________________________________________________________________________________ American Bible Society | Barna Group | The State of the Bible 2012 page 5
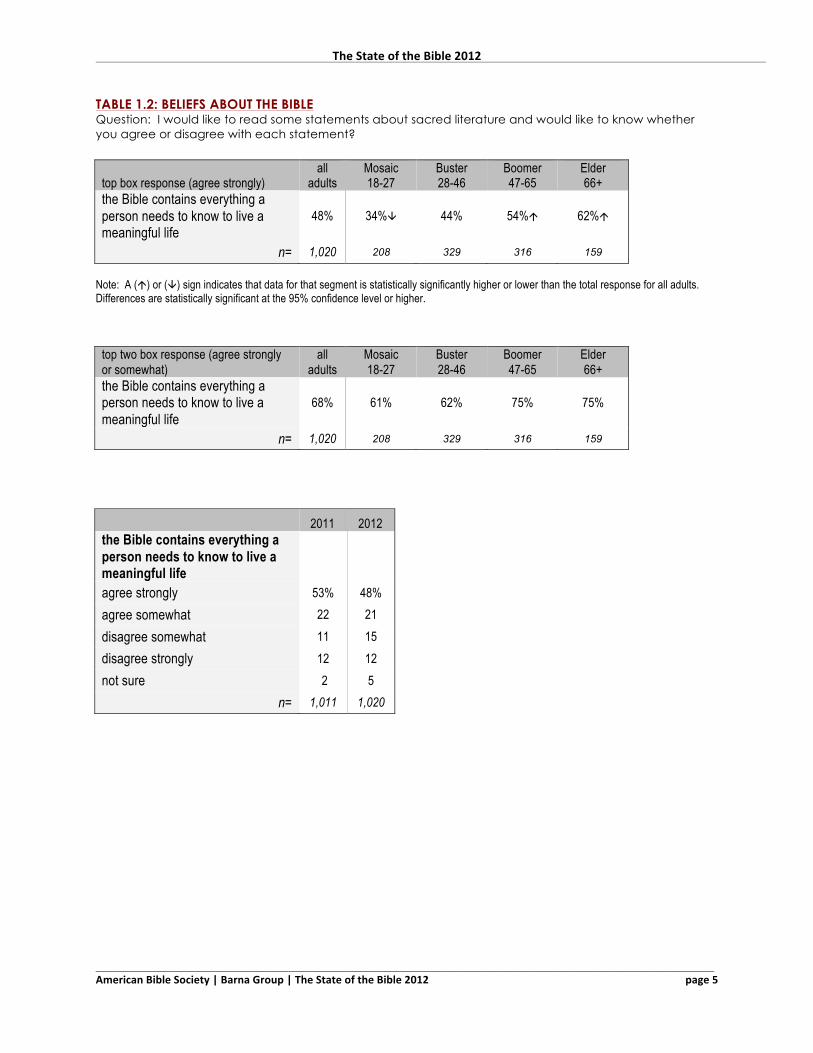
TABLE 1.2: BELIEFS ABOUT THE BIBLE Question: I would like to read some statements about sacred literature and would like to know whether you agree or disagree with each statement?
top box response (agree strongly) all
adults Mosaic 18-27
Buster 28-46
Boomer 47-65
Elder 66+
the Bible contains everything a person needs to know to live a meaningful life
48% 34%â 44% 54%á 62%á
n= 1,020 208 329 316 159
Note: A (á) or (â) sign indicates that data for that segment is statistically significantly higher or lower than the total response for all adults. Differences are statistically significant at the 95% confidence level or higher.
top two box response (agree strongly or somewhat)
all adults
Mosaic 18-27
Buster 28-46
Boomer 47-65
Elder 66+
the Bible contains everything a person needs to know to live a meaningful life
68% 61% 62% 75% 75%
n= 1,020 208 329 316 159
2011 2012 the Bible contains everything a person needs to know to live a meaningful life
agree strongly 53% 48% agree somewhat 22 21 disagree somewhat 11 15 disagree strongly 12 12 not sure 2 5
n= 1,011 1,020
The State of the Bible 2012
_____________________________________________________________________________________________ American Bible Society | Barna Group | The State of the Bible 2012 page 6
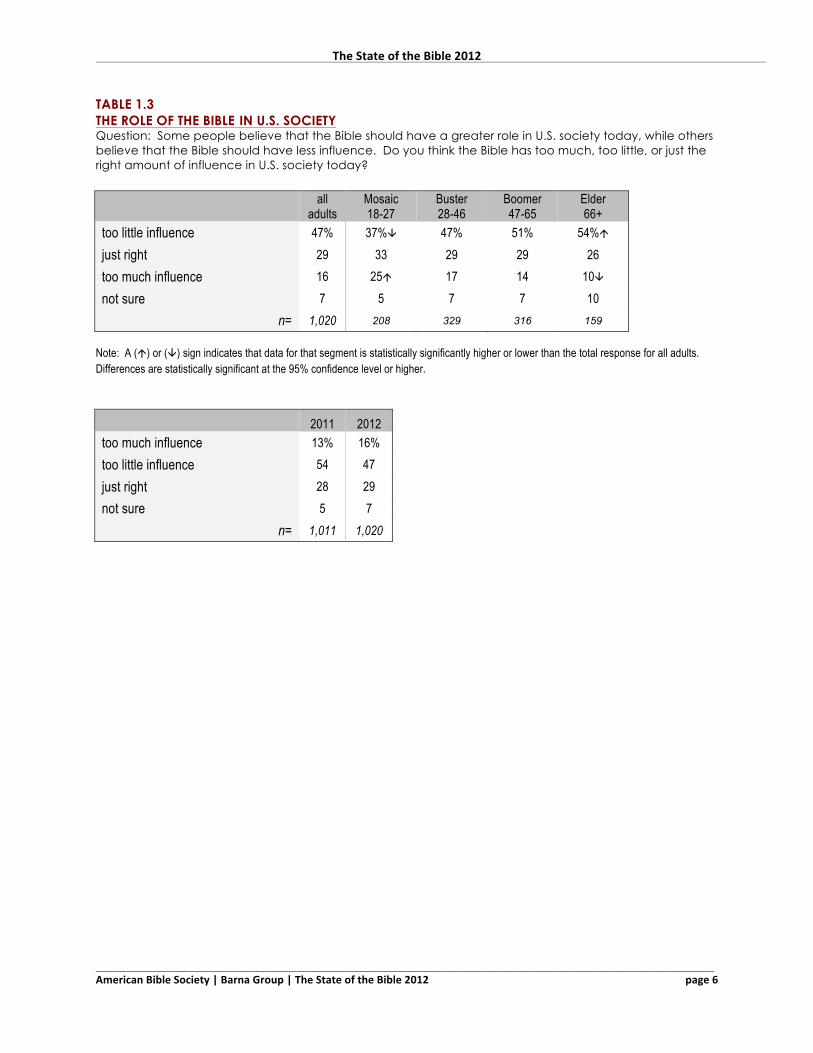
TABLE 1.3 THE ROLE OF THE BIBLE IN U.S. SOCIETY Question: Some people believe that the Bible should have a greater role in U.S. society today, while others believe that the Bible should have less influence. Do you think the Bible has too much, too little, or just the right amount of influence in U.S. society today?
all
adults Mosaic 18-27
Buster 28-46
Boomer 47-65
Elder 66+
too little influence 47% 37%â 47% 51% 54%á just right 29 33 29 29 26 too much influence 16 25á 17 14 10â not sure 7 5 7 7 10
n= 1,020 208 329 316 159
Note: A (á) or (â) sign indicates that data for that segment is statistically significantly higher or lower than the total response for all adults. Differences are statistically significant at the 95% confidence level or higher.
2011 2012 too much influence 13% 16% too little influence 54 47 just right 28 29 not sure 5 7
n= 1,011 1,020
The State of the Bible 2012
_____________________________________________________________________________________________ American Bible Society | Barna Group | The State of the Bible 2012 page 7
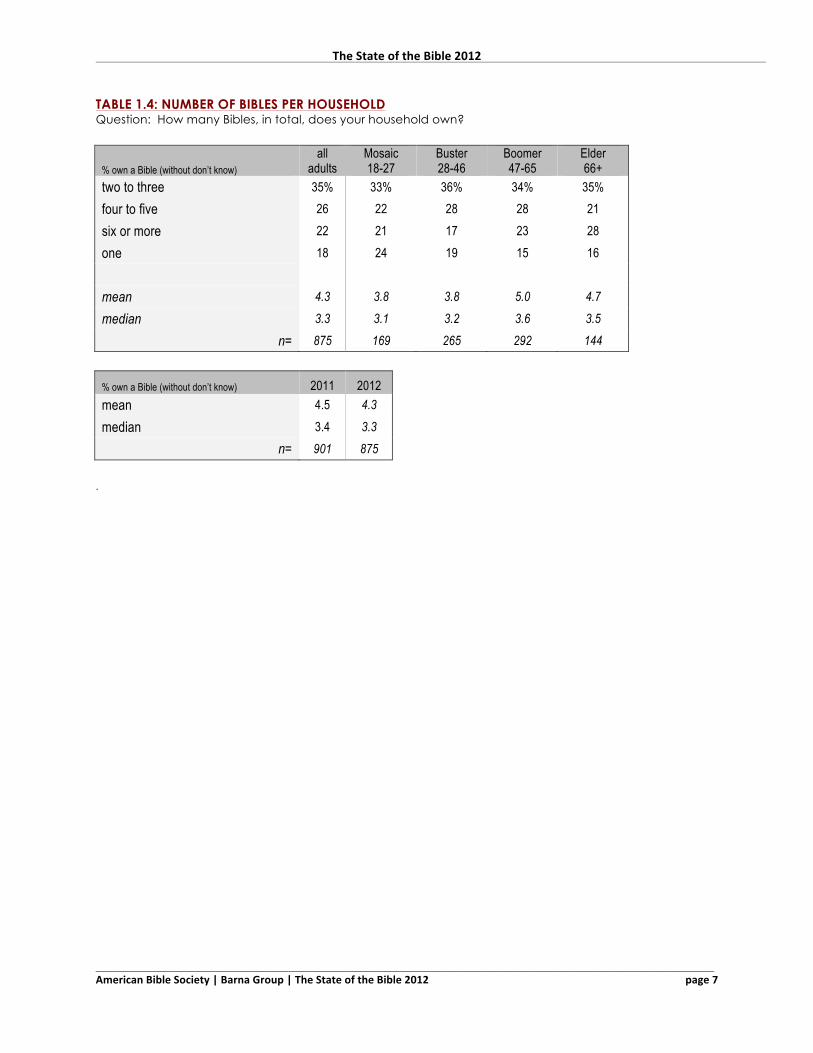
TABLE 1.4: NUMBER OF BIBLES PER HOUSEHOLD Question: How many Bibles, in total, does your household own?
% own a Bible (without don’t know) all
adults Mosaic 18-27
Buster 28-46
Boomer 47-65
Elder 66+
two to three 35% 33% 36% 34% 35% four to five 26 22 28 28 21 six or more 22 21 17 23 28 one 18 24 19 15 16
mean 4.3 3.8 3.8 5.0 4.7
median 3.3 3.1 3.2 3.6 3.5
n= 875 169 265 292 144
% own a Bible (without don’t know) 2011 2012 mean 4.5 4.3
median 3.4 3.3
n= 901 875 .
The State of the Bible 2012
_____________________________________________________________________________________________ American Bible Society | Barna Group | The State of the Bible 2012 page 8
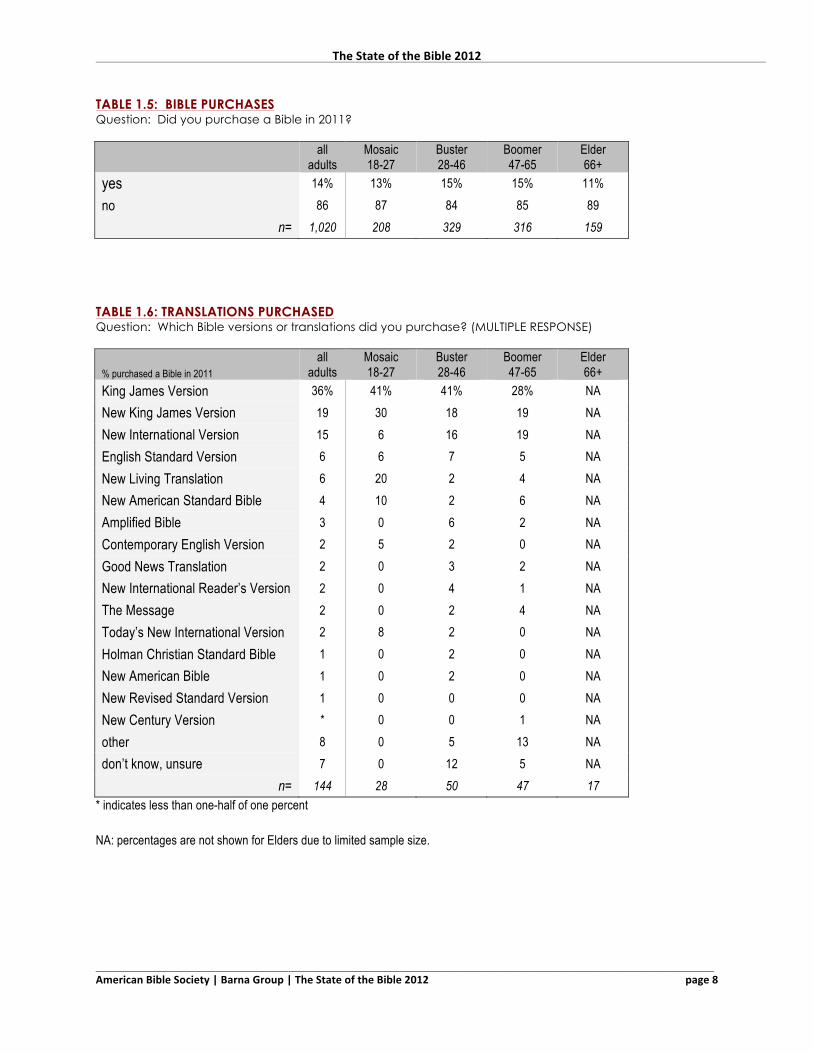
TABLE 1.5: BIBLE PURCHASES Question: Did you purchase a Bible in 2011?
all
adults Mosaic 18-27
Buster 28-46
Boomer 47-65
Elder 66+
yes 14% 13% 15% 15% 11% no 86 87 84 85 89
n= 1,020 208 329 316 159
TABLE 1.6: TRANSLATIONS PURCHASED Question: Which Bible versions or translations did you purchase? (MULTIPLE RESPONSE)
% purchased a Bible in 2011 all
adults Mosaic 18-27
Buster 28-46
Boomer 47-65
Elder 66+
King James Version 36% 41% 41% 28% NA New King James Version 19 30 18 19 NA New International Version 15 6 16 19 NA English Standard Version 6 6 7 5 NA New Living Translation 6 20 2 4 NA New American Standard Bible 4 10 2 6 NA Amplified Bible 3 0 6 2 NA Contemporary English Version 2 5 2 0 NA Good News Translation 2 0 3 2 NA New International Reader’s Version 2 0 4 1 NA The Message 2 0 2 4 NA Today’s New International Version 2 8 2 0 NA Holman Christian Standard Bible 1 0 2 0 NA New American Bible 1 0 2 0 NA New Revised Standard Version 1 0 0 0 NA New Century Version * 0 0 1 NA other 8 0 5 13 NA don’t know, unsure 7 0 12 5 NA
n= 144 28 50 47 17 * indicates less than one-half of one percent NA: percentages are not shown for Elders due to limited sample size.
The State of the Bible 2012
_____________________________________________________________________________________________ American Bible Society | Barna Group | The State of the Bible 2012 page 9
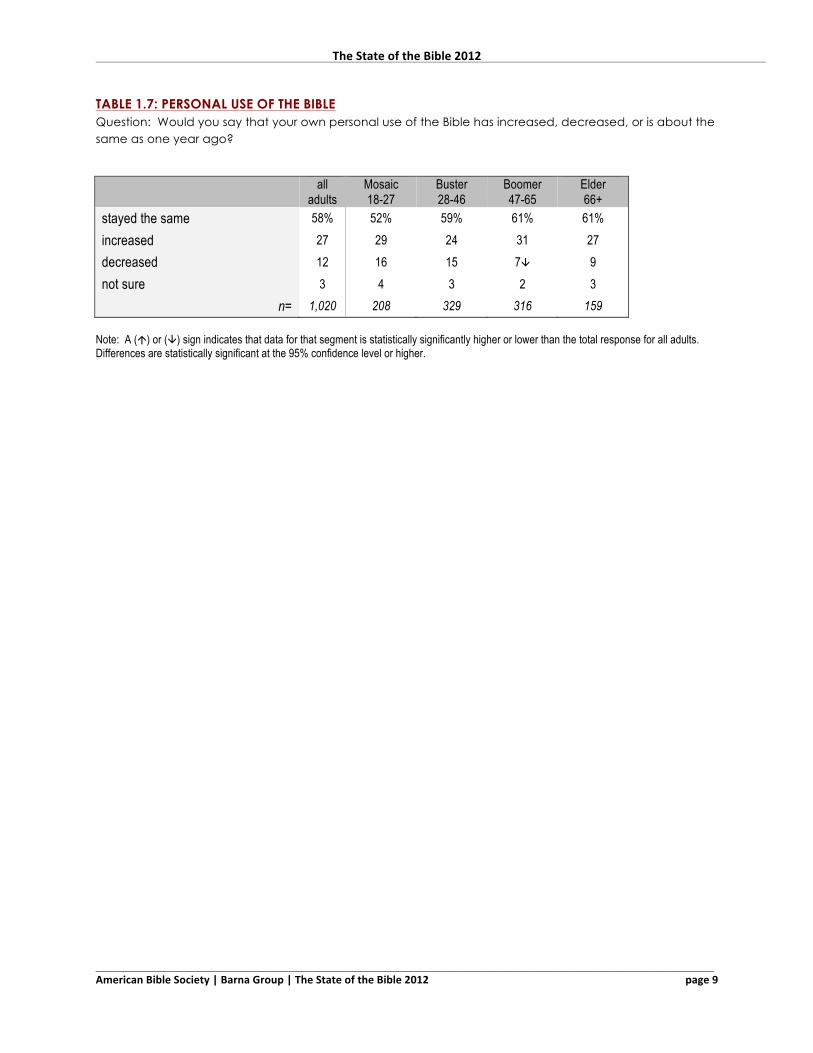
TABLE 1.7: PERSONAL USE OF THE BIBLE Question: Would you say that your own personal use of the Bible has increased, decreased, or is about the same as one year ago?
all
adults Mosaic 18-27
Buster 28-46
Boomer 47-65
Elder 66+
stayed the same 58% 52% 59% 61% 61% increased 27 29 24 31 27 decreased 12 16 15 7â 9 not sure 3 4 3 2 3
n= 1,020 208 329 316 159 Note: A (á) or (â) sign indicates that data for that segment is statistically significantly higher or lower than the total response for all adults. Differences are statistically significant at the 95% confidence level or higher.
The State of the Bible 2012
_____________________________________________________________________________________________ American Bible Society | Barna Group | The State of the Bible 2012 page 10
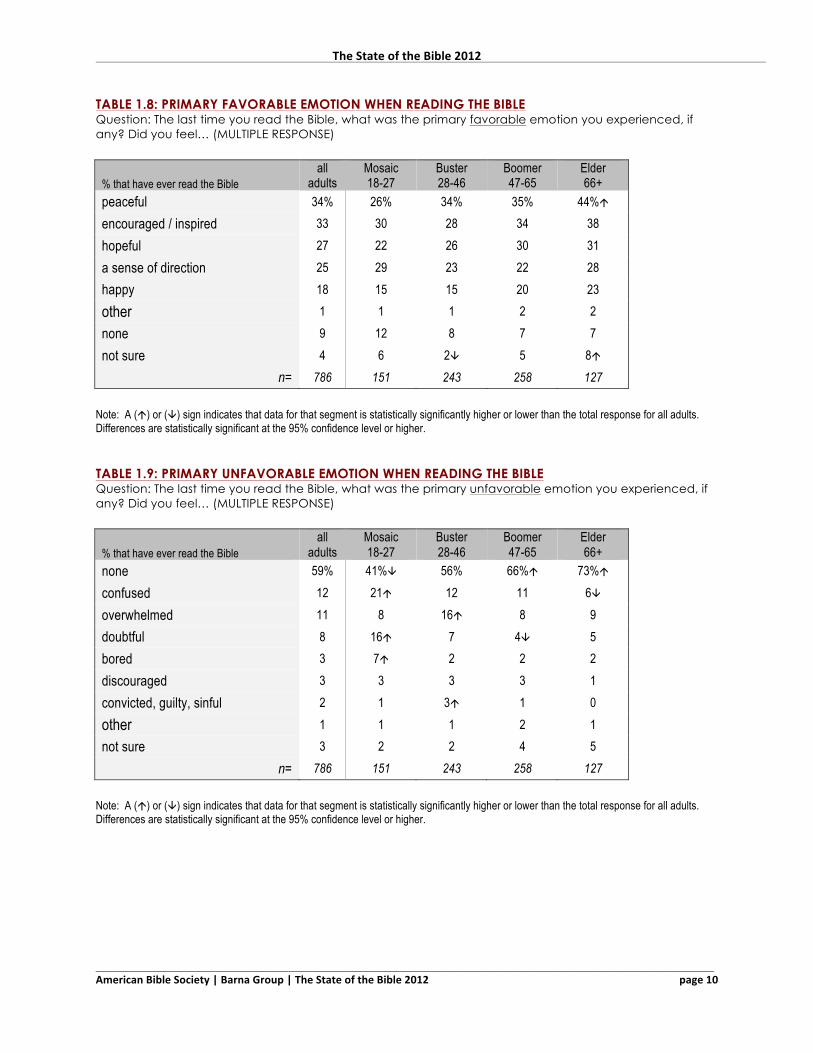
TABLE 1.8: PRIMARY FAVORABLE EMOTION WHEN READING THE BIBLE Question: The last time you read the Bible, what was the primary favorable emotion you experienced, if any? Did you feel… (MULTIPLE RESPONSE)
% that have ever read the Bible all
adults Mosaic 18-27
Buster 28-46
Boomer 47-65
Elder 66+
peaceful 34% 26% 34% 35% 44%á encouraged / inspired 33 30 28 34 38 hopeful 27 22 26 30 31 a sense of direction 25 29 23 22 28 happy 18 15 15 20 23
other 1 1 1 2 2 none 9 12 8 7 7 not sure 4 6 2â 5 8á
n= 786 151 243 258 127 Note: A (á) or (â) sign indicates that data for that segment is statistically significantly higher or lower than the total response for all adults. Differences are statistically significant at the 95% confidence level or higher. TABLE 1.9: PRIMARY UNFAVORABLE EMOTION WHEN READING THE BIBLE Question: The last time you read the Bible, what was the primary unfavorable emotion you experienced, if any? Did you feel… (MULTIPLE RESPONSE)
% that have ever read the Bible all
adults Mosaic 18-27
Buster 28-46
Boomer 47-65
Elder 66+
none 59% 41%â 56% 66%á 73%á confused 12 21á 12 11 6â overwhelmed 11 8 16á 8 9 doubtful 8 16á 7 4â 5 bored 3 7á 2 2 2 discouraged 3 3 3 3 1 convicted, guilty, sinful 2 1 3á 1 0
other 1 1 1 2 1 not sure 3 2 2 4 5
n= 786 151 243 258 127 Note: A (á) or (â) sign indicates that data for that segment is statistically significantly higher or lower than the total response for all adults. Differences are statistically significant at the 95% confidence level or higher.
The State of the Bible 2012
_____________________________________________________________________________________________ American Bible Society | Barna Group | The State of the Bible 2012 page 11
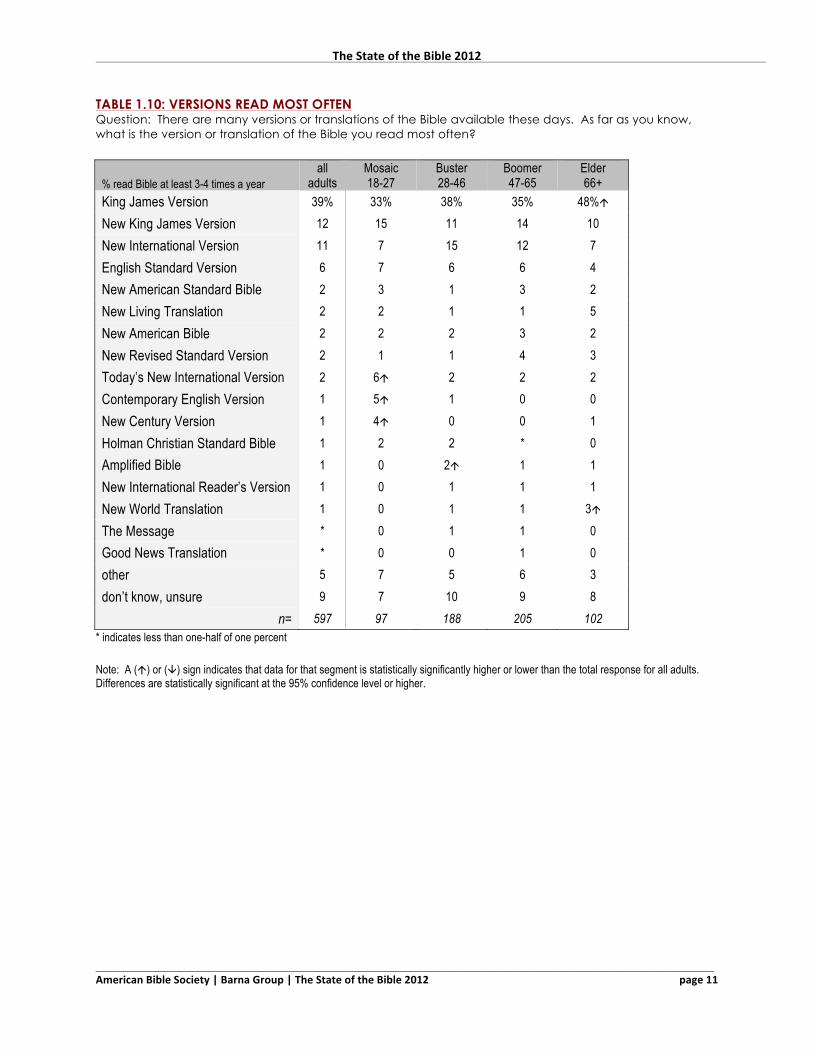
TABLE 1.10: VERSIONS READ MOST OFTEN Question: There are many versions or translations of the Bible available these days. As far as you know, what is the version or translation of the Bible you read most often?
% read Bible at least 3-4 times a year all
adults Mosaic 18-27
Buster 28-46
Boomer 47-65
Elder 66+
King James Version 39% 33% 38% 35% 48%á New King James Version 12 15 11 14 10 New International Version 11 7 15 12 7 English Standard Version 6 7 6 6 4 New American Standard Bible 2 3 1 3 2 New Living Translation 2 2 1 1 5 New American Bible 2 2 2 3 2 New Revised Standard Version 2 1 1 4 3 Today’s New International Version 2 6á 2 2 2 Contemporary English Version 1 5á 1 0 0 New Century Version 1 4á 0 0 1 Holman Christian Standard Bible 1 2 2 * 0 Amplified Bible 1 0 2á 1 1 New International Reader’s Version 1 0 1 1 1 New World Translation 1 0 1 1 3á The Message * 0 1 1 0 Good News Translation * 0 0 1 0 other 5 7 5 6 3 don’t know, unsure 9 7 10 9 8
n= 597 97 188 205 102 * indicates less than one-half of one percent Note: A (á) or (â) sign indicates that data for that segment is statistically significantly higher or lower than the total response for all adults. Differences are statistically significant at the 95% confidence level or higher.
The State of the Bible 2012
_____________________________________________________________________________________________ American Bible Society | Barna Group | The State of the Bible 2012 page 12
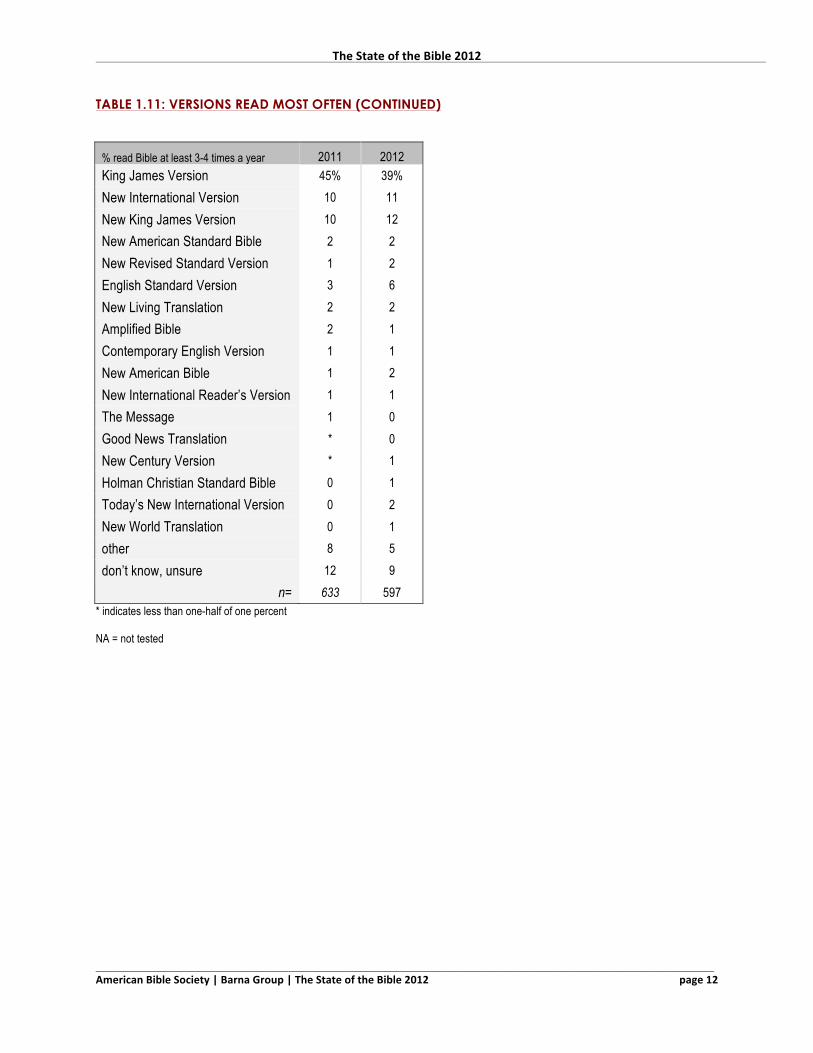
TABLE 1.11: VERSIONS READ MOST OFTEN (CONTINUED)
% read Bible at least 3-4 times a year 2011 2012 King James Version 45% 39% New International Version 10 11 New King James Version 10 12 New American Standard Bible 2 2 New Revised Standard Version 1 2 English Standard Version 3 6 New Living Translation 2 2 Amplified Bible 2 1 Contemporary English Version 1 1 New American Bible 1 2 New International Reader’s Version 1 1 The Message 1 0 Good News Translation * 0 New Century Version * 1 Holman Christian Standard Bible 0 1 Today’s New International Version 0 2 New World Translation 0 1 other 8 5 don’t know, unsure 12 9
n= 633 597 * indicates less than one-half of one percent NA = not tested
The State of the Bible 2012
_____________________________________________________________________________________________ American Bible Society | Barna Group | The State of the Bible 2012 page 13
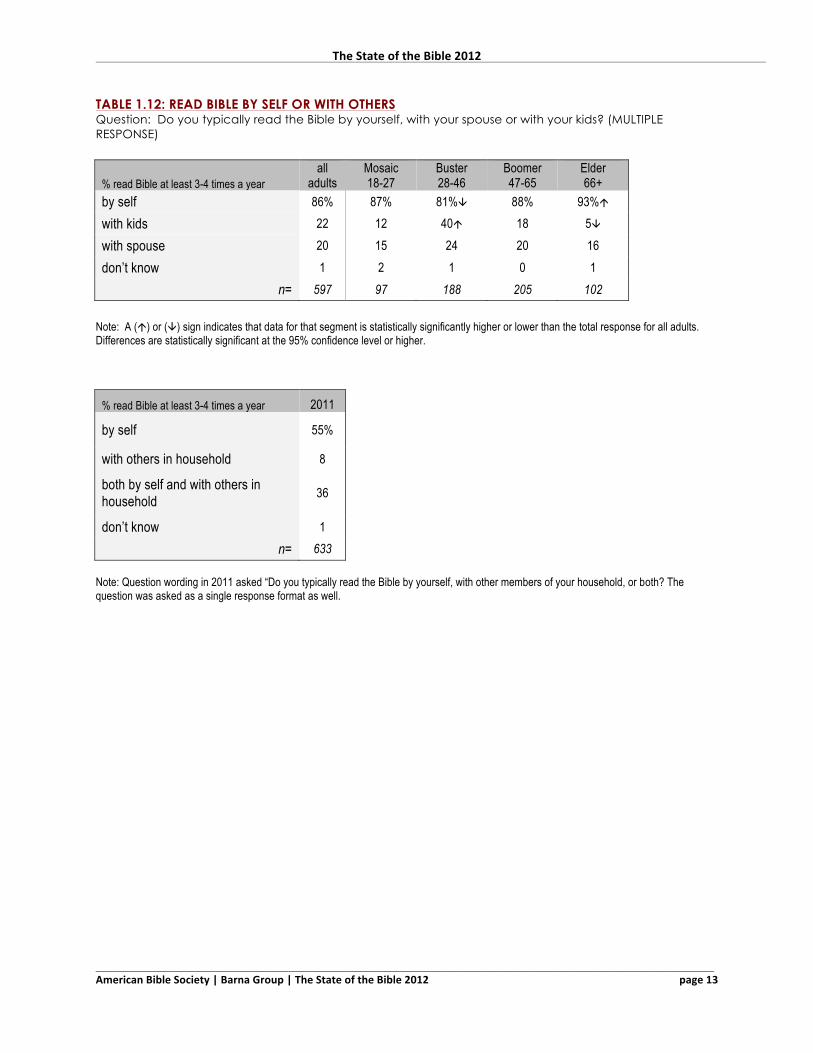
TABLE 1.12: READ BIBLE BY SELF OR WITH OTHERS Question: Do you typically read the Bible by yourself, with your spouse or with your kids? (MULTIPLE RESPONSE)
% read Bible at least 3-4 times a year all
adults Mosaic 18-27
Buster 28-46
Boomer 47-65
Elder 66+
by self 86% 87% 81%â 88% 93%á with kids 22 12 40á 18 5â with spouse 20 15 24 20 16 don’t know 1 2 1 0 1
n= 597 97 188 205 102 Note: A (á) or (â) sign indicates that data for that segment is statistically significantly higher or lower than the total response for all adults. Differences are statistically significant at the 95% confidence level or higher.
% read Bible at least 3-4 times a year 2011
by self 55%
with others in household 8
both by self and with others in household 36
don’t know 1 n= 633
Note: Question wording in 2011 asked “Do you typically read the Bible by yourself, with other members of your household, or both? The question was asked as a single response format as well.
The State of the Bible 2012
_____________________________________________________________________________________________ American Bible Society | Barna Group | The State of the Bible 2012 page 14
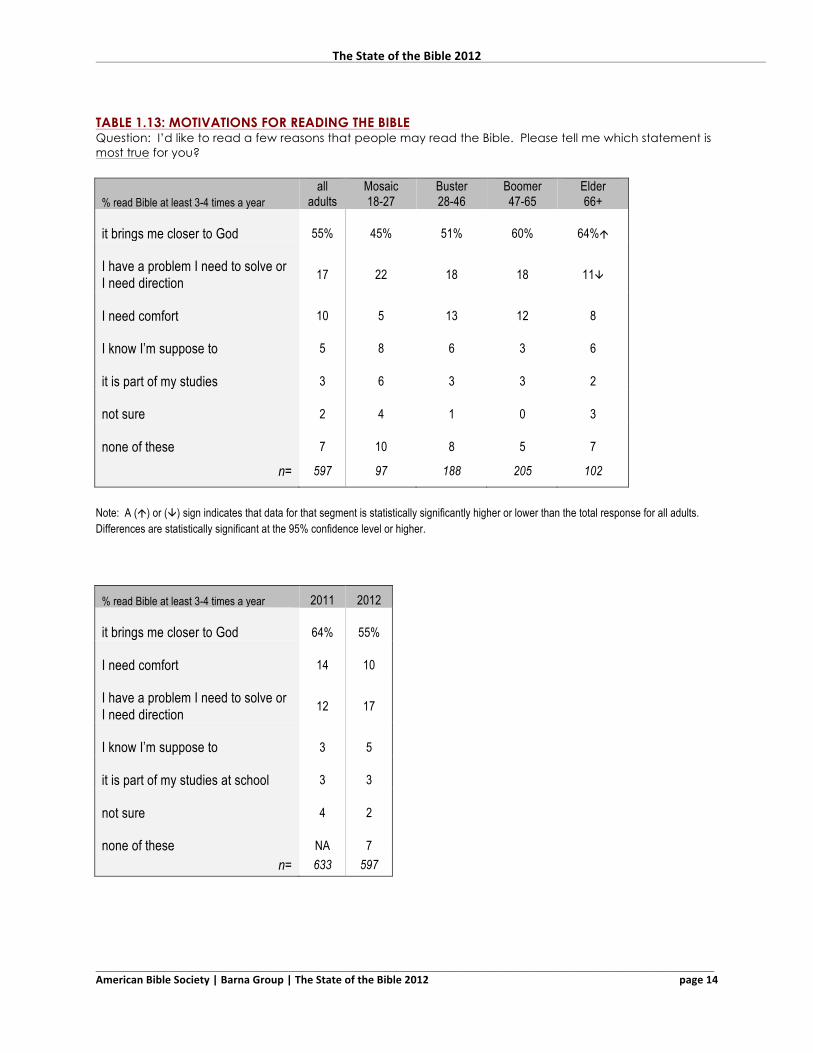
TABLE 1.13: MOTIVATIONS FOR READING THE BIBLE Question: I’d like to read a few reasons that people may read the Bible. Please tell me which statement is most true for you?
% read Bible at least 3-4 times a year all
adults Mosaic 18-27
Buster 28-46
Boomer 47-65
Elder 66+
it brings me closer to God 55% 45% 51% 60% 64%á
I have a problem I need to solve or I need direction 17 22 18 18 11â
I need comfort 10 5 13 12 8
I know I’m suppose to 5 8 6 3 6
it is part of my studies 3 6 3 3 2
not sure 2 4 1 0 3
none of these 7 10 8 5 7
n= 597 97 188 205 102
Note: A (á) or (â) sign indicates that data for that segment is statistically significantly higher or lower than the total response for all adults. Differences are statistically significant at the 95% confidence level or higher.
% read Bible at least 3-4 times a year 2011 2012
it brings me closer to God 64% 55%
I need comfort 14 10
I have a problem I need to solve or I need direction 12 17
I know I’m suppose to 3 5
it is part of my studies at school 3 3
not sure 4 2
none of these NA 7 n= 633 597
The State of the Bible 2012
_____________________________________________________________________________________________ American Bible Society | Barna Group | The State of the Bible 2012 page 15
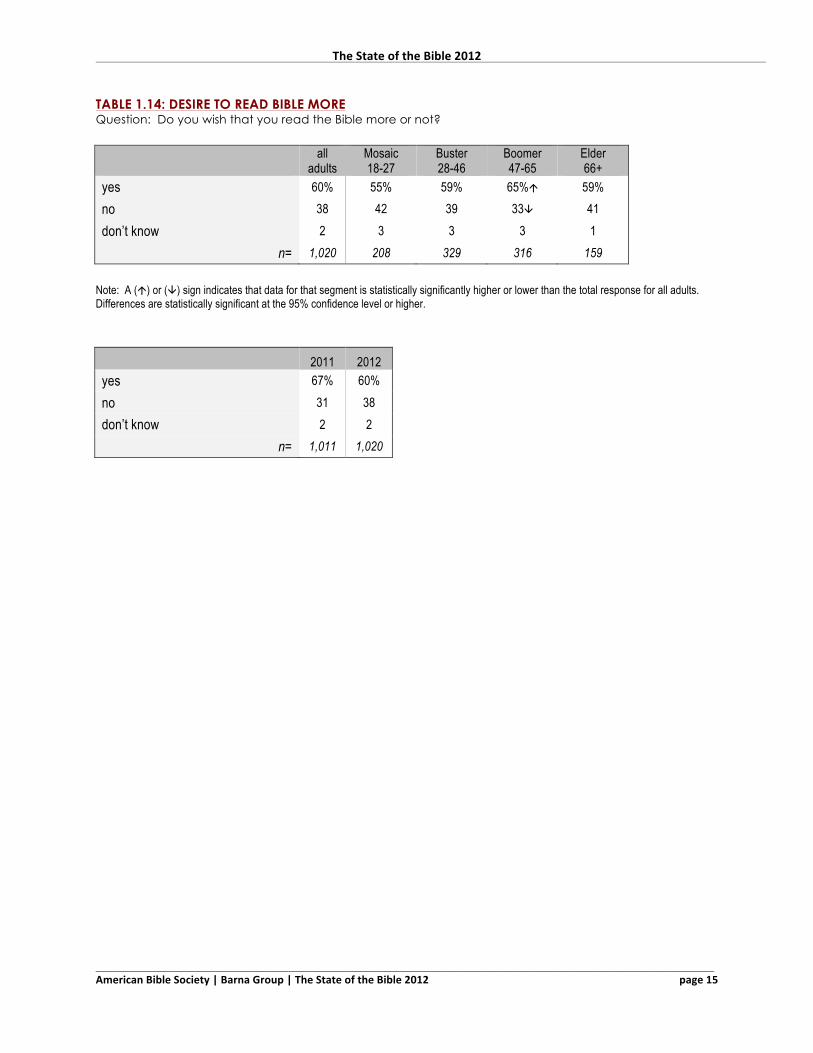
TABLE 1.14: DESIRE TO READ BIBLE MORE Question: Do you wish that you read the Bible more or not?
all
adults Mosaic 18-27
Buster 28-46
Boomer 47-65
Elder 66+
yes 60% 55% 59% 65%á 59% no 38 42 39 33â 41 don’t know 2 3 3 3 1
n= 1,020 208 329 316 159 Note: A (á) or (â) sign indicates that data for that segment is statistically significantly higher or lower than the total response for all adults. Differences are statistically significant at the 95% confidence level or higher. 2011 2012 yes 67% 60% no 31 38 don’t know 2 2
n= 1,011 1,020
The State of the Bible 2012
_____________________________________________________________________________________________ American Bible Society | Barna Group | The State of the Bible 2012 page 16
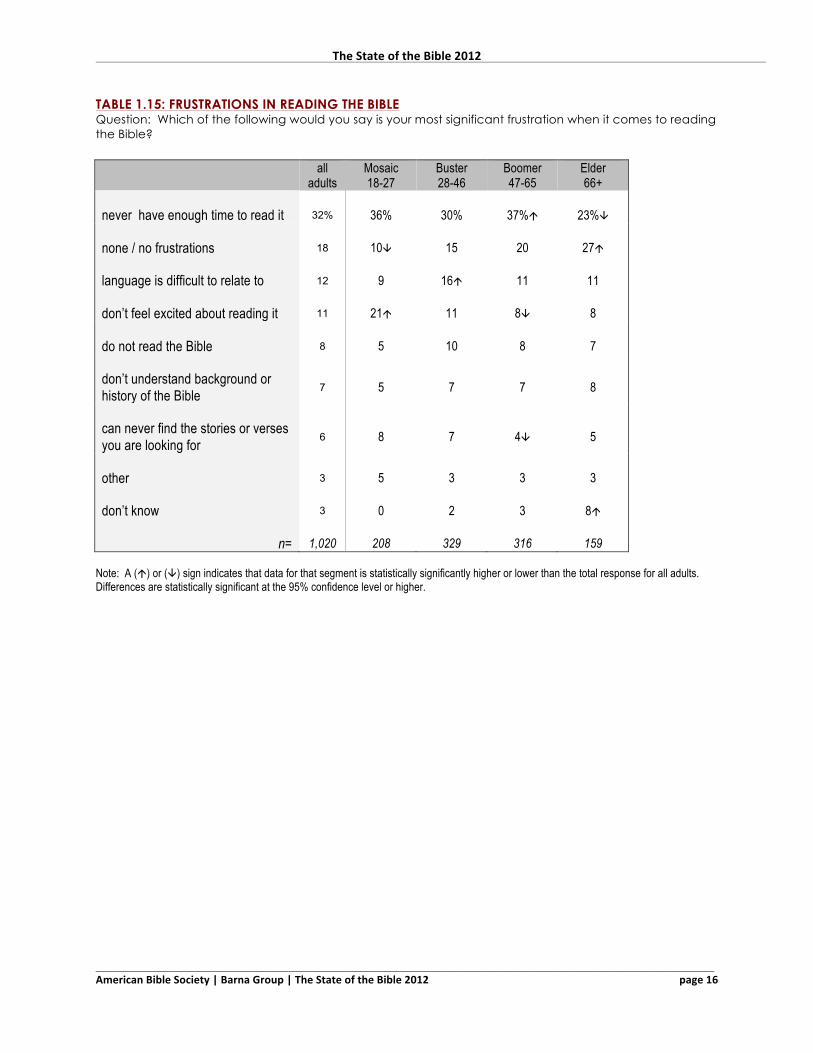
TABLE 1.15: FRUSTRATIONS IN READING THE BIBLE Question: Which of the following would you say is your most significant frustration when it comes to reading the Bible?
all
adults Mosaic 18-27
Buster 28-46
Boomer 47-65
Elder 66+
never have enough time to read it 32% 36% 30% 37%á 23%â
none / no frustrations 18 10â 15 20 27á
language is difficult to relate to 12 9 16á 11 11
don’t feel excited about reading it 11 21á 11 8â 8
do not read the Bible 8 5 10 8 7
don’t understand background or history of the Bible 7 5 7 7 8
can never find the stories or verses you are looking for 6 8 7 4â 5
other 3 5 3 3 3
don’t know 3 0 2 3 8á
n= 1,020 208 329 316 159 Note: A (á) or (â) sign indicates that data for that segment is statistically significantly higher or lower than the total response for all adults. Differences are statistically significant at the 95% confidence level or higher.
The State of the Bible 2012
_____________________________________________________________________________________________ American Bible Society | Barna Group | The State of the Bible 2012 page 17
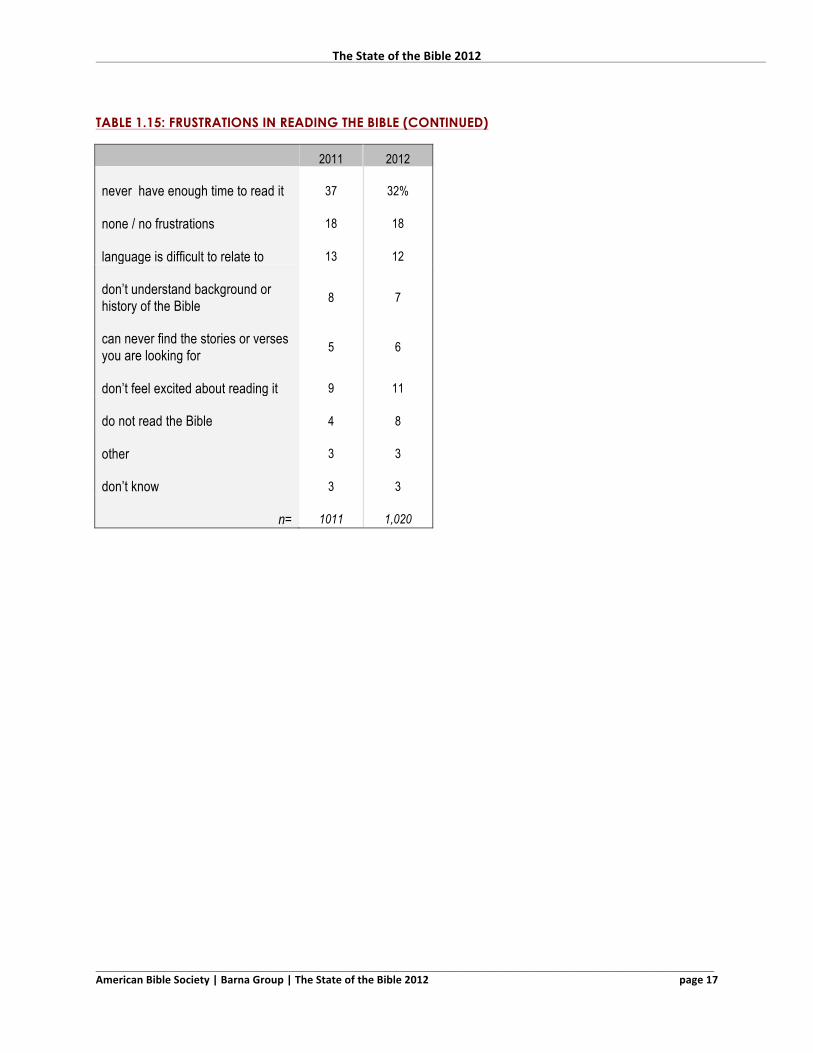
TABLE 1.15: FRUSTRATIONS IN READING THE BIBLE (CONTINUED)
2011 2012
never have enough time to read it 37 32%
none / no frustrations 18 18
language is difficult to relate to 13 12
don’t understand background or history of the Bible 8 7
can never find the stories or verses you are looking for 5 6
don’t feel excited about reading it 9 11
do not read the Bible 4 8
other 3 3
don’t know 3 3
n= 1011 1,020
The State of the Bible 2012
_____________________________________________________________________________________________ American Bible Society | Barna Group | The State of the Bible 2012 page 18
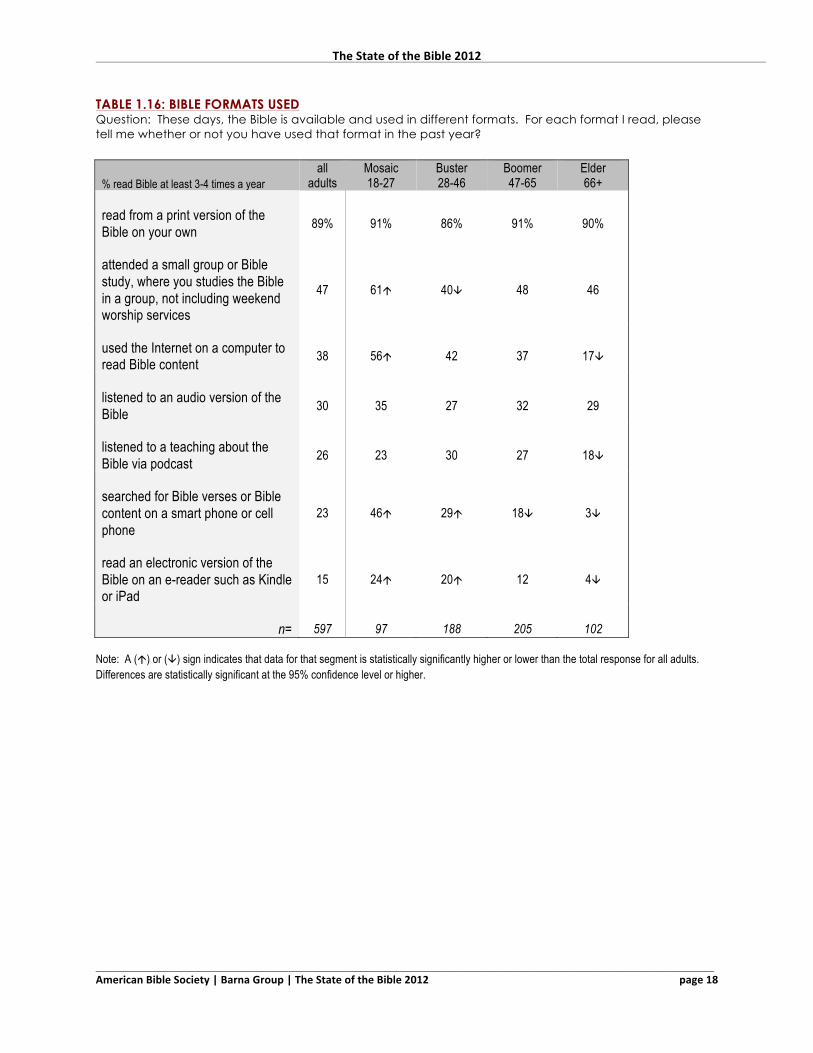
TABLE 1.16: BIBLE FORMATS USED Question: These days, the Bible is available and used in different formats. For each format I read, please tell me whether or not you have used that format in the past year?
% read Bible at least 3-4 times a year all
adults Mosaic 18-27
Buster 28-46
Boomer 47-65
Elder 66+
read from a print version of the Bible on your own 89% 91% 86% 91% 90%
attended a small group or Bible study, where you studies the Bible in a group, not including weekend worship services
47 61á 40â 48 46
used the Internet on a computer to read Bible content 38 56á 42 37 17â
listened to an audio version of the Bible 30 35 27 32 29
listened to a teaching about the Bible via podcast 26 23 30 27 18â
searched for Bible verses or Bible content on a smart phone or cell phone
23 46á 29á 18â 3â
read an electronic version of the Bible on an e-reader such as Kindle or iPad
15 24á 20á 12 4â
n= 597 97 188 205 102 Note: A (á) or (â) sign indicates that data for that segment is statistically significantly higher or lower than the total response for all adults. Differences are statistically significant at the 95% confidence level or higher.
The State of the Bible 2012
_____________________________________________________________________________________________ American Bible Society | Barna Group | The State of the Bible 2012 page 19
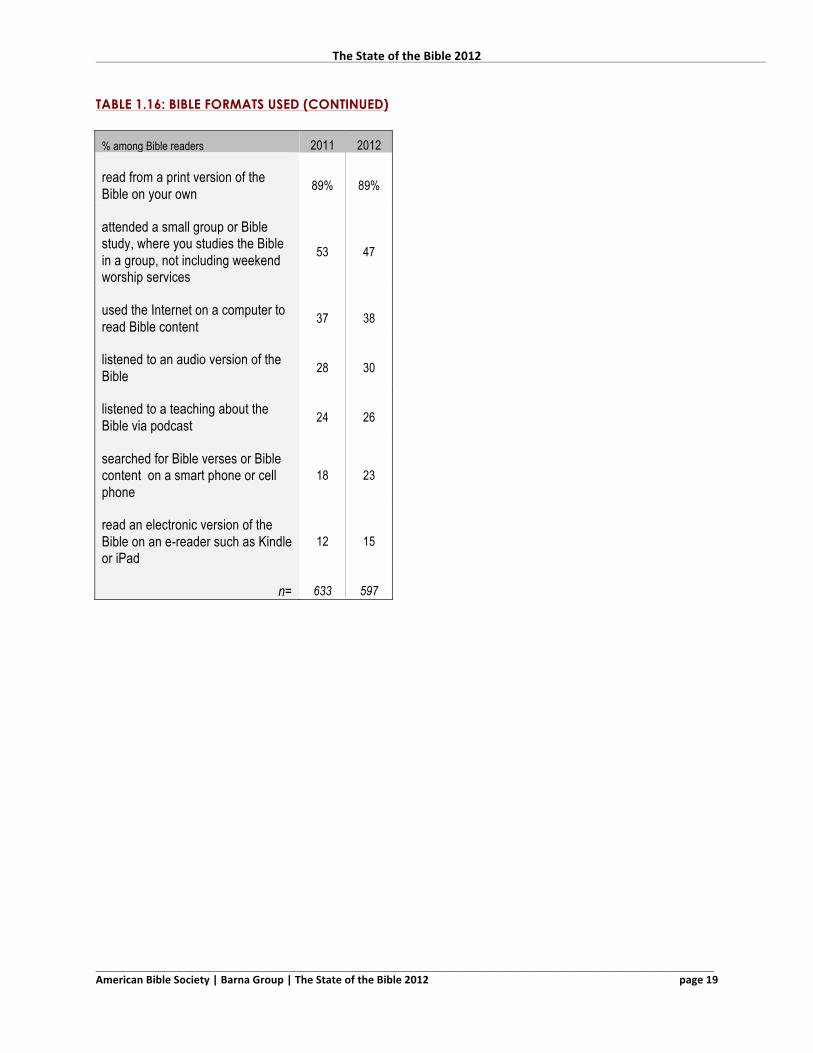
TABLE 1.16: BIBLE FORMATS USED (CONTINUED)
% among Bible readers 2011 2012
read from a print version of the Bible on your own 89% 89%
attended a small group or Bible study, where you studies the Bible in a group, not including weekend worship services
53 47
used the Internet on a computer to read Bible content 37 38
listened to an audio version of the Bible 28 30
listened to a teaching about the Bible via podcast 24 26
searched for Bible verses or Bible content on a smart phone or cell phone
18 23
read an electronic version of the Bible on an e-reader such as Kindle or iPad
12 15
n= 633 597
The State of the Bible 2012
_____________________________________________________________________________________________ American Bible Society | Barna Group | The State of the Bible 2012 page 20
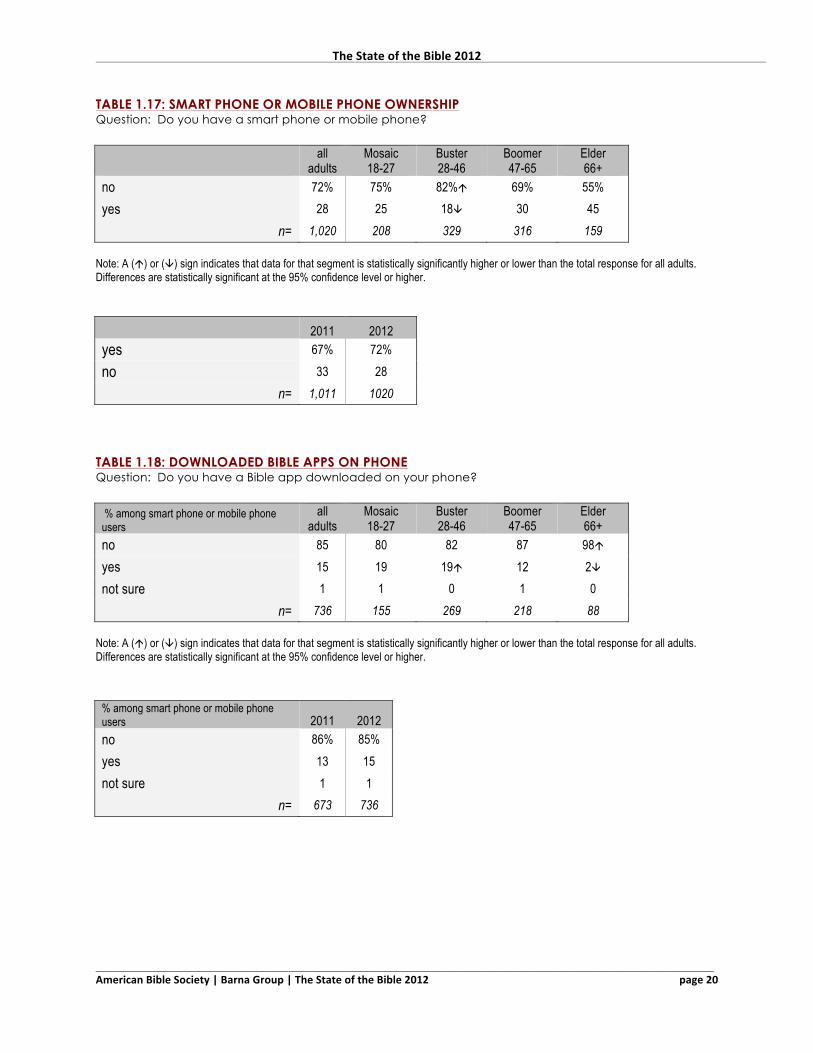
TABLE 1.17: SMART PHONE OR MOBILE PHONE OWNERSHIP Question: Do you have a smart phone or mobile phone?
all
adults Mosaic 18-27
Buster 28-46
Boomer 47-65
Elder 66+
no 72% 75% 82%á 69% 55% yes 28 25 18â 30 45
n= 1,020 208 329 316 159 Note: A (á) or (â) sign indicates that data for that segment is statistically significantly higher or lower than the total response for all adults. Differences are statistically significant at the 95% confidence level or higher.
2011 2012 yes 67% 72%
no 33 28 n= 1,011 1020
TABLE 1.18: DOWNLOADED BIBLE APPS ON PHONE Question: Do you have a Bible app downloaded on your phone?
% among smart phone or mobile phone users
all adults
Mosaic 18-27
Buster 28-46
Boomer 47-65
Elder 66+
no 85 80 82 87 98á yes 15 19 19á 12 2â not sure 1 1 0 1 0
n= 736 155 269 218 88 Note: A (á) or (â) sign indicates that data for that segment is statistically significantly higher or lower than the total response for all adults. Differences are statistically significant at the 95% confidence level or higher.
% among smart phone or mobile phone users 2011 2012 no 86% 85% yes 13 15 not sure 1 1
n= 673 736
The State of the Bible 2012
_____________________________________________________________________________________________ American Bible Society | Barna Group | The State of the Bible 2012 page 21
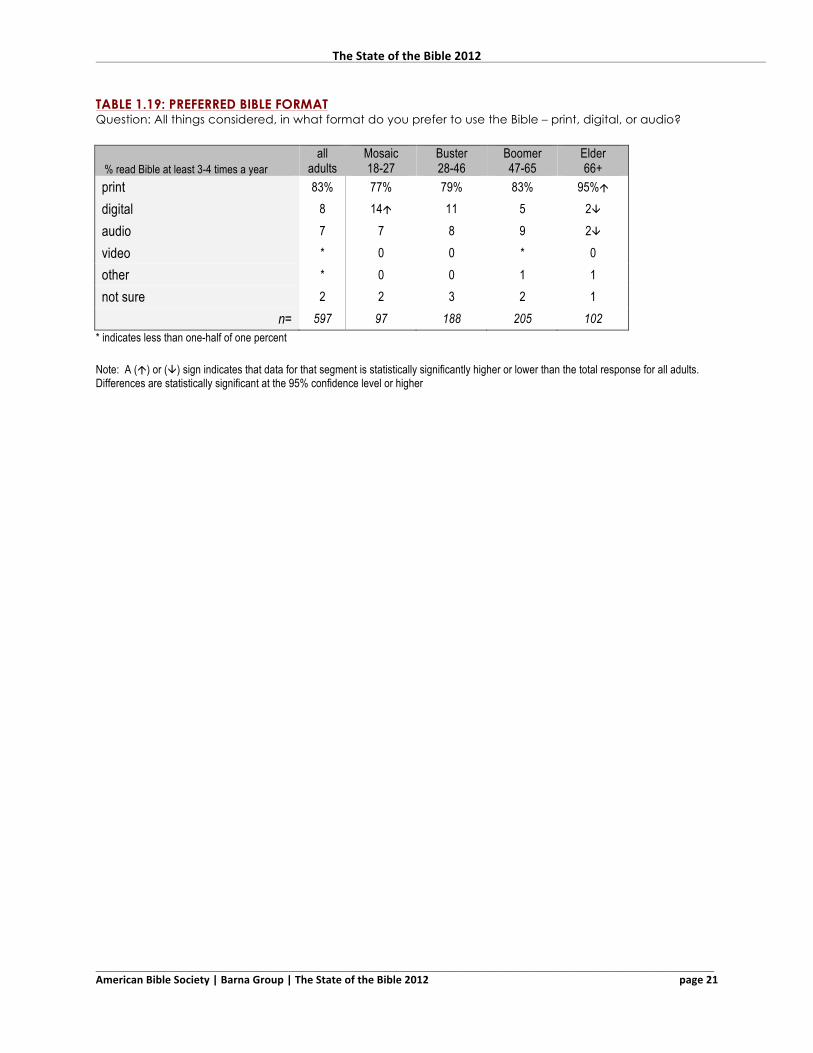
TABLE 1.19: PREFERRED BIBLE FORMAT Question: All things considered, in what format do you prefer to use the Bible – print, digital, or audio?
% read Bible at least 3-4 times a year all
adults Mosaic 18-27
Buster 28-46
Boomer 47-65
Elder 66+
print 83% 77% 79% 83% 95%á digital 8 14á 11 5 2â audio 7 7 8 9 2â video * 0 0 * 0 other * 0 0 1 1 not sure 2 2 3 2 1
n= 597 97 188 205 102 * indicates less than one-half of one percent Note: A (á) or (â) sign indicates that data for that segment is statistically significantly higher or lower than the total response for all adults. Differences are statistically significant at the 95% confidence level or higher
The State of the Bible 2012
_____________________________________________________________________________________________ American Bible Society | Barna Group | The State of the Bible 2012 page 22
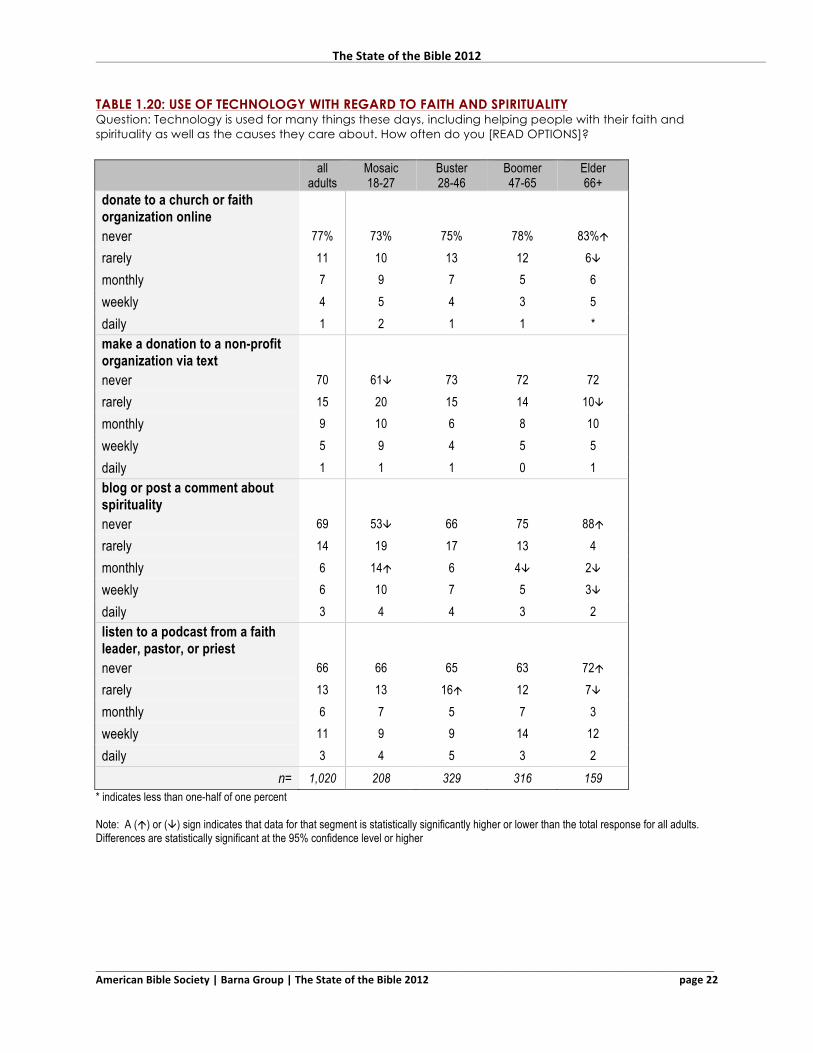
TABLE 1.20: USE OF TECHNOLOGY WITH REGARD TO FAITH AND SPIRITUALITY Question: Technology is used for many things these days, including helping people with their faith and spirituality as well as the causes they care about. How often do you [READ OPTIONS]?
all
adults Mosaic 18-27
Buster 28-46
Boomer 47-65
Elder 66+
donate to a church or faith organization online
never 77% 73% 75% 78% 83%á rarely 11 10 13 12 6â monthly 7 9 7 5 6 weekly 4 5 4 3 5 daily 1 2 1 1 * make a donation to a non-profit organization via text
never 70 61â 73 72 72 rarely 15 20 15 14 10â monthly 9 10 6 8 10 weekly 5 9 4 5 5 daily 1 1 1 0 1 blog or post a comment about spirituality
never 69 53â 66 75 88á rarely 14 19 17 13 4 monthly 6 14á 6 4â 2â weekly 6 10 7 5 3â daily 3 4 4 3 2 listen to a podcast from a faith leader, pastor, or priest
never 66 66 65 63 72á rarely 13 13 16á 12 7â monthly 6 7 5 7 3 weekly 11 9 9 14 12 daily 3 4 5 3 2
n= 1,020 208 329 316 159 * indicates less than one-half of one percent Note: A (á) or (â) sign indicates that data for that segment is statistically significantly higher or lower than the total response for all adults. Differences are statistically significant at the 95% confidence level or higher
The State of the Bible 2012
_____________________________________________________________________________________________ American Bible Society | Barna Group | The State of the Bible 2012 page 23
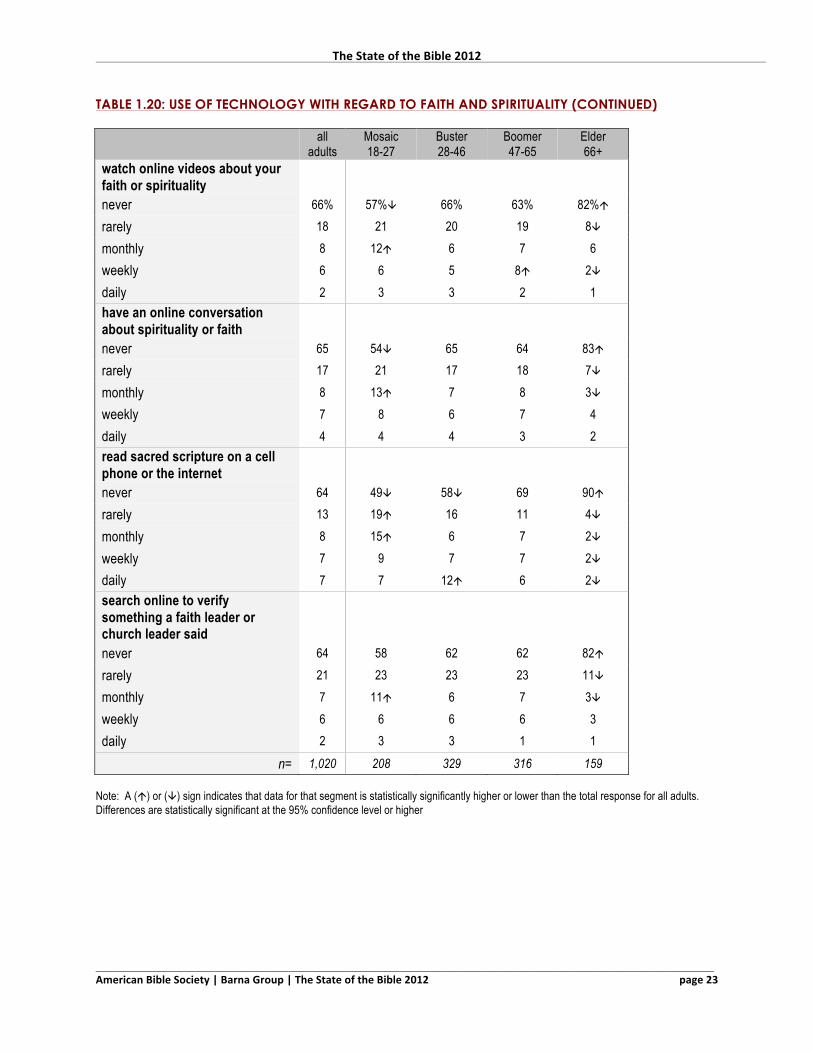
TABLE 1.20: USE OF TECHNOLOGY WITH REGARD TO FAITH AND SPIRITUALITY (CONTINUED)
all
adults Mosaic 18-27
Buster 28-46
Boomer 47-65
Elder 66+
watch online videos about your faith or spirituality
never 66% 57%â 66% 63% 82%á rarely 18 21 20 19 8â monthly 8 12á 6 7 6 weekly 6 6 5 8á 2â daily 2 3 3 2 1 have an online conversation about spirituality or faith
never 65 54â 65 64 83á rarely 17 21 17 18 7â monthly 8 13á 7 8 3â weekly 7 8 6 7 4 daily 4 4 4 3 2 read sacred scripture on a cell phone or the internet
never 64 49â 58â 69 90á rarely 13 19á 16 11 4â monthly 8 15á 6 7 2â weekly 7 9 7 7 2â daily 7 7 12á 6 2â search online to verify something a faith leader or church leader said
never 64 58 62 62 82á rarely 21 23 23 23 11â monthly 7 11á 6 7 3â weekly 6 6 6 6 3 daily 2 3 3 1 1
n= 1,020 208 329 316 159 Note: A (á) or (â) sign indicates that data for that segment is statistically significantly higher or lower than the total response for all adults. Differences are statistically significant at the 95% confidence level or higher
The State of the Bible 2012
_____________________________________________________________________________________________ American Bible Society | Barna Group | The State of the Bible 2012 page 24
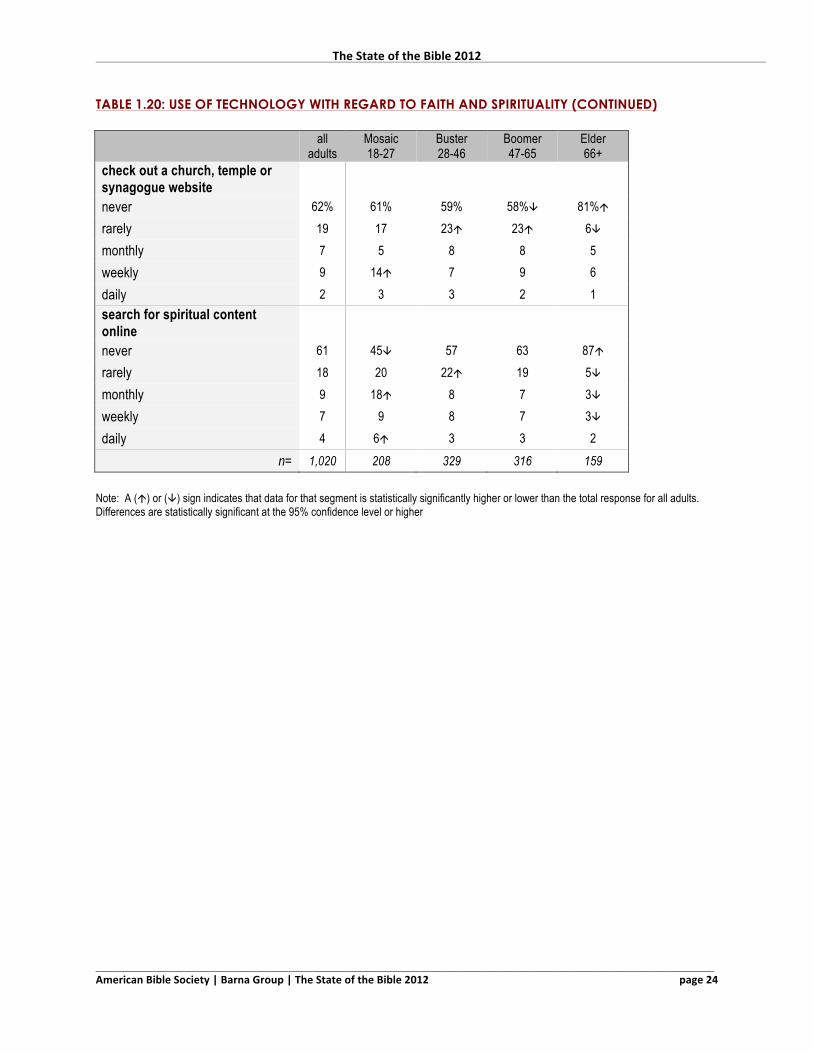
TABLE 1.20: USE OF TECHNOLOGY WITH REGARD TO FAITH AND SPIRITUALITY (CONTINUED)
all
adults Mosaic 18-27
Buster 28-46
Boomer 47-65
Elder 66+
check out a church, temple or synagogue website
never 62% 61% 59% 58%â 81%á rarely 19 17 23á 23á 6â monthly 7 5 8 8 5 weekly 9 14á 7 9 6 daily 2 3 3 2 1 search for spiritual content online
never 61 45â 57 63 87á rarely 18 20 22á 19 5â monthly 9 18á 8 7 3â weekly 7 9 8 7 3â daily 4 6á 3 3 2
n= 1,020 208 329 316 159 Note: A (á) or (â) sign indicates that data for that segment is statistically significantly higher or lower than the total response for all adults. Differences are statistically significant at the 95% confidence level or higher
The State of the Bible 2012
_____________________________________________________________________________________________ American Bible Society | Barna Group | The State of the Bible 2012 page 25
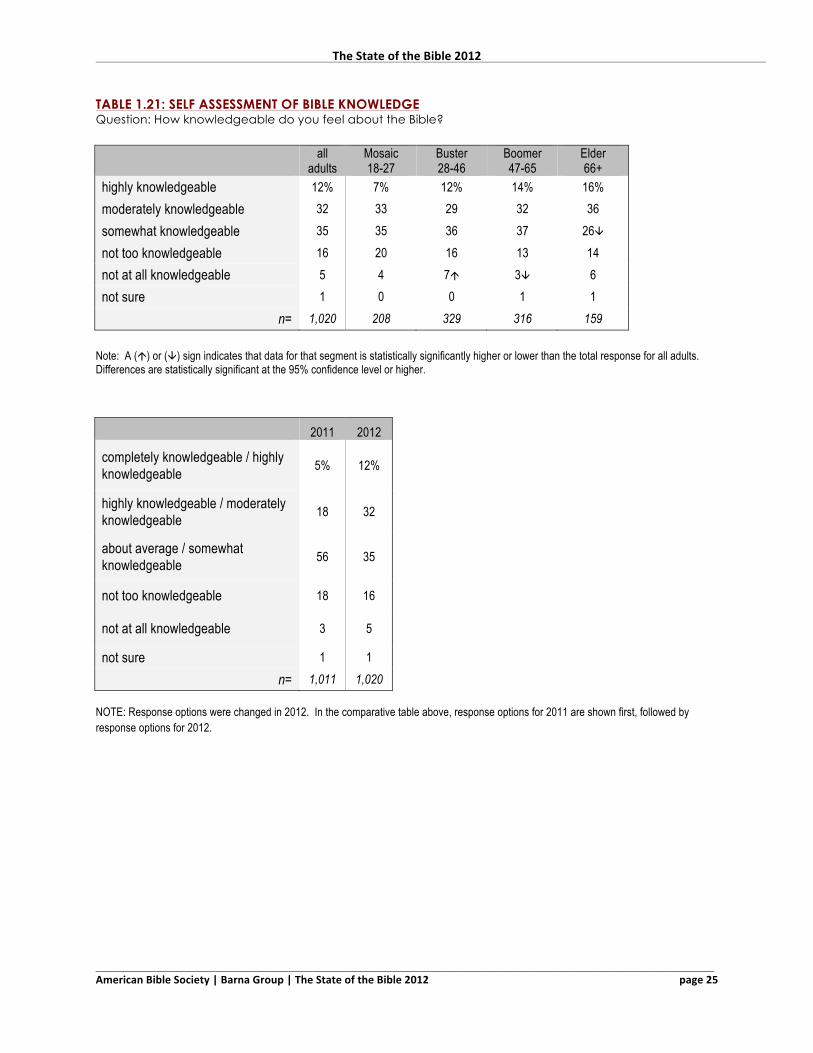
TABLE 1.21: SELF ASSESSMENT OF BIBLE KNOWLEDGE Question: How knowledgeable do you feel about the Bible?
all
adults Mosaic 18-27
Buster 28-46
Boomer 47-65
Elder 66+
highly knowledgeable 12% 7% 12% 14% 16% moderately knowledgeable 32 33 29 32 36 somewhat knowledgeable 35 35 36 37 26â not too knowledgeable 16 20 16 13 14 not at all knowledgeable 5 4 7á 3â 6 not sure 1 0 0 1 1
n= 1,020 208 329 316 159 Note: A (á) or (â) sign indicates that data for that segment is statistically significantly higher or lower than the total response for all adults. Differences are statistically significant at the 95% confidence level or higher.
2011 2012
completely knowledgeable / highly knowledgeable 5% 12%
highly knowledgeable / moderately knowledgeable 18 32
about average / somewhat knowledgeable 56 35
not too knowledgeable 18 16
not at all knowledgeable 3 5
not sure 1 1 n= 1,011 1,020
NOTE: Response options were changed in 2012. In the comparative table above, response options for 2011 are shown first, followed by response options for 2012.
The State of the Bible 2012
_____________________________________________________________________________________________ American Bible Society | Barna Group | The State of the Bible 2012 page 26
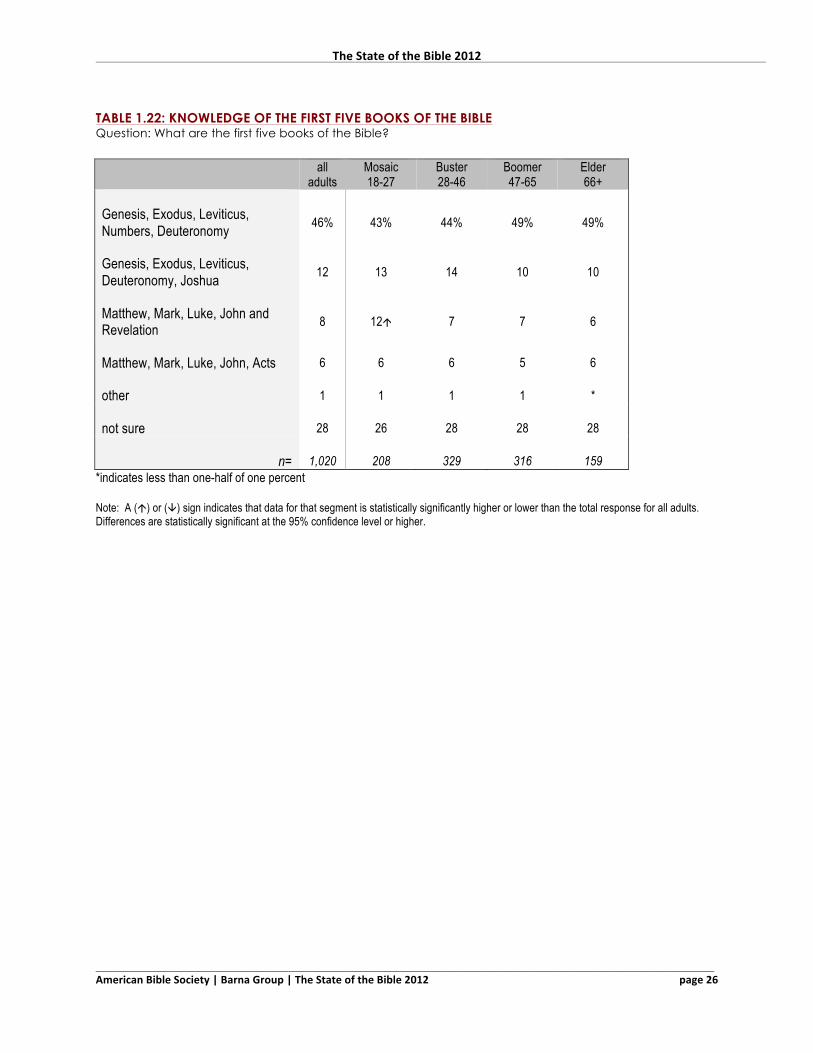
TABLE 1.22: KNOWLEDGE OF THE FIRST FIVE BOOKS OF THE BIBLE Question: What are the first five books of the Bible?
all
adults Mosaic 18-27
Buster 28-46
Boomer 47-65
Elder 66+
Genesis, Exodus, Leviticus, Numbers, Deuteronomy 46% 43% 44% 49% 49%
Genesis, Exodus, Leviticus, Deuteronomy, Joshua 12 13 14 10 10
Matthew, Mark, Luke, John and Revelation 8 12á 7 7 6
Matthew, Mark, Luke, John, Acts 6 6 6 5 6
other 1 1 1 1 *
not sure 28 26 28 28 28
n= 1,020 208 329 316 159 *indicates less than one-half of one percent Note: A (á) or (â) sign indicates that data for that segment is statistically significantly higher or lower than the total response for all adults. Differences are statistically significant at the 95% confidence level or higher.
The State of the Bible 2012
_____________________________________________________________________________________________ American Bible Society | Barna Group | The State of the Bible 2012 page 27
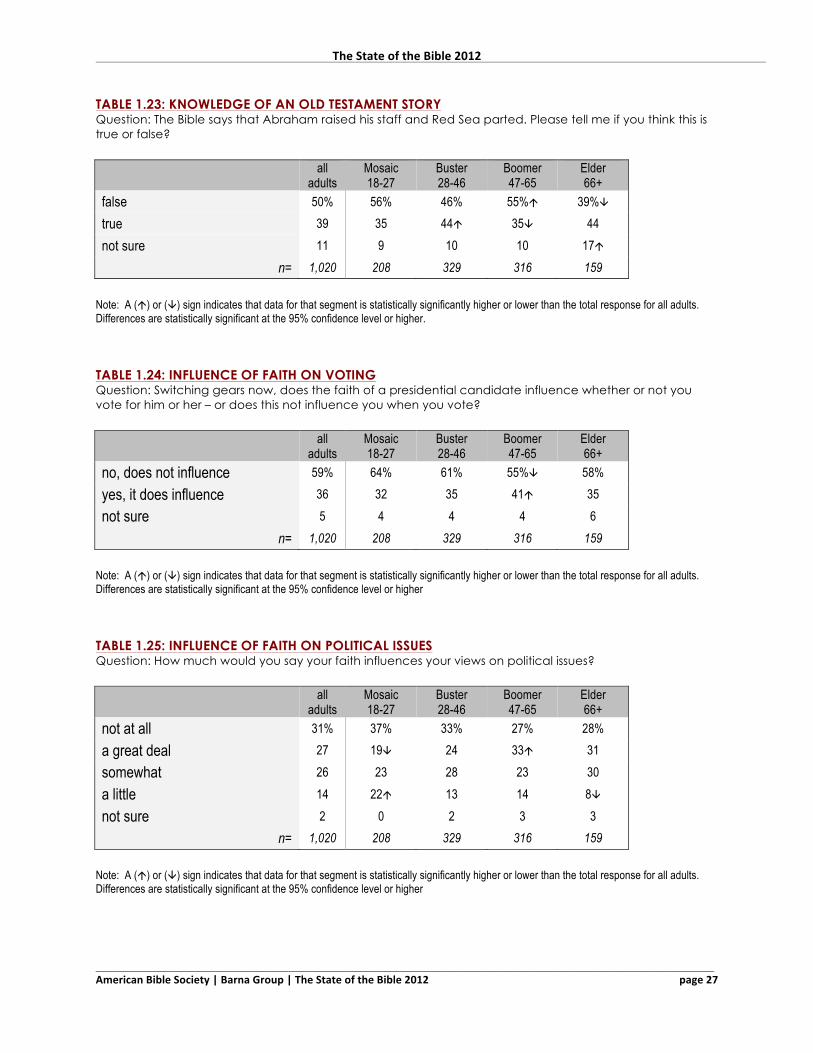
TABLE 1.23: KNOWLEDGE OF AN OLD TESTAMENT STORY Question: The Bible says that Abraham raised his staff and Red Sea parted. Please tell me if you think this is true or false?
all
adults Mosaic 18-27
Buster 28-46
Boomer 47-65
Elder 66+
false 50% 56% 46% 55%á 39%â true 39 35 44á 35â 44 not sure 11 9 10 10 17á
n= 1,020 208 329 316 159 Note: A (á) or (â) sign indicates that data for that segment is statistically significantly higher or lower than the total response for all adults. Differences are statistically significant at the 95% confidence level or higher. TABLE 1.24: INFLUENCE OF FAITH ON VOTING Question: Switching gears now, does the faith of a presidential candidate influence whether or not you vote for him or her – or does this not influence you when you vote?
all
adults Mosaic 18-27
Buster 28-46
Boomer 47-65
Elder 66+
no, does not influence 59% 64% 61% 55%â 58%
yes, it does influence 36 32 35 41á 35
not sure 5 4 4 4 6 n= 1,020 208 329 316 159
Note: A (á) or (â) sign indicates that data for that segment is statistically significantly higher or lower than the total response for all adults. Differences are statistically significant at the 95% confidence level or higher TABLE 1.25: INFLUENCE OF FAITH ON POLITICAL ISSUES Question: How much would you say your faith influences your views on political issues?
all
adults Mosaic 18-27
Buster 28-46
Boomer 47-65
Elder 66+
not at all 31% 37% 33% 27% 28%
a great deal 27 19â 24 33á 31
somewhat 26 23 28 23 30
a little 14 22á 13 14 8â
not sure 2 0 2 3 3 n= 1,020 208 329 316 159
Note: A (á) or (â) sign indicates that data for that segment is statistically significantly higher or lower than the total response for all adults. Differences are statistically significant at the 95% confidence level or higher
The State of the Bible 2012
_____________________________________________________________________________________________ American Bible Society | Barna Group | The State of the Bible 2012 page 28
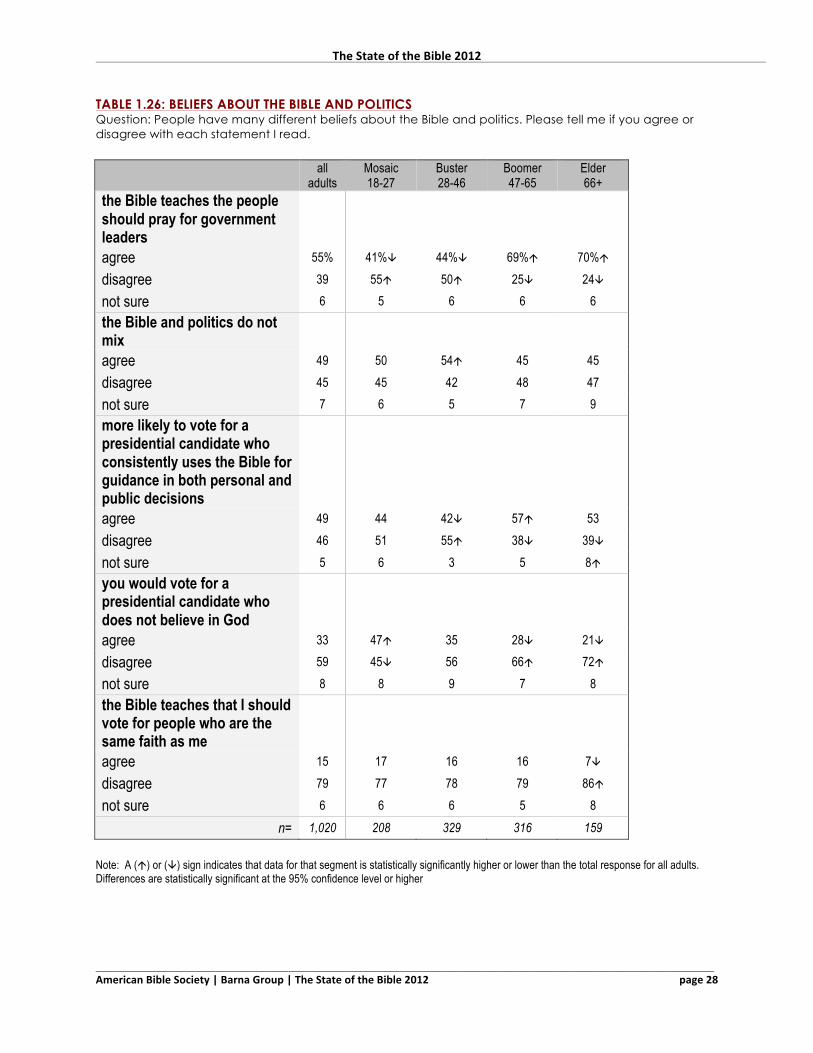
TABLE 1.26: BELIEFS ABOUT THE BIBLE AND POLITICS Question: People have many different beliefs about the Bible and politics. Please tell me if you agree or disagree with each statement I read.
all
adults Mosaic 18-27
Buster 28-46
Boomer 47-65
Elder 66+
the Bible teaches the people should pray for government leaders
agree 55% 41%â 44%â 69%á 70%á
disagree 39 55á 50á 25â 24â
not sure 6 5 6 6 6 the Bible and politics do not mix
agree 49 50 54á 45 45
disagree 45 45 42 48 47
not sure 7 6 5 7 9 more likely to vote for a presidential candidate who consistently uses the Bible for guidance in both personal and public decisions
agree 49 44 42â 57á 53
disagree 46 51 55á 38â 39â
not sure 5 6 3 5 8á you would vote for a presidential candidate who does not believe in God
agree 33 47á 35 28â 21â
disagree 59 45â 56 66á 72á
not sure 8 8 9 7 8 the Bible teaches that I should vote for people who are the same faith as me
agree 15 17 16 16 7â
disagree 79 77 78 79 86á
not sure 6 6 6 5 8
n= 1,020 208 329 316 159 Note: A (á) or (â) sign indicates that data for that segment is statistically significantly higher or lower than the total response for all adults. Differences are statistically significant at the 95% confidence level or higher
The State of the Bible 2012
_____________________________________________________________________________________________ American Bible Society | Barna Group | The State of the Bible 2012 page 29
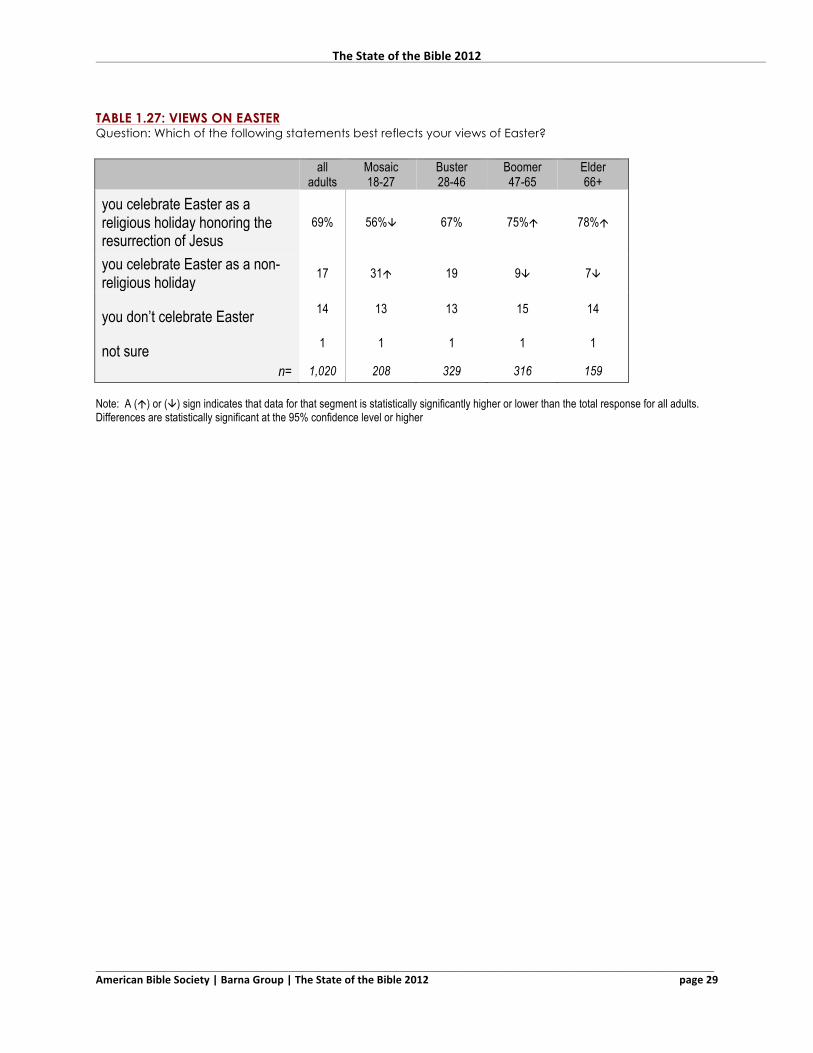
TABLE 1.27: VIEWS ON EASTER Question: Which of the following statements best reflects your views of Easter?
all
adults Mosaic 18-27
Buster 28-46
Boomer 47-65
Elder 66+
you celebrate Easter as a religious holiday honoring the resurrection of Jesus
69% 56%â 67% 75%á 78%á
you celebrate Easter as a non-religious holiday 17 31á 19 9â 7â
you don’t celebrate Easter 14 13 13 15 14
not sure 1 1 1 1 1
n= 1,020 208 329 316 159 Note: A (á) or (â) sign indicates that data for that segment is statistically significantly higher or lower than the total response for all adults. Differences are statistically significant at the 95% confidence level or higher
The State of the Bible 2012
_____________________________________________________________________________________________ American Bible Society | Barna Group | The State of the Bible 2012 page 30
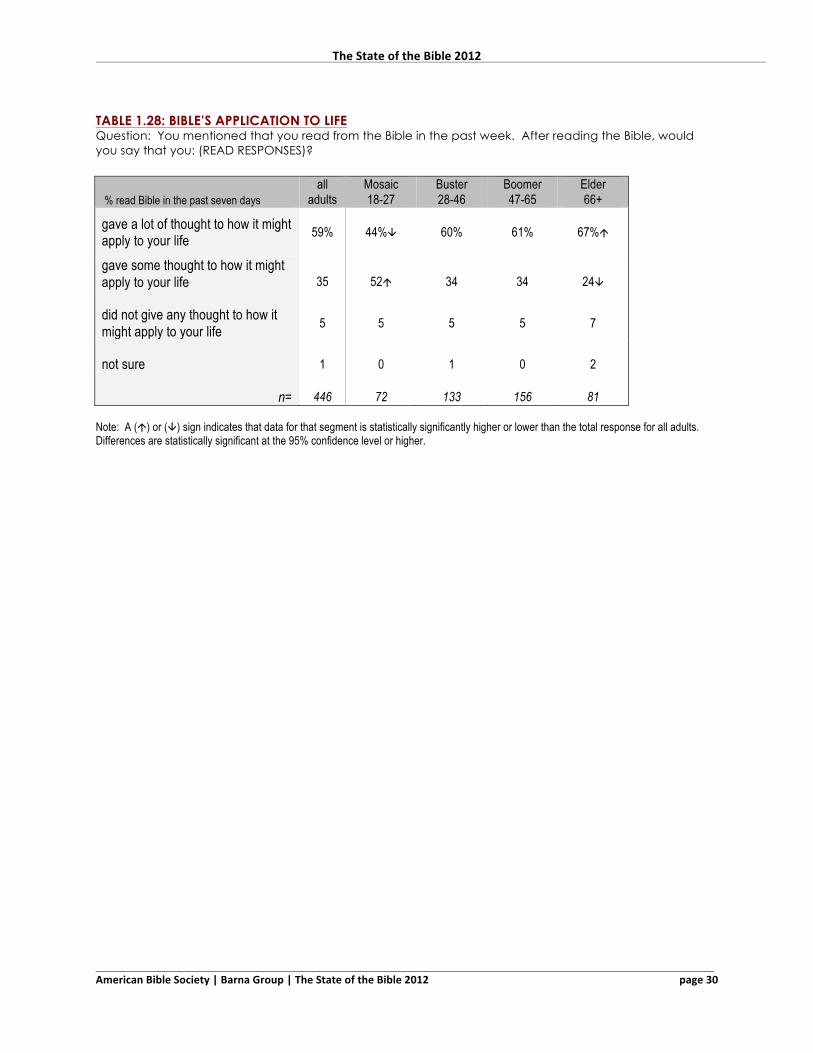
TABLE 1.28: BIBLE’S APPLICATION TO LIFE Question: You mentioned that you read from the Bible in the past week. After reading the Bible, would you say that you: (READ RESPONSES)?
% read Bible in the past seven days all
adults Mosaic 18-27
Buster 28-46
Boomer 47-65
Elder 66+
gave a lot of thought to how it might apply to your life 59% 44%â 60% 61% 67%á
gave some thought to how it might apply to your life 35 52á 34 34 24â
did not give any thought to how it might apply to your life 5 5 5 5 7
not sure 1 0 1 0 2
n= 446 72 133 156 81 Note: A (á) or (â) sign indicates that data for that segment is statistically significantly higher or lower than the total response for all adults. Differences are statistically significant at the 95% confidence level or higher.
The State of the Bible 2012
_____________________________________________________________________________________________ American Bible Society | Barna Group | The State of the Bible 2012 page 31
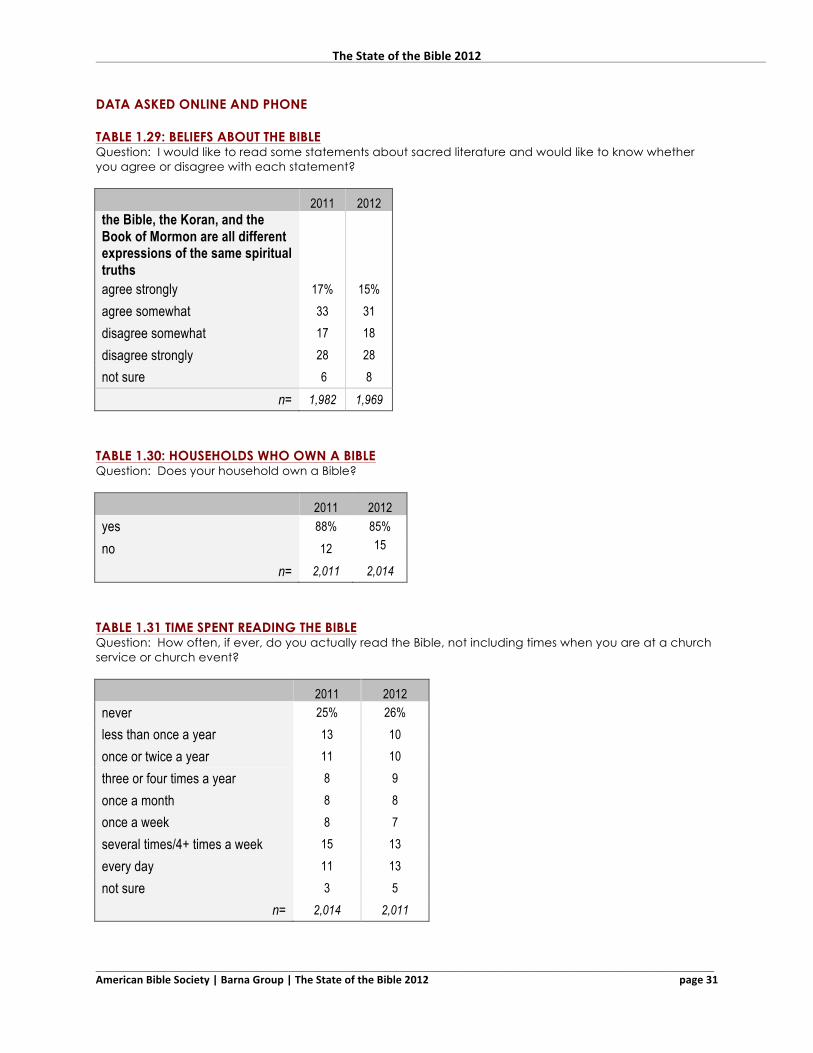
DATA ASKED ONLINE AND PHONE TABLE 1.29: BELIEFS ABOUT THE BIBLE Question: I would like to read some statements about sacred literature and would like to know whether you agree or disagree with each statement?
2011 2012 the Bible, the Koran, and the Book of Mormon are all different expressions of the same spiritual truths
agree strongly 17% 15% agree somewhat 33 31 disagree somewhat 17 18 disagree strongly 28 28 not sure 6 8
n= 1,982 1,969
TABLE 1.30: HOUSEHOLDS WHO OWN A BIBLE Question: Does your household own a Bible?
2011 2012 yes 88% 85% no 12 15
n= 2,011 2,014
TABLE 1.31 TIME SPENT READING THE BIBLE Question: How often, if ever, do you actually read the Bible, not including times when you are at a church service or church event?
2011 2012 never 25% 26% less than once a year 13 10 once or twice a year 11 10 three or four times a year 8 9 once a month 8 8 once a week 8 7 several times/4+ times a week 15 13 every day 11 13 not sure 3 5
n= 2,014 2,011
The State of the Bible 2012
_____________________________________________________________________________________________ American Bible Society | Barna Group | The State of the Bible 2012 page 32
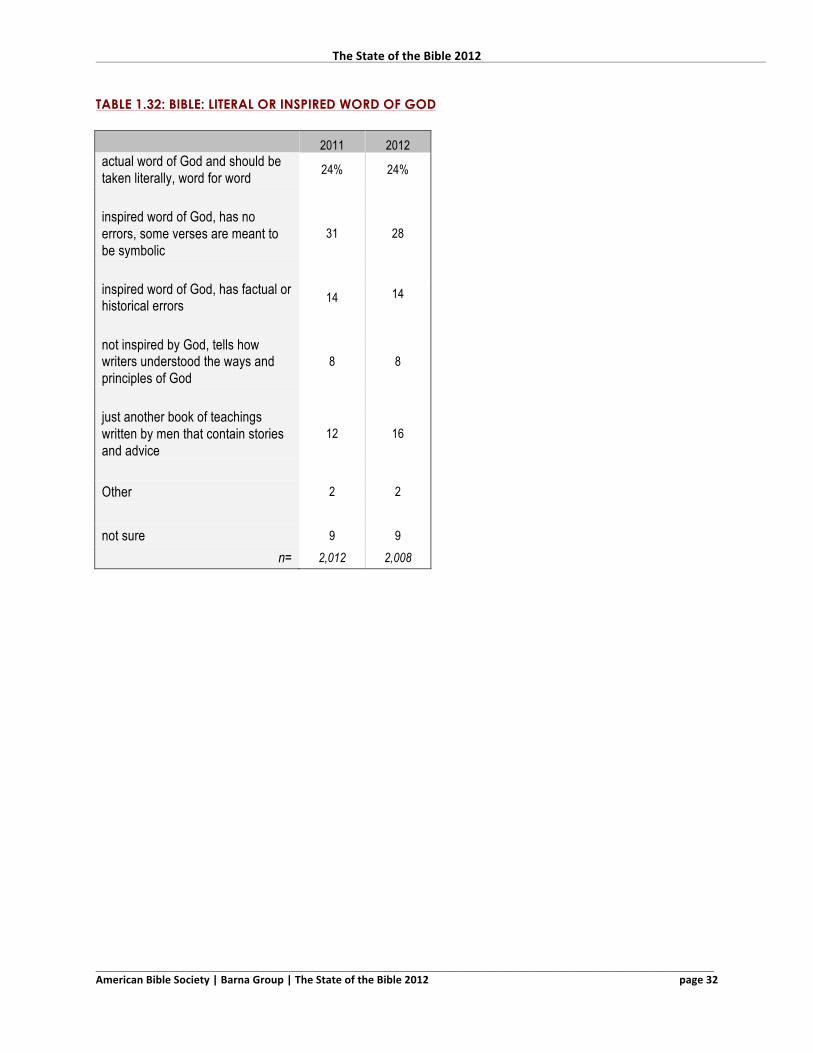
TABLE 1.32: BIBLE: LITERAL OR INSPIRED WORD OF GOD 2011 2012 actual word of God and should be taken literally, word for word 24% 24%
inspired word of God, has no errors, some verses are meant to be symbolic
31 28
inspired word of God, has factual or historical errors 14 14
not inspired by God, tells how writers understood the ways and principles of God
8 8
just another book of teachings written by men that contain stories and advice
12 16
Other 2 2
not sure 9 9
n= 2,012 2,008
![American Bible Society · American Bible Society | State of the Bible, 2018 Page 6 of 54 Data Analysis 1. Bible Perceptions Bible Engagement Profile [Table 1.1, pages 32-33] Bible](https://img.pdfslide.net/doc/110x75/5e846930e73f3d404c4289c7/american-bible-society-american-bible-society-state-of-the-bible-2018-page-6.jpg)