Embed Size (px)
Citation preview

Slide 1
5,05
4,10
3,50
4,72
11,82 11,82
American Diabetes Association 77th Scientific Sessions
Investor and analyst event
San Diego, 12 June 2017
Manato Ohara, diagnosed with type 1 diabetes Kanagawa, Japan

Slide 2
5,05
4,10
3,50
4,72
11,82 11,82
Agenda
ADA 2017 investor and analyst event
1 Victoza® - LEADER - Alan Moses, SVP and Chief Medical Officer
2 Tresiba® - DEVOTE - Mads Krogsgaard Thomsen, EVP and Chief Science Officer
3 Injectable semaglutide - Peter Kurtzhals, SVP Global Research
4 Oral semaglutide - Peter Kurtzhals, SVP Global Research
5 Xultophy® 100/3.6 - DUAL VII - Robin Evers, SVP, Medical Affairs, Regulatory Affairs & Safety
AGENDA MASTER SLIDE. Changes will be carried to all agenda divider slides when updated with Slidesright. The highlighter for divider slides is inserted below; changes to its design are applied to all divider slides (don't delete!)
How to use first time: 1. Edit agenda item text to suit 2. Copy item to add agenda point 3. Delete item to remove agenda point 4. Move item up or down to change agenda order 5a. Use toolbar Agenda>Update agendas to finalise 5b. Agenda divider slides will be added to presentation 6. Move divider slides to desired place in presentation (divider slide order in presentation is irrelevant, will be updated to reflect relative position) 7. Update agendas again 8. Agendas will be updated to reflect their relative position. How to change agenda throughout presentation: 1a. Change agenda master when needed, as described above 1b. Rearrange agenda dividers when needed, as described above 2. Use toolbar Agenda>Update agendas to update all agenda slides throughout presentation to reflect changes.
6 Discussion and Q&A

Slide 3
5,05
4,10
3,50
4,72
11,82 11,82
ADA 2017 investor and analyst event
Alan Moses SVP and Chief Medical Officer
Victoza® - LEADER

Slide 4
5,05
4,10
3,50
4,72
11,82 11,82
LEADER trial design Regulatory status
LEADER data were submitted to regulatory authorities in Q4 2016 to obtain a cardiovascular indication for Victoza®
ADA 2017 investor and analyst event
Standard of care + placebo (daily blinded injection)
Standard of care + Victoza®
(0.6-1.8 mg once daily)
0 3.5-5.0 years
9,340 patients with type 2 diabetes
Key inclusion criteria • Adults above 50 years with type 2 diabetes and
established cardiovascular disease, or above 60 years with multiple cardiovascular risk factors
• HbA1c 7.0%
CV: cardiovascular Source: Marso et al. Am Heart J 2013;166:823–30; Marso et al. N Engl J Med 2016;375:311–22.
• LEADER data were submitted to regulatory authorities in the EU and the US in order to obtain a cardiovascular indication for Victoza®
• In the US, the FDA has scheduled an Advisory Committee meeting on 20 June 2017 to discuss the proposed cardiovascular indication for Victoza®
• EU and US regulatory feedback is expected in Q3 2017

Slide 5
5,05
4,10
3,50
4,72
11,82 11,82
Victoza achieved superiority for reducing MACE and also reduced all-cause mortality in the LEADER trial
1Inclusion criteria: Adults above 50 years with type 2 diabetes and established CV disease, above 60 years with multiple CV factors, HbA1C ≥ 7.0% MACE: major adverse cardiovascular events; 3-point MACE comprises cardiovascular death, non-fatal myocardial infarction and non-fatal stroke; CI: confidence interval Source: Marso SP, Daniels GH, Brown-Frandsen K, et al. Liraglutide and cardiovascular outcomes in type 2 diabetes. The New England journal of medicine. Symposium 3-CT-SY24, ADA 2016
ADA 2017 investor and analyst event
13% reduction in 3-point MACE with Victoza® compared to placebo
Patients1 with an event (%)
Months
Hazard ratio = 0.87 95% CI (0.78;0.97)
P=0.01
Victoza® Placebo Victoza® Placebo
Months
0
5
10
15
20
0 6 12 18 24 30 36 42 48 54
15% reduction in all-cause death with Victoza® compared to placebo
CI: confidence interval Source: Marso SP, Daniels GH, Brown-Frandsen K, et al. Liraglutide and cardiovascular outcomes in type 2 diabetes. The New England journal of medicine. Symposium 3-CT-SY24, ADA 2016
Patients with an event (%)
0
5
10
15
20
0 6 12 18 24 30 36 42 48 54
Hazard ratio = 0.85 95% CI (0.74;0.97)
P=0.02

Slide 6
5,05
4,10
3,50
4,72
11,82 11,82
0
10
20
30
40
50
60
70
0 6 12 18 24 30 36 42 48 54
Victoza® reduced the number of CV deaths and severe hypoglycaemia events in LEADER
1Inclusion criteria: Adults above 50 years with type 2 diabetes and established CV disease, above 60 years with multiple CV factors, HbA1C ≥ 7.0% CV death: cardiovascular death; CI: confidence interval Source: Marso et al. N Engl J Med 2016;375:311–22
ADA 2017 investor and analyst event
22% reduction in CV death with Victoza® compared to placebo
Patients1 with an event (%)
Months
Victoza® Placebo
31% reduction in severe hypoglycaemia with Victoza® compared to placebo
ERR=0.69 95% CI (0.51;0.91)
P=0.01
Mean episodes per 1000 patients
Victoza® Placebo
0
10
20
30
40
50
60
70
0 6 12 18 24 30 36 42 48 54
ERR: estimated rate ratio; CI: confidence interval Source: Presented at the American Diabetes Association 77th Scientific Sessions, 359-OR, June 12 2017, San Diego, CA, USA
Months
Hazard ratio = 0.78 95% CI (0.66;0.93)
P=0.01
Mean episodes per 1,000 patients
0
2
4
6
8
10
0 6 12 18 24 30 36 42 48 54

Slide 7
5,05
4,10
3,50
4,72
11,82 11,82
Risk of CV death was 3.7 times higher for patients with a severe hypoglycaemic episode
Association between severe hypoglycaemia and CV death
Patients who experienced a severe hypoglycemic episode were at higher risk of CV death in the LEADER trial
ADA 2017 investor and analyst event
• LEADER showed that patients experiencing severe hypoglyceamia were at greater risk of MACE particularly within the first week following a severe hypoglycaemic episode
• Reduced severe hypoglycaemia in LEADER contributes to, but cannot explain, the beneficial CV outcomes which are hypothesized to be related to an anti-atherosclerotic effect
• Reducing severe hypoglycemia remains a cornerstone of diabetes management
CV death: cardiovascular death; CI: confidence interval; HR: hazard ratio Source: Presented at the American Diabetes Association 77th Scientific Sessions, 359-OR, June 12 2017, San Diego, CA, USA
HR P-value
Risk of CV death after severe hypoglycaemia for all events
3.7 <0.0001
Time after event
7 days 9.6 <0.05
14 days 9.5 <0.05
30 days 12.6 <0.0001
180 days 7.0 <0.0001
365 days 2.6 <0.0001
Hazard ratio
Increased risk of CV death following a severe hypoglycaemic episode
0.5 1 2 4 8 16

Slide 8
5,05
4,10
3,50
4,72
11,82 11,82
ADA 2017 investor and analyst event
Mads Krogsgaard Thomsen
EVP and Chief Science Officer
Tresiba® - DEVOTE

Slide 9
5,05
4,10
3,50
4,72
11,82 11,82
Inclusion criteria
• Adults above 50 years with type 2 diabetes and established cardiovascular disease, or above 60 years with multiple cardiovascular risk factors.
DEVOTE trial design Baseline characteristics
The DEVOTE trial was designed to investigate the CV profile of Tresiba® compared to insulin glargine U100
ADA 2017 investor and analyst event
Insulin glargine U100 once daily (blinded vial) + standard of care
Tresiba® once daily (blinded vial) + standard of care
0
7,637 patients
with type 2 diabetes
Trial objective
• To investigate the cardiovascular safety of Tresiba®
CV: cardiovascular; IGlar U100: insulin glargine U100; CKD: chronic kidney disease * The trial was designed to conclude after at least 633 events and a total of 681 events were accrued Source: Presented at the American Diabetes Association 77th Scientific Sessions, Session 3-CT-SY22, June 12 2017, San Diego, CA, USA
Event driven trial*
Tresiba® IGlar U100
Number of patients 3,818 3,819
Sex, Male 62.8% 62.4%
Mean HbA1c 8.4% 8.4%
Mean diabetes duration (years)
16.6 16.2
Mean BMI (kg/m2) 33.6 33.6
Established CV or CKD and age ≥50 years
85.5% 84.9%
With CV risk factors and age ≥60 years
14.1% 14.8%

Slide 10
5,05
4,10
3,50
4,72
11,82 11,82
0
2
4
6
8
10
12
0 5 10 15 20 25 30
The cardiovascular safety of Tresiba® was documented in the cardiovascular outcomes trial DEVOTE
ADA 2017 investor and analyst event
Non-inferiority of Tresiba® vs insulin glargine U100 was confirmed for time to first MACE
1Inclusion criteria: patients with a history of cardiovascular or chronic kidney disease and aged ≥50 or patients with cardiovascular or chronic kidney disease risk factors and aged ≥60 CI: confidence interval; IGlar U100: insulin glargine U100 Source: Presented at the American Diabetes Association 77th Scientific Sessions, Session 3-CT-SY22, June 12 2017, San Diego, CA, USA
The hazard ratio was below 1.0 in favour of Tresiba® in the DEVOTE trial
Patients with an event (%)
Months
Tresiba® IGlar U100 • DEVOTE demonstrated a 9% reduction in MACE with Tresiba® relative to insulin glargine U100, with no statistically significant difference between the two treatments
• Tresiba® demonstrated a safe and well-tolerated profile consistent with previous clinical studies conducted with Tresiba®
• DEVOTE data have been submitted to regulatory authorities in the US. Regulatory feedback is expected in H1 2018
Hazard ratio = 0.91 95% CI (0.78;1.06)
P<0.001 for non-inferiority

Slide 11
5,05
4,10
3,50
4,72
11,82 11,82
0
2
4
6
8
0 5 10 15 20 25 30
0
2
4
6
8
0 5 10 15 20 25 30
0
2
4
6
8
0 5 10 15 20 25 30
The hazard ratio was below 1.0 across the individual components of 3-point MACE in the DEVOTE trial
ADA 2017 investor and analyst event
Non-fatal stroke Cardiovascular death Non-fatal
myocardial infarction
Months Months Months
Patients with an event (%)
HR = 0.96 95% CI (0.76; 1.21)
P=0.71
Tresiba® IGlar U100
HR = 0.85 95% CI (0.68;1.06)
P=0.15
HR = 0.90 95% CI (0.65;1.23)
P=0.50
HR: hazard ratio; CI: confidence interval;MACE: major adverse cardiovascular events; 3-point MACE comprises cardiovascular death, non-fatal myocardial infarction and non-fatal stroke; IGlar U100: insulin glargine U100 Source: Presented at the American Diabetes Association 77th Scientific Sessions, 3-CT-SY22, June 12 2017, San Diego, CA, USA
Patients with an event (%)
Patients with an event (%)

Slide 12
5,05
4,10
3,50
4,72
11,82 11,82
0
2
4
6
8
10
12
14
0 5 10 15 20 25 30
Numerical reduction in 4-point MACE in favour of Tresiba® compared to IGlar U100
Numerical reduction in all-cause death in favour of Tresiba® compared to IGlar U100
The hazard ratio was below 1.0 for 4-point MACE and all-cause death in favour of Tresiba® in the DEVOTE trial
HR: hazard ratio; MACE: major adverse cardiovascular events; 4-point MACE comprises cardiovascular death, non-fatal myocardial infarction, non-fatal stroke and unstable angina pectoris requiring hospitalization; CI: confidence interval; IGlar U100: insulin glargine U100 Source: Presented at the American Diabetes Association 77th Scientific Sessions, 3-CT-SY22, June 12 2017, San Diego, CA, USA
ADA 2017 investor and analyst event
Months Months
HR = 0.92 95% CI (0.80;1.05)
P=0.22
HR = 0.91 95% CI (0.76;1.11)
P=0.35
Patients with an event (%)
Tresiba® IGlar U100 Patients with an event (%)
Tresiba® IGlar U100
0
2
4
6
8
10
12
14
0 5 10 15 20 25 30

Slide 13
5,05
4,10
3,50
4,72
11,82 11,82
6.5
7.0
7.5
8.0
8.5
9.0
0 3 6 9 12 15 18 21 24 27 30
0
2
4
6
8
10
Similar mean HbA1c levels sustained throughout the DEVOTE trial
27% fewer patients in the Tresiba® treated group had a severe hypoglycaemic episode
At similar HbA1c levels, fewer patients on Tresiba® vs IGlar U100 had a severe hypoglycaemia episode in DEVOTE trial
Note: No visits between 12-24 months and no visits between 24-end of trial; ET: end of trial Source: Presented at the American Diabetes Association 77th Scientific Sessions, Session 3-CT-SY22, June 12 2017, San Diego, CA, USA
ADA 2017 investor and analyst event
Months
OR = 0.73 95% CI (0.60;0.89)
P<0.001 for superiority
HbA1c (%)
Tresiba® IGlar U100
Tresiba® IGlar U100 Proportion (%) of patients with at least one severe hypoglycaemic episode
0.0 ET
CI: confidence interval; IGlar U100: insulin glargine U100, OR: odds ratio Source: Presented at the American Diabetes Association 77th Scientific Sessions, Session 3-CT-SY22, June 12 2017, San Diego, CA, USA
4.9%
6.6%

Slide 14
5,05
4,10
3,50
4,72
11,82 11,82
0.00
0.05
0.10
0.15
0 5 10 15 20 25 30
0.00
0.05
0.10
0.15
0 5 10 15 20 25 30
40% reduction in severe hypoglycaemia with Tresiba® versus IGlar U100
53% reduction in nocturnal severe hypoglycaemia with Tresiba® versus IGlar U100
Tresiba statistically significantly reduced the risk of severe hypoglycaemia compared to IGlar U100 in DEVOTE
ERR: estimated rate ratio; CI: confidence interval; IGlar U100: insulin glargine U100 Source: Presented at the American Diabetes Association 77th Scientific Sessions, Session 3-CT-SY22, June 12 2017, San Diego, CA, USA
ADA 2017 investor and analyst event
Months Months
ERR = 0.60 95% CI (0.48;0.76)
P<0.001
ERR = 0.47 95% CI (0.31;0.73)
P<0.001
Mean episodes per patient
Tresiba® IGlar U100 Mean episodes per patient
Tresiba® IGlar U100
0.00

Slide 15
5,05
4,10
3,50
4,72
11,82 11,82
Hypoglycaemia event
Patients Study Hazard ratio
[95% CI]
Nocturnal confirmed
T1D
BEGIN 0.75 [0.60; 0.94]*
0.83 [0.69; 1.00]
SWITCH 1 0.64 [0.56; 0.73]*
0.75 [0.68; 0.83]*
T2D
BEGIN 0.62 [0.49; 0.78]*
0.68 [0.57; 0.82]*
SWITCH 2 0.58 [0.46; 0.74]*
0.75 [0.64; 0.89]*
Severe
T1D
BEGIN 1.12 [0.68; 1.86]
SWITCH 1 0.65 [0.48; 0.89]*
0.74 [0.61; 0.90]*
0.81 [0.42; 1.56]
T2D
SWITCH 2 0.54 [0.21; 1.42]
DEVOTE 0.49 [0.26; 0.94]*
0.60 [0.48; 0.76]*
0.0078125 0.015625 0.03125 0.0625 0.125 0.25 0.5 1 2 40.0078125 0.015625 0.03125 0.0625 0.125 0.25 0.5 1 2 4
0.00781250.015625 0.03125 0.0625 0.125 0.25 0.5 1 2 40.0078125 0.015625 0.03125 0.0625 0.125 0.25 0.5 1 2 4
0.00781250.015625 0.03125 0.0625 0.125 0.25 0.5 1 2 4
0.00781250.015625 0.03125 0.0625 0.125 0.25 0.5 1 2 4
0.0078125 0.015625 0.03125 0.0625 0.125 0.25 0.5 1 2 4
0.0078125 0.015625 0.03125 0.0625 0.125 0.25 0.5 1 2 40.00781250.015625 0.03125 0.0625 0.125 0.25 0.5 1 2 4
0.00781250.015625 0.03125 0.0625 0.125 0.25 0.5 1 2 4
Tresiba® hypoglycaemia results are consistent across BEGIN, SWITCH and DEVOTE trials
Favors insulin degludec
Hazard ratio [95% CI] 2 1 0.5 0.25 0.125
Favours insulin degludec
*Significant difference; †6 month data. BEGIN: nocturnal=00.01–05:59; severe=third-party assistance; SWITCH: nocturnal=severe or BG (<3.1 mmol/L) confirmed with symptoms between 00.01–05:59; severe=third-party assistance and adjudicated; DEVOTE: severe=third-party assistance and adjudicated; nocturnal severe=severe and adjudicated between 00.01–05:59. Source: Ratner et al. Diabetes Obes Metab 2013;15:175–84; Lane et al. Diabetologia 2016;59(Suppl.1):S42; Wysham et al. Diabetologia 2016;59(Suppl.1):S43; Novo Nordisk CA, 29 November 2016.
T2D
T1D
SWITCH 2
DEVOTE
0.0078125 0.015625 0.03125 0.0625 0.125 0.25 0.5 1 2 4
2 1 0.5 0.25 0.125
*Statistically significant difference; Phase 3a BEGIN: nocturnal=00.01–05:59; severe=third-party assistance; Phase 3b SWITCH: nocturnal=severe or BG (<3.1 mmol/L) confirmed with symptoms between 00.01–05:59; severe=third-party assistance and adjudicated; Phase 3b DEVOTE: severe=third-party assistance and adjudicated; nocturnal severe=severe and adjudicated between 00.01–05:59. Source: Ratner et al. Diabetes Obes Metab 2013;15:175–84; Lane et al. Diabetologia 2016;59(Suppl.1):S42; Wysham et al. Diabetologia 2016;59(Suppl.1):S43; Novo Nordisk CA, 29 November 2016.
Favours Tresiba®
Maintenance period
Full treatment period
T1D
T2D
BEGIN
DEVOTE
SWITCH 2

Slide 16
5,05
4,10
3,50
4,72
11,82 11,82
ADA 2017 investor and analyst event
KurtzhalPeter Kurtzhals
PeterSVP Global Research
Injectable semaglutide

Slide 17
5,05
4,10
3,50
4,72
11,82 11,82
-1.6 -1.6 -1.5
-1.6
-1.8
-1.4 -1.5
-1.3
-0.9
-1.2
-1.4
-1.1
-0.5
-0.8
-0.4
-2.0
-1.6
-1.2
-0.8
-0.4
0.00.0
-0.1
Semaglutide demonstrated a statistically significant reduction in HbA1c vs comparators in the phase 3a trials
Comparison of HbA1c lowering effect in phase 3a SUSTAIN trials
* p < 0.001; QD: once-daily; QW: once-weekly; sema: semaglutide ** SUSTAIN 1: semaglutide once-weekly versus placebo in drug-naïve subjects with type 2 diabetes; SUSTAIN 5: semaglutide once-weekly versus placebo in subjects with type 2 diabetes added on to insulin; SUSTAIN 6: semaglutide once-weekly versus placebo, added-on to their standard-of-care treatment Source: SUSTAIN 1-5: Ahmann, et al, et al. Presented at the 77th Annual Scientific Sessions of the American Diabetes Association, San Diego, USA. Poster 1080-P; SUSTAIN 6 HbA1c: Marso SP, et al. N Engl J Med 2016;375:1834–44
Baseline SUSTAIN 1
8.1% SUSTAIN 3
8.3% SUSTAIN 4
8.2% SUSTAIN 2
8.1%
Ch
an
ge i
n H
bA
1c (
%)
*
SUSTAIN 5 8.4%
ADA 2017 investor and analyst event
Sema 1 mg Sema 0.5 mg Exenatide QW Insulin glargine QD Sitagliptin 100 mg Placebo**
SUSTAIN 6 8.7%
*
* *
*
*
* *
*
* *
*

Slide 18
5,05
4,10
3,50
4,72
11,82 11,82
Semaglutide demonstrated a statistically significant reduction in weight vs comparators the the phase 3a trials
Comparison of weight reductions in phase 3a SUSTAIN trials
-4.5
-6.1 -5.6
-5.2
-6.4
-4.9
-3.7 -4.3
-1.9
-3.5 -3.7 -3.6
-1.0
-1.9
1.2
-1.4 -0.7
-7.0
-6.0
-5.0
-4.0
-3.0
-2.0
-1.0
0.0
1.0
Baseline SUSTAIN 1
92kg SUSTAIN 3
96kg SUSTAIN 4
93kg SUSTAIN 2
89kg
Ch
an
ge i
n w
eig
ht
(kg
)
-6.1
*
SUSTAIN 5 92kg
ADA 2017 investor and analyst event
Sema 1 mg Sema 0.5 mg Exenatide QW Insulin glargine QD Sitagliptin 100 mg Placebo**
SUSTAIN 6 92kg
* *
*
*
*
*
*
*
*
*
*
* p < 0.001; QD: once-daily; QW: once-weekly; sema: semaglutide ** SUSTAIN 1: semaglutide once-weekly versus placebo in drug-naïve subjects with type 2 diabetes; SUSTAIN 5: semaglutide once-weekly versus placebo in subjects with type 2 diabetes added on to insulin; SUSTAIN 6: semaglutide once-weekly versus placebo, added-on to their standard-of-care treatment Source: SUSTAIN 1-5: Lingvay, et al. Presented at the 77th Annual Scientific Sessions of the American Diabetes Association, San Diego, USA. Oral presentation 243-OR; SUSTAIN 6: Vilsbøll, et al. Presented at the 77th Annual Scientific Sessions of the American Diabetes Association, San Diego, USA. Poster 1125-P

Slide 19
5,05
4,10
3,50
4,72
11,82 11,82
38
54
43 41
56
30 35
13
25 30
4 9 2
5
0
10
20
30
40
50
60
SUSTAIN 2
8.1%
89kg
25-56% of patients on semaglutide achieved ≥1% HbA1c reduction and weight loss ≥5% in the SUSTAIN 1–5 trials
Patients achieving HbA1c reduction ≥1% and weight loss ≥5% across SUSTAIN 1–5 clinical trials
*p<0.001 vs comparator; †p<0.001 vs semaglutide 0.5 mg ; QD: once-daily; QW: once-weekly; sema: semaglutide * * SUSTAIN 1: semaglutide once-weekly versus placebo in drug-naïve subjects with type 2 diabetes; SUSTAIN 5: semaglutide once-weekly versus placebo in subjects with type 2 diabetes added on to insulin Source: Presented at the American Diabetes Association 77th Scientific Sessions, Poster 1124-P, June 12 2017, San Diego, CA, USA
SUSTAIN 1
8.1%
92kg
SUSTAIN 3
8.3%
96kg
SUSTAIN 4
8.2%
93kg
Proportion of patients (%)
SUSTAIN 5
8.4%
92kg
ADA 2017 investor and analyst event
Sema 1 mg Sema 0.5 mg Exenatide QW Insulin glargine QD Sitagliptin 100 mg Placebo**
Baseline
*
* *
*†
* *†
*†
*
*
HbA1c
Weight

Slide 20
5,05
4,10
3,50
4,72
11,82 11,82
0
5
10
15
0 8 16 24 32 40 48 56 64 72 80 88 96 104
Semaglutide produces a positive effect on atherosclerosis in mouse models which may have a positive impact on MACE
ADA 2017 investor and analyst event
Semaglutide demonstrated a 26% reduction in MACE compared to placebo
Note: pooled data reported for both semaglutide and placebo MACE: Major adverse cardiovascular event; Confidence interval * No adjustment for multiple tests Source: Marso SP, Bain SC, Consoli A, et al. Semaglutide and Cardiovascular Outcomes in Patients with Type 2 Diabetes. The New England journal of medicine. 2016
In mouse models of atherosclerosis, lower levels of plaque is observed with semaglutide
Patients with an event (%)
Weeks
Hazard ratio = 0.74 (95% CI: 0.58;0.95)
P=0.02 for superiority*
semaglutide placebo
0
4
8
12
16
1 2 3 4
Note: Semaglutide in LDL Receptor Knock-Out Mice Comparator: Vehicle, WD mice Source: Presented at the American Diabetes Association 77th Scientific Sessions, 244-OR, June 12 2017, San Diego, CA, USA
Plaque area (%)
Comparator Sema 4µg/kg
Sema 12µg/kg
Sema 60µg/kg
Slide 21
5,05
4,10
3,50
4,72
11,82 11,82
6
7
8
9
10
11
0 8 16 24 32 40 48 56 64 72 80 88 96 104
6
7
8
9
10
11
0
0 8 16 24 32 40 48 56 64 72 80 88 96 104
In SUSTAIN 6 patients with diabetic retinopathy events had HbA1C reductions of up to 2.5%-points after 16 weeks
ADA 2017 investor and analyst event
Change in HbA1c (%) in overall population (N=3.297)
Change in HbA1c (%) in patients with diabetic retinopathy event (N=79)
HbA1c (%) Sema 1.0 mg Placebo 1.0 mg
Sema 0.5 mg Placebo 0.5 mg HbA1c (%) Sema 1.0 mg Placebo 1.0 mg
Sema 0.5 mg Placebo 0.5 mg
Sema: semaglutide Source: Presented at the American Diabetes Association 77th Scientific Sessions, Session Update on Cardiovascular Outcomes Trials (CVOTs); Cardiovascular Outcomes with Semaglutide in Subjects with Type 2 Diabetes Mellitus (SUSTAIN 6) – Tina Vilsbøll, June 9 2017, San Diego, CA, USA
0
Weeks Weeks

Slide 22
5,05
4,10
3,50
4,72
11,82 11,82
ADA 2017 investor and analyst event
KurtzhalPeter Kurtzhals
PeterSVP Global Research
Oral semaglutide

Slide 23
5,05
4,10
3,50
4,72
11,82 11,82
5.5
6.0
6.5
7.0
7.5
8.0
0 2 4 6 8 10 12 14 16 18 20 22 24 26
-8.0
-6.0
-4.0
-2.0
0.0
0 2 4 6 8 10 12 14 16 18 20 22 24 26
HbA1c reduction from a mean baseline of 7.9% Weight loss from a mean base line of 92 kg
Oral semaglutide demonstrated clinically relevant reductions in HbA1c and body weight in the phase 2 trial
Inclusion criteria: Type 2 diabetes; 7.0% ≤ HbA1c ≤ 9.5%; treatment with diet and exercise with or without metformin; sc: subcutaneous; sema: semaglutide
ADA 2017 investor and analyst event
Placebo Sema 2.5 mg Sema 5 mg Sema 10 mg Sema 20 mg Sema 1 mg sc Sema 40 mg
HbA1c (%) Weight loss (kg)
0.0
Weeks Weeks

Slide 24
5,05
4,10
3,50
4,72
11,82 11,82
A post-dose fasting period of ≥ 30 min results in clinically relevant semaglutide exposure
Proportion of patients achieving HbA1c levels below 7% in the phase 2 trial
With a post-dose fasting period ≥30 min oral semaglutide demonstrated relevant dose-response rates in phase 2
ADA 2017 investor and analyst event
0
200
400
600
800
1000
15 min 30 min 60 min 120 min
AUC0-24h, Day 10
(nmol·h/L)
Note: Patients were exposed to semaglutide in combination with different water volume with dosing (50/120 mL) and duration of post-dose fasting (15/30/60/120 min) to evaluate dosing conditions. Semaglutide exposure (AUC0-24h,Day 10) was unaffected by water volume (p=0.54) AUC: Area under curve; ETR: Estimated Treatment Ratio, *p < 0.001; **p = 0.190; ***p = 0.002 Source: Presented at the American Diabetes Association 77th Scientific Sessions, Poster 1201-P, June 11 2017, San Diego, CA, USA
ETR: 1.98*
(95% CI: 1.43;2.75)
ETR: 1.25**
(95% CI: 0.90;1.73)
ETR: 1.68***
(95% CI: 1.20;2.34)
28
44
81 84 86 88 93
0
20
40
60
80
100
Placebo2.5 mg 5 mg 10 mg 20 mg 40 mg 1 mg sc
Proportion of patients (%)
SC: subcutaneous Note: oral semaglutide doses are: 2.5 mg, 5 mg, 10 mg, 20 mg, 40 mg; 1 mg sc: 1 mg semaglutide with subcutaneous injections; Oral semaglutide dosed fasting in the morning with maximum 120 mL water and 30 minutes post-dose fasting. Source: ENDO 2016; Boston, Massachusetts; April 2, 2016, session OR15-3

Slide 25
5,05
4,10
3,50
4,72
11,82 11,82
Ten phase 3a trials ongoing with oral semaglutide; first trial results expected in Q1 2018
ADA 2017 investor and analyst event
Note: Preliminary estimated timing of trials from first patient first visit (FPFV) to last patient last visit (LPLV), n = approximate number of randomised people; MACE: Major Cardiovascular Events; OAD: oral anti-diabetic
2016 2017 2018
PIONEER 1: monotherapy 26 weeks, n=704
PIONEER 2: vs empagliflozin 52 weeks, n=816
PIONEER 3: vs sitagliptin 78 weeks, n=1,860
PIONEER 4: vs liraglutide 52 weeks, n=690
PIONEER 5: moderate renal impairment 26 weeks, n=324
PIONEER 6: cardiovascular outcomes Event driven (>122 MACE), n=3,176
PIONEER 7: flexible dose escalation 52 weeks, n=500
PIONEER 8: insulin add-on 26+26 weeks, n=720
PIONEER 9: JAPAN monotherapy 52 weeks, n=230
PIONEER 10: JAPAN OAD combination 52 weeks, n=336
52 weeks extension trial
Slide 26
5,05
4,10
3,50
4,72
11,82 11,82
ADA 2017 investor and analyst event
Robin Evers SVP Medical Affairs, Regulatory Affairs & Safety
Xultophy® 100/3.6 DUAL VII

Slide 27
5,05
4,10
3,50
4,72
11,82 11,82
DUAL VII phase 3b trial design Baseline characteristics
DUAL VII was designed to confirm the glycaemic efficacy of Xultophy® 100/3.6 versus basal-bolus treatment
ADA 2017 investor and analyst event
Xultophy® IGlar
U100+IAsp
Number of patients 252 254
Weight (kg) 87.2 88.2
Mean HbA1c 8.2% 8.2%
Mean diabetes duration (years)
13.2 13.3
Mean BMI (kg/m2) 31.7 31.7
Daily insulin dose (units)
34 33
insulin glargine U100 + insulin aspart (≤4 times) + metformin
IDegLira + metformin
26 weeks
506 patients with type 2
diabetes
Randomisation (1:1)
End of treatment
Trial objective
• To confirm the efficacy of Xultophy® 100/3.6 versus basal-bolus therapy in terms of glycaemic control
BMI: Body Mass Index; IGlar U100: insulin glargine U100; IAsp: insulin aspart Key inclusion criteria: Adults with type 2 diabetes and BMI ≤40kg/m2; HbA1c 7.0-10.0% and current basal insulin therapy 20-50 units insulin glargine U100 + metformin per day Source: Presented at the American Diabetes Association 77th Scientific Sessions, 136-OR, June 10 2017, San Diego, CA, USA

Slide 28
5,05
4,10
3,50
4,72
11,82 11,82
5.5
6
6.5
7
7.5
8
8.5
5.5
6.0
6.5
7.0
7.5
8.0
8.5
-2 0 2 4 6 8 10 12 14 16 18 20 22 24 26
Similar mean HbA1c levels sustained throughout the DUAL VII trial
Patients on Xultophy® 100/3.6 used less insulin units than patients on basal-bolus treatment
IGlar U100: insulin glargine U100; IAsp: insulin aspart; ETD: end of trial dose Source: Presented at the American Diabetes Association 77th Scientific Sessions, 136-OR, June 10 2017, San Diego, CA, USA
ADA 2017 investor and analyst event
Weeks
HbA1c (%) Dose (units)
0.0 0
20
40
60
80
100
0 2 4 6 8 10 12 14 16 18 20 22 24 26
Weeks
40.4 units
84.1 units 52.3 units basal* 32.1 units bolus*
In DUAL VII Xultophy® 100/3.6 demonstrated an insulin sparing effect compared to basal-bolus treatment
* Based on observed mean values at end of trial from the safety analysis set Source: Presented at the American Diabetes Association 77th Scientific Sessions, 136-OR, June 10 2017, San Diego, CA, USA
ETD:–0.02% 95% CI (–0.16; 0.12)
p<0.0001 for non-inferiority
Xultophy® 100/3.6 IGlar U100 + IAsp Xultophy® 100/3.6 IGlar U100 + IAsp

Slide 29
5,05
4,10
3,50
4,72
11,82 11,82
-2
-1
0
1
2
3
0 2 4 6 8 10 12 14 16 18 20 22 24 26
0.0
1.5
3.0
4.5
0 2 4 6 8 10 12 14 16 18 20 22 24 26
89% reduction in hypoglycaemia1 with Xultophy® 100/3.6 vs basal-bolus treatment Change in body weight over time
Xultophy® 100/3.6 demonstrated a reduction in both hypoglycaemia and weight vs basal-bolus in DUAL VII
ERR: estimated rate ratio; CI, confidence interval; IAsp, insulin aspart; IGlar U100: insulin glargine U100
1Severe or blood glucose-confirmed symptomatic hypoglycaemia Source: Presented at the American Diabetes Association 77th Scientific Sessions, 136-OR, June 10 2017, San Diego, CA, USA
ADA 2017 investor and analyst event
Weeks Weeks
ERR = 0.11 95% CI (0.08;0.17)
p<0.0001
Number of episodes per patient
Change in body weight (kg)
–0.9 kg
+2.6 kg
0 2 4 6 8 10 12 14 16 18 20 22 24 26
Xultophy® 100/3.6 IGlar U100 + IAsp Xultophy® 100/3.6 IGlar U100 + IAsp
Slide 30
5,05
4,10
3,50
4,72
11,82 11,82
0
20
40
60
80
100
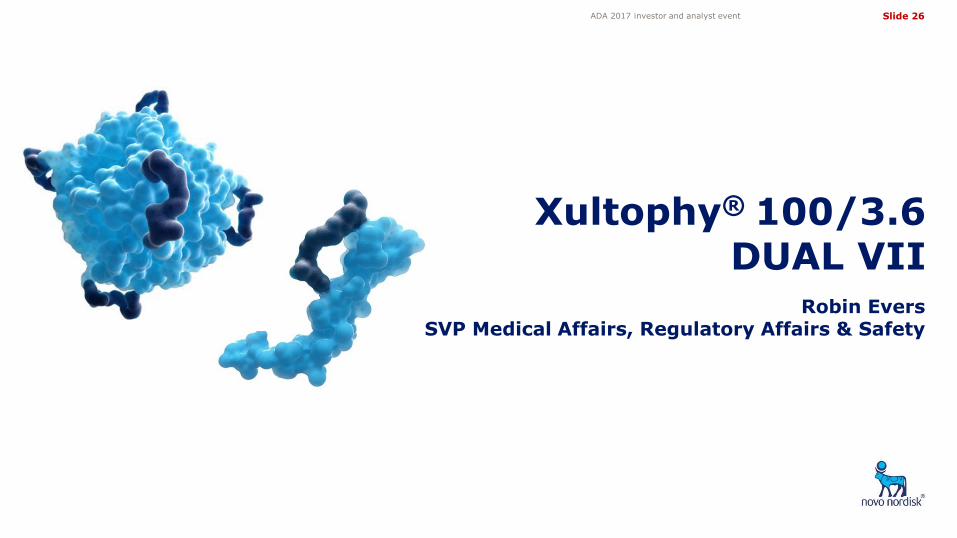
38% of patients on Xultophy® 100/3.6 achieved HbA1c<7% with no hypoglycaemia and no weight gain in DUAL VII Patients achieving HbA1c <7% with no hypoglycaemia and no weight gain
NS: Not significant; * Statistically significant in favour of Xultophy®; OR: Odds ratio ; HbA1c: glycated haemoglobin A1c 1Severe or BG-confirmed symptomatic hypoglycaemia was based on hypoglycaemic episodes during a subject’s last 12 weeks of treatment BG, blood glucose; CI: confidence interval; Iasp: insulin aspart; IGlar U100: insulin glargine 100 Source: Presented at the American Diabetes Association 77th Scientific Sessions, 136-OR, June 10 2017, San Diego, CA, USA
ADA 2017 investor and analyst event
HbA1c <7% HbA1c <7%, no hypoglycaemia1 and no weight gain
HbA1c <7%, no hypoglycaemia1
HbA1c <7%, no weight gain
66 67 58
34 38
6
43
16
Proportion of subjects (%)
Xultophy® 100/3.6 IGlar U100 + IAsp
OR: 0.91NS
OR: 4.46*
OR: 2.58*
OR: 10.39*

Slide 31
5,05
4,10
3,50
4,72
11,82 11,82
Significant regulatory news flow in 2017
ADA 2017 investor and analyst event
Project Q1 2017 Q2 2017 Q3 2017 Q4 2017
1 Study conducted in adult growth hormone disorder
Diabetes Haemophilia Growth disorders
Tresiba®
Victoza®
Once-weekly semaglutide
N9-GP
Fast-acting insulin aspart
N9-GP CHMP opinion
EU approval
Somapacitan
Concizumab
Results available Regulatory milestone
US resubmission
US regulatory decision
REAL 1 phase 3a data1
SUSTAIN 7 phase 3b data
US regulatory decision
LEADER CHMP opinion & US regulatory decision
Obesity
Semaglutide obesity Phase 2 data
√
Japan submission CHMP opinion
Japan submission
US regulatory decision
US submission DEVOTE
√
√
√
EU SWITCH approval √
CHMP: Committee for Medicinal Products for Human Use in Europe
US label update decision for SWITCH
Phase 1 data √
√
√
EU submission DEVOTE
EU regulatory decision √

Slide 32
5,05
4,10
3,50
4,72
11,82 11,82
ADA 2017 investor and analyst event
Q&A session

Slide 33
5,05
4,10
3,50
4,72
11,82 11,82
Share information Investor Relations contacts
Investor contact information
ADA 2017 investor and analyst event
Novo Nordisk’s B shares are listed on the stock exchange in Copenhagen under the symbol ‘NOVO B’. Its ADRs are listed on the New York Stock Exchange under the symbol ‘NVO’. For further company information, visit Novo Nordisk on the internet at: novonordisk.com
Peter Hugreffe Ankersen +45 3075 9085 [email protected]
Hanna Ögren +45 3079 8519 [email protected]
Anders Mikkelsen +45 3079 4461 [email protected]
In North America:
Kasper Veje +1 609 235 8567 [email protected]
Novo Nordisk A/S Investor Relations Novo Allé, DK-2880 Bagsværd
Upcoming events
09 Aug 2017 Financial statement for the first half of 2017
01 Nov 2017 Financial statement for the first nine months of 2017
01 Feb 2018 Financial statement for 2017