Embed Size (px)
Citation preview

American Economic Association
Stature and the Standard of LivingAuthor(s): Richard H. SteckelSource: Journal of Economic Literature, Vol. 33, No. 4 (Dec., 1995), pp. 1903-1940Published by: American Economic AssociationStable URL: http://www.jstor.org/stable/2729317Accessed: 14/05/2010 16:09
Your use of the JSTOR archive indicates your acceptance of JSTOR's Terms and Conditions of Use, available athttp://www.jstor.org/page/info/about/policies/terms.jsp. JSTOR's Terms and Conditions of Use provides, in part, that unlessyou have obtained prior permission, you may not download an entire issue of a journal or multiple copies of articles, and youmay use content in the JSTOR archive only for your personal, non-commercial use.
Please contact the publisher regarding any further use of this work. Publisher contact information may be obtained athttp://www.jstor.org/action/showPublisher?publisherCode=aea.
Each copy of any part of a JSTOR transmission must contain the same copyright notice that appears on the screen or printedpage of such transmission.
JSTOR is a not-for-profit service that helps scholars, researchers, and students discover, use, and build upon a wide range ofcontent in a trusted digital archive. We use information technology and tools to increase productivity and facilitate new formsof scholarship. For more information about JSTOR, please contact [email protected].
American Economic Association is collaborating with JSTOR to digitize, preserve and extend access to Journalof Economic Literature.
http://www.jstor.org
Journal of Economic Literature, Vol. XXXIII (December 1995), pp. 1903-1940
Stature and the Standard of Living
By RICHARD H. STECKEL Economics and Anthropology Departments
Ohio State University and
National Bureau of Economic Research
The author has benefitedfronm conotnents or discussions twith Jere Behrman, Della Cook, Dora Costa, Robert Fogel, Robert Gallmnan, Bernard Harris, Mitsuhiko Kimitura, John Komilos, John Lyons, Robert Margo, John Murray, Walter Oi, Jonathan Pritchett, James Riley, John Strauss; seminar participants at Rochester, Colby, and Tulane; session participanits at the Social Sci- ence History Association meetings and the Amnerican Historical Association mleetings; an(l three anonymous referees. The paper was written while the author was a Fellow at Harvard's Charles Warren Center.
NUMEROUS GENERATIONS of econo- mists and other social scientists
have studied the conceptual foundations and measurement of living standards. At- tempts to define and estimate national income, which originated over three cen- turies ago, eventually led to the system of national accounts in the twentieth century. Although economists recognize the magnificent achievements of the na- tional accounts, research momentum has shifted to alternatives or supplements that address shortcomings in GNP as a welfare measure or that indicate living standards in time periods or among groups for which conventional measures cannot be calculated. Stature is an exam- ple now used extensively in the fields of economic history and economic develop- ment.
Newcomers to the idea that stature measures important aspects of the stan- dard of living should not be sidetracked by genetic issues. Genes are important determinants of individual height, but genetic differences approximately cancel in comparisons of averages across most
populations, and in these situations heights accurately reflect health status.
Many studies show that measures of health are positively correlated with in- come or wealth. Less well known are the relationship between stature and conven- tional measures such as per capita in- come, and the ways that stature ad- dresses certain conceptual inadequacies in GNP as a welfare measure. It will be shown, for example, that stature adeptly measures inequality in the form of nutri- tional deprivation; average height in the past century is sensitive not only to the level of income but to the distribution of income and the consumption of basic ne- cessities by the poor. Unlike conven- tional measures of living standards based -on output, stature is a measure of con- sumption that incorporates or adjusts for individual nutritional needs; it is a net measure that captures not only the sup- ply of inputs to health but demands on those inputs. Moreover, heights are available in settings, such as eighteenth century America, where income data are lacking (or of dubious quality) and for
1903
1904 Journal of Economic Literature, Vol. XXXIII (December 1995)
groups, such as slaves, for which income or wage concepts do not apply. Because growth occurs largely in childhood, stat- ure also provides valuable insights into resource allocation within the family, an interesting phenomenon obscured from household-level data on income or earn- ings, much less aggregate statistics on output or inequality.
The paper reviews the findings and implications of nearly two decades of re- search on stature, primarily as under- taken by economic historians. Although this research confirms much that schol- ars knew from other sources, such as the poor state of health in cities before the twentieth century, the discussion empha- sizes several anomalies that challenge traditional interpretations of the past. The unusual height-by-age profile of American slaves, in which young chil- dren were dreadfully small but recov- ered substantially as teenagers, provides new insights into the nature and conse- quences of slavery. Contrary to wide- spread impressions, eighteenth century native born American whites fell only a few centimeters below mid-twentieth century stature. Moreover, cycles or fluctuations in heights, rather than a sta- ble secular trend, better characterize the historical record in Europe and America before the twentieth century. Although they were once several centimeters taller than Europeans, whose strides toward modern heights were delayed until the second half of the nineteenth century, Americans now lag behind some Western Europeans in international comparions of stature. Following a discussion of pos- sible explanations for these remarkable patterns, I consider the use of stature in developing economies to monitor health status, to investigate the allocation of re- sources within the family, and to study the link between nutrition and labor pro- ductivity. The paper concludes with sug- gestions for research and policy.
I. Conceptual Background
A. Social Accounts
During the 1930s national accounting methodology emerged as an important subject in economics departments and scholars debated alternative conceptuali- zations of the issues. One school of thought, represented by Simon Kuznets (1941), Joseph Davis (1945), and Merrill K. Bennett (1937) urged the creation of welfare measures that would reflect the satisfaction of consumers. Arguing that a welfare measure might begin with na- tional income, Kuznets proposed numer- ous refinements to incorporate nonmar- ket activities, occupational costs, leisure, costs of urban civilization, and inequal- ity. Ultimately many practical considera- tions were involved and given pressures to combat unemployment during the De- pression, the Commerce Department followed a narrower approach by defin- ing national product as the market value of the output of final goods and services produced by the nation's economy. Though it had recognized shortcomings, per capita GNP soon emerged as a widely used measure of living standards.
Soon after economists and policy mak- ers established the major conventions of national income accounting in the 1940s, economic historians began to extend these ideas as far into the past as permit- ted by the readily available evidence. By combining census data, market prices, and other sources with methods of im- putation and interpolation, they con- structed data series on national product and related components from the mid- nineteenth century onwards for many countries. While important for under- standing the extent and possible ingredi- ents of long-run economic growth, these series began too late, were of question- able validity, or lacked detail for analysis of early industrialization in many coun- tries.
Steckel: Stature and the Standard of Living 1905
By the 1950s many economists be- lieved that the profession had resolved the major accounting questions to the ex- tent practical, and the emphasis in the emerging field of macroeconomics shifted to using the new results on na- tional product to study determinants of income, employment, and the price level. The United Nations research agenda featured multiple indicators of the standard of living, including items for health and nutrition, and efforts to improve the international comparability of GNP through purchasing power pari- ties constructed by the International Comparison Project (United Nations 1954, 1961; Irving Kravis, Alan Heston, and Robert Summers 1978). In the 1970s the knowledge of nutritionists such as John C. Waterlow, Jean-Pierre Habicht, Stanley Garn, and Reynaldo Martorell entered the picture and by the end of the decade development economists and various international organizations used stature as a measure of health status (Pe- ter Heller and William Drake 1979; United Nations 1979). In 1980 the World Bank began the Living Standards Measurement Study (LSMS), which con- templated the collection of individual, household, and community data (includ- ing stature) for the assessment and study of living standards in developing coun- tries (United Nations Statistical Office 1980).
The 1970s witnessed a revival of inter- est in the methodology of social account- ing. Moderation of business cycles and high rates of economic growth with ac- companying disamenities in the form of urban sprawl, pollution, congestion, and crime stimulated interest in broad wel- fare measures. In an influential article of the early 1970s William D. Nordhaus and James Tobin (1973) asked whether growth was obsolete. Taking issue with Gross National Product as a measure of production as opposed to welfare or con-
sumption, they adjusted GNP for capital services, leisure, nonmarket work, and disamenities. Others extended these ideas to cross-national comparisons by using inequality as an ingredient in wel- fare (see, for example, Nanak Kakwani 1981). International organizations and economists concerned with the lagging progress of the poor in Third World countries also expressed dissatisfaction with the focus on economic growth, urg- ing a greater role for welfare considera- tions. The United Nations, the World Bank, and various economists proposed growth-with-equity or basic human needs approaches to living standards (Irma Adelman and Cynthia Morris 1973; Hollis Chenery et al. 1974).1 While there is some disagreement over the es- sential elements, advocates often equate basic needs with minimum amounts of food, clothing, shelter, water, and sanita- tion that are necessary to prevent ill health and undernourishment. Morris Morris (1979) took up the task of quanti- fying these concerns in the form of a Physical Quality of Life Index based on the infant mortality rate, the literacy rate, and life expectancy at age one. In a similar vein, the United Nations (UNDP 1993) created the human development index, which weighs life expectancy, lit- eracy, and income, and subsequent re- finements incorporated a broader defini- tion of education, and adjustments for gender discrimination and the income distribution.
Stature measures performance by health history rather than inputs to health, which has the advantage of incor- porating the supply of inputs to health as well as demands on those inputs, a con- sideration high on the agenda of Amartya Sen's (1987) approach to the standard of living. Sen rejects the notion that the
I See Bruce Johnston (1977) for a discussion of issues.
1906 Journal of Economic Literature, Vol. XXXIII (December 1995)
TABLE 1 MILESTONES IN AUXOLOGY
Place Investigator Year Events or Developments
Germany Elsholtz 1654 Graduation thesis on anthropometria Germany Jampert 1754 Cross-section measurements of stature by age Germany Roederer 1754 Measures and weights of newborns France Montbeillard 1777 First longitudinal study from birth to adult France Villerme 1829 Studied environmental influences on growth U.K. Chadwick 1833 First survey of factory children Brussels Quetelet 1842 First mathematical formulation of growth U.K. Roberts 1876 Used frequency distributions to assess fitness;
studied growth by social class U.S. Bowditch 1877 School surveys; analyzed velocity of growth Italy Pagliani 1879 Longitudinal studies; school surveys U.K. Galton 1889 Studied inheritance of height; introduced
regression coefficient France Budin 1892 First infant welfare clinic established U.S. Boas 1891- Tempo of growth; concept of developmental
1932 age; growth studies in anthropology; standards for height and weight
France Godin 1903 Detailed growth surveillance U.S. Baldwin 1921 Supervised the first large longitudinal study U.K. Douglas 1946 First national survey of health and development U.K. Tanner 1952 Models underlying clinical standards
Source: Compiled from Tanner (1981).
standard of living can be portrayed in terms of opulence or commodities alone, though it is influenced by them, in favor of the idea that one must consider the balance between functionings (the vari- ous living conditions that one can or can- not achieve) and capabilities (the ability to achieve various living conditions). For example, to reach the same level of nu- trition as another, one needs a larger command over food if one has a higher metabolic rate (or a larger body frame), or if one is pregnant (or breast-feeding), or if one has a disease that makes ab- sorption more difficult, or if one lives in a colder climate, or if one has to toil a lot, or if food has other uses, such as for entertainment, ceremonies, or festivals (Sen 1987, p. 16).
B. Stature
The histories of national income ac- counting and auxology (the study of hu- man growth) have two things in com- mon: the first substantial efforts occurred in the seventeenth and eigh- teenth centuries and early studies were sporadic, imprecise attempts made by in- dividuals. Unlike national income, how- ever, investigators could make useful an- thropometric measurements on a small scale. Systematic national income data awaited government involvement and support in the twentieth century while important progress in auxology was made before the end of the nineteenth cen- tury.
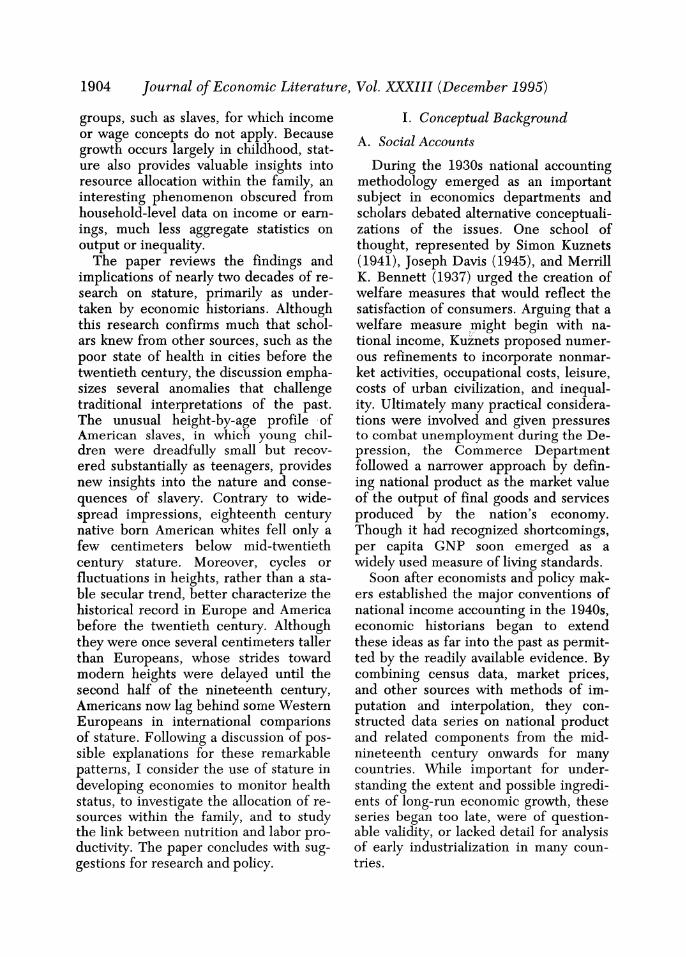
Table 1 charts milestones in anthro-
Steckel: Stature and the Standard of Living 1907
pometry from the perspective of human biology.2 Researchers took initial steps in the seventeenth and eighteenth centu- ries but progress was slow until the sec- ond quarter of the nineteenth century. The realization that environmental con- ditions systematically influenced growth stimulated interest in growth studies in the 1820s. Auxological epidemiology arose in France, where Villerme studied the stature of soldiers; in Belgium, where Quetelet measured children and formulated mathematical representations of the human growth curve; and in En- gland, where Edwin Chadwick inquired into the health of factory children. After examining the heights of soldiers in France and Holland and studying the economic conditions in their places of origin, Villerme concluded in 1829 that poverty was much more important than climate in influencing growth. In 1833 the English Parliament put these ideas into action in legislation using stature as a criterion in evaluating minimum standards of health for child employ- ment.
The greatest strides in the modern study of human growth occurred about a century ago with the work of Charles Roberts, Henry Bowditch, and espe- cially, Franz Boas. Roberts raised the level of sophistication in judging fitness for factory employment by using fre- quency distributions of stature and other measurements, such as weight-for-height and chest circumference. Bowditch as- sembled longitudinal data on stature to establish the prominent gender differ- ences in growth. In 1875 he supervised the collection and analysis of heights from Boston school children, a data set on which he later used Galton's method of percentiles to create growth stan- dards. In a career that spanned several
decades, Boas identified salient relation- ships between the tempo of growth and height distributions and in 1891 coordin- ated a national growth study, which he used to develop national standards for height and weight. Later he pioneered the used of statistical methods in analyz- ing anthropometric measurements and investigated the effects of environment and heredity on growth. The volumes by Phyllis Eveleth and Tanner (1976, 1990), Worldwide Variation in Human Growth, summarize the explosion of growth stud- ies in the twentieth century.
II. Stature and Living Standards
The methods of assessing human wel- fare from national income accounts and anthropometric measures have long, dis- tinguished intellectual traditions that emanated largely from humanitarian considerations, yet until recently there has been virtually no overlap of person- nel or cross-fertilization of ideas. Casual comparison of Table 1 with discussions of the history of national income ac- counting shows that none of the major contributors in either area participated in an important way in the other field. Why these movements unfolded in isola- tion remains to be explained. Perhaps the demands of understanding and mak- ing important contributions to econom- ics and national income accounting (or to auxology) precluded forays into other, seemingly distant areas. Perhaps the greatest flurries of activity occurred at times when these fields were particularly remote; national income accounting ad- vanced rapidly in the 1930s and 1940s, a time when the data gathering and analy- sis in auxology were centered in medical enterprises and in institutions devoted to the study of child welfare, which were removed from the economics profession. Perhaps the national income accountants of the 1930s and 1940s were repelled by
2 This section draws heavily on material in James M. Tanner (1981).
1908 Journal of Economic Literature, Vol. XXXIII (December 1995)
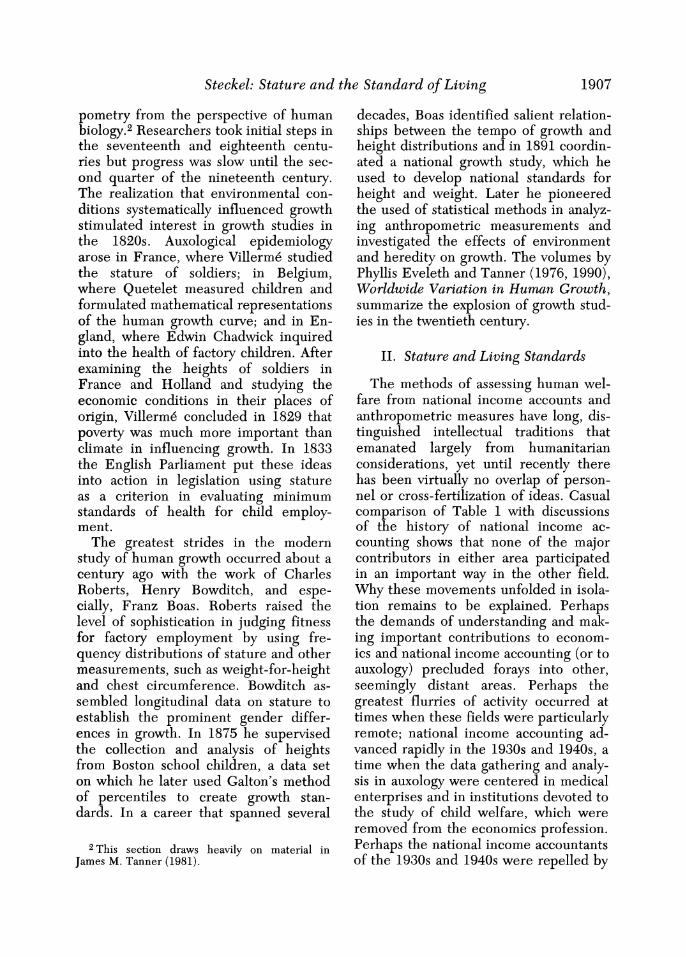
Socioeconomic Proximate SaueFunctional Determinants Determinants aure Consequences
* Income * Diet * Mortality * Inequality * Disease I Age * Public Health * Work Intensity Gender * Personal Hygiene * Maintenance Disease * Disease Environment * Genetic * Morbidity * Technology * Military * Work Intensity * Labor Organization * Manifests * Labor Productivity * Cultural Values * Oath Takers * Human Capital Formation * Food Prices * Students * Cognitive Development
* Passports * Personality * Convicts * Police * Registration of Free Negoes * National Guard * Firemen * Voter Registration * Contraband Slave Property * Runaway Slave Ads * Surveys * Skeletal Remains * Runaway Indentured Servant Ads * Life Insurance
Figure 1. Relationships Involving Stature
the perversion of human measurements and study of human form that occurred in Hitler's Germany. Whatever the ex- planation, I will argue the case for col- laboration.
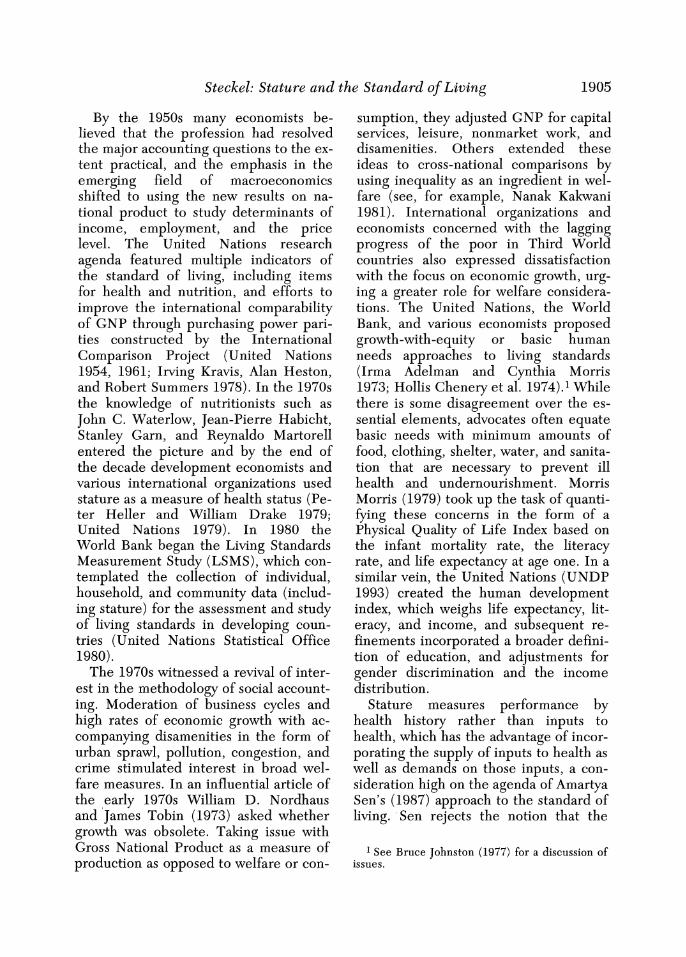
Figure 1 is a useful organizing device for exploring the relationship of height to living standards. Stature is a function of proximate determinants such as diet, disease, and work intensity during the growing years, and as such it is a mea- sure of the consumption of basic necessi- ties that incorporates demands placed on one's biological system. Because family income heavily influences purchases of basic necessities such as food and medi- cal care, stature is ultimately a function of access to resources. It is noteworthy that stature recognizes or adjusts for consumption of products, such as alcohol or drugs, that are harmful to health, but
excessive consumption of food, while leading to rapid growth, may impair health in later life. Public health mea- sures, personal hygiene, and the disease environment affect the incidence of dis- ease that claims nutrition. In addition, human growth may have functional con- sequences for health, labor productivity, mental development, and personality, which in turn may influence socioeco- nomic conditions.
A. Sources of Evidence on Stature
Beginning in the mid-eighteenth cen- tury identification records emerged to describe soldiers, students, slave car- goes, oath takers, travelers, or those with life insurance. In an era when photogra- phy was unavailable or expensive, identi- fication records often included age, height, hair color, and complexion. Mili-
Steckel: Stature and the Standard of Living 1909
tary organizations collected stature to track deserters, to assure that compensa- tion went to the proper individuals, and to assess the fighting capability of regi- ments. To prevent smuggling after abol- ishing the African slave trade in 1807, Congress required ship captains to re- cord slave heights on cargo manifests of the coastwise trade in the United States. Because most black people were slaves in the American South before 1860, many localities required free blacks to register or to carry identification papers that proved their status as free persons of color. During the Civil War of the 1860s, the Union Army collected identi- fying information, such as age, height, and value, on contraband slaves. Begin- ning in 1863 the President and Congress established an amnesty program for resi- dents of states in rebellion, through which oath-takers regained rights as citi- zens. In addition, skeletal remains have proven useful for documenting stature and the nature of work, nutrition, and disease in the past.
Minimum height standards, age and height heaping, ethnic differences in growth potential, and selectivity of those measured complicate the interpretation of stature, but researchers have devised techniques to address these problems. Military organizations often applied minimum height standards that varied with personnel needs, but flexible en- forcement of the standards eroded the lower tail of the height distribution. As- suming that the underlying distribution was normal or Gaussian, Kenneth Wachter and James Trussell (1982) de- vised techniques such as the Quantile Bend Estimator and the Reduced-Sam- ple Maximum Likelihood Estimator to identify the height below which stan- dards were applied and to compensate for those omitted.
Heaping, or concentrations of mea- surements at whole feet or meters, even-
numbered ages or units, and at ages or units ending in zero, plagues many data sources, including some modern studies. Simulations suggest that these aspects were relatively minor for estimates of sample means, primarily because their effects are largely self-canceling (Fogel et al. 1983). Rounding by the military during World War II probably biased av- erage heights by approximately 0.5 centi- meters below the actual mean. In any event, rounding practices that were uni- form over time and across space would not distort comparisons of relative height averages. In addition, smoothing tech- niques help to overcome heaping irregu- larities that contaminate the picture of the growth profile.
It was seldom the case that measure- ments represented the entire population about which investigators would like to draw inferences. Army volunteers, for example, typically included more un- skilled and more foreign born than the entire adult male population and some historians have suggested that slaves transported in the coastwise trade were rejects in poor health. One way to ad- dress sample selectivity is to compare different samples from the same group. For example, the average heights of adults among U.S. Colored Troops and slaves shipped in the coastwise trade were nearly identical, and Louisiana's certificates of character suggest that se- lectivity by height among children in the slave trade was small (Margo and Steckel 1982; Pritchett and Herman Freuden- berger 1992). Second, it may be possible to calculate the mean by assigning popu- lation weights to components of the sam- ple. Third, in a few cases, such as Swe- den beginning in 1840 and the United States during the Civil War, authorities measured all (or nearly all) men of a par- ticular age, which makes possible study of the characteristics of volunteers and rejects.
1910 Journal of Economic Literature, Vol. XXXIII (December 1995)
B. The Growth Process
Two periods of intense activity charac- terize the growth process following birth (Tanner 1978). The change in height, or velocity, is greatest during infancy, falls sharply, and then declines irregularly into the preadolescent years. During adolescence velocity rises sharply to a peak that equals approximately one-half of the velocity during infancy, then de- clines rapidly and reaches zero at matur- ity. The adolescent growth spurt begins about two years earlier in girls than boys and during their spurt girls temporarily overtake boys in average height. As adults, males are taller than females pri- marily because they have approximately two additional years of growth before adolescence.
The height of an individual reflects the interaction of genetic and environmental influences during the period of growth. According to Eveleth and Tanner (1976, p. 222):
Such interaction may be complex. Two geno- types which produce the same adult height under optimal environmental circumstances may produce different heights under circum- stances of privation. Thus two children who would be the same height in a well-off com- munity may not only be smaller under poor economic conditions, but one may be signifi- cantly smaller than the other . . . . If a par- ticular environmental stimulus is lacking at a time when it is essential for the child (times known as "sensitive periods") then the child's development may be shunted as it were, from one line to another.
Although genes are important deter- minants of individual height, studies of genetically similar and dissimilar popula- tions under various environmental condi- tions suggest that differences in average height across most populations are largely attributable to environmental fac- tors. In a review of studies covering populations in Europe, New Guinea, and Mexico, L. A. Malcolm (1974) concludes
that differences in average height be- tween populations are almost entirely the product of the environment. Using data from well-nourished populations in several developed and developing coun- tries, Martorell and Habicht (1986) re- port that children from Europe or Euro- pean descent, Africa or African descent, and from India or the Middle East have similar growth profiles. Far-Eastern chil- dren or adults are an exception that may have a substantial genetic basis; well-off Japanese, for example, reach, on aver- age, the fifteenth height percentile of the well-off in Britain (Tanner et al. 1982). Important for interpreting stature in the United States is that Europeans and people of European descent, and Af- ricans and people of African descent who grew under good nutritional cir- cumstances have nearly identical stature (Eveleth and Tanner 1976, Appendix).3
Height at a particular age reflects an individual's history of net nutrition. The body devotes a substantial share of food to maintenance, and work or physical ac- tivity and disease make other claims on the diet. The synergy between malnutri- tion and illness may further reduce the nutrition left over for growth (Nevin Scrimshaw, Carl Taylor, and John Gor- don 1968). Poorly nourished children are more susceptible to infection, and infec- tion reduces the body's absorption of nu- trients. This feature implies that analyses of stature must recognize not only inputs to health such as diet and medical care but also work effort and related phenom- ena such as methods of labor organiza- tion. Similarly, researchers must attempt to understand ways that exposure to in- fectious disease may have placed claims on the diet.4
3To the extent that genetic factors influence height, comparisons can be made by converting stature to centiles of appropriate height standards.
4 An alternative view of stature is the "small but healthy" paradigm emphasized by P. V. Sukhatme
Steckel: Stature and the Standard of Living 1911
The sensitivity of growth to depriva- tion depends upon the age at which it occurs. For a given degree of depriva- tion, the adverse effects may be propor- tional to the velocity of growth under op- timal conditions (Tanner 1966). Thus, young children and adolescents are par- ticularly susceptible to environmental in- sults. The return of adequate nutrition following a period of deprivation may re- store normal height through catch-up growth.5 If conditions are inadequate for catch-up, individuals may approach nor- mal adult height by an extension of the growing period by as long as several years. Prolonged and severe deprivation results in stunting, or a reduction in adult size.
C. Relationship of Stature to Per Capita Income and Its Distribution
While I will argue that income is a po- tent determinant of stature that operates through diet, disease, and work intensity, analysis of the problem must recognize other factors. Personal hygiene, public health measures, and the disease envi- ronment affect illness, and work inten- sity is a function of technology, culture, and methods of labor organization. In addition, the relative price of food, cul- tural values such as the pattern of food distribution within the family, methods of preparation, and tastes and prefer- ences for foods may also be relevant for net nutrition. Yet, influential policy mak- ers view higher incomes for the poor as the most effective means of alleviating protein-energy malnutrition in develop-
ing countries (World Bank 1993, p. 75).6 Extremely poor families may spend two- thirds or more of their income on food, but even a large share of their very low incomes purchases few calories. Malnu- trition associated with extreme poverty has a major impact on height, but expen- ditures beyond those needed to satisfy calorie requirements purchase largely va- riety, palatability, and convenience.
Impoverished families can afford little medical care, and additional income im- proves health through control of infec- tious diseases. Although tropical climates have a bad reputation for diseases, Maurice King (1966) argues that poor health in developing countries is largely a consequence of poverty rather than cli- mate. A group of diseases are spread by vectors that need a warm climate, but poverty is responsible for the lack of doctors, nurses, drugs, and equipment to combat these and other diseases. Pov- erty, via malnutrition, increases the sus- ceptibility to disease.
Gains in stature associated with higher income are not limited to developing countries. Within industrialized coun- tries, height rises with socio-economic class (Eveleth and Tanner 1976, p. 34). These differences in height are related to improvements in the diet, reductions in physical work loads, and to better health care. Expenditures on health ser- vices rise with income and there is a positive relationship between health ser- vices and health (Victor Fuchs 1972).
At the individual level, extreme pov- erty results in malnutrition, retarded growth, and stunting. Higher incomes enable individuals to purchase a better diet and height increases correspond- ingly, but once income is sufficient to satisfy caloric requirements, only modest increases are attainable through change
(1982), David Seckler (1982), and others, in which it is claimed that many individuals adapt to nutri- tional deprivation with low costs. For critiques of this view see Martorell (1989) and Partha Das- gupta (1993).
5 Ingestion of toxic substances, such as alcohol or tobacco, in utero or in early childhood may cre- ate permanent stunting regardless of nutritional conditions.
6 Development economists have debated the ef- fects of income on the diets of the poor. See Behrman and Anil Deolalikar (1987).
1912 Journal of Economic Literature, Vol. XXXIII (December 1995)
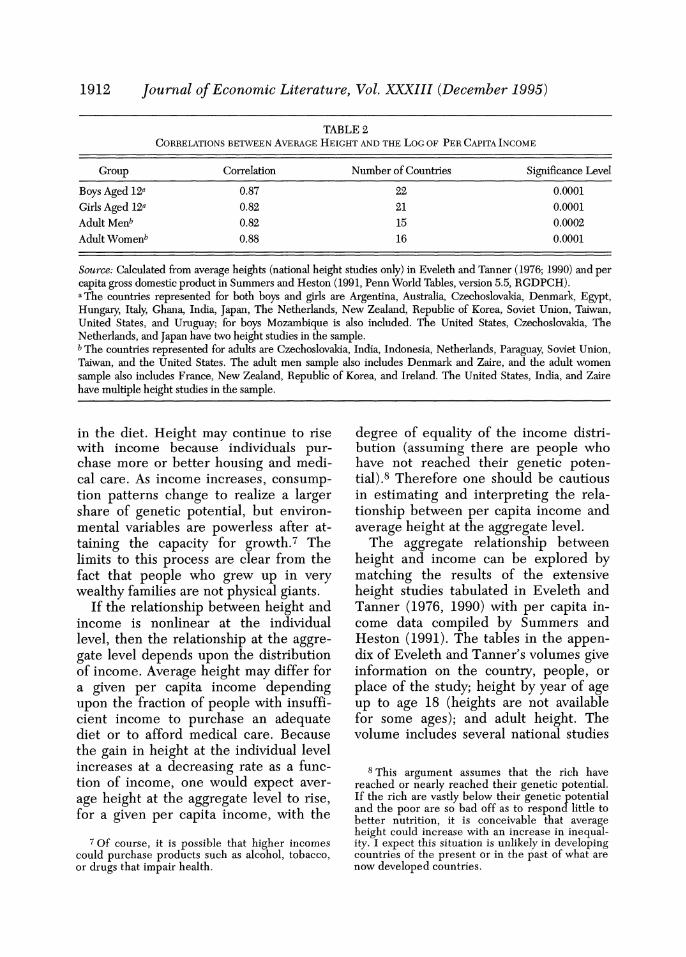
TABLE 2 CORRELATIONS BETWEEN AVERAGE HEIGHT AND THE LOG OF PER CAPITA INCOME
Group Correlation Number of Countries Significance Level
Boys Aged 12a 0.87 22 0.0001 Girls Aged 12a 0.82 21 0.0001 Adult Menb 0.82 15 0.0002 Adult Womenb 0.88 16 0.0001
Source: Calculated from average heights (national height studies only) in Eveleth and Tanner (1976; 1990) and per capita gross domestic product in Summers and Heston (1991, Penn World Tables, version 5.5, RGDPCH). aThe countries represented for both boys and girls are Argentina, Australia, Czechoslovakia, Denmark, Egypt, Hungary, Italy, Ghana, India, Japan, The Netherlands, New Zealand, Republic of Korea, Soviet Union, Taiwan, United States, and Uruguay; for boys Mozambique is also included. The United States, Czechoslovakia, The Netherlands, and Japan have two height studies in the sample. b The countries represented for adults are Czechoslovakia, India, Indonesia, Netherlands, Paraguay, Soviet Union, Taiwan, and the United States. The adult men sample also includes Denmark and Zaire, and the adult women sample also includes France, New Zealand, Republic of Korea, and Ireland. The United States, India, and Zaire have multiple height studies in the sample.
in the diet. Height may continue to rise with income because individuals pur- chase more or better housing and medi- cal care. As income increases, consump- tion patterns change to realize a larger share of genetic potential, but environ- mental variables are powerless after at- taining the capacity for growth.7 The limits to this process are clear from the fact that people who grew up in very wealthy families are not physical giants.
If the relationship between height and income is nonlinear at the individual level, then the relationship at the aggre- gate level depends upon the distribution of income. Average height may differ for a given per capita income depending upon the fraction of people with insuffi- cient income to purchase an adequate diet or to afford medical care. Because the gain in height at the individual level increases at a decreasing rate as a func- tion of income, one would expect aver- age height at the aggregate level to rise, for a given per capita income, with the
degree of equality of the income distri- bution (assuming there are people who have not reached their genetic poten- tial).8 Therefore one should be cautious in estimating and interpreting the rela- tionship between per capita income and average height at the aggregate level.
The aggregate relationship between height and income can be explored by matching the results of the extensive height studies tabulated in Eveleth and Tanner (1976, 1990) with per capita in- come data compiled by Summers and Heston (1991). The tables in the appen- dix of Eveleth and Tanner's volumes give information on the country, people, or place of the study; height by year of age up to age 18 (heights are not available for some ages); and adult height. The volume includes several national studies
7 Of course, it is possible that higher incomes could purchase products such as alcohol, tobacco, or drugs that impair health.
8 This argument assumes that the rich have reached or nearly reached their genetic potential. If the rich are vastly below their genetic potential and the poor are so bad off as to respond little to better nutrition, it is conceivable that average height could increase with an increase in inequal- ity. I expect this situation is unlikely in developing countries of the present or in the past of what are now developed countries.
Steckel: Stature and the Standard of Living 1913
of height as well as studies of numerous smaller groups within these populations such as rural, urban, student, military, poor, and rich residents. Despite the large number of factors that may influ- ence average height at a given level of per capita income, Table 2 shows that simple correlations between a country's average height (reported in national studies) and the log of its per capita in- come are in the range of 0.82 to 0.88.9
By employing a regression framework, I extend the analysis of average height beyond national studies to include vari- ous subsets of a country's population. I examine adolescents and adults sepa- rately because the independent variables may have different effects on the average heights of these groups. Moreover, it may be safe to argue that causation runs one way from per capita income to the heights of children, but per capita in- come and adult height are jointly deter- mined. Height is an index of health and nutrition, phenomena known to affect the output of workers. Healthy workers have greater physical vigor, fewer days lost from work, and longer working lives. By using two-stage least squares it is not necessary to specify the complete model involving adult height and per capita in- come; exogenous variables excluded from the height equation must be used, though, to identify the height equation. Any reasonable model of per capita in- come would include the value of the capital stock per worker, a measure of
human capital per worker, and the per- centage of the population of working age. Reliable estimates of the capital stock per worker are available for only a few countries, and therefore I use the measure of human capital (adult literacy rate) and the percentage of the popula- tion of working age to identify the height equation.
In addition to the log of per capita in- come, the independent variables include a Gini coefficient, which is a measure of income inequality that varies from zero (complete equality) to one (complete in- equality), and dummy variables for those studies on subsets of a country's popula- tion such as poor, rich, urban, rural, uni- versity student, and military residents.'0 The urban, rural, and student variables may operate in part as proxies for in- come; the poor often locate in rural ar- eas and university students tend to come from high income families. The effects of military employment are unclear; some countries have minimum height standards while others have universal service, and the bulk of the personnel in many countries comes from lower socio- economic classes. The height studies in- clude populations of Europeans, Afri- cans, Asians, Indo-Mediterraneans, and people with European ancestry living outside Europe and those with African ancestry living outside Africa.11 The eth- nic variables could measure genetic fac- tors or environmental influences such as
9 Results in this section extend Steckel (1983) by including additional height studies from Ev- eleth and Tanner (1990) and income data from Summers and Heston (1991).
Functional form was explored by regressing av- erage height on various nonlinear relations in per capita income and the log of per capita income. Fit improved substantially by going from the lin- ear to the quadratic formulation but only slightly by going from the quadratic to the cubic. Because the semilog form fits approximately as well as the cubic but is simpler, results are reported for the semilog formulation.
10 Attained height is a function of income dur- ing the years of growth, and a more elaborate model would include several lagged values of per capita income. In view of the large differences in per capita income across countries, lagged values would probably add little to the analysis, and one may question whether their inclusion would justify the additional complexity. Some research on the lagged relationship between income and stature has gone forward for the Netherlands (Henk Brinkman, J. W. Drukker, and Brigitte Slot 1988; C. A. Mandemakers and J. L. van Zanden 1993).
11 There are no observations on adult Africans due to lack of income distribution data.
1914 Journal of Economic Literature, Vol. XXXIII (December 1995)
TABLE 3 REGRESSIONS OF AVERAGE HEIGHT ON PER CAPITA INCOME, GINI COEFFICIENT, PLACE OF RESIDENCE, GENDER,
ETHNIC GROUP, AND AGE
Adolescents Adults
Variable Coeff. t-value Sample Mean Coeff. t-value Sample Mean
Intercept 100.56 24.24 151.14 12.26 Log Per Capita Inc. 4.90 11.99 8.04 3.97 2.75 7.67 Gini Coefficient -14.34 -2.84 0.41 -32.60 -4.00 0.43 Urban 0.81 1.16 0.21 -0.44 -0.31 0.13 Rural -1.35 -1.95 0.11 -2.82 -1.49 0.03 Poor -6.29 -5.17 0.05 Rich 4.42 6.37 0.10 Student 1.22 1.23 0.13 Military 2.02 1.56 0.13 Female 0.89 2.44 0.49 -11.41 -16.51 0.47 European Ancestry -2.26 -2.32 0.29 -1.26 -0.70 0.09 African 2.83 1.89 0.05 African ancestry -2.14 -1.69 0.05 -1.36 -0.74 0.13 Asian -4.46 -4.39 0.25 -2.09 -0.98 0.19 Indo-Mediterranean 2.51 2.04 0.25 4.09 1.25 0.47 Age 11 5.37 9.64 0.21 Age 12 11.14 19.99 0.21 Age 13 16.80 29.47 0.19 Age 14 21.62 39.96 0.18 R2 0.93 0.96 N 191 32
Method OLS 2SLS
Sources: Calculated from data in Eveleth and Tanner (1976; 1990), Norton Ginsburg (1961), Jain (1975), Summers and Heston (1991, Penn World Table, version 5.5, RGDPCH), UNESCO (1957), and World Bank (1980, 1981).
Definition of Variables: Dependent variable = average height in centimeters. Income is measured in 1985 U.S. dollars at international prices for the year that the height study was published. The mean of the dependent variable is 144.05 centimeters for adolescents and 163.69 centimeters for adults. The Gini coefficients used in Jain (1975) are for households.
The omitted class refers to a national height study of Europeans. Age 10 is an excluded variable in the regression on adolescent height. Observations on "poor" and "rich" groups do not exist for the adults.
The countries represented for adolescents are Argentina, Australia, Egypt, France, Hong Kong, India, Japan, Republic of Korea, Malaysia, New Zealand, Spain, Sudan, Taiwan, Turkey, United States, Uruguay, and Yugoslavia. The countries represented for adults are Egypt, France, Hong Kong, India, Republic of Korea, New Zealand, Taiwan, Thailand, Turkey, United Kingdom, and the United States. Several countries have more than one height study.
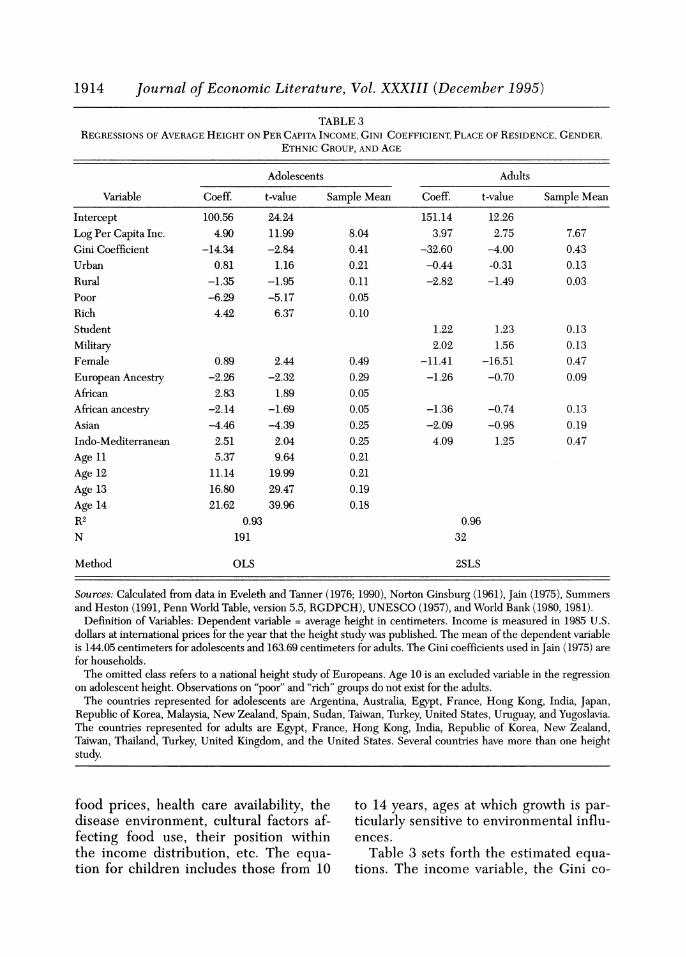
food prices, health care availability, the disease environment, cultural factors af- fecting food use, their position within the income distribution, etc. The equa- tion for children includes those from 10
to 14 years, ages at which growth is par- ticularly sensitive to environmental influ- ences.
Table 3 sets forth the estimated equa- tions. The income variable, the Gini co-
Steckel: Stature and the Standard of Living 1915
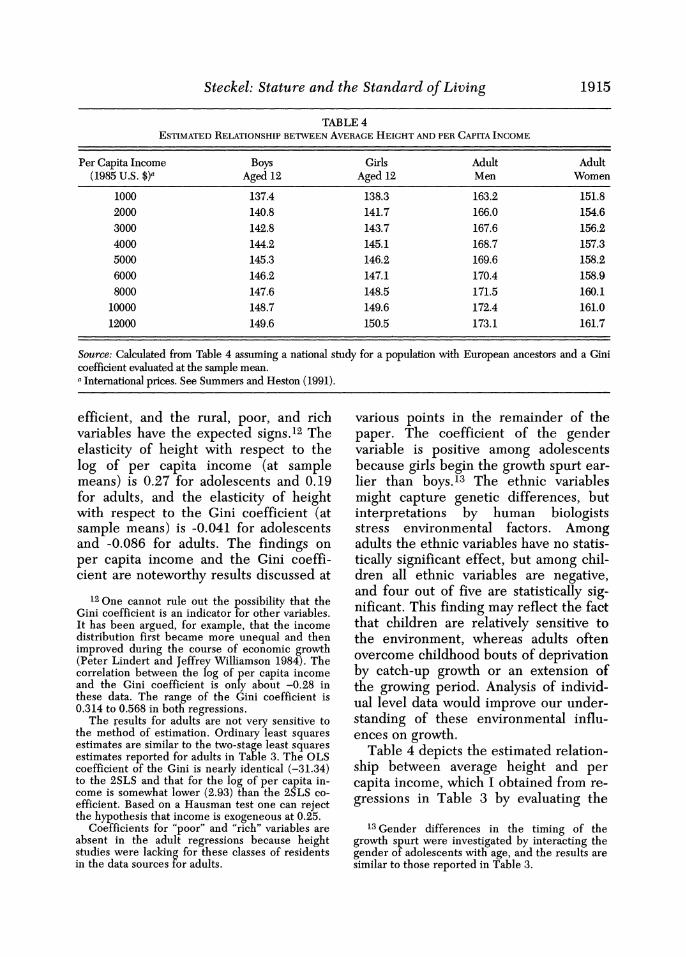
TABLE 4 ESTIMATED RELATIONSHIP BETWEEN AVERAGE HEIGHT AND PER CAPITA INCOME
Per Capita Income Boys Girls Adult Adult (1985 U.S. $)a Aged 12 Aged 12 Men Women
1000 137.4 138.3 163.2 151.8 2000 140.8 141.7 166.0 154.6 3000 142.8 143.7 167.6 156.2 4000 144.2 145.1 168.7 157.3 5000 145.3 146.2 169.6 158.2 6000 146.2 147.1 170.4 158.9 8000 147.6 148.5 171.5 160.1
10000 148.7 149.6 172.4 161.0 12000 149.6 150.5 173.1 161.7
Source: Calculated from Table 4 assuming a national study for a population with European ancestors and a Gini coefficient evaluated at the sample mean. a International prices. See Summers and Heston (1991).
efficient, and the rural, poor, and rich variables have the expected signs.'2 The elasticity of height with respect to the log of per capita income (at sample means) is 0.27 for adolescents and 0.19 for adults, and the elasticity of height with respect to the Gini coefficient (at sample means) is -0.041 for adolescents and -0.086 for adults. The findings on per capita income and the Gini coeffi- cient are noteworthy results discussed at
various points in the remainder of the paper. The coefficient of the gender variable is positive among adolescents because girls begin the growth spurt ear- lier than boys.'3 The ethnic variables might capture genetic differences, but interpretations by human biologists stress environmental factors. Among adults the ethnic variables have no statis- tically significant effect, but among chil- dren all ethnic variables are negative, and four out of five are statistically sig- nificant. This finding may reflect the fact that children are relatively sensitive to the environment, whereas adults often overcome childhood bouts of deprivation by catch-up growth or an extension of the growing period. Analysis of individ- ual level data would improve our under- standing of these environmental influ- ences on growth.
Table 4 depicts the estimated relation- ship between average height and per capita income, which I obtained from re- gressions in Table 3 by evaluating the
12 One cannot rule out the possibility that the Gini coefficient is an indicator for other variables. It has been argued, for example, that the income distribution first became more unequal and then improved during the course of economic growth (Peter Lindert and Jeffrey Williamson 1984). The correlation between the Iog of per capita income and the Gini coefficient is only about -0.28 in these data. The range of the Gini coefficient is 0.314 to 0.568 in both regressions.
The results for adults are not very sensitive to the method of estimation. Ordinary least squares estimates are similar to the two-stage least squares estimates reported for adults in Table 3. The OLS coefficient of the Gini is nearly identical (-31.34) to the 2SLS and that for the log of per capita in- come is somewhat lower (2.93) than the 2SLS co- efficient. Based on a Hausman test one can reject the hypothesis that income is exogeneous at 0.25.
Coefficients for "poor" and "rich" variables are absent in the adult regressions because height studies were lacking for these classes of residents in the data sources for adults.
13 Gender differences in the timing of the growth spurt were investigated by interacting the gender of adolescents with age, and the results are similar to those reported in Table 3.
1916 Journal of Economic Literature, Vol. XXXIII (December 1995)
Gini coefficient at the sample mean and by assuming a population of European ancestors. Height is particularly sensitive to income at low income levels. Among boys aged 12, for example, height in- creases by 6.8 centimeters as per capita income increases from $1,000 to $4,000, whereas the gain is 2.0 centimeters as per capita income increases from $8,000 to $12,000 (the standard deviation of height among boys aged 12 is approxi- mately 7.25 centimeters in well-nour- ished populations).
The Great Depression scarcely af- fected the secular trend in stature in the United States (Howard Meredith 1963; Jialu Wu 1992; Harris forthcoming), which indicates this calamity had only a small adverse impact on health and nutrition compared with the deprivation witnessed in earlier eras or in less developed coun- tries. However, the secular trend depicts average experience, and it would be in- teresting to know the extent to which health within families under severe eco- nomic stress declined in the 1930s.
D. Inferring Per Capita Incomefrom Stature
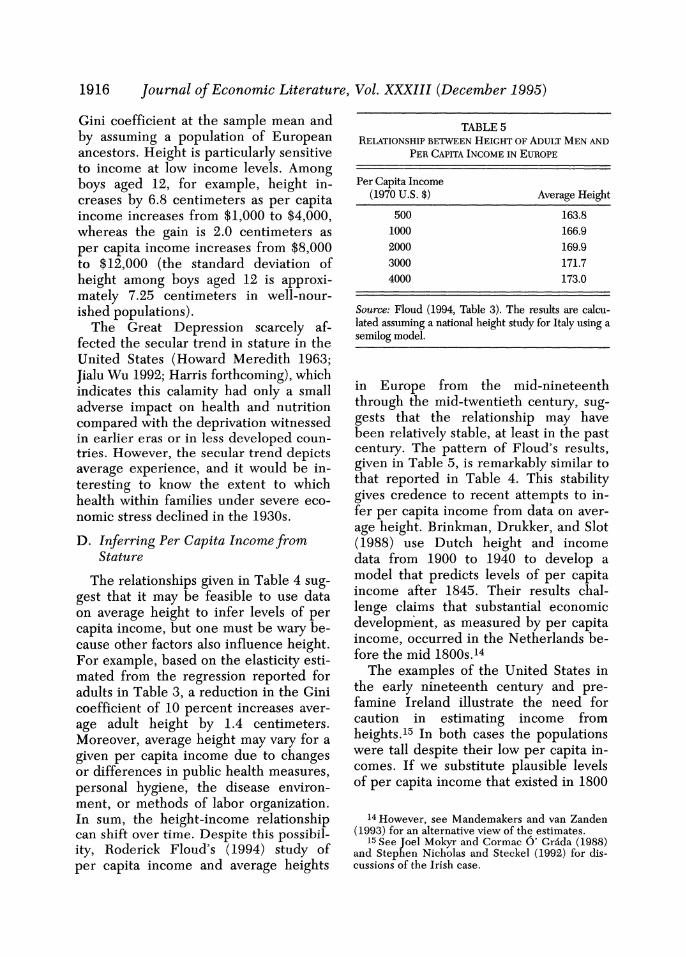
The relationships given in Table 4 sug- gest that it may be feasible to use data on average height to infer levels of per capita income, but one must be wary be- cause other factors also influence height. For example, based on the elasticity esti- mated from the regression reported for adults in Table 3, a reduction in the Gini coefficient of 10 percent increases aver- age adult height by 1.4 centimeters. Moreover, average height may vary for a given per capita income due to changes or differences in public health measures, personal hygiene, the disease environ- ment, or methods of labor organization. In sum, the height-income relationship can shift over time. Despite this possibil- ity, Roderick Floud's (1994) study of per capita income and average heights
TABLE 5 RELATIONSHIP BETWEEN HEIGHT OF ADULT MEN AND
PER CAPITA INCOME IN EUROPE
Per Capita Income (1970 U.S. $) Average Height
500 163.8
1000 166.9
2000 169.9
3000 171.7
4000 173.0
Source: Floud (1994, Table 3). The results are calcu- lated assuming a national height study for Italy using a semilog model.
in Europe from the mid-nineteenth through the mid-twentieth century, sug- gests that the relationship may have been relatively stable, at least in the past century. The pattern of Floud's results, given in Table 5, is remarkably similar to that reported in Table 4. This stability gives credence to recent attempts to in- fer per capita income from data on aver- age height. Brinkman, Drukker, and Slot (1988) use Dutch height and income data from 1900 to 1940 to develop a model that predicts levels of per capita income after 1845. Their results chal- lenge claims that substantial economic development, as measured by per capita income, occurred in the Netherlands be- fore the mid 1800s.14
The examples of the United States in the early nineteenth century and pre- famine Ireland illustrate the need for caution in estimating income from heights.15 In both cases the populations were tall despite their low per capita in- comes. If we substitute plausible levels of per capita income that existed in 1800
14 However, see Mandemakers and van Zanden (1993) for an alternative view of the estimates.
15 See Joel Mokyr and Cormac 6' Grada (1988) and Stephen Nicholas and Steckel (1992) for dis- cussions of the Irish case.
Steckel: Stature and the Standard of Living 1917
into Table 4, for example, predicted stat- ure would be roughly 10 centimeters be- low the level observed.16 Put another way, the nutritional status of Americans who survived to adulthood at the turn of the nineteenth century was comparable to the average nutritional status in twen- tieth century countries where per capita income was roughly $10,000 (in 1985 prices), which is many times higher than income estimates for the period.
While there is no firm answer to why Americans were tall despite poverty (conventionally measured), preliminary research suggests several potential expla- nations. First, wealth or income inequal- ity in early America may have been low compared with developing countries in the data base for the regressions, a line of inquiry made attractive by knowledge that average height is sensitive to the Gini coefficient. Income inequality is high in many developing countries and probate records suggest that inequality in wealth was modest in the late eigh- teenth century America (Shail Jain 1975; Alice Jones 1980). A second line of study (discussed in more detail below) explores different experiences with claims on the diet made by disease. Low population density in the late eighteenth century and a temperate climate may have re- duced exposure to communicable dis- eases below that faced by the typical resident of a developing country in the twentieth century.
While I commend efforts to estimate per capita income from average height, the question is what to make of the re- sults. Whether we should take them lit- erally-as an estimate of the market value of goods and services as contem- plated by the national accounts-de- pends upon the stability of the height-
income relationship and on the implica- tions of other evidence that bears on the level of economic activity. If other influ- ences on stature, such as inequality and the state of public health, were similar between the base and the forecast peri- ods and if the estimated levels of per capita income are plausible considering other information, then we might take them literally. However, in the case of early America we have good reason to believe that the inferred level of per cap- ita income is not credible-Americans were simply not as rich, in conventional terms, as their average heights and the height-income relationship estimated from twentieth century data would sug- gest. Nevertheless, the exercise is useful. The excess of per capita income inferred from stature over the level thought to prevail from other evidence is a measure of welfare that Americans enjoyed above that suggested by conventional mea- sures. In turn, this finding has led to a research agenda designed to explain why Americans were relatively healthy but poor two centuries ago.
E. Stature and the Concept of Living Standards
Although economists widely debated the welfare basis of the national income accounts in the 1930s, the system that emerged from the economic crisis of that era was, understandably, based on pro- duction. With the revival of interest in social accounting, various branches of re- search have followed. One seeks to en- hance the scope of GNP as a measure of production by imputing the value of items omitted from their purview, such as home production and leisure. While I encourage these useful efforts, even a perfectly comprehensive and interna- tionally comparable estimate of produc- tion has significant flaws as a measure of human welfare. Production statistics tell us nothing directly about the intensity or
16 One obtains a gross domestic product per capita in 1800 of approximately $840 by converting data in Thomas Weiss (1992), variant C of Table 1.2, into 1985 prices.
1918 Journal of Economic Literature, Vol. XXXIII (December 1995)
safety of work, health conditions, the dis- tribution of output within the popula- tion, and disamenities of life such as crime, congestion, or pollution. Nor do they inform us about opportunities for social and economic mobility, and the state of religious and political freedom. Therefore, a second line of research ad- justs or modifies GNP by estimating the costs or benefits of important conditions of life ignored by the national accounts. No widespread agreement, much less consensus, exists on the items to be in- cluded in the adjustment or the method- ology for evaluating the items. A third line of research, which identifies multi- ple indicators of the standard of living as in the second line of research, essentially concludes that the methodology for evaluating an adequate list of multiple indicators-the appropriate techniques for assigning monetary amounts-is im- possibly complex. Instead, this research tabulates welfare indexes by assigning reasonable, but debatable, weights to various indicators of the quality of life. Recognizing the difficulty in justifying weights as reasonable, some adherents to this approach accept the intractable na- ture of the problem and simply recom- mend comparisons of individual indica- tors.
Though distinct, heights are similar to other measures of living standards. Stat- ure is not a measure of production, but average height correlates highly with the log of it at the national level in the past century. Heights fit easily within the framework of the multiple indicators ap- proach as a measure of health. Though relatively little research has been done on the question, in principle it would be possible to adjust GNP using stature as a guide to aspects of the quality of life omitted by the national accounts. This would require estimates of the value that individuals or societies place on a unit of height along with knowledge of ways that
the accounts already incorporate expen- ditures that influence height.
Average height is particularly adept at sensing the degree of deprivation, a fea- ture that places the measure nicely within the basic needs approach to living standards. Although one may question the definition of basic, as a measure of net nutrition average height finesses the problem by recognizing needs created by factors such as a harsher disease environ- ment or heavy work loads. In this vein, average height is also conceptually con- sistent with Sen's framework of function- ings and capabilities, though, of course, height registers primarily conditions of health during the growing years as op- posed to one's status with respect to commodities more broadly.
Average height also meets satisfacto- rily the criteria set forth by M. Morris (1979, ch. 4) for an international stan- dard of the physical quality of life: (1) It should not assume that there is only one pattern of development. In other words the measure should be adaptable to di- verse societies including those with mod- ern economic structures, village econo- mies, or tribal systems; (2) It should avoid standards that reflect the values of specific societies; (3) It should measure results, not inputs; (4) It should reflect the distribution of social results; (5) It should be simple to construct and easy to comprehend; and (6) It should lend itself to international comparison. Stature ob- viously measures results, not inputs, and the regression analysis made clear that the measure is sensitive to the distribu- tion of income. Moreover, measurements of stature are simple to construct, easy to comprehend, and amenable to a variety of economic structures and to interna- tional comparison once investigators rec- ognize differences in genetic potential that may exist. One can allow for genetic differences by comparing stature relative to percentiles attained on the appropri-
Steckel: Stature and the Standard of Living 1919
TABLE 6 LONG-TERM TRENDS IN THE STATURE OF ADULT MEN (CM)
Approximate Country Date U.S. U.K. Sweden Norway Netherlands France Austria/Hungary
1750 172 165 167 165 166
1800 173 167 166 166 163 163
1850 171 166 168 169 164 167
1900 171 167 172 171 169 165
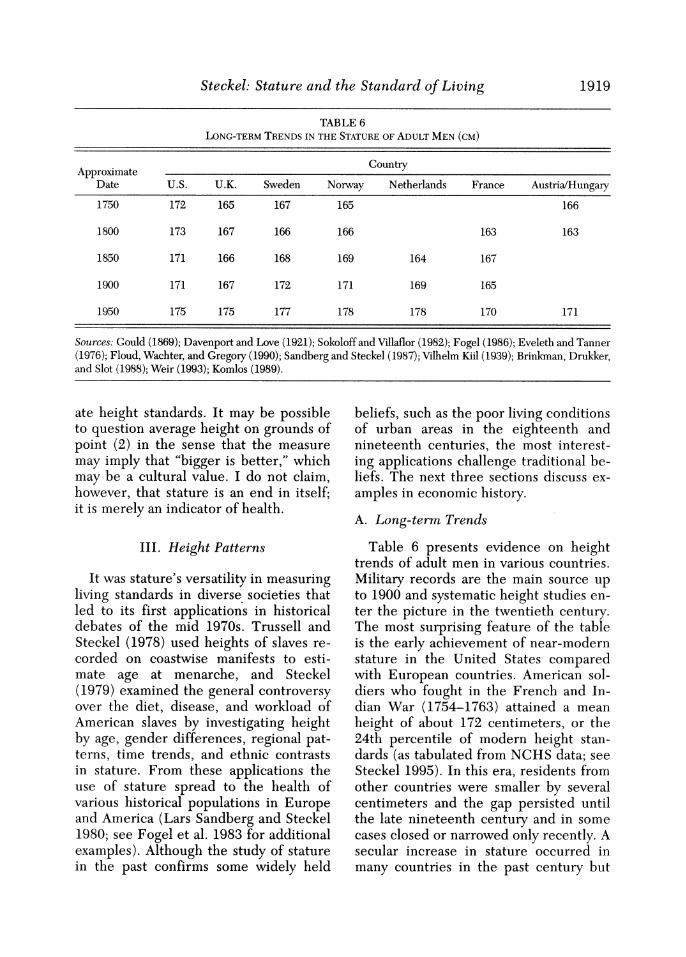
1950 175 175 177 178 178 170 171
Sources: Gould (1869); Davenport and Love (1921); Sokoloff and Villaflor (1982); Fogel (1986); Eveleth and Tanner (1976); Floud, Wachter, and Gregory (1990); Sandberg and Steckel (1987); Vilhelm Kiil (1939); Brinkman, Drukker, and Slot (1988); Weir (1993); Komlos (1989).
ate height standards. It may be possible to question average height on grounds of point (2) in the sense that the measure may imply that "bigger is better," which may be a cultural value. I do not claim, however, that stature is an end in itself; it is merely an indicator of health.
III. Height Patterns
It was stature's versatility in measuring living standards in diverse societies that led to its first applications in historical debates of the mid 1970s. Trussell and Steckel (1978) used heights of slaves re- corded on coastwise manifests to esti- mate age at menarche, and Steckel (1979) examined the general controversy over the diet, disease, and workload of American slaves by investigating height by age, gender differences, regional pat- terns, time trends, and ethnic contrasts in stature. From these applications the use of stature spread to the health of various historical populations in Europe and America (Lars Sandberg and Steckel 1980; see Fogel et al. 1983 for additional examples). Although the study of stature in the past confirms some widely held
beliefs, such as the poor living conditions of urban areas in the eighteenth and nineteenth centuries, the most interest- ing applications challenge traditional be- liefs. The next three sections discuss ex- amples in economic history.
A. Long-term Trends
Table 6 presents evidence on height trends of adult men in various countries. Military records are the main source up to 1900 and systematic height studies en- ter the picture in the twentieth century. The most surprising feature of the table is the early achievement of near-modern stature in the United States compared with European countries. American sol- diers who fought in the French and In- dian War (1754-1763) attained a mean height of about 172 centimeters, or the 24th percentile of modern height stan- dards (as tabulated from NCHS data; see Steckel 1995). In this era, residents from other countries were smaller by several centimeters and the gap persisted until the late nineteenth century and in some cases closed or narrowed only recently. A secular increase in stature occurred in many countries in the past century but
1920 Journal of Economic Literature, Vol. XXXIII (December 1995)
180 71
178 70
Ohio National Guard 176I
69 *
.O174 L
68 . 172
170 67
Interpolation based on Ohio National Guard
168 66
1700 1720 1740 1760 1780 1800 1820 1840 1860 1880 1900 1920 1940 1960 1980 Year of birth
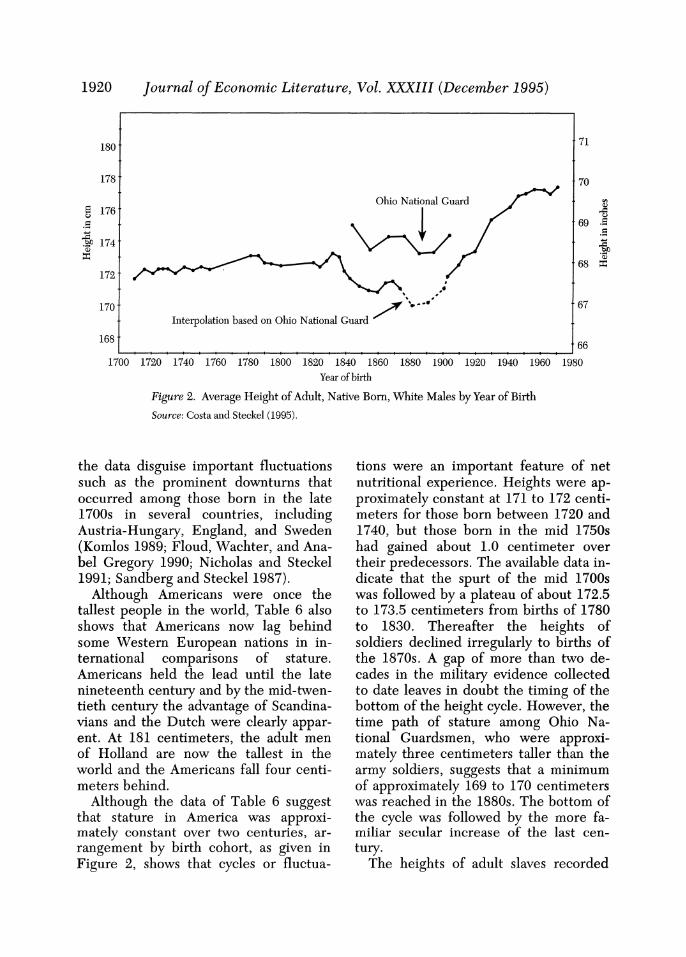
Figure 2. Average Height of Adult, Native Born, White Males by Year of Birth
Source: Costa and Steckel (1995).
the data disguise important fluctuations such as the prominent downturns that occurred among those born in the late 1700s in several countries, including Austria-Hungary, England, and Sweden (Komlos 1989; Floud, Wachter, and Ana- bel Gregory 1990; Nicholas and Steckel 1991; Sandberg and Steckel 1987).
Although Americans were once the tallest people in the world, Table 6 also shows that Americans now lag behind some Western European nations in in- ternational comparisons of stature. Americans held the lead until the late nineteenth century and by the mid-twen- tieth century the advantage of Scandina- vians and the Dutch were clearly appar- ent. At 181 centimeters, the adult men of Holland are now the tallest in the world and the Americans fall four centi- meters behind.
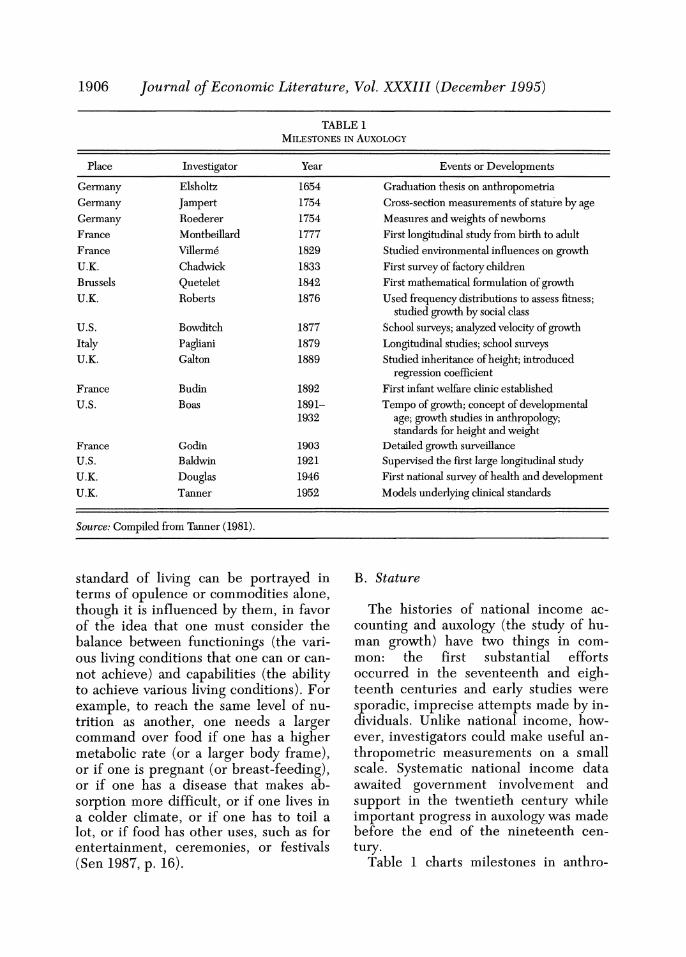
Although the data of Table 6 suggest that stature in America was approxi- mately constant over two centuries, ar- rangement by birth cohort, as given in Figure 2, shows that cycles or fluctua-
tions were an important feature of net nutritional experience. Heights were ap- proximately constant at 171 to 172 centi- meters for those born between 1720 and 1740, but those born in the mid 1750s had gained about 1.0 centimeter over their predecessors. The available data in- dicate that the spurt of the mid 1700s was followed by a plateau of about 172.5 to 173.5 centimeters from births of 1780 to 1830. Thereafter the heights of soldiers declined irregularly to births of the 1870s. A gap of more than two de- cades in the military evidence collected to date leaves in doubt the timing of the bottom of the height cycle. However, the time path of stature among Ohio Na- tional Guardsmen, who were approxi- mately three centimeters taller than the army soldiers, suggests that a minimum of approximately 169 to 170 centimeters was reached in the 1880s. The bottom of the cycle was followed by the more fa- miliar secular increase of the last cen- tury.
The heights of adult slaves recorded
Steckel: Stature and the Standard of Living 1921
on the coastwise manifests also displayed cycles (Steckel 1979). Those born in the 1770s reached, on average, about 171.3 centimeters, which corresponds to the 20th percentile of modern NCHS stan- dards. Then the mean declined to 169.6 for those born in the early 1790s, after which there was an irregular recovery to about 171.5 centimeters by those born in the late 1820s. The measurements of children point to increasing net nutri- tional hardship for those born after 1830; the stature of adolescents aged 12 to 17 who were born in the early 1840s was over five centimeters below that of chil- dren the same age born only 10 to 15 years earlier. Because those born in the early 1840s did not reach adulthood be- fore the recording system ended, it is un- known whether these children were stunted as adults.
B. Geographic Differences
Several studies have noted differences in height by state or region within the United States. Residents of the North- east were short while those who lived in the South or the West were frequently tall, a pattern that may have begun as early as the Colonial Period. Among troops of the French and Indian War, southerners were 0.5 centimeters taller than those from the Middle Atlantic States (Kenneth Sokoloff and Georgia Villaflor 1982). The north-south gradient also appeared during the American Revolution when southerners were 0.8 above those from the Middle Atlantic states, and 1.3 centimeters taller than New Englanders. Using a different sam- ple and a more refined geographic grid, Theodore Steegmann and P. A. Haseley (1988) report, however, that French and Indian War troops were tallest (173.5 centimeters) from noncoastal eastern Massachusetts, noncoastal Connecticut, and the mid-Hudson Valley and declined as one moved south to 169.2 centimeters
for these from Delaware, southeastern Pennsylvania, and eastern Maryland.
The disadvantage of the Northeast was clear during the Civil War, World War I, and World War II. At ages 27 to 30 Union troops from Kentucky and Ten- nessee were tallest (175.5) followed by other slave states and the Midwest at ap- proximately 174.7, New England (173.4), and the Middle Atlantic states at 172.8 (Benjamin Gould 1869, p. 123). The World War I recruits were shortest from the Northeast (about 169.5) and tallest from the South at approximately 173.0 (Charles Davenport and Albert Love 1921, p. 75). During World War lI the tallest inductees were from the West (174.6) followed by the South Central (174.2), the North Central (173.2), the Southeast (173.1), and the Northeast at 171.6 (Bernard Karpinos 1958). During the mid 1800s West Point cadets from the South were about one percent taller than those from the Middle Atlantic States and the West (Komlos 1987). It should be noted that the secular decline in stature of the nineteenth century, noted above, occurred despite the rela- tive shift of population out of the low stature states of the Northeast and into western environments more favorable to human growth.
Among southern whites who signed amnesty oaths during the 1860s, those from the interior states of Kentucky, Tennessee, Missouri, and Arkansas tended to be 0.8 to 1.8 centimeters taller than residents from the lower coastal states such as Alabama, Louisiana, South Carolina, and Texas (Margo and Steckel 1992). A similar but less pronounced re- gional pattern existed among ex-slave re- cruits. The former slaves from South Carolina were particularly small, falling 2.3 centimeters below those from Ken- tucky or Tennessee.
The slight growth advantage observed for people from urban areas in modern
1922 Journal of Economic Literature, Vol. XXXIII (December 1995)
data is probably a new phenomenon. As recently as World War II, the troops from areas of 2,500 people or less were 1.2 centimeters taller than those from communities of 500,000 or more. In the late nineteenth century Ohio National Guard recruits from rural areas were about 0.5 centimeters taller than urban recruits (Steckel and Donald Haurin 1982). Earlier in the century the advan- tage of rural residence was larger: Civil War troops from cities and towns of 10,000 or more people were 1.3 centime- ters shorter than their country counter- parts. A similar advantage for rural resi- dents prevailed among regular army troops measured between 1815 and 1820, but a half a century earlier there were no statistically significant rural-ur- ban differences.
Although adult European men were smaller than Americans before the twen- tieth century, considerable geographic diversity prevailed within Europe. In the early nineteenth century the Irish and the Scots were the tallest at approxi- mately 168 centimeters (Nicholas and Steckel 1992), followed by residents of Norway, Sweden, England, France, and Austria-Hungary, the latter averaging about 163 centimeters. Some reversals of the pattern occurred in this century when Scandinavians and the Dutch be- came the tallest, averaging approxi- mately 177 to 178 at mid-century fol- lowed by the Americans, the British, the French, and the Austrians (Eveleth and Tanner 1976).
C. Socioeconomic Patterns
Systematic height differences existed by occupation, place of birth, and condi- tion of the population (whether white, free black, or slave). In general, the oc- cupational differences were larger dur- ing the nineteenth century than during the present century or the late Colonial Period, and occupational contrasts were
larger in Europe compared with the United States. Among World War II re- cruits, all but the shortest occupation clustered within 0.5 centimeters and the tallest, farmers and farm laborers, was only 1.2 centimeters larger than the shortest-clerks and kindred workers (Karpinos 1958). Half a century earlier in Ohio the range exceeded two centime- ters: professionals were tallest at 175.5 followed by farmers (174.7), clerical and skilled workers (174.0), and laborers (173.3) (Steckel and Haurin 1982). Union troops who were farmers were 0.4 centimeters taller than white collar workers, who were 0.8 centimeters taller than skilled artisans, who were 0.9 centi- meters taller than laborers (Margo and Steckel 1983). West Point cadets whose fathers were farmers were 1.1 percent taller than the shortest group, whose family background was in blue collar work (Komlos 1987). In the French and Indian War, sample farmers were about 1.5 centimeters taller than artisans or la- borers but the occupational differences vanished among troops of the American Revolution (Sokoloff and Villaflor 1982).
Differences in average height by social class or occupation are a useful indicator of inequality in the biological standard of living. Before the twentieth century, oc- cupational or class differences in stature were usually several centimeters larger in Europe compared with the United States. In eighteenth century Germany, for example, children of aristocrats were 8 to 10 centimeters taller than children of the lower classes, an advantage that closed somewhat as adults (Komlos 1990). The advantage of the upper classes was even larger in nineteenth century England, where 14 year old Sandhurst boys, who attained approxi- mately the 15th centile of modern NCHS height standards, exceeded the stature of those from the slums of Lon- don (taken in by the Marine Society) by
Steckel: Stature and the Standard of Living 1923
10 to 15 centimeters (Floud, Wachter, and Gregory 1990). Nearly every Sand- hurst boy was taller than any boy at the Marine Society.17
Because European residents were sev- eral centimeters shorter than Americans, it is not surprising that the foreign born were smaller than the native born throughout the period. Yet the advantage of the native born was substantially less than the difference in average heights between Europe and America, which in- dicates that trans-Atlantic migrants may have been taller and in better health than those who remained behind. It is also possible that newcomers from Europe who were still growing benefited from improved nutrition after arrival. The native born Ohio National Guard re- cruits of the late nineteenth century, for example, were 2.1 centimeters taller than those who were foreign born. The difference in favor of the native born was about 3.2 centimeters for Union Army recruits, and two to 4.8 centimeters for troops of the French and Indian War or the American Revolution.
Although the adult heights of free blacks in Maryland, of northern whites, and of slaves differed by less than three centimeters, comparisons of growth pro- files from early childhood to maturity make clear that slaves were remarkably different (Steckel 1986b, 1987a; Komlos 1992). Slave children were extraordinar- ily small, approaching the early child- hood heights of the Bundi of New Guinea. The mean heights of boys and girls fell below the 0.5 percentile of modern NCHS height standards before age 6 and reached approximately the first percentile at age 10. Average heights in this neighborhood occasionally
exist in developing countries or in poor countries of the past, but in these set- tings the nutritional status was similar in children and adults. American slaves were remarkable because the children were small and catch-up growth was large if not unprecedented.'8 Their ado- lescent growth spurt was vigorous, with an age at peak velocity of 13.3 years in females and 14.8 years in males, only one to 1.5 years later than well-nourished modern populations. Prolonged growth helped bring slave adults to the 17th (male) or 20th (female) percentile of modern standards.
IV. Possible Explanations
A. Slaves
The web of evidence surrounding the unusual pattern of slave growth suggests that newborns received a poor start in life. The infant mortality rate was ap- proximately 350 per thousand, and losses for those aged one to four were about 201 per thousand on large plantations (Steckel 1986a, 1986c). Poor medical knowledge and practices of the era claimed many children, but slave losses before age five were roughly double those of whites who lived in the United States from 1830 to 1860. Regional dif- ferences in the survival rates of whites suggest that only a portion of the excess losses (perhaps 15 to 30 percent) is at- tributable to a harsh disease environ- ment or other factors affiliated with resi- dence in the South (Steckel 1988). Although the vigorous adolescent growth spurt indicates that workers were well fed, seasonal patterns of neonatal mor- tality and -plantation work records in-i-
17 Sandhurst boys were children of the aristoc- racy, professionals, and the higher ranks of the Army and Navy. It is possible that some of their height advantage stems from recruitment of taller individuals as officers.
18 Certificates of freedom, obtained to travel outside the immediate vicinity in 1806 to 1864, show that free blacks in NMary and attained about the 10th percentile of modern standards as chil- dren (average at ages 4 through 10) and the 14th (male) to the 17th (female) percentile as adults (Komlos 1992).
1924 journal of Economic Literature, Vol. XXXIII (December 1995)
cate that pregnant women had an ardu- ous work routine during peaks in the de- mand for labor such as the plowing, planting, and harvesting seasons. The la- bor demands of the institution are clear from estimates that slaves produced about 30 percent more output per year than free farmers (Fogel and Stanley Engerman 1974). A number of features of slave skeletons from the Colonial and the ante-bellum period document the strenuous physical labor demands, par- ticularly in areas of the shoulders, hips, and lower vertebrae (Jennifer Kelley and J. Lawrence Angel 1987; Ted Rathbun 1987). Claims on the diet placed by work were exacerbated by malaria and other fevers common during the "sickly sea- son" of late summer and early autumn. It is also likely that vitamin and mineral de- ficiencies, such as iron, calcium, Vitamin C, and niacin, aggravated overall mater- nal ill health. Because stillbirths and neonatal deaths are sensitive to depriva- tion at or near conception, and depriva- tion during the third trimester increases neonatal deaths, it is likely that seasonal nutritional deprivation of the fetus was an important ingredient in poor infant health.
Although poor prenatal care and low birthweights underlay many neonatal deaths and contributed to high losses in the post-neonatal period and beyond, a poor diet and infections also entered the picture. Slave women usually resumed regular work within three to five weeks after delivery, and while mothers were in the field the young children typically re- mained in the nursery. Initially the mothers returned two or three times per day for breast feeding but within three months after delivery their productivity in the field reached normal levels, which suggests that planters eliminated one or more of the day-time breast feedings. As a substitute the infants received starchy paps and gruels, often contaminated or
fed using contaminated utensils. Thus, young children who survived the hazard- ous neonatal period faced a poor diet that emphasized hominy and fat, and owners and medical practitioners fre- quently cited nutrition-sensitive dis- eases, such as whooping cough, diarrhea, measles, worms, and pneumonia as causes of death. Concentrations of chil- dren on medium and large plantations probably promoted the spread of these diseases.
By ages 8 to 12 work entered the pic- ture of slave health. Ceteris paribus, in- creased physical activity would have placed a claim on the diet that retarded growth. Yet, it was at ages that work usu- ally began, initially as a light activity, that some catch-up growth occurred (Steckel 1986b). Other things must not have been equal. Specifically, slave workers received regular rations of meat (about one-half pound of pork per day) and corn, foods often supplemented by garden produce, chickens, pigs, and game acquired by slaves. In addition, as slaves matured they may have become more experienced and efficient at their work, using less wasted motion, thereby leaving more nutrition from a given diet for growth. A substantial incidence of Harris lines on leg bones uncovered from a South Carolina plantation point to late childhood and adolescence as the major period of recovery from depriva- tion (Rathbun 1987). The strong catch- up growth as teenagers and workers rein- forces the view that nutrition was at least adequate, if not exceptional, for the tasks performed by slaves.
Caribbean slave children were ap- proximately as small as slave children in the United States but the Caribbean population displayed much less recovery, attaining only the 2nd to the 8th percen- tile of modern NCHS standards as adults (Barry Higman 1984). In the Caribbean, the age at peak velocity was about 14.7
Steckel: Stature and the Standard of Living 1925
years for males and 13 years for females. The pattern of stunting with relatively little delay may have been caused by lib- eral rations of rum given to all working slaves, including pregnant women. It is also possible that the strenuous work of Caribbean sugar plantations that began in adolescence contributed to the mea- ger catch-up growth.
B. Long-term Trends in Europe and America
Why did Americans achieve near-mod- ern heights as early as the mid-1700s while Europeans lagged more than a century behind? The large differences in stature by social class within Europe be- fore the end of the nineteenth century indicate that the European climb to modern height standards involved very large gains for the lower and middle classes. The available evidence points to several possible causes of the American height advantage, including a good diet, a low incidence of epidemic disease, and widespread access to land and other re- sources. The abundance of good land in America enabled farmers to choose only the most productive plots for cultivation, resulting in less physical effort (after clearing the land) for a given amount of output, compared with European farm- ers. In addition, most of the population nestled along the coast between two sources of protein-fish from the Atlan- tic and game from the forests-and am- ple land was available to support live- stock.
Although a poor diet has been empha- sized by some researchers as a source of high European mortality rates (see Thomas McKeown 1976), estimates of agricultural production and new results in energy cost accounting help quantify the importance of diet in the height ad- vantage of Americans over eighteenth and early nineteenth century Europeans. According to Fogel (1994), the output of
food was so low in many European coun- tries that a substantial segment of the population was malnourished. Estimates of agricultural productivity and surveys of food purchases in England indicate that daily caloric consumption was ap- proximately 2,060 calories per person in 1790 (Fogel 1994). In France during this era, daily consumption was about 1,800 calories. A typical American male in his early thirties requires nearly 2,300 calo- ries for baseline maintenance, and by im- plication the typical European of the late eighteenth century was much smaller and lighter. This evidence indicates that the diets in England and France near the end of the eighteenth century were so inadequate that approximately one-fifth of the labor force was incapable of work or could do no more than three hours of light work daily. According to this analy- sis, the growth in agricultural productiv- ity of the nineteenth century was an important factor that alleviated malnutri- tion, promoted physical growth, and re- duced mortality rates in Europe.
Low population density conferred a second advantage for health of Ameri- cans over Europeans. The dispersion of population tended to reduce the spread of communicable diseases that lessened the ability to work and that claimed nu- trition from the diet. Researchers have noted the benefits for health of geo- graphic isolation, low population density, or lack of commercial development for outlying areas within Sweden, Austria- Hungary, Japan, and the American South (Sandberg and Steckel 1987; Komlos 1989; Ted Shay 1986; Margo and Steckel 1982,1992).
The available evidence suggests that income and wealth were distributed more equally in the United States during the late Colonial Period than at any time except the mid-twentieth century and that inequality in the 1700s was probably much less in the United States compared
1926 Journal of Economic Literature, Vol. XXXIII (December 1995)
with Europe (Gallman 1978; Jones 1980; Williamson and Lindert 1980). As noted earlier in the paper, greater equality in access to resources, at a given level of income, tends to increase the average height of a population. Redistribution from the rich to the poor decreases the heights of the rich by less than the in- crease in the heights of the poor, assum- ing, of course, that the poor had not reached their growth potential.
Heterosis, or an increase in adult size attributable to outbreeding (marriage to unrelated persons) has been cited as a possible influence on adult stature. Out- breeding increases with population mo- bility, which is a function of transporta- tion costs. However, empirical evidence suggests that the effect of heterosis on stature is minor (Tanner 1978, p. 153).
C. Cycles in Height
Several counties including Sweden, England, Austria-Hungary, and the United States have experienced cycles in heights. Although cycles are not unusual, the episode of stature decline that began in the United States during the second quarter of the nineteenth century is par- ticularly intriguing to economic histori- ans because it appears to challenge firm beliefs that the middle decades of the nineteenth century were prosperous by conventional measures. The cycles in Europe are interesting for the light they shed on one of the oldest debates in eco- nomic history, living standards during the Industrial Revolution, and for their insights into preindustrial fluctuations in health status.
American industrialization began in the Northeast early in the 1800s and by the middle of the century the economy achieved modern economic growth, or sustained increases in real per capita in- come of one to 1.5 percent or more per year (Gallman 1966). This prosperity also registers in estimates of real wages,
productivity improvements in agriculture and manufacturing, and in increases in the capital stock per capita (Claudia Goldin and Margo 1992; Winifred Rothenberg 1992; Gallman 1992). Re- gional estimates of per capita income in- dicate that the Northeast was relatively prosperous in the mid 1800s, yet the military data show that this region had the lowest average stature (Richard Eas- terlin 1961)
When the mid-nineteenth century de- cline in stature was first discovered about 15 years ago, economic historians were initially skeptical and many favored alternative explanations, including sam- ple selectivity and composition effects. The accumulation of a strong web of evi- dence since that time has persuaded many observers that a downturn and eventual recovery in health occurred (though its magnitude and timing are debatable) and a small industry has emerged to probe its dimensions, sources, and implications. A height decline in the second quarter of the nineteenth century is clearly visible in the huge number of conscripts measured by the Union Army during the Civil War (Gould 1869, ch. 5, Table 6). The down- turn also appears in an independent source of evidence, Ohio National Guardsmen measured after the Civil War, and the temporal pattern in the stature of Union Army troops remains af- ter controlling for place of residence, oc- cupation, and other factors (Steckel and Haurin 1982; Margo and Steckel 1983). West Point cadets fell in stature among those born after approximately 1830 and data from regular army enlistments fol- lowing the Civil War indicate that the decline continued for those born in the years immediately following the Civil War (see Figure 2; Komlos 1987). Al- though the evidence collected to date is geographically thin for the next three decades, heights of the Ohio National
Steckel: Stature and the Standard of Living 1927
Guard and of Citadel cadets reached a trough for those born in the 1880s or early 1890s, and data for World War II troops arranged by year of birth show the modern secular increase in stature began around the turn of the century (Steckel and Haurin 1982; Peter Co- clanis and Komlos 1995; Karpinos 1958). Skeletal evidence also identifies the re- covery underway at the turn of the twen- tieth century and suggests that a low point in stature was probably reached among those born in the 1880s (Mildred Trotter and Goldine Gleser 1951). More- over, mortality evidence from genealo- gies and from plantation records indicate that life expectancy deteriorated while heights declined during the ante-bellum period (Clayne Pope 1992; Steckel 1979). Although genetic drift cannot be ruled-out as a factor in the height pat- terns, I note that modern populations show little evidence of drift in stature when living conditions are approximately constant.19 Moreover, we know that stat- ure is sensitive to the environment and plausible explanations linked to changing environmental conditions are discussed below.
Explanations should recognize that traditional national income accounting measures, real wage series, and average heights focus on different aspects of liv- ing standards. The first two emphasize market behavior and various imputations for productive activity while average height reflects net nutrition and the dis- tribution of income or wealth. Thus, a particular type of prosperity accompa- nied industrialization while other aspects of the standard of living deteriorated. Ceteris paribus, the measured economic prosperity of the mid 1800s should have increased average stature. The height decline suggests that other things must
not have been equal. Specifically, nutri- tional liabilities (claims on nutrition or lower nutritional intake) that more than offset the advantages bestowed by higher incomes must have accompanied the economic prosperity.
Moreover, the height-income relation- ship was probably weaker in the mid- nineteenth century compared with the modern period. In the absence of the germ theory of disease to guide decision- making, those with higher incomes had less accurate information on expendi- tures that would enhance health. The finding that wealth conveyed little ad- vantage for child survival in the mid- nineteenth century is consistent with this point of view (Steckel 1988; Eric Leif Davin 1993). Thus, the beneficial aspects of income growth per se for stature may have been small and easily offset by claims on the diet imposed by other fac- tors associated with income growth.
The search for understanding should recognize that most of the mid-nine- teenth century height decline occurred within the rural population, a point illus- trated by some calculations. Only a small share of the population lived in cities be- fore the Civil War and the height differ- ences were modest between farmers and residents of large urban areas. Six per- cent of the U.S. population lived in places of 10,000 or more people in 1830 and as late as 1860 it was only 14.8 per- cent (U.S. Bureau of the Census 1975, Series A 57-72). Soldiers who were born in urban areas of 10,000 or more popula- tion were approximately 3.3 centimeters inches shorter than farmers (Margo and Steckel 1983). Therefore, the increase in the share living in these urban areas of 14.8 - 6.0 = 8.8 percent would explain roughly 0.088 x 3.3 = 0.29 centimeters, or about 12 percent of the 2.5 centime- ter height decline between 1830 and 1860.
Data for the Ohio National Guard fol- 19 Genetic issues are discussed in Tanner (1978)
and Eveleth and Tanner (1976).
1928 Journal of Economic Literature, Vol. XXXIII (December 1995)
lowing the Civil War indicate that height declines were moderate in large urban areas. Compared with those born before 1880, the heights of cohorts born in 1880-1896 declined 0.25 centimeters among farmers, 2.0 centimeters among the non-farm rural population, 0.25 cen- timeters among residents in small cities, and 2.3 centimeters among residents in cities with 50,000 or more population (Steckel and Haurin 1982). Between 1870 and 1900 the share of the popula- tion living in urban places of 50,000 or more population increased from 12.7 percent to 22.3 percent (U.S. Bureau of the Census 1975, Series A 57-72). This evidence suggests that urbanization played a supporting role in the height decline of the late nineteenth century.
Among additional explanations under study, one emphasizes the sensitivity of average heights to the distribution of in- come or wealth. Based on the regression reported in Table 4, a rise of 0.17 in the Gini coefficient over the period 1830 to 1890 would have offset the rise in per capita income and account for a decline of four centimeters in average stature. The modest evidence on wealth or in- come distributions and wage ratios in the U.S. during the nineteenth century has evoked controversy (see Williamson and Lindert, 1980, and the critique in Carole Shammas 1993) but it seems plausible that growing inequality might have con- tributed to the cyclical decline in stature. The most recent evidence on skill differ- entials indicates that the wages of clerks rose faster than the wages of unskilled or other skilled labor from the 1820s through the 1850s, but one must recall that factors other than wage ratios, in- cluding hours worked and returns on property income, also affect the distribu- tion of income (Goldin and Margo 1992, p. 77). Direct evidence on inequality comes from matching household heads in the manuscript schedules of the popu-
lation census with real and personal property tax lists. The Gini coefficient of taxable wealth rose by 24 percent from 1820 to 1900 in industrializing Massa- chusetts and by seven percent in Ohio from 1830 to 1900 (Steckel 1994). That heights of upper class men (students at Amherst and Yale; see Milicent Hathaway and Elsie Foard 1960, p. 29) rose from 171 to 173 centimeters while those of the Ohio National Guard de- clined by several centimeters is consis- tent with growing inequality in the sec- ond half of the nineteenth century. In contrast, Lee Soltow (1992) concludes from evidence on trends in housing ex- penditure, literacy, schooling, and other phenomena, that little change in the dis- tribution of the standard of living occurred from 1800 to 1860. Given the income growth in the period, the redis- tribution argument is effective in ex- plaining the height decline only if in- equality increased fast enough to more than offset the health gains attributable to rising average incomes. On this point, the nineteenth century decline in birth- weights in Boston and Montreal charity hospitals suggests the poor may have suf- fered a loss in nutritional status (Peter Ward 1993).
Komlos (1987) argues that dietary de- terioration influenced the height decline through a sectoral shift in production that occurred during industrialization. According to this view, urbanization and the expansion of the industrial labor force increased the demand for food, and simultaneously, productivity per worker and the agricultural labor force grew slowly, causing a decline in food production (especially meat) per capita. Komlos notes that in the 1830s, grain prices rose faster than wages and the price of food rose relative to prices of industrial products. It would be possible to test the argument that declines in in- puts to net nutrition were responsible by
Steckel: Stature and the Standard of Living 1929
examining information on diets, cooking and food preparation technology, and systems of food distribution. However, the most recent survey of research in this area suggests that dietary deteriora- tion did not occur after 1825, though more research is clearly needed (Lorena Walsh 1992).
Other hypotheses focus on the nutri- tional costs of infectious disease created by higher rates of interregional trade, migration, public schooling, and immi- gration, and the push of midwestern farming into marshy and river-bottom lands that hosted malaria. Migration and trade increase morbidity and mortality by spreading communicable diseases and by exposing newcomers to different dis- ease environments, adverse conse- quences that could have been substantial before public health measures were ef- fective (Philip Curtin 1989). Indeed, prior to the late nineteenth century geo- graphically isolated, preindustrial popu- lations in sparsely settled regions were often tall, as discovered in Ireland, the interior of the American South, Austria- Hungary, Sweden, and Japan. The chol- era epidemics from the 1830s through the 1860s are well-known examples of disease transmission that illustrate this point (Charles Rosenberg 1962). The epidemic of 1832, for example, entered the continent at New York, Quebec, and New Orleans, and spread by travelers along the major routes. The importance of immigration to disease transmission is confirmed by positive correlations be- tween immigration rates and urban mor- tality rates and by information that epi- demics often spread from immigrant districts to other areas (Richard Meckel 1985). The high degree of churning in population movements from rural to ur- ban areas may help to explain the rural character of the height decline. Low per- sistence rates in moves from farms to cit- ies and towns indicate that rural-to-ur-
ban migrants often returned after short periods of time, bringing communicable diseases with them (Steckel 1987b). Westward migration led to encounters with malaria, particularly in the numer- ous marshy and river-bottom areas of the Midwest. Travel accounts, memoirs, army statistics, and medical journals es- tablish that malaria was a substantial sea- sonal health problem in the Midwest un- til the late nineteenth century.
Scholars have documented the rise of public schools in the second quarter of the nineteenth century and studied the contributions of education to human capital formation, but the health effects of schooling on children are less well known. Studies in modern settings estab- lish that concentrations of population harbor and spread disease. Data from the nineteenth century also show that while wealth had no systematic effect on childhood survival, the chances of sur- vival decreased with the number of sib- lings in the household (Steckel 1988). Therefore it is reasonable to argue that schools spread childhood diseases such as measles, whooping cough, and scarlet fever, which retarded growth.
Changes in labor organization, which led to greater exposure to disease in the work place and may have required more physical exertion by workers, deserves some attention in a list of potential ex- planations. The home manufacturing typical of the eighteenth century dif- fused geographic patterns of work and insulated the population from contagious disease. Those employed at home also progressed at their own pace. In con- trast, factories and artisan establishments that emerged in the 1820s and 1830s concentrated employees in the work place under conditions that increased the risk of exposure to infectious dis- eases (George Rosen 1944). Long hours paced by machines claimed nutrition, and numerous people crowded in dusty
1930 Journal of Economic Literature, Vol. XXXIII (December 1995)
or humid environments, typical of textile mills, led to the spread of tuberculosis and pulmonary illnesses. These condi- tions are important for understanding trends in height because children com- prised a substantial share of the labor force during early industrialization (Goldin and Sokoloff 1982). The geo- graphic spread of industrialization to the Midwest widened the scope of this claim on nutrition.
The adverse consequence for civilian health of large scale wars of the twenti- eth century suggests that the Civil War of the 1860s may have exacerbated the decline in health underway near the mid- dle of the nineteenth century. The war disrupted the production and distribu- tion of food, contributing to dietary stress, and concentrations of troops and large scale migrations affiliated with the war led to the spread of communicable diseases that added to claims on nutri- tional inputs. Postwar disorganization, particularly in the South, may have pro- longed the adverse nutritional conditions.
It is conceivable that new opportuni- ties for trade reduced nutritional intake in rural areas. If the transportation revo- lution made manufactured goods avail- able at low cost, farmers might have traded so much of their farm output that nutrition diminished. If rural residents placed very high value on manufactured goods, their utility could have increased while their diet deteriorated.
The puzzle of height decline in the face of economic growth also applies to the height disadvantage of northeastern residents. Although per capita incomes were relatively high in this region, the population was less well-off as measured by stature. One possible explanation notes the dense settlement, high rate of commerce, industrialization, and sub- stantial immigration into the area. The growing concentration of population in cities and towns after 1820 reinforced
the harmful aspects of this disease envi- ronment. The Northeast also had a smaller supply of good farmland per per- son than the Midwest or the South, which contributed to a higher relative price of food in the region. It is also pos- sible that food imported from the Mid- west lost nutritional value in processing, shipment, or storage.
Numerous explanations can be found for the secular growth in stature that oc- curred from the late 1800s to the mid- twentieth century. Understanding of the germ theory of disease and the rise of the public health movement in the 1880s, with accompanying investments in purified water supplies, vaccinations, and sewage disposal were crucial for pre- venting contagious diseases and improv- ing health in the cities. Higher standards of personal hygiene and improved pre- and post-natal care led to better health for children. Economic growth and higher incomes enabled families to pur- chase better diets, housing, and medical care. The emergence of antibiotics in the 1930s improved the chances of cures for diseases, while health insurance and public health programs increased the ac- cess to modern medicine by the public.
The decline in adult heights of slaves born after 1775, and the subsequent re- covery for those born after the mid 1790s, may be attributed to changes in the concentration of the African born in the American slave population. The Afri- can born were five to ten centimeters shorter than native born or Creole slaves (David Eltis 1982; Higman 1984) and imports were at their highest level from 1780 to 1807. Unfortunately the share of African born is unknown from the slave manifests, but an increase of 15 percent- age points in this share could have ac- counted for about three-quarters of the decline. Because Congress outlawed the African slave trade after 1807 and smug- gling was probably a minor part of popu-
Steckel: Stature and the Standard of Living 1931
lation growth thereafter, the downturn in adolescent heights after 1830 had causes largely unrelated to the African born. Possible explanations include rapid west- ward migration of the 1830s, which helped to spread communicable diseases such as measles, scarlet fever, or whoop- ing cough; the rise of larger plantations, which had more demanding work rou- tines and greater concentrations of chil- dren; and the appearance of epidemic diseases such as cholera. It is also possi- ble that owners reduced rations in re- sponse to an increase in the price of pork.
The longest running controversy in British economic history, the living stan- dard of the working class during industri- alization, received its start in the mid- nineteenth century with the work of Marx and Engels. Protagonists in the de- bate coalesced into "optimists" and "pes- simists" and in a flurry of archival activ- ity following World War II, investigators assembled evidence on trends in per capita income, real wages, and food consumption, and, more recently, they estimated mortality rates from parish re- cords. Far from creating general agree- ment, much less consensus on the course of events, opinions remain divided. Par- ticipants in the debate have questioned methods of statistical analysis and at- tacked evidence for lack of coverage of the population, selectivity biases, or lack of comprehensiveness in measuring the standard of living. Within the past few years evidence on stature has entered the controversy. The largest effort using this evidence, by Floud, Wachter, and Gregory (1991), concluded that health aspects of the standard of living im- proved during the early phase of British industrialization (the late 1700s and early 1800s) and conditions did not dete- riorate until the middle of the nine- teenth century. In a re-analysis of their evidence, separating Army from Marine
units, Komlos (1993) reported that heights declined significantly in the early phase of industrialization, a view congen- ial to his argument that widespread de- clines in health during the late eigh- teenth century led to institutional changes that promoted industrialization in other European countries such as Aus- tria-Hungary (Komlos 1989). Additional evidence on stature from British convicts transported to Australia supports the pessimist case and suggests that nutri- tional status declined faster for women compared with men (Nicholas and Steckel 1991; Nicholas and Deborah Ox- ley 1993).
Cycles in health also occurred in the preindustrial period. In Sweden fluctua- tions in height were an important feature of the environment near the eve of in- dustrialization. It is notable that a down- turn in the stature of adult men of ap- proximately five centimeters occurred in the southern part of Sweden among those born after the 1840s (Sandberg and Steckel 1988). The decline coincided with a rise in the mortality rates of young children, but not adults, from nutrition- sensitive diseases such as measles, scar- latina, and whooping cough. These events took place in an environment of modest income growth. Sandberg and Steckel (1988) attribute the pattern to growing inequality in the income distri- bution, such that poorer families (espe- cially those with children) saw their in- comes decline, and to a sequence of bad harvests. In a review of the evidence, Jo- han Soderberg (1989) favors a growing workload hypothesis in which farmers cleared and tilled increasingly marginal land.
IV. Stature in Developing Economies
Although economic historians and de- velopment economists use stature, simi- larities and differences in their goals and
1932 [ournal of Economic Literature, Vol. XXXIII (December 1995)
methods are worth noting. Both seek to chart the course of health-aspects of the standard of living and to understand the forces that impinge on health and human growth. Yet, the types of data readily available and immediate research inter- ests have shaped contrasting research profiles in these areas.
In an attempt to explain long-run changes in the standard of living, eco- nomic historians have assembled height series to shed light on a past that is dimly lit from the other sources. They have studied cross-section height patterns for insights into social and economic in- equality and for the suggestions they of- fer about potentially significant forces of change over time. Both the time-series and the cross-section data on stature, along with other evidence, are used to address fundamental questions of eco- nomic, social, and political history.
Policy implications may follow from the work of economic historians but de- velopment economists give foremost pri- ority to this area of study. In this re- search, stature and other measures of health are used to monitor socioeco- nomic conditions and to evaluate policy. The World Bank, the United Nations, and other international organizations have been active in monitoring health status, particularly of children, by sup- porting a series of household-level sur- veys. Efforts such as the Living Stan- dards Surveys of the World Bank and related data bases such as ICRISAT (In- ternational Crops Research Institute for the Semi-Arid Tropics), typically record not only height, weight, age, and gender of individuals but a host of household and community socioeconomic data use- ful for analyzing the results. Using stat- ure and other variables as measures of health status, this work probes the deter- minants of health, knowledge of which is important for devising effective health policies on nutrition. For example, re-
cent studies have investigated the effects on child health of the mother's wage, mother's education, land ownership, and community inputs such as hospitals and nurses (see, for example, Duncan Thomas, Strauss, and Maria-Helena Henriques 1991).20
Researchers have also used anthro- pometric data from surveys to monitor and to study the intrahousehold alloca- tion of resources. Sources familiar to economists, such as aggregate data on per capita income and its distribution, obscure important aspects of individual welfare, and household-level data on in- come or wages do not reveal allocation patterns within the family. Even if sur- veys collected wage or income data for individuals within the household, the re- sults would not measure directly the liv- ing standards of children and others not in the labor force. Anthropometric mea- sures are easily collected, sensitive indi- cators of individual health status that circumvent many of these measure- ment problems, and which investigators sometimes use in conjunction with other individual indicators such as morbidity or death. Both types of measures have been placed in the service of research on discrimination by age and by gen- der. For example, Susan Horton (1988) has investigated the effects of birth or- der on height-for-age and weight-for- height. 21
Several studies using anthropometric indicators or related measures show that boys receive preferential treatment in parts of Asia (Sen 1984; Behrman and Deolalikar 1989). Addressing this dis- crimination literature, Mark Pitt, Mark
20 For excellent surveys see Behrman and Deo- lalikar (1988) and Strauss and Thomas (forthcom- ing).
21 Weight-for-height is a measure of current nu- tritional status as opposed to one's history of net nutrition. Those with a deficit in weight-for-height are called wasted and those with a deficit in height-for-age are called stunted.
Steckel: Stature and the Standard of Living 1933
Rosenzweig, and M. Nazmul Hassan (1990) advise that studies must control for individual variation in activity levels.
As a vehicle for understanding the sources of economic growth, develop- ment economists, economic historians, and nutritionists have long sought to measure the impact of health and nutri- tion on income and productivity (Strauss 1986; Rosenzweig 1988). Recently they added height and weight-for-height to this effort as measures of health. While generally expecting a positive correla- tion, studies have focused on the quanti- tative dimensions of the relationship. For example, the value of American slaves increased by approximately 1.5 percent per inch of height (Margo and Steckel 1982), and the elasticity of adult wage rates with respect to height was ap- proximately 1.0 in the Philippines (Lawrence Haddad and Howarth Bouis 1991). Thus, policies that improve nutri- tion are investments in higher productiv- ity and larger household incomes.
Contrasts in the types of evidence available have contributed to different research methods in economic history and development economics. Household surveys in developing countries repre- sent the population under study, or can be weighted to gain representation, but researchers often know less about the representativeness of historical data. A major source of information about the past-military records-often over rep- resented the lower classes, and volunteer armies may have imposed minimum height standards that complicate statisti- cal analysis. With the exception of American slaves, relatively little histori- cal data are available on child heights. Therefore, most historical studies of adult height must infer determinants of growth during childhood, a process as- sisted by knowledge of the proximate de- terminants of height learned from stud- ies in developing countries.
V. Concluding Remarks
This paper. reviews the intellectual his- tory of living standards from the per- spectives of national income accounting and of auxology, explores the relation- ship between these approaches, and ex- amines geographic, temporal, and socio- economic patterns of anthropometric evidence. The discussion suggests sev- eral directions for research. For exam- ple, secular trends and cyclical fluctua- tions in stature that were largely unaffiliated with changes in income indi- cate a need for incorporating health into welfare changes. A recent NBER confer- ence on Health and Welfare during In- dustrialization adopts a comparative in- ternational perspective and considers alternative methodologies for assessing the value of health.
The collection and analysis of height data and related anthropometric mea- sures will undoubtedly be important aca- demic enterprises in the years ahead. For example, Ralph Shlomowitz and col- leagues are collecting heights for Asia and the Pacific region (Lance Brennan, John McDonald, and Shlomowitz 1994), as is Stephen Nicholas for Australia, and various dissertations use stature (e.g., Timothy Cuff at Pittsburgh; Sophia Twarog, 1993, at Ohio State).22 How- ever, we need research to uncover the functional implications of anthropomet- ric measures, articulating the outcomes of nutritional deprivation in childhood for mortality, morbidity, labor productiv- ity, and cognitive development. Many so- cial scientists have little or no clinical experience with stature and those unfa- miliar with height research, or some- thing related, such as physical anthropol-
22 Some new applications include John Murray (1993) on living standards of the Shakers; Kimura (1993) on the fate of Koreans under Japanese rule; and Louis Ferleger and Steckel (forthcoming) on health aspects of living standards as portrayed in William Faulkner's novels.
1934 Journal of Economic Literature, Vol. XXXIII (December 1995)
ogy, have read little or none of the un- derlying literature on human biology. Therefore, most social scientists find this measure difficult to interpret in isola- tion; average height has meaning only in relation to more familiar measures such as per capita income, Gini coefficients, real wages, or labor productivity. More- over, it is in terms of these measures that they have defined problems, framed hy- potheses, and taken positions in debates. Social scientists will have an incentive to learn about the underpinnings of this line of work if height is accepted as a proxy, or at least a measure similar to variables and concepts in which there is an established interest.
We have made some progress in docu- menting the relationship of height to learning, mortality, and labor productiv- ity, particularly in developing countries, and a substantial project is underway to measure the long-term health conse- quences of stature using Civil War pen- sion files. Study of an initial sample of these records by Costa (1993a, 1993b) shows that height and weight were im- portant determinants of health and lon- gevity at older ages, results that contra- dict the "small but healthy" hypothesis of nutritional adaptation. The most recent research on nutrition and cognition uses longitudinal evidence to show that early supplementary feeding of poor children significantly enhances educa- tional achievement (Ernesto Pollitt et al. 1993).
Stature could be used to extend per capita income estimates, or welfare lev- els, in several countries in the early in- dustrial and, in some cases, the preindus- trial era, but one must be wary in this research. The conflicting patterns of stature and per capita income discussed for the U.S. in the nineteenth century suggest that other factors, such as the distribution of income or wealth and claims on the diet made by work or dis-
ease, must be taken into account in esti- mating height-income relationships. Re- search has been done on the course of birth weights from hospital records such as the Lying-in Hospital in Montreal and the Philadelphia Alms House (Ward 1993; Goldin and Margo 1989), but work is just beginning on historical relation- ships among stature, nuptiality, and fer- tility (David Weir 1993). As an aid to this entire research agenda, economic histo- rians have only begun to exploit informa- tion that may be available about stature and its implications from developing countries. Skeletal remains, from which one can obtain stature and other indica- tors of health status, are also useful in assessing health-related aspects of living standards (Steckel et al. 1992).
I recommend efforts to extend the portion of the life-span over which we collect information on the biological quality of life. Heights inform us about the history of net nutrition during the growing years, particularly early child- hood and adolescence, but they contain no direct information on the health of adults. Growth in childhood is a predic- tor of adult morbidity and mortality, but its explanatory power established to date is modest. It is also the case in many so- cieties, with the exception of American slaves, that the nutritional conditions of children are highly correlated with the nutritional conditions of adults. Weight- for-height measures, such as the Quetelet body mass index (weight in kilograms divided by the square of height in meters), add predictive power to the health risks among adults (Fogel 1994). Hans Waaler (1984) reports that death rates among Norwegian men were substantially higher among those whose body mass indexes exceeded 28 or were less than 22. Unfortunately, little histori- cal data on the body mass index exists before the 1860s, when manufacturers introduced platform scales.
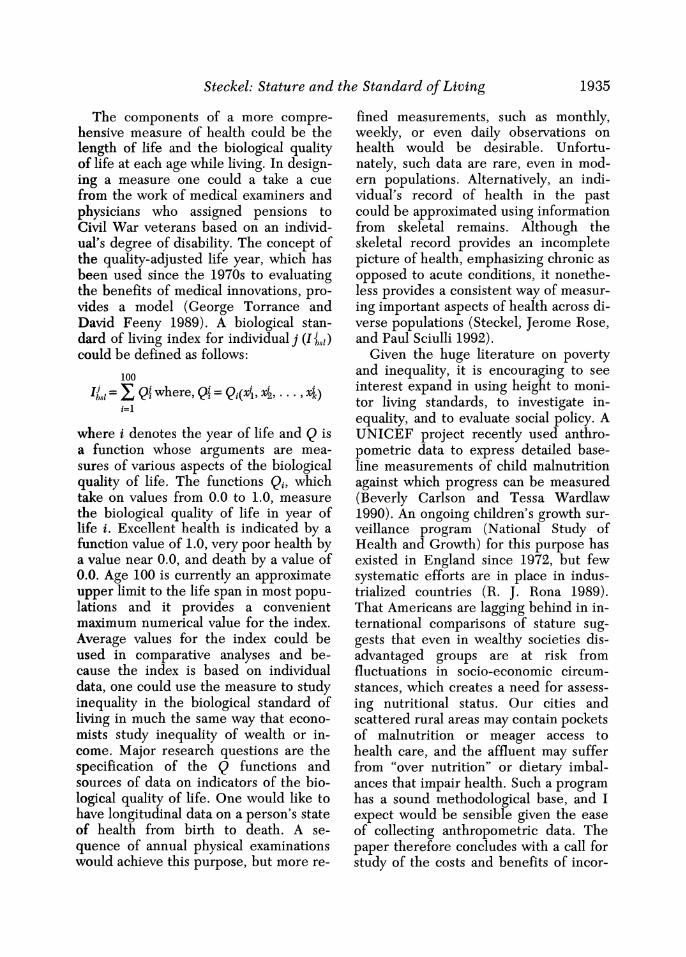
Steckel: Stature and the Standard of Living 1935
The components of a more compre- hensive measure of health could be the length of life and the biological quality of life at each age while living. In design- ing a measure one could a take a cue from the work of medical examiners and physicians who assigned pensions to Civil War veterans based on an individ- ual's degree of disability. The concept of the quality-adjusted life year, which has been used since the 1970s to evaluating the benefits of medical innovations, pro- vides a model (George Torrance and David Feeny 1989). A biological stan- dard of living index for individual j (I bsl )
could be defined as follows:
100
Ibsl where, Q = Qi(xA, xt, . . .4 X) i=l
where i denotes the year of life and Q is a function whose arguments are mea- sures of various aspects of the biological quality of life. The functions Qi, which take on values from 0.0 to 1.0, measure the biological quality of life in year of life i. Excellent health is indicated by a function value of 1.0, very poor health by a value near 0.0, and death by a value of 0.0. Age 100 is currently an approximate upper limit to the life span in most popu- lations and it provides a convenient maximum numerical value for the index. Average values for the index could be used in comparative analyses and be- cause the index is based on individual data, one could use the measure to study inequality in the biological standard of living in much the same way that econo- mists study inequality of wealth or in- come. Major research questions are the specification of the Q functions and sources of data on indicators of the bio- logical quality of life. One would like to have longitudinal data on a person's state of health from birth to death. A se- quence of annual physical examinations would achieve this purpose, but more re-
fined measurements, such as monthly, weekly, or even daily observations on health would be desirable. Unfortu- nately, such data are rare, even in mod- ern populations. Alternatively, an indi- vidual's record of health in the past could be approximated using information from skeletal remains. Although the skeletal record provides an incomplete picture of health, emphasizing chronic as opposed to acute conditions, it nonethe- less provides a consistent way of measur- ing important aspects of health across di- verse populations (Steckel, Jerome Rose, and Paul Sciulli 1992).
Given the huge literature on poverty and inequality, it is encouraging to see interest expand in using height to moni- tor living standards, to investigate in- equality, and to evaluate social policy. A UNICEF project recently used anthro- pometric data to express detailed base- line measurements of child malnutrition against which progress can be measured (Beverly Carlson and Tessa Wardlaw 1990). An ongoing children's growth sur- veillance program (National Study of Health and Growth) for this purpose has existed in England since 1972, but few systematic efforts are in place in indus- trialized countries (R. J. Rona 1989). That Americans are lagging behind in in- ternational comparisons of stature sug- gests that even in wealthy societies dis- advantaged groups are at risk from fluctuations in socio-economic circum- stances, which creates a need for assess- ing nutritional status. Our cities and scattered rural areas may contain pockets of malnutrition or meager access to health care, and the affluent may suffer from "over nutrition" or dietary imbal- ances that impair health. Such a program has a sound methodological base, and I expect would be sensible given the ease of collecting anthropometric data. The paper therefore concludes with a call for study of the costs and benefits of incor-
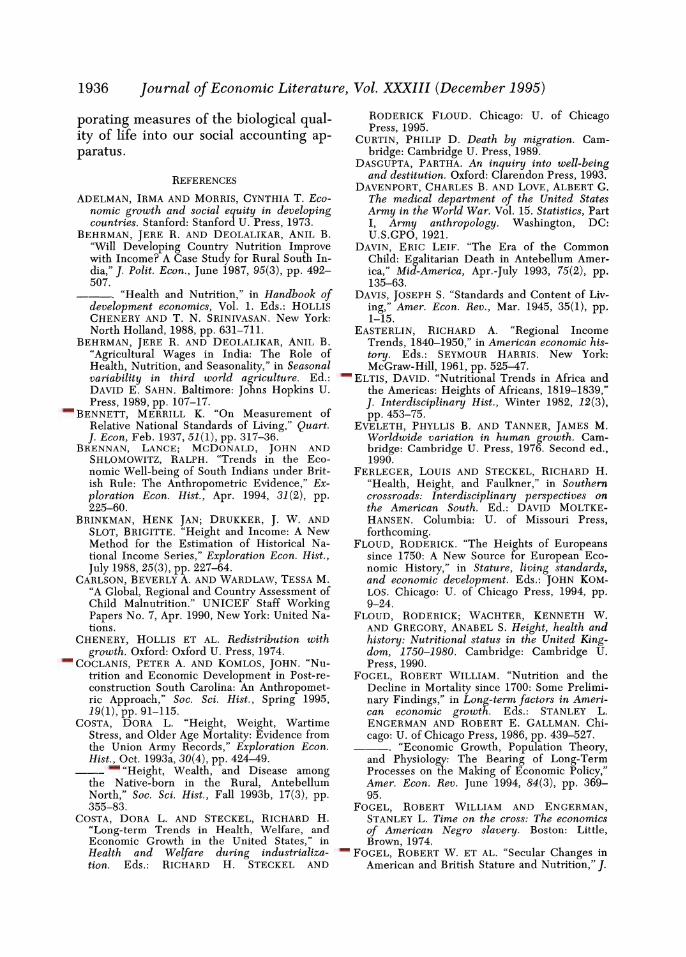
1936 Journal of Economic Literature, Vol. XXXIII (December 1995)
porating measures of the biological qual- ity of life into our social accounting ap- paratus.
REFERENCES
ADELMAN, IRMA AND MORRIS, CYNTHIA T. Eco- nomic growth and social equity in developing countries. Stanford: Stanford U. Press, 1973.
BEHRMAN, JERE R. AND DEOLALIKAR, ANIL B. "Will Developing Country Nutrition Improve with Income? A Case Study for Rural South In- dia," J. Polit. Econ., June 1987, 95(3), pp. 492- 507.
. "Health and Nutrition," in Handbook of development economics, Vol. 1. Eds.: HOLLIS CHENERY AND T. N. SRINIVASAN. New York: North Holland, 1988, pp. 631-711.
BEHRMAN, JERE R. AND DEOLALIKAR, ANIL B. "Agricultural Wages in India: The Role of Health, Nutrition, and Seasonality," in Seasonal variability in third world agriculture. Ed.: DAVID E. SAHN. Baltimore: Johns Hopkins U. Press, 1989, pp. 107-17.
BENNETT, MERRILL K. "On Measurement of Relative National Standards of Living," Quart. J. Econ, Feb. 1937, 51(1), pp. 317-36.
BRENNAN, LANCE; MCDONALD, JOHN AND SHLOMOWITZ, RALPH. "Trends in the Eco- nomic Well-being of South Indians under Brit- ish Rule: The Anthropometric Evidence," Ex- ploration Econ. Hist., Apr. 1994, 31(2), pp. 225-60.
BRINKMAN, HENK JAN; DRUKKER, J. W. AND SLOT, BRIGITTE. "Height and Income: A New Method for the Estimation of Historical Na- tional Income Series," Exploration Econ. Hist., July 1988, 25(3), pp. 227-64.
CARLSON, BEVERLY A. AND WARDLAW, TESSA M. "A Global, Regional and Country Assessment of Child Malnutrition." UNICEF Staff Working Papers No. 7, Apr. 1990, New York: United Na- tions.
CHENERY, HOLLIS ET AL. Redistribution with growth. Oxford: Oxford U. Press, 1974.
COCLANIS, PETER A. AND KOMLOS, JOHN. "Nu- trition and Economic Development in Post-re- construction South Carolina: An Anthropomet- ric Approach," Soc. Sci. Hist., Spring 1995, 19(1), pp. 91-115.
COSTA, DORA L. "Height, Weight, Wartime Stress, and Older Age Mortality: Evidence from the Union Army Records," Exploration Econ. Hist., Oct. 1993a, 30(4), pp. 424-49.
- "Height, Wealth, and Disease among the Native-born in the Rural, Antebellum North," Soc. Sci. Hist., Fall 1993b, 17(3), pp. 355-83.
COSTA, DORA L. AND STECKEL, RICHARD H. "Long-term Trends in Health, Welfare, and Economic Growth in the United States," in Health and Welfare during industrializa- tion. Eds.: RICHARD H. STECKEL AND
RODERICK FLOUD. Chicago: U. of Chicago Press, 1995.
CURTIN, PHILIP D. Death by migration. Cam- bridge: Cambridge U. Press, 1989.
DASGUPTA, PARTHA. An inquiry into well-being and destitution. Oxford: Clarendon Press, 1993.
DAVENPORT, CHARLES B. AND LOVE, ALBERT G. The medical department of the United States Army in the World War. Vol. 15. Statistics, Part I, Army anthropology. Washington, DC: U.S.GPO, 1921.
DAVIN, ERIC LEIF. "The Era of the Common Child: Egalitarian Death in Antebellum Amer- ica," Mid-America, Apr.-July 1993, 75(2), pp. 135-63.
DAVIS, JOSEPH S. "Standards and Content of Liv- ing," Amer. Econ. Rev., Mar. 1945, 35(1), pp. 1-15.
EASTERLIN, RICHARD A. "Regional Income Trends, 1840-1950," in American economic his- tory. Eds.: SEYMOUR HARRIS. New York: McGraw-Hill, 1961, pp. 525-47.
ELTIS, DAVID. "Nutritional Trends in Africa and the Americas: Heights of Africans, 1819-1839," J. Interdisciplinary Hist., Winter 1982, 12(3), pp. 453-75.
EVELETH, PHYLLIS B. AND TANNER, JAMES M. Worldwide variation in human growth. Cam- bridge: Cambridge U. Press, 1976. Second ed., 1990.
FERLEGER, LOUIS AND STECKEL, RICHARD H. "Health, Height, and Faulkner," in Southern crossroads: Interdisciplinary perspectives on the American South. Ed.: DAVID MOLTKE- HANSEN. Columbia: U. of Missouri Press, forthcoming.
FLOUD, RODERICK. "The Heights of Europeans since 1750: A New Source or European Eco- nomic History," in Stature, living standards, and economic development. Eds.: JOHN KOM- LOS. Chicago: U. of Chicago Press, 1994, pp. 9-24.
FLOUD, RODERICK; WACHTER, KENNETH W. AND GREGORY, ANABEL S. Height, health and history: Nutritional status in the United King- dom, 1750-1980. Cambridge: Cambridge U. Press, 1990.
FOGEL, ROBERT WILLIAM. "Nutrition and the Decline in Mortality since 1700: Some Prelimi- nary Findings," in Long-term factors in Ameri- can economic growth. Eds.: STANLEY L. ENGERMAN AND ROBERT E. GALLMAN. Chi- cago: U. of Chicago Press, 1986, pp. 439-527.
. "Economic Growth, Population Theory, and Physiology: The Bearing of Long-Term Processes on the Making of Economic Policy," Amer. Econ. Rev. June 1994, 84(3), pp. 369- 95.
FOGEL, ROBERT WILLIAM AND ENGERMAN, STANLEY L. Time on the cross: The economics of American Negro slavery. Boston: Little, Brown, 1974.
FOGEL, ROBERT W. ET AL. "Secular Changes in American and British Stature and Nutrition," J.
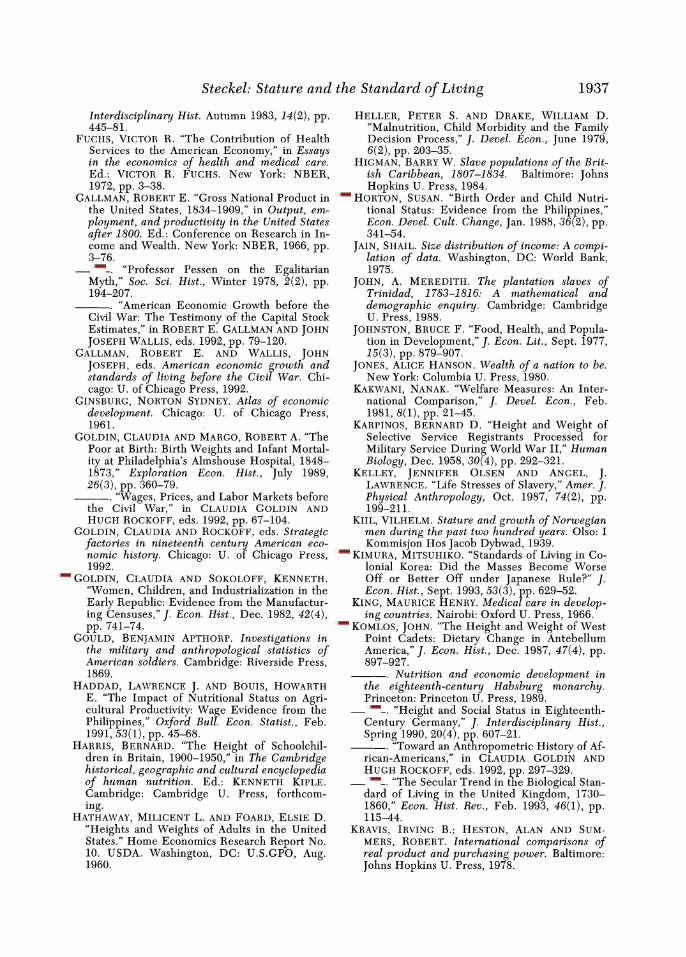
Steckel: Stature and the Standard of Living 1937
Interdisciplinary Hist. Autumn 1983, 14(2), pp. 445-81.
FUCHS, VICTOR R. "The Contribution of Health Services to the American Economy," in Essays in the economics of health and medical care. Ed.: VICTOR R. FUCHS. New York: NBER, 1972, pp. 3-38.
GALLMAN, ROBERT E. "Gross National Product in the United States, 1834-1909," in Output, em- ployment, and productivity in the United States after 1800. Ed.: Conference on Research in In- come and Wealth. New York: NBER, 1966, pp. 3-76.
-. "Professor Pessen on the Egalitarian Myth," Soc. Sci. Hist., Winter 1978, 2(2), pp. 194-207.
- "American Economic Growth before the Civil War: The Testimony of the Capital Stock Estimates," in ROBERT E. GALLMAN AND JOHN JOSEPH WALLIS, eds. 1992, pp. 79-120.
GALLMAN, ROBERT E. AND WALLIS, JOHN JOSEPH, eds. American economic growth and standards of living before the Civil War. Chi- cago: U. of Chicago Press, 1992.
GINSBURG, NORTON SYDNEY. Atlas of economic development. Chicago: U. of Chicago Press, 1961.
GOLDIN, CLAUDIA AND MARGO, ROBERT A. "The Poor at Birth: Birth Weights and Infant Mortal- ity at Philadelphia's Almshouse Hospital, 1848- 1873," Exploration Econ. Hist., July 1989, 26(3), pp. 360-79.
-."Wages, Prices, and Labor Markets before the Civil War," in CLAUDIA GOLDIN AND HUGH ROCKOFF, eds. 1992, pp. 67-104.
GOLDIN, CLAUDIA AND ROCKOFF, eds. Strategic factories in nineteenth century American eco- nomic history. Chicago: U. of Chicago Press, 1992.
GOLDIN, CLAUDIA AND SOKOLOFF, KENNETH. "Women, Children, and Industrialization in the Early Republic: Evidence from the Manufactur- ing Censuses," J. Econ. Hist., Dec. 1982, 42(4), pp. 741-74.
GOULD, BENJAMIN APTHORP. Investigations in the military and anthropological statistics of American soldiers. Cambridge: Riverside Press, 1869.
HADDAD, LAWRENCE J. AND BoUIS, HOWARTH E. "The Impact of Nutritional Status on Agri- cultural Productivity: Wage Evidence from the Philippines," Oxford BulL Econ. Statist., Feb. 1991, 53(1), pp. 45-68.
HARRIs, BERNARD. "The Height of Schoolchil- dren in Britain, 1900-1950," in The Cambridge historical, geographic and cultural encyclopedia of human nutrition. Ed.: KENNETH KIPLE. Cambridge: Cambridge U. Press, forthcom- ing.
HATHAWAY, MILICENT L. AND FOARD, ELSIE D. "Heights and Weights of Adults in the United States." Home Economics Research Report No. 10. USDA. Washington, DC: U.S.GPO, Aug. 1960.
HELLER, PETER S. AND DRAKE, WILLIAM D. "Malnutrition, Child Morbidity and the Family Decision Process," J. Devel. Econ., June 1979, 6(2), pp. 203-35.
HIGMAN, BARRY W. Slave populations of the Brit- ish Caribbean, 1807-1834. Baltimore: Johns Hopkins U. Press, 1984.
HORTON, SUSAN. "Birth Order and Child Nutri- tional Status: Evidence from the Philippines," Econ. Devel. Cult. Change, Jan. 1988, 36(2), pp. 341-54.
JAIN, SHAIL. Size distribution of income: A compi- lation of data. Washington, DC: World Bank, 1975.
JOHN, A. MEREDITH. The plantation slaves of Trinidad, 1783-1816: A mathematical and demographic enquiry. Cambridge: Cambridge U. Press, 1988.
JOHNSTON, BRUCE F. "Food, Health, and Popula- tion in Development," J. Econ. Lit., Sept. 1977, 15(3), pp. 879-907.
JONES, ALICE HANSON. Wealth of a nation to be. New York: Columbia U. Press, 1980.
KAKWANI, NANAK. "Welfare Measures: An Inter- national Comparison," J. Devel. Econ., Feb. 1981, 8(1), pp. 21-45.
KARPINOS, BERNARD D. "Height and Weight of Selective Service Registrants Processed for Military Service During World War II," Human Biology, Dec. 1958, 30(4), pp. 292-321.
KELLEY, JENNIFER OLSEN AND ANGEL, J. LAWRENCE. "Life Stresses of Slavery," Amer. J. Physical Anthropology, Oct. 1987, 74(2), pp. 199-211.
KIIL, VILHELM. Stature and growth of Norwegian men during the past two hundred years. Olso: I Kommisjon Hos Jacob Dybwad, 1939.
KIMURA, MITSUHIKO. "Standards of Living in Co- lonial Korea: Did the Masses Become Worse Off or Better Off under Japanese Rule?" J. Econ. Hist., Sept. 1993, 53(3), pp.629-52.
KING, MAURICE HENRY. Medical care in develop- ing countries. Nairobi: Oxford U. Press, 1966.
KOMLOS, JOHN. "The Height and Weight of West Point Cadets: Dietary Change in Antebellum America," J. Econ. Hist., Dec. 1987, 47(4), pp. 897-927.
-. Nutrition and economic development in the eighteenth-century Habsburg monarchy. Princeton: Princeton U. Press, 1989.
-. "Height and Social Status in Eighteenth- Century Germany," J. Interdisciplinary Hist., Spring 1990, 20(4), pp. 607-21.
. "Toward an Ant hropometric History of Af- rican-Americans," in CLAUDIA GOLDIN AND HUGH ROCKOFF, eds. 1992, pp. 297-329.
-. "The Secular Trend in the Biological Stan- dard of Living in the United Kingdom, 1730- 1860," Econ. Hist. Rev., Feb. 1993, 46(1), pp. 115-44.
KRAVIS, IRVING B.; HESTON, ALAN AND SUM- MERS, ROBERT. International comparisons of real product and purchasing power. Baltimore: Johns Hopkins U. Press, 1978.
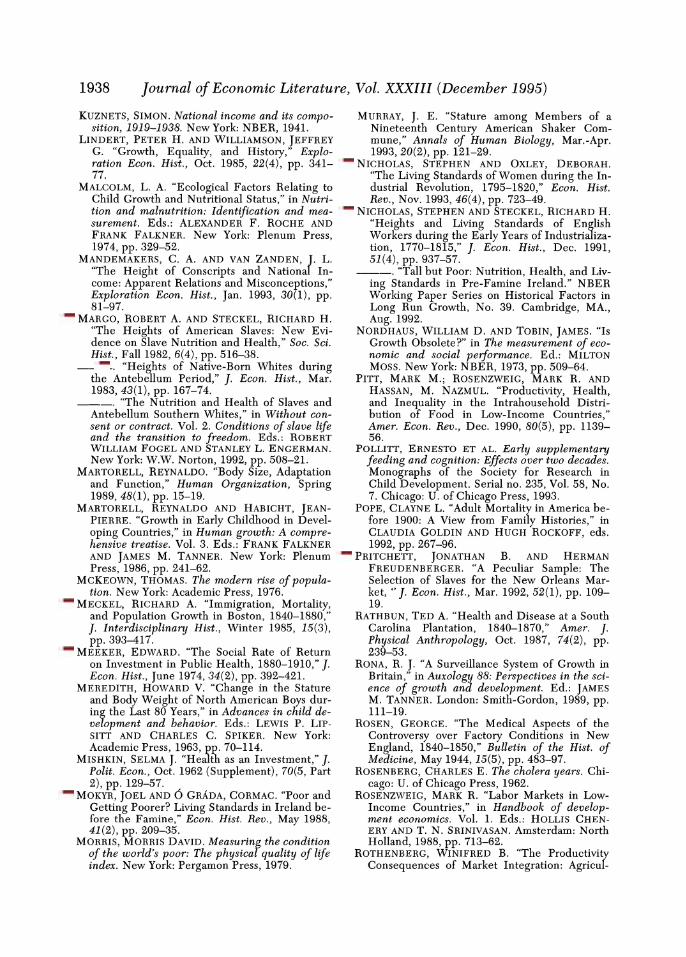
1938 Journal of Economic Literature, Vol. XXXIII (December 1995)
KuZNETS, SIMON. National income and its compo- sition, 1919-1938. New York: NBER, 1941.
LINDERT, PETER H. AND WILLIAMSON, JEFFREY G. "Growth, Equality, and History," Explo- ration Econ. Hist., Oct. 1985, 22(4), pp. 341- 77.
MALCOLM, L. A. "Ecological Factors Relating to Child Growth and Nutritional Status," in Nutri- tion and malnutrition: Identification and mea- surement. Eds.: ALEXANDER F. ROCHE AND FRANK FALKNER. New York: Plenum Press, 1974, pp. 329-52.
MANDEMAKERS, C. A. AND VAN ZANDEN, J. L. "The Height of Conscripts and National In- come: Apparent Relations and Misconceptions, Exploration Econ. Hist., Jan. 1993, 30(1), pp. 81-97.
MARGO, ROBERT A. AND STECKEL, RICHARD H. "The Heights of American Slaves: New Evi- dence on Slave Nutrition and Health," Soc. Sci. Hist., Fall 1982, 6(4), pp. 516-38.
. "Heights of Native-Born Whites during the Antebellum Period," J. Econ. Hist., Mar. 1983, 43(1), pp. 167-74.
. "The Nutrition and Health of Slaves and Antebellum Southern Whites," in Without con- sent or contract. Vol. 2. Conditions of slave life and the transition to freedom. Eds.: ROBERT WILLIAM FOGEL AND STANLEY L. ENGERMAN. New York: W.W. Norton, 1992, pp. 508-21.
MARTORELL, REYNALDO. "Body Size, Adaptation and Function," Human Organization, Spring 1989, 48(1), pp. 15-19.
MARTORELL, REYNALDO AND HABICHT, JEAN- PIERRE. "Growth in Early Childhood in Devel- oping Countries," in Human growth: A compre- hensive treatise. Vol. 3. Eds.: FRANK FALKNER AND JAMES M. TANNER. New York: Plenum Press, 1986, pp. 241-62.
MCKEOWN, THOMAS. The modern rise of popula- tion. New York: Academic Press, 1976.
MECKEL, RICHARD A. "Immigration, Mortality, and Population Growth in Boston, 1840-1880," J. Interdisciplinary Hist., Winter 1985, 15(3), pp. 393-417.
MEEKER, EDWARD. "The Social Rate of Return on Investment in Public Health, 1880-1910," J. Econ. Hist., June 1974, 34(2), pp. 392-421.
MEREDITH, HOWARD V. "Change in the Stature and Body Weight of North American Boys dur- ing the Last 80 Years," in Advances in child de- velopment and behavior. Eds.: LEWIS P. LIP- SITT AND CHARLES C. SPIKER. New York: Academic Press, 1963, pp. 70-114.
MISHKIN, SELMA J. "Health as an Investment," J. Polit. Econ., Oct. 1962 (Supplement), 70(5, Part 2), pp. 129-57.
MOKYR, JOEL AND 0 GRADA, CORMAC. "Poor and Getting Poorer? Living Standards in Ireland be- fore the Famine," Econ. Hist. Rev., May 1988, 41(2), pp. 209-35.
MORRIS, MORRIS DAVID. Measuring the condition of the world's poor: The physicafquality of life index. New York: Pergamon Press, 1979.
MURRAY, J. E. "Stature among Members of a Nineteenth Century American Shaker Com- mune," Annals of Human Biology, Mar.-Apr. 1993, 20(2), pp. 121-29.
NICHOLAS, STEPHEN AND OXLEY, DEBORAH. "The Living Standards of Women during the In- dustrial Revolution, 1795-1820," Econ. Hist. Rev., Nov. 1993, 46(4), pp. 723-49.
NICHOLAS, STEPHEN AND STECKEL, RICHARD H. "Heights and Living Standards of English Workers during the Early Years of Industrializa- tion, 1770-1815," J. Econ. Hist., Dec. 1991, 51(4), pp. 937-57.
-. "Tall but Poor: Nutrition, Health, and Liv- ing Standards in Pre-Famine Ireland." NBER Working Paper Series on Historical Factors in Long Run Growth, No. 39. Cambridge, MA., Aug. 1992.
NORDHAUS, WILLIAM D. AND TOBIN, JAMES. "Is Growth Obsolete?" in The measurement of eco- nomic and social performance. Ed.: MILTON Moss. New York: NBER, 1973, pp. 509-64.
PITT, MARK M.; ROSENZWEIG, MARK R. AND HASSAN, M. NAZMUL. "Productivity, Health, and Inequality in the Intrahousehold Distri- bution of Food in Low-Income Countries," Amer. Econ. Rev., Dec. 1990, 80(5), pp. 1139- 56.
POLLITT, ERNESTO ET AL. Early supplementary feeding and cognition: Effects over two decades. Monographs of the Society for Research in Child Development. Serial no. 235, Vol. 58, No. 7. Chicago: U. of Chicago Press, 1993.
POPE, CLAYNE L. "Adult Mortality in America be- fore 1900: A View from Family Histories," in CLAUDIA GOLDIN AND HUGH ROCKOFF, eds. 1992, pp. 267-96.
PRITCHETT, JONATHAN B. AND HERMAN FREUDENBERGER. "A Peculiar Sample: The Selection of Slaves for the New Orleans Mar- ket, "J. Econ. Hist., Mar. 1992, 52(1), pp. 109- 19.
RATHBUN, TED A. "Health and Disease at a South Carolina Plantation, 1840-1870," Amer. J. Physical Anthropology, Oct. 1987, 74(2), pp. 239-53.
RONA, R. J. "A Surveillance System of Growth in Britain," in Auxology 88: Perspectives in the sci- ence of growth and development. Ed.: JAMES M. TANNER. London: Smith-Gordon, 1989, pp. 111-19.
ROSEN, GEORGE. "The Medical Aspects of the Controversy over Factory Conditions in New England, 1840-1850," Bulletin of the Hist. of Medicine, May 1944,15(5), pp. 483-97.
ROSENBERG, CHARLES E. The cholera years. Chi- cago: U. of Chicago Press, 1962.
ROSENZWEIG, MARK R. "Labor Markets in Low- Income Countries," in Handbook of develop- ment economics. Vol. 1. Eds.: HOLLIS CHEN- ERY AND T. N. SRINIVASAN. Amsterdam: North Holland, 1988, pp. 713-62.
ROTHENBERG, WINIFRED B. "The Productivity Consequences of Market Integration: AgricutI-
Steckel: Stature and the Standard of Living 1939
ture in Massachusetts, 1771-1801," in ROBERT E. GALLMAN AND JOHN JOSEPH WALLIS, eds. 1992, pp. 311-38.
SANDBERG, LARS G. AND STECKEL, RICHARD H. "Soldier, Soldier, What Made You Grow So Tall? A Study of Height, Health, and Nutrition in Sweden, 1720-1881," Econ. Hist., 1980, 23(2), pp. 91-105.
. "Heights and Economic History: The Swedish Case. Annals of Human Biology, Mar.- Apr. 1987,14(2), pp. 101-10.
. "Overpopulation and Malnutrition Redis- covered: Hard Times in Nineteenth Century Sweden," Exploration Econ. Hist., Jan. 1988, 25(1), pp. 1-19.
SCRIMSHAW, NEVIN S.; TAYLOR, CARL E. AND GORDON, JOHN EVERETT. Interactions of nu- trition and infection. WHO Monograph Series, No. 57. Geneva: World Health Organization, 1968.
SECKLER, DAVID. "'Small but Healthy': A Basic Hypothesis in the Theory, Measurement and Policy of Malnutrition," in Newer concepts in nutrition and their implications for policy. Ed.: PANDURANG V. SUKHATME. Pune: Maharashtra Association for the Cultivation of Science Re- search Institute, 1982, pp. 127-37.
SEN, AMARTYA. Resources, values, and develop- ment. Cambridge: Harvard U. Press, 1984
. The standard of living. Cambridge: Cam- bridge U. Press, 1987.
SHAMMAS, CAROLE. "A New Look at Long-Term Trends in Wealth Inequality in the United States," Amer. Historical Rev. Apr. 1993, 98(2), pp. 412-31.
SHAY, TED. "The Stature of Military Conscripts: New Evidence on the Standard of Living in Ja- pan." Paper given at the 1986 Social Science History Association meetings, St. Louis, Mis- souri, 1986.
SODERBERG, JOHAN. "Hard Times in 19th-Cen- tury Sweden: Comment," Exploration Econ. Hist. Oct. 1989, 26(4), pp. 477-91.
SOKOLOFF, KENNETH L. AND VILLAFLOR, GEOR- GIA C. "The Early Achievement of Modern Stature in America," Soc. Sci. Hist., Fall 1982, 6(4). pp. 453-81.
SOLToW, LEE. "Inequalities in the Standard of Living in the United States, 1798-1875," in ROBERT E. GALLMAN AND JOHN JOSEPH WAL- LIS, eds. 1992, pp. 121-66.
STECKEL, RICHARD H. "Slave Height Profiles from Coastwise Manifests," Exploration Econ. Hist., Oct. 1979, 16(4), pp. 363-80.
. "Height and Per Capita Income,"Histori- cal Methods, Winter 1983, 16(1),pp. 1-7.
"Birth Weights and Infant Mortality among American Slaves," Exploration Econ. Hist., Apr. 1986a, 23(2), pp. 173-98.
. "A Peculiar Population: The Nutrition, Health, and Mortality of American Slaves from Childhood to Maturity," J. Econ. Hist., Sept. 1986b, 46(3), pp. 721-41.
. "A Dreadful Childhood: The Excess Mor-
tality of American Slaves," Soc. Sci. Hist., Win- ter 1986c, 10(4), pp. 427-65.
. "Growth Depression and Recovery: The Remarkable Case of American Slaves," Annals of Human Biology, Mar.-Apr. 1987a, 14(2), pp. 111-32.
. "Household Migration, Urban Growth, and Industrialization: The United States, 1850- 1860." NBER Working Paper No. 2281. Cam- bridge, MA., June 1987b.
. "The Health and Mortality of Women and Children, 1850-1860," J. Econ. Hist., June, 1988, 48(2), pp. 333-45.
-. "Census Manuscript Schedules Matched with Property Tax Lists: A Source of Informa- tion on Long-Term Trends in Wealth Inequal- ity," Historical Methods, Spring 1994, 27(2), pp. 71-85.
. "Percentiles of Modern Height Standards for Use in Historical Research."Mimeo. Colum- bus, OH, 1995.
STECKEL, RICHARD H. AND HAURIN, DONALD R. "Height, Nutrition, and Mortality in Ohio, 1870-1900." Mimeo. Columbus, Ohio, 1982.
STECKEL, RICHARD H.; ROSE, JEROME C. AND SCIULLI, PAUL. "A History of Health and Nutri- tion in the Western Hemisphere." Mimeo. Ohio State U., Columbus, Ohio, 1992.
STEEGMANN, A. THEODORE, JR. AND HASELEY, P. A. "Stature Variation in the British American Colonies: French and Indian War Records, 1755-1763," Amer. J. Physical Anthropology, Mar. 1988, 75(3), pp. 413-21.
STRAUSS, JOHN. "Does Better Nutrition Raise Farm Productivity?" J. Polit. Econ., Apr. 1986, 94(2), pp. 297-320.
STRAUSS, JOHN AND THOMAS, DUNCAN. "'Human Resources: Empirical Modeling of Household and Family Decisions," in Handbook of develop- ment economics. Vol. 3. Eds: T. N. SRINIVASAN AND JERE R. BEHRMAN. Amsterdam: Elsevier, forthcoming.
SUMMERS, ROBERT AND HESTON, ALAN. "The Penn World Table (Mark 5): An Expanded Set of International Comparisons, 1950-1988," Quart. J. Econ., May 1991, 106(2), pp. 327-68.
TANNER, JAMES M. "Growth and Physique in Dif- ferent Populations of Mankind," in The biology of human adaptability. Eds.: PAUL T. BAKER AND J. S. WEINER. Oxford: Oxford U. Press, 1966, pp. 45-66.
-. Foetus into man: Physical growth from conception to maturity. Cambridge: Harvard U. Press, 1978.
-. A history of the study of human growth. Cambridge: Cambridge U. Press, 1981.
TANNER, JAMES M. ET AL. "Increase in Length of Leg Relative to Trunk in Japanese Children and Adults from 1957 to 1977: Comparisons with British and with Japanese Americans," Annals of Human Biology, Sept.-Oct. 1982, 9(5), pp. 411-23.
THOMAS, DUNCAN; STRAUSS, JOHN AND HENRI- QUES, MARIA-HELENA. "How Does Mother's
1940 Journal of Economic Literature, Vol. XXXIII (December 1995)
Education Affect Child Height?" J. Human Res., Spring 1991, 26(2), pp. 183-211.
TORRANCE, GEORGE W. AND FEENY, DAVID. "Utilities and Quality-Adjusted Life Years," In- ternational J. Technology Assessment in Health Care, 1989, 5(4), pp. 559-75.
TROTTER, MILDRED AND GLESER, GOLDINE C. "Trends in Stature of American Whites and Ne- groes Born between 1840 and 1924," Amer. J. Physical Anthropology, Dec. 1951, 9(4), pp. 427-40.
TRUSSELL, JAMES AND STECKEL, RICHARD H. "The Age of Slaves at Menarche and Their First Birth," J. Interdisciplinary Hist., Winter 1978, 8(3), pp. 477-505.
TWAROG, SOPHIA NORA. "Heights and Living Standards in Industrializing Germany: The Case of Wurttemberg." 2 vols. Ph.D. Dissertation, Ohio State U., 1993.
UNITED NATIONS. Report on international defini- tion and measurement of standards and levels of living. New York: United Nations, 1954.
- . International definition and measurement of levels of living: An interim guide. New York: United Nations, 1961.
. Studies in the integration of social statis- tics: Technical report. Series F, No. 24. New York: United Nations, 1979.
UNDP. Human development report, 1993. New York: United Nations Development Pro- gramme, 1993.
UNESCO. World illiteracy at mid-century. New York: United Nations, 1957.
UNITED NATIONS STATISTICAL OFFICE. "To- wards More Effective Measurement of Levels of Living, and Review of Work of the United Nations Statistical Office (UNSO) Related to Statistics of Levels of Living." LSMS Working
Paper No. 4. Washington, DC: World Bank, 1980.
U.S. BUREAU OF THE CENSUS. Historical statis- tics of the United States, colonial times to 1970. Washington, DC: U.S.GPO, 1975.
WAALER, HANS TH. "Height, Weight, and Mortal- ity: The Norwegian Experience," Acta Medica Scandinavica, 1984, Supplementum 679.
WACHTER, KENNETH W. AND TRUSSELL, JAMES. "Estimating Historical Heights," J. Amer. Sta- tist. Assoc., June 1982, 77(378), pp. 279-93.
WALSH, LORENA S. "Consumer Behavior, Diet, and the Standard of Living in Late Colonial and Early Antebellum America, 1770-1840," in ROBERT E. GALLMAN AND JOHN JOSEPH WAL- LIS, eds. 1992, pp. 217-61.
WARD, W. PETER. Birth weight and economic growth: Women's living standards in the indus- trializing West. Chicago: U. of Chicago Press, 1993.
WEIR, DAVID R. "Parental Consumption Deci- sions and Child Health During the Early French Fertility Decline, 1790-1914," J. Econ. Hist., June 1993, 53(2), pp. 259-74.
WEISS, THOMAS J. "U.S. Labor Force Estimates and Economic Growth, 1800-1860," in ROBERT E. GALLMAN AND JOHN JOSEPH WALLIS, eds. 1992, pp. 19-75.
WILLIAMSON, JEFFREY G. AND LINDERT, PETER H. American inequality: A macroeconomic his- tory. New York: Academic Press, 1980.
WORLD BANK. World development report. Washington, DC: World Bank, 1980, 1982, 1993.
WU, JIALU. "The Anthropometric History of Pitts- burgh and Allegheny County, Pennsylvania, 1890-1945," Annals of Human Biology, Jan.- Feb. 1992, 19(1), pp. 79-86.