Embed Size (px)
Citation preview
This report should be read in conjunction with AIG's Quarterly Report on Form 10-Qfor the quarter ended March 31, 2007 filed with the Securities and Exchange Commission.
American International Group, Inc.
Financial Supplement
First Quarter 2007
American International Group, Inc.Financial Supplement
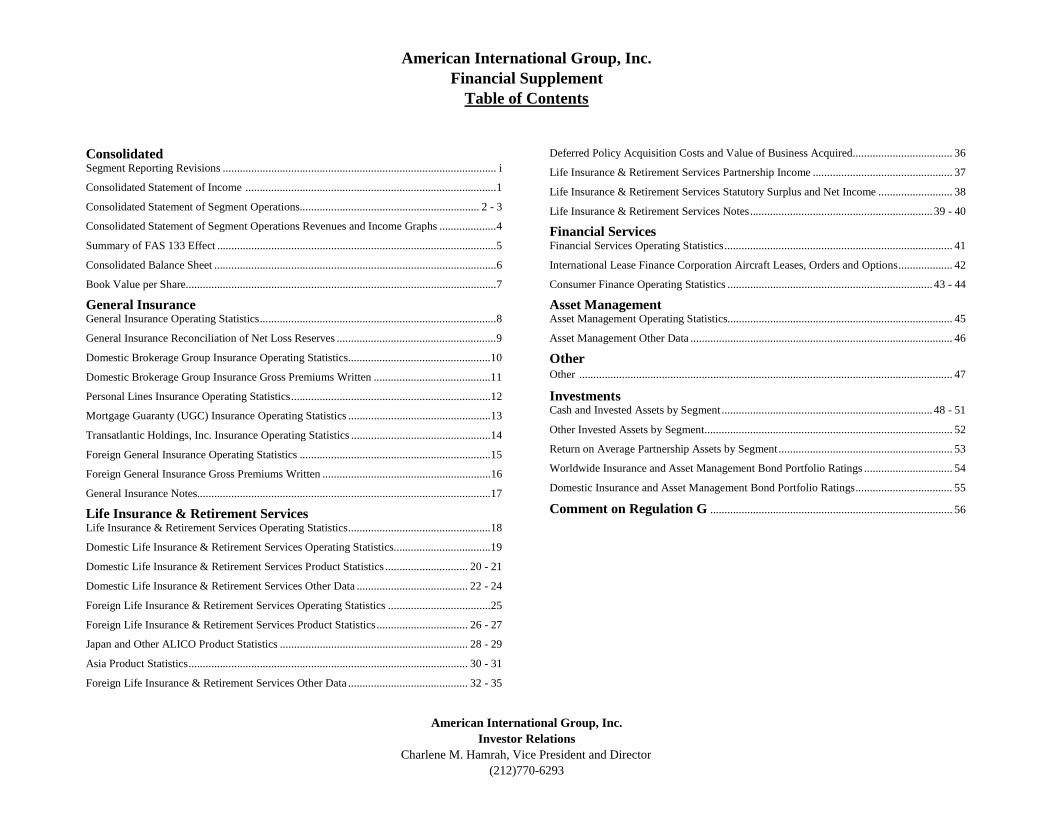
Table of Contents
Consolidated Segment Reporting Revisions ................................................................................................ i
Consolidated Statement of Income ........................................................................................1
Consolidated Statement of Segment Operations............................................................... 2 - 3
Consolidated Statement of Segment Operations Revenues and Income Graphs ....................4
Summary of FAS 133 Effect ..................................................................................................5
Consolidated Balance Sheet ...................................................................................................6
Book Value per Share.............................................................................................................7
General Insurance General Insurance Operating Statistics...................................................................................8
General Insurance Reconciliation of Net Loss Reserves ........................................................9
Domestic Brokerage Group Insurance Operating Statistics..................................................10
Domestic Brokerage Group Insurance Gross Premiums Written .........................................11
Personal Lines Insurance Operating Statistics......................................................................12
Mortgage Guaranty (UGC) Insurance Operating Statistics ..................................................13
Transatlantic Holdings, Inc. Insurance Operating Statistics .................................................14
Foreign General Insurance Operating Statistics ...................................................................15
Foreign General Insurance Gross Premiums Written ...........................................................16
General Insurance Notes.......................................................................................................17
Life Insurance & Retirement Services Life Insurance & Retirement Services Operating Statistics..................................................18
Domestic Life Insurance & Retirement Services Operating Statistics..................................19
Domestic Life Insurance & Retirement Services Product Statistics ............................. 20 - 21
Domestic Life Insurance & Retirement Services Other Data ....................................... 22 - 24
Foreign Life Insurance & Retirement Services Operating Statistics ....................................25
Foreign Life Insurance & Retirement Services Product Statistics................................ 26 - 27
Japan and Other ALICO Product Statistics .................................................................. 28 - 29
Asia Product Statistics.................................................................................................. 30 - 31
Foreign Life Insurance & Retirement Services Other Data .......................................... 32 - 35
Deferred Policy Acquisition Costs and Value of Business Acquired................................... 36
Life Insurance & Retirement Services Partnership Income ................................................. 37
Life Insurance & Retirement Services Statutory Surplus and Net Income .......................... 38
Life Insurance & Retirement Services Notes................................................................ 39 - 40
Financial Services Financial Services Operating Statistics................................................................................ 41
International Lease Finance Corporation Aircraft Leases, Orders and Options................... 42
Consumer Finance Operating Statistics ........................................................................ 43 - 44
Asset Management Asset Management Operating Statistics............................................................................... 45
Asset Management Other Data ............................................................................................ 46
Other Other ................................................................................................................................... 47 Investments Cash and Invested Assets by Segment.......................................................................... 48 - 51
Other Invested Assets by Segment....................................................................................... 52
Return on Average Partnership Assets by Segment............................................................. 53
Worldwide Insurance and Asset Management Bond Portfolio Ratings ............................... 54
Domestic Insurance and Asset Management Bond Portfolio Ratings.................................. 55
Comment on Regulation G ..................................................................................... 56
American International Group, Inc.Investor Relations
Charlene M. Hamrah, Vice President and Director(212)770-6293
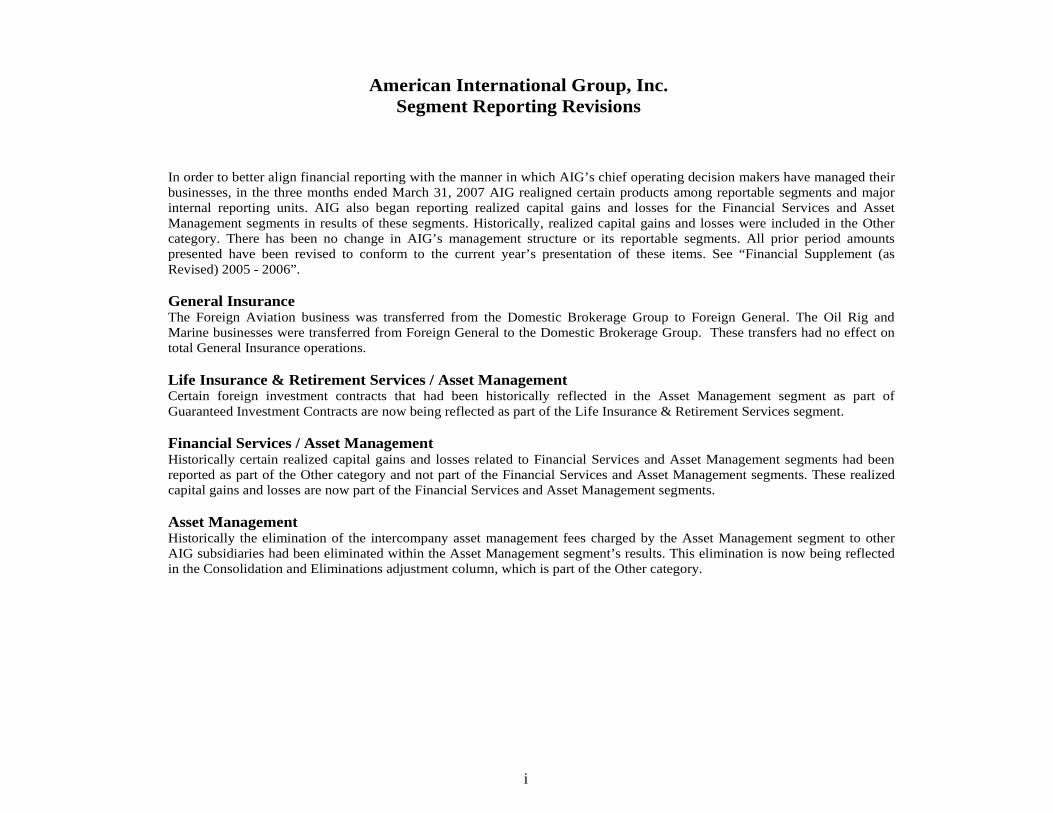
American International Group, Inc. Segment Reporting Revisions
In order to better align financial reporting with the manner in which AIG’s chief operating decision makers have managed their businesses, in the three months ended March 31, 2007 AIG realigned certain products among reportable segments and major internal reporting units. AIG also began reporting realized capital gains and losses for the Financial Services and Asset Management segments in results of these segments. Historically, realized capital gains and losses were included in the Other category. There has been no change in AIG’s management structure or its reportable segments. All prior period amounts presented have been revised to conform to the current year’s presentation of these items. See “Financial Supplement (as Revised) 2005 - 2006”. General Insurance The Foreign Aviation business was transferred from the Domestic Brokerage Group to Foreign General. The Oil Rig and Marine businesses were transferred from Foreign General to the Domestic Brokerage Group. These transfers had no effect on total General Insurance operations. Life Insurance & Retirement Services / Asset Management Certain foreign investment contracts that had been historically reflected in the Asset Management segment as part of Guaranteed Investment Contracts are now being reflected as part of the Life Insurance & Retirement Services segment. Financial Services / Asset Management Historically certain realized capital gains and losses related to Financial Services and Asset Management segments had been reported as part of the Other category and not part of the Financial Services and Asset Management segments. These realized capital gains and losses are now part of the Financial Services and Asset Management segments. Asset Management Historically the elimination of the intercompany asset management fees charged by the Asset Management segment to other AIG subsidiaries had been eliminated within the Asset Management segment’s results. This elimination is now being reflected in the Consolidation and Eliminations adjustment column, which is part of the Other category.
i
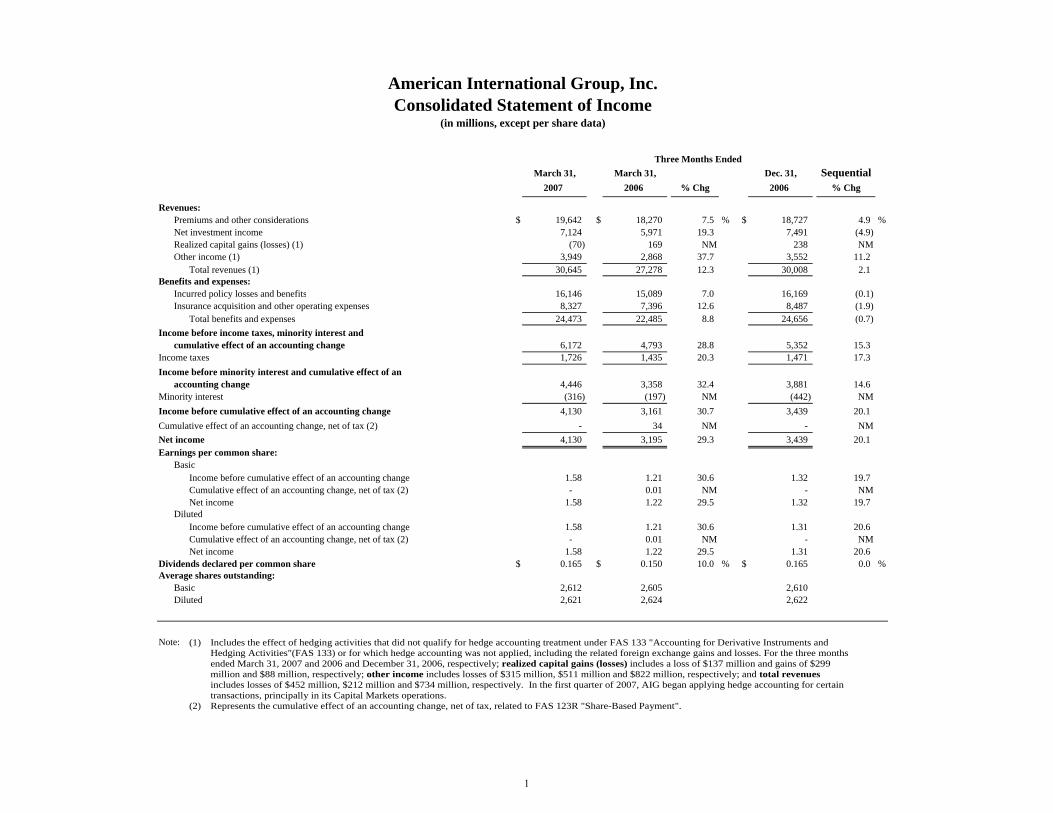
American International Group, Inc.Consolidated Statement of Income
(in millions, except per share data)
Three Months Ended March 31, March 31, Dec. 31, Sequential
2007 2006 % Chg 2006 % Chg
Revenues: Premiums and other considerations $ 19,642 $ 18,270 7.5 % $ 18,727 4.9 %Net investment income 7,124 5,971 19.3 7,491 (4.9)Realized capital gains (losses) (1) (70) 169 NM 238 NMOther income (1) 3,949 2,868 37.7 3,552 11.2
Total revenues (1) 30,645 27,278 12.3 30,008 2.1Benefits and expenses:
Incurred policy losses and benefits 16,146 15,089 7.0 16,169 (0.1)Insurance acquisition and other operating expenses 8,327 7,396 12.6 8,487 (1.9)
Total benefits and expenses 24,473 22,485 8.8 24,656 (0.7)Income before income taxes, minority interest and
cumulative effect of an accounting change 6,172 4,793 28.8 5,352 15.3Income taxes 1,726 1,435 20.3 1,471 17.3Income before minority interest and cumulative effect of an
accounting change 4,446 3,358 32.4 3,881 14.6Minority interest (316) (197) NM (442) NMIncome before cumulative effect of an accounting change 4,130 3,161 30.7 3,439 20.1Cumulative effect of an accounting change, net of tax (2) - 34 NM - NMNet income 4,130 3,195 29.3 3,439 20.1Earnings per common share:
BasicIncome before cumulative effect of an accounting change 1.58 1.21 30.6 1.32 19.7Cumulative effect of an accounting change, net of tax (2) - 0.01 NM - NMNet income 1.58 1.22 29.5 1.32 19.7
DilutedIncome before cumulative effect of an accounting change 1.58 1.21 30.6 1.31 20.6Cumulative effect of an accounting change, net of tax (2) - 0.01 NM - NMNet income 1.58 1.22 29.5 1.31 20.6
Dividends declared per common share $ 0.165 $ 0.150 10.0 % $ 0.165 0.0 %Average shares outstanding:
Basic 2,612 2,605 2,610 Diluted 2,621 2,624 2,622
Note: (1) Includes the effect of hedging activities that did not qualify for hedge accounting treatment under FAS 133 "Accounting for Derivative Instruments and Hedging Activities"(FAS 133) or for which hedge accounting was not applied, including the related foreign exchange gains and losses. For the three months ended March 31, 2007 and 2006 and December 31, 2006, respectively; realized capital gains (losses) includes a loss of $137 million and gains of $299 million and $88 million, respectively; other income includes losses of $315 million, $511 million and $822 million, respectively; and total revenues includes losses of $452 million, $212 million and $734 million, respectively. In the first quarter of 2007, AIG began applying hedge accounting for certain transactions, principally in its Capital Markets operations.
(2) Represents the cumulative effect of an accounting change, net of tax, related to FAS 123R "Share-Based Payment".
1
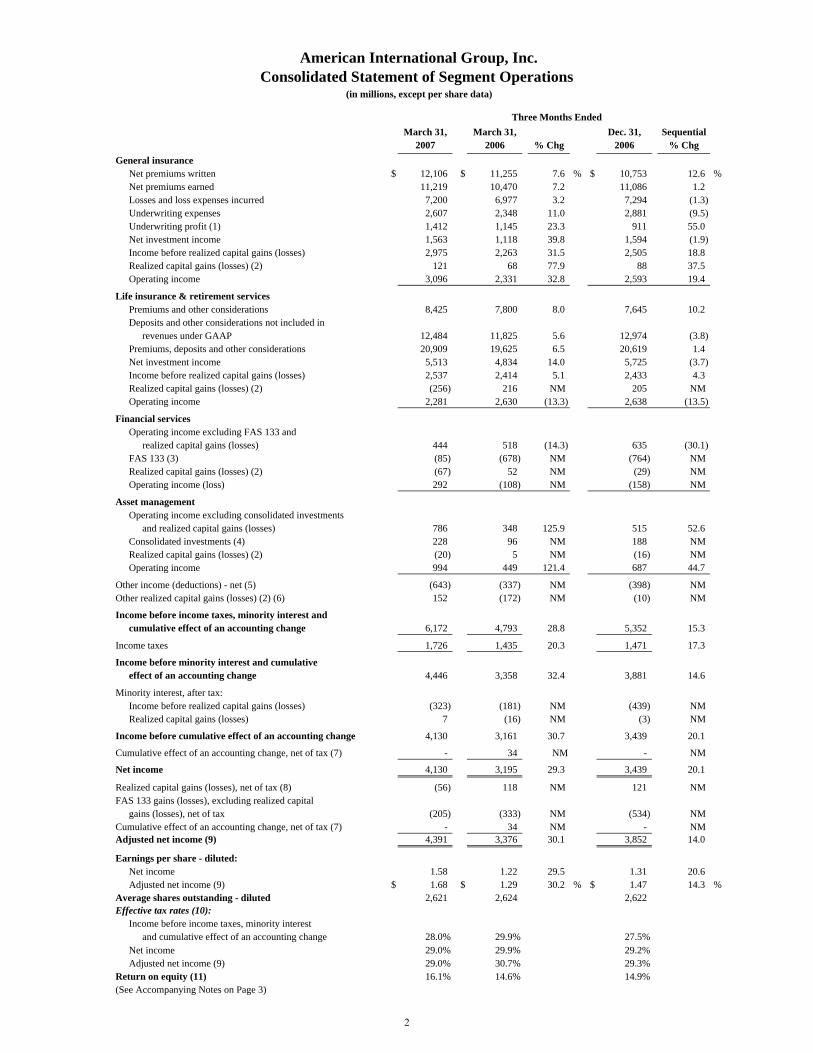
American International Group, Inc.Consolidated Statement of Segment Operations
(in millions, except per share data)
Three Months EndedMarch 31, March 31, Dec. 31, Sequential
2007 2006 % Chg 2006 % ChgGeneral insurance
Net premiums written $ 12,106 $ 11,255 7.6 % $ 10,753 12.6 %Net premiums earned 11,219 10,470 7.2 11,086 1.2Losses and loss expenses incurred 7,200 6,977 3.2 7,294 (1.3)Underwriting expenses 2,607 2,348 11.0 2,881 (9.5)Underwriting profit (1) 1,412 1,145 23.3 911 55.0Net investment income 1,563 1,118 39.8 1,594 (1.9)Income before realized capital gains (losses) 2,975 2,263 31.5 2,505 18.8Realized capital gains (losses) (2) 121 68 77.9 88 37.5Operating income 3,096 2,331 32.8 2,593 19.4
Life insurance & retirement services Premiums and other considerations 8,425 7,800 8.0 7,645 10.2Deposits and other considerations not included in
revenues under GAAP 12,484 11,825 5.6 12,974 (3.8)Premiums, deposits and other considerations 20,909 19,625 6.5 20,619 1.4Net investment income 5,513 4,834 14.0 5,725 (3.7)Income before realized capital gains (losses) 2,537 2,414 5.1 2,433 4.3Realized capital gains (losses) (2) (256) 216 NM 205 NM Operating income 2,281 2,630 (13.3) 2,638 (13.5)
Financial services Operating income excluding FAS 133 and
realized capital gains (losses) 444 518 (14.3) 635 (30.1)FAS 133 (3) (85) (678) NM (764) NM Realized capital gains (losses) (2) (67) 52 NM (29) NM Operating income (loss) 292 (108) NM (158) NM
Asset management Operating income excluding consolidated investments
and realized capital gains (losses) 786 348 125.9 515 52.6Consolidated investments (4) 228 96 NM 188 NM Realized capital gains (losses) (2) (20) 5 NM (16) NM Operating income 994 449 121.4 687 44.7
Other income (deductions) - net (5) (643) (337) NM (398) NM Other realized capital gains (losses) (2) (6) 152 (172) NM (10) NM
Income before income taxes, minority interest andcumulative effect of an accounting change 6,172 4,793 28.8 5,352 15.3
Income taxes 1,726 1,435 20.3 1,471 17.3
Income before minority interest and cumulativeeffect of an accounting change 4,446 3,358 32.4 3,881 14.6
Minority interest, after tax:Income before realized capital gains (losses) (323) (181) NM (439) NM Realized capital gains (losses) 7 (16) NM (3) NM
Income before cumulative effect of an accounting change 4,130 3,161 30.7 3,439 20.1
Cumulative effect of an accounting change, net of tax (7) - 34 NM - NM
Net income 4,130 3,195 29.3 3,439 20.1
Realized capital gains (losses), net of tax (8) (56) 118 NM 121 NM FAS 133 gains (losses), excluding realized capital
gains (losses), net of tax (205) (333) NM (534) NM Cumulative effect of an accounting change, net of tax (7) - 34 NM - NM Adjusted net income (9) 4,391 3,376 30.1 3,852 14.0
Earnings per share - diluted:Net income 1.58 1.22 29.5 1.31 20.6Adjusted net income (9) $ 1.68 $ 1.29 30.2 % $ 1.47 14.3 %
Average shares outstanding - diluted 2,621 2,624 2,622 Effective tax rates (10):
Income before income taxes, minority interestand cumulative effect of an accounting change 28.0% 29.9% 27.5%
Net income 29.0% 29.9% 29.2%Adjusted net income (9) 29.0% 30.7% 29.3%
Return on equity (11) 16.1% 14.6% 14.9%(See Accompanying Notes on Page 3)
2
American International Group, Inc. Consolidated Statement of Segment Operations
Notes
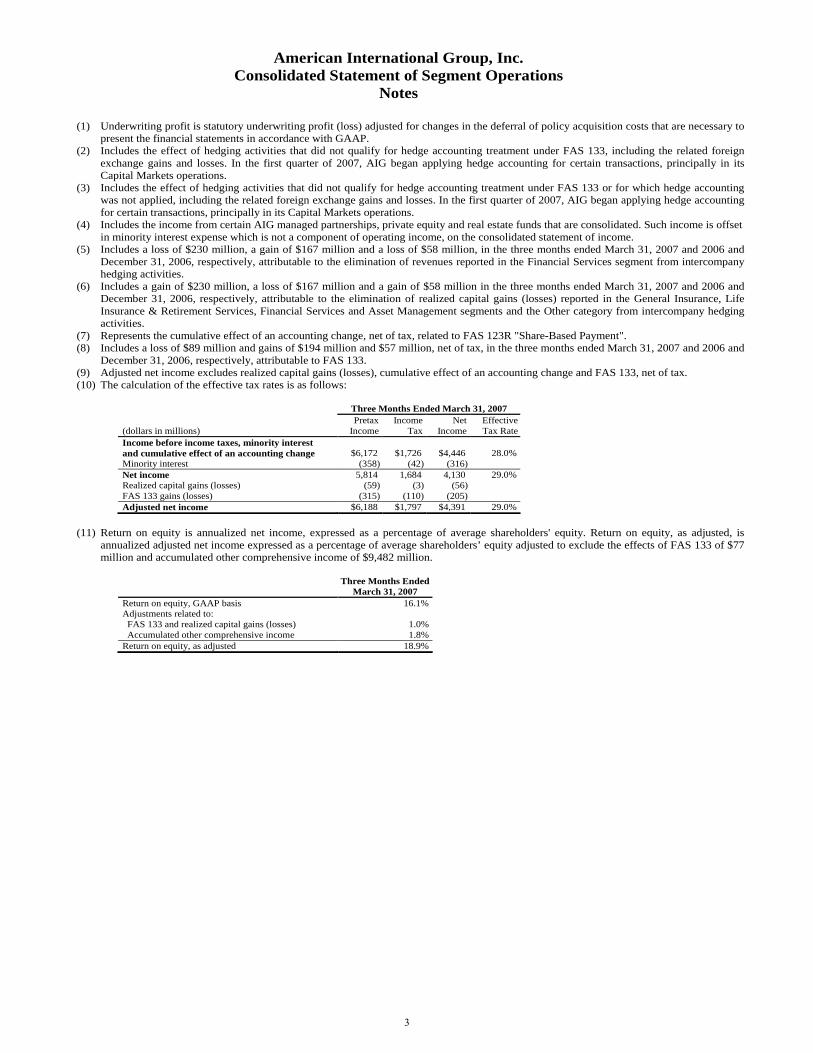
(1) Underwriting profit is statutory underwriting profit (loss) adjusted for changes in the deferral of policy acquisition costs that are necessary to
present the financial statements in accordance with GAAP. (2) Includes the effect of hedging activities that did not qualify for hedge accounting treatment under FAS 133, including the related foreign
exchange gains and losses. In the first quarter of 2007, AIG began applying hedge accounting for certain transactions, principally in its Capital Markets operations.
(3) Includes the effect of hedging activities that did not qualify for hedge accounting treatment under FAS 133 or for which hedge accounting was not applied, including the related foreign exchange gains and losses. In the first quarter of 2007, AIG began applying hedge accounting for certain transactions, principally in its Capital Markets operations.
(4) Includes the income from certain AIG managed partnerships, private equity and real estate funds that are consolidated. Such income is offset in minority interest expense which is not a component of operating income, on the consolidated statement of income.
(5) Includes a loss of $230 million, a gain of $167 million and a loss of $58 million, in the three months ended March 31, 2007 and 2006 and December 31, 2006, respectively, attributable to the elimination of revenues reported in the Financial Services segment from intercompany hedging activities.
(6) Includes a gain of $230 million, a loss of $167 million and a gain of $58 million in the three months ended March 31, 2007 and 2006 and December 31, 2006, respectively, attributable to the elimination of realized capital gains (losses) reported in the General Insurance, Life Insurance & Retirement Services, Financial Services and Asset Management segments and the Other category from intercompany hedging activities.
(7) Represents the cumulative effect of an accounting change, net of tax, related to FAS 123R "Share-Based Payment". (8) Includes a loss of $89 million and gains of $194 million and $57 million, net of tax, in the three months ended March 31, 2007 and 2006 and
December 31, 2006, respectively, attributable to FAS 133. (9) Adjusted net income excludes realized capital gains (losses), cumulative effect of an accounting change and FAS 133, net of tax. (10) The calculation of the effective tax rates is as follows:
(11) Return on equity is annualized net income, expressed as a percentage of average shareholders' equity. Return on equity, as adjusted, is
annualized adjusted net income expressed as a percentage of average shareholders’ equity adjusted to exclude the effects of FAS 133 of $77 million and accumulated other comprehensive income of $9,482 million.
Three Months Ended
March 31, 2007 Return on equity, GAAP basis 16.1%Adjustments related to: FAS 133 and realized capital gains (losses) 1.0% Accumulated other comprehensive income 1.8%Return on equity, as adjusted 18.9%
Three Months Ended March 31, 2007 Pretax Income Net Effective(dollars in millions) Income Tax Income Tax RateIncome before income taxes, minority interest and cumulative effect of an accounting change $6,172 $1,726 $4,446 28.0%Minority interest (358) (42) (316)Net income 5,814 1,684 4,130 29.0%Realized capital gains (losses) (59) (3) (56)FAS 133 gains (losses) (315) (110) (205)Adjusted net income $6,188 $1,797 $4,391 29.0%
3
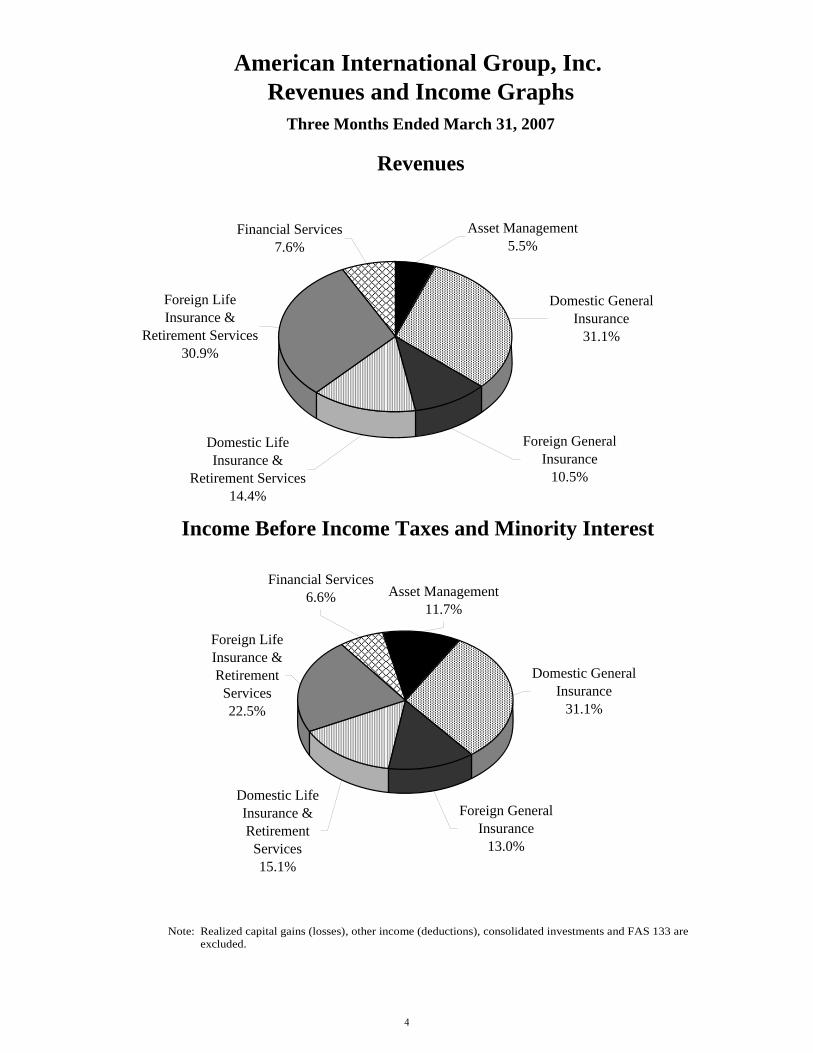
American International Group, Inc. Revenues and Income Graphs
Three Months Ended March 31, 2007
Revenues
Income Before Income Taxes and Minority Interest
Foreign Life Insurance &
Retirement Services30.9%
Asset Management5.5%
Financial Services7.6%
Domestic General Insurance
31.1%
Domestic Life Insurance &
Retirement Services14.4%
Foreign General Insurance
10.5%
Domestic General Insurance
31.1%
Foreign General Insurance
13.0%
Asset Management11.7%
Financial Services6.6%
Foreign Life Insurance & Retirement
Services22.5%
Domestic Life Insurance & Retirement
Services15.1%
Note: Realized capital gains (losses), other income (deductions), consolidated investments and FAS 133 are excluded.
4
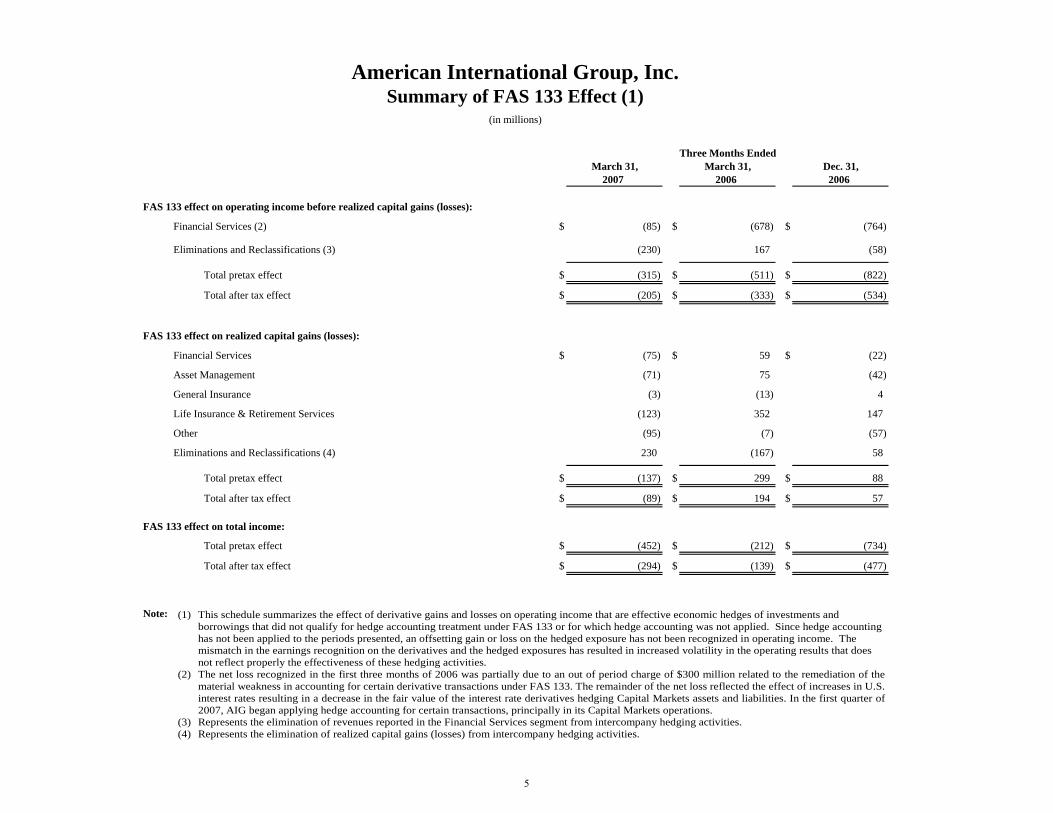
March 31, March 31, Dec. 31,2007 2006 2006
$ (85) $ (678) $ (764)
Eliminations and Reclassifications (3) (230) 167 (58)
Total pretax effect $ (315) $ (511) $ (822)
Total after tax effect $ (205) $ (333) $ (534)
$ (75) $ 59 $ (22)
(71) 75 (42)
(3) (13) 4
(123) 352 147
(95) (7) (57)
Eliminations and Reclassifications (4) 230 (167) 58
Total pretax effect $ (137) $ 299 $ 88
Total after tax effect $ (89) $ 194 $ 57
Total pretax effect $ (452) $ (212) $ (734)
Total after tax effect $ (294) $ (139) $ (477)
Note:
American International Group, Inc.Summary of FAS 133 Effect (1)
(in millions)
Financial Services
FAS 133 effect on operating income before realized capital gains (losses):
Three Months Ended
Financial Services (2)
Other
Asset Management
FAS 133 effect on realized capital gains (losses):
FAS 133 effect on total income:
General Insurance
Life Insurance & Retirement Services
(1) This schedule summarizes the effect of derivative gains and losses on operating income that are effective economic hedges of investments and borrowings that did not qualify for hedge accounting treatment under FAS 133 or for which hedge accounting was not applied. Since hedge accounting has not been applied to the periods presented, an offsetting gain or loss on the hedged exposure has not been recognized in operating income. The mismatch in the earnings recognition on the derivatives and the hedged exposures has resulted in increased volatility in the operating results that does not reflect properly the effectiveness of these hedging activities.
(2) The net loss recognized in the first three months of 2006 was partially due to an out of period charge of $300 million related to the remediation of the material weakness in accounting for certain derivative transactions under FAS 133. The remainder of the net loss reflected the effect of increases in U.S. interest rates resulting in a decrease in the fair value of the interest rate derivatives hedging Capital Markets assets and liabilities. In the first quarter of 2007, AIG began applying hedge accounting for certain transactions, principally in its Capital Markets operations.
(3) Represents the elimination of revenues reported in the Financial Services segment from intercompany hedging activities. (4) Represents the elimination of realized capital gains (losses) from intercompany hedging activities.
5
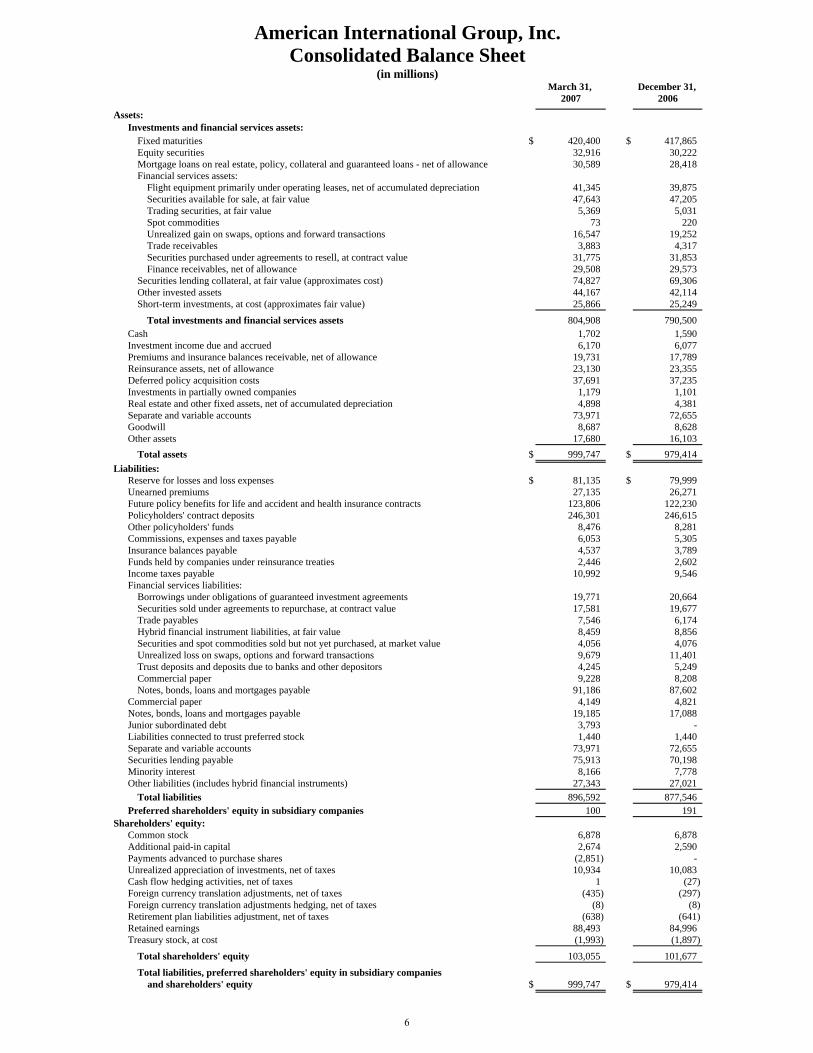
American International Group, Inc.Consolidated Balance Sheet
(in millions)March 31, December 31,
2007 2006
Assets:Investments and financial services assets:
Fixed maturities $ 420,400 $ 417,865 Equity securities 32,916 30,222 Mortgage loans on real estate, policy, collateral and guaranteed loans - net of allowance 30,589 28,418 Financial services assets:
Flight equipment primarily under operating leases, net of accumulated depreciation 41,345 39,875 Securities available for sale, at fair value 47,643 47,205 Trading securities, at fair value 5,369 5,031 Spot commodities 73 220 Unrealized gain on swaps, options and forward transactions 16,547 19,252 Trade receivables 3,883 4,317 Securities purchased under agreements to resell, at contract value 31,775 31,853 Finance receivables, net of allowance 29,508 29,573
Securities lending collateral, at fair value (approximates cost) 74,827 69,306 Other invested assets 44,167 42,114 Short-term investments, at cost (approximates fair value) 25,866 25,249
Total investments and financial services assets 804,908 790,500 1,702 1,590
Investment income due and accrued 6,170 6,077 Premiums and insurance balances receivable, net of allowance 19,731 17,789 Reinsurance assets, net of allowance 23,130 23,355 Deferred policy acquisition costs 37,691 37,235 Investments in partially owned companies 1,179 1,101 Real estate and other fixed assets, net of accumulated depreciation 4,898 4,381 Separate and variable accounts 73,971 72,655 Goodwill 8,687 8,628 Other assets 17,680 16,103
Total assets $ 999,747 $ 979,414 Liabilities:
Reserve for losses and loss expenses $ 81,135 $ 79,999 Unearned premiums 27,135 26,271 Future policy benefits for life and accident and health insurance contracts 123,806 122,230 Policyholders' contract deposits 246,301 246,615 Other policyholders' funds 8,476 8,281 Commissions, expenses and taxes payable 6,053 5,305 Insurance balances payable 4,537 3,789 Funds held by companies under reinsurance treaties 2,446 2,602 Income taxes payable 10,992 9,546 Financial services liabilities:
Borrowings under obligations of guaranteed investment agreements 19,771 20,664 Securities sold under agreements to repurchase, at contract value 17,581 19,677 Trade payables 7,546 6,174 Hybrid financial instrument liabilities, at fair value 8,459 8,856 Securities and spot commodities sold but not yet purchased, at market value 4,056 4,076 Unrealized loss on swaps, options and forward transactions 9,679 11,401 Trust deposits and deposits due to banks and other depositors 4,245 5,249 Commercial paper 9,228 8,208 Notes, bonds, loans and mortgages payable 91,186 87,602
Commercial paper 4,149 4,821 Notes, bonds, loans and mortgages payable 19,185 17,088 Junior subordinated debt 3,793 - Liabilities connected to trust preferred stock 1,440 1,440 Separate and variable accounts 73,971 72,655 Securities lending payable 75,913 70,198 Minority interest 8,166 7,778 Other liabilities (includes hybrid financial instruments) 27,343 27,021
Total liabilities 896,592 877,546 Preferred shareholders' equity in subsidiary companies 100 191
Shareholders' equity:Common stock 6,878 6,878 Additional paid-in capital 2,674 2,590 Payments advanced to purchase shares (2,851) - Unrealized appreciation of investments, net of taxes 10,934 10,083 Cash flow hedging activities, net of taxes 1 (27) Foreign currency translation adjustments, net of taxes (435) (297) Foreign currency translation adjustments hedging, net of taxes (8) (8) Retirement plan liabilities adjustment, net of taxes (638) (641) Retained earnings 88,493 84,996 Treasury stock, at cost (1,993) (1,897)
Total shareholders' equity 103,055 101,677
Total liabilities, preferred shareholders' equity in subsidiary companies and shareholders' equity $ 999,747 $ 979,414
Cash
6
Shareholders'Book Value EquityPer Share Shareholders' excluding
Book Value excluding Equity URA (1)Per Share URA (1) (in millions) (in millions)
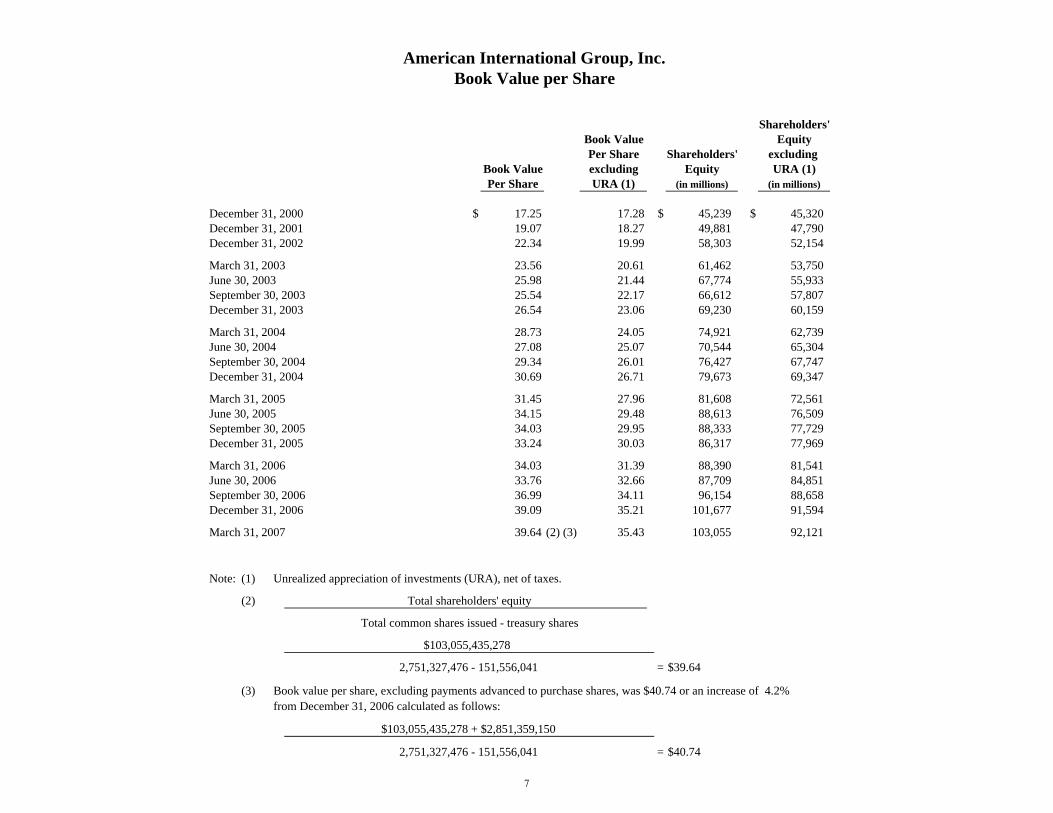
December 31, 2000 $ 17.25 17.28 $ 45,239 $ 45,320December 31, 2001 19.07 18.27 49,881 47,790December 31, 2002 22.34 19.99 58,303 52,154
March 31, 2003 23.56 20.61 61,462 53,750June 30, 2003 25.98 21.44 67,774 55,933September 30, 2003 25.54 22.17 66,612 57,807December 31, 2003 26.54 23.06 69,230 60,159
March 31, 2004 28.73 24.05 74,921 62,739June 30, 2004 27.08 25.07 70,544 65,304September 30, 2004 29.34 26.01 76,427 67,747December 31, 2004 30.69 26.71 79,673 69,347
March 31, 2005 31.45 27.96 81,608 72,561June 30, 2005 34.15 29.48 88,613 76,509September 30, 2005 34.03 29.95 88,333 77,729December 31, 2005 33.24 30.03 86,317 77,969
March 31, 2006 34.03 31.39 88,390 81,541June 30, 2006 33.76 32.66 87,709 84,851September 30, 2006 36.99 34.11 96,154 88,658December 31, 2006 39.09 35.21 101,677 91,594
March 31, 2007 39.64 (2) (3) 35.43 103,055 92,121
Note: (1) Unrealized appreciation of investments (URA), net of taxes.
(2) Total shareholders' equity
Total common shares issued - treasury shares
= $39.64
(3) Book value per share, excluding payments advanced to purchase shares, was $40.74 or an increase of 4.2% from December 31, 2006 calculated as follows:
= $40.74
American International Group, Inc.Book Value per Share
$103,055,435,278 + $2,851,359,150
2,751,327,476 - 151,556,041
$103,055,435,278
2,751,327,476 - 151,556,041
7
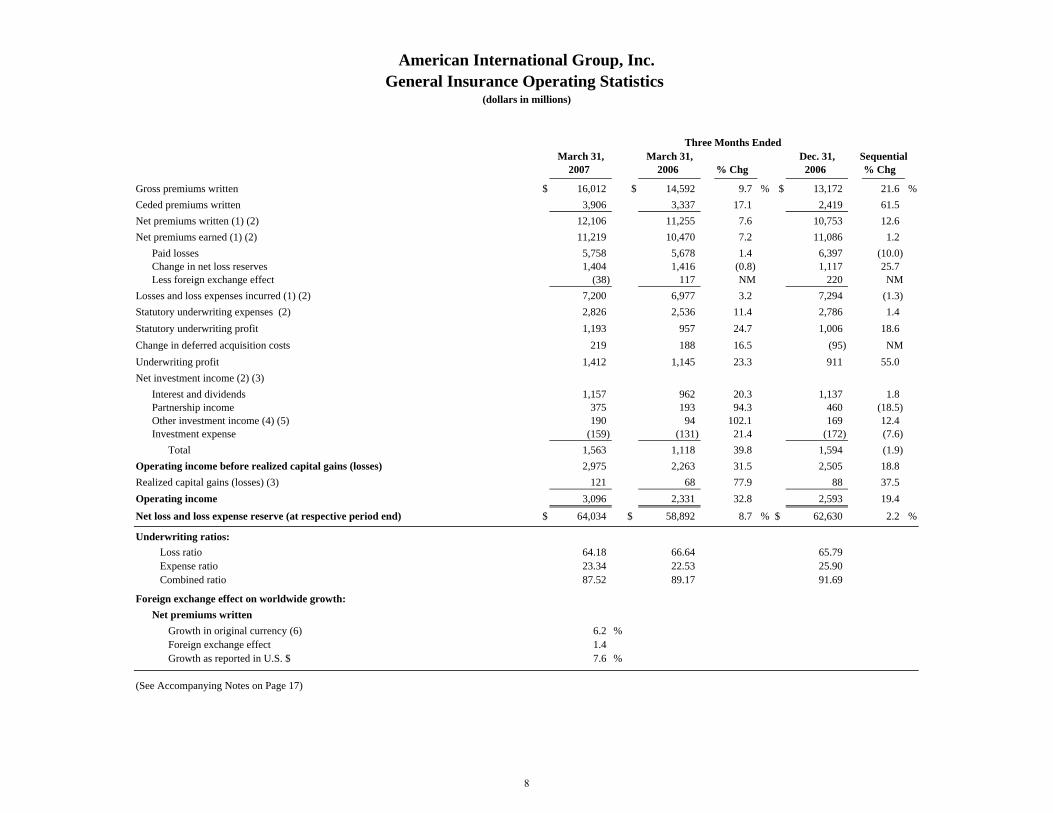
American International Group, Inc.General Insurance Operating Statistics
(dollars in millions)
March 31, March 31, Dec. 31, Sequential2007 2006 % Chg 2006 % Chg
Gross premiums written $ 16,012 $ 14,592 9.7 % $ 13,172 21.6 %Ceded premiums written 3,906 3,337 17.1 2,419 61.5Net premiums written (1) (2) 12,106 11,255 7.6 10,753 12.6Net premiums earned (1) (2) 11,219 10,470 7.2 11,086 1.2
Paid losses 5,758 5,678 1.4 6,397 (10.0)Change in net loss reserves 1,404 1,416 (0.8) 1,117 25.7Less foreign exchange effect (38) 117 NM 220 NM
Losses and loss expenses incurred (1) (2) 7,200 6,977 3.2 7,294 (1.3)Statutory underwriting expenses (2) 2,826 2,536 11.4 2,786 1.4Statutory underwriting profit 1,193 957 24.7 1,006 18.6Change in deferred acquisition costs 219 188 16.5 (95) NMUnderwriting profit 1,412 1,145 23.3 911 55.0Net investment income (2) (3)
Interest and dividends 1,157 962 20.3 1,137 1.8Partnership income 375 193 94.3 460 (18.5)Other investment income (4) (5) 190 94 102.1 169 12.4Investment expense (159) (131) 21.4 (172) (7.6)
Total 1,563 1,118 39.8 1,594 (1.9)Operating income before realized capital gains (losses) 2,975 2,263 31.5 2,505 18.8Realized capital gains (losses) (3) 121 68 77.9 88 37.5Operating income 3,096 2,331 32.8 2,593 19.4Net loss and loss expense reserve (at respective period end) $ 64,034 $ 58,892 8.7 % $ 62,630 2.2 %
Underwriting ratios: Loss ratio 64.18 66.64 65.79 Expense ratio 23.34 22.53 25.90 Combined ratio 87.52 89.17 91.69
Foreign exchange effect on worldwide growth:Net premiums written
Growth in original currency (6) 6.2 %Foreign exchange effect 1.4 Growth as reported in U.S. $ 7.6 %
(See Accompanying Notes on Page 17)
Three Months Ended
8
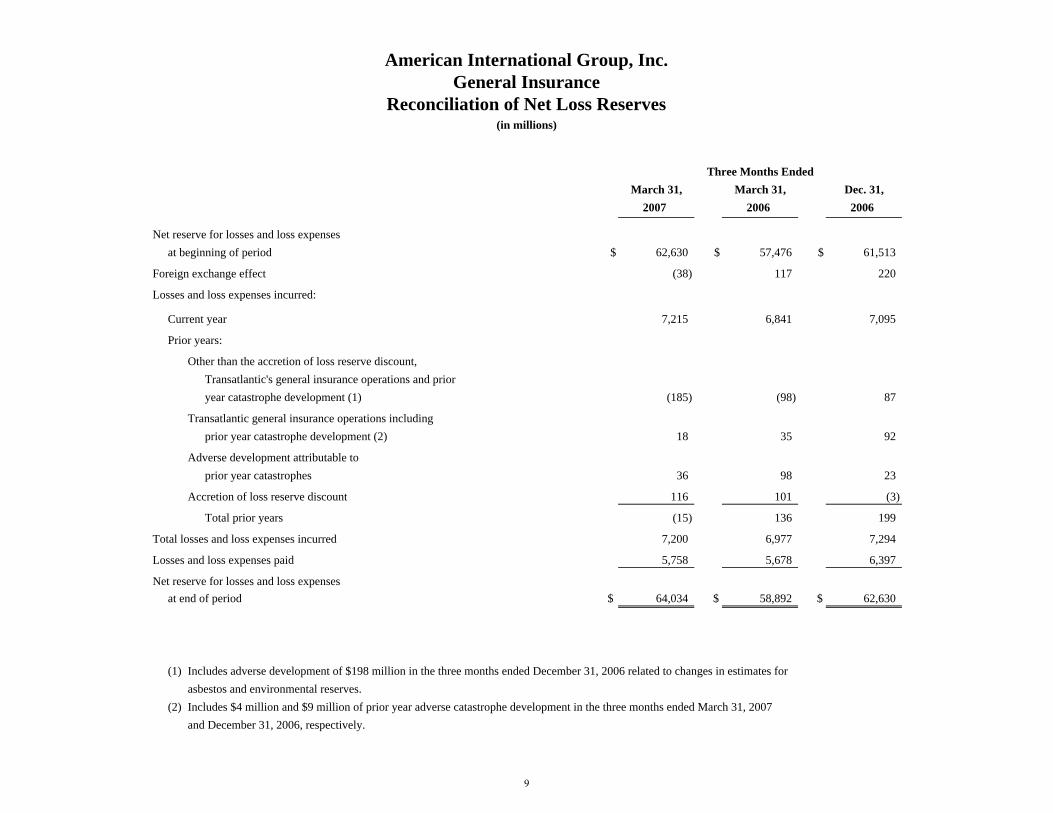
March 31, March 31, Dec. 31,2007 2006 2006
Net reserve for losses and loss expenses at beginning of period $ 62,630 $ 57,476 $ 61,513
Foreign exchange effect (38) 117 220
Losses and loss expenses incurred:
Current year 7,215 6,841 7,095
Prior years:
Other than the accretion of loss reserve discount,Transatlantic's general insurance operations and prioryear catastrophe development (1) (185) (98) 87
Transatlantic general insurance operations includingprior year catastrophe development (2) 18 35 92
Adverse development attributable to prior year catastrophes 36 98 23
Accretion of loss reserve discount 116 101 (3)
Total prior years (15) 136 199
Total losses and loss expenses incurred 7,200 6,977 7,294
Losses and loss expenses paid 5,758 5,678 6,397
Net reserve for losses and loss expenses at end of period $ 64,034 $ 58,892 $ 62,630
(1) Includes adverse development of $198 million in the three months ended December 31, 2006 related to changes in estimates for asbestos and environmental reserves.
(2) Includes $4 million and $9 million of prior year adverse catastrophe development in the three months ended March 31, 2007and December 31, 2006, respectively.
(in millions)
Three Months Ended
American International Group, Inc.General Insurance
Reconciliation of Net Loss Reserves
9
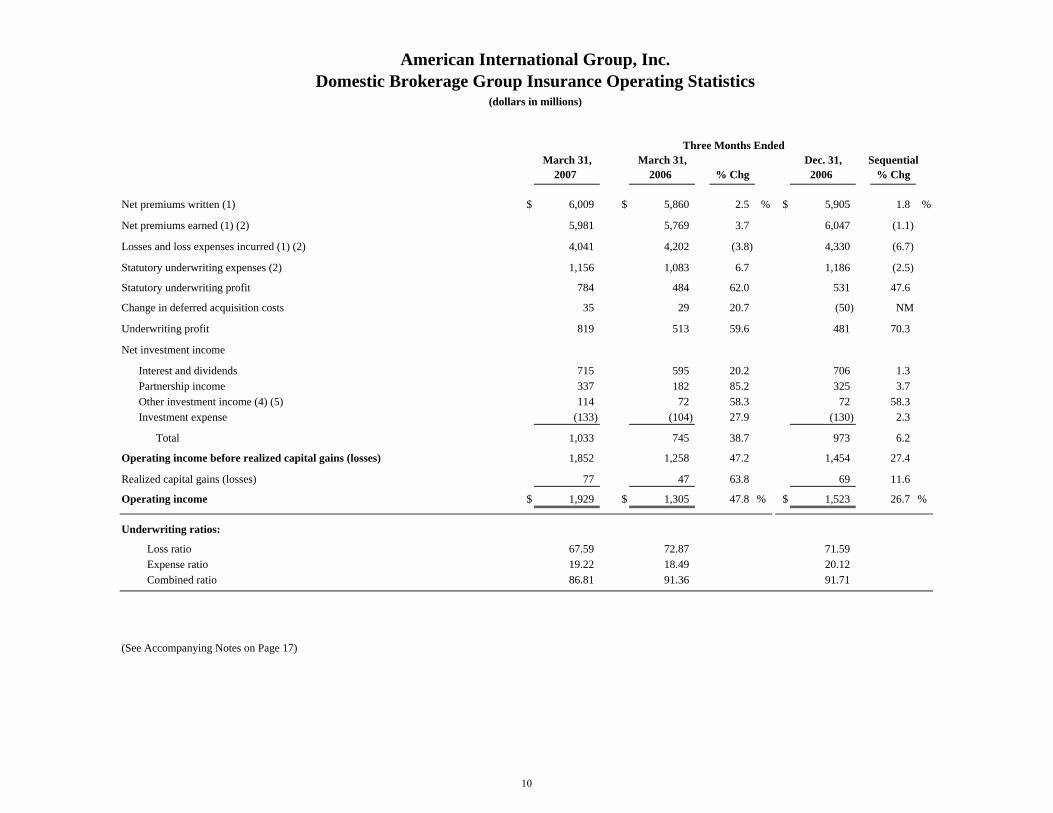
American International Group, Inc.Domestic Brokerage Group Insurance Operating Statistics
(dollars in millions)
Three Months Ended March 31, March 31, Dec. 31, Sequential
2007 2006 % Chg 2006 % Chg
Net premiums written (1) $ 6,009 $ 5,860 2.5 % $ 5,905 1.8 %
Net premiums earned (1) (2) 5,981 5,769 3.7 6,047 (1.1)
Losses and loss expenses incurred (1) (2) 4,041 4,202 (3.8) 4,330 (6.7)
Statutory underwriting expenses (2) 1,156 1,083 6.7 1,186 (2.5)
Statutory underwriting profit 784 484 62.0 531 47.6
Change in deferred acquisition costs 35 29 20.7 (50) NM
Underwriting profit 819 513 59.6 481 70.3
Net investment income
Interest and dividends 715 595 20.2 706 1.3Partnership income 337 182 85.2 325 3.7Other investment income (4) (5) 114 72 58.3 72 58.3Investment expense (133) (104) 27.9 (130) 2.3
Total 1,033 745 38.7 973 6.2
Operating income before realized capital gains (losses) 1,852 1,258 47.2 1,454 27.4
Realized capital gains (losses) 77 47 63.8 69 11.6
Operating income $ 1,929 $ 1,305 47.8 % $ 1,523 26.7 %
Underwriting ratios:
Loss ratio 67.59 72.87 71.59 Expense ratio 19.22 18.49 20.12 Combined ratio 86.81 91.36 91.71
(See Accompanying Notes on Page 17)
10
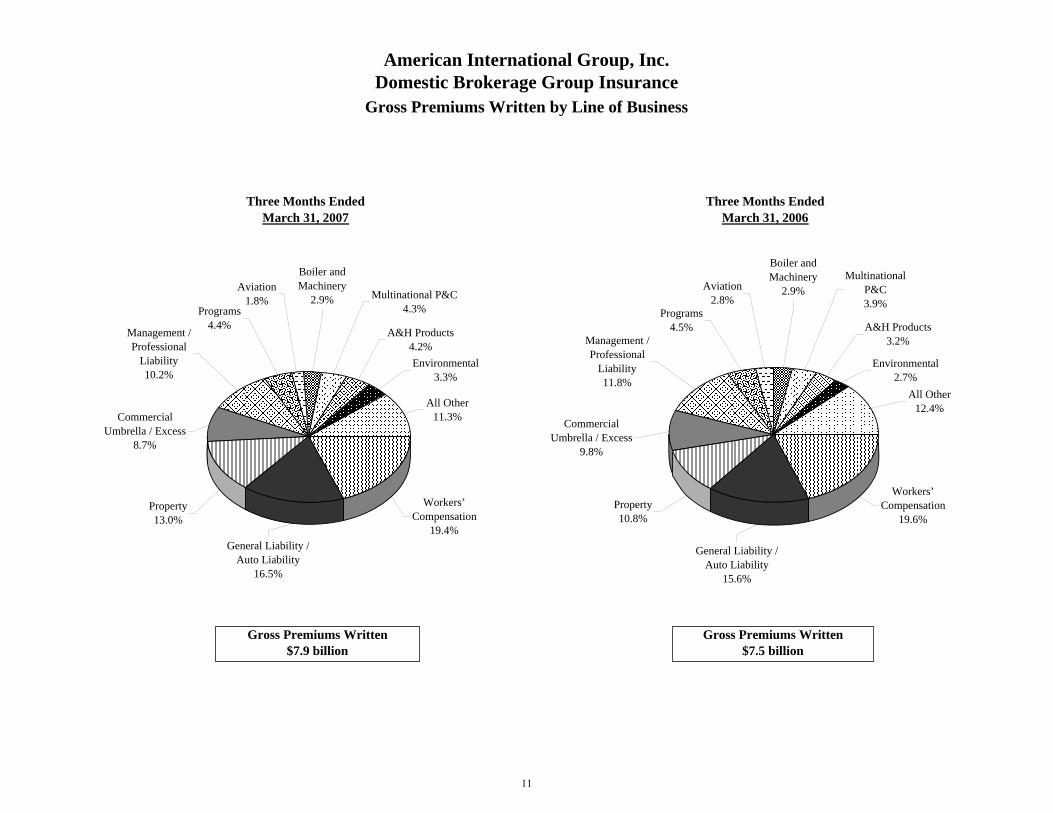
American International Group, Inc.Domestic Brokerage Group Insurance
Gross Premiums Written by Line of Business
Three Months Ended Three Months EndedMarch 31, 2007 March 31, 2006
Gross Premiums Written $7.5 billion
Gross Premiums Written $7.9 billion
Multinational P&C3.9%
General Liability / Auto Liability
15.6%
Management / Professional
Liability11.8%
Property10.8%
Commercial Umbrella / Excess
9.8%
Workers’ Compensation
19.6%
Programs4.5%
All Other12.4%
Environmental2.7%
A&H Products3.2%
Boiler and Machinery
2.9%Aviation2.8%
Programs4.4%
Aviation1.8%
Management / Professional
Liability10.2%
Boiler and Machinery
2.9% Multinational P&C4.3%
A&H Products4.2%
Commercial Umbrella / Excess
8.7%
Property13.0%
General Liability / Auto Liability
16.5%
Workers’ Compensation
19.4%
All Other11.3%
Environmental3.3%
11
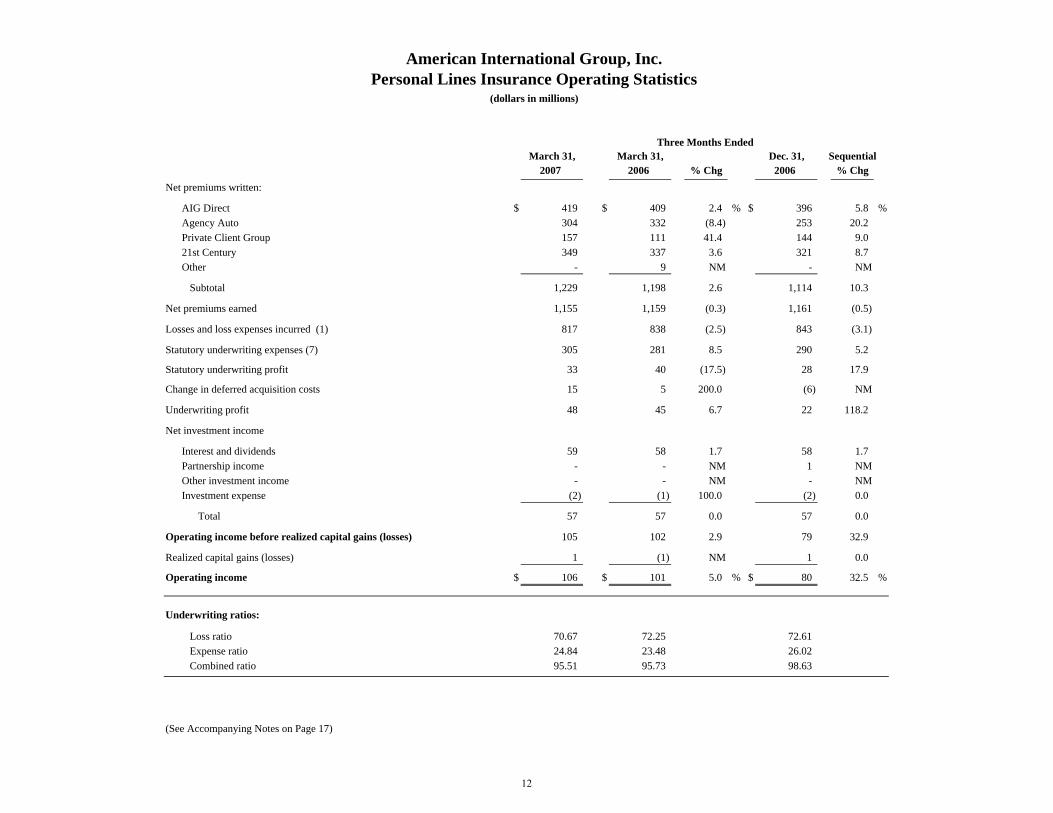
American International Group, Inc.Personal Lines Insurance Operating Statistics
(dollars in millions)
Three Months Ended March 31, March 31, Dec. 31, Sequential
2007 2006 % Chg 2006 % ChgNet premiums written:
AIG Direct $ 419 $ 409 2.4 % $ 396 5.8 %Agency Auto 304 332 (8.4) 253 20.2Private Client Group 157 111 41.4 144 9.021st Century 349 337 3.6 321 8.7Other - 9 NM - NM
Subtotal 1,229 1,198 2.6 1,114 10.3
Net premiums earned 1,155 1,159 (0.3) 1,161 (0.5)
Losses and loss expenses incurred (1) 817 838 (2.5) 843 (3.1)
Statutory underwriting expenses (7) 305 281 8.5 290 5.2
Statutory underwriting profit 33 40 (17.5) 28 17.9
Change in deferred acquisition costs 15 5 200.0 (6) NM
Underwriting profit 48 45 6.7 22 118.2
Net investment income
Interest and dividends 59 58 1.7 58 1.7Partnership income - - NM 1 NMOther investment income - - NM - NMInvestment expense (2) (1) 100.0 (2) 0.0
Total 57 57 0.0 57 0.0
Operating income before realized capital gains (losses) 105 102 2.9 79 32.9
Realized capital gains (losses) 1 (1) NM 1 0.0
Operating income $ 106 $ 101 5.0 % $ 80 32.5 %
Underwriting ratios:
Loss ratio 70.67 72.25 72.61 Expense ratio 24.84 23.48 26.02 Combined ratio 95.51 95.73 98.63
(See Accompanying Notes on Page 17)
12
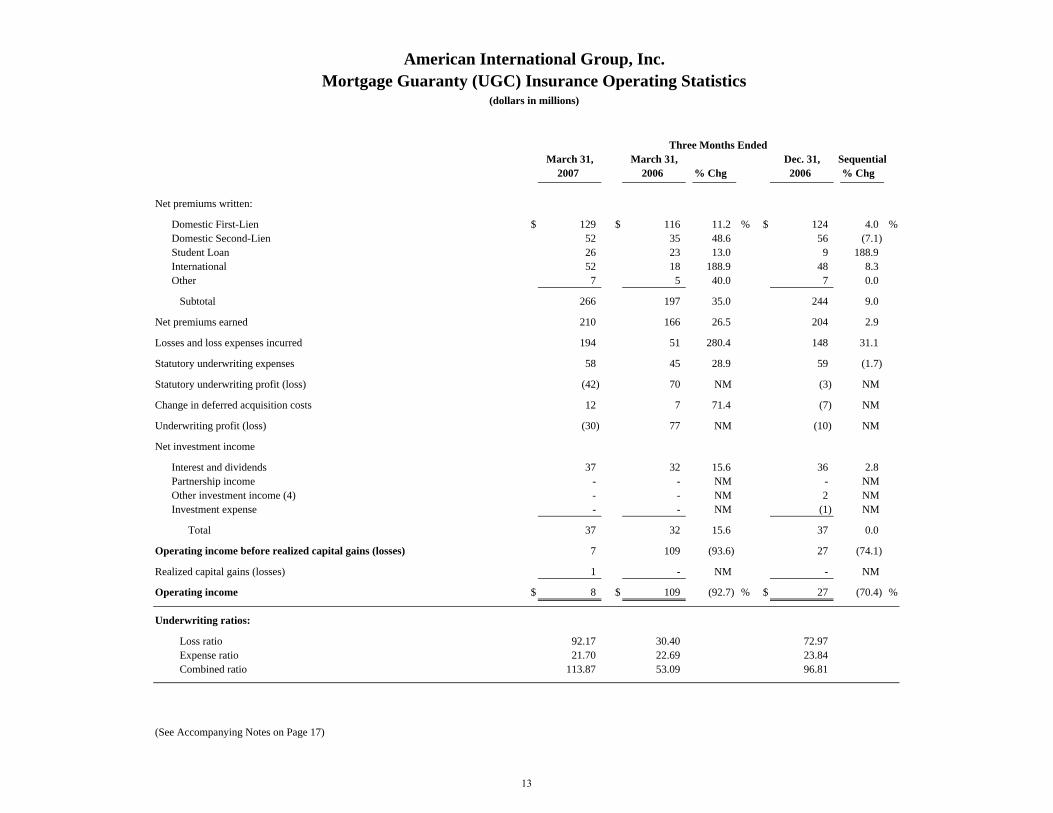
American International Group, Inc.Mortgage Guaranty (UGC) Insurance Operating Statistics
(dollars in millions)
Three Months Ended March 31, March 31, Dec. 31, Sequential
2007 2006 % Chg 2006 % Chg
Net premiums written:
Domestic First-Lien $ 129 $ 116 11.2 % $ 124 4.0 %Domestic Second-Lien 52 35 48.6 56 (7.1)Student Loan 26 23 13.0 9 188.9International 52 18 188.9 48 8.3Other 7 5 40.0 7 0.0
Subtotal 266 197 35.0 244 9.0
Net premiums earned 210 166 26.5 204 2.9
Losses and loss expenses incurred 194 51 280.4 148 31.1
Statutory underwriting expenses 58 45 28.9 59 (1.7)
Statutory underwriting profit (loss) (42) 70 NM (3) NM
Change in deferred acquisition costs 12 7 71.4 (7) NM
Underwriting profit (loss) (30) 77 NM (10) NM
Net investment income
Interest and dividends 37 32 15.6 36 2.8Partnership income - - NM - NM Other investment income (4) - - NM 2 NM Investment expense - - NM (1) NM
Total 37 32 15.6 37 0.0
Operating income before realized capital gains (losses) 7 109 (93.6) 27 (74.1)
Realized capital gains (losses) 1 - NM - NM
Operating income $ 8 $ 109 (92.7) % $ 27 (70.4) %
Underwriting ratios:
Loss ratio 92.17 30.40 72.97 Expense ratio 21.70 22.69 23.84 Combined ratio 113.87 53.09 96.81
(See Accompanying Notes on Page 17)
13
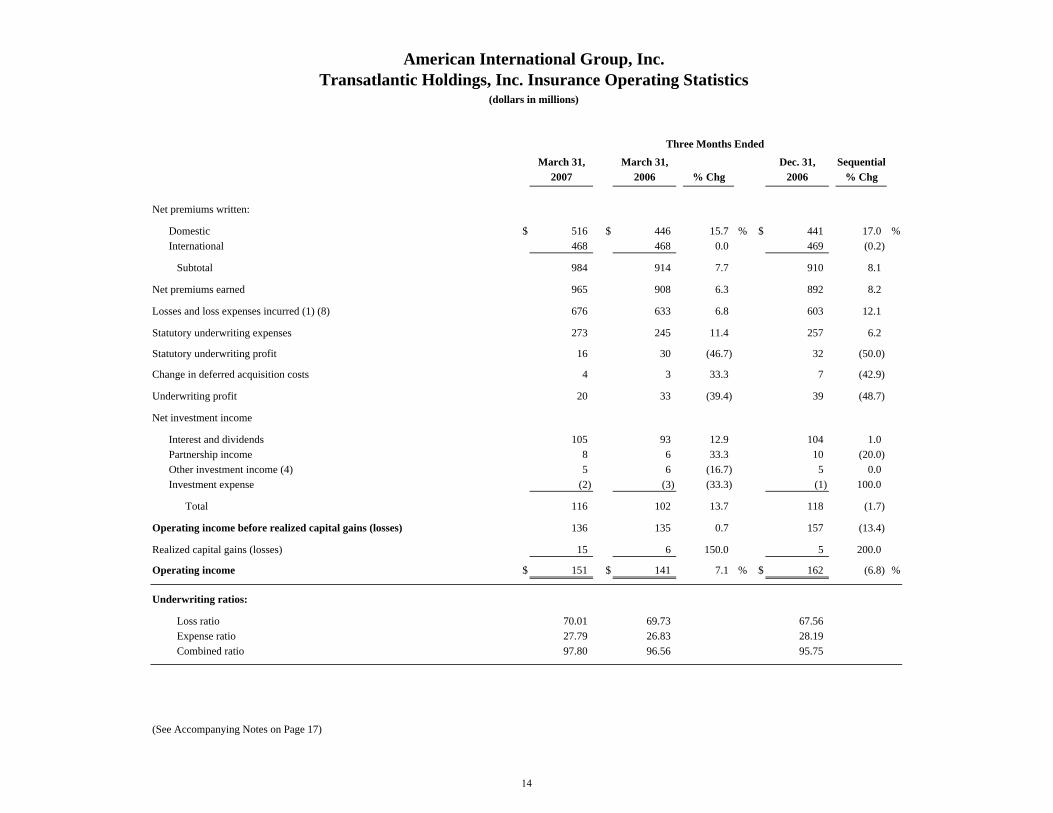
American International Group, Inc.Transatlantic Holdings, Inc. Insurance Operating Statistics
(dollars in millions)
Three Months Ended
March 31, March 31, Dec. 31, Sequential2007 2006 % Chg 2006 % Chg
Net premiums written:
Domestic $ 516 $ 446 15.7 % $ 441 17.0 %International 468 468 0.0 469 (0.2)
Subtotal 984 914 7.7 910 8.1
Net premiums earned 965 908 6.3 892 8.2
Losses and loss expenses incurred (1) (8) 676 633 6.8 603 12.1
Statutory underwriting expenses 273 245 11.4 257 6.2
Statutory underwriting profit 16 30 (46.7) 32 (50.0)
Change in deferred acquisition costs 4 3 33.3 7 (42.9)
Underwriting profit 20 33 (39.4) 39 (48.7)
Net investment income
Interest and dividends 105 93 12.9 104 1.0Partnership income 8 6 33.3 10 (20.0)Other investment income (4) 5 6 (16.7) 5 0.0Investment expense (2) (3) (33.3) (1) 100.0
Total 116 102 13.7 118 (1.7)
Operating income before realized capital gains (losses) 136 135 0.7 157 (13.4)
Realized capital gains (losses) 15 6 150.0 5 200.0
Operating income $ 151 $ 141 7.1 % $ 162 (6.8) %
Underwriting ratios:
Loss ratio 70.01 69.73 67.56 Expense ratio 27.79 26.83 28.19 Combined ratio 97.80 96.56 95.75
(See Accompanying Notes on Page 17)
14
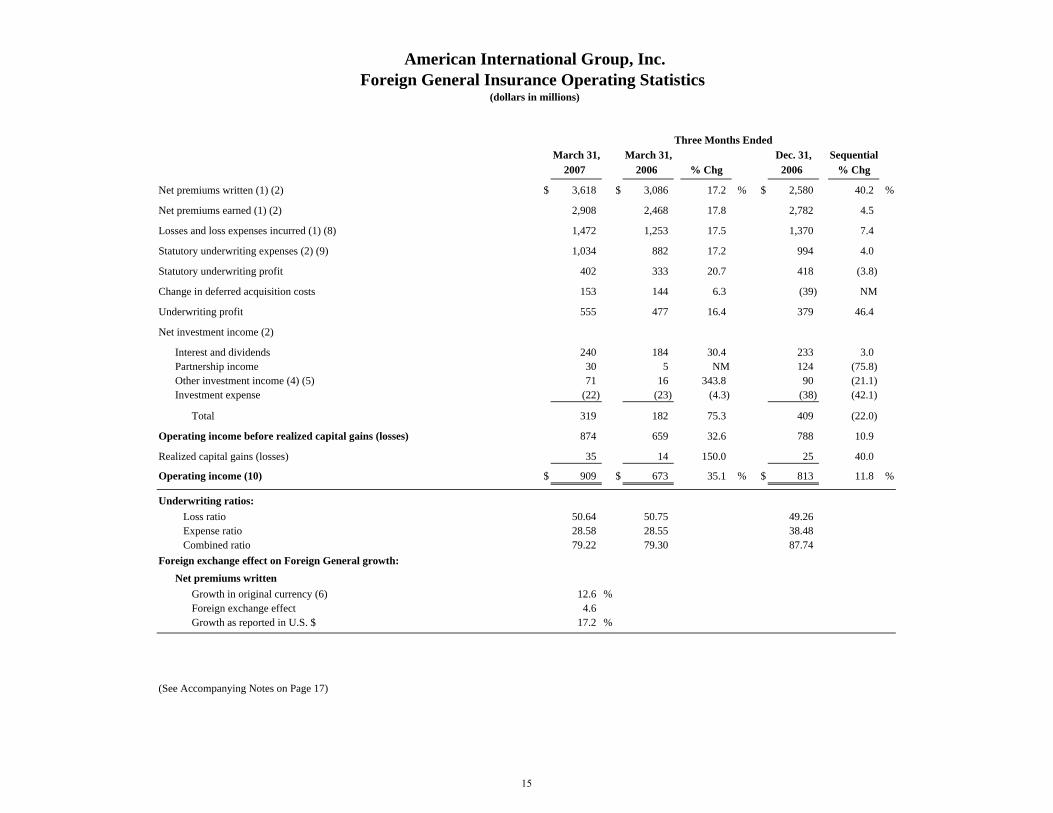
American International Group, Inc.Foreign General Insurance Operating Statistics
(dollars in millions)
Three Months Ended March 31, March 31, Dec. 31, Sequential
2007 2006 % Chg 2006 % Chg
Net premiums written (1) (2) $ 3,618 $ 3,086 17.2 % $ 2,580 40.2 %
Net premiums earned (1) (2) 2,908 2,468 17.8 2,782 4.5
Losses and loss expenses incurred (1) (8) 1,472 1,253 17.5 1,370 7.4
Statutory underwriting expenses (2) (9) 1,034 882 17.2 994 4.0
Statutory underwriting profit 402 333 20.7 418 (3.8)
Change in deferred acquisition costs 153 144 6.3 (39) NM
Underwriting profit 555 477 16.4 379 46.4
Net investment income (2)
Interest and dividends 240 184 30.4 233 3.0Partnership income 30 5 NM 124 (75.8)Other investment income (4) (5) 71 16 343.8 90 (21.1)Investment expense (22) (23) (4.3) (38) (42.1)
Total 319 182 75.3 409 (22.0)
Operating income before realized capital gains (losses) 874 659 32.6 788 10.9
Realized capital gains (losses) 35 14 150.0 25 40.0
Operating income (10) $ 909 $ 673 35.1 % $ 813 11.8 %
Underwriting ratios: Loss ratio 50.64 50.75 49.26 Expense ratio 28.58 28.55 38.48 Combined ratio 79.22 79.30 87.74
Foreign exchange effect on Foreign General growth:Net premiums written
Growth in original currency (6) 12.6 %Foreign exchange effect 4.6 Growth as reported in U.S. $ 17.2 %
(See Accompanying Notes on Page 17)
15
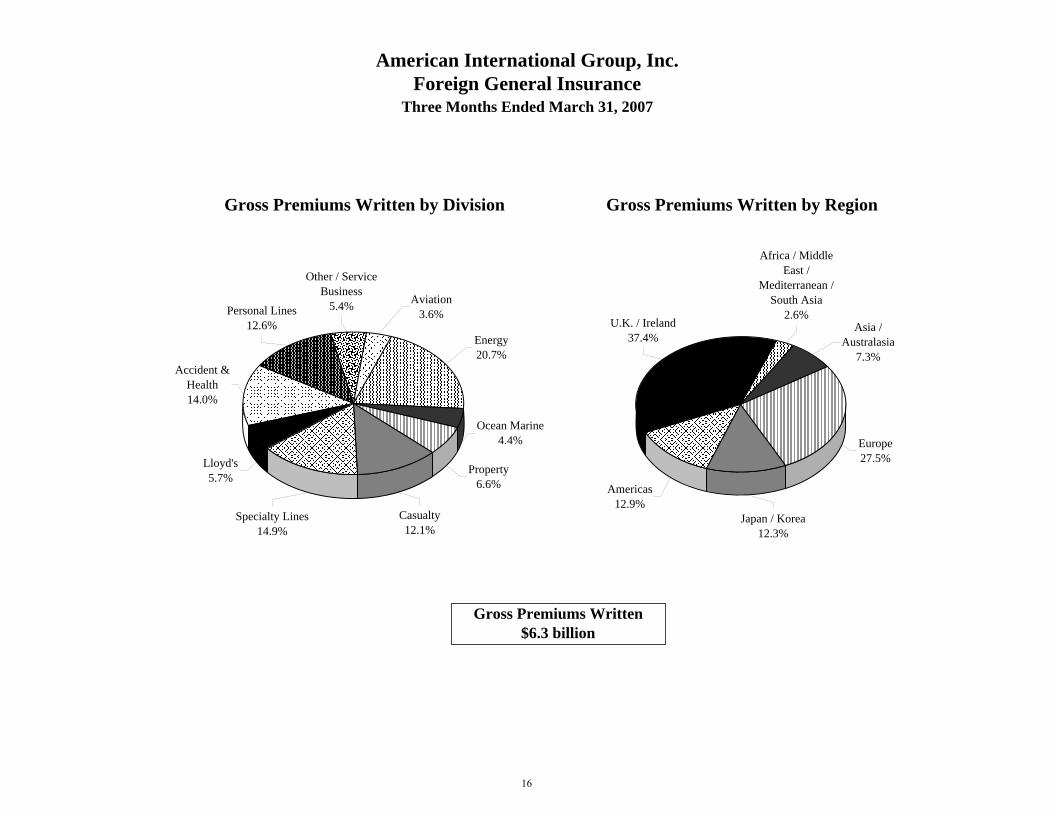
Gross Premiums Written by Division
American International Group, Inc.Foreign General Insurance
Three Months Ended March 31, 2007
Gross Premiums Written by Region
Aviation3.6%
Other / Service Business
5.4%Personal Lines12.6%
Accident & Health14.0%
Lloyd's5.7%
Specialty Lines14.9%
Casualty12.1%
Property6.6%
Ocean Marine4.4%
Energy20.7%
U.K. / Ireland37.4%
Africa / Middle East /
Mediterranean / South Asia
2.6%
Japan / Korea12.3%
Europe27.5%
Americas12.9%
Asia / Australasia
7.3%
Gross Premiums Written $6.3 billion
16
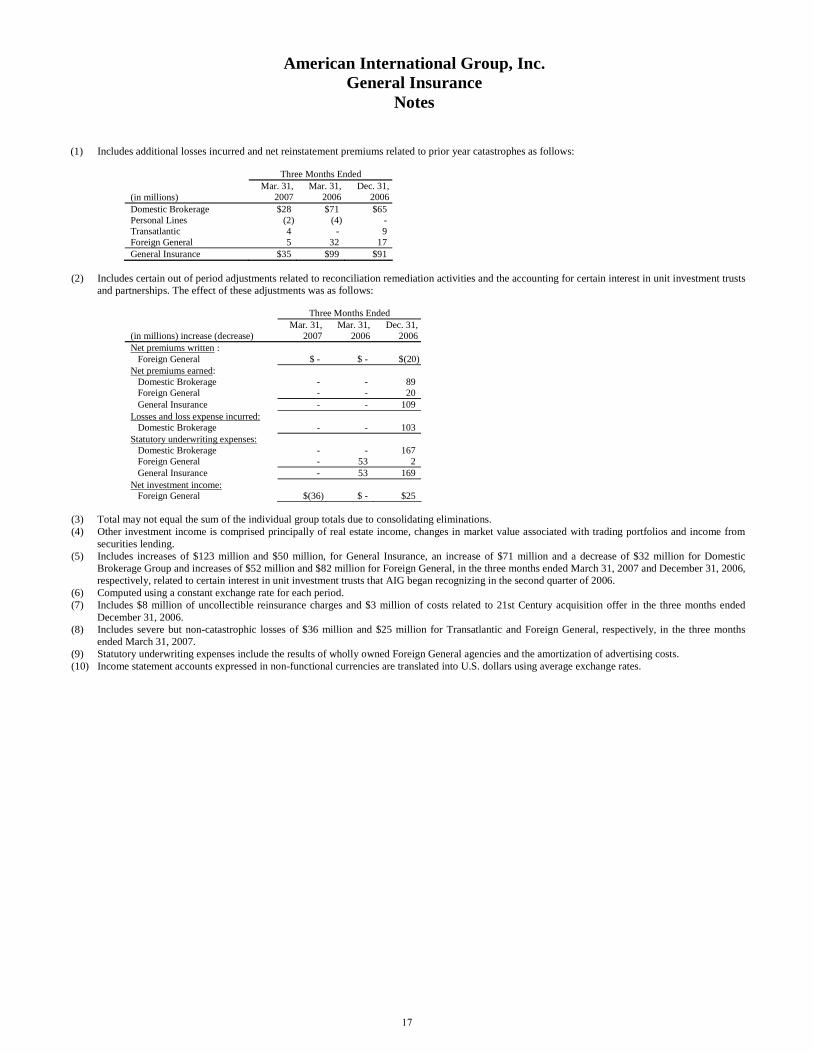
(1) Includes additional losses incurred and net reinstatement premiums related to prior year catastrophes as follows:
(2) Includes certain out of period adjustments related to reconciliation remediation activities and the accounting for certain interest in unit investment trusts
and partnerships. The effect of these adjustments was as follows:
Three Months Ended
(in millions) increase (decrease) Mar. 31,
2007 Mar. 31,
2006Dec. 31,
2006Net premiums written : Foreign General $ - $ - $(20)Net premiums earned: Domestic Brokerage - - 89 Foreign General - - 20 General Insurance - - 109 Losses and loss expense incurred: Domestic Brokerage - - 103 Statutory underwriting expenses: Domestic Brokerage - - 167 Foreign General - 53 2 General Insurance - 53 169 Net investment income: Foreign General $(36) $ - $25
(3) Total may not equal the sum of the individual group totals due to consolidating eliminations. (4) Other investment income is comprised principally of real estate income, changes in market value associated with trading portfolios and income from
securities lending. (5) Includes increases of $123 million and $50 million, for General Insurance, an increase of $71 million and a decrease of $32 million for Domestic
Brokerage Group and increases of $52 million and $82 million for Foreign General, in the three months ended March 31, 2007 and December 31, 2006, respectively, related to certain interest in unit investment trusts that AIG began recognizing in the second quarter of 2006.
(6) Computed using a constant exchange rate for each period. (7) Includes $8 million of uncollectible reinsurance charges and $3 million of costs related to 21st Century acquisition offer in the three months ended
December 31, 2006. (8) Includes severe but non-catastrophic losses of $36 million and $25 million for Transatlantic and Foreign General, respectively, in the three months
ended March 31, 2007. (9) Statutory underwriting expenses include the results of wholly owned Foreign General agencies and the amortization of advertising costs. (10) Income statement accounts expressed in non-functional currencies are translated into U.S. dollars using average exchange rates.
Three Months Ended
(in millions) Mar. 31,
2007 Mar. 31,
2006Dec. 31,
2006Domestic Brokerage $28 $71 $65 Personal Lines (2) (4) - Transatlantic 4 - 9 Foreign General 5 32 17 General Insurance $35 $99 $91
American International Group, Inc. General Insurance
Notes
17
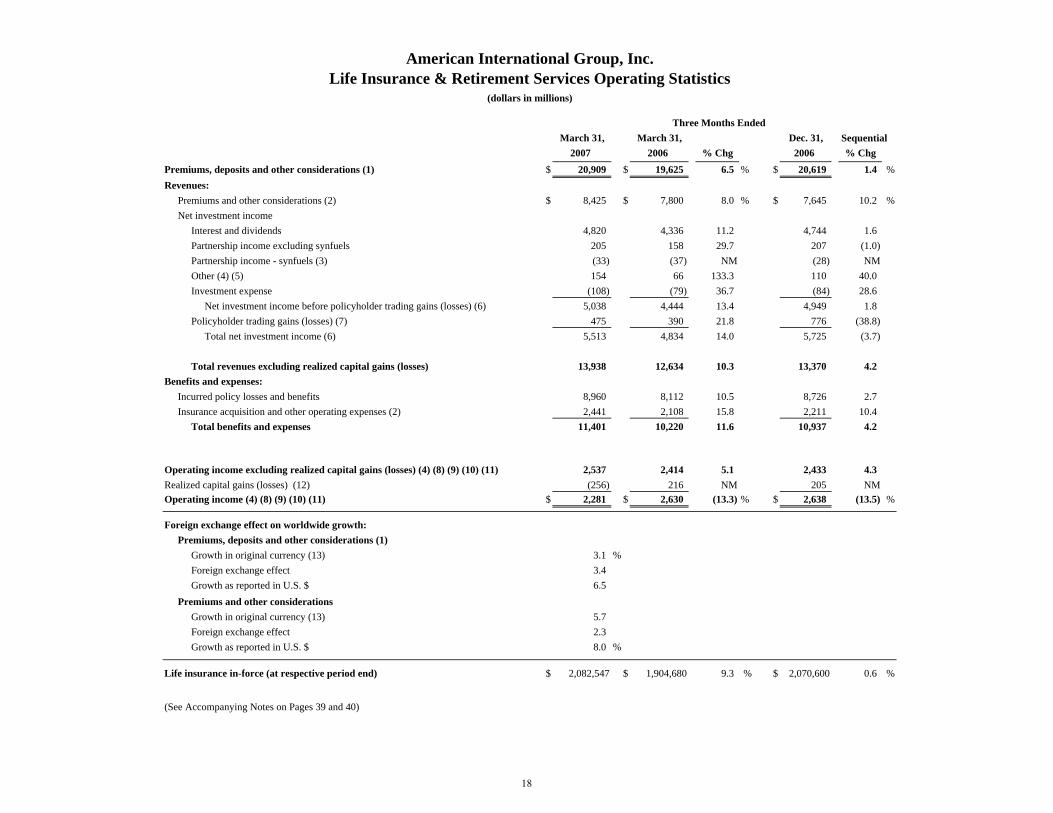
American International Group, Inc.Life Insurance & Retirement Services Operating Statistics
(dollars in millions)
Three Months EndedMarch 31, March 31, Dec. 31,
2007 2006 % Chg 2006 % ChgPremiums, deposits and other considerations (1) $ 20,909 $ 19,625 6.5 % $ 20,619 1.4 %Revenues:
Premiums and other considerations (2) $ 8,425 $ 7,800 8.0 % $ 7,645 10.2 %Net investment income
Interest and dividends 4,820 4,336 11.2 4,744 1.6Partnership income excluding synfuels 205 158 29.7 207 (1.0)Partnership income - synfuels (3) (33) (37) NM (28) NMOther (4) (5) 154 66 133.3 110 40.0Investment expense (108) (79) 36.7 (84) 28.6
Net investment income before policyholder trading gains (losses) (6) 5,038 4,444 13.4 4,949 1.8Policyholder trading gains (losses) (7) 475 390 21.8 776 (38.8)
Total net investment income (6) 5,513 4,834 14.0 5,725 (3.7)
Total revenues excluding realized capital gains (losses) 13,938 12,634 10.3 13,370 4.2Benefits and expenses:
Incurred policy losses and benefits 8,960 8,112 10.5 8,726 2.7Insurance acquisition and other operating expenses (2) 2,441 2,108 15.8 2,211 10.4
Total benefits and expenses 11,401 10,220 11.6 10,937 4.2
Operating income excluding realized capital gains (losses) (4) (8) (9) (10) (11) 2,537 2,414 5.1 2,433 4.3Realized capital gains (losses) (12) (256) 216 NM 205 NMOperating income (4) (8) (9) (10) (11) $ 2,281 $ 2,630 (13.3) % $ 2,638 (13.5) %
Foreign exchange effect on worldwide growth:Premiums, deposits and other considerations (1)
Growth in original currency (13) 3.1 %Foreign exchange effect 3.4Growth as reported in U.S. $ 6.5
Premiums and other considerations Growth in original currency (13) 5.7Foreign exchange effect 2.3Growth as reported in U.S. $ 8.0 %
Life insurance in-force (at respective period end) $ 2,082,547 $ 1,904,680 9.3 % $ 2,070,600 0.6 %
(See Accompanying Notes on Pages 39 and 40)
Sequential
18
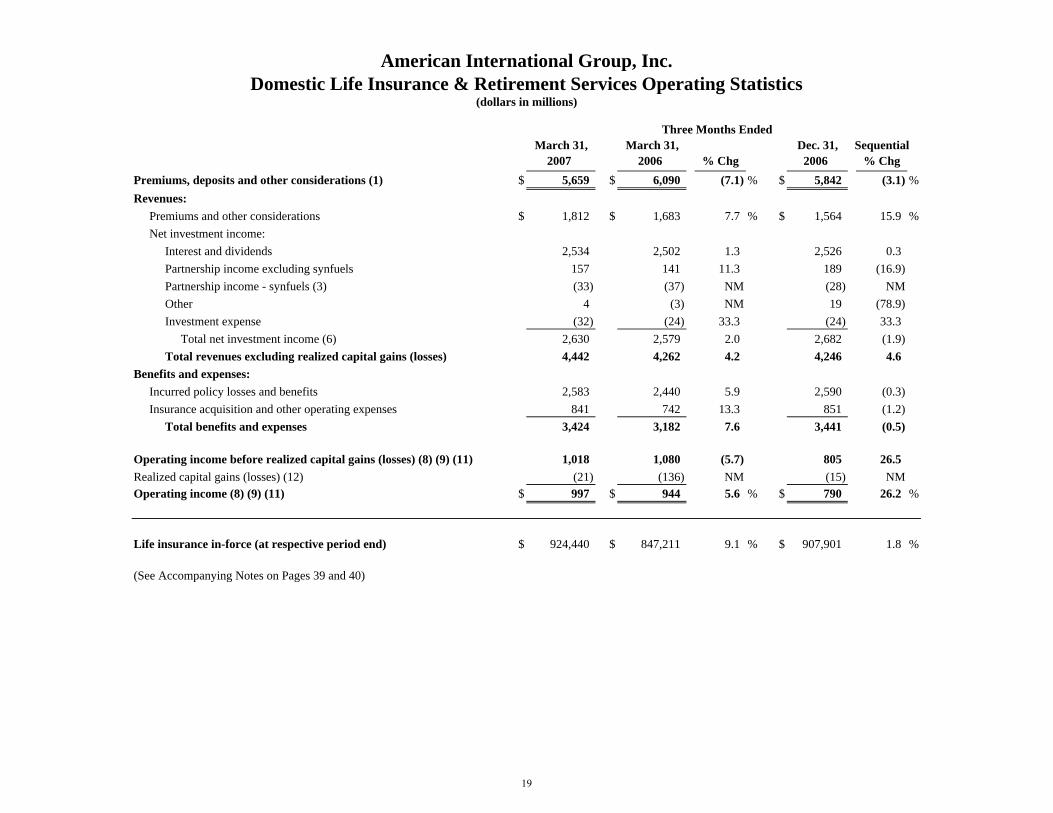
American International Group, Inc.Domestic Life Insurance & Retirement Services Operating Statistics
(dollars in millions)
Three Months EndedMarch 31, March 31, Dec. 31, Sequential
2007 2006 % Chg 2006 % ChgPremiums, deposits and other considerations (1) $ 5,659 $ 6,090 (7.1) % $ 5,842 (3.1) %Revenues:
Premiums and other considerations $ 1,812 $ 1,683 7.7 % $ 1,564 15.9 %Net investment income:
Interest and dividends 2,534 2,502 1.3 2,526 0.3Partnership income excluding synfuels 157 141 11.3 189 (16.9)Partnership income - synfuels (3) (33) (37) NM (28) NMOther 4 (3) NM 19 (78.9)Investment expense (32) (24) 33.3 (24) 33.3
Total net investment income (6) 2,630 2,579 2.0 2,682 (1.9)Total revenues excluding realized capital gains (losses) 4,442 4,262 4.2 4,246 4.6
Benefits and expenses:Incurred policy losses and benefits 2,583 2,440 5.9 2,590 (0.3)Insurance acquisition and other operating expenses 841 742 13.3 851 (1.2)
Total benefits and expenses 3,424 3,182 7.6 3,441 (0.5)
Operating income before realized capital gains (losses) (8) (9) (11) 1,018 1,080 (5.7) 805 26.5Realized capital gains (losses) (12) (21) (136) NM (15) NMOperating income (8) (9) (11) $ 997 $ 944 5.6 % $ 790 26.2 %
Life insurance in-force (at respective period end) $ 924,440 $ 847,211 9.1 % $ 907,901 1.8 %
(See Accompanying Notes on Pages 39 and 40)
19
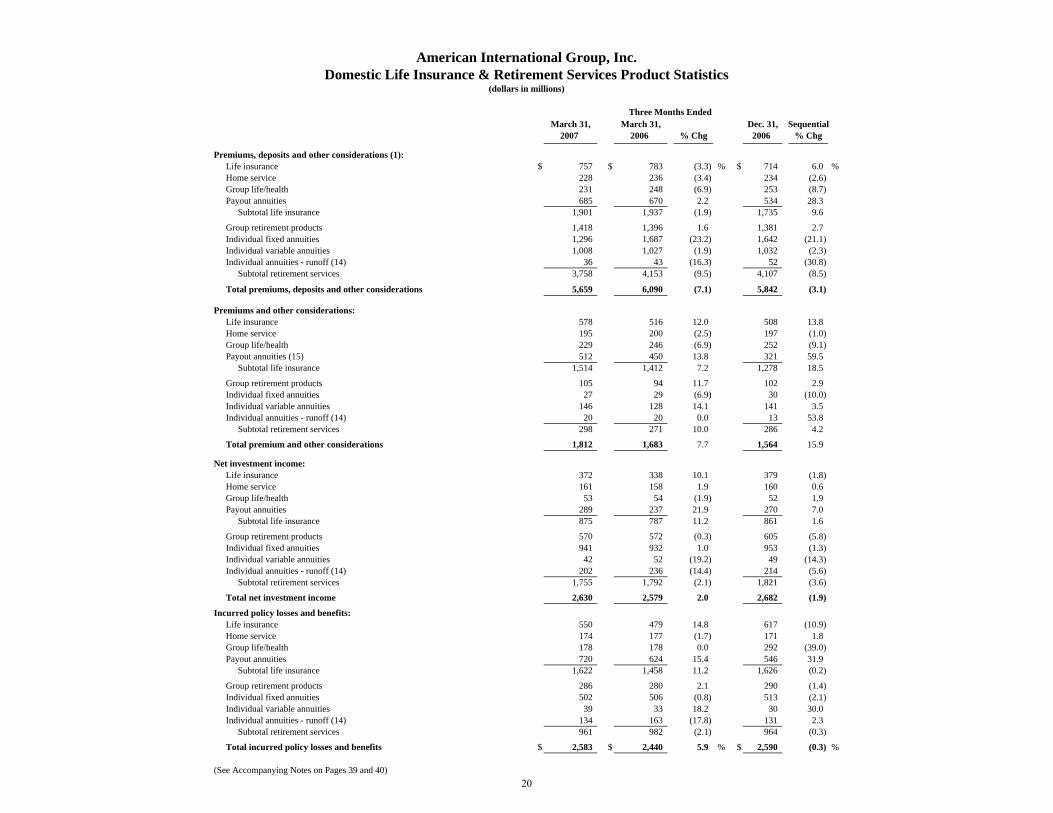
American International Group, Inc.Domestic Life Insurance & Retirement Services Product Statistics
(dollars in millions)
Three Months EndedMarch 31, March 31, Dec. 31, Sequential
2007 2006 % Chg 2006 % Chg
Premiums, deposits and other considerations (1):Life insurance $ 757 $ 783 (3.3) % $ 714 6.0 %Home service 228 236 (3.4) 234 (2.6)Group life/health 231 248 (6.9) 253 (8.7)Payout annuities 685 670 2.2 534 28.3
Subtotal life insurance 1,901 1,937 (1.9) 1,735 9.6
Group retirement products 1,418 1,396 1.6 1,381 2.7Individual fixed annuities 1,296 1,687 (23.2) 1,642 (21.1)Individual variable annuities 1,008 1,027 (1.9) 1,032 (2.3)Individual annuities - runoff (14) 36 43 (16.3) 52 (30.8)
Subtotal retirement services 3,758 4,153 (9.5) 4,107 (8.5)
Total premiums, deposits and other considerations 5,659 6,090 (7.1) 5,842 (3.1)
Premiums and other considerations:Life insurance 578 516 12.0 508 13.8Home service 195 200 (2.5) 197 (1.0)Group life/health 229 246 (6.9) 252 (9.1)Payout annuities (15) 512 450 13.8 321 59.5
Subtotal life insurance 1,514 1,412 7.2 1,278 18.5
Group retirement products 105 94 11.7 102 2.9Individual fixed annuities 27 29 (6.9) 30 (10.0)Individual variable annuities 146 128 14.1 141 3.5Individual annuities - runoff (14) 20 20 0.0 13 53.8
Subtotal retirement services 298 271 10.0 286 4.2
Total premium and other considerations 1,812 1,683 7.7 1,564 15.9
Net investment income:Life insurance 372 338 10.1 379 (1.8)Home service 161 158 1.9 160 0.6Group life/health 53 54 (1.9) 52 1.9Payout annuities 289 237 21.9 270 7.0
Subtotal life insurance 875 787 11.2 861 1.6
Group retirement products 570 572 (0.3) 605 (5.8)Individual fixed annuities 941 932 1.0 953 (1.3)Individual variable annuities 42 52 (19.2) 49 (14.3)Individual annuities - runoff (14) 202 236 (14.4) 214 (5.6)
Subtotal retirement services 1,755 1,792 (2.1) 1,821 (3.6)
Total net investment income 2,630 2,579 2.0 2,682 (1.9)
Incurred policy losses and benefits:Life insurance 550 479 14.8 617 (10.9)Home service 174 177 (1.7) 171 1.8Group life/health 178 178 0.0 292 (39.0)Payout annuities 720 624 15.4 546 31.9
Subtotal life insurance 1,622 1,458 11.2 1,626 (0.2)
Group retirement products 286 280 2.1 290 (1.4)Individual fixed annuities 502 506 (0.8) 513 (2.1)Individual variable annuities 39 33 18.2 30 30.0Individual annuities - runoff (14) 134 163 (17.8) 131 2.3
Subtotal retirement services 961 982 (2.1) 964 (0.3)
Total incurred policy losses and benefits $ 2,583 $ 2,440 5.9 % $ 2,590 (0.3) %
(See Accompanying Notes on Pages 39 and 40)20
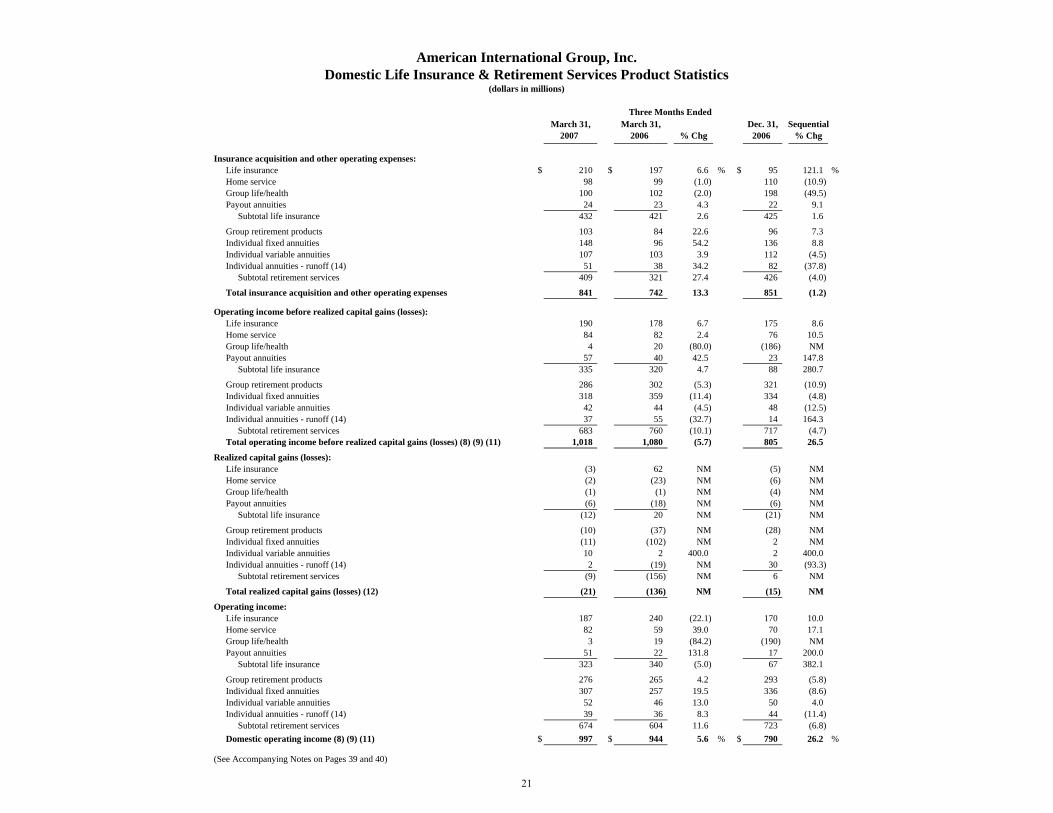
American International Group, Inc.Domestic Life Insurance & Retirement Services Product Statistics
(dollars in millions)
Three Months EndedMarch 31, March 31, Dec. 31, Sequential
2007 2006 % Chg 2006 % Chg
Insurance acquisition and other operating expenses:Life insurance $ 210 $ 197 6.6 % $ 95 121.1 %Home service 98 99 (1.0) 110 (10.9)Group life/health 100 102 (2.0) 198 (49.5)Payout annuities 24 23 4.3 22 9.1
Subtotal life insurance 432 421 2.6 425 1.6
Group retirement products 103 84 22.6 96 7.3Individual fixed annuities 148 96 54.2 136 8.8Individual variable annuities 107 103 3.9 112 (4.5)Individual annuities - runoff (14) 51 38 34.2 82 (37.8)
Subtotal retirement services 409 321 27.4 426 (4.0)
Total insurance acquisition and other operating expenses 841 742 13.3 851 (1.2)
Operating income before realized capital gains (losses):Life insurance 190 178 6.7 175 8.6Home service 84 82 2.4 76 10.5Group life/health 4 20 (80.0) (186) NM Payout annuities 57 40 42.5 23 147.8
Subtotal life insurance 335 320 4.7 88 280.7
Group retirement products 286 302 (5.3) 321 (10.9)Individual fixed annuities 318 359 (11.4) 334 (4.8)Individual variable annuities 42 44 (4.5) 48 (12.5)Individual annuities - runoff (14) 37 55 (32.7) 14 164.3
Subtotal retirement services 683 760 (10.1) 717 (4.7)Total operating income before realized capital gains (losses) (8) (9) (11) 1,018 1,080 (5.7) 805 26.5
Realized capital gains (losses):Life insurance (3) 62 NM (5) NM Home service (2) (23) NM (6) NM Group life/health (1) (1) NM (4) NM Payout annuities (6) (18) NM (6) NM
Subtotal life insurance (12) 20 NM (21) NM
Group retirement products (10) (37) NM (28) NM Individual fixed annuities (11) (102) NM 2 NM Individual variable annuities 10 2 400.0 2 400.0Individual annuities - runoff (14) 2 (19) NM 30 (93.3)
Subtotal retirement services (9) (156) NM 6 NM
Total realized capital gains (losses) (12) (21) (136) NM (15) NM
Operating income:Life insurance 187 240 (22.1) 170 10.0Home service 82 59 39.0 70 17.1Group life/health 3 19 (84.2) (190) NM Payout annuities 51 22 131.8 17 200.0
Subtotal life insurance 323 340 (5.0) 67 382.1
Group retirement products 276 265 4.2 293 (5.8)Individual fixed annuities 307 257 19.5 336 (8.6)Individual variable annuities 52 46 13.0 50 4.0Individual annuities - runoff (14) 39 36 8.3 44 (11.4)
Subtotal retirement services 674 604 11.6 723 (6.8)Domestic operating income (8) (9) (11) $ 997 $ 944 5.6 % $ 790 26.2 %
(See Accompanying Notes on Pages 39 and 40)
21
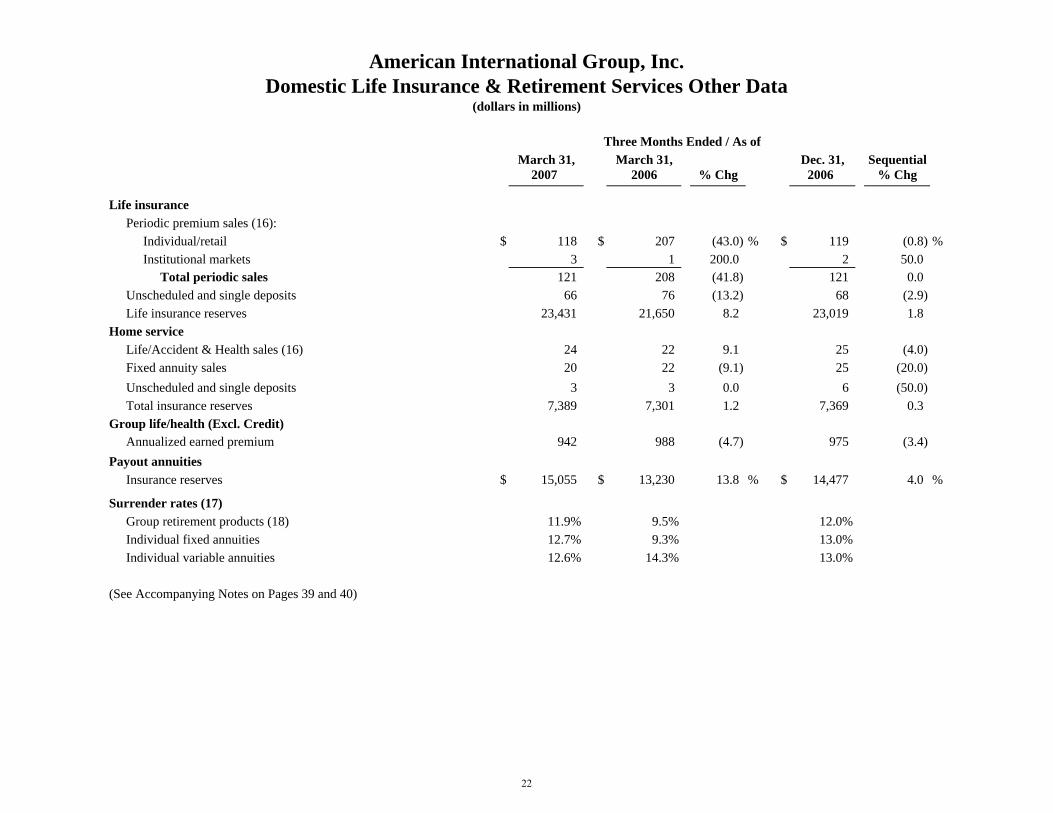
American International Group, Inc.Domestic Life Insurance & Retirement Services Other Data
(dollars in millions)
Three Months Ended / As ofMarch 31, March 31, Dec. 31, Sequential
2007 2006 % Chg 2006 % Chg
Life insurancePeriodic premium sales (16):
Individual/retail $ 118 $ 207 (43.0) % $ 119 (0.8) %Institutional markets 3 1 200.0 2 50.0
Total periodic sales 121 208 (41.8) 121 0.0Unscheduled and single deposits 66 76 (13.2) 68 (2.9)Life insurance reserves 23,431 21,650 8.2 23,019 1.8
Home serviceLife/Accident & Health sales (16) 24 22 9.1 25 (4.0)Fixed annuity sales 20 22 (9.1) 25 (20.0)Unscheduled and single deposits 3 3 0.0 6 (50.0)Total insurance reserves 7,389 7,301 1.2 7,369 0.3
Group life/health (Excl. Credit)Annualized earned premium 942 988 (4.7) 975 (3.4)
Payout annuitiesInsurance reserves $ 15,055 $ 13,230 13.8 % $ 14,477 4.0 %
Surrender rates (17)Group retirement products (18) 11.9% 9.5% 12.0%Individual fixed annuities 12.7% 9.3% 13.0%Individual variable annuities 12.6% 14.3% 13.0%
(See Accompanying Notes on Pages 39 and 40)
22
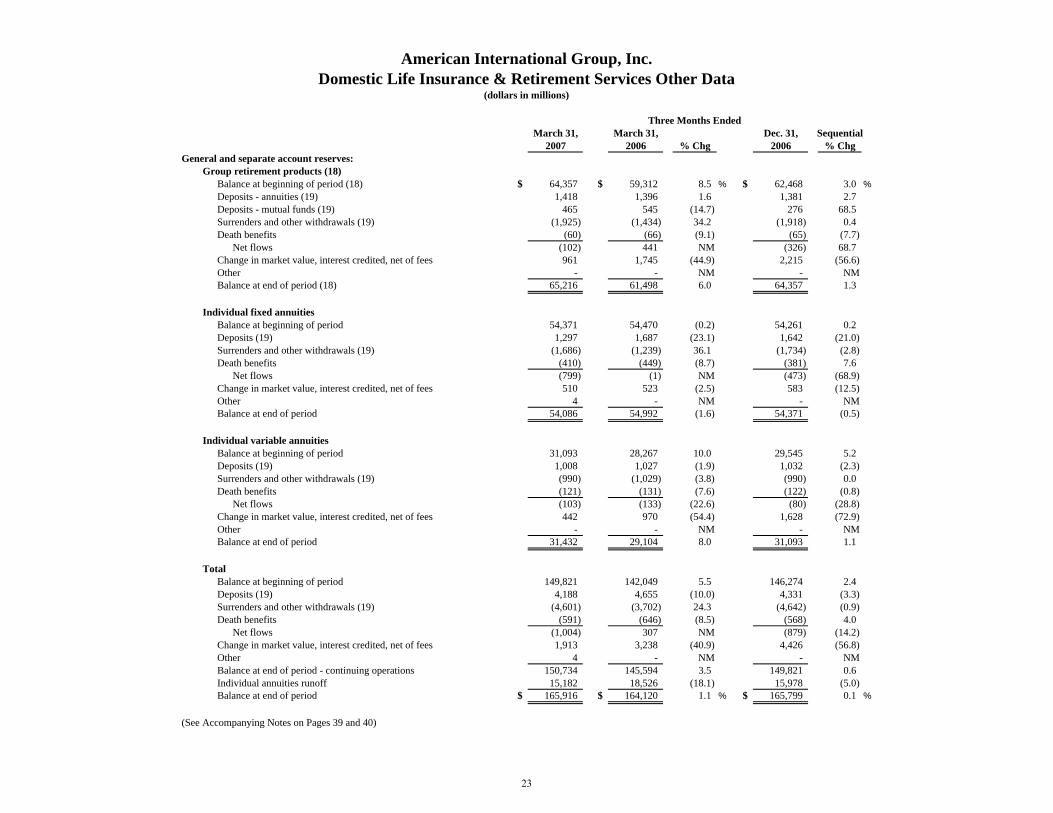
Three Months EndedMarch 31, March 31, Dec. 31, Sequential
2007 2006 % Chg 2006 % ChgGeneral and separate account reserves:
Group retirement products (18)Balance at beginning of period (18) $ 64,357 $ 59,312 8.5 % $ 62,468 3.0 %Deposits - annuities (19) 1,418 1,396 1.6 1,381 2.7Deposits - mutual funds (19) 465 545 (14.7) 276 68.5Surrenders and other withdrawals (19) (1,925) (1,434) 34.2 (1,918) 0.4Death benefits (60) (66) (9.1) (65) (7.7)
Net flows (102) 441 NM (326) 68.7Change in market value, interest credited, net of fees 961 1,745 (44.9) 2,215 (56.6)Other - - NM - NMBalance at end of period (18) 65,216 61,498 6.0 64,357 1.3
Individual fixed annuitiesBalance at beginning of period 54,371 54,470 (0.2) 54,261 0.2Deposits (19) 1,297 1,687 (23.1) 1,642 (21.0)Surrenders and other withdrawals (19) (1,686) (1,239) 36.1 (1,734) (2.8)Death benefits (410) (449) (8.7) (381) 7.6
Net flows (799) (1) NM (473) (68.9)Change in market value, interest credited, net of fees 510 523 (2.5) 583 (12.5)Other 4 - NM - NMBalance at end of period 54,086 54,992 (1.6) 54,371 (0.5)
Individual variable annuitiesBalance at beginning of period 31,093 28,267 10.0 29,545 5.2Deposits (19) 1,008 1,027 (1.9) 1,032 (2.3)Surrenders and other withdrawals (19) (990) (1,029) (3.8) (990) 0.0Death benefits (121) (131) (7.6) (122) (0.8)
Net flows (103) (133) (22.6) (80) (28.8)Change in market value, interest credited, net of fees 442 970 (54.4) 1,628 (72.9)Other - - NM - NMBalance at end of period 31,432 29,104 8.0 31,093 1.1
TotalBalance at beginning of period 149,821 142,049 5.5 146,274 2.4Deposits (19) 4,188 4,655 (10.0) 4,331 (3.3)Surrenders and other withdrawals (19) (4,601) (3,702) 24.3 (4,642) (0.9)Death benefits (591) (646) (8.5) (568) 4.0
Net flows (1,004) 307 NM (879) (14.2)Change in market value, interest credited, net of fees 1,913 3,238 (40.9) 4,426 (56.8)Other 4 - NM - NMBalance at end of period - continuing operations 150,734 145,594 3.5 149,821 0.6Individual annuities runoff 15,182 18,526 (18.1) 15,978 (5.0)Balance at end of period $ 165,916 $ 164,120 1.1 % $ 165,799 0.1 %
(See Accompanying Notes on Pages 39 and 40)
American International Group, Inc.Domestic Life Insurance & Retirement Services Other Data
(dollars in millions)
23
American International Group, IncDomestic Life Insurance & Retirement Services Other Data
(dollars in millions)
Three Months EndedMarch 31, March 31, Dec. 31, Sequential
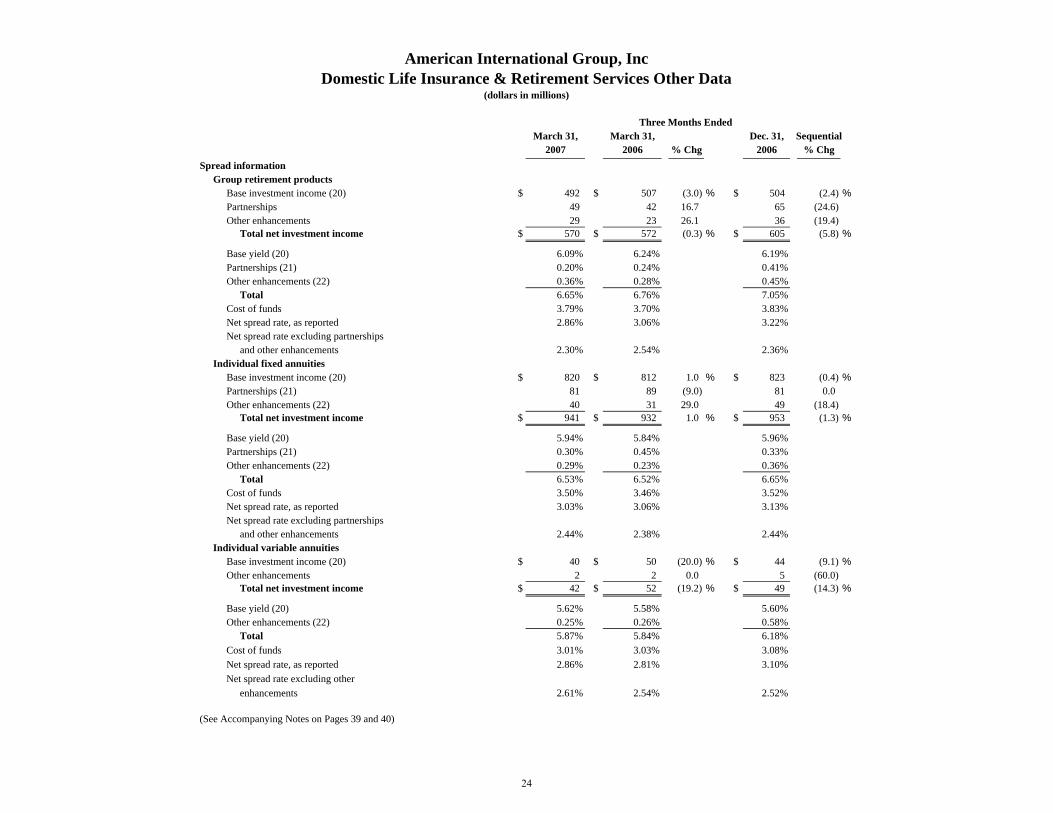
2007 2006 % Chg 2006 % ChgSpread information
Group retirement productsBase investment income (20) $ 492 $ 507 (3.0) % $ 504 (2.4) %Partnerships 49 42 16.7 65 (24.6)Other enhancements 29 23 26.1 36 (19.4)
Total net investment income $ 570 $ 572 (0.3) % $ 605 (5.8) %
Base yield (20) 6.09% 6.24% 6.19%Partnerships (21) 0.20% 0.24% 0.41%Other enhancements (22) 0.36% 0.28% 0.45%
Total 6.65% 6.76% 7.05%Cost of funds 3.79% 3.70% 3.83%Net spread rate, as reported 2.86% 3.06% 3.22%Net spread rate excluding partnerships
and other enhancements 2.30% 2.54% 2.36%Individual fixed annuities
Base investment income (20) $ 820 $ 812 1.0 % $ 823 (0.4) %Partnerships (21) 81 89 (9.0) 81 0.0Other enhancements (22) 40 31 29.0 49 (18.4)
Total net investment income $ 941 $ 932 1.0 % $ 953 (1.3) %
Base yield (20) 5.94% 5.84% 5.96%Partnerships (21) 0.30% 0.45% 0.33%Other enhancements (22) 0.29% 0.23% 0.36%
Total 6.53% 6.52% 6.65%Cost of funds 3.50% 3.46% 3.52%Net spread rate, as reported 3.03% 3.06% 3.13%Net spread rate excluding partnerships
and other enhancements 2.44% 2.38% 2.44%Individual variable annuities
Base investment income (20) $ 40 $ 50 (20.0) % $ 44 (9.1) %Other enhancements 2 2 0.0 5 (60.0)
Total net investment income $ 42 $ 52 (19.2) % $ 49 (14.3) %
Base yield (20) 5.62% 5.58% 5.60%Other enhancements (22) 0.25% 0.26% 0.58%
Total 5.87% 5.84% 6.18%Cost of funds 3.01% 3.03% 3.08%Net spread rate, as reported 2.86% 2.81% 3.10%Net spread rate excluding other
enhancements 2.61% 2.54% 2.52%
(See Accompanying Notes on Pages 39 and 40)
24
American International Group, Inc.Foreign Life Insurance & Retirement Services Operating Statistics
(dollars in millions)
Three Months EndedMarch 31, March 31, Dec. 31, Sequential
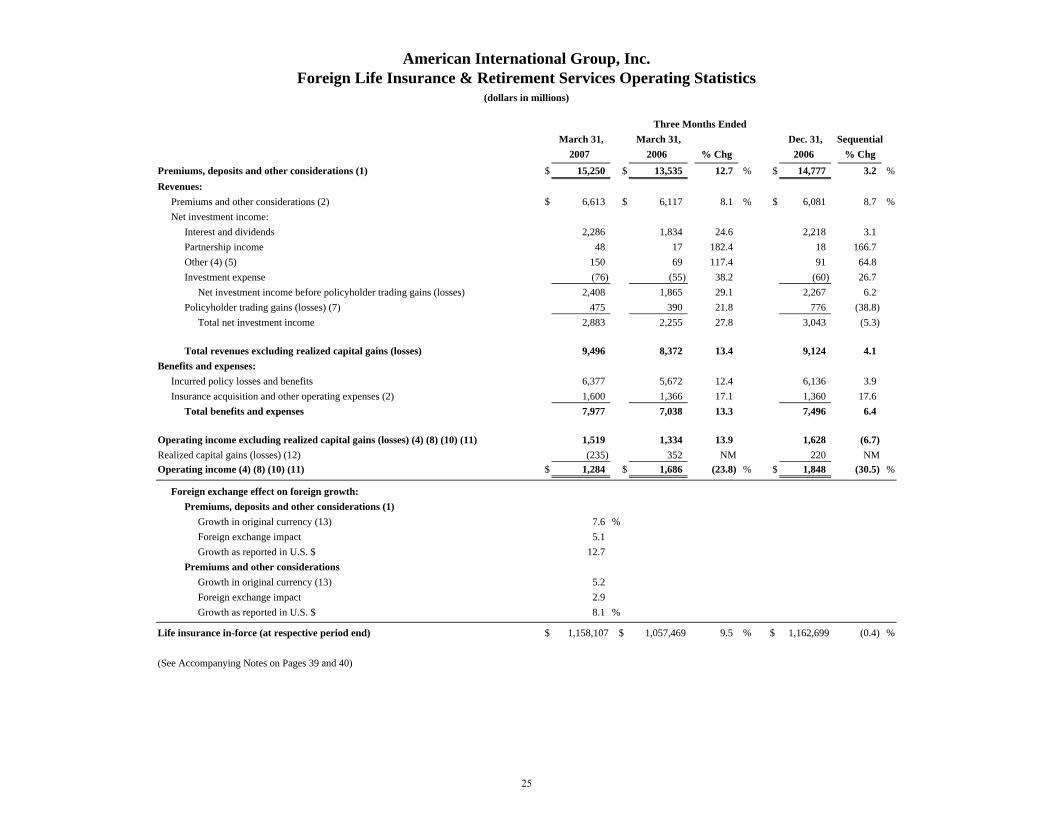
2007 2006 % Chg 2006 % ChgPremiums, deposits and other considerations (1) $ 15,250 $ 13,535 12.7 % $ 14,777 3.2 %Revenues:
Premiums and other considerations (2) $ 6,613 $ 6,117 8.1 % $ 6,081 8.7 %Net investment income:
Interest and dividends 2,286 1,834 24.6 2,218 3.1Partnership income 48 17 182.4 18 166.7Other (4) (5) 150 69 117.4 91 64.8Investment expense (76) (55) 38.2 (60) 26.7
Net investment income before policyholder trading gains (losses) 2,408 1,865 29.1 2,267 6.2Policyholder trading gains (losses) (7) 475 390 21.8 776 (38.8)
Total net investment income 2,883 2,255 27.8 3,043 (5.3)
Total revenues excluding realized capital gains (losses) 9,496 8,372 13.4 9,124 4.1Benefits and expenses:
Incurred policy losses and benefits 6,377 5,672 12.4 6,136 3.9Insurance acquisition and other operating expenses (2) 1,600 1,366 17.1 1,360 17.6
Total benefits and expenses 7,977 7,038 13.3 7,496 6.4
Operating income excluding realized capital gains (losses) (4) (8) (10) (11) 1,519 1,334 13.9 1,628 (6.7)Realized capital gains (losses) (12) (235) 352 NM 220 NMOperating income (4) (8) (10) (11) $ 1,284 $ 1,686 (23.8) % $ 1,848 (30.5) %
Foreign exchange effect on foreign growth:Premiums, deposits and other considerations (1)
Growth in original currency (13) 7.6 %Foreign exchange impact 5.1 Growth as reported in U.S. $ 12.7
Premiums and other considerations Growth in original currency (13) 5.2 Foreign exchange impact 2.9 Growth as reported in U.S. $ 8.1 %
Life insurance in-force (at respective period end) $ 1,158,107 $ 1,057,469 9.5 % $ 1,162,699 (0.4) %
(See Accompanying Notes on Pages 39 and 40)
25
American International Group, Inc.Foreign Life Insurance & Retirement Services Product Statistics
(dollars in millions)
Three Months EndedMarch 31, March 31, Dec. 31, Sequential
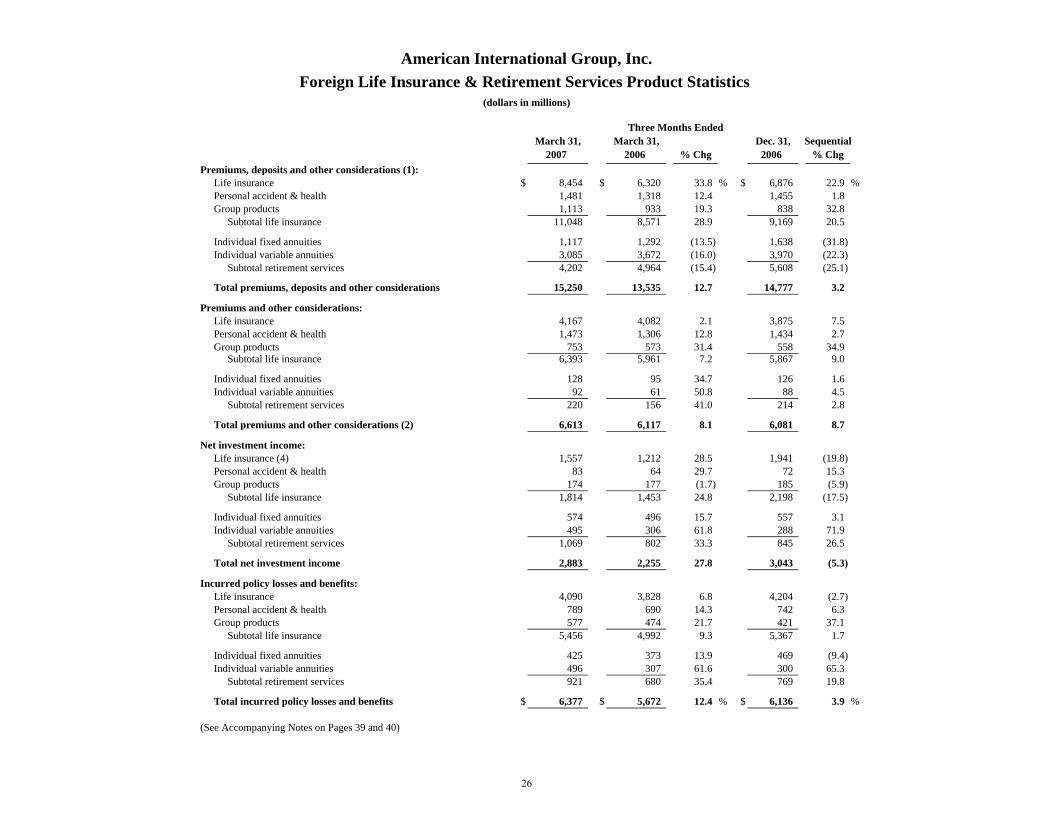
2007 2006 % Chg 2006 % ChgPremiums, deposits and other considerations (1):
Life insurance $ 8,454 $ 6,320 33.8 % $ 6,876 22.9 %Personal accident & health 1,481 1,318 12.4 1,455 1.8Group products 1,113 933 19.3 838 32.8
Subtotal life insurance 11,048 8,571 28.9 9,169 20.5
Individual fixed annuities 1,117 1,292 (13.5) 1,638 (31.8)Individual variable annuities 3,085 3,672 (16.0) 3,970 (22.3)
Subtotal retirement services 4,202 4,964 (15.4) 5,608 (25.1)
Total premiums, deposits and other considerations 15,250 13,535 12.7 14,777 3.2
Premiums and other considerations:Life insurance 4,167 4,082 2.1 3,875 7.5Personal accident & health 1,473 1,306 12.8 1,434 2.7Group products 753 573 31.4 558 34.9
Subtotal life insurance 6,393 5,961 7.2 5,867 9.0
Individual fixed annuities 128 95 34.7 126 1.6Individual variable annuities 92 61 50.8 88 4.5
Subtotal retirement services 220 156 41.0 214 2.8
Total premiums and other considerations (2) 6,613 6,117 8.1 6,081 8.7
Net investment income:Life insurance (4) 1,557 1,212 28.5 1,941 (19.8)Personal accident & health 83 64 29.7 72 15.3Group products 174 177 (1.7) 185 (5.9)
Subtotal life insurance 1,814 1,453 24.8 2,198 (17.5)
Individual fixed annuities 574 496 15.7 557 3.1Individual variable annuities 495 306 61.8 288 71.9
Subtotal retirement services 1,069 802 33.3 845 26.5
Total net investment income 2,883 2,255 27.8 3,043 (5.3)
Incurred policy losses and benefits:Life insurance 4,090 3,828 6.8 4,204 (2.7)Personal accident & health 789 690 14.3 742 6.3Group products 577 474 21.7 421 37.1
Subtotal life insurance 5,456 4,992 9.3 5,367 1.7
Individual fixed annuities 425 373 13.9 469 (9.4)Individual variable annuities 496 307 61.6 300 65.3
Subtotal retirement services 921 680 35.4 769 19.8
Total incurred policy losses and benefits $ 6,377 $ 5,672 12.4 % $ 6,136 3.9 %
(See Accompanying Notes on Pages 39 and 40)
26
American International Group, Inc.Foreign Life Insurance & Retirement Services Product Statistics
(dollars in millions)
Three Months EndedMarch 31, March 31, Dec. 31, Sequential
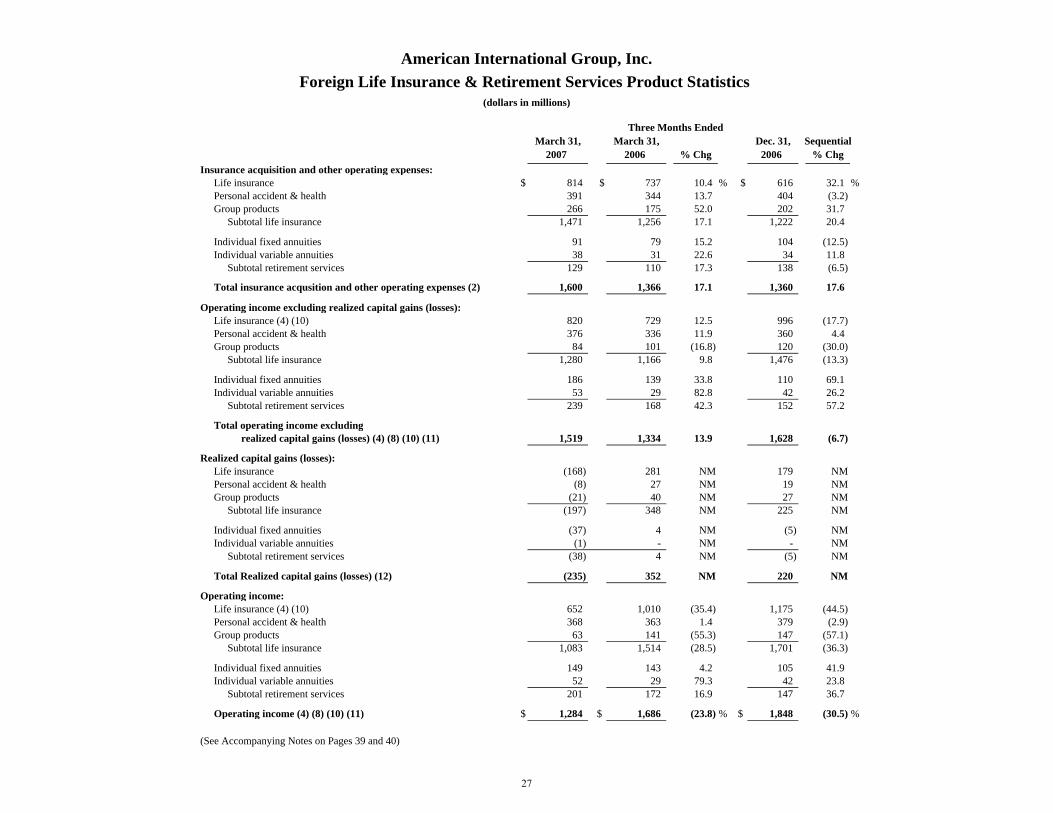
2007 2006 % Chg 2006 % ChgInsurance acquisition and other operating expenses:
Life insurance $ 814 $ 737 10.4 % $ 616 32.1 %Personal accident & health 391 344 13.7 404 (3.2)Group products 266 175 52.0 202 31.7
Subtotal life insurance 1,471 1,256 17.1 1,222 20.4
Individual fixed annuities 91 79 15.2 104 (12.5)Individual variable annuities 38 31 22.6 34 11.8
Subtotal retirement services 129 110 17.3 138 (6.5)
Total insurance acqusition and other operating expenses (2) 1,600 1,366 17.1 1,360 17.6
Operating income excluding realized capital gains (losses):Life insurance (4) (10) 820 729 12.5 996 (17.7)Personal accident & health 376 336 11.9 360 4.4Group products 84 101 (16.8) 120 (30.0)
Subtotal life insurance 1,280 1,166 9.8 1,476 (13.3)
Individual fixed annuities 186 139 33.8 110 69.1Individual variable annuities 53 29 82.8 42 26.2
Subtotal retirement services 239 168 42.3 152 57.2
Total operating income excludingrealized capital gains (losses) (4) (8) (10) (11) 1,519 1,334 13.9 1,628 (6.7)
Realized capital gains (losses):Life insurance (168) 281 NM 179 NMPersonal accident & health (8) 27 NM 19 NMGroup products (21) 40 NM 27 NM
Subtotal life insurance (197) 348 NM 225 NM
Individual fixed annuities (37) 4 NM (5) NMIndividual variable annuities (1) - NM - NM
Subtotal retirement services (38) 4 NM (5) NM
Total Realized capital gains (losses) (12) (235) 352 NM 220 NM
Operating income:Life insurance (4) (10) 652 1,010 (35.4) 1,175 (44.5)Personal accident & health 368 363 1.4 379 (2.9)Group products 63 141 (55.3) 147 (57.1)
Subtotal life insurance 1,083 1,514 (28.5) 1,701 (36.3)
Individual fixed annuities 149 143 4.2 105 41.9Individual variable annuities 52 29 79.3 42 23.8
Subtotal retirement services 201 172 16.9 147 36.7
Operating income (4) (8) (10) (11) $ 1,284 $ 1,686 (23.8) % $ 1,848 (30.5) %
(See Accompanying Notes on Pages 39 and 40)
27
American International Group, Inc.Japan and Other ALICO Product Statistics
(dollars in millions)
Three Months EndedMarch 31, March 31, Dec. 31, Sequential
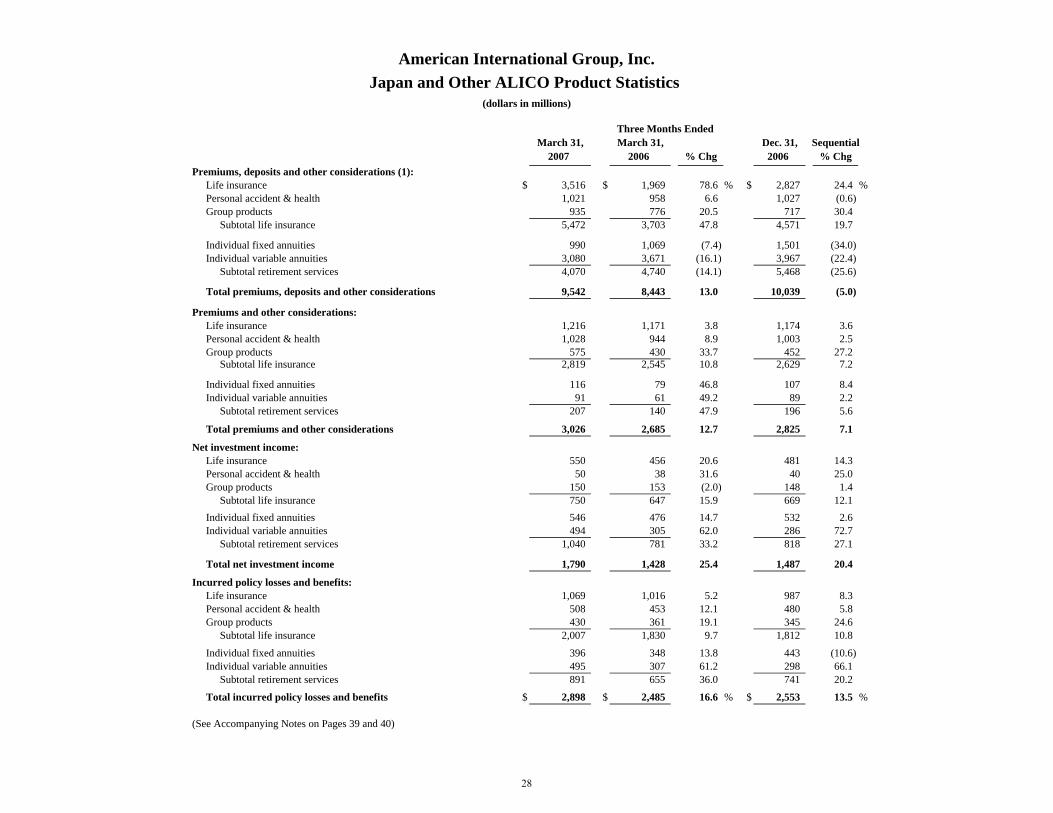
2007 2006 % Chg 2006 % ChgPremiums, deposits and other considerations (1):
Life insurance $ 3,516 $ 1,969 78.6 % $ 2,827 24.4 %Personal accident & health 1,021 958 6.6 1,027 (0.6)Group products 935 776 20.5 717 30.4
Subtotal life insurance 5,472 3,703 47.8 4,571 19.7
Individual fixed annuities 990 1,069 (7.4) 1,501 (34.0)Individual variable annuities 3,080 3,671 (16.1) 3,967 (22.4)
Subtotal retirement services 4,070 4,740 (14.1) 5,468 (25.6)
Total premiums, deposits and other considerations 9,542 8,443 13.0 10,039 (5.0)
Premiums and other considerations:Life insurance 1,216 1,171 3.8 1,174 3.6Personal accident & health 1,028 944 8.9 1,003 2.5Group products 575 430 33.7 452 27.2
Subtotal life insurance 2,819 2,545 10.8 2,629 7.2
Individual fixed annuities 116 79 46.8 107 8.4Individual variable annuities 91 61 49.2 89 2.2
Subtotal retirement services 207 140 47.9 196 5.6
Total premiums and other considerations 3,026 2,685 12.7 2,825 7.1
Net investment income:Life insurance 550 456 20.6 481 14.3Personal accident & health 50 38 31.6 40 25.0Group products 150 153 (2.0) 148 1.4
Subtotal life insurance 750 647 15.9 669 12.1Individual fixed annuities 546 476 14.7 532 2.6Individual variable annuities 494 305 62.0 286 72.7
Subtotal retirement services 1,040 781 33.2 818 27.1
Total net investment income 1,790 1,428 25.4 1,487 20.4
Incurred policy losses and benefits:Life insurance 1,069 1,016 5.2 987 8.3Personal accident & health 508 453 12.1 480 5.8Group products 430 361 19.1 345 24.6
Subtotal life insurance 2,007 1,830 9.7 1,812 10.8
Individual fixed annuities 396 348 13.8 443 (10.6)Individual variable annuities 495 307 61.2 298 66.1
Subtotal retirement services 891 655 36.0 741 20.2
Total incurred policy losses and benefits $ 2,898 $ 2,485 16.6 % $ 2,553 13.5 %
(See Accompanying Notes on Pages 39 and 40)
28
American International Group, Inc.Japan and Other ALICO Product Statistics
(dollars in millions)
Three Months EndedMarch 31, March 31, Dec. 31, Sequential
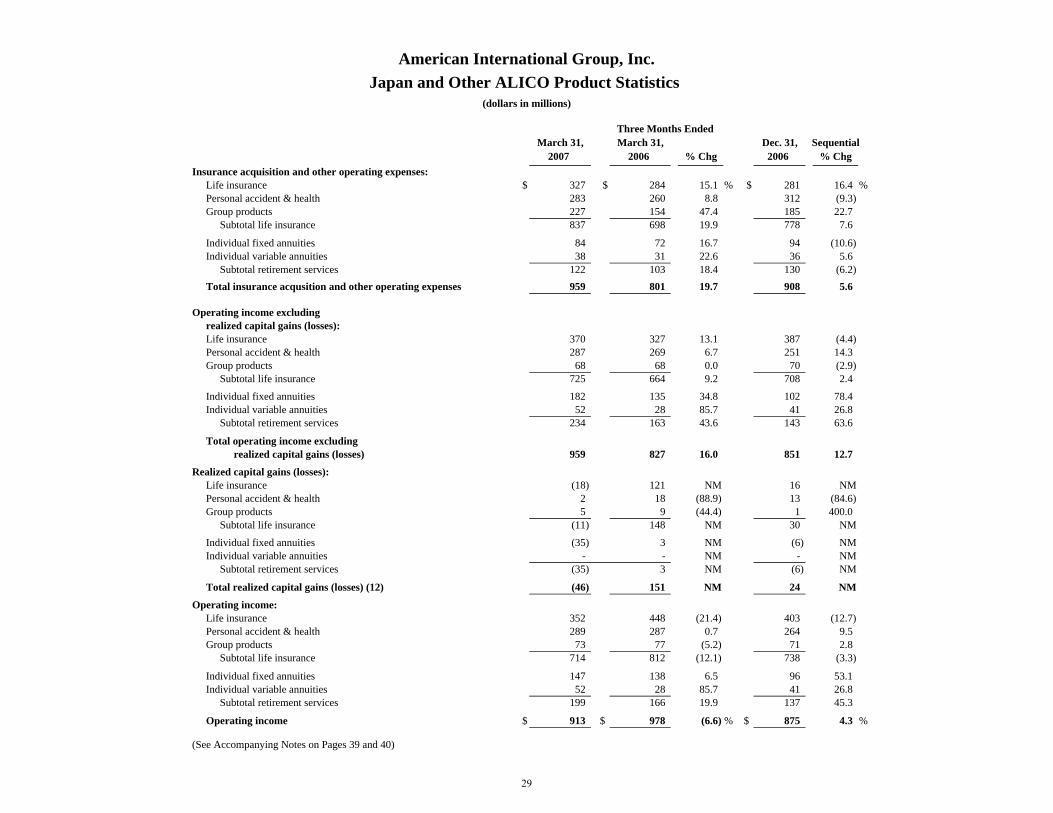
2007 2006 % Chg 2006 % ChgInsurance acquisition and other operating expenses:
Life insurance $ 327 $ 284 15.1 % $ 281 16.4 %Personal accident & health 283 260 8.8 312 (9.3)Group products 227 154 47.4 185 22.7
Subtotal life insurance 837 698 19.9 778 7.6
Individual fixed annuities 84 72 16.7 94 (10.6)Individual variable annuities 38 31 22.6 36 5.6
Subtotal retirement services 122 103 18.4 130 (6.2)Total insurance acqusition and other operating expenses 959 801 19.7 908 5.6
Operating income excludingrealized capital gains (losses): Life insurance 370 327 13.1 387 (4.4)Personal accident & health 287 269 6.7 251 14.3Group products 68 68 0.0 70 (2.9)
Subtotal life insurance 725 664 9.2 708 2.4
Individual fixed annuities 182 135 34.8 102 78.4Individual variable annuities 52 28 85.7 41 26.8
Subtotal retirement services 234 163 43.6 143 63.6
Total operating income excludingrealized capital gains (losses) 959 827 16.0 851 12.7
Realized capital gains (losses):Life insurance (18) 121 NM 16 NMPersonal accident & health 2 18 (88.9) 13 (84.6)Group products 5 9 (44.4) 1 400.0
Subtotal life insurance (11) 148 NM 30 NM
Individual fixed annuities (35) 3 NM (6) NMIndividual variable annuities - - NM - NM
Subtotal retirement services (35) 3 NM (6) NM
Total realized capital gains (losses) (12) (46) 151 NM 24 NM
Operating income:Life insurance 352 448 (21.4) 403 (12.7)Personal accident & health 289 287 0.7 264 9.5Group products 73 77 (5.2) 71 2.8
Subtotal life insurance 714 812 (12.1) 738 (3.3)
Individual fixed annuities 147 138 6.5 96 53.1Individual variable annuities 52 28 85.7 41 26.8
Subtotal retirement services 199 166 19.9 137 45.3
Operating income $ 913 $ 978 (6.6) % $ 875 4.3 %
(See Accompanying Notes on Pages 39 and 40)
29
American International Group, Inc.Asia Product Statistics
(dollars in millions)
Three Months EndedMarch 31, March 31, Dec. 31, Sequential
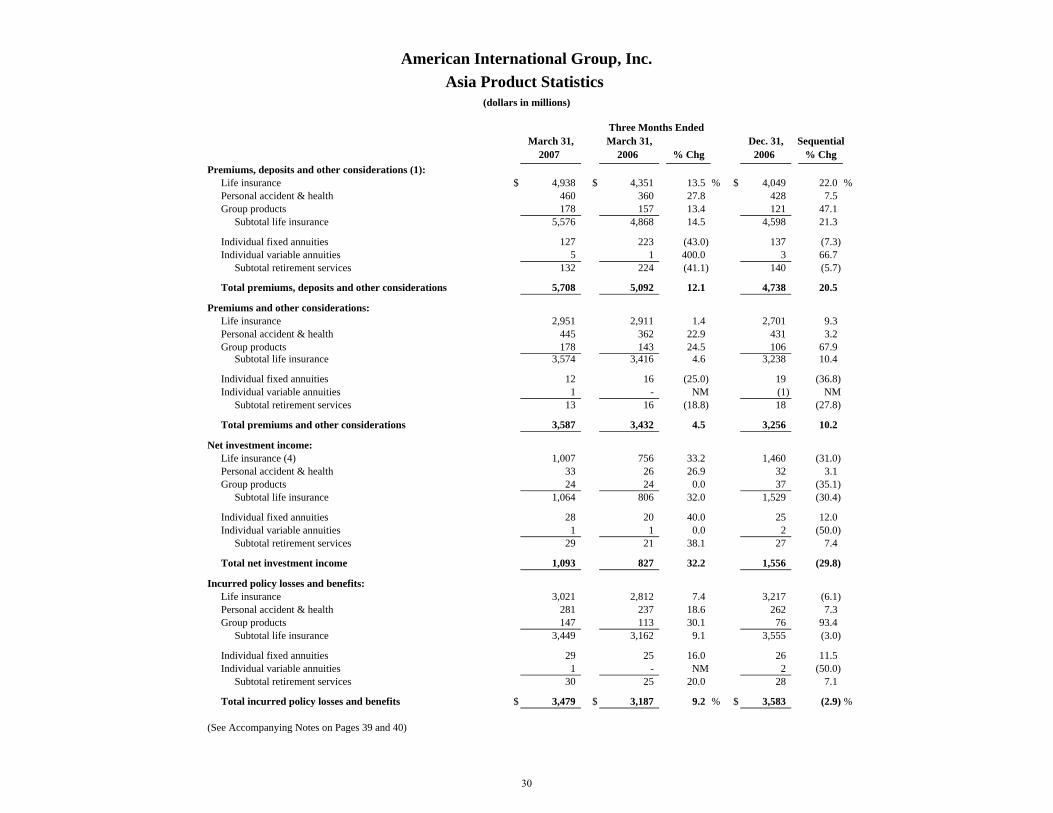
2007 2006 % Chg 2006 % ChgPremiums, deposits and other considerations (1):
Life insurance $ 4,938 $ 4,351 13.5 % $ 4,049 22.0 %Personal accident & health 460 360 27.8 428 7.5Group products 178 157 13.4 121 47.1
Subtotal life insurance 5,576 4,868 14.5 4,598 21.3
Individual fixed annuities 127 223 (43.0) 137 (7.3)Individual variable annuities 5 1 400.0 3 66.7
Subtotal retirement services 132 224 (41.1) 140 (5.7)
Total premiums, deposits and other considerations 5,708 5,092 12.1 4,738 20.5
Premiums and other considerations:Life insurance 2,951 2,911 1.4 2,701 9.3Personal accident & health 445 362 22.9 431 3.2Group products 178 143 24.5 106 67.9
Subtotal life insurance 3,574 3,416 4.6 3,238 10.4
Individual fixed annuities 12 16 (25.0) 19 (36.8)Individual variable annuities 1 - NM (1) NM
Subtotal retirement services 13 16 (18.8) 18 (27.8)
Total premiums and other considerations 3,587 3,432 4.5 3,256 10.2
Net investment income:Life insurance (4) 1,007 756 33.2 1,460 (31.0)Personal accident & health 33 26 26.9 32 3.1Group products 24 24 0.0 37 (35.1)
Subtotal life insurance 1,064 806 32.0 1,529 (30.4)
Individual fixed annuities 28 20 40.0 25 12.0Individual variable annuities 1 1 0.0 2 (50.0)
Subtotal retirement services 29 21 38.1 27 7.4
Total net investment income 1,093 827 32.2 1,556 (29.8)
Incurred policy losses and benefits:Life insurance 3,021 2,812 7.4 3,217 (6.1)Personal accident & health 281 237 18.6 262 7.3Group products 147 113 30.1 76 93.4
Subtotal life insurance 3,449 3,162 9.1 3,555 (3.0)
Individual fixed annuities 29 25 16.0 26 11.5Individual variable annuities 1 - NM 2 (50.0)
Subtotal retirement services 30 25 20.0 28 7.1
Total incurred policy losses and benefits $ 3,479 $ 3,187 9.2 % $ 3,583 (2.9) %
(See Accompanying Notes on Pages 39 and 40)
30
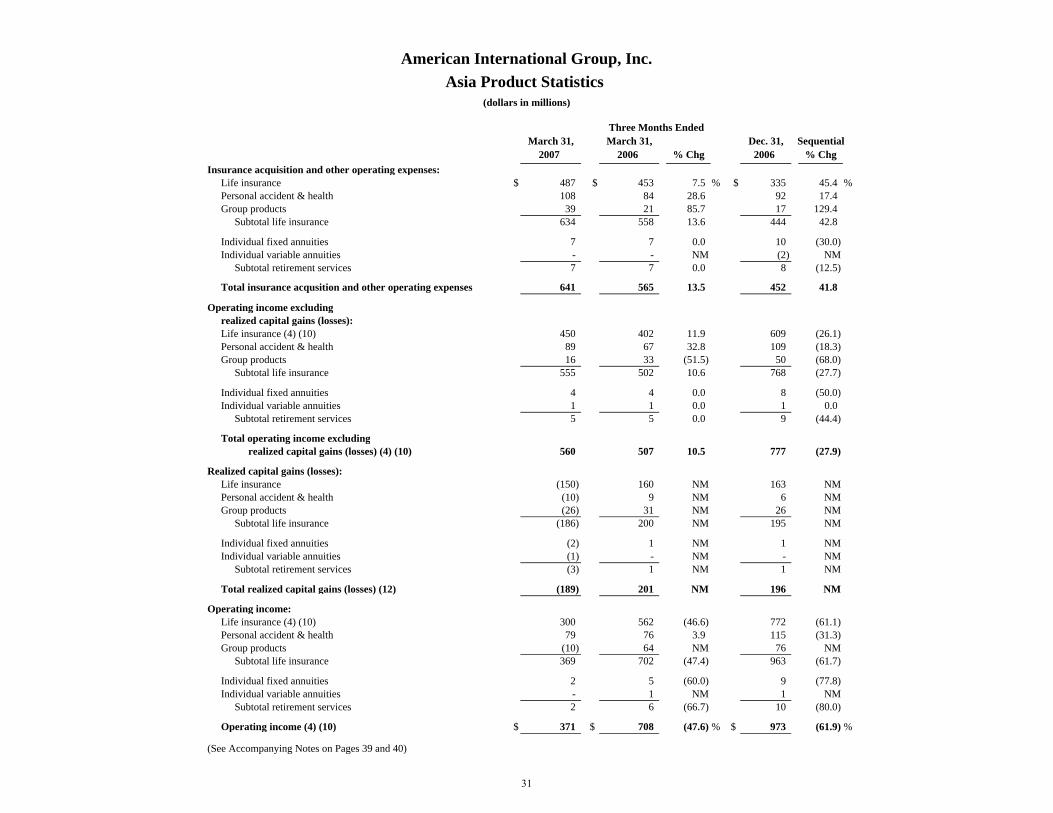
American International Group, Inc.Asia Product Statistics
(dollars in millions)
Three Months EndedMarch 31, March 31, Dec. 31, Sequential
2007 2006 % Chg 2006 % ChgInsurance acquisition and other operating expenses:
Life insurance $ 487 $ 453 7.5 % $ 335 45.4 %Personal accident & health 108 84 28.6 92 17.4Group products 39 21 85.7 17 129.4
Subtotal life insurance 634 558 13.6 444 42.8
Individual fixed annuities 7 7 0.0 10 (30.0)Individual variable annuities - - NM (2) NM
Subtotal retirement services 7 7 0.0 8 (12.5)
Total insurance acqusition and other operating expenses 641 565 13.5 452 41.8
Operating income excludingrealized capital gains (losses): Life insurance (4) (10) 450 402 11.9 609 (26.1)Personal accident & health 89 67 32.8 109 (18.3)Group products 16 33 (51.5) 50 (68.0)
Subtotal life insurance 555 502 10.6 768 (27.7)
Individual fixed annuities 4 4 0.0 8 (50.0)Individual variable annuities 1 1 0.0 1 0.0
Subtotal retirement services 5 5 0.0 9 (44.4)
Total operating income excludingrealized capital gains (losses) (4) (10) 560 507 10.5 777 (27.9)
Realized capital gains (losses):Life insurance (150) 160 NM 163 NMPersonal accident & health (10) 9 NM 6 NMGroup products (26) 31 NM 26 NM
Subtotal life insurance (186) 200 NM 195 NM
Individual fixed annuities (2) 1 NM 1 NMIndividual variable annuities (1) - NM - NM
Subtotal retirement services (3) 1 NM 1 NM
Total realized capital gains (losses) (12) (189) 201 NM 196 NM
Operating income:Life insurance (4) (10) 300 562 (46.6) 772 (61.1)Personal accident & health 79 76 3.9 115 (31.3)Group products (10) 64 NM 76 NM
Subtotal life insurance 369 702 (47.4) 963 (61.7)
Individual fixed annuities 2 5 (60.0) 9 (77.8)Individual variable annuities - 1 NM 1 NM
Subtotal retirement services 2 6 (66.7) 10 (80.0)
Operating income (4) (10) $ 371 $ 708 (47.6) % $ 973 (61.9) %
(See Accompanying Notes on Pages 39 and 40)
31
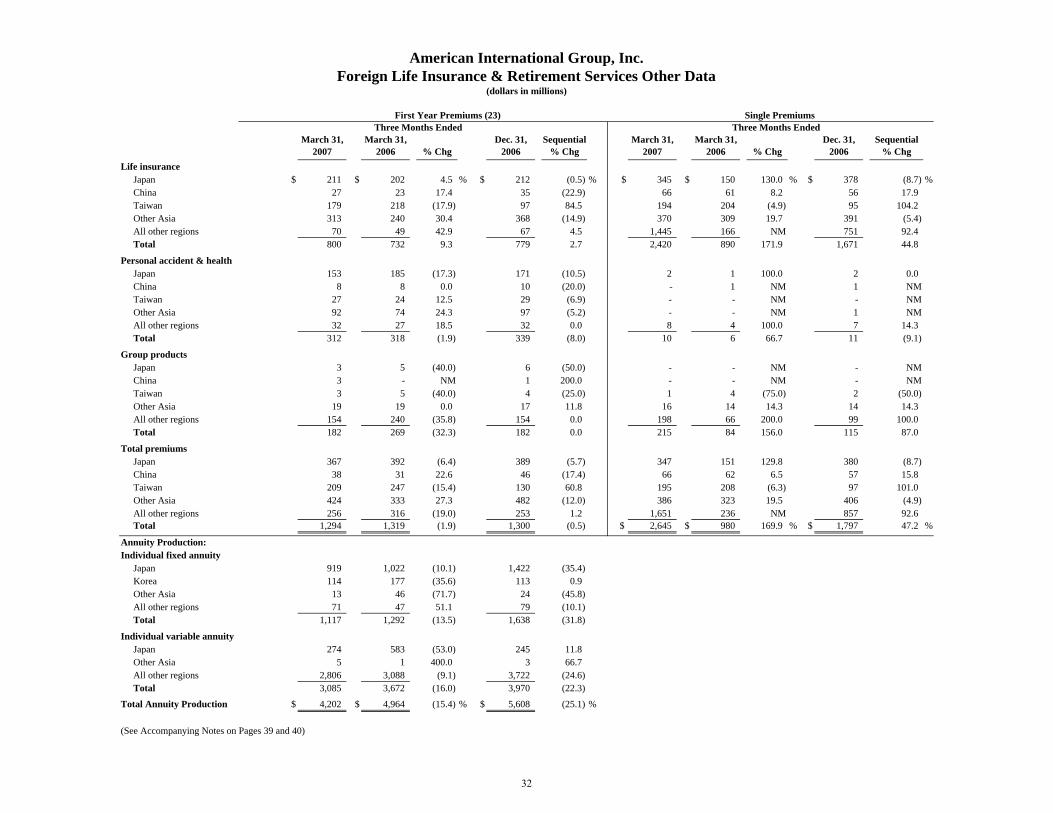
American International Group, Inc.Foreign Life Insurance & Retirement Services Other Data
(dollars in millions)
First Year Premiums (23) Single Premiums Three Months Ended Three Months Ended
March 31, March 31, Dec. 31, Sequential March 31, March 31, Dec. 31, Sequential2007 2006 % Chg 2006 % Chg 2007 2006 % Chg 2006 % Chg
Life insuranceJapan $ 211 $ 202 4.5 % $ 212 (0.5) % $ 345 $ 150 130.0 % $ 378 (8.7) %China 27 23 17.4 35 (22.9) 66 61 8.2 56 17.9Taiwan 179 218 (17.9) 97 84.5 194 204 (4.9) 95 104.2Other Asia 313 240 30.4 368 (14.9) 370 309 19.7 391 (5.4)All other regions 70 49 42.9 67 4.5 1,445 166 NM 751 92.4Total 800 732 9.3 779 2.7 2,420 890 171.9 1,671 44.8
Personal accident & healthJapan 153 185 (17.3) 171 (10.5) 2 1 100.0 2 0.0China 8 8 0.0 10 (20.0) - 1 NM 1 NMTaiwan 27 24 12.5 29 (6.9) - - NM - NMOther Asia 92 74 24.3 97 (5.2) - - NM 1 NMAll other regions 32 27 18.5 32 0.0 8 4 100.0 7 14.3Total 312 318 (1.9) 339 (8.0) 10 6 66.7 11 (9.1)
Group productsJapan 3 5 (40.0) 6 (50.0) - - NM - NMChina 3 - NM 1 200.0 - - NM - NMTaiwan 3 5 (40.0) 4 (25.0) 1 4 (75.0) 2 (50.0)Other Asia 19 19 0.0 17 11.8 16 14 14.3 14 14.3All other regions 154 240 (35.8) 154 0.0 198 66 200.0 99 100.0Total 182 269 (32.3) 182 0.0 215 84 156.0 115 87.0
Total premiumsJapan 367 392 (6.4) 389 (5.7) 347 151 129.8 380 (8.7)China 38 31 22.6 46 (17.4) 66 62 6.5 57 15.8Taiwan 209 247 (15.4) 130 60.8 195 208 (6.3) 97 101.0Other Asia 424 333 27.3 482 (12.0) 386 323 19.5 406 (4.9)All other regions 256 316 (19.0) 253 1.2 1,651 236 NM 857 92.6Total 1,294 1,319 (1.9) 1,300 (0.5) $ 2,645 $ 980 169.9 % $ 1,797 47.2 %
Annuity Production:Individual fixed annuity
Japan 919 1,022 (10.1) 1,422 (35.4)Korea 114 177 (35.6) 113 0.9Other Asia 13 46 (71.7) 24 (45.8)All other regions 71 47 51.1 79 (10.1)Total 1,117 1,292 (13.5) 1,638 (31.8)
Individual variable annuityJapan 274 583 (53.0) 245 11.8Other Asia 5 1 400.0 3 66.7All other regions 2,806 3,088 (9.1) 3,722 (24.6)Total 3,085 3,672 (16.0) 3,970 (22.3)
Total Annuity Production $ 4,202 $ 4,964 (15.4) % $ 5,608 (25.1) %
(See Accompanying Notes on Pages 39 and 40)
32
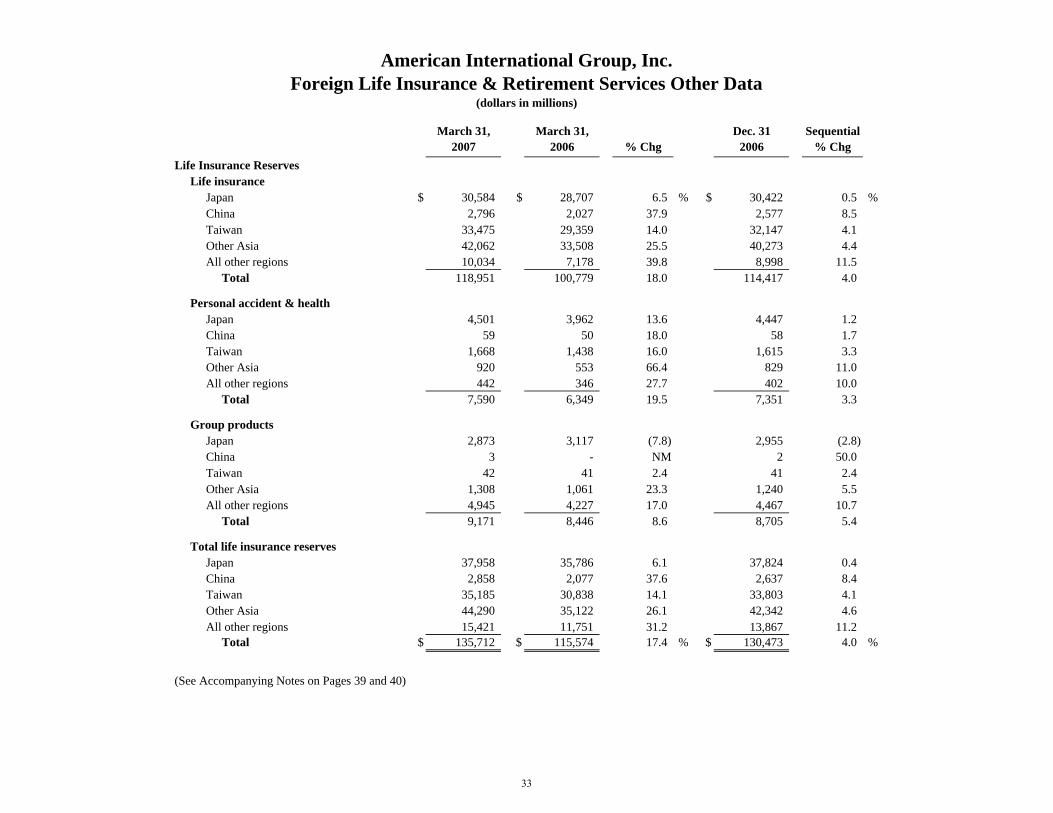
American International Group, Inc.Foreign Life Insurance & Retirement Services Other Data
(dollars in millions)
March 31, March 31, Dec. 31 Sequential2007 2006 % Chg 2006 % Chg
Life Insurance Reserves Life insurance
Japan $ 30,584 $ 28,707 6.5 % $ 30,422 0.5 %China 2,796 2,027 37.9 2,577 8.5Taiwan 33,475 29,359 14.0 32,147 4.1Other Asia 42,062 33,508 25.5 40,273 4.4All other regions 10,034 7,178 39.8 8,998 11.5
Total 118,951 100,779 18.0 114,417 4.0
Personal accident & healthJapan 4,501 3,962 13.6 4,447 1.2China 59 50 18.0 58 1.7Taiwan 1,668 1,438 16.0 1,615 3.3Other Asia 920 553 66.4 829 11.0All other regions 442 346 27.7 402 10.0
Total 7,590 6,349 19.5 7,351 3.3
Group productsJapan 2,873 3,117 (7.8) 2,955 (2.8)China 3 - NM 2 50.0Taiwan 42 41 2.4 41 2.4Other Asia 1,308 1,061 23.3 1,240 5.5All other regions 4,945 4,227 17.0 4,467 10.7
Total 9,171 8,446 8.6 8,705 5.4
Total life insurance reservesJapan 37,958 35,786 6.1 37,824 0.4China 2,858 2,077 37.6 2,637 8.4Taiwan 35,185 30,838 14.1 33,803 4.1Other Asia 44,290 35,122 26.1 42,342 4.6All other regions 15,421 11,751 31.2 13,867 11.2
Total $ 135,712 $ 115,574 17.4 % $ 130,473 4.0 %
(See Accompanying Notes on Pages 39 and 40)
33
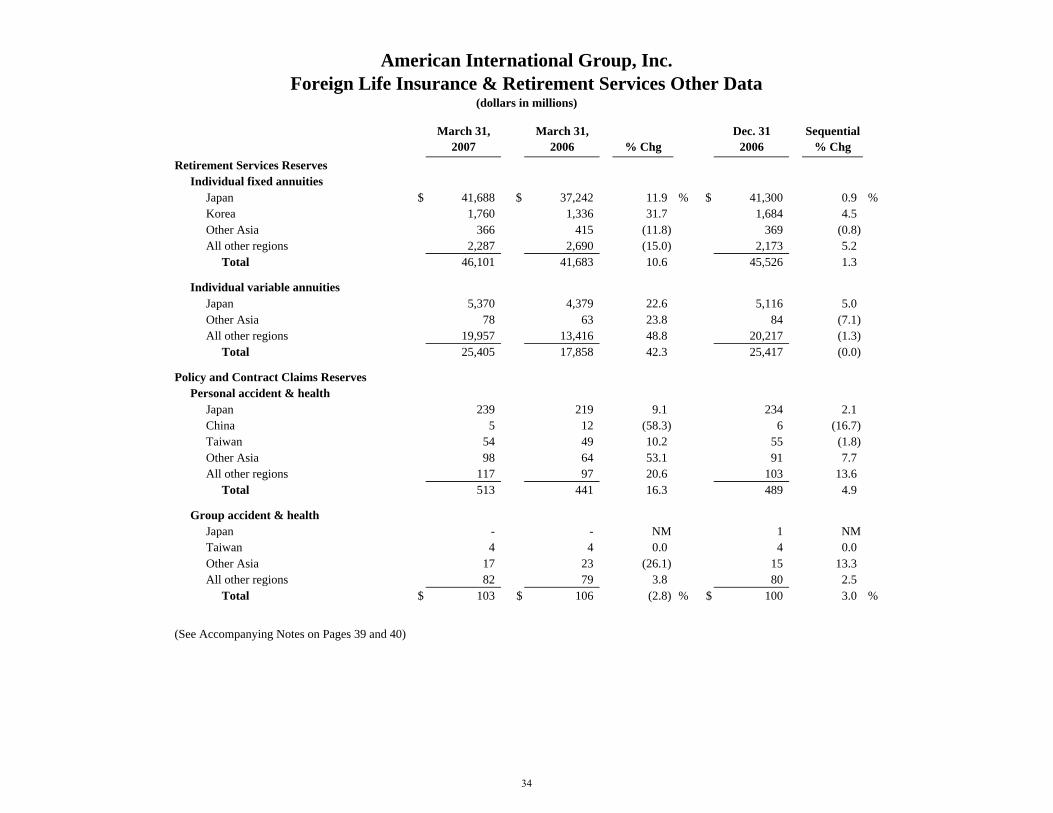
American International Group, Inc.Foreign Life Insurance & Retirement Services Other Data
(dollars in millions)
March 31, March 31, Dec. 31 Sequential2007 2006 % Chg 2006 % Chg
Retirement Services Reserves Individual fixed annuities
Japan $ 41,688 $ 37,242 11.9 % $ 41,300 0.9 %Korea 1,760 1,336 31.7 1,684 4.5Other Asia 366 415 (11.8) 369 (0.8)All other regions 2,287 2,690 (15.0) 2,173 5.2
Total 46,101 41,683 10.6 45,526 1.3
Individual variable annuitiesJapan 5,370 4,379 22.6 5,116 5.0Other Asia 78 63 23.8 84 (7.1)All other regions 19,957 13,416 48.8 20,217 (1.3)
Total 25,405 17,858 42.3 25,417 (0.0)
Policy and Contract Claims Reserves Personal accident & health
Japan 239 219 9.1 234 2.1China 5 12 (58.3) 6 (16.7)Taiwan 54 49 10.2 55 (1.8)Other Asia 98 64 53.1 91 7.7All other regions 117 97 20.6 103 13.6
Total 513 441 16.3 489 4.9
Group accident & healthJapan - - NM 1 NMTaiwan 4 4 0.0 4 0.0Other Asia 17 23 (26.1) 15 13.3All other regions 82 79 3.8 80 2.5
Total $ 103 $ 106 (2.8) % $ 100 3.0 %
(See Accompanying Notes on Pages 39 and 40)
34
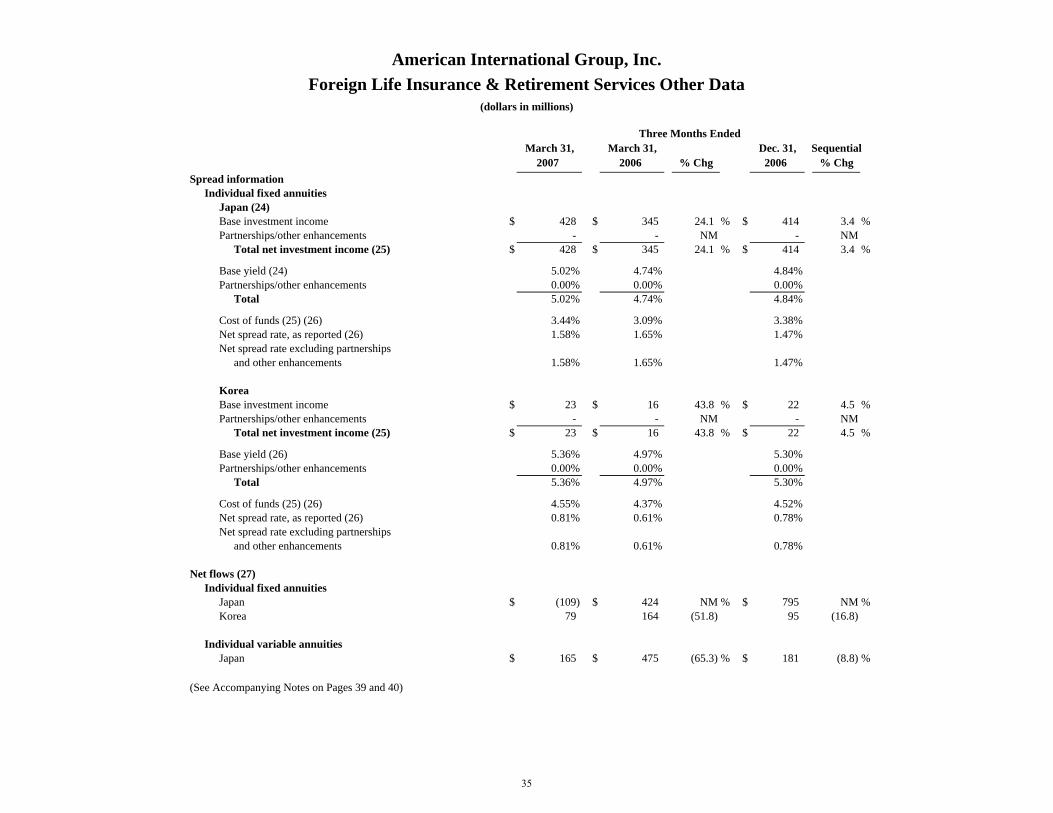
Three Months EndedMarch 31, March 31, Dec. 31, Sequential
2007 2006 % Chg 2006 % ChgSpread information
Individual fixed annuitiesJapan (24)Base investment income $ 428 $ 345 24.1 % $ 414 3.4 %Partnerships/other enhancements - - NM - NM
Total net investment income (25) $ 428 $ 345 24.1 % $ 414 3.4 %
Base yield (24) 5.02% 4.74% 4.84%Partnerships/other enhancements 0.00% 0.00% 0.00%
Total 5.02% 4.74% 4.84%
Cost of funds (25) (26) 3.44% 3.09% 3.38%Net spread rate, as reported (26) 1.58% 1.65% 1.47%Net spread rate excluding partnerships
and other enhancements 1.58% 1.65% 1.47%
KoreaBase investment income $ 23 $ 16 43.8 % $ 22 4.5 %Partnerships/other enhancements - - NM - NM
Total net investment income (25) $ 23 $ 16 43.8 % $ 22 4.5 %
Base yield (26) 5.36% 4.97% 5.30%Partnerships/other enhancements 0.00% 0.00% 0.00%
Total 5.36% 4.97% 5.30%
Cost of funds (25) (26) 4.55% 4.37% 4.52%Net spread rate, as reported (26) 0.81% 0.61% 0.78%Net spread rate excluding partnerships
and other enhancements 0.81% 0.61% 0.78%
Net flows (27)Individual fixed annuities
Japan $ (109) $ 424 NM % $ 795 NM %Korea 79 164 (51.8) 95 (16.8)
Individual variable annuitiesJapan $ 165 $ 475 (65.3) % $ 181 (8.8) %
(See Accompanying Notes on Pages 39 and 40)
American International Group, Inc.Foreign Life Insurance & Retirement Services Other Data
(dollars in millions)
35
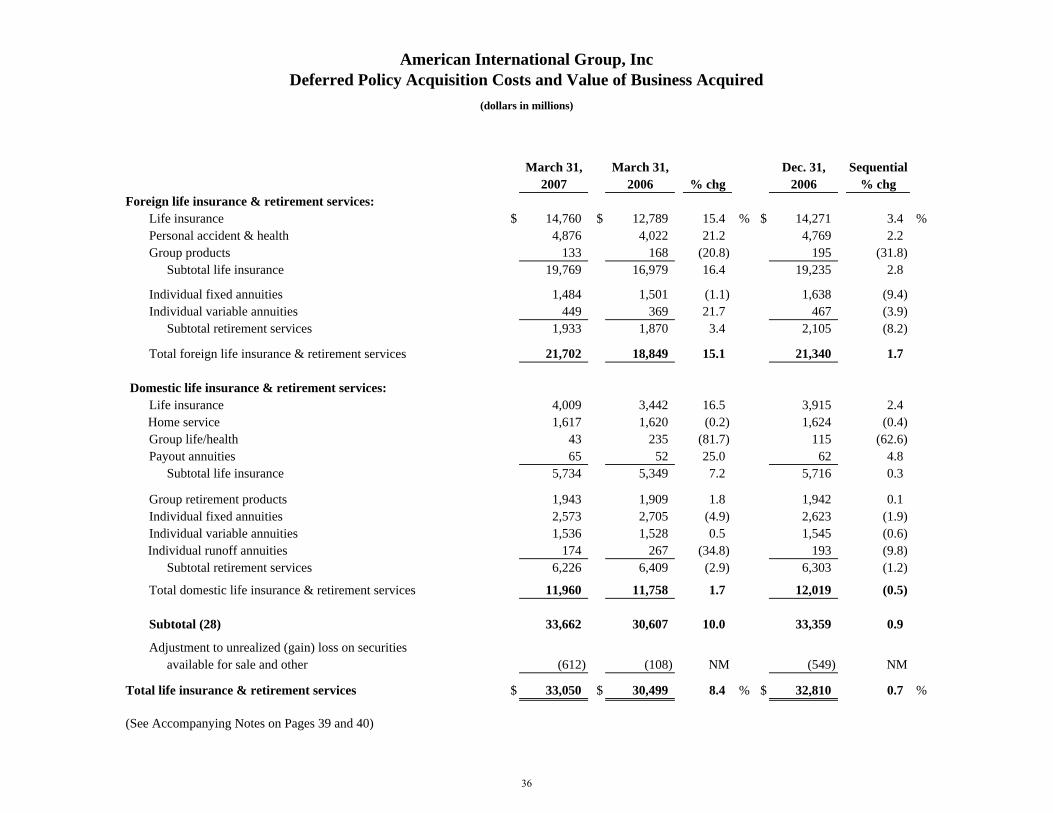
March 31, March 31, Dec. 31, Sequential2007 2006 % chg 2006 % chg
Foreign life insurance & retirement services:Life insurance $ 14,760 $ 12,789 15.4 % $ 14,271 3.4 %Personal accident & health 4,876 4,022 21.2 4,769 2.2Group products 133 168 (20.8) 195 (31.8)
Subtotal life insurance 19,769 16,979 16.4 19,235 2.8
Individual fixed annuities 1,484 1,501 (1.1) 1,638 (9.4)Individual variable annuities 449 369 21.7 467 (3.9)
Subtotal retirement services 1,933 1,870 3.4 2,105 (8.2)
Total foreign life insurance & retirement services 21,702 18,849 15.1 21,340 1.7
Domestic life insurance & retirement services:Life insurance 4,009 3,442 16.5 3,915 2.4
Home service 1,617 1,620 (0.2) 1,624 (0.4)Group life/health 43 235 (81.7) 115 (62.6)Payout annuities 65 52 25.0 62 4.8
Subtotal life insurance 5,734 5,349 7.2 5,716 0.3
Group retirement products 1,943 1,909 1.8 1,942 0.1Individual fixed annuities 2,573 2,705 (4.9) 2,623 (1.9)Individual variable annuities 1,536 1,528 0.5 1,545 (0.6)
Individual runoff annuities 174 267 (34.8) 193 (9.8)Subtotal retirement services 6,226 6,409 (2.9) 6,303 (1.2)
Total domestic life insurance & retirement services 11,960 11,758 1.7 12,019 (0.5)
Subtotal (28) 33,662 30,607 10.0 33,359 0.9
Adjustment to unrealized (gain) loss on securities available for sale and other (612) (108) NM (549) NM
Total life insurance & retirement services $ 33,050 $ 30,499 8.4 % $ 32,810 0.7 %
(See Accompanying Notes on Pages 39 and 40)
American International Group, Inc
(dollars in millions)
Deferred Policy Acquisition Costs and Value of Business Acquired
36
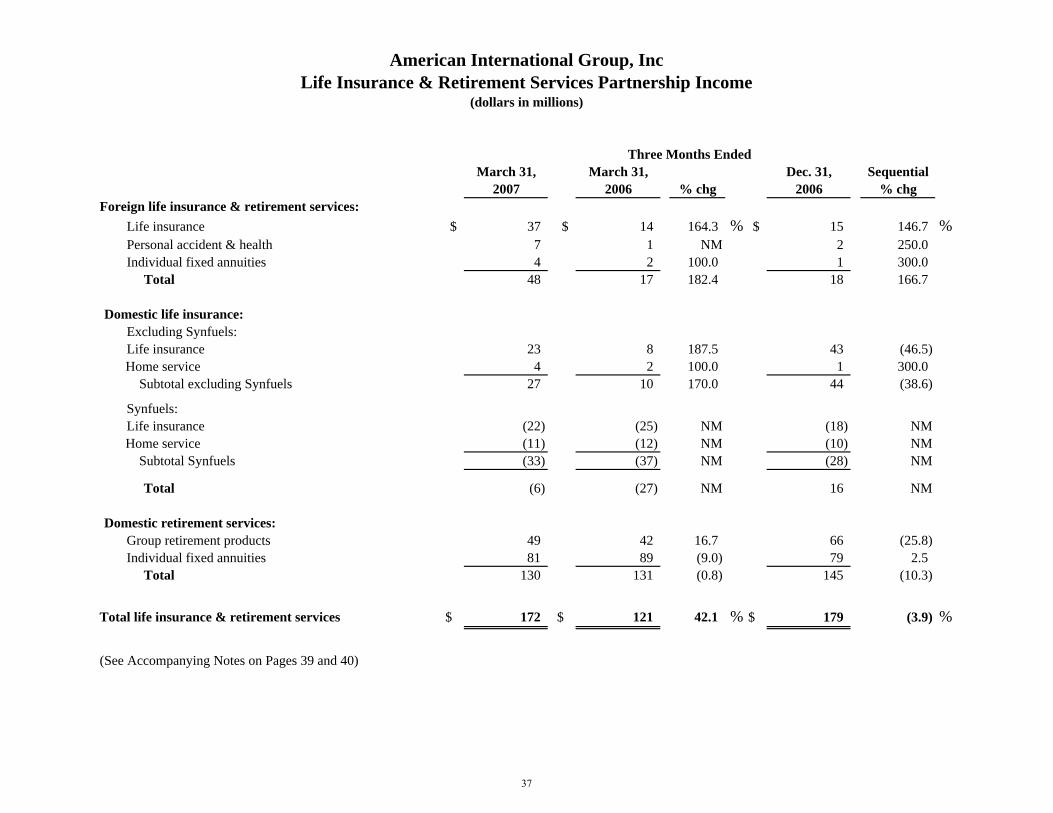
March 31, March 31, Dec. 31, Sequential2007 2006 % chg 2006 % chg
Foreign life insurance & retirement services:Life insurance $ 37 $ 14 164.3 % $ 15 146.7 %Personal accident & health 7 1 NM 2 250.0Individual fixed annuities 4 2 100.0 1 300.0
Total 48 17 182.4 18 166.7
Domestic life insurance:Excluding Synfuels:Life insurance 23 8 187.5 43 (46.5)
Home service 4 2 100.0 1 300.0Subtotal excluding Synfuels 27 10 170.0 44 (38.6)
Synfuels:Life insurance (22) (25) NM (18) NM
Home service (11) (12) NM (10) NMSubtotal Synfuels (33) (37) NM (28) NM
Total (6) (27) NM 16 NM
Domestic retirement services:Group retirement products 49 42 16.7 66 (25.8)Individual fixed annuities 81 89 (9.0) 79 2.5
Total 130 131 (0.8) 145 (10.3)
Total life insurance & retirement services $ 172 $ 121 42.1 % $ 179 (3.9) %
(See Accompanying Notes on Pages 39 and 40)
American International Group, IncLife Insurance & Retirement Services Partnership Income
(dollars in millions)
Three Months Ended
37
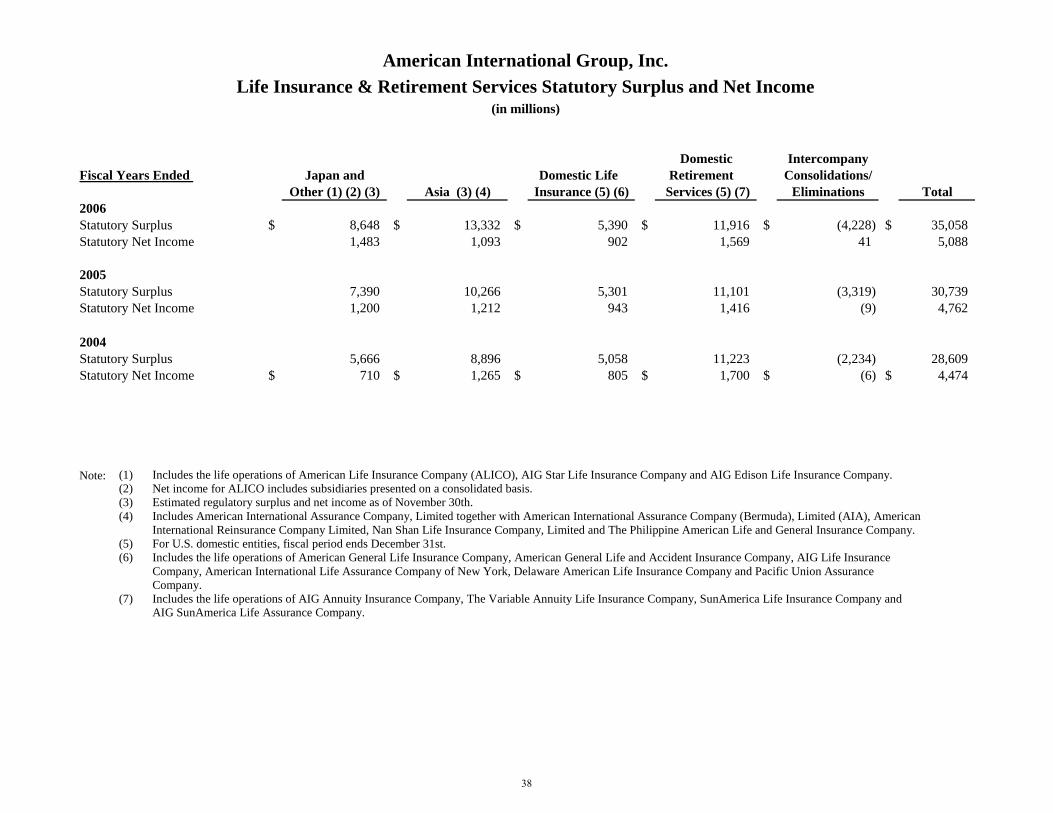
American International Group, Inc.Life Insurance & Retirement Services Statutory Surplus and Net Income
(in millions)
Domestic IntercompanyFiscal Years Ended Japan and Domestic Life Retirement Consolidations/
Other (1) (2) (3) Asia (3) (4) Insurance (5) (6) Services (5) (7) Eliminations Total2006Statutory Surplus $ 8,648 $ 13,332 $ 5,390 $ 11,916 $ (4,228) $ 35,058 Statutory Net Income 1,483 1,093 902 1,569 41 5,088
2005Statutory Surplus 7,390 10,266 5,301 11,101 (3,319) 30,739 Statutory Net Income 1,200 1,212 943 1,416 (9) 4,762
2004Statutory Surplus 5,666 8,896 5,058 11,223 (2,234) 28,609 Statutory Net Income $ 710 $ 1,265 $ 805 $ 1,700 $ (6) $ 4,474
Note: (1) Includes the life operations of American Life Insurance Company (ALICO), AIG Star Life Insurance Company and AIG Edison Life Insurance Company. (2) Net income for ALICO includes subsidiaries presented on a consolidated basis. (3) Estimated regulatory surplus and net income as of November 30th. (4) Includes American International Assurance Company, Limited together with American International Assurance Company (Bermuda), Limited (AIA), American
International Reinsurance Company Limited, Nan Shan Life Insurance Company, Limited and The Philippine American Life and General Insurance Company. (5) For U.S. domestic entities, fiscal period ends December 31st. (6) Includes the life operations of American General Life Insurance Company, American General Life and Accident Insurance Company, AIG Life Insurance
Company, American International Life Assurance Company of New York, Delaware American Life Insurance Company and Pacific Union Assurance Company.
(7) Includes the life operations of AIG Annuity Insurance Company, The Variable Annuity Life Insurance Company, SunAmerica Life Insurance Company and AIG SunAmerica Life Assurance Company.
38
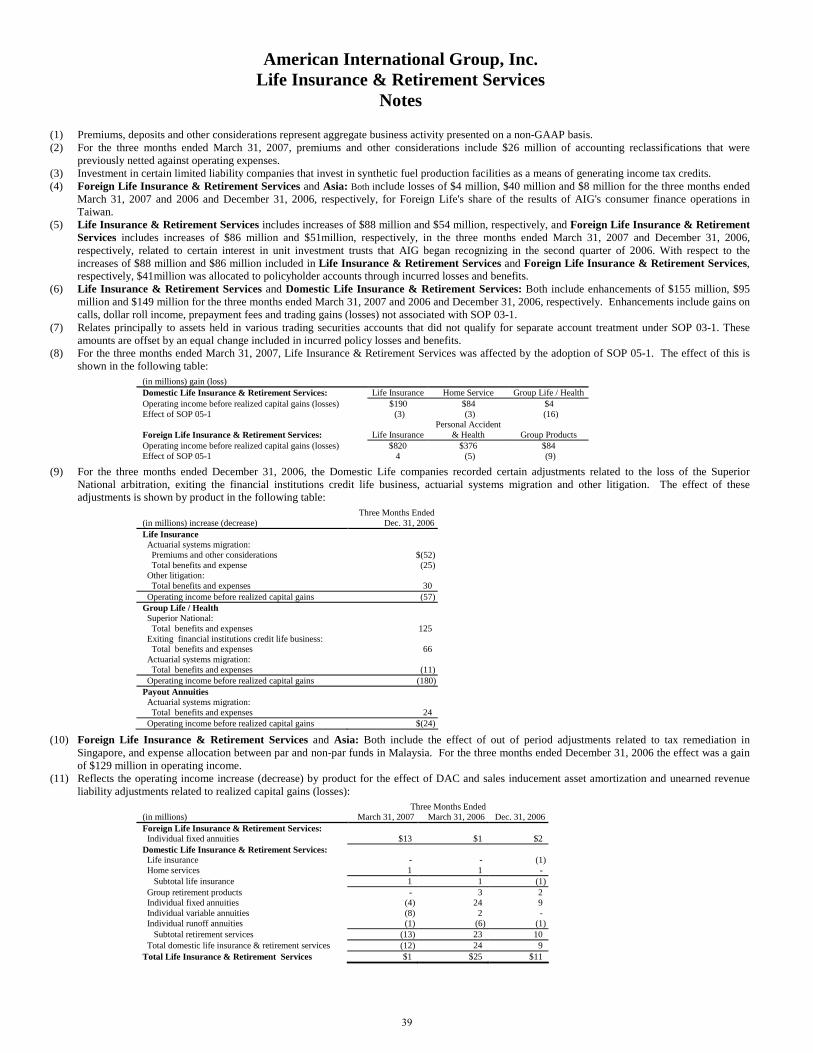
American International Group, Inc. Life Insurance & Retirement Services
Notes
(1) Premiums, deposits and other considerations represent aggregate business activity presented on a non-GAAP basis. (2) For the three months ended March 31, 2007, premiums and other considerations include $26 million of accounting reclassifications that were
previously netted against operating expenses. (3) Investment in certain limited liability companies that invest in synthetic fuel production facilities as a means of generating income tax credits. (4) Foreign Life Insurance & Retirement Services and Asia: Both include losses of $4 million, $40 million and $8 million for the three months ended
March 31, 2007 and 2006 and December 31, 2006, respectively, for Foreign Life's share of the results of AIG's consumer finance operations in Taiwan.
(5) Life Insurance & Retirement Services includes increases of $88 million and $54 million, respectively, and Foreign Life Insurance & Retirement Services includes increases of $86 million and $51million, respectively, in the three months ended March 31, 2007 and December 31, 2006, respectively, related to certain interest in unit investment trusts that AIG began recognizing in the second quarter of 2006. With respect to the increases of $88 million and $86 million included in Life Insurance & Retirement Services and Foreign Life Insurance & Retirement Services, respectively, $41million was allocated to policyholder accounts through incurred losses and benefits.
(6) Life Insurance & Retirement Services and Domestic Life Insurance & Retirement Services: Both include enhancements of $155 million, $95 million and $149 million for the three months ended March 31, 2007 and 2006 and December 31, 2006, respectively. Enhancements include gains on calls, dollar roll income, prepayment fees and trading gains (losses) not associated with SOP 03-1.
(7) Relates principally to assets held in various trading securities accounts that did not qualify for separate account treatment under SOP 03-1. These amounts are offset by an equal change included in incurred policy losses and benefits.
(8) For the three months ended March 31, 2007, Life Insurance & Retirement Services was affected by the adoption of SOP 05-1. The effect of this is shown in the following table:
(in millions) gain (loss) Domestic Life Insurance & Retirement Services: Life Insurance Home Service Group Life / Health Operating income before realized capital gains (losses) $190 $84 $4 Effect of SOP 05-1 (3) (3) (16) Foreign Life Insurance & Retirement Services:
Life Insurance
Personal Accident & Health
Group Products
Operating income before realized capital gains (losses) $820 $376 $84 Effect of SOP 05-1 4 (5) (9)
(9) For the three months ended December 31, 2006, the Domestic Life companies recorded certain adjustments related to the loss of the Superior National arbitration, exiting the financial institutions credit life business, actuarial systems migration and other litigation. The effect of these adjustments is shown by product in the following table:
Three Months Ended(in millions) increase (decrease) Dec. 31, 2006Life Insurance Actuarial systems migration: Premiums and other considerations $(52) Total benefits and expense (25) Other litigation: Total benefits and expenses 30 Operating income before realized capital gains (57)Group Life / Health Superior National: Total benefits and expenses 125 Exiting financial institutions credit life business: Total benefits and expenses 66 Actuarial systems migration: Total benefits and expenses (11) Operating income before realized capital gains (180)Payout Annuities Actuarial systems migration: Total benefits and expenses 24 Operating income before realized capital gains $(24)
(10) Foreign Life Insurance & Retirement Services and Asia: Both include the effect of out of period adjustments related to tax remediation in Singapore, and expense allocation between par and non-par funds in Malaysia. For the three months ended December 31, 2006 the effect was a gain of $129 million in operating income.
(11) Reflects the operating income increase (decrease) by product for the effect of DAC and sales inducement asset amortization and unearned revenue liability adjustments related to realized capital gains (losses):
Three Months Ended (in millions) March 31, 2007 March 31, 2006 Dec. 31, 2006Foreign Life Insurance & Retirement Services: Individual fixed annuities $13 $1 $2 Domestic Life Insurance & Retirement Services: Life insurance - - (1) Home services 1 1 - Subtotal life insurance 1 1 (1) Group retirement products - 3 2 Individual fixed annuities (4) 24 9 Individual variable annuities (8) 2 - Individual runoff annuities (1) (6) (1) Subtotal retirement services (13) 23 10 Total domestic life insurance & retirement services (12) 24 9 Total Life Insurance & Retirement Services $1 $25 $11
39
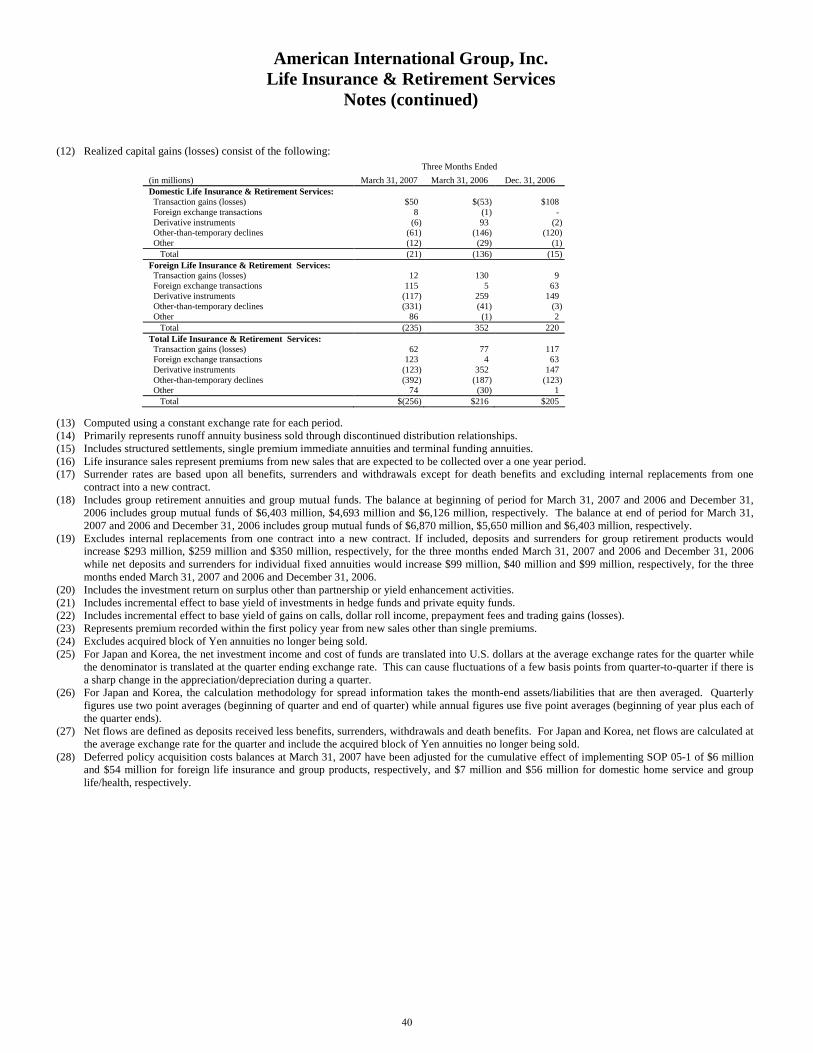
(12) Realized capital gains (losses) consist of the following:
Three Months Ended (in millions) March 31, 2007 March 31, 2006 Dec. 31, 2006 Domestic Life Insurance & Retirement Services: Transaction gains (losses) $50 $(53) $108 Foreign exchange transactions 8 (1) - Derivative instruments (6) 93 (2) Other-than-temporary declines (61) (146) (120) Other (12) (29) (1) Total (21) (136) (15)Foreign Life Insurance & Retirement Services: Transaction gains (losses) 12 130 9 Foreign exchange transactions 115 5 63 Derivative instruments (117) 259 149 Other-than-temporary declines (331) (41) (3) Other 86 (1) 2 Total (235) 352 220 Total Life Insurance & Retirement Services: Transaction gains (losses) 62 77 117 Foreign exchange transactions 123 4 63 Derivative instruments (123) 352 147 Other-than-temporary declines (392) (187) (123) Other 74 (30) 1 Total $(256) $216 $205
(13) Computed using a constant exchange rate for each period. (14) Primarily represents runoff annuity business sold through discontinued distribution relationships. (15) Includes structured settlements, single premium immediate annuities and terminal funding annuities. (16) Life insurance sales represent premiums from new sales that are expected to be collected over a one year period. (17) Surrender rates are based upon all benefits, surrenders and withdrawals except for death benefits and excluding internal replacements from one
contract into a new contract. (18) Includes group retirement annuities and group mutual funds. The balance at beginning of period for March 31, 2007 and 2006 and December 31,
2006 includes group mutual funds of $6,403 million, $4,693 million and $6,126 million, respectively. The balance at end of period for March 31, 2007 and 2006 and December 31, 2006 includes group mutual funds of $6,870 million, $5,650 million and $6,403 million, respectively.
(19) Excludes internal replacements from one contract into a new contract. If included, deposits and surrenders for group retirement products would increase $293 million, $259 million and $350 million, respectively, for the three months ended March 31, 2007 and 2006 and December 31, 2006 while net deposits and surrenders for individual fixed annuities would increase $99 million, $40 million and $99 million, respectively, for the three months ended March 31, 2007 and 2006 and December 31, 2006.
(20) Includes the investment return on surplus other than partnership or yield enhancement activities. (21) Includes incremental effect to base yield of investments in hedge funds and private equity funds. (22) Includes incremental effect to base yield of gains on calls, dollar roll income, prepayment fees and trading gains (losses). (23) Represents premium recorded within the first policy year from new sales other than single premiums. (24) Excludes acquired block of Yen annuities no longer being sold. (25) For Japan and Korea, the net investment income and cost of funds are translated into U.S. dollars at the average exchange rates for the quarter while
the denominator is translated at the quarter ending exchange rate. This can cause fluctuations of a few basis points from quarter-to-quarter if there is a sharp change in the appreciation/depreciation during a quarter.
(26) For Japan and Korea, the calculation methodology for spread information takes the month-end assets/liabilities that are then averaged. Quarterly figures use two point averages (beginning of quarter and end of quarter) while annual figures use five point averages (beginning of year plus each of the quarter ends).
(27) Net flows are defined as deposits received less benefits, surrenders, withdrawals and death benefits. For Japan and Korea, net flows are calculated at the average exchange rate for the quarter and include the acquired block of Yen annuities no longer being sold.
(28) Deferred policy acquisition costs balances at March 31, 2007 have been adjusted for the cumulative effect of implementing SOP 05-1 of $6 million and $54 million for foreign life insurance and group products, respectively, and $7 million and $56 million for domestic home service and group life/health, respectively.
American International Group, Inc. Life Insurance & Retirement Services
Notes (continued)
40
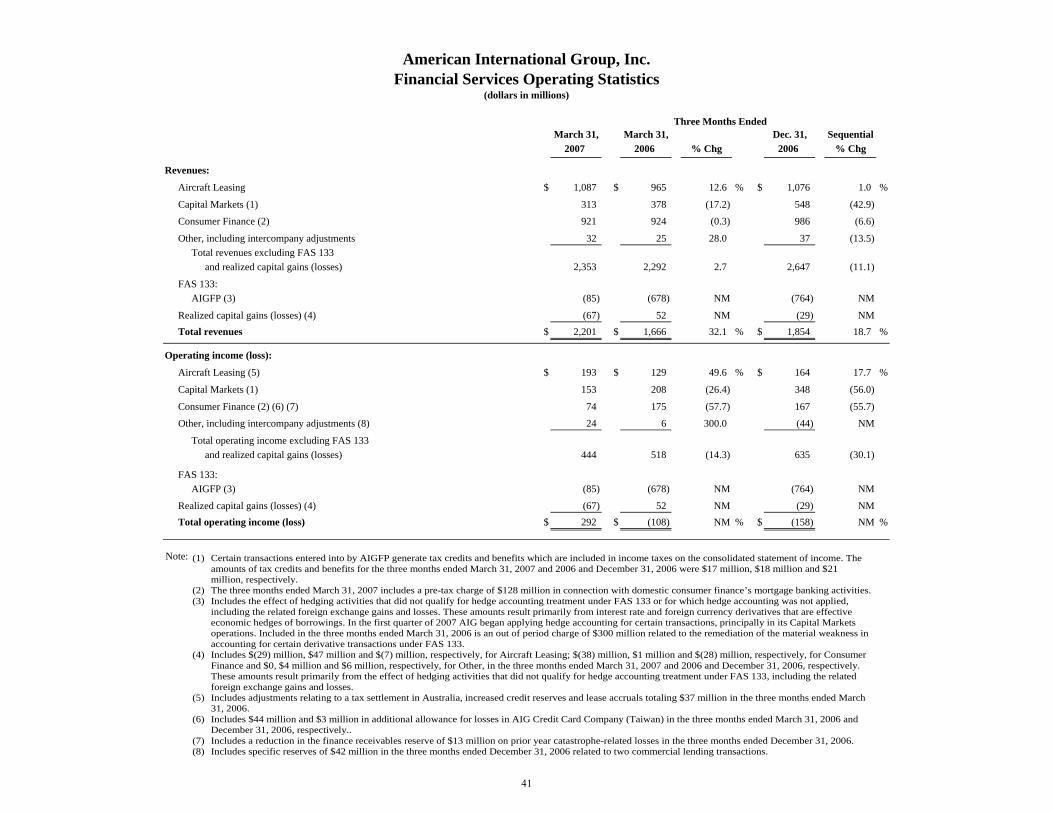
March 31, March 31, Dec. 31, Sequential2007 2006 % Chg 2006 % Chg
Revenues:
Aircraft Leasing $ 1,087 $ 965 12.6 % $ 1,076 1.0 %
Capital Markets (1) 313 378 (17.2) 548 (42.9)
Consumer Finance (2) 921 924 (0.3) 986 (6.6)
Other, including intercompany adjustments 32 25 28.0 37 (13.5)Total revenues excluding FAS 133
and realized capital gains (losses) 2,353 2,292 2.7 2,647 (11.1)
FAS 133:AIGFP (3) (85) (678) NM (764) NM
Realized capital gains (losses) (4) (67) 52 NM (29) NMTotal revenues $ 2,201 $ 1,666 32.1 % $ 1,854 18.7 %
Operating income (loss):
Aircraft Leasing (5) $ 193 $ 129 49.6 % $ 164 17.7 %
Capital Markets (1) 153 208 (26.4) 348 (56.0)
Consumer Finance (2) (6) (7) 74 175 (57.7) 167 (55.7)
Other, including intercompany adjustments (8) 24 6 300.0 (44) NM
Total operating income excluding FAS 133 and realized capital gains (losses) 444 518 (14.3) 635 (30.1)
FAS 133:AIGFP (3) (85) (678) NM (764) NM
Realized capital gains (losses) (4) (67) 52 NM (29) NMTotal operating income (loss) $ 292 $ (108) NM % $ (158) NM %
Note:
Three Months Ended
American International Group, Inc.Financial Services Operating Statistics
(dollars in millions)
(1) Certain transactions entered into by AIGFP generate tax credits and benefits which are included in income taxes on the consolidated statement of income. The amounts of tax credits and benefits for the three months ended March 31, 2007 and 2006 and December 31, 2006 were $17 million, $18 million and $21 million, respectively.
(2) The three months ended March 31, 2007 includes a pre-tax charge of $128 million in connection with domestic consumer finance’s mortgage banking activities.(3) Includes the effect of hedging activities that did not qualify for hedge accounting treatment under FAS 133 or for which hedge accounting was not applied,
including the related foreign exchange gains and losses. These amounts result primarily from interest rate and foreign currency derivatives that are effective economic hedges of borrowings. In the first quarter of 2007 AIG began applying hedge accounting for certain transactions, principally in its Capital Markets operations. Included in the three months ended March 31, 2006 is an out of period charge of $300 million related to the remediation of the material weakness in accounting for certain derivative transactions under FAS 133.
(4) Includes $(29) million, $47 million and $(7) million, respectively, for Aircraft Leasing; $(38) million, $1 million and $(28) million, respectively, for Consumer Finance and $0, $4 million and $6 million, respectively, for Other, in the three months ended March 31, 2007 and 2006 and December 31, 2006, respectively. These amounts result primarily from the effect of hedging activities that did not qualify for hedge accounting treatment under FAS 133, including the related foreign exchange gains and losses.
(5) Includes adjustments relating to a tax settlement in Australia, increased credit reserves and lease accruals totaling $37 million in the three months ended March 31, 2006.
(6) Includes $44 million and $3 million in additional allowance for losses in AIG Credit Card Company (Taiwan) in the three months ended March 31, 2006 and December 31, 2006, respectively..
(7) Includes a reduction in the finance receivables reserve of $13 million on prior year catastrophe-related losses in the three months ended December 31, 2006. (8) Includes specific reserves of $42 million in the three months ended December 31, 2006 related to two commercial lending transactions.
41
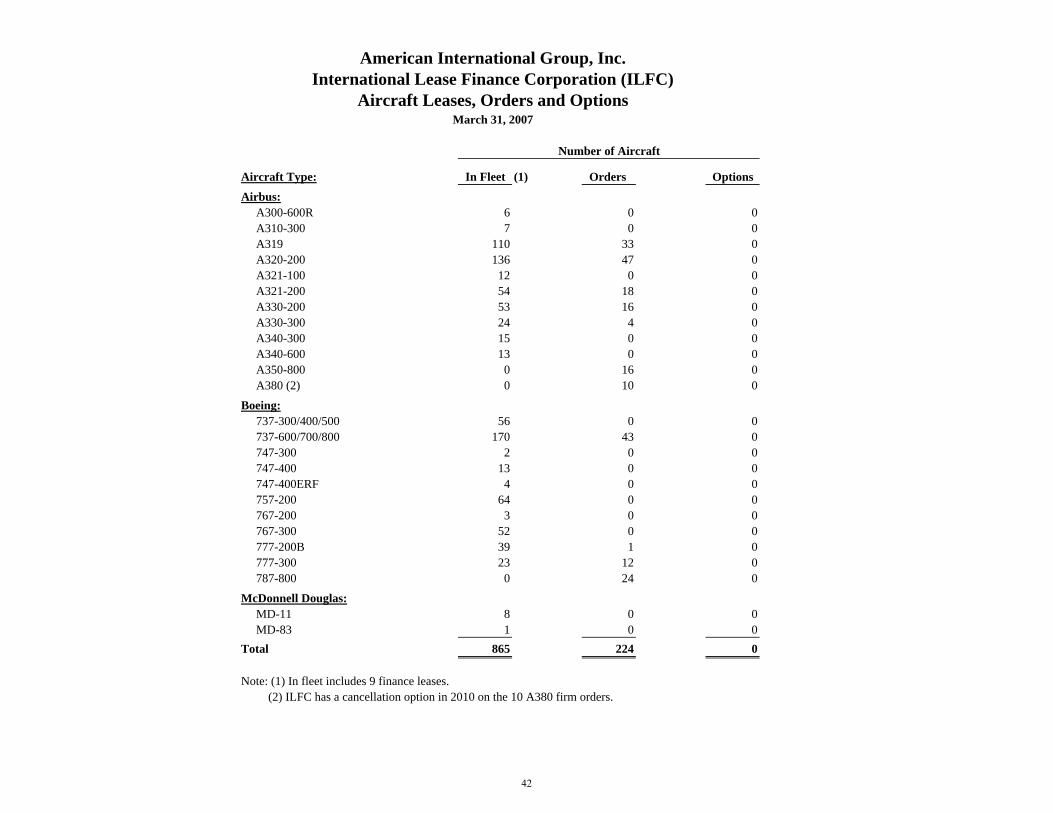
Aircraft Type: In Fleet (1) Orders Options
Airbus:A300-600R 6 0 0A310-300 7 0 0A319 110 33 0A320-200 136 47 0A321-100 12 0 0A321-200 54 18 0A330-200 53 16 0A330-300 24 4 0A340-300 15 0 0A340-600 13 0 0A350-800 0 16 0A380 (2) 0 10 0
Boeing:737-300/400/500 56 0 0737-600/700/800 170 43 0747-300 2 0 0747-400 13 0 0747-400ERF 4 0 0757-200 64 0 0767-200 3 0 0767-300 52 0 0777-200B 39 1 0777-300 23 12 0787-800 0 24 0
McDonnell Douglas:MD-11 8 0 0MD-83 1 0 0
Total 865 224 0
Note: (1) In fleet includes 9 finance leases. (2) ILFC has a cancellation option in 2010 on the 10 A380 firm orders.
Number of Aircraft
American International Group, Inc.International Lease Finance Corporation (ILFC)
Aircraft Leases, Orders and OptionsMarch 31, 2007
42
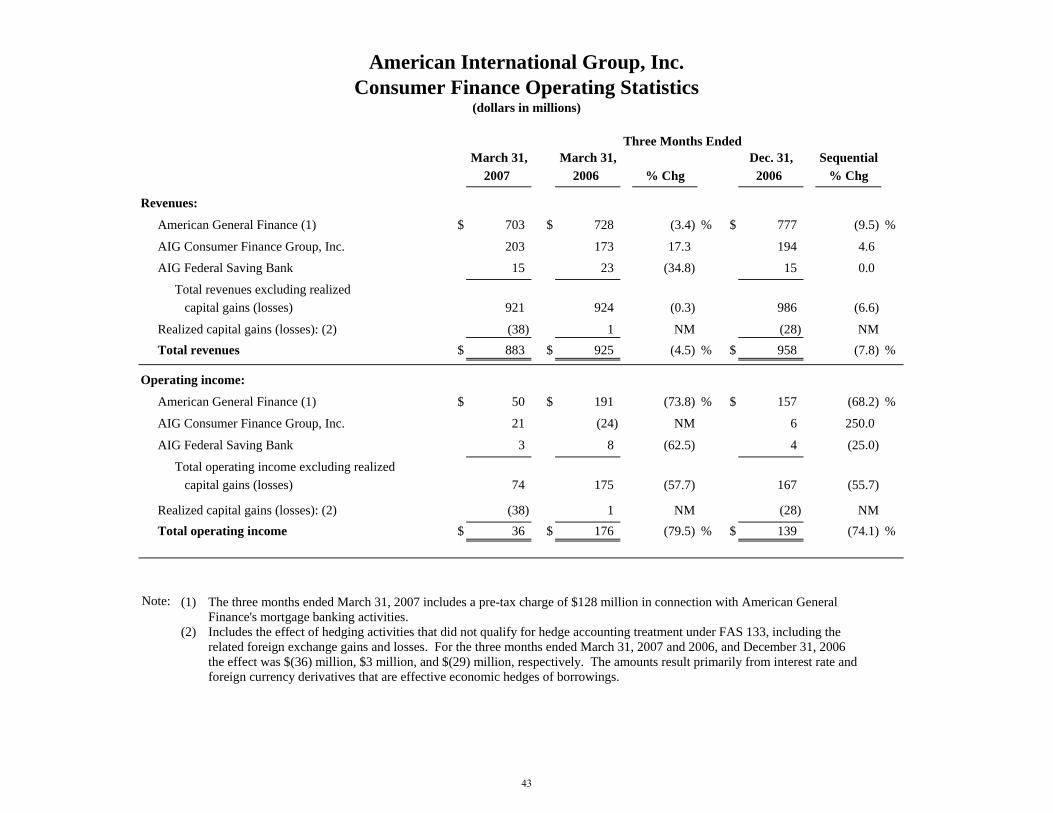
March 31, March 31, Dec. 31, Sequential2007 2006 % Chg 2006 % Chg
Revenues:
American General Finance (1) $ 703 $ 728 (3.4) % $ 777 (9.5) %
AIG Consumer Finance Group, Inc. 203 173 17.3 194 4.6
AIG Federal Saving Bank 15 23 (34.8) 15 0.0
Total revenues excluding realized capital gains (losses) 921 924 (0.3) 986 (6.6)
Realized capital gains (losses): (2) (38) 1 NM (28) NMTotal revenues $ 883 $ 925 (4.5) % $ 958 (7.8) %
Operating income:
American General Finance (1) $ 50 $ 191 (73.8) % $ 157 (68.2) %
AIG Consumer Finance Group, Inc. 21 (24) NM 6 250.0
AIG Federal Saving Bank 3 8 (62.5) 4 (25.0)
Total operating income excluding realized capital gains (losses) 74 175 (57.7) 167 (55.7)
Realized capital gains (losses): (2) (38) 1 NM (28) NMTotal operating income $ 36 $ 176 (79.5) % $ 139 (74.1) %
Note:
Three Months Ended
American International Group, Inc.Consumer Finance Operating Statistics
(dollars in millions)
(1) The three months ended March 31, 2007 includes a pre-tax charge of $128 million in connection with American General Finance's mortgage banking activities.
(2) Includes the effect of hedging activities that did not qualify for hedge accounting treatment under FAS 133, including the related foreign exchange gains and losses. For the three months ended March 31, 2007 and 2006, and December 31, 2006 the effect was $(36) million, $3 million, and $(29) million, respectively. The amounts result primarily from interest rate and foreign currency derivatives that are effective economic hedges of borrowings.
43
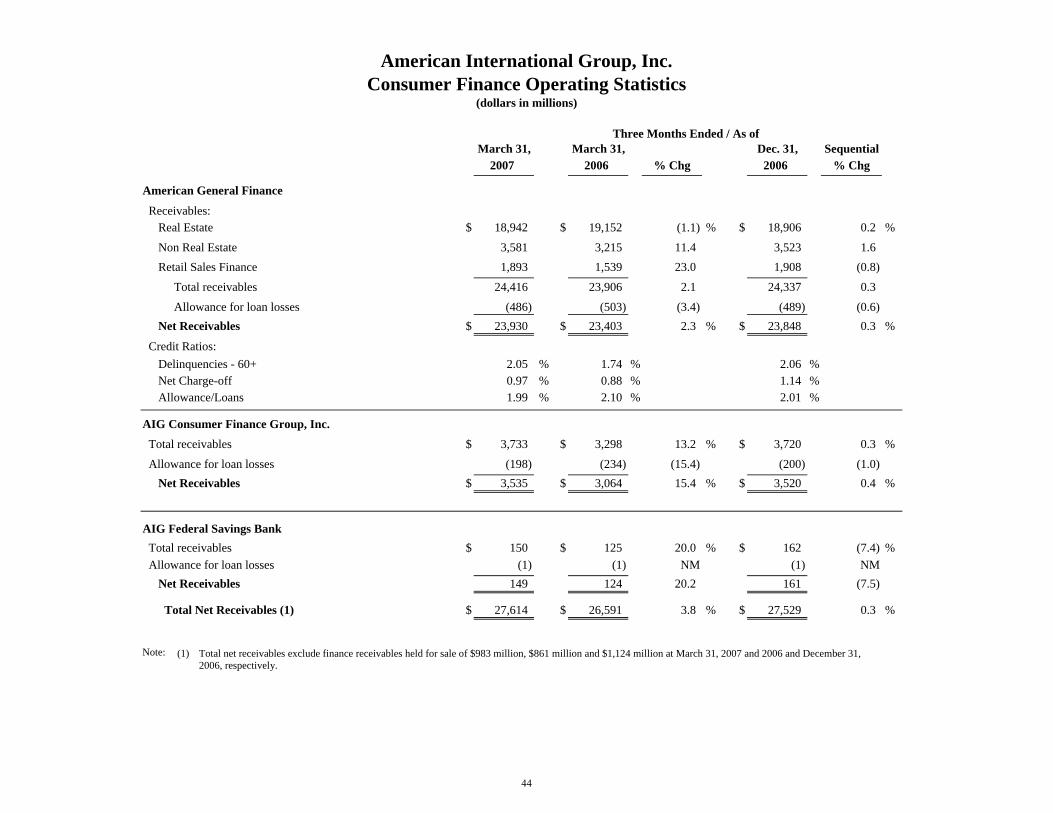
March 31, March 31, Dec. 31, Sequential2007 2006 % Chg 2006 % Chg
American General Finance
Receivables:Real Estate $ 18,942 $ 19,152 (1.1) % $ 18,906 0.2 %
Non Real Estate 3,581 3,215 11.4 3,523 1.6Retail Sales Finance 1,893 1,539 23.0 1,908 (0.8)
Total receivables 24,416 23,906 2.1 24,337 0.3
Allowance for loan losses (486) (503) (3.4) (489) (0.6)Net Receivables $ 23,930 $ 23,403 2.3 % $ 23,848 0.3 %
Credit Ratios:Delinquencies - 60+ 2.05 % 1.74 % 2.06 %Net Charge-off 0.97 % 0.88 % 1.14 %Allowance/Loans 1.99 % 2.10 % 2.01 %
AIG Consumer Finance Group, Inc.
Total receivables $ 3,733 $ 3,298 13.2 % $ 3,720 0.3 %
Allowance for loan losses (198) (234) (15.4) (200) (1.0)Net Receivables $ 3,535 $ 3,064 15.4 % $ 3,520 0.4 %
AIG Federal Savings Bank Total receivables $ 150 $ 125 20.0 % $ 162 (7.4) % Allowance for loan losses (1) (1) NM (1) NM
Net Receivables 149 124 20.2 161 (7.5)
Total Net Receivables (1) $ 27,614 $ 26,591 3.8 % $ 27,529 0.3 %
Note:
Three Months Ended / As of
American International Group, Inc.Consumer Finance Operating Statistics
(dollars in millions)
(1) Total net receivables exclude finance receivables held for sale of $983 million, $861 million and $1,124 million at March 31, 2007 and 2006 and December 31, 2006, respectively.
44
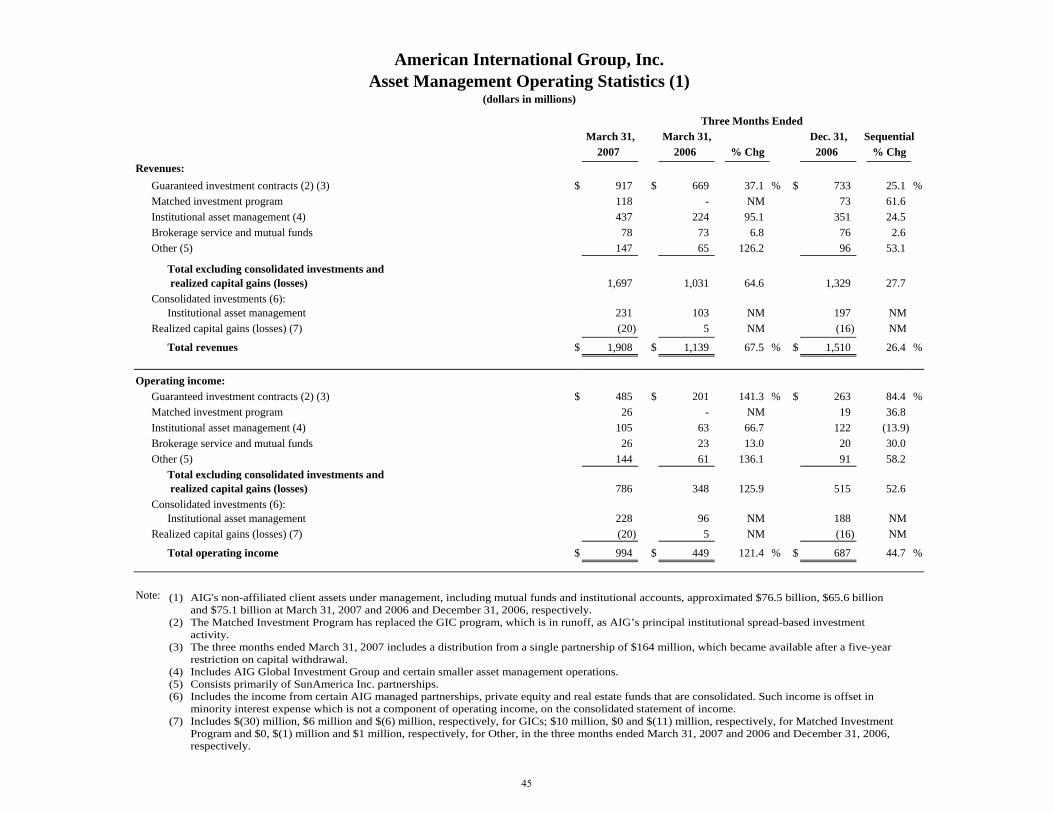
March 31, March 31, Dec. 31, Sequential2007 2006 % Chg 2006 % Chg
Revenues:Guaranteed investment contracts (2) (3) $ 917 $ 669 37.1 % $ 733 25.1 %Matched investment program 118 - NM 73 61.6Institutional asset management (4) 437 224 95.1 351 24.5Brokerage service and mutual funds 78 73 6.8 76 2.6Other (5) 147 65 126.2 96 53.1
Total excluding consolidated investments and realized capital gains (losses) 1,697 1,031 64.6 1,329 27.7
Consolidated investments (6):Institutional asset management 231 103 NM 197 NM
Realized capital gains (losses) (7) (20) 5 NM (16) NM
Total revenues $ 1,908 $ 1,139 67.5 % $ 1,510 26.4 %
Operating income:Guaranteed investment contracts (2) (3) $ 485 $ 201 141.3 % $ 263 84.4 %Matched investment program 26 - NM 19 36.8Institutional asset management (4) 105 63 66.7 122 (13.9)Brokerage service and mutual funds 26 23 13.0 20 30.0Other (5) 144 61 136.1 91 58.2
Total excluding consolidated investments and realized capital gains (losses) 786 348 125.9 515 52.6
Consolidated investments (6):Institutional asset management 228 96 NM 188 NM
Realized capital gains (losses) (7) (20) 5 NM (16) NM
Total operating income $ 994 $ 449 121.4 % $ 687 44.7 %
Note:
Three Months Ended
American International Group, Inc.Asset Management Operating Statistics (1)
(dollars in millions)
(1) AIG's non-affiliated client assets under management, including mutual funds and institutional accounts, approximated $76.5 billion, $65.6 billion and $75.1 billion at March 31, 2007 and 2006 and December 31, 2006, respectively.
(2) The Matched Investment Program has replaced the GIC program, which is in runoff, as AIG’s principal institutional spread-based investment activity.
(3) The three months ended March 31, 2007 includes a distribution from a single partnership of $164 million, which became available after a five-year restriction on capital withdrawal.
(4) Includes AIG Global Investment Group and certain smaller asset management operations. (5) Consists primarily of SunAmerica Inc. partnerships. (6) Includes the income from certain AIG managed partnerships, private equity and real estate funds that are consolidated. Such income is offset in
minority interest expense which is not a component of operating income, on the consolidated statement of income. (7) Includes $(30) million, $6 million and $(6) million, respectively, for GICs; $10 million, $0 and $(11) million, respectively, for Matched Investment
Program and $0, $(1) million and $1 million, respectively, for Other, in the three months ended March 31, 2007 and 2006 and December 31, 2006, respectively.
45
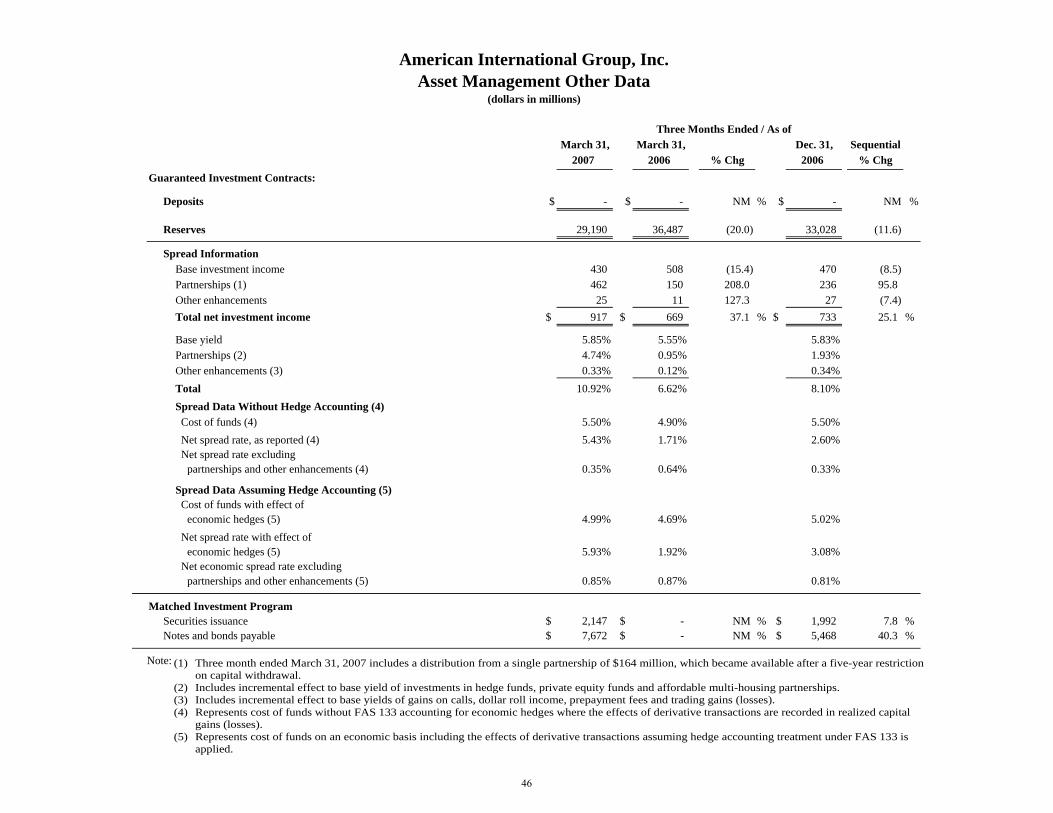
March 31, March 31, Dec. 31, Sequential2007 2006 % Chg 2006 % Chg
Guaranteed Investment Contracts:
Deposits $ - $ - NM % $ - NM %
Reserves 29,190 36,487 (20.0) 33,028 (11.6)
Spread InformationBase investment income 430 508 (15.4) 470 (8.5)Partnerships (1) 462 150 208.0 236 95.8Other enhancements 25 11 127.3 27 (7.4)Total net investment income $ 917 $ 669 37.1 % $ 733 25.1 %
Base yield 5.85% 5.55% 5.83%Partnerships (2) 4.74% 0.95% 1.93%Other enhancements (3) 0.33% 0.12% 0.34%Total 10.92% 6.62% 8.10%Spread Data Without Hedge Accounting (4) Cost of funds (4) 5.50% 4.90% 5.50% Net spread rate, as reported (4) 5.43% 1.71% 2.60% Net spread rate excluding
partnerships and other enhancements (4) 0.35% 0.64% 0.33%
Spread Data Assuming Hedge Accounting (5) Cost of funds with effect of
economic hedges (5) 4.99% 4.69% 5.02% Net spread rate with effect of
economic hedges (5) 5.93% 1.92% 3.08% Net economic spread rate excluding
partnerships and other enhancements (5) 0.85% 0.87% 0.81%
Matched Investment ProgramSecurities issuance $ 2,147 $ - NM % $ 1,992 7.8 %Notes and bonds payable $ 7,672 $ - NM % $ 5,468 40.3 %
Note:
Three Months Ended / As of
American International Group, Inc.Asset Management Other Data
(dollars in millions)
(1) Three month ended March 31, 2007 includes a distribution from a single partnership of $164 million, which became available after a five-year restriction on capital withdrawal.
(2) Includes incremental effect to base yield of investments in hedge funds, private equity funds and affordable multi-housing partnerships. (3) Includes incremental effect to base yields of gains on calls, dollar roll income, prepayment fees and trading gains (losses). (4) Represents cost of funds without FAS 133 accounting for economic hedges where the effects of derivative transactions are recorded in realized capital
gains (losses). (5) Represents cost of funds on an economic basis including the effects of derivative transactions assuming hedge accounting treatment under FAS 133 is
applied.
46
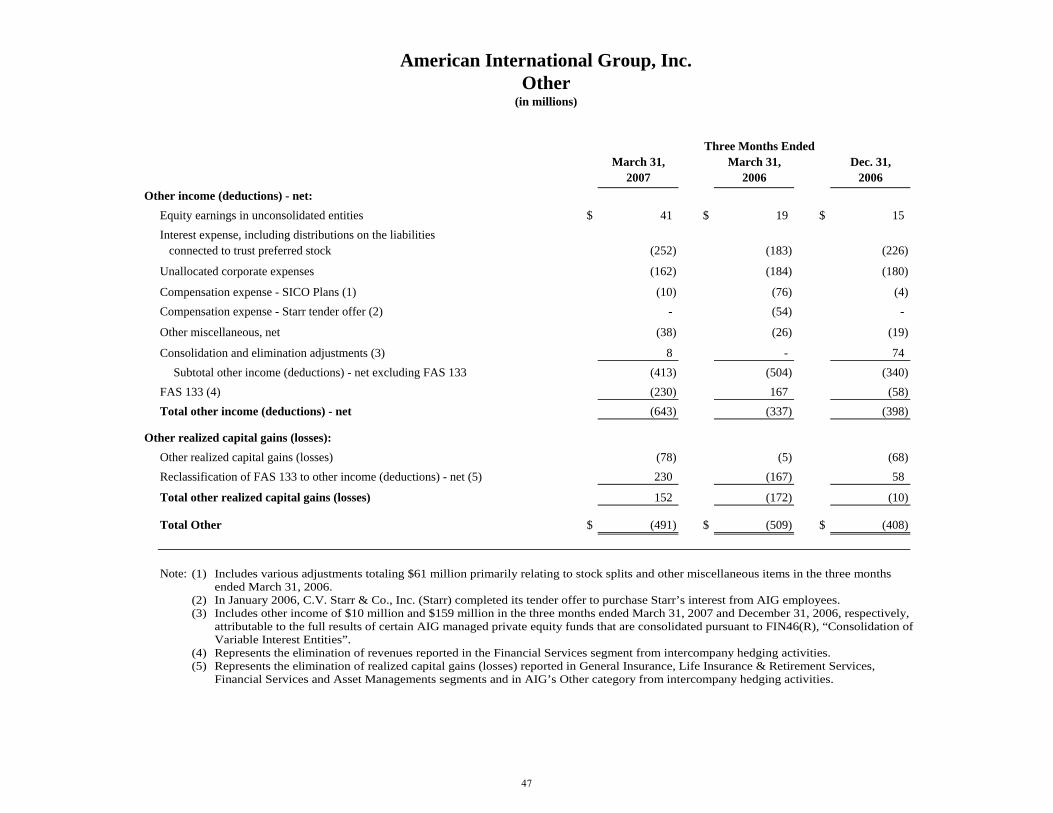
American International Group, Inc.Other
(in millions)
Three Months EndedMarch 31, March 31, Dec. 31,
2007 2006 2006Other income (deductions) - net:
Equity earnings in unconsolidated entities $ 41 $ 19 $ 15Interest expense, including distributions on the liabilities connected to trust preferred stock (252) (183) (226)
Unallocated corporate expenses (162) (184) (180)
Compensation expense - SICO Plans (1) (10) (76) (4)Compensation expense - Starr tender offer (2) - (54) -
Other miscellaneous, net (38) (26) (19)
Consolidation and elimination adjustments (3) 8 - 74 Subtotal other income (deductions) - net excluding FAS 133 (413) (504) (340)
FAS 133 (4) (230) 167 (58) Total other income (deductions) - net (643) (337) (398)
Other realized capital gains (losses):Other realized capital gains (losses) (78) (5) (68) Reclassification of FAS 133 to other income (deductions) - net (5) 230 (167) 58
Total other realized capital gains (losses) 152 (172) (10)
Total Other $ (491) $ (509) $ (408)
Note: (1) Includes various adjustments totaling $61 million primarily relating to stock splits and other miscellaneous items in the three months ended March 31, 2006.
(2) In January 2006, C.V. Starr & Co., Inc. (Starr) completed its tender offer to purchase Starr’s interest from AIG employees. (3) Includes other income of $10 million and $159 million in the three months ended March 31, 2007 and December 31, 2006, respectively,
attributable to the full results of certain AIG managed private equity funds that are consolidated pursuant to FIN46(R), “Consolidation of Variable Interest Entities”.
(4) Represents the elimination of revenues reported in the Financial Services segment from intercompany hedging activities. (5) Represents the elimination of realized capital gains (losses) reported in General Insurance, Life Insurance & Retirement Services,
Financial Services and Asset Managements segments and in AIG’s Other category from intercompany hedging activities.
47
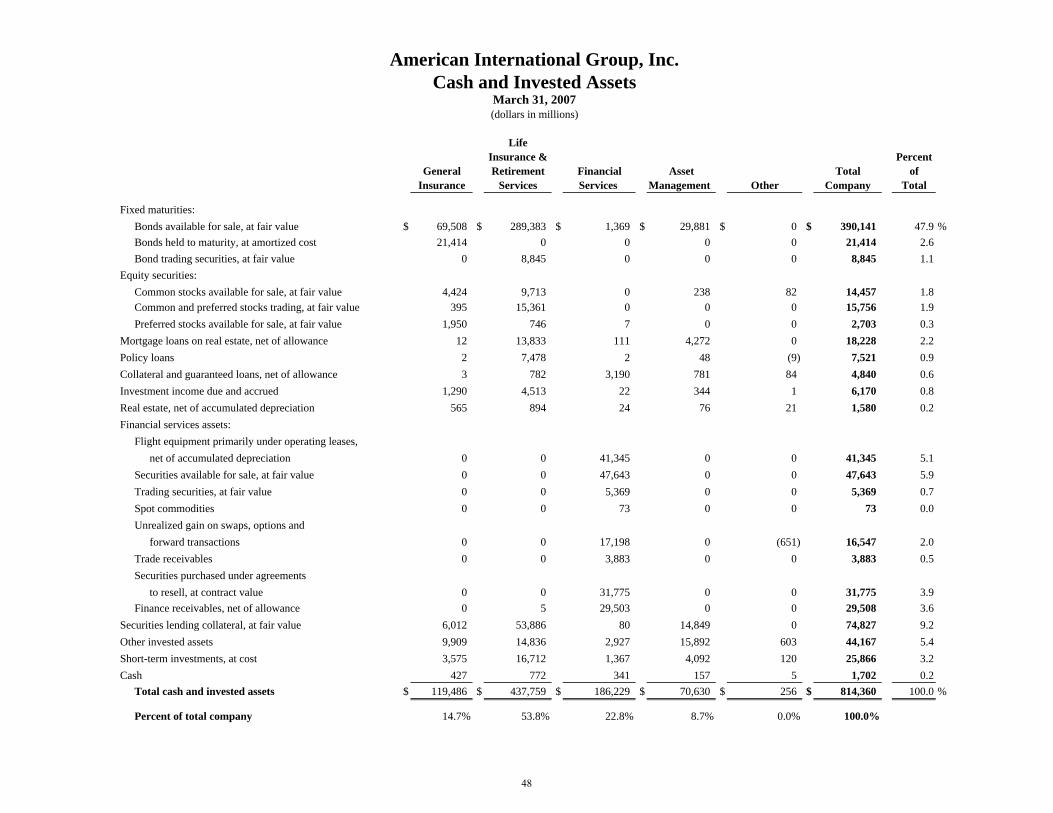
American International Group, Inc.Cash and Invested Assets
March 31, 2007(dollars in millions)
LifeInsurance & Percent
General Retirement Financial Asset Total ofInsurance Services Services Management Other Company Total
Fixed maturities:Bonds available for sale, at fair value $ 69,508 $ 289,383 $ 1,369 $ 29,881 $ 0 $ 390,141 47.9 %Bonds held to maturity, at amortized cost 21,414 0 0 0 0 21,414 2.6Bond trading securities, at fair value 0 8,845 0 0 0 8,845 1.1
Equity securities:Common stocks available for sale, at fair value 4,424 9,713 0 238 82 14,457 1.8Common and preferred stocks trading, at fair value 395 15,361 0 0 0 15,756 1.9Preferred stocks available for sale, at fair value 1,950 746 7 0 0 2,703 0.3
Mortgage loans on real estate, net of allowance 12 13,833 111 4,272 0 18,228 2.2Policy loans 2 7,478 2 48 (9) 7,521 0.9Collateral and guaranteed loans, net of allowance 3 782 3,190 781 84 4,840 0.6Investment income due and accrued 1,290 4,513 22 344 1 6,170 0.8Real estate, net of accumulated depreciation 565 894 24 76 21 1,580 0.2Financial services assets:
Flight equipment primarily under operating leases, net of accumulated depreciation 0 0 41,345 0 0 41,345 5.1Securities available for sale, at fair value 0 0 47,643 0 0 47,643 5.9Trading securities, at fair value 0 0 5,369 0 0 5,369 0.7Spot commodities 0 0 73 0 0 73 0.0Unrealized gain on swaps, options and
forward transactions 0 0 17,198 0 (651) 16,547 2.0Trade receivables 0 0 3,883 0 0 3,883 0.5Securities purchased under agreements to resell, at contract value 0 0 31,775 0 0 31,775 3.9Finance receivables, net of allowance 0 5 29,503 0 0 29,508 3.6
Securities lending collateral, at fair value 6,012 53,886 80 14,849 0 74,827 9.2Other invested assets 9,909 14,836 2,927 15,892 603 44,167 5.4Short-term investments, at cost 3,575 16,712 1,367 4,092 120 25,866 3.2Cash 427 772 341 157 5 1,702 0.2
Total cash and invested assets $ 119,486 $ 437,759 $ 186,229 $ 70,630 $ 256 $ 814,360 100.0 %
Percent of total company 14.7% 53.8% 22.8% 8.7% 0.0% 100.0%
48
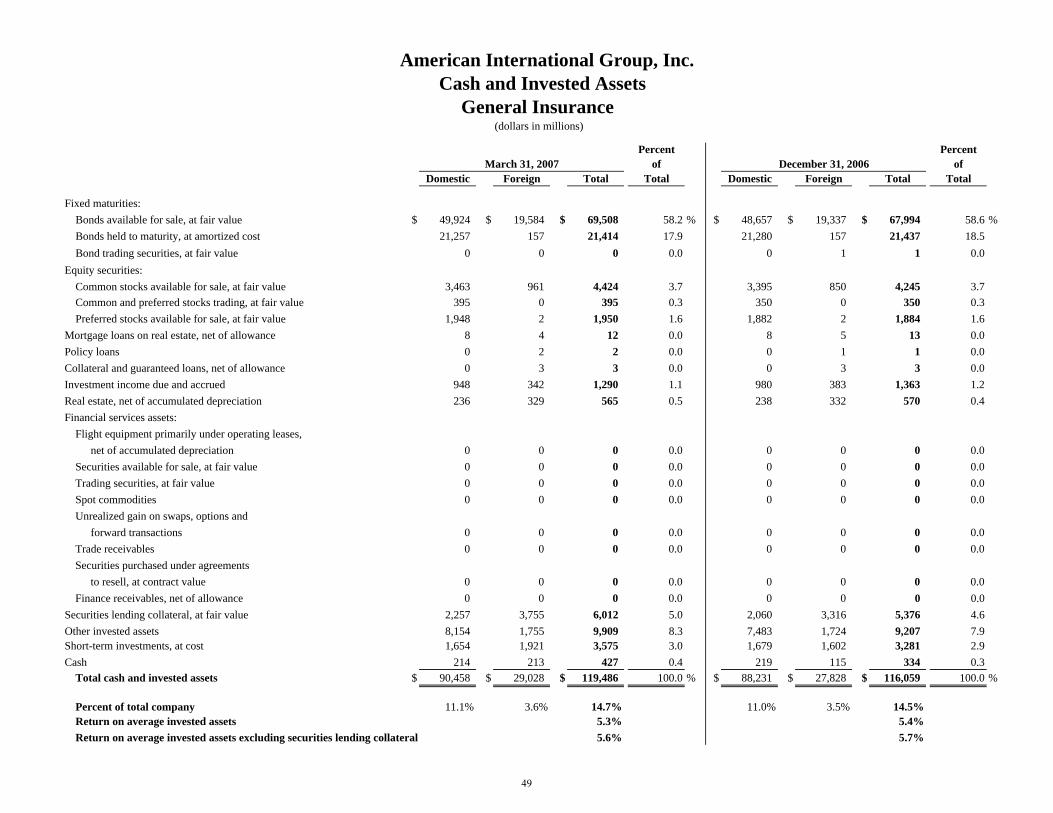
American International Group, Inc. Cash and Invested Assets
General Insurance (dollars in millions)
Percent PercentMarch 31, 2007 of December 31, 2006 of
Domestic Foreign Total Total Domestic Foreign Total Total
Fixed maturities:Bonds available for sale, at fair value $ 49,924 $ 19,584 $ 69,508 58.2 % $ 48,657 $ 19,337 $ 67,994 58.6 %Bonds held to maturity, at amortized cost 21,257 157 21,414 17.9 21,280 157 21,437 18.5Bond trading securities, at fair value 0 0 0 0.0 0 1 1 0.0
Equity securities:Common stocks available for sale, at fair value 3,463 961 4,424 3.7 3,395 850 4,245 3.7Common and preferred stocks trading, at fair value 395 0 395 0.3 350 0 350 0.3Preferred stocks available for sale, at fair value 1,948 2 1,950 1.6 1,882 2 1,884 1.6
Mortgage loans on real estate, net of allowance 8 4 12 0.0 8 5 13 0.0Policy loans 0 2 2 0.0 0 1 1 0.0Collateral and guaranteed loans, net of allowance 0 3 3 0.0 0 3 3 0.0Investment income due and accrued 948 342 1,290 1.1 980 383 1,363 1.2Real estate, net of accumulated depreciation 236 329 565 0.5 238 332 570 0.4Financial services assets:
Flight equipment primarily under operating leases, net of accumulated depreciation 0 0 0 0.0 0 0 0 0.0Securities available for sale, at fair value 0 0 0 0.0 0 0 0 0.0Trading securities, at fair value 0 0 0 0.0 0 0 0 0.0Spot commodities 0 0 0 0.0 0 0 0 0.0Unrealized gain on swaps, options and
forward transactions 0 0 0 0.0 0 0 0 0.0Trade receivables 0 0 0 0.0 0 0 0 0.0Securities purchased under agreements to resell, at contract value 0 0 0 0.0 0 0 0 0.0Finance receivables, net of allowance 0 0 0 0.0 0 0 0 0.0
Securities lending collateral, at fair value 2,257 3,755 6,012 5.0 2,060 3,316 5,376 4.6Other invested assets 8,154 1,755 9,909 8.3 7,483 1,724 9,207 7.9Short-term investments, at cost 1,654 1,921 3,575 3.0 1,679 1,602 3,281 2.9Cash 214 213 427 0.4 219 115 334 0.3
Total cash and invested assets $ 90,458 $ 29,028 $ 119,486 100.0 % $ 88,231 $ 27,828 $ 116,059 100.0 %
Percent of total company 11.1% 3.6% 14.7% 11.0% 3.5% 14.5%Return on average invested assets 5.3% 5.4%Return on average invested assets excluding securities lending collateral 5.6% 5.7%
49
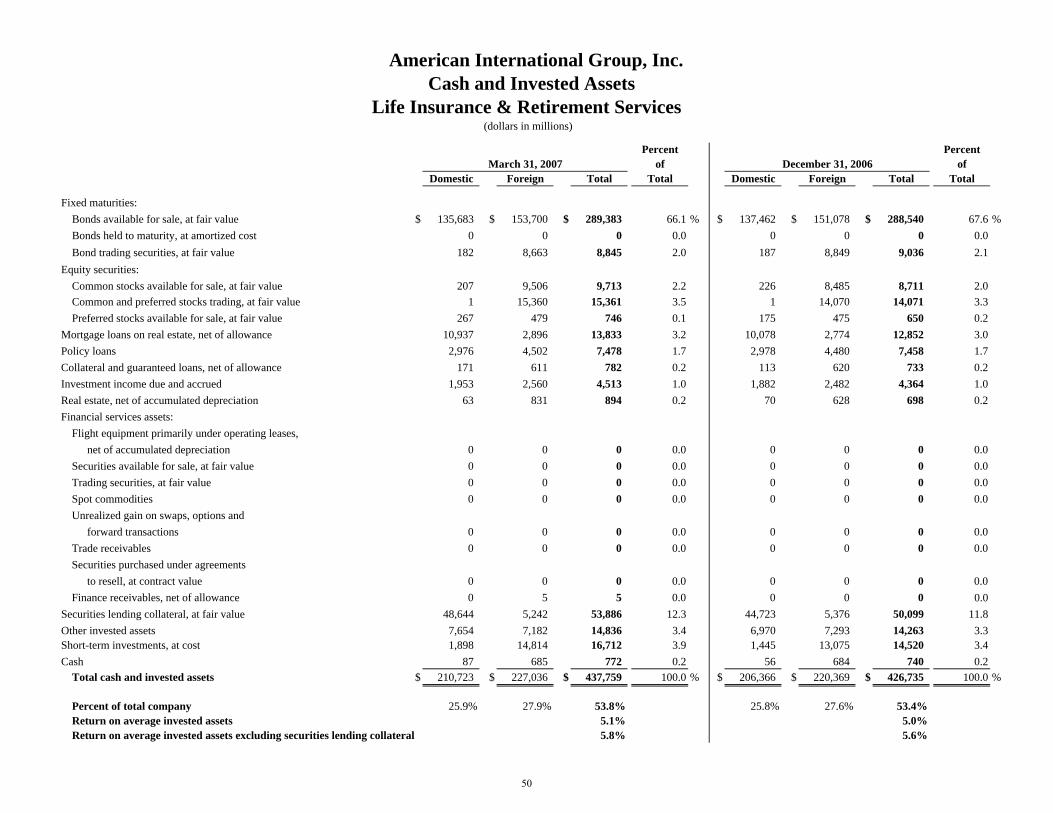
Percent PercentMarch 31, 2007 of December 31, 2006 of
Domestic Foreign Total Total Domestic Foreign Total Total
Fixed maturities:Bonds available for sale, at fair value $ 135,683 $ 153,700 $ 289,383 66.1 % $ 137,462 $ 151,078 $ 288,540 67.6 %Bonds held to maturity, at amortized cost 0 0 0 0.0 0 0 0 0.0Bond trading securities, at fair value 182 8,663 8,845 2.0 187 8,849 9,036 2.1
Equity securities:Common stocks available for sale, at fair value 207 9,506 9,713 2.2 226 8,485 8,711 2.0Common and preferred stocks trading, at fair value 1 15,360 15,361 3.5 1 14,070 14,071 3.3Preferred stocks available for sale, at fair value 267 479 746 0.1 175 475 650 0.2
Mortgage loans on real estate, net of allowance 10,937 2,896 13,833 3.2 10,078 2,774 12,852 3.0Policy loans 2,976 4,502 7,478 1.7 2,978 4,480 7,458 1.7Collateral and guaranteed loans, net of allowance 171 611 782 0.2 113 620 733 0.2Investment income due and accrued 1,953 2,560 4,513 1.0 1,882 2,482 4,364 1.0Real estate, net of accumulated depreciation 63 831 894 0.2 70 628 698 0.2Financial services assets:
Flight equipment primarily under operating leases, net of accumulated depreciation 0 0 0 0.0 0 0 0 0.0Securities available for sale, at fair value 0 0 0 0.0 0 0 0 0.0Trading securities, at fair value 0 0 0 0.0 0 0 0 0.0Spot commodities 0 0 0 0.0 0 0 0 0.0Unrealized gain on swaps, options and
forward transactions 0 0 0 0.0 0 0 0 0.0Trade receivables 0 0 0 0.0 0 0 0 0.0Securities purchased under agreements to resell, at contract value 0 0 0 0.0 0 0 0 0.0Finance receivables, net of allowance 0 5 5 0.0 0 0 0 0.0
Securities lending collateral, at fair value 48,644 5,242 53,886 12.3 44,723 5,376 50,099 11.8Other invested assets 7,654 7,182 14,836 3.4 6,970 7,293 14,263 3.3Short-term investments, at cost 1,898 14,814 16,712 3.9 1,445 13,075 14,520 3.4Cash 87 685 772 0.2 56 684 740 0.2
Total cash and invested assets $ 210,723 $ 227,036 $ 437,759 100.0 % $ 206,366 $ 220,369 $ 426,735 100.0 %
Percent of total company 25.9% 27.9% 53.8% 25.8% 27.6% 53.4%Return on average invested assets 5.1% 5.0%Return on average invested assets excluding securities lending collateral 5.8% 5.6%
American International Group, Inc. Cash and Invested Assets
Life Insurance & Retirement Services (dollars in millions)
50
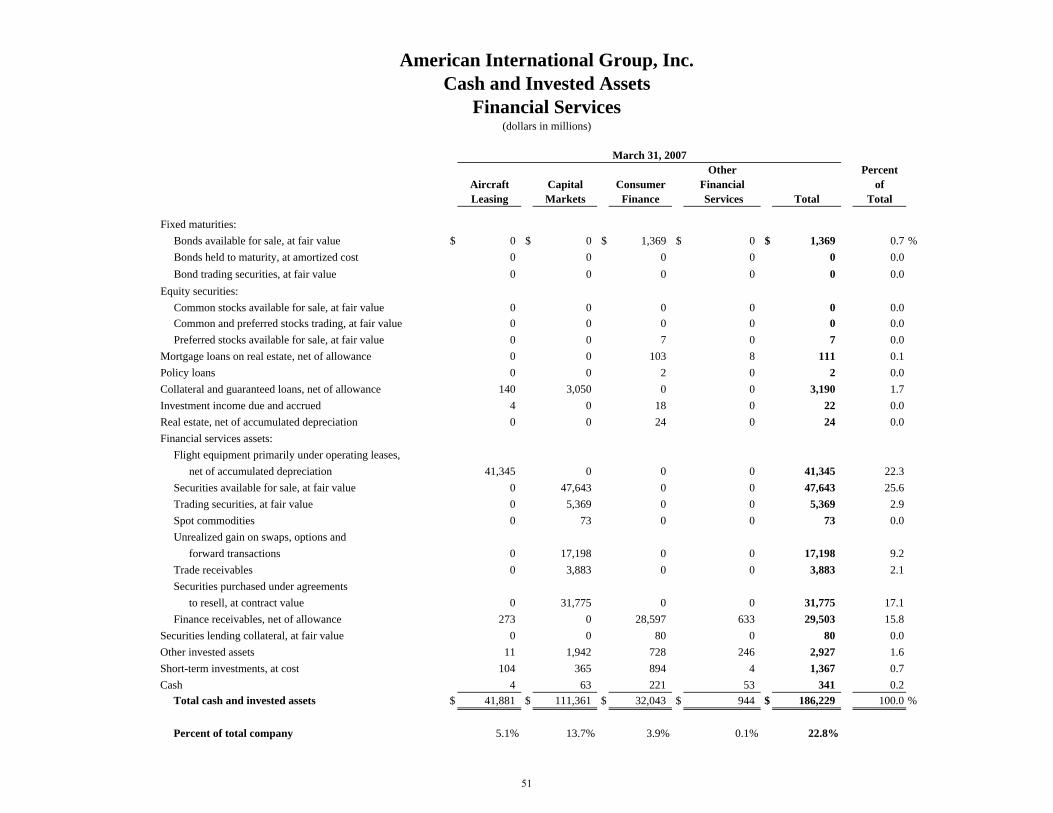
American International Group, Inc.Cash and Invested Assets
Financial Services(dollars in millions)
March 31, 2007Other Percent
Aircraft Capital Consumer Financial ofLeasing Markets Finance Services Total Total
Fixed maturities:Bonds available for sale, at fair value $ 0 $ 0 $ 1,369 $ 0 $ 1,369 0.7 %Bonds held to maturity, at amortized cost 0 0 0 0 0 0.0Bond trading securities, at fair value 0 0 0 0 0 0.0
Equity securities:Common stocks available for sale, at fair value 0 0 0 0 0 0.0Common and preferred stocks trading, at fair value 0 0 0 0 0 0.0Preferred stocks available for sale, at fair value 0 0 7 0 7 0.0
Mortgage loans on real estate, net of allowance 0 0 103 8 111 0.1Policy loans 0 0 2 0 2 0.0Collateral and guaranteed loans, net of allowance 140 3,050 0 0 3,190 1.7Investment income due and accrued 4 0 18 0 22 0.0Real estate, net of accumulated depreciation 0 0 24 0 24 0.0Financial services assets:
Flight equipment primarily under operating leases, net of accumulated depreciation 41,345 0 0 0 41,345 22.3Securities available for sale, at fair value 0 47,643 0 0 47,643 25.6Trading securities, at fair value 0 5,369 0 0 5,369 2.9Spot commodities 0 73 0 0 73 0.0Unrealized gain on swaps, options and
forward transactions 0 17,198 0 0 17,198 9.2Trade receivables 0 3,883 0 0 3,883 2.1Securities purchased under agreements to resell, at contract value 0 31,775 0 0 31,775 17.1Finance receivables, net of allowance 273 0 28,597 633 29,503 15.8
Securities lending collateral, at fair value 0 0 80 0 80 0.0Other invested assets 11 1,942 728 246 2,927 1.6Short-term investments, at cost 104 365 894 4 1,367 0.7Cash 4 63 221 53 341 0.2
Total cash and invested assets $ 41,881 $ 111,361 $ 32,043 $ 944 $ 186,229 100.0 %
Percent of total company 5.1% 13.7% 3.9% 0.1% 22.8%
51
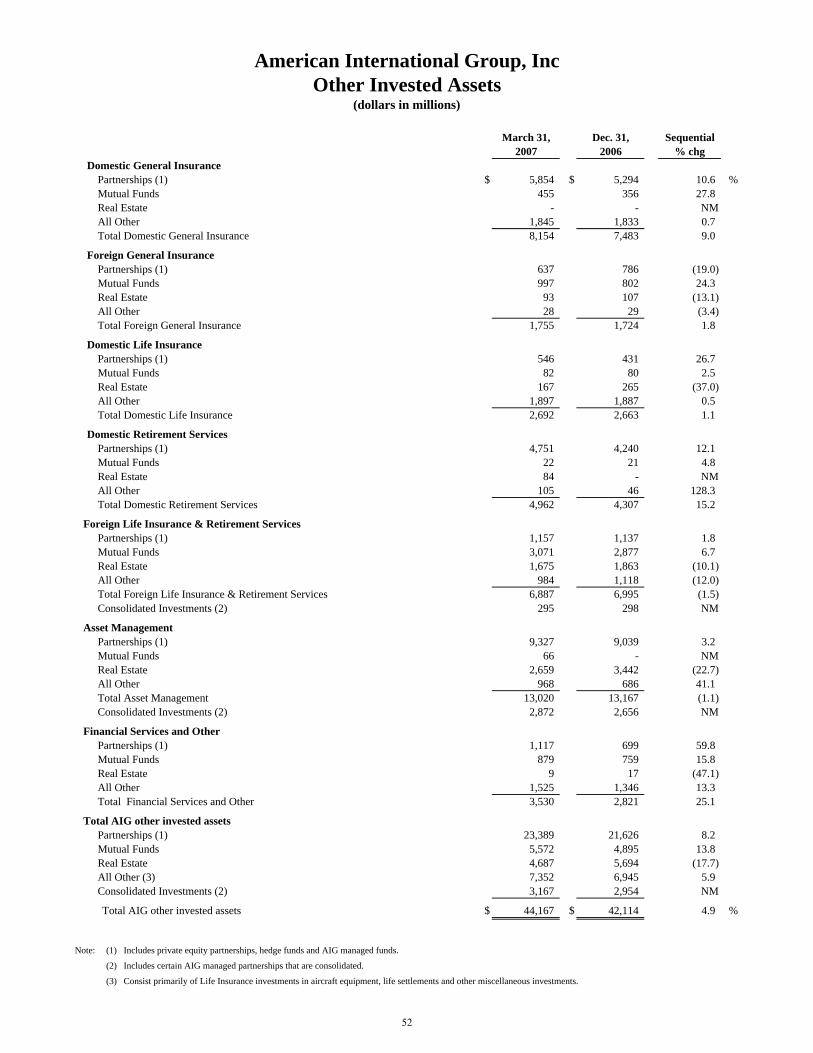
March 31, Dec. 31, Sequential2007 2006 % chg
Domestic General InsurancePartnerships (1) $ 5,854 $ 5,294 10.6 %Mutual Funds 455 356 27.8Real Estate - - NMAll Other 1,845 1,833 0.7Total Domestic General Insurance 8,154 7,483 9.0
Foreign General InsurancePartnerships (1) 637 786 (19.0)Mutual Funds 997 802 24.3Real Estate 93 107 (13.1)All Other 28 29 (3.4)Total Foreign General Insurance 1,755 1,724 1.8
Domestic Life InsurancePartnerships (1) 546 431 26.7Mutual Funds 82 80 2.5Real Estate 167 265 (37.0)All Other 1,897 1,887 0.5Total Domestic Life Insurance 2,692 2,663 1.1
Domestic Retirement ServicesPartnerships (1) 4,751 4,240 12.1Mutual Funds 22 21 4.8Real Estate 84 - NMAll Other 105 46 128.3Total Domestic Retirement Services 4,962 4,307 15.2
Foreign Life Insurance & Retirement ServicesPartnerships (1) 1,157 1,137 1.8Mutual Funds 3,071 2,877 6.7Real Estate 1,675 1,863 (10.1)All Other 984 1,118 (12.0)Total Foreign Life Insurance & Retirement Services 6,887 6,995 (1.5)Consolidated Investments (2) 295 298 NM
Asset ManagementPartnerships (1) 9,327 9,039 3.2Mutual Funds 66 - NMReal Estate 2,659 3,442 (22.7)All Other 968 686 41.1Total Asset Management 13,020 13,167 (1.1)Consolidated Investments (2) 2,872 2,656 NM
Financial Services and OtherPartnerships (1) 1,117 699 59.8Mutual Funds 879 759 15.8Real Estate 9 17 (47.1)All Other 1,525 1,346 13.3Total Financial Services and Other 3,530 2,821 25.1
Total AIG other invested assetsPartnerships (1) 23,389 21,626 8.2Mutual Funds 5,572 4,895 13.8Real Estate 4,687 5,694 (17.7)All Other (3) 7,352 6,945 5.9Consolidated Investments (2) 3,167 2,954 NM
Total AIG other invested assets $ 44,167 $ 42,114 4.9 %
Note: (1) Includes private equity partnerships, hedge funds and AIG managed funds.
(2) Includes certain AIG managed partnerships that are consolidated.
(3) Consist primarily of Life Insurance investments in aircraft equipment, life settlements and other miscellaneous investments.
American International Group, IncOther Invested Assets
(dollars in millions)
52
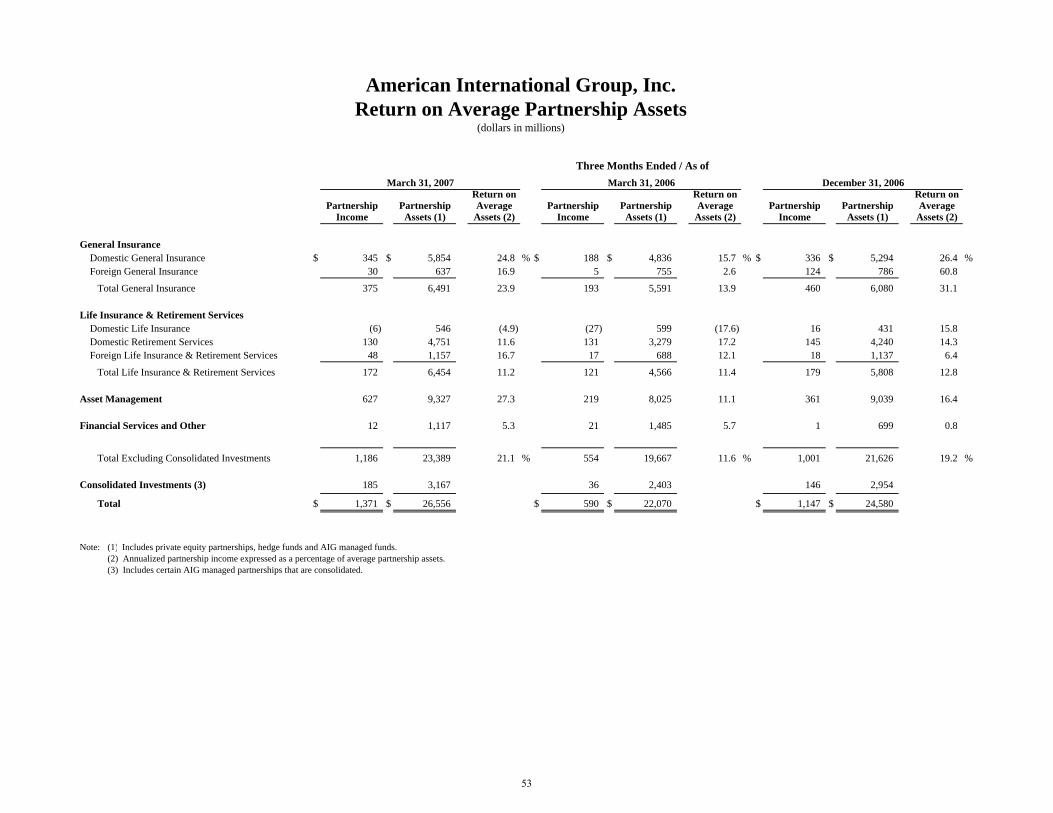
Return on Return on Return onPartnership Partnership Average Partnership Partnership Average Partnership Partnership Average
Income Assets (1) Assets (2) Income Assets (1) Assets (2) Income Assets (1) Assets (2)
General Insurance Domestic General Insurance $ 345 $ 5,854 24.8 % $ 188 $ 4,836 15.7 % $ 336 $ 5,294 26.4 % Foreign General Insurance 30 637 16.9 5 755 2.6 124 786 60.8
Total General Insurance 375 6,491 23.9 193 5,591 13.9 460 6,080 31.1
Life Insurance & Retirement Services Domestic Life Insurance (6) 546 (4.9) (27) 599 (17.6) 16 431 15.8 Domestic Retirement Services 130 4,751 11.6 131 3,279 17.2 145 4,240 14.3 Foreign Life Insurance & Retirement Services 48 1,157 16.7 17 688 12.1 18 1,137 6.4
Total Life Insurance & Retirement Services 172 6,454 11.2 121 4,566 11.4 179 5,808 12.8
Asset Management 627 9,327 27.3 219 8,025 11.1 361 9,039 16.4
Financial Services and Other 12 1,117 5.3 21 1,485 5.7 1 699 0.8
Total Excluding Consolidated Investments 1,186 23,389 21.1 % 554 19,667 11.6 % 1,001 21,626 19.2 %
Consolidated Investments (3) 185 3,167 36 2,403 146 2,954
Total $ 1,371 $ 26,556 $ 590 $ 22,070 $ 1,147 $ 24,580
Note: (1) Includes private equity partnerships, hedge funds and AIG managed funds. (2) Annualized partnership income expressed as a percentage of average partnership assets. (3) Includes certain AIG managed partnerships that are consolidated.
American International Group, Inc.Return on Average Partnership Assets
(dollars in millions)
March 31, 2007 March 31, 2006 December 31, 2006
Three Months Ended / As of
53
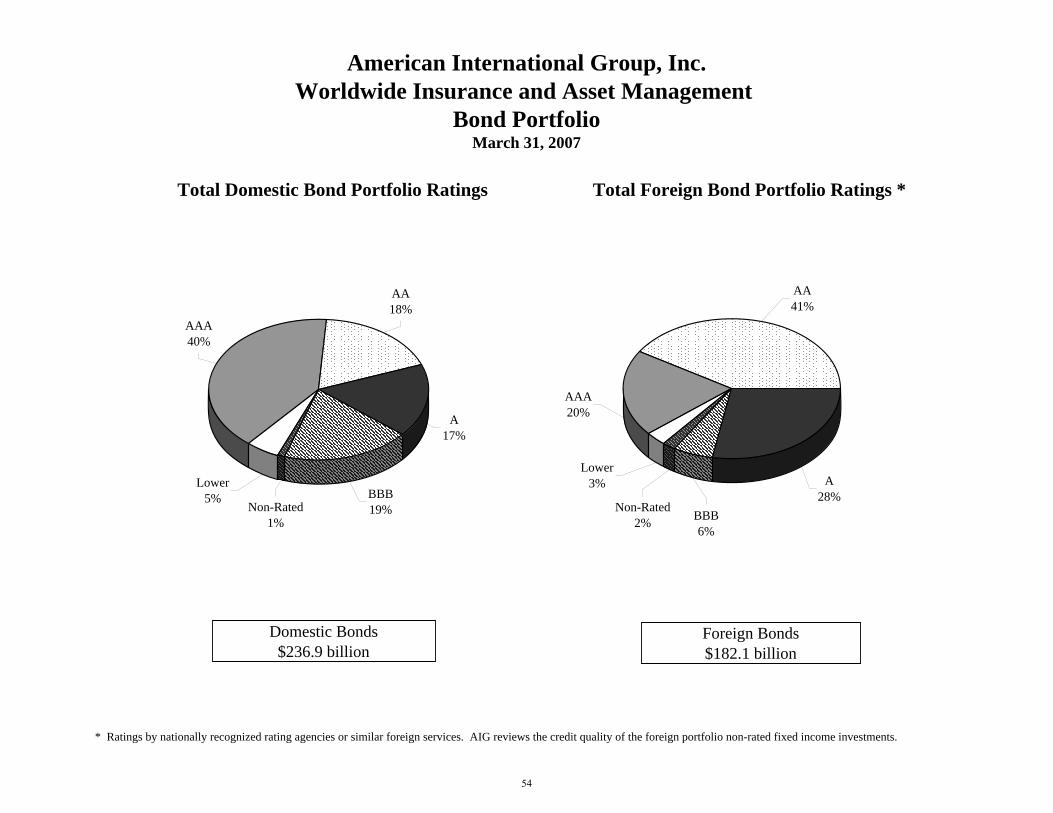
* Ratings by nationally recognized rating agencies or similar foreign services. AIG reviews the credit quality of the foreign portfolio non-rated fixed income investments.
American International Group, Inc.Worldwide Insurance and Asset Management
Bond PortfolioMarch 31, 2007
Total Domestic Bond Portfolio Ratings Total Foreign Bond Portfolio Ratings *
Non-Rated2% BBB
6%
Lower3%
AAA20%
AA41%
A28%BBB
19%
A17%
AA18%
AAA40%
Lower5%
Non-Rated1%
Foreign Bonds$182.1 billion
Domestic Bonds$236.9 billion
54
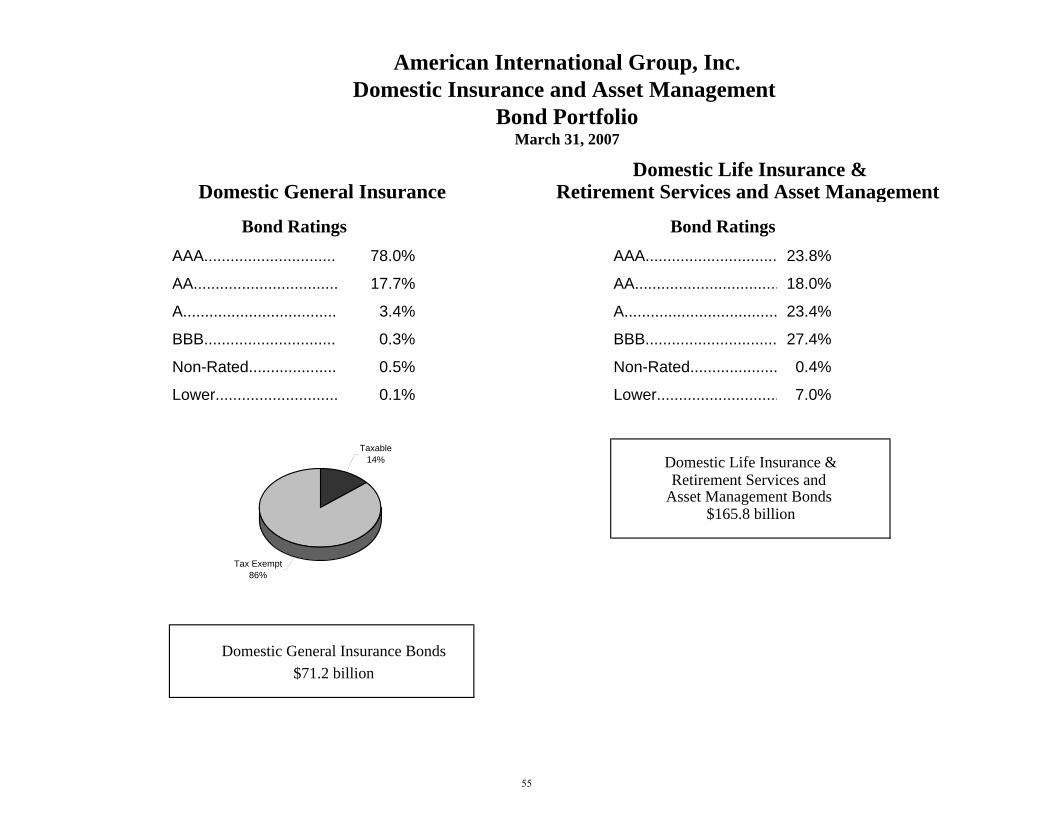
Retirement Services and Asset Management
Bond Ratings Bond RatingsAAA............................... 78.0% AAA.............................. 23.8%
AA................................. 17.7% AA................................. 18.0%
A................................... 3.4% A................................... 23.4%
BBB............................... 0.3% BBB.............................. 27.4%
Non-Rated.................... 0.5% Non-Rated.................... 0.4%
Lower............................ 0.1% Lower............................ 7.0%
Domestic General Insurance Bonds$71.2 billion
Domestic Life Insurance &
American International Group, Inc.Domestic Insurance and Asset Management
Bond PortfolioMarch 31, 2007
Asset Management Bonds $165.8 billion
Domestic General Insurance
Domestic Life Insurance &Retirement Services and
Tax Exempt86%
Taxable14%
55
Comment on Regulation G
This financial supplement includes certain non-GAAP financial measures. The reconciliations of such measures to the most comparable GAAP figures in accordance with Regulation G are included within the relevant tables.
Throughout this financial supplement, AIG presents its operations in the way it believes will be most meaningful and useful, as well as most transparent, to the investing public and others who use AIG’s financial information in evaluating the performance of AIG. That presentation includes the use of certain non-GAAP measures. In addition to the GAAP presentations, in some cases, revenues, net income, operating income and related rates of performance, and out of period adjustments are shown exclusive of realized capital gains (losses), cumulative effect of an accounting change in 2006, the effect of FIN46(R), the effect of EITF 04-5 and the effect of FAS 133.
AIG excludes the effects of the 2006 accounting change, FIN46(R) and EITF 04-5, and the effect of hedging activities that did not qualify for hedge accounting treatment under FAS 133, or to which hedge accounting is not applied, although they are economically effective hedges, because AIG believes that excluding these items permits investors to better assess the performance of the underlying businesses. AIG believes that providing information in a non-GAAP manner is more useful to investors and analysts. Likewise, AIG excludes certain entities consolidated pursuant to FIN46(R) or EITF 04-5, including certain AIG managed partnerships, private equity and real estate funds, where AIG does not in fact have the economic interest that is presumed to be held by consolidation, because AIG believes this presentation is more meaningful than the GAAP presentation.
Although the investment of premiums to generate investment income (or loss) and realized capital gains or losses is an integral part of both life and
general insurance operations, the determination to realize capital gains or losses is independent of the insurance underwriting process. Moreover, under applicable GAAP accounting requirements, losses can be recorded as the result of other than temporary declines in value without actual realization. In sum, investment income and realized capital gains or losses for any particular period are not indicative of underlying business performance for such period.
AIG believes that underwriting profit (loss) provides investors with financial information that is not only meaningful but critically important to understanding the results of property and casualty insurance operations. Operating income of a property and casualty insurance company includes three components: underwriting profit (loss), net investment income and realized capital gains (losses). Without disclosure of underwriting profit (loss), it is impossible to determine how successful an insurance company is in its core business activity of assessing and underwriting risk. Including investment income and realized capital gains (losses) in operating income without disclosing underwriting profit (loss) can mask underwriting losses. The amount of net investment income may be driven by changes in interest rates and other factors that are totally unrelated to underwriting performance.
Underwriting profit (loss) is an important measurement used by AIG senior management to evaluate the performance of its property and casualty
insurance operations. AIG includes the measurement required in statutory financial statements filed with state insurance departments and adjusts for changes in deferred acquisition costs in order to make the measure more consistent with the information provided in AIG’s consolidated financial statements. Further, the equity analysts who follow AIG exclude the realized capital transactions in their analyses for the same reason and consistently request that AIG provide the non-GAAP information.
Life and retirement services production (premiums, deposits and other considerations), gross premiums written, net premiums written and loss, expense and combined ratios are presented in accordance with accounting principles prescribed or permitted by insurance regulatory authorities because these are standard measures of performance used in the insurance industry and thus allow for more meaningful comparisons with AIG’s insurance competitors.
56