Embed Size (px)
Citation preview
American International Group, Inc.
Quarterly Financial Supplement
Fourth Quarter 2011
This report should be read in conjunction with AIG’s Annual Report on Form 10-K for the year ended
December 31, 2011 filed with the Securities and Exchange Commission. All financial information in this
document is unaudited.
American International Group, Inc.Quarterly Financial Supplement
Contact: Liz Werner Investor Relations(212) 770-7074
Table of Contents . Page(s) Cautionary Statement Regarding Forward-Looking Information ........................................... 1
Non-GAAP Financial Measures .................................................................................................. 2 Consolidated Results Consolidated Statement of Operations……. ................................................................................ 3 Consolidated Statement of Segment Operations .................................................................... 4 – 5 After-tax Operating Income (loss) Attributable to AIG ............................................................... 6 Summary of Non-Qualifying Derivative Hedging Activities ...................................................... 7 Condensed Consolidating Balance Sheet ............................................................................... 8 - 9 STAT to GAAP reconciliation .................................................................................................. 10 Debt and Capital ........................................................................................................................ 11 Understanding AIG’s Relationship with the U.S. Government ................................................. 12 Book Value per Common Share ................................................................................................ 13 Chartis Chartis Operating Statistics ........................................................................................................ 14 Chartis - Operating Statistics by Business ...........................................................................15 - 17 Chartis - Operating Statistics (U.S. & International) .......................................................... 18 – 21 Revised Historical Chartis - Operating Statistics ................................................................ 22 – 26 Worldwide Net Premiums Written by Line of Business & Region ............................................ 27
SunAmerica Financial Group SunAmerica Financial Group Operating Statistics .................................................................... 30 Domestic Life Insurance (American General) Operating Statistics .......................................... 31 Domestic Life Insurance (American General) Sales, Deposits and In Force ............................ 32 Domestic Life Insurance (American General) Other Data ....................................................... 33 Domestic Retirement Services Operating Statistics .................................................................. 34 Domestic Retirement Services Product Statistics ..................................................................... 35 Domestic Retirement Services Account Value Rollforward ..................................................... 36 Domestic Retirement Services Spread Information ........................................................... 37 - 38 Domestic Retirement Services – Group Retirement Products (VALIC) ................................... 39 Domestic Retirement Services – Individual Variable Annuities (SunAmerica Retirement markets) Guaranteed Benefits .................................................. 40 - 42 SunAmerica Financial Group Notes .................................................................................. 43 - 44 Aircraft Leasing Aircraft Leasing Operating Statistics ........................................................................................ 45 Other Other Operations ........................................................................................................................ 46 Mortgage Guaranty Operating Statistics .................................................................................... 47
A G d i i 48
Table of Contents . Page(s) Cautionary Statement Regarding Forward-Looking Information ........................................... 1
Non-GAAP Financial Measures .................................................................................................. 2 Consolidated Results Consolidated Statement of Operations……. ................................................................................ 3 Consolidated Statement of Segment Operations .................................................................... 4 – 5 After-tax Operating Income (loss) Attributable to AIG ............................................................... 6 Summary of Non-Qualifying Derivative Hedging Activities ...................................................... 7 Condensed Consolidating Balance Sheet ............................................................................... 8 - 9 STAT to GAAP reconciliation .................................................................................................. 10 Debt and Capital ........................................................................................................................ 11 Understanding AIG’s Relationship with the U.S. Government ................................................. 12 Book Value per Common Share ................................................................................................ 13 Chartis Chartis Operating Statistics ........................................................................................................ 14 Chartis - Operating Statistics by Business ...........................................................................15 - 17 Chartis - Operating Statistics (U.S. & International) .......................................................... 18 – 21 Revised Historical Chartis - Operating Statistics ................................................................ 22 – 26 Worldwide Net Premiums Written by Line of Business & Region ............................................ 27 Net Premiums Written by Line of Business ................................................................................ 28 Chartis Notes .............................................................................................................................. 29
SunAmerica Financial Group SunAmerica Financial Group Operating Statistics .................................................................... 30 Domestic Life Insurance (American General) Operating Statistics .......................................... 31 Domestic Life Insurance (American General) Sales, Deposits and In Force ............................ 32 Domestic Life Insurance (American General) Other Data ....................................................... 33 Domestic Retirement Services Operating Statistics .................................................................. 34 Domestic Retirement Services Product Statistics ..................................................................... 35 Domestic Retirement Services Account Value Rollforward ..................................................... 36 Domestic Retirement Services Spread Information ........................................................... 37 - 38 Domestic Retirement Services – Group Retirement Products (VALIC) ................................... 39 Domestic Retirement Services – Individual Variable Annuities (SunAmerica Retirement markets) Guaranteed Benefits .................................................. 40 - 42 SunAmerica Financial Group Notes .................................................................................. 43 - 44 Aircraft Leasing Aircraft Leasing Operating Statistics ........................................................................................ 45 Other Other Operations ........................................................................................................................ 46 Mortgage Guaranty Operating Statistics .................................................................................... 47 AIGFP derivatives ..................................................................................................................... 48 Parent Company Financial Statements ............................................................................... 49 - 51 Investment Information Other Invested Assets by Segment ............................................................................................ 52 Realized Capital Gains (Losses) ............................................................................................... 53 Return on Average Partnership and Mutual Funds Assets by Segment .................................... 54
Cautionary Statement Regarding Forward-Looking Information
This Financial Supplement includes, and officers and representatives of American International Group, Inc. (AIG) may from time to time make, projections, goals, assumptions and statements that may constitute “forward-looking statements” within the meaning of the Private Securities Litigation Reform Act of 1995. These projections, goals, assumptions and statements are not historical facts but instead represent only AIG’s belief regarding future events, many of which, by their nature, are inherently uncertain and outside AIG’s control. These projections, goals, assumptions and statements include statements preceded by, followed by or including words such as “believe”, “anticipate”, “expect”, “intend”, “plan”, “view”, “target” or “estimate”. These projections, goals, assumptions and statements may address, among other things: the timing of the disposition of the ownership position of the United States Department of the Treasury (the Department of the Treasury) in AIG; the timing and method of repayment of the preferred interests in AIA Aurora LLC held by the Department of the Treasury; the monetization of AIG’s interests in International Lease Finance Corporation (ILFC); AIG’s exposures to subprime mortgages, monoline insurers and the residential and commercial real estate markets, state and municipal bond issuers and sovereign bond issuers; AIG’s exposure to European governments and European financial institutions; AIG’s strategy for risk management; AIG’s ability to retain and motivate its employees; AIG’s generation of deployable capital; AIG’s return on equity and earnings per share long-term aspirational goals; AIG’s strategy to grow net investment income, efficiently manage capital and reduce expenses; AIG’s strategy for customer retention, growth, product development, market position, financial results and reserves; and the revenues and combined ratios of AIG’s subsidiaries.
It is possible that AIG’s actual results and financial condition will differ, possibly materially, from the results and financial condition indicated in these projections, goals, assumptions and
statements. Factors that could cause AIG’s actual results to differ, possibly materially, from those in the specific projections, goals, assumptions and statements include:
actions by credit rating agencies;
changes in market conditions;
the occurrence of catastrophic events;
significant legal proceedings;
concentrations in AIG’s investment portfolios, including its municipal bond portfolio;
judgments concerning casualty insurance underwriting and reserves;
judgments concerning the recognition of deferred tax assets;
judgments concerning deferred policy acquisition costs (DAC) recoverability;
judgments concerning the recoverability of aircraft values in ILFC’s fleet; and
such other factors as discussed in Part I, Item 1A. Risk Factors and throughout Part II, Item 7. Management’s Discussion and Analysis of Financial Condition and Results of Operations in AIG’s Annual Report on Form 10-K for the year ended December 31, 2011. AIG is not under any obligation (and expressly disclaims any obligation) to update or alter any projections, goals, assumptions or other statements, whether written or oral, that may be made from time to time, whether as a result of new information, future events or otherwise.
1
Non-GAAP Financial Measures
Throughout this financial supplement, AIG presents its operations in the way it believes will be most meaningful and useful, as well as most transparent, to the investing public and others who use AIG’s financial information in evaluating the performance of AIG. That presentation includes the use of certain non-GAAP financial measures. The reconciliations of such measures to the most comparable GAAP measures in accordance with Regulation G are included within the relevant tables.
AIG believes that After-tax operating income (loss) permits a better assessment and enhanced understanding of the operating performance of its businesses by highlighting the results from
ongoing operations and the underlying profitability of its businesses. After-tax operating income (loss) excludes net income (loss) from discontinued operations, net income (loss) from divested businesses that did not qualify for discontinued operations accounting treatment, deferred income tax valuation allowance charges and releases, amortization of the Federal Reserve Bank of New York prepaid commitment fee asset, goodwill impairment charges arising from divestiture-related activities, net realized capital gains (losses), including the DAC offset for SunAmerica, non-qualifying derivative hedging activities and the bargain purchase gain on the Fuji acquisition. See page 6 for the reconciliation of Net income (loss) attributable to AIG to After-tax operating income (loss).
Additionally, in some cases, revenues, net income, operating income and related rates of performance are shown exclusive of the effect of tax benefits not obtained for losses incurred, the recognition of other-than-temporary impairments, restructuring-related activities, exchange of the Series C, E and F Preferred Stock, partnership income, other enhancements to income, credit valuation adjustments, unrealized market valuation gains (losses), the effect of catastrophe-related losses and prior year loss development, asbestos losses, returned or additional premiums related to prior year development, foreign exchange rates and aircraft impairments.
In all such instances, AIG believes that excluding these items permits investors to better assess the performance of AIG’s underlying businesses. AIG believes that providing information in a non-GAAP manner is more useful to investors and analysts and more meaningful than the GAAP presentation.
Although the investment of premiums to generate investment income (or loss) and realized capital gains or losses is an integral part of both life and general insurance operations, the
determination to realize capital gains or losses is independent of the insurance underwriting process. Moreover, under applicable GAAP accounting requirements, losses can be recorded as the result of other than temporary declines in value without actual realization. In sum, investment income and realized capital gains or losses for any particular period are not indicative of underlying business performance for such period.
Underwriting profit (loss) is utilized to report results for Chartis operations. Operating income (loss), which is before net realized capital gains (losses) and related DAC and sales
inducement asset amortization and goodwill impairment charges, is utilized to report results for SunAmerica operations. Results from discontinued operations and net gains (losses) on sales of divested businesses are excluded from these measures. AIG believes that these measures allow for a better assessment and enhanced understanding of the operating performance of each business by highlighting the results from ongoing operations and the underlying profitability of its businesses. When such measures are disclosed, reconciliations to GAAP pre-tax income are provided.
Life and retirement services production (premiums, deposits and other considerations and life insurance CPPE sales) is a non-GAAP measure which includes life insurance premiums,
deposits on annuity contracts and mutual funds. AIG uses this measure because it is a standard measure of performance used in the insurance industry and thus allows for more meaningful comparisons with AIG’s insurance competitors. Additionally, the DAC offset adjustment is a common adjustment for non-GAAP operating financial measures in the life insurance industry, and is a better measure of how AIG assesses the operating performance of SunAmerica’s operations.
2
American International Group, Inc.
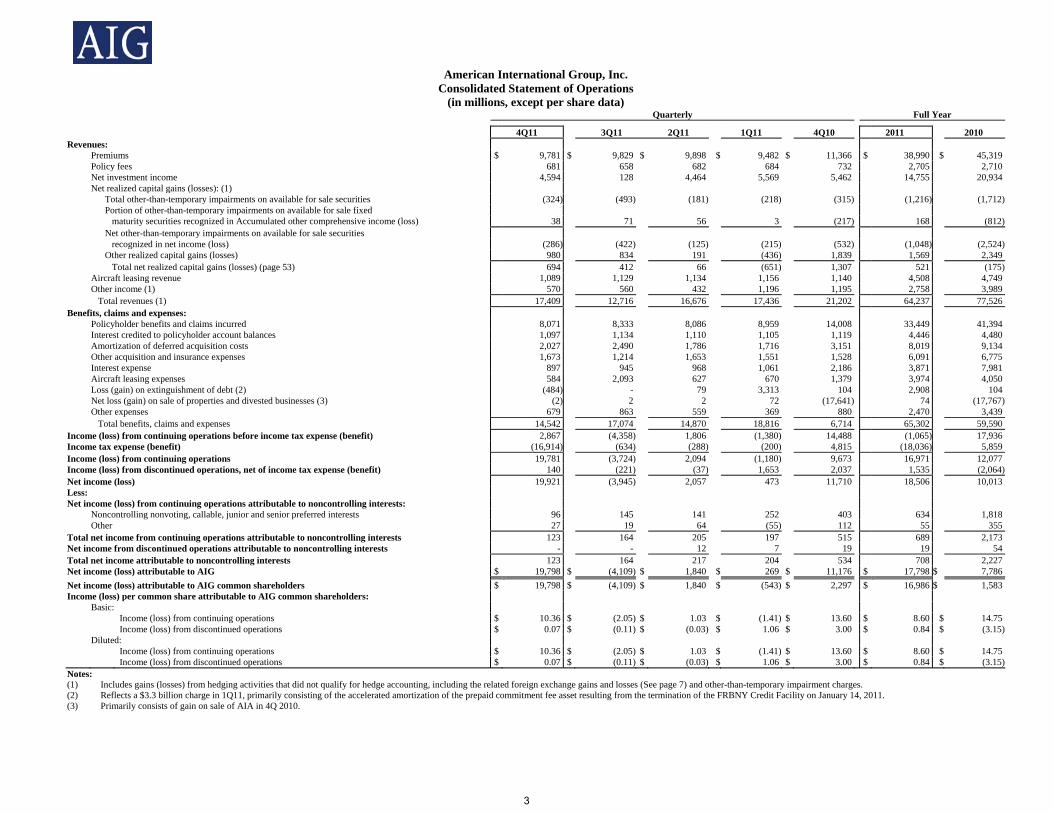
Consolidated Statement of Operations (in millions, except per share data)
Quarterly Full Year
4Q11 3Q11 2Q11 1Q11 4Q10 2011 2010 Revenues: Premiums $ 9,781 $ 9,829 $ 9,898 $ 9,482 $ 11,366 $ 38,990 $ 45,319 Policy fees 681 658 682 684 732 2,705 2,710 Net investment income 4,594 128 4,464 5,569 5,462 14,755 20,934 Net realized capital gains (losses): (1) Total other-than-temporary impairments on available for sale securities (324) (493) (181) (218) (315) (1,216) (1,712) Portion of other-than-temporary impairments on available for sale fixed maturity securities recognized in Accumulated other comprehensive income (loss) 38 71 56 3 (217) 168 (812) Net other-than-temporary impairments on available for sale securities recognized in net income (loss) (286) (422) (125) (215) (532) (1,048) (2,524) Other realized capital gains (losses) 980 834 191 (436) 1,839 1,569 2,349 Total net realized capital gains (losses) (page 53) 694 412 66 (651) 1,307 521 (175) Aircraft leasing revenue 1,089 1,129 1,134 1,156 1,140 4,508 4,749 Other income (1) 570 560 432 1,196 1,195 2,758 3,989 Total revenues (1) 17,409 12,716 16,676 17,436 21,202 64,237 77,526 Benefits, claims and expenses: Policyholder benefits and claims incurred 8,071 8,333 8,086 8,959 14,008 33,449 41,394 Interest credited to policyholder account balances 1,097 1,134 1,110 1,105 1,119 4,446 4,480 Amortization of deferred acquisition costs 2,027 2,490 1,786 1,716 3,151 8,019 9,134 Other acquisition and insurance expenses 1,673 1,214 1,653 1,551 1,528 6,091 6,775 Interest expense 897 945 968 1,061 2,186 3,871 7,981 Aircraft leasing expenses 584 2,093 627 670 1,379 3,974 4,050 Loss (gain) on extinguishment of debt (2) (484) - 79 3,313 104 2,908 104 Net loss (gain) on sale of properties and divested businesses (3) (2) 2 2 72 (17,641) 74 (17,767) Other expenses 679 863 559 369 880 2,470 3,439 Total benefits, claims and expenses 14,542 17,074 14,870 18,816 6,714 65,302 59,590 Income (loss) from continuing operations before income tax expense (benefit) 2,867 (4,358) 1,806 (1,380) 14,488 (1,065) 17,936 Income tax expense (benefit) (16,914) (634) (288) (200) 4,815 (18,036) 5,859 Income (loss) from continuing operations 19,781 (3,724) 2,094 (1,180) 9,673 16,971 12,077 Income (loss) from discontinued operations, net of income tax expense (benefit) 140 (221) (37) 1,653 2,037 1,535 (2,064) Net income (loss) 19,921 (3,945) 2,057 473 11,710 18,506 10,013 Less: Net income (loss) from continuing operations attributable to noncontrolling interests: Noncontrolling nonvoting, callable, junior and senior preferred interests 96 145 141 252 403 634 1,818 Other 27 19 64 (55) 112 55 355 Total net income from continuing operations attributable to noncontrolling interests 123 164 205 197 515 689 2,173 Net income from discontinued operations attributable to noncontrolling interests - - 12 7 19 19 54 Total net income attributable to noncontrolling interests 123 164 217 204 534 708 2,227 Net income (loss) attributable to AIG $ 19,798 $ (4,109) $ 1,840 $ 269 $ 11,176 $ 17,798 $ 7,786 Net income (loss) attributable to AIG common shareholders $ 19,798 $ (4,109) $ 1,840 $ (543) $ 2,297 $ 16,986 $ 1,583 Income (loss) per common share attributable to AIG common shareholders: Basic: Income (loss) from continuing operations $ 10.36 $ (2.05) $ 1.03 $ (1.41) $ 13.60 $ 8.60 $ 14.75 Income (loss) from discontinued operations $ 0.07 $ (0.11) $ (0.03) $ 1.06 $ 3.00 $ 0.84 $ (3.15) Diluted: Income (loss) from continuing operations $ 10.36 $ (2.05) $ 1.03 $ (1.41) $ 13.60 $ 8.60 $ 14.75 Income (loss) from discontinued operations $ 0.07 $ (0.11) $ (0.03) $ 1.06 $ 3.00 $ 0.84 $ (3.15) Notes: (1) Includes gains (losses) from hedging activities that did not qualify for hedge accounting, including the related foreign exchange gains and losses (See page 7) and other-than-temporary impairment charges. (2) Reflects a $3.3 billion charge in 1Q11, primarily consisting of the accelerated amortization of the prepaid commitment fee asset resulting from the termination of the FRBNY Credit Facility on January 14, 2011. (3) Primarily consists of gain on sale of AIA in 4Q 2010.
3
American International Group, Inc.
Consolidated Statement of Segment Operations (in millions, except per share data)
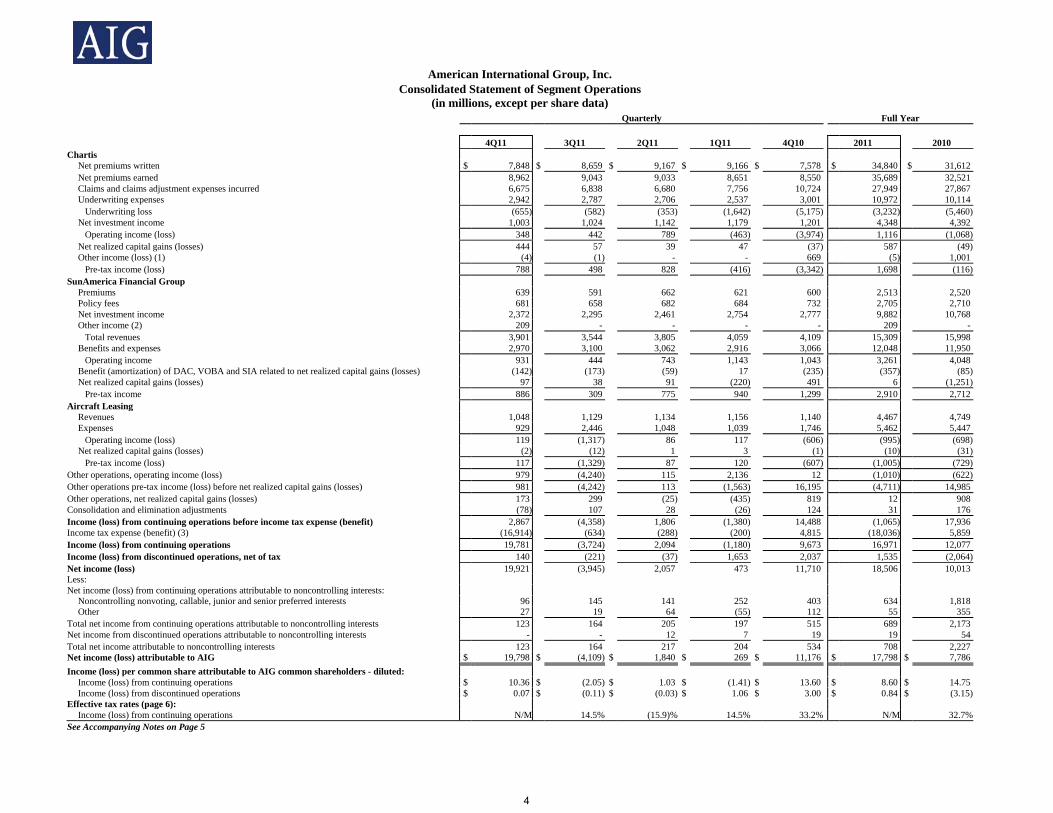
Quarterly Full Year 4Q11 3Q11 2Q11 1Q11 4Q10 2011 2010 Chartis Net premiums written $ 7,848 $ 8,659 $ 9,167 $ 9,166 $ 7,578 $ 34,840 $ 31,612 Net premiums earned 8,962 9,043 9,033 8,651 8,550 35,689 32,521 Claims and claims adjustment expenses incurred 6,675 6,838 6,680 7,756 10,724 27,949 27,867 Underwriting expenses 2,942 2,787 2,706 2,537 3,001 10,972 10,114 Underwriting loss (655) (582) (353) (1,642) (5,175) (3,232) (5,460) Net investment income 1,003 1,024 1,142 1,179 1,201 4,348 4,392 Operating income (loss) 348 442 789 (463) (3,974) 1,116 (1,068) Net realized capital gains (losses) 444 57 39 47 (37) 587 (49) Other income (loss) (1) (4) (1) - - 669 (5) 1,001 Pre-tax income (loss) 788 498 828 (416) (3,342) 1,698 (116)SunAmerica Financial Group Premiums 639 591 662 621 600 2,513 2,520 Policy fees 681 658 682 684 732 2,705 2,710 Net investment income 2,372 2,295 2,461 2,754 2,777 9,882 10,768 Other income (2) 209 - - - - 209 - Total revenues 3,901 3,544 3,805 4,059 4,109 15,309 15,998 Benefits and expenses 2,970 3,100 3,062 2,916 3,066 12,048 11,950 Operating income 931 444 743 1,143 1,043 3,261 4,048 Benefit (amortization) of DAC, VOBA and SIA related to net realized capital gains (losses) (142) (173) (59) 17 (235) (357) (85) Net realized capital gains (losses) 97 38 91 (220) 491 6 (1,251) Pre-tax income 886 309 775 940 1,299 2,910 2,712 Aircraft Leasing Revenues 1,048 1,129 1,134 1,156 1,140 4,467 4,749 Expenses 929 2,446 1,048 1,039 1,746 5,462 5,447 Operating income (loss) 119 (1,317) 86 117 (606) (995) (698) Net realized capital gains (losses) (2) (12) 1 3 (1) (10) (31) Pre-tax income (loss) 117 (1,329) 87 120 (607) (1,005) (729)Other operations, operating income (loss) 979 (4,240) 115 2,136 12 (1,010) (622)Other operations pre-tax income (loss) before net realized capital gains (losses) 981 (4,242) 113 (1,563) 16,195 (4,711) 14,985 Other operations, net realized capital gains (losses) 173 299 (25) (435) 819 12 908 Consolidation and elimination adjustments (78) 107 28 (26) 124 31 176 Income (loss) from continuing operations before income tax expense (benefit) 2,867 (4,358) 1,806 (1,380) 14,488 (1,065) 17,936 Income tax expense (benefit) (3) (16,914) (634) (288) (200) 4,815 (18,036) 5,859 Income (loss) from continuing operations 19,781 (3,724) 2,094 (1,180) 9,673 16,971 12,077 Income (loss) from discontinued operations, net of tax 140 (221) (37) 1,653 2,037 1,535 (2,064)Net income (loss) 19,921 (3,945) 2,057 473 11,710 18,506 10,013 Less: Net income (loss) from continuing operations attributable to noncontrolling interests: Noncontrolling nonvoting, callable, junior and senior preferred interests 96 145 141 252 403 634 1,818 Other 27 19 64 (55) 112 55 355 Total net income from continuing operations attributable to noncontrolling interests 123 164 205 197 515 689 2,173 Net income from discontinued operations attributable to noncontrolling interests - - 12 7 19 19 54 Total net income attributable to noncontrolling interests 123 164 217 204 534 708 2,227 Net income (loss) attributable to AIG $ 19,798 $ (4,109) $ 1,840 $ 269 $ 11,176 $ 17,798 $ 7,786 Income (loss) per common share attributable to AIG common shareholders - diluted: Income (loss) from continuing operations $ 10.36 $ (2.05) $ 1.03 $ (1.41) $ 13.60 $ 8.60 $ 14.75 Income (loss) from discontinued operations $ 0.07 $ (0.11) $ (0.03) $ 1.06 $ 3.00 $ 0.84 $ (3.15)Effective tax rates (page 6): Income (loss) from continuing operations N/M 14.5% (15.9)% 14.5% 33.2% N/M 32.7%See Accompanying Notes on Page 5
4
American International Group, Inc.
Consolidated Statement of Segment Operations Notes
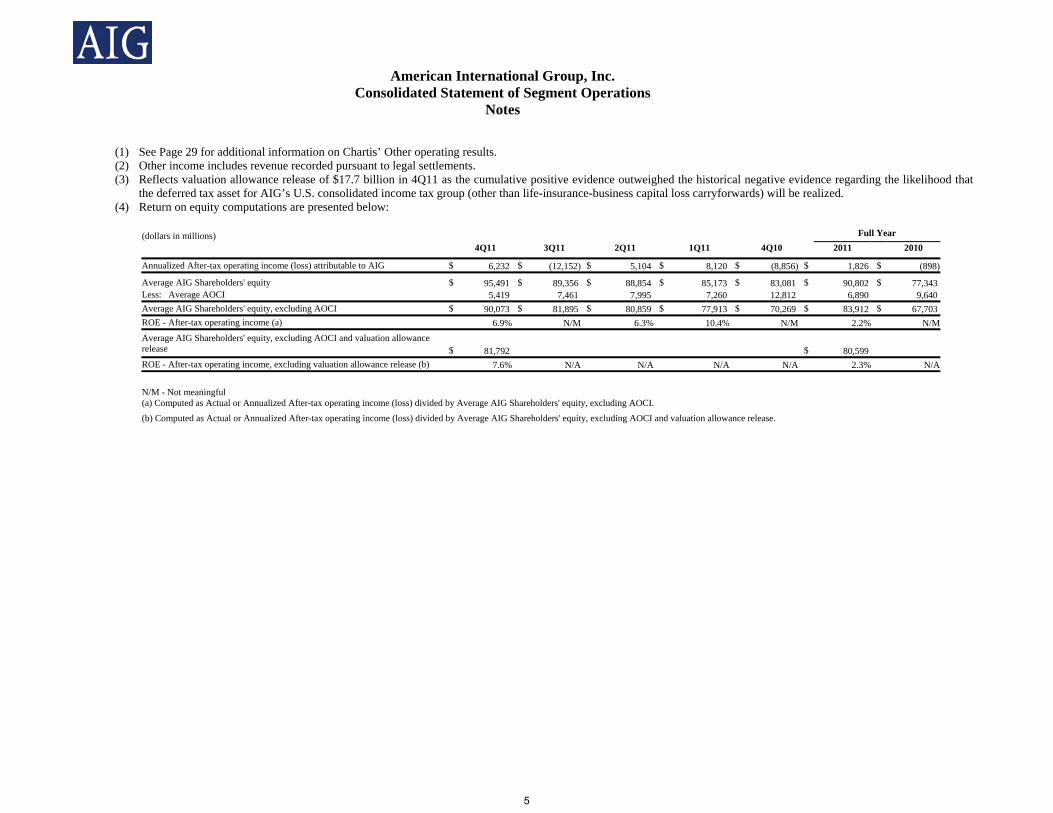
(1) See Page 29 for additional information on Chartis’ Other operating results. (2) Other income includes revenue recorded pursuant to legal settlements. (3) Reflects valuation allowance release of $17.7 billion in 4Q11 as the cumulative positive evidence outweighed the historical negative evidence regarding the likelihood that
the deferred tax asset for AIG’s U.S. consolidated income tax group (other than life-insurance-business capital loss carryforwards) will be realized. (4) Return on equity computations are presented below:
(dollars in millions) Full Year
4Q11 3Q11 2Q11 1Q11 4Q10 2011 2010
Annualized After-tax operating income (loss) attributable to AIG $ 6,232 $ (12,152) $ 5,104 $ 8,120 $ (8,856) $ 1,826 $ (898)
Average AIG Shareholders' equity $ 95,491 $ 89,356 $ 88,854 $ 85,173 $ 83,081 $ 90,802 $ 77,343 Less: Average AOCI 5,419 7,461 7,995 7,260 12,812 6,890 9,640 Average AIG Shareholders' equity, excluding AOCI $ 90,073 $ 81,895 $ 80,859 $ 77,913 $ 70,269 $ 83,912 $ 67,703 ROE - After-tax operating income (a) 6.9% N/M 6.3% 10.4% N/M 2.2% N/M Average AIG Shareholders' equity, excluding AOCI and valuation allowance
release
$ 81,792 $ 80,599 ROE - After-tax operating income, excluding valuation allowance release (b) 7.6% N/A N/A N/A N/A 2.3% N/A N/M - Not meaningful (a) Computed as Actual or Annualized After-tax operating income (loss) divided by Average AIG Shareholders' equity, excluding AOCI.
(b) Computed as Actual or Annualized After-tax operating income (loss) divided by Average AIG Shareholders' equity, excluding AOCI and valuation allowance release.
5
American International Group, Inc.
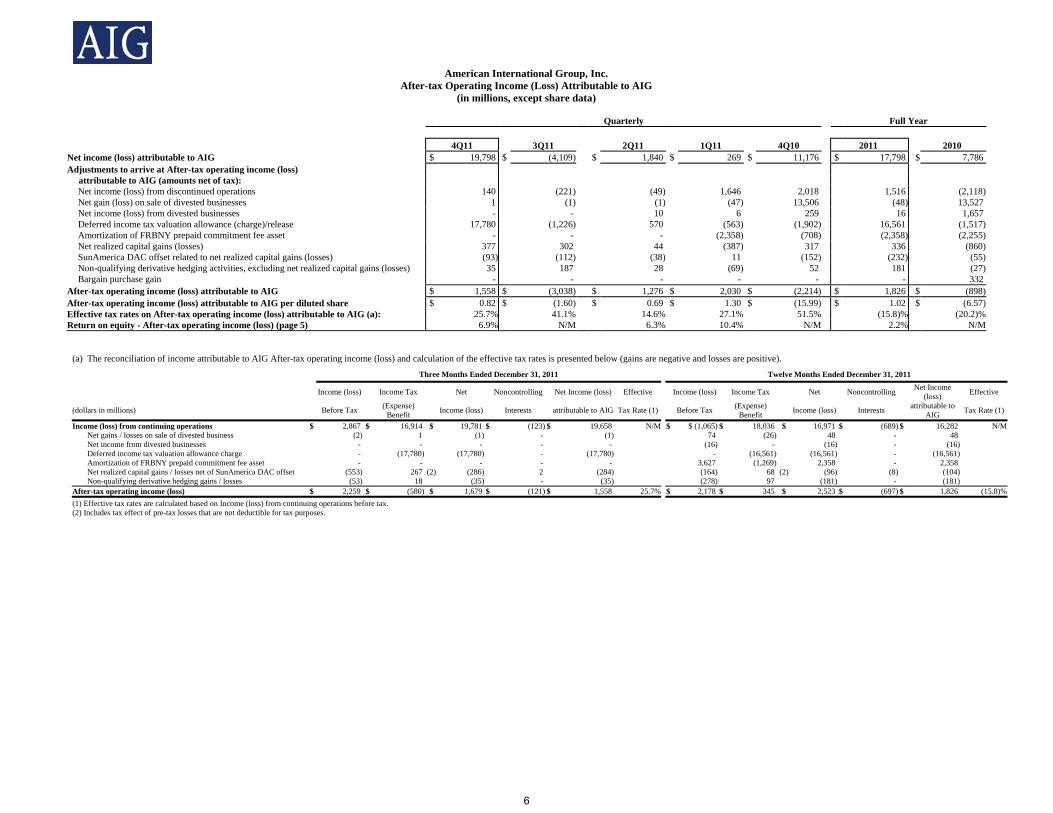
After-tax Operating Income (Loss) Attributable to AIG (in millions, except share data)
Quarterly Full Year 4Q11 3Q11 2Q11 1Q11 4Q10 2011 2010 Net income (loss) attributable to AIG $ 19,798 $ (4,109) $ 1,840 $ 269 $ 11,176 $ 17,798 $ 7,786 Adjustments to arrive at After-tax operating income (loss) attributable to AIG (amounts net of tax): Net income (loss) from discontinued operations 140 (221) (49) 1,646 2,018 1,516 (2,118) Net gain (loss) on sale of divested businesses 1 (1) (1) (47) 13,506 (48) 13,527 Net income (loss) from divested businesses - - 10 6 259 16 1,657 Deferred income tax valuation allowance (charge)/release 17,780 (1,226) 570 (563) (1,902) 16,561 (1,517) Amortization of FRBNY prepaid commitment fee asset - - - (2,358) (708) (2,358) (2,255) Net realized capital gains (losses) 377 302 44 (387) 317 336 (860) SunAmerica DAC offset related to net realized capital gains (losses) (93) (112) (38) 11 (152) (232) (55) Non-qualifying derivative hedging activities, excluding net realized capital gains (losses) 35 187 28 (69) 52 181 (27) Bargain purchase gain - - - - - - 332 After-tax operating income (loss) attributable to AIG $ 1,558 $ (3,038) $ 1,276 $ 2,030 $ (2,214) $ 1,826 $ (898) After-tax operating income (loss) attributable to AIG per diluted share $ 0.82 $ (1.60) $ 0.69 $ 1.30 $ (15.99) $ 1.02 $ (6.57) Effective tax rates on After-tax operating income (loss) attributable to AIG (a): 25.7% 41.1% 14.6% 27.1% 51.5% (15.8)% (20.2)% Return on equity - After-tax operating income (loss) (page 5) 6.9% N/M 6.3% 10.4% N/M 2.2% N/M
(a) The reconciliation of income attributable to AIG After-tax operating income (loss) and calculation of the effective tax rates is presented below (gains are negative and losses are positive).
Three Months Ended December 31, 2011 Twelve Months Ended December 31, 2011
Income (loss) Income Tax Net Noncontrolling Net Income (loss) Effective Income (loss) Income Tax Net Noncontrolling Net Income
(loss) Effective
(dollars in millions) Before Tax (Expense)
Benefit Income (loss) Interests attributable to AIG Tax Rate (1) Before Tax (Expense) Benefit Income (loss) Interests
attributable to AIG Tax Rate (1)
Income (loss) from continuing operations $ 2,867 $ 16,914 $ 19,781 $ (123) $ 19,658 N/M $ $ (1,065) $ 18,036 $ 16,971 $ (689) $ 16,282 N/M Net gains / losses on sale of divested business (2) 1 (1) - (1) 74 (26) 48 - 48 Net income from divested businesses - - - - - (16) - (16) - (16) Deferred income tax valuation allowance charge - (17,780) (17,780) - (17,780) - (16,561) (16,561) - (16,561) Amortization of FRBNY prepaid commitment fee asset - - - - - 3,627 (1,269) 2,358 - 2,358 Net realized capital gains / losses net of SunAmerica DAC offset (553) 267 (2) (286) 2 (284) (164) 68 (2) (96) (8) (104) Non-qualifying derivative hedging gains / losses (53) 18 (35) - (35) (278) 97 (181) - (181) After-tax operating income (loss) $ 2,259 $ (580) $ 1,679 $ (121) $ 1,558 25.7% $ 2,178 $ 345 $ 2,523 $ (697) $ 1,826 (15.8)% (1) Effective tax rates are calculated based on Income (loss) from continuing operations before tax. (2) Includes tax effect of pre-tax losses that are not deductible for tax purposes.
6
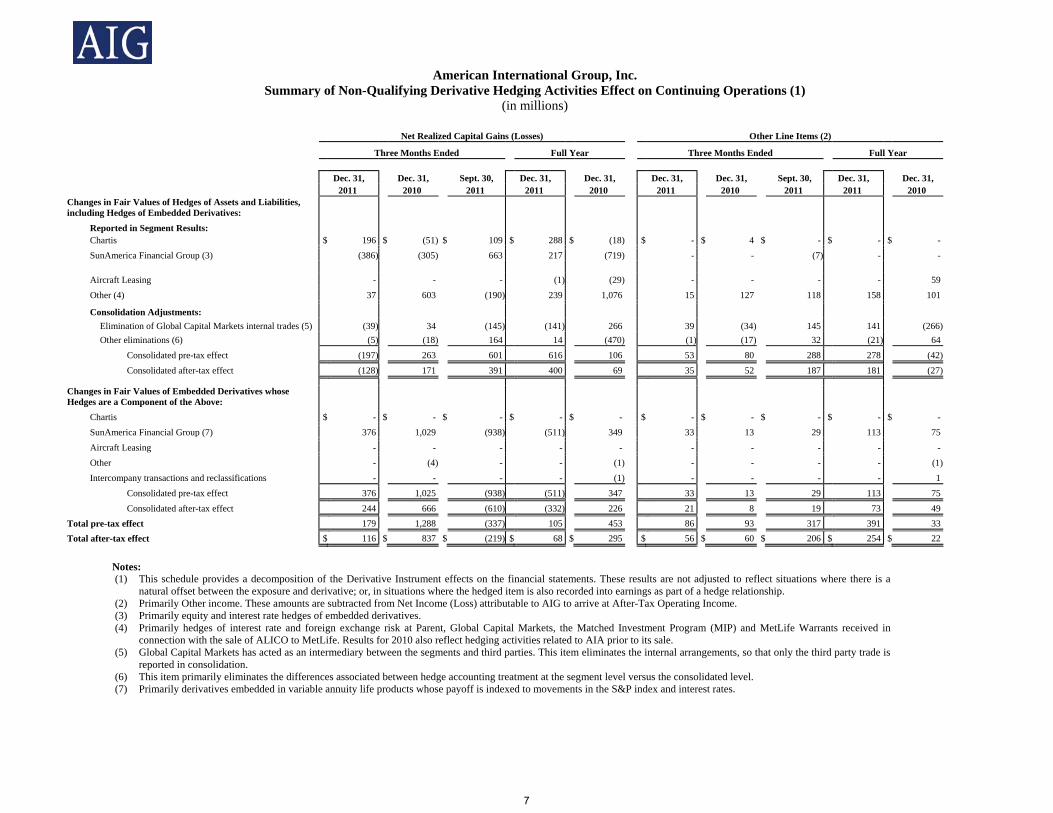
American International Group, Inc. Summary of Non-Qualifying Derivative Hedging Activities Effect on Continuing Operations (1) (in millions)
Net Realized Capital Gains (Losses) Other Line Items (2)
Three Months Ended Full Year Three Months Ended Full Year Dec. 31, Dec. 31, Sept. 30, Dec. 31, Dec. 31, Dec. 31, Dec. 31, Sept. 30, Dec. 31, Dec. 31, 2011 2010 2011 2011 2010 2011 2010 2011 2011 2010 Changes in Fair Values of Hedges of Assets and Liabilities, including Hedges of Embedded Derivatives: Reported in Segment Results: Chartis $ 196 $ (51) $ 109 $ 288 $ (18) $ - $ 4 $ - $ - $ - SunAmerica Financial Group (3) (386) (305) 663 217 (719) - - (7) - -
Aircraft Leasing
- - - (1) (29) - - - - 59 Other (4) 37 603 (190) 239 1,076 15 127 118 158 101
Consolidation Adjustments: Elimination of Global Capital Markets internal trades (5) (39) 34 (145) (141) 266 39 (34) 145 141 (266) Other eliminations (6) (5) (18) 164 14 (470) (1) (17) 32 (21) 64 Consolidated pre-tax effect (197) 263 601 616 106 53 80 288 278 (42) Consolidated after-tax effect (128) 171 391 400 69 35 52 187 181 (27)
Changes in Fair Values of Embedded Derivatives whose Hedges are a Component of the Above: Chartis $ - $ - $ - $ - $ - $ - $ - $ - $ - $ - SunAmerica Financial Group (7) 376 1,029 (938) (511) 349 33 13 29 113 75 Aircraft Leasing - - - - - - - - - - Other - (4) - - (1) - - - - (1) Intercompany transactions and reclassifications - - - - (1) - - - - 1 Consolidated pre-tax effect 376 1,025 (938) (511) 347 33 13 29 113 75 Consolidated after-tax effect 244 666 (610) (332) 226 21 8 19 73 49 Total pre-tax effect 179 1,288 (337) 105 453 86 93 317 391 33 Total after-tax effect $ 116 $ 837 $ (219) $ 68 $ 295 $ 56 $ 60 $ 206 $ 254 $ 22
Notes:
(1) This schedule provides a decomposition of the Derivative Instrument effects on the financial statements. These results are not adjusted to reflect situations where there is a natural offset between the exposure and derivative; or, in situations where the hedged item is also recorded into earnings as part of a hedge relationship.
(2) Primarily Other income. These amounts are subtracted from Net Income (Loss) attributable to AIG to arrive at After-Tax Operating Income. (3) Primarily equity and interest rate hedges of embedded derivatives. (4) Primarily hedges of interest rate and foreign exchange risk at Parent, Global Capital Markets, the Matched Investment Program (MIP) and MetLife Warrants received in
connection with the sale of ALICO to MetLife. Results for 2010 also reflect hedging activities related to AIA prior to its sale. (5) Global Capital Markets has acted as an intermediary between the segments and third parties. This item eliminates the internal arrangements, so that only the third party trade is
reported in consolidation. (6) This item primarily eliminates the differences associated between hedge accounting treatment at the segment level versus the consolidated level. (7) Primarily derivatives embedded in variable annuity life products whose payoff is indexed to movements in the S&P index and interest rates.
7
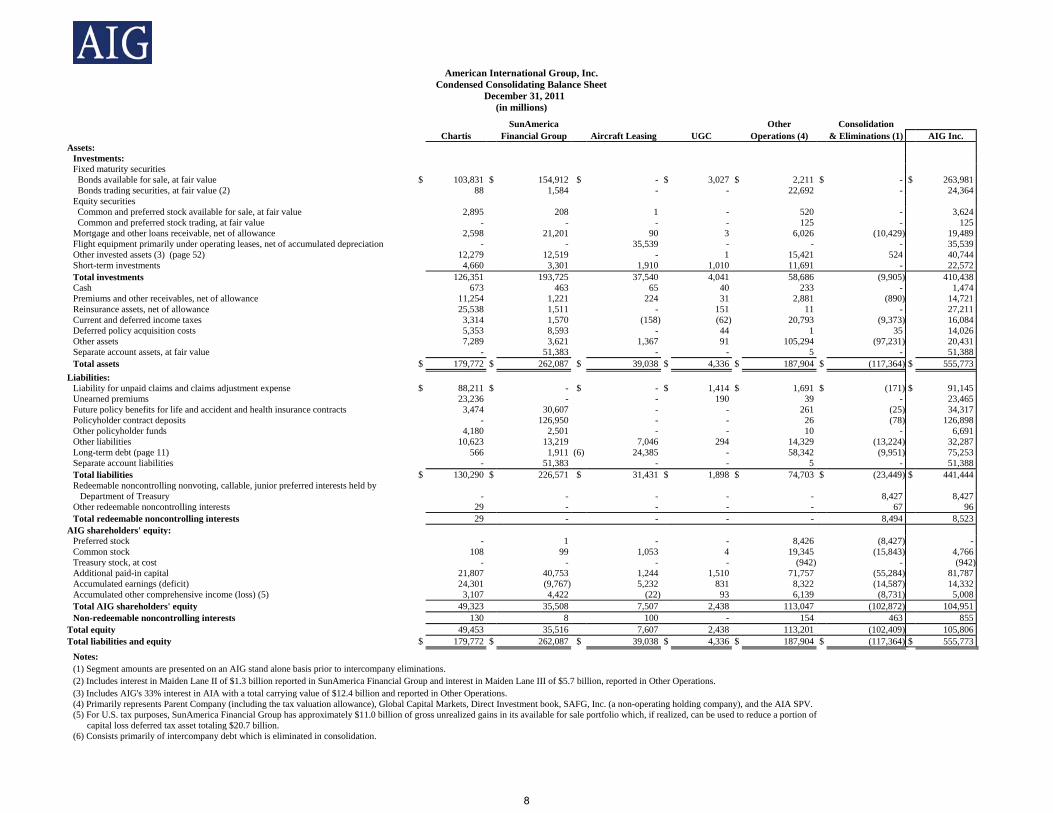
American International Group, Inc.
Condensed Consolidating Balance Sheet December 31, 2011
(in millions) SunAmerica Other Consolidation Chartis Financial Group Aircraft Leasing UGC Operations (4) & Eliminations (1) AIG Inc. Assets: Investments: Fixed maturity securities Bonds available for sale, at fair value $ 103,831 $ 154,912 $ - $ 3,027 $ 2,211 $ - $ 263,981 Bonds trading securities, at fair value (2) 88 1,584 - - 22,692 - 24,364 Equity securities Common and preferred stock available for sale, at fair value 2,895 208 1 - 520 - 3,624 Common and preferred stock trading, at fair value - - - - 125 - 125 Mortgage and other loans receivable, net of allowance 2,598 21,201 90 3 6,026 (10,429) 19,489 Flight equipment primarily under operating leases, net of accumulated depreciation - - 35,539 - - - 35,539 Other invested assets (3) (page 52) 12,279 12,519 - 1 15,421 524 40,744 Short-term investments 4,660 3,301 1,910 1,010 11,691 - 22,572 Total investments 126,351 193,725 37,540 4,041 58,686 (9,905) 410,438 Cash 673 463 65 40 233 - 1,474 Premiums and other receivables, net of allowance 11,254 1,221 224 31 2,881 (890) 14,721 Reinsurance assets, net of allowance 25,538 1,511 - 151 11 - 27,211 Current and deferred income taxes 3,314 1,570 (158) (62) 20,793 (9,373) 16,084 Deferred policy acquisition costs 5,353 8,593 - 44 1 35 14,026 Other assets 7,289 3,621 1,367 91 105,294 (97,231) 20,431 Separate account assets, at fair value - 51,383 - - 5 - 51,388 Total assets $ 179,772 $ 262,087 $ 39,038 $ 4,336 $ 187,904 $ (117,364) $ 555,773 Liabilities: Liability for unpaid claims and claims adjustment expense $ 88,211 $ - $ - $ 1,414 $ 1,691 $ (171) $ 91,145 Unearned premiums 23,236 - - 190 39 - 23,465 Future policy benefits for life and accident and health insurance contracts 3,474 30,607 - - 261 (25) 34,317 Policyholder contract deposits - 126,950 - - 26 (78) 126,898 Other policyholder funds 4,180 2,501 - - 10 - 6,691 Other liabilities 10,623 13,219 7,046 294 14,329 (13,224) 32,287 Long-term debt (page 11) 566 1,911 (6) 24,385 - 58,342 (9,951) 75,253 Separate account liabilities - 51,383 - - 5 - 51,388 Total liabilities $ 130,290 $ 226,571 $ 31,431 $ 1,898 $ 74,703 $ (23,449) $ 441,444 Redeemable noncontrolling nonvoting, callable, junior preferred interests held by Department of Treasury - - - - - 8,427 8,427 Other redeemable noncontrolling interests 29 - - - - 67 96 Total redeemable noncontrolling interests 29 - - - - 8,494 8,523 AIG shareholders' equity: Preferred stock - 1 - - 8,426 (8,427) - Common stock 108 99 1,053 4 19,345 (15,843) 4,766 Treasury stock, at cost - - - - (942) - (942) Additional paid-in capital 21,807 40,753 1,244 1,510 71,757 (55,284) 81,787 Accumulated earnings (deficit) 24,301 (9,767) 5,232 831 8,322 (14,587) 14,332 Accumulated other comprehensive income (loss) (5) 3,107 4,422 (22) 93 6,139 (8,731) 5,008 Total AIG shareholders' equity 49,323 35,508 7,507 2,438 113,047 (102,872) 104,951 Non-redeemable noncontrolling interests 130 8 100 - 154 463 855 Total equity 49,453 35,516 7,607 2,438 113,201 (102,409) 105,806 Total liabilities and equity $ 179,772 $ 262,087 $ 39,038 $ 4,336 $ 187,904 $ (117,364) $ 555,773 Notes: (1) Segment amounts are presented on an AIG stand alone basis prior to intercompany eliminations. (2) Includes interest in Maiden Lane II of $1.3 billion reported in SunAmerica Financial Group and interest in Maiden Lane III of $5.7 billion, reported in Other Operations. (3) Includes AIG's 33% interest in AIA with a total carrying value of $12.4 billion and reported in Other Operations. (4) Primarily represents Parent Company (including the tax valuation allowance), Global Capital Markets, Direct Investment book, SAFG, Inc. (a non-operating holding company), and the AIA SPV. (5) For U.S. tax purposes, SunAmerica Financial Group has approximately $11.0 billion of gross unrealized gains in its available for sale portfolio which, if realized, can be used to reduce a portion of capital loss deferred tax asset totaling $20.7 billion. (6) Consists primarily of intercompany debt which is eliminated in consolidation.
8
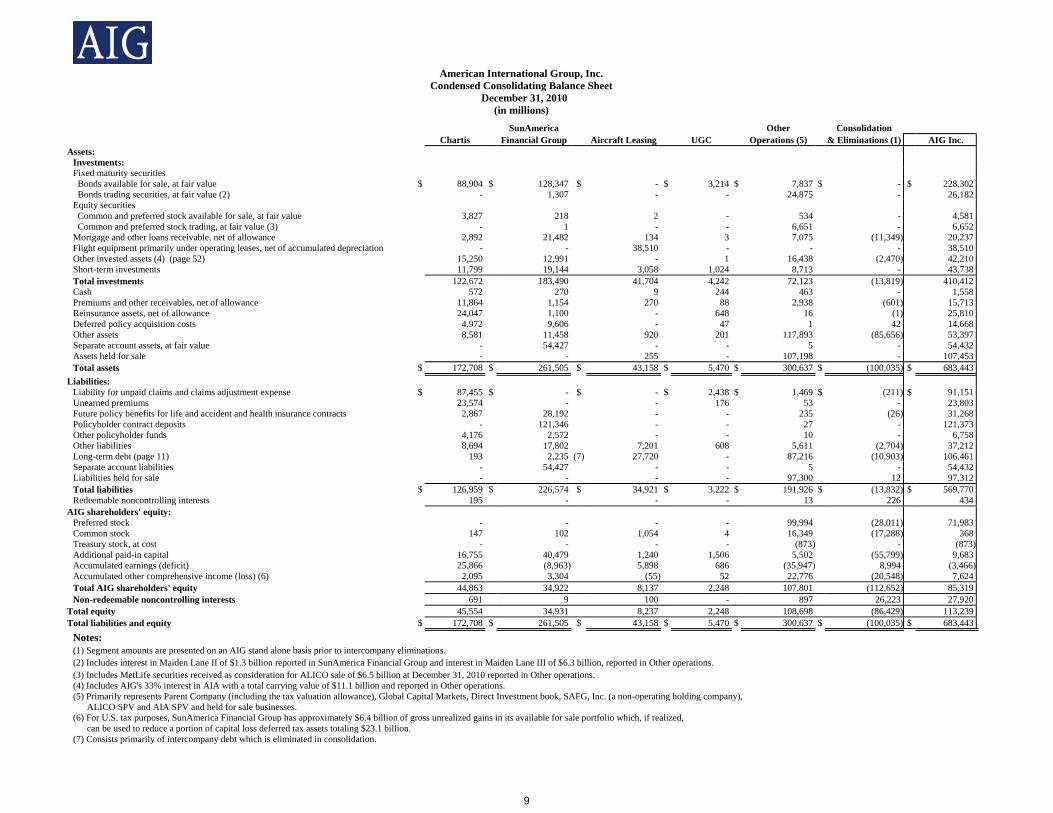
American International Group, Inc.
Condensed Consolidating Balance Sheet December 31, 2010
(in millions) SunAmerica Other Consolidation Chartis Financial Group Aircraft Leasing UGC Operations (5) & Eliminations (1) AIG Inc. Assets: Investments: Fixed maturity securities Bonds available for sale, at fair value $ 88,904 $ 128,347 $ - $ 3,214 $ 7,837 $ - $ 228,302 Bonds trading securities, at fair value (2) - 1,307 - - 24,875 - 26,182 Equity securities Common and preferred stock available for sale, at fair value 3,827 218 2 - 534 - 4,581 Common and preferred stock trading, at fair value (3) - 1 - - 6,651 - 6,652 Mortgage and other loans receivable, net of allowance 2,892 21,482 134 3 7,075 (11,349) 20,237 Flight equipment primarily under operating leases, net of accumulated depreciation - - 38,510 - - - 38,510 Other invested assets (4) (page 52) 15,250 12,991 - 1 16,438 (2,470) 42,210 Short-term investments 11,799 19,144 3,058 1,024 8,713 - 43,738 Total investments 122,672 183,490 41,704 4,242 72,123 (13,819) 410,412 Cash 572 270 9 244 463 - 1,558 Premiums and other receivables, net of allowance 11,864 1,154 270 88 2,938 (601) 15,713 Reinsurance assets, net of allowance 24,047 1,100 - 648 16 (1) 25,810 Deferred policy acquisition costs 4,972 9,606 - 47 1 42 14,668 Other assets 8,581 11,458 920 201 117,893 (85,656) 53,397 Separate account assets, at fair value - 54,427 - - 5 - 54,432 Assets held for sale - - 255 - 107,198 - 107,453 Total assets $ 172,708 $ 261,505 $ 43,158 $ 5,470 $ 300,637 $ (100,035) $ 683,443 Liabilities: Liability for unpaid claims and claims adjustment expense $ 87,455 $ - $ - $ 2,438 $ 1,469 $ (211) $ 91,151 Unearned premiums 23,574 - - 176 53 - 23,803 Future policy benefits for life and accident and health insurance contracts 2,867 28,192 - - 235 (26) 31,268 Policyholder contract deposits - 121,346 - - 27 - 121,373 Other policyholder funds 4,176 2,572 - - 10 - 6,758 Other liabilities 8,694 17,802 7,201 608 5,611 (2,704) 37,212 Long-term debt (page 11) 193 2,235 (7) 27,720 - 87,216 (10,903) 106,461 Separate account liabilities - 54,427 - - 5 - 54,432 Liabilities held for sale - - - - 97,300 12 97,312 Total liabilities $ 126,959 $ 226,574 $ 34,921 $ 3,222 $ 191,926 $ (13,832) $ 569,770 Redeemable noncontrolling interests 195 - - - 13 226 434 AIG shareholders' equity: Preferred stock - - - - 99,994 (28,011) 71,983 Common stock 147 102 1,054 4 16,349 (17,288) 368 Treasury stock, at cost - - - - (873) - (873) Additional paid-in capital 16,755 40,479 1,240 1,506 5,502 (55,799) 9,683 Accumulated earnings (deficit) 25,866 (8,963) 5,898 686 (35,947) 8,994 (3,466) Accumulated other comprehensive income (loss) (6) 2,095 3,304 (55) 52 22,776 (20,548) 7,624 Total AIG shareholders' equity 44,863 34,922 8,137 2,248 107,801 (112,652) 85,319 Non-redeemable noncontrolling interests 691 9 100 - 897 26,223 27,920 Total equity 45,554 34,931 8,237 2,248 108,698 (86,429) 113,239 Total liabilities and equity $ 172,708 $ 261,505 $ 43,158 $ 5,470 $ 300,637 $ (100,035) $ 683,443 Notes: (1) Segment amounts are presented on an AIG stand alone basis prior to intercompany eliminations. (2) Includes interest in Maiden Lane II of $1.3 billion reported in SunAmerica Financial Group and interest in Maiden Lane III of $6.3 billion, reported in Other operations. (3) Includes MetLife securities received as consideration for ALICO sale of $6.5 billion at December 31, 2010 reported in Other operations. (4) Includes AIG's 33% interest in AIA with a total carrying value of $11.1 billion and reported in Other operations. (5) Primarily represents Parent Company (including the tax valuation allowance), Global Capital Markets, Direct Investment book, SAFG, Inc. (a non-operating holding company), ALICO SPV and AIA SPV and held for sale businesses. (6) For U.S. tax purposes, SunAmerica Financial Group has approximately $6.4 billion of gross unrealized gains in its available for sale portfolio which, if realized, can be used to reduce a portion of capital loss deferred tax assets totaling $23.1 billion. (7) Consists primarily of intercompany debt which is eliminated in consolidation.
9
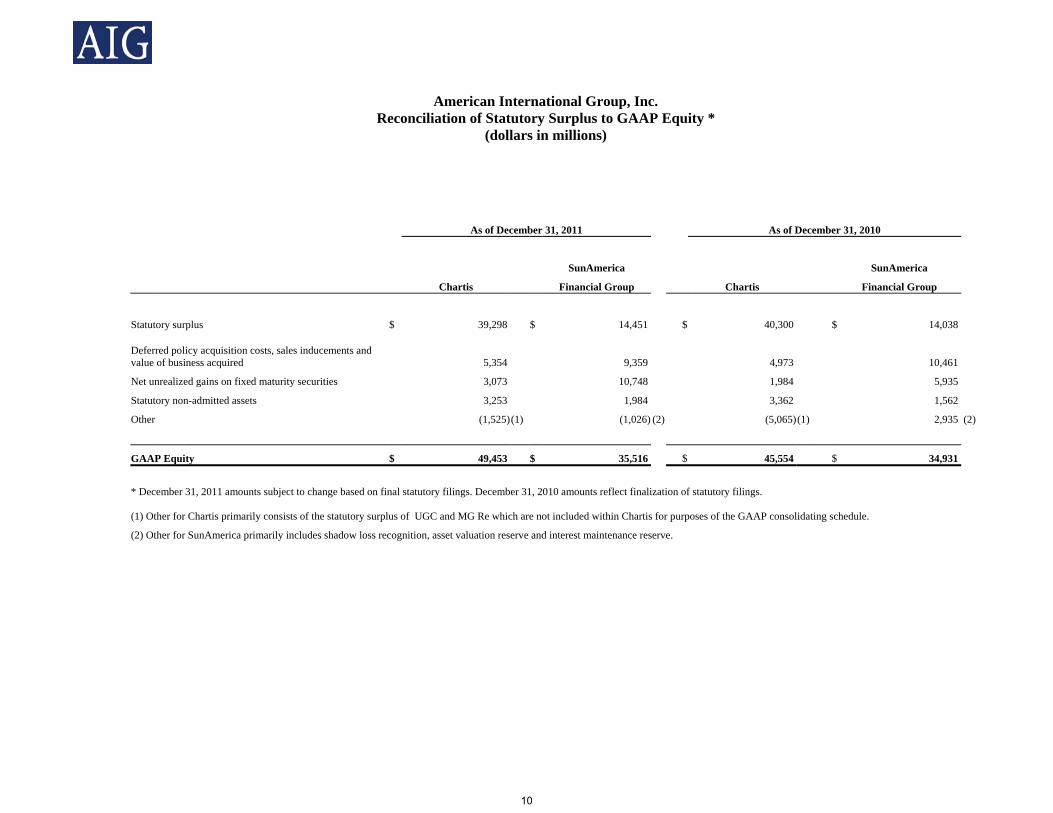
American International Group, Inc. Reconciliation of Statutory Surplus to GAAP Equity * (dollars in millions)
As of December 31, 2011 As of December 31, 2010
SunAmerica SunAmerica
Chartis Financial Group Chartis Financial Group
Statutory surplus $ 39,298 $ 14,451 $ 40,300 $ 14,038
Deferred policy acquisition costs, sales inducements and value of business acquired
5,354 9,359 4,973 10,461
Net unrealized gains on fixed maturity securities 3,073 10,748 1,984 5,935
Statutory non-admitted assets 3,253 1,984 3,362 1,562
Other (1,525)(1) (1,026) (2) (5,065)(1) 2,935 (2)
GAAP Equity $ 49,453 $ 35,516 $ 45,554 $ 34,931
* December 31, 2011 amounts subject to change based on final statutory filings. December 31, 2010 amounts reflect finalization of statutory filings. (1) Other for Chartis primarily consists of the statutory surplus of UGC and MG Re which are not included within Chartis for purposes of the GAAP consolidating schedule.
(2) Other for SunAmerica primarily includes shadow loss recognition, asset valuation reserve and interest maintenance reserve.
10

American International Group, Inc.
Debt and Capital (dollars in millions)
Debt and Hybrid Capital Interest Expense
Dec. 31, Dec. 31, Inc. Three Months Ended Twelve Months Ended 2011 2010 (Dec.) Dec. 31, 2011 Dec. 31, 2010 Dec. 31, 2011 Dec. 31, 2010Financial debt: FRBNY Credit Facility (a) $ - $ 20,985 (100.0)% $ - $ 1,200 $ 72 $ 4,107 AIG notes and bonds payable 12,725 11,511 10.5 167 131 623 499 AIG loans and mortgage payable 234 218 7.3 - 1 2 3 SAFG, Inc. notes and bonds payable 298 298 - 5 5 21 44 Liabilities connected to trust preferred stock 1,339 1,339 - 27 27 107 107 AIG Funding loans to subsidiaries- net - (376) NM - - (b) - - (b) Total 14,596 33,975 (57.0) 199 1,364 825 4,760 Operating debt: MIP notes payable 10,147 11,318 (10.3) 94 89 367 382 Series AIGFP matched notes and bonds payable 3,807 3,981 (4.4) 73 75 296 302 Other AIG borrowings supported by assets (c) 10,766 12,143 (11.3) - - - - ILFC borrowings 24,364 27,699 (12.0) 345 366 1,427 1,239 Other subsidiaries 393 446 (11.9) 6 3 16 29 Borrowings of consolidated investments 1,853 2,614 (29.1) 15 19 82 138 AIG Funding loans to subsidiaries- net - 376 NM - - (b) - - (b) Total 51,330 58,577 (12.4) 533 552 2,188 2,090 Hybrid - debt securities: Junior subordinated debt (e) 9,327 11,740 (20.6) 165 220 828 877 Hybrid - mandatorily convertible units: Junior subordinated debt attributable to equity units (e) - 2,169 NM - 68 32 329 Total $ 75,253 $ 106,461 (29.3)% $ 897 $ 2,204 $ 3,873 $ 8,056 Interest expense reported in discontinued operations - (18) (2) (75) Interest expense on consolidated income statement $ 897 $ 2,186 $ 3,871 $ 7,981 AIG capitalization: Total equity $ 105,806 $ 113,239 (d) (6.6)% Hybrid - debt securities (e) 9,327 11,740 (20.6) Hybrid - mandatorily convertible units (e) - 2,169 NM Total consolidated equity and hybrid capital 115,133 127,148 (9.4) Financial debt 14,596 33,975 (57.0) Total capital $ 129,729 $ 161,123 (19.5)% Ratios: Total equity / Total capital 81.6% 70.3% Hybrid - debt securities / Total capital 7.2% 7.3% Hybrid - mandatorily convertible units / Total capital N/A 1.3% Financial debt / Total capital 11.3% 21.1% Notes: (a) Repaid in full on January 14, 2011 following AIG's recapitalization. See page 12. (b) Amounts are eliminated in consolidation. (c) Borrowings are carried at fair value with fair value adjustments reported in Other income (loss) on the Consolidated Statement of Operations. Contractual interest payments amounted to $401 million and $424 million for the twelve months ended December 31, 2011 and 2010, respectively. (d) As a result of the closing of the Recapitalization on January 14, 2011, the SPV noncontrolling interests of $26.4 billion in 2010 are no longer considered permanent equity on AIG's Consolidated Balance Sheet, and are classified as redeemable noncontrollling interest. (e) The equity units and junior subordinated debentures receive hybrid equity treatment from the major rating agencies under their current policies but are recorded as long-term borrowings on the consolidated balance sheet. In 2011, AIG remarketed three series of debentures representing $2.2 billion in aggregate principal and as a result, no debentures relating to the equity units remain outstanding. In November 2011, AIG exchanged specified series of its outstanding Junior Subordinated Debentures for senior notes pursuant to its offer to exchange.
11
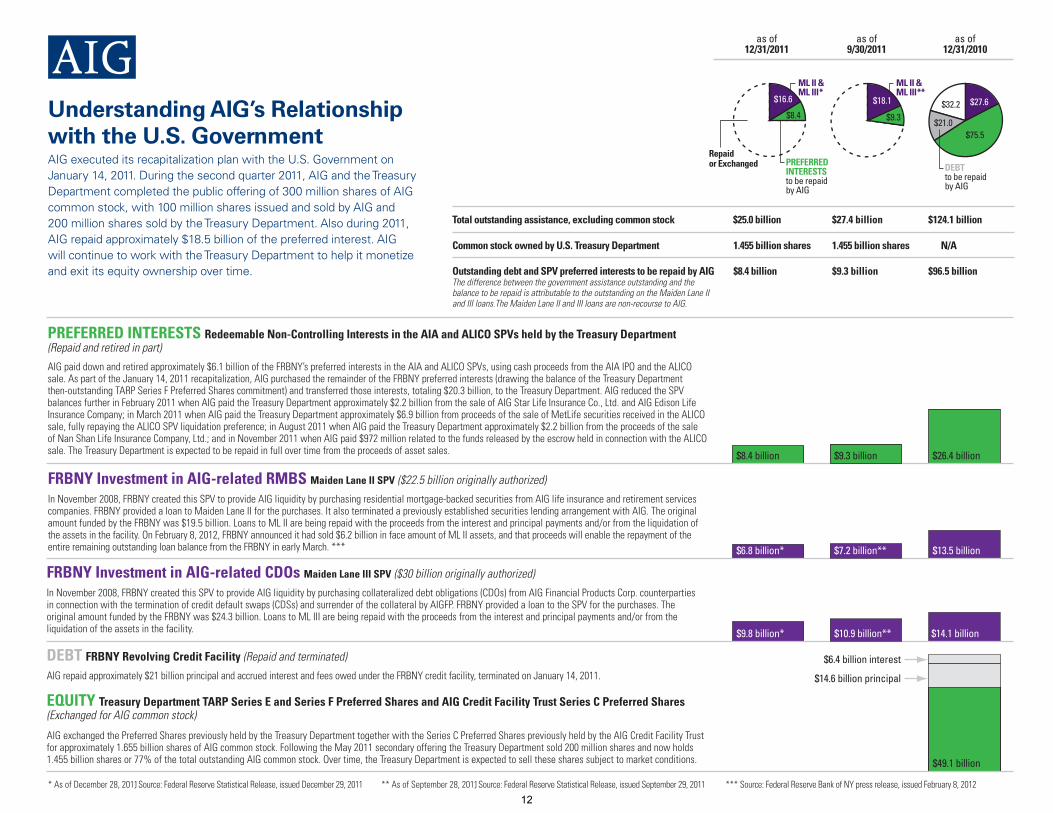
Understanding AIG’s Relationshipwith the U.S. GovernmentAIG executed its recapitalization plan with the U.S. Government on January 14, 2011. During the second quarter 2011, AIG and the Treasury Department completed the public offering of 300 million shares of AIG common stock, with 100 million shares issued and sold by AIG and 200 million shares sold by the Treasury Department. Also during 2011, AIG repaid approximately $18.5 billion of the preferred interest. AIG will continue to work with the Treasury Department to help it monetize and exit its equity ownership over time.
Total outstanding assistance, excluding common stock $25.0 billion $27.4 billion $124.1 billion
Common stock owned by U.S. Treasury Department 1.455 billion shares 1.455 billion shares N/A
Outstanding debt and SPV preferred interests to be repaid by AIG $8.4 billion $9.3 billion $96.5 billionThe difference between the government assistance outstanding and the balance to be repaid is attributable to the outstanding on the Maiden Lane II and III loans.The Maiden Lane II and III loans are non-recourse to AIG.
* As of December 28, 2011, Source: Federal Reserve Statistical Release, issued December 29, 2011 ** As of September 28, 2011, Source: Federal Reserve Statistical Release, issued September 29, 2011 *** Source: Federal Reserve Bank of NY press release, issued February 8, 2012
PREFERRED INTERESTS Redeemable Non-Controlling Interests in the AIA and ALICO SPVs held by the Treasury Department (Repaid and retired in part)
AIG paid down and retired approximately $6.1 billion of the FRBNY’s preferred interests in the AIA and ALICO SPVs, using cash proceeds from the AIA IPO and the ALICO sale. As part of the January 14, 2011 recapitalization, AIG purchased the remainder of the FRBNY preferred interests (drawing the balance of the Treasury Department then-outstanding TARP Series F Preferred Shares commitment) and transferred those interests, totaling $20.3 billion, to the Treasury Department. AIG reduced the SPV balances further in February 2011 when AIG paid the Treasury Department approximately $2.2 billion from the sale of AIG Star Life Insurance Co., Ltd. and AIG Edison Life Insurance Company; in March 2011 when AIG paid the Treasury Department approximately $6.9 billion from proceeds of the sale of MetLife securities received in the ALICO sale, fully repaying the ALICO SPV liquidation preference; in August 2011 when AIG paid the Treasury Department approximately $2.2 billion from the proceeds of the sale of Nan Shan Life Insurance Company, Ltd.; and in November 2011 when AIG paid $972 million related to the funds released by the escrow held in connection with the ALICO sale. The Treasury Department is expected to be repaid in full over time from the proceeds of asset sales.
FRBNY Investment in AIG-related CDOs Maiden Lane III SPV ($30 billion originally authorized)
In November 2008, FRBNY created this SPV to provide AIG liquidity by purchasing collateralized debt obligations (CDOs) from AIG Financial Products Corp. counterparties in connection with the termination of credit default swaps (CDSs) and surrender of the collateral by AIGFP. FRBNY provided a loan to the SPV for the purchases. The original amount funded by the FRBNY was $24.3 billion. Loans to ML III are being repaid with the proceeds from the interest and principal payments and/or from the liquidation of the assets in the facility.
FRBNY Investment in AIG-related RMBS Maiden Lane II SPV ($22.5 billion originally authorized)
In November 2008, FRBNY created this SPV to provide AIG liquidity by purchasing residential mortgage-backed securities from AIG life insurance and retirement services companies. FRBNY provided a loan to Maiden Lane II for the purchases. It also terminated a previously established securities lending arrangement with AIG. The original amount funded by the FRBNY was $19.5 billion. Loans to ML II are being repaid with the proceeds from the interest and principal payments and/or from the liquidation of the assets in the facility. On February 8, 2012, FRBNY announced it had sold $6.2 billion in face amount of ML II assets, and that proceeds will enable the repayment of the entire remaining outstanding loan balance from the FRBNY in early March. ***
as of12/31/2011
$8.4
$6.8 billion*
$9.8 billion*
$16.6
$8.4 billion
ML II &ML III*
as of12/31/2010
$75.5
$13.5 billion
$14.1 billion
$27.6$32.2
$21.0
$26.4 billion
as of9/30/2011
$9.3
$7.2 billion**
$10.9 billion**
DEBT FRBNY Revolving Credit Facility (Repaid and terminated)
AIG repaid approximately $21 billion principal and accrued interest and fees owed under the FRBNY credit facility, terminated on January 14, 2011.
EQUITY Treasury Department TARP Series E and Series F Preferred Shares and AIG Credit Facility Trust Series C Preferred Shares (Exchanged for AIG common stock)
AIG exchanged the Preferred Shares previously held by the Treasury Department together with the Series C Preferred Shares previously held by the AIG Credit Facility Trust for approximately 1.655 billion shares of AIG common stock. Following the May 2011 secondary offering the Treasury Department sold 200 million shares and now holds 1.455 billion shares or 77% of the total outstanding AIG common stock. Over time, the Treasury Department is expected to sell these shares subject to market conditions. $49.1 billion
$6.4 billion interest
$14.6 billion principal
$18.1
$9.3 billion
ML II &ML III**
Repaidor Exchanged PREFERRED
INTERESTSto be repaidby AIG
DEBTto be repaidby AIG
12
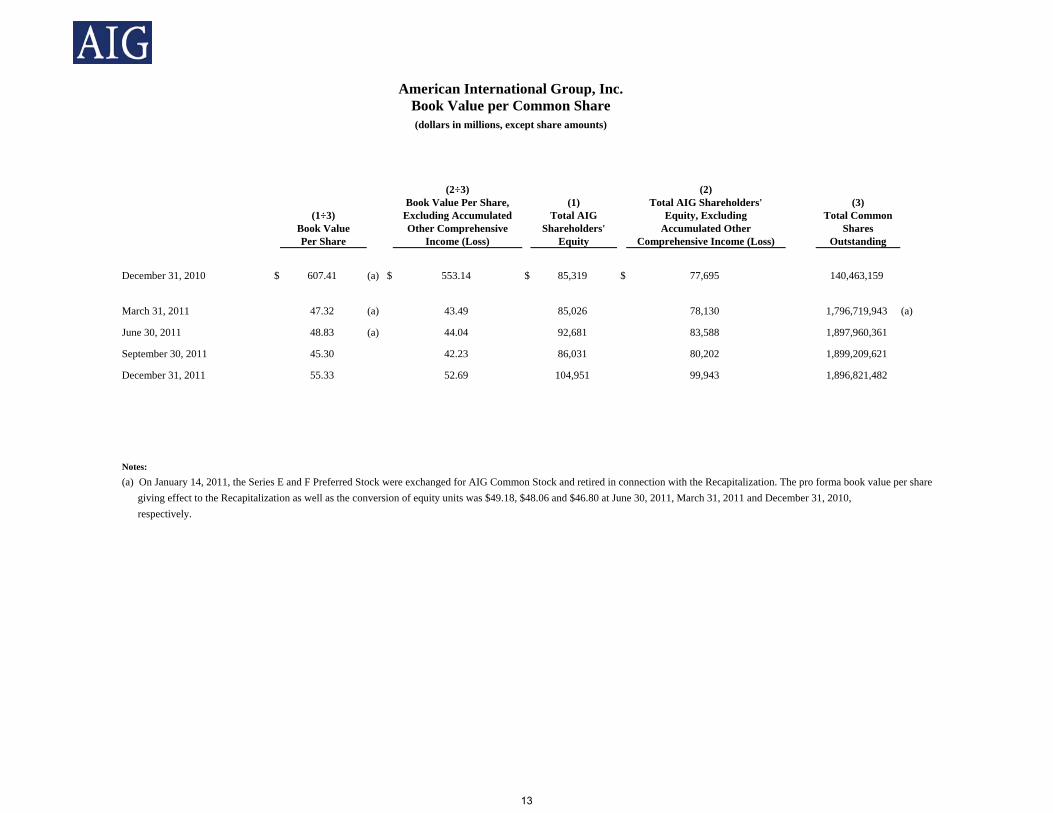
American International Group, Inc. Book Value per Common Share (dollars in millions, except share amounts) (2÷3) (2) Book Value Per Share, (1) Total AIG Shareholders' (3) (1÷3) Excluding Accumulated Total AIG Equity, Excluding Total Common Book Value Other Comprehensive Shareholders' Accumulated Other Shares Per Share Income (Loss) Equity Comprehensive Income (Loss) Outstanding
December 31, 2010 $ 607.41 (a) $ 553.14 $ 85,319 $ 77,695 140,463,159
March 31, 2011 47.32 (a) 43.49 85,026 78,130 1,796,719,943 (a) June 30, 2011 48.83 (a) 44.04 92,681 83,588 1,897,960,361 September 30, 2011 45.30 42.23 86,031 80,202 1,899,209,621 December 31, 2011 55.33 52.69 104,951 99,943 1,896,821,482
Notes:
(a) On January 14, 2011, the Series E and F Preferred Stock were exchanged for AIG Common Stock and retired in connection with the Recapitalization. The pro forma book value per share giving effect to the Recapitalization as well as the conversion of equity units was $49.18, $48.06 and $46.80 at June 30, 2011, March 31, 2011 and December 31, 2010, respectively.
13

American International Group, Inc.
Chartis Operating Statistics (dollars in millions)
Quarterly Full Year 4Q11 3Q11 2Q11 1Q11 4Q10 2011 2010 Net premiums written $ 7,848 $ 8,659 $ 9,167 $ 9,166 $ 7,578 $ 34,840 $ 31,612 Net premiums earned 8,962 9,043 9,033 8,651 8,550 35,689 32,521 Claims and claims adjustment expenses incurred (1) 6,675 6,838 6,680 7,756 10,724 27,949 27,867 Underwriting expenses 2,942 2,787 2,706 2,537 3,001 10,972 10,114 Underwriting loss (655) (582) (353) (1,642) (5,175) (3,232) (5,460) Net investment income Interest and dividends 963 970 946 863 882 3,742 3,450 Alternative investments (86) 55 161 241 257 371 640 Mutual funds (4) (15) 5 45 58 31 19 Other investment income (2) 186 71 80 92 78 429 445 Investment expense (56) (57) (50) (62) (74) (225) (162) Total 1,003 1,024 1,142 1,179 1,201 4,348 4,392
Operating income (loss) before net realized capital gains (losses), bargain purchase gain, gain on sale of properties and other loss 348 442 789 (463) (3,974) 1,116 (1,068) Net realized capital gains (losses) 444 57 39 47 (37) 587 (49) Bargain purchase gain (3) - - - - - - 332 Gain on sale of properties (4) - - - - 669 - 669 Other loss (4) (1) - - - (5) - Pre-tax income (loss) $ 788 $ 498 $ 828 $ (416) $ (3,342) $ 1,698 $ (116)
Underwriting ratios: Loss ratio 74.5 75.6 74.0 89.7 125.4 78.3 85.7 Expense ratio 32.8 30.8 30.0 29.3 35.1 30.7 31.1 Combined ratio 107.3 106.4 104.0 119.0 160.5 109.0 116.8 Combined ratio excluding significant current year catastrophe-related losses 102.0 100.0 98.0 99.1 158.1 99.8 113.5 Combined ratio excluding significant current year catastrophe-related losses and prior year loss development 102.1 99.2 97.7 98.7 108.9 99.4 100.3
Foreign exchange effect on worldwide premium: Change in net premiums written Increase / (decrease) in original currency (5) 1.7 % (3.5) % 13.6 % 18.7 % 7.8 % 7.3 % 1.8 % Foreign exchange effect 1.9 4.2 4.0 1.2 1.6 2.9 1.3 Increase / (decrease) as reported in US $ 3.6 % 0.7 % 17.6 % 19.9 % 9.4 % 10.2 % 3.1 % Pre-tax catastrophe-related losses and prior year loss reserve development: Pre-tax catastrophe-related losses $ 478 $ 605 $ 525 $ 1,688 $ 203 $ 3,296 $ 1,066 Reinstatement premium related to catastrophes (11) (31) 14 39 - 11 10 Prior year loss reserve development (favorable) / unfavorable (13) 62 - 23 4,203 72 4,280 Returned / (additional) premium related to prior year development (19) (25) (91) (37) (26) (172) (8) Net loss and loss expense reserve (at period end) $ 67,979 $ 70,729 $ 70,555 $ 70,201 $ 68,074 $ 67,979 $ 68,074
See Accompanying Notes on Page 29
14

American International Group, Inc.
Chartis Commercial Operating Statistics (dollars in millions)
Quarterly Full Year
4Q11 3Q11 2Q11 1Q11 4Q10 2011 2010
Net premiums written $ 4,510 $ 5,293 $ 5,845 $ 5,821 $ 4,526 $ $ 21,469 $ 20,466 Net premiums earned 5,477 5,708 5,732 5,379 5,298 22,296 21,472 Claims and claims adjustment expenses incurred 4,537 4,668 4,524 5,224 6,714 18,953 19,001 Underwriting expenses 1,575 1,514 1,418 1,340 1,692 5,847 5,752 Underwriting loss (635) (474) (210) (1,185) (3,108) (2,504) (3,281) Net investment income 837 807 820 784 813 3,248 3,348 Operating income (loss) 202 333 610 (401) (2,295) 744 67
Underwriting ratios: Loss ratio 82.8 81.8 78.9 97.1 126.7 85.0 88.5 Expense ratio 28.8 26.5 24.8 24.9 31.9 26.2 26.8 Combined ratio 111.6 108.3 103.7 122.0 158.6 111.2 115.3 Combined ratio excluding significant current year catastrophe-related losses 103.7 100.2 95.5 99.2 154.8 99.6 110.6 Combined ratio excluding significant current year catastrophe-related losses and prior year loss development 105.0 99.7 95.9 99.3 112.2 99.9 100.4 Pre-tax catastrophe-related losses and prior year loss reserve development: Pre-tax catastrophe-related losses $ 443 $ 483 $ 456 $ 1,199 $ 203 $ 2,581 $ 1,000 Reinstatement premium related to catastrophes (11) (31) 14 39 - 11 10 Prior year loss reserve development (favorable) / unfavorable (75) 20 (43) (16) 2,251 (114) 2,186 Returned / (additional) premium related to prior year development (19) (25) (91) (37) (26) (172) (8) Net loss and loss expense reserve (at period end) $ 58,625 $ 59,163 $ 59,233 $ 59,006 $ 57,324 $ 58,625 $ 57,324 See Accompanying Notes on Page 29
15
American International Group, Inc.
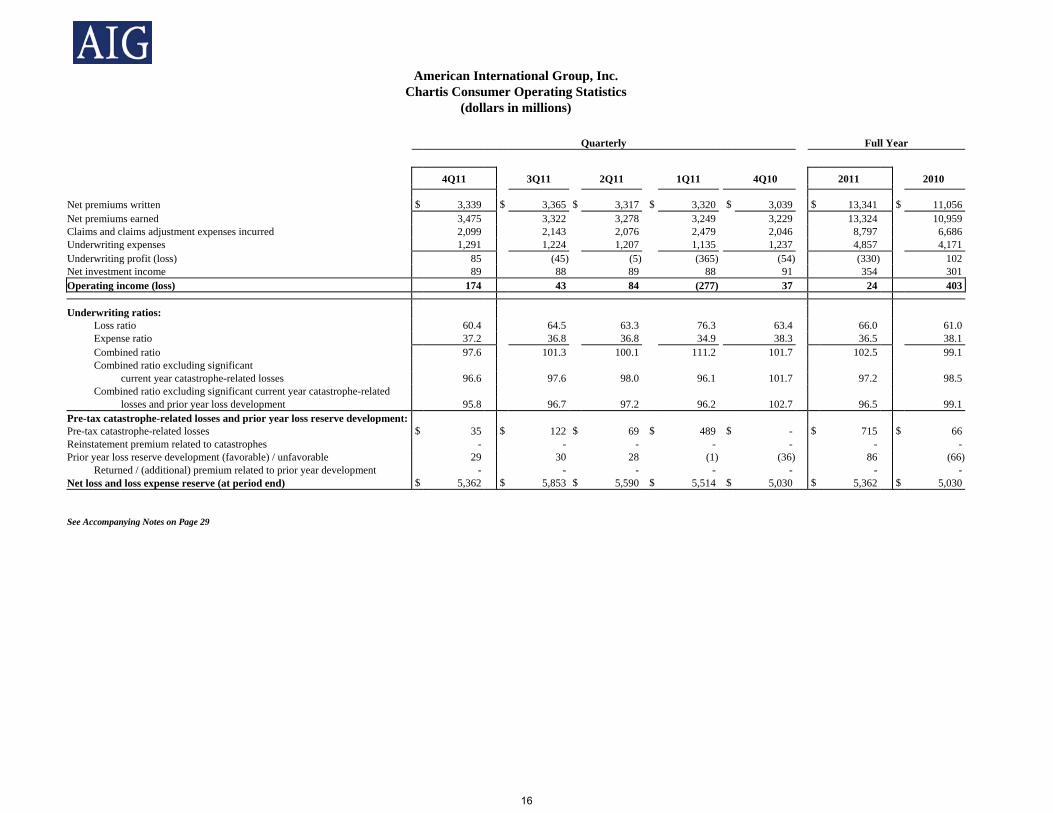
Chartis Consumer Operating Statistics (dollars in millions)
Quarterly Full Year
4Q11 3Q11 2Q11 1Q11 4Q10 2011 2010
Net premiums written $ 3,339 $ 3,365 $ 3,317 $ 3,320 $ 3,039 $ 13,341 $ 11,056 Net premiums earned 3,475 3,322 3,278 3,249 3,229 13,324 10,959 Claims and claims adjustment expenses incurred 2,099 2,143 2,076 2,479 2,046 8,797 6,686 Underwriting expenses 1,291 1,224 1,207 1,135 1,237 4,857 4,171 Underwriting profit (loss) 85 (45) (5) (365) (54) (330) 102 Net investment income 89 88 89 88 91 354 301 Operating income (loss) 174 43 84 (277) 37 24 403
Underwriting ratios: Loss ratio 60.4 64.5 63.3 76.3 63.4 66.0 61.0 Expense ratio 37.2 36.8 36.8 34.9 38.3 36.5 38.1 Combined ratio 97.6 101.3 100.1 111.2 101.7 102.5 99.1 Combined ratio excluding significant current year catastrophe-related losses 96.6 97.6 98.0 96.1 101.7 97.2 98.5 Combined ratio excluding significant current year catastrophe-related losses and prior year loss development 95.8 96.7 97.2 96.2 102.7 96.5 99.1 Pre-tax catastrophe-related losses and prior year loss reserve development: Pre-tax catastrophe-related losses $ 35 $ 122 $ 69 $ 489 $ - $ 715 $ 66 Reinstatement premium related to catastrophes - - - - - - - Prior year loss reserve development (favorable) / unfavorable 29 30 28 (1) (36) 86 (66) Returned / (additional) premium related to prior year development - - - - - - - Net loss and loss expense reserve (at period end) $ 5,362 $ 5,853 $ 5,590 $ 5,514 $ 5,030 $ 5,362 $ 5,030 See Accompanying Notes on Page 29
16
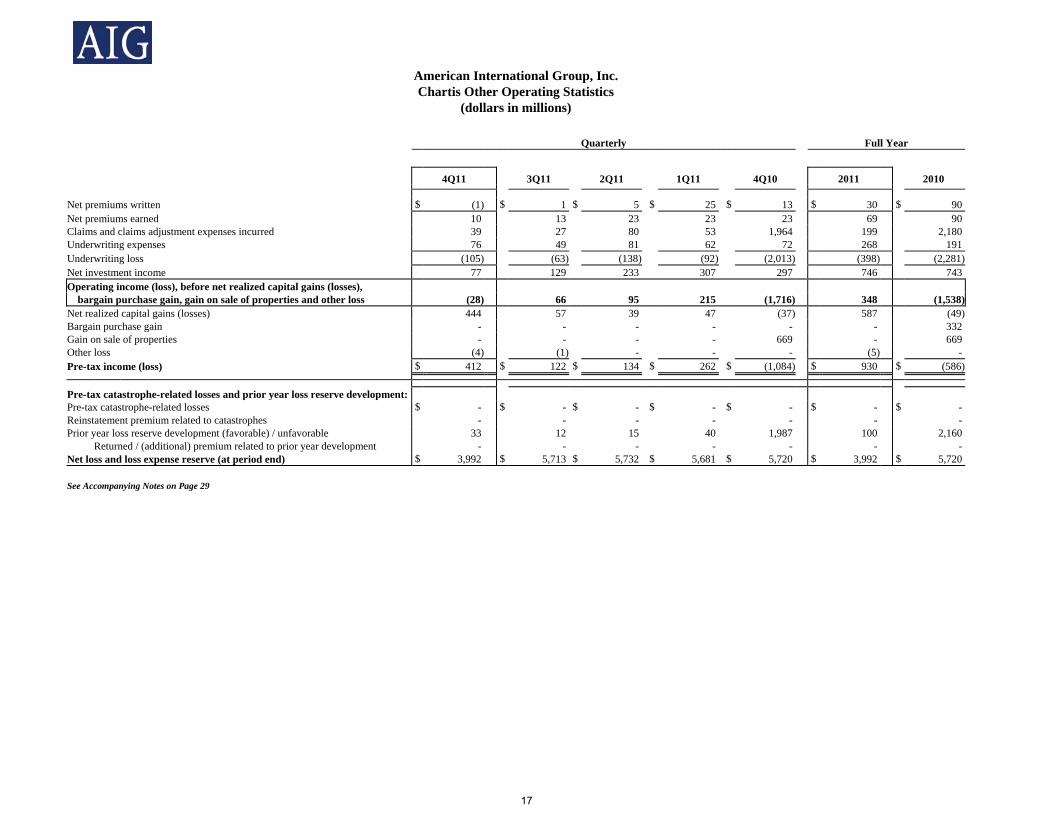
American International Group, Inc. Chartis Other Operating Statistics
(dollars in millions)
Quarterly Full Year
4Q11 3Q11 2Q11 1Q11 4Q10 2011 2010
Net premiums written $ (1) $ 1 $ 5 $ 25 $ 13 $ 30 $ 90 Net premiums earned 10 13 23 23 23 69 90 Claims and claims adjustment expenses incurred 39 27 80 53 1,964 199 2,180 Underwriting expenses 76 49 81 62 72 268 191 Underwriting loss (105) (63) (138) (92) (2,013) (398) (2,281) Net investment income 77 129 233 307 297 746 743 Operating income (loss), before net realized capital gains (losses), bargain purchase gain, gain on sale of properties and other loss (28) 66 95 215 (1,716) 348 (1,538) Net realized capital gains (losses) 444 57 39 47 (37) 587 (49) Bargain purchase gain - - - - - - 332 Gain on sale of properties - - - - 669 - 669 Other loss (4) (1) - - - (5) - Pre-tax income (loss) $ 412 $ 122 $ 134 $ 262 $ (1,084) $ 930 $ (586)
Pre-tax catastrophe-related losses and prior year loss reserve development: Pre-tax catastrophe-related losses $ - $ - $ - $ - $ - $ - $ - Reinstatement premium related to catastrophes - - - - - - - Prior year loss reserve development (favorable) / unfavorable 33 12 15 40 1,987 100 2,160 Returned / (additional) premium related to prior year development - - - - - - - Net loss and loss expense reserve (at period end) $ 3,992 $ 5,713 $ 5,732 $ 5,681 $ 5,720 $ 3,992 $ 5,720 See Accompanying Notes on Page 29
17
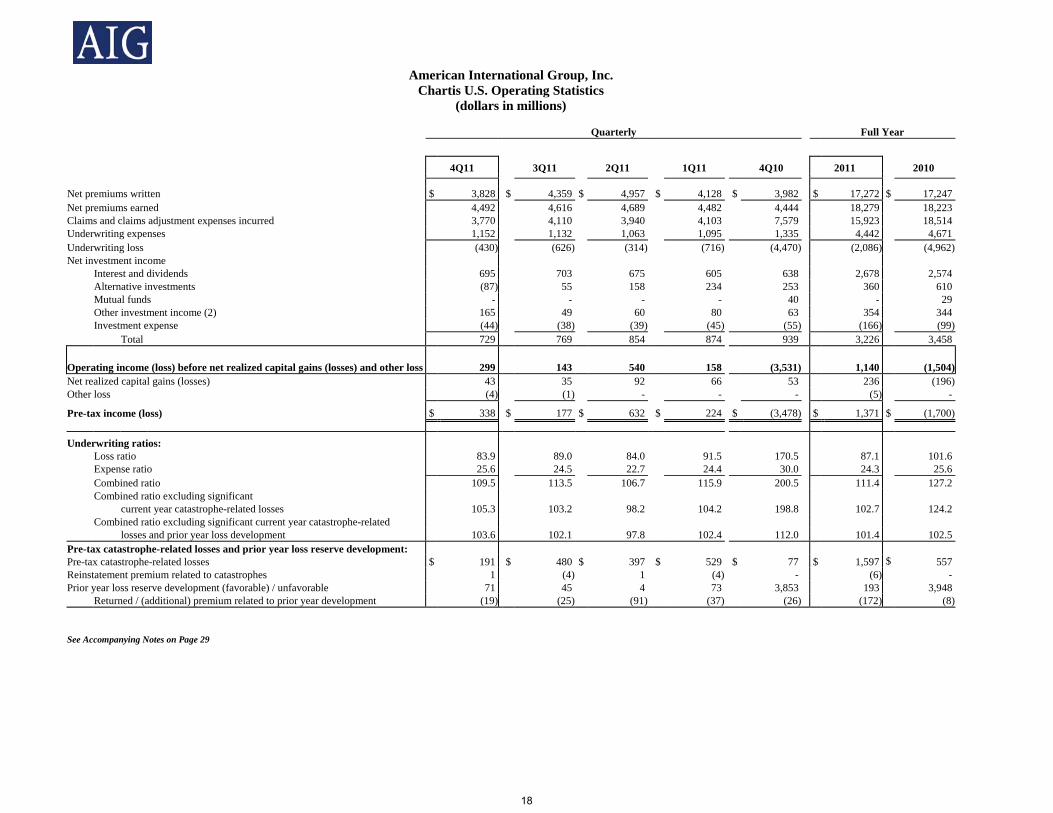
American International Group, Inc.
Chartis U.S. Operating Statistics (dollars in millions)
Quarterly Full Year
4Q11 3Q11 2Q11 1Q11 4Q10 2011 2010
Net premiums written $ 3,828 $ 4,359 $ 4,957 $ 4,128 $ 3,982 $ 17,272 $ 17,247 Net premiums earned 4,492 4,616 4,689 4,482 4,444 18,279 18,223 Claims and claims adjustment expenses incurred 3,770 4,110 3,940 4,103 7,579 15,923 18,514 Underwriting expenses 1,152 1,132 1,063 1,095 1,335 4,442 4,671 Underwriting loss (430) (626) (314) (716) (4,470) (2,086) (4,962)Net investment income Interest and dividends 695 703 675 605 638 2,678 2,574 Alternative investments (87) 55 158 234 253 360 610 Mutual funds - - - - 40 - 29 Other investment income (2) 165 49 60 80 63 354 344 Investment expense (44) (38) (39) (45) (55) (166) (99) Total 729 769 854 874 939 3,226 3,458
Operating income (loss) before net realized capital gains (losses) and other loss 299 143 540 158 (3,531) 1,140 (1,504)Net realized capital gains (losses) 43 35 92 66 53 236 (196)Other loss (4) (1) - - - (5) -
Pre-tax income (loss) $ 338 $ 177 $ 632 $ 224 $ (3,478) $ 1,371 $ (1,700)
Underwriting ratios: Loss ratio 83.9 89.0 84.0 91.5 170.5 87.1 101.6 Expense ratio 25.6 24.5 22.7 24.4 30.0 24.3 25.6 Combined ratio 109.5 113.5 106.7 115.9 200.5 111.4 127.2 Combined ratio excluding significant current year catastrophe-related losses 105.3 103.2 98.2 104.2 198.8 102.7 124.2 Combined ratio excluding significant current year catastrophe-related losses and prior year loss development 103.6 102.1 97.8 102.4 112.0 101.4 102.5 Pre-tax catastrophe-related losses and prior year loss reserve development: Pre-tax catastrophe-related losses $ 191 $ 480 $ 397 $ 529 $ 77 $ 1,597 $ 557 Reinstatement premium related to catastrophes 1 (4) 1 (4) - (6) - Prior year loss reserve development (favorable) / unfavorable 71 45 4 73 3,853 193 3,948 Returned / (additional) premium related to prior year development (19) (25) (91) (37) (26) (172) (8) See Accompanying Notes on Page 29
18
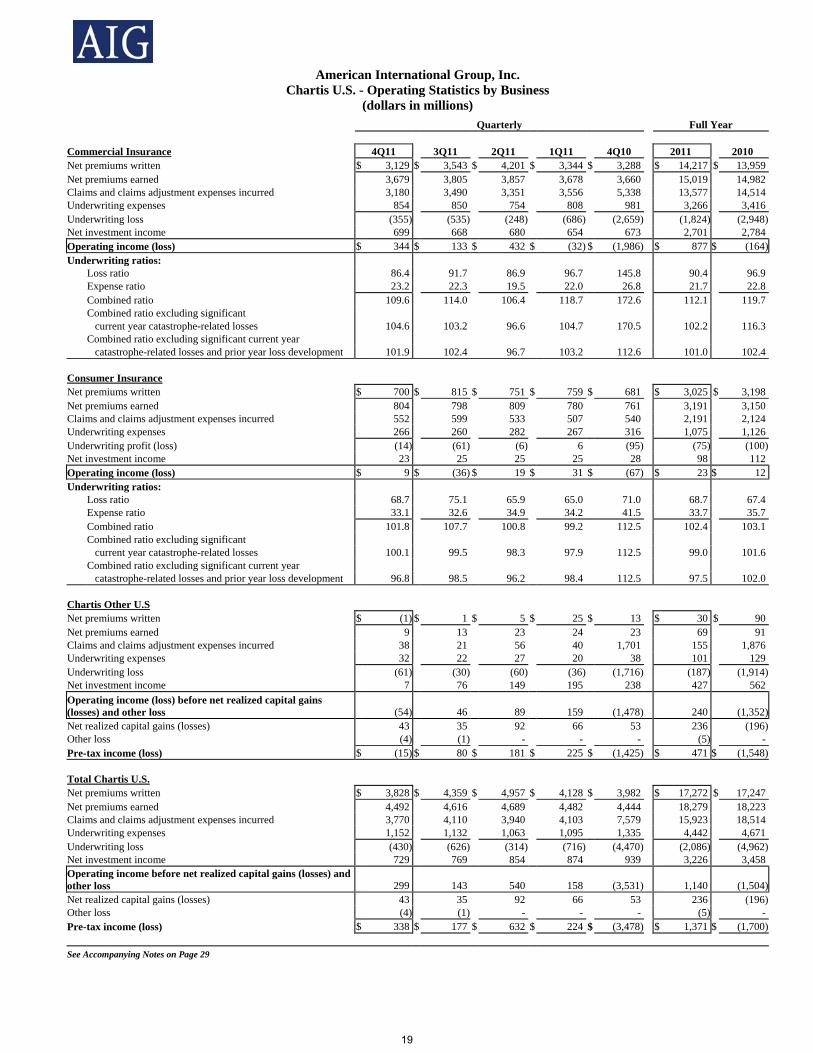
American International Group, Inc.
Chartis U.S. - Operating Statistics by Business (dollars in millions)
Quarterly Full Year
Commercial Insurance 4Q11 3Q11 2Q11 1Q11 4Q10 2011 2010 Net premiums written $ 3,129 $ 3,543 $ 4,201 $ 3,344 $ 3,288 $ 14,217 $ 13,959 Net premiums earned 3,679 3,805 3,857 3,678 3,660 15,019 14,982 Claims and claims adjustment expenses incurred 3,180 3,490 3,351 3,556 5,338 13,577 14,514 Underwriting expenses 854 850 754 808 981 3,266 3,416 Underwriting loss (355) (535) (248) (686) (2,659) (1,824) (2,948)Net investment income 699 668 680 654 673 2,701 2,784 Operating income (loss) $ 344 $ 133 $ 432 $ (32) $ (1,986) $ 877 $ (164)Underwriting ratios: Loss ratio 86.4 91.7 86.9 96.7 145.8 90.4 96.9 Expense ratio 23.2 22.3 19.5 22.0 26.8 21.7 22.8 Combined ratio 109.6 114.0 106.4 118.7 172.6 112.1 119.7 Combined ratio excluding significant current year catastrophe-related losses 104.6 103.2 96.6 104.7 170.5 102.2 116.3 Combined ratio excluding significant current year catastrophe-related losses and prior year loss development 101.9 102.4 96.7 103.2 112.6 101.0 102.4 Consumer Insurance Net premiums written $ 700 $ 815 $ 751 $ 759 $ 681 $ 3,025 $ 3,198 Net premiums earned 804 798 809 780 761 3,191 3,150 Claims and claims adjustment expenses incurred 552 599 533 507 540 2,191 2,124 Underwriting expenses 266 260 282 267 316 1,075 1,126 Underwriting profit (loss) (14) (61) (6) 6 (95) (75) (100)Net investment income 23 25 25 25 28 98 112 Operating income (loss) $ 9 $ (36) $ 19 $ 31 $ (67) $ 23 $ 12 Underwriting ratios: Loss ratio 68.7 75.1 65.9 65.0 71.0 68.7 67.4 Expense ratio 33.1 32.6 34.9 34.2 41.5 33.7 35.7 Combined ratio 101.8 107.7 100.8 99.2 112.5 102.4 103.1 Combined ratio excluding significant current year catastrophe-related losses 100.1 99.5 98.3 97.9 112.5 99.0 101.6 Combined ratio excluding significant current year catastrophe-related losses and prior year loss development 96.8 98.5 96.2 98.4 112.5 97.5 102.0 Chartis Other U.S Net premiums written $ (1) $ 1 $ 5 $ 25 $ 13 $ 30 $ 90 Net premiums earned 9 13 23 24 23 69 91 Claims and claims adjustment expenses incurred 38 21 56 40 1,701 155 1,876 Underwriting expenses 32 22 27 20 38 101 129 Underwriting loss (61) (30) (60) (36) (1,716) (187) (1,914)Net investment income 7 76 149 195 238 427 562 Operating income (loss) before net realized capital gains (losses) and other loss (54) 46 89 159 (1,478) 240 (1,352)Net realized capital gains (losses) 43 35 92 66 53 236 (196)Other loss (4) (1) - - - (5) - Pre-tax income (loss) $ (15) $ 80 $ 181 $ 225 $ (1,425) $ 471 $ (1,548) Total Chartis U.S. Net premiums written $ 3,828 $ 4,359 $ 4,957 $ 4,128 $ 3,982 $ 17,272 $ 17,247 Net premiums earned 4,492 4,616 4,689 4,482 4,444 18,279 18,223 Claims and claims adjustment expenses incurred 3,770 4,110 3,940 4,103 7,579 15,923 18,514 Underwriting expenses 1,152 1,132 1,063 1,095 1,335 4,442 4,671 Underwriting loss (430) (626) (314) (716) (4,470) (2,086) (4,962)Net investment income 729 769 854 874 939 3,226 3,458 Operating income before net realized capital gains (losses) and other loss 299 143 540 158 (3,531) 1,140 (1,504)Net realized capital gains (losses) 43 35 92 66 53 236 (196)Other loss (4) (1) - - - (5) - Pre-tax income (loss) $ 338 $ 177 $ 632 $ 224 $ (3,478) $ 1,371 $ (1,700) See Accompanying Notes on Page 29
19
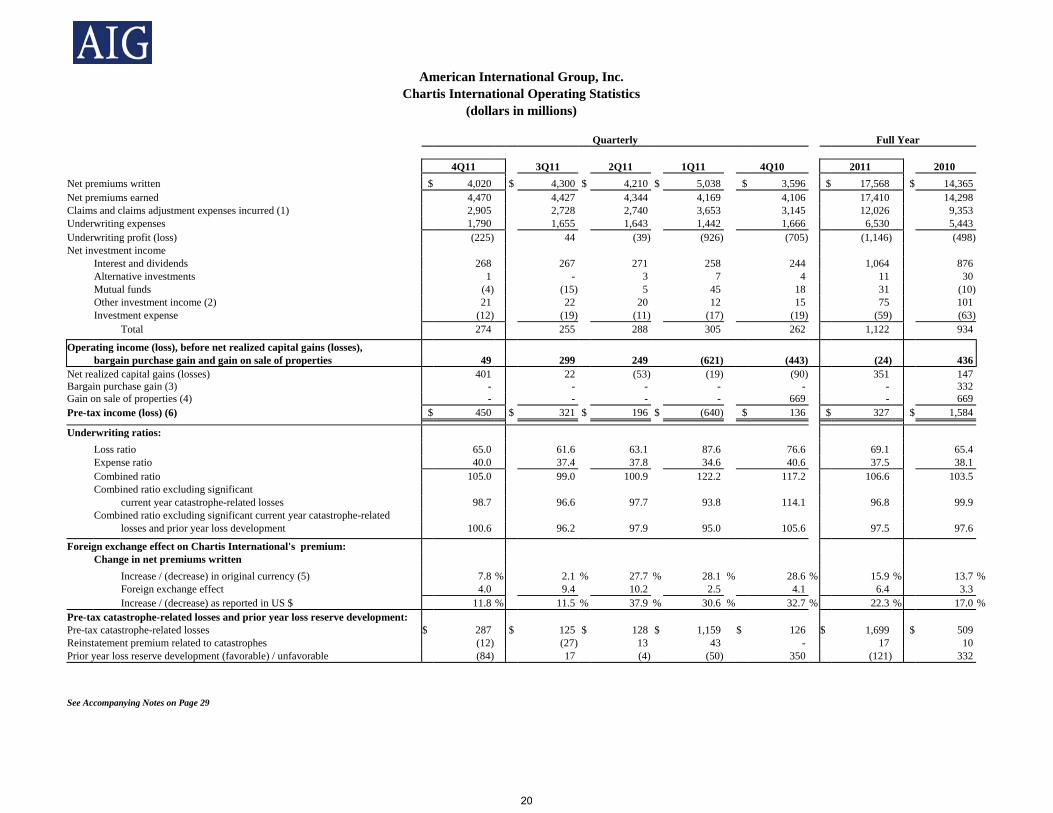
American International Group, Inc.
Chartis International Operating Statistics (dollars in millions)
Quarterly Full Year
4Q11 3Q11 2Q11 1Q11 4Q10 2011 2010 Net premiums written $ 4,020 $ 4,300 $ 4,210 $ 5,038 $ 3,596 $ 17,568 $ 14,365 Net premiums earned 4,470 4,427 4,344 4,169 4,106 17,410 14,298 Claims and claims adjustment expenses incurred (1) 2,905 2,728 2,740 3,653 3,145 12,026 9,353 Underwriting expenses 1,790 1,655 1,643 1,442 1,666 6,530 5,443 Underwriting profit (loss) (225) 44 (39) (926) (705) (1,146) (498) Net investment income Interest and dividends 268 267 271 258 244 1,064 876 Alternative investments 1 - 3 7 4 11 30 Mutual funds (4) (15) 5 45 18 31 (10) Other investment income (2) 21 22 20 12 15 75 101 Investment expense (12) (19) (11) (17) (19) (59) (63) Total 274 255 288 305 262 1,122 934
Operating income (loss), before net realized capital gains (losses), bargain purchase gain and gain on sale of properties 49 299 249 (621) (443) (24) 436 Net realized capital gains (losses) 401 22 (53) (19) (90) 351 147 Bargain purchase gain (3) - - - - - - 332 Gain on sale of properties (4) - - - - 669 - 669 Pre-tax income (loss) (6) $ 450 $ 321 $ 196 $ (640) $ 136 $ 327 $ 1,584
Underwriting ratios: Loss ratio 65.0 61.6 63.1 87.6 76.6 69.1 65.4 Expense ratio 40.0 37.4 37.8 34.6 40.6 37.5 38.1 Combined ratio 105.0 99.0 100.9 122.2 117.2 106.6 103.5 Combined ratio excluding significant current year catastrophe-related losses 98.7 96.6 97.7 93.8 114.1 96.8 99.9 Combined ratio excluding significant current year catastrophe-related losses and prior year loss development 100.6 96.2 97.9 95.0 105.6 97.5 97.6
Foreign exchange effect on Chartis International's premium: Change in net premiums written Increase / (decrease) in original currency (5) 7.8 % 2.1 % 27.7 % 28.1 % 28.6 % 15.9 % 13.7 % Foreign exchange effect 4.0 9.4 10.2 2.5 4.1 6.4 3.3 Increase / (decrease) as reported in US $ 11.8 % 11.5 % 37.9 % 30.6 % 32.7 % 22.3 % 17.0 % Pre-tax catastrophe-related losses and prior year loss reserve development: Pre-tax catastrophe-related losses $ 287 $ 125 $ 128 $ 1,159 $ 126 $ 1,699 $ 509 Reinstatement premium related to catastrophes (12) (27) 13 43 - 17 10 Prior year loss reserve development (favorable) / unfavorable (84) 17 (4) (50) 350 (121) 332
See Accompanying Notes on Page 29
20
American International Group, Inc.
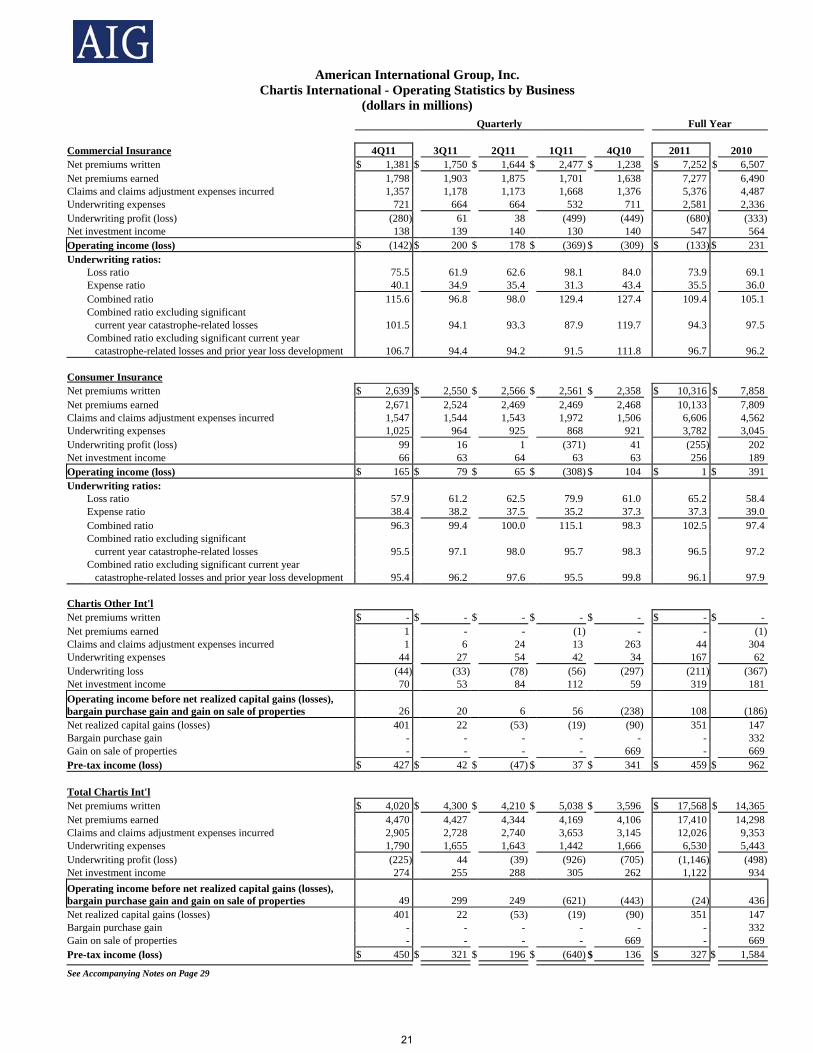
Chartis International - Operating Statistics by Business (dollars in millions)
Quarterly Full Year
Commercial Insurance 4Q11 3Q11 2Q11 1Q11 4Q10 2011 2010 Net premiums written $ 1,381 $ 1,750 $ 1,644 $ 2,477 $ 1,238 $ 7,252 $ 6,507 Net premiums earned 1,798 1,903 1,875 1,701 1,638 7,277 6,490 Claims and claims adjustment expenses incurred 1,357 1,178 1,173 1,668 1,376 5,376 4,487 Underwriting expenses 721 664 664 532 711 2,581 2,336 Underwriting profit (loss) (280) 61 38 (499) (449) (680) (333)Net investment income 138 139 140 130 140 547 564 Operating income (loss) $ (142) $ 200 $ 178 $ (369) $ (309) $ (133) $ 231 Underwriting ratios: Loss ratio 75.5 61.9 62.6 98.1 84.0 73.9 69.1 Expense ratio 40.1 34.9 35.4 31.3 43.4 35.5 36.0 Combined ratio 115.6 96.8 98.0 129.4 127.4 109.4 105.1 Combined ratio excluding significant current year catastrophe-related losses 101.5 94.1 93.3 87.9 119.7 94.3 97.5 Combined ratio excluding significant current year catastrophe-related losses and prior year loss development 106.7 94.4 94.2 91.5 111.8 96.7 96.2 Consumer Insurance Net premiums written $ 2,639 $ 2,550 $ 2,566 $ 2,561 $ 2,358 $ 10,316 $ 7,858 Net premiums earned 2,671 2,524 2,469 2,469 2,468 10,133 7,809 Claims and claims adjustment expenses incurred 1,547 1,544 1,543 1,972 1,506 6,606 4,562 Underwriting expenses 1,025 964 925 868 921 3,782 3,045 Underwriting profit (loss) 99 16 1 (371) 41 (255) 202 Net investment income 66 63 64 63 63 256 189 Operating income (loss) $ 165 $ 79 $ 65 $ (308) $ 104 $ 1 $ 391 Underwriting ratios: Loss ratio 57.9 61.2 62.5 79.9 61.0 65.2 58.4 Expense ratio 38.4 38.2 37.5 35.2 37.3 37.3 39.0 Combined ratio 96.3 99.4 100.0 115.1 98.3 102.5 97.4 Combined ratio excluding significant current year catastrophe-related losses 95.5 97.1 98.0 95.7 98.3 96.5 97.2 Combined ratio excluding significant current year catastrophe-related losses and prior year loss development 95.4 96.2 97.6 95.5 99.8 96.1 97.9 Chartis Other Int'l Net premiums written $ - $ - $ - $ - $ - $ - $ - Net premiums earned 1 - - (1) - - (1)Claims and claims adjustment expenses incurred 1 6 24 13 263 44 304 Underwriting expenses 44 27 54 42 34 167 62 Underwriting loss (44) (33) (78) (56) (297) (211) (367)Net investment income 70 53 84 112 59 319 181 Operating income before net realized capital gains (losses), bargain purchase gain and gain on sale of properties 26 20 6 56 (238) 108 (186)Net realized capital gains (losses) 401 22 (53) (19) (90) 351 147 Bargain purchase gain - - - - - - 332 Gain on sale of properties - - - - 669 - 669 Pre-tax income (loss) $ 427 $ 42 $ (47) $ 37 $ 341 $ 459 $ 962
Total Chartis Int'l Net premiums written $ 4,020 $ 4,300 $ 4,210 $ 5,038 $ 3,596 $ 17,568 $ 14,365 Net premiums earned 4,470 4,427 4,344 4,169 4,106 17,410 14,298 Claims and claims adjustment expenses incurred 2,905 2,728 2,740 3,653 3,145 12,026 9,353 Underwriting expenses 1,790 1,655 1,643 1,442 1,666 6,530 5,443 Underwriting profit (loss) (225) 44 (39) (926) (705) (1,146) (498)Net investment income 274 255 288 305 262 1,122 934 Operating income before net realized capital gains (losses), bargain purchase gain and gain on sale of properties 49 299 249 (621) (443) (24) 436 Net realized capital gains (losses) 401 22 (53) (19) (90) 351 147 Bargain purchase gain - - - - - - 332 Gain on sale of properties - - - - 669 - 669 Pre-tax income (loss) $ 450 $ 321 $ 196 $ (640) $ 136 $ 327 $ 1,584
See Accompanying Notes on Page 29
21
American International Group, Inc.
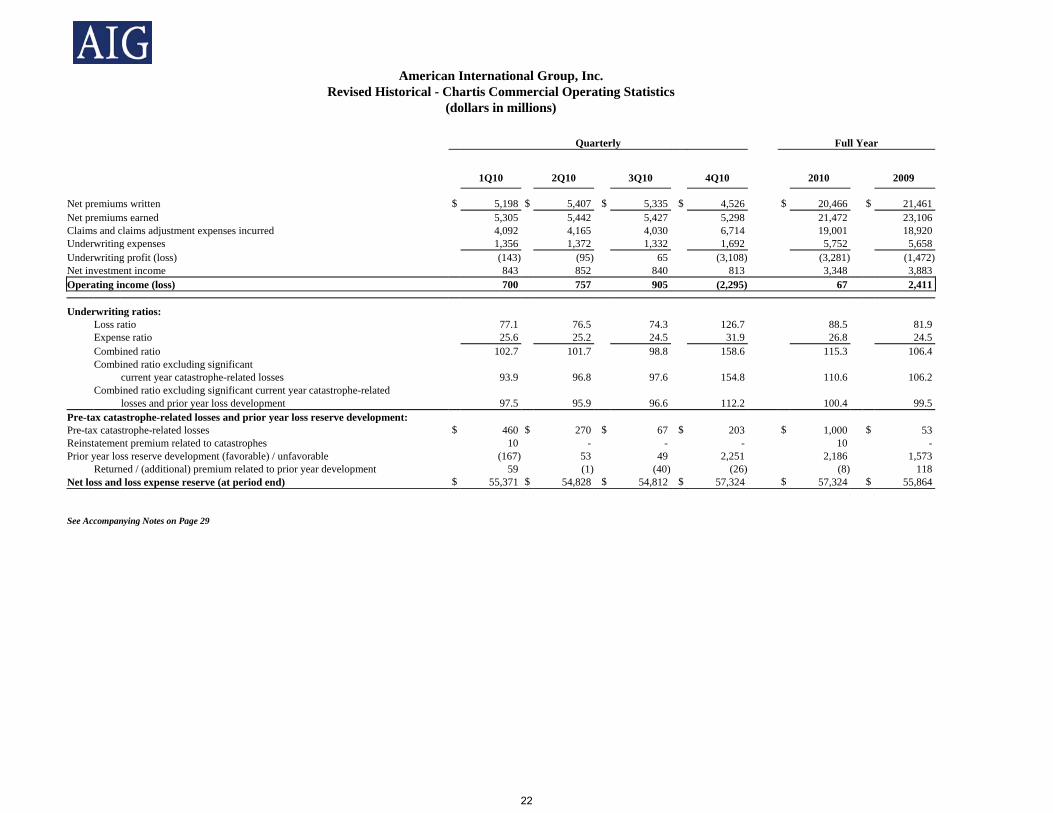
Revised Historical - Chartis Commercial Operating Statistics (dollars in millions)
Quarterly Full Year
1Q10 2Q10 3Q10 4Q10 2010 2009
Net premiums written $ 5,198 $ 5,407 $ 5,335 $ 4,526 $ 20,466 $ 21,461 Net premiums earned 5,305 5,442 5,427 5,298 21,472 23,106 Claims and claims adjustment expenses incurred 4,092 4,165 4,030 6,714 19,001 18,920 Underwriting expenses 1,356 1,372 1,332 1,692 5,752 5,658 Underwriting profit (loss) (143) (95) 65 (3,108) (3,281) (1,472) Net investment income 843 852 840 813 3,348 3,883 Operating income (loss) 700 757 905 (2,295) 67 2,411
Underwriting ratios: Loss ratio 77.1 76.5 74.3 126.7 88.5 81.9 Expense ratio 25.6 25.2 24.5 31.9 26.8 24.5 Combined ratio 102.7 101.7 98.8 158.6 115.3 106.4 Combined ratio excluding significant current year catastrophe-related losses 93.9 96.8 97.6 154.8 110.6 106.2 Combined ratio excluding significant current year catastrophe-related losses and prior year loss development 97.5 95.9 96.6 112.2 100.4 99.5 Pre-tax catastrophe-related losses and prior year loss reserve development: Pre-tax catastrophe-related losses $ 460 $ 270 $ 67 $ 203 $ 1,000 $ 53 Reinstatement premium related to catastrophes 10 - - - 10 - Prior year loss reserve development (favorable) / unfavorable (167) 53 49 2,251 2,186 1,573 Returned / (additional) premium related to prior year development 59 (1) (40) (26) (8) 118 Net loss and loss expense reserve (at period end) $ 55,371 $ 54,828 $ 54,812 $ 57,324 $ 57,324 $ 55,864 See Accompanying Notes on Page 29
22

American International Group, Inc.
Revised Historical - Chartis Consumer Operating Statistics (dollars in millions)
Quarterly Full Year
1Q10 2Q10 3Q10 4Q10 2010 2009
Net premiums written $ 2,427 $ 2,367 $ 3,223 $ 3,039 $ 11,056 $ 9,096 Net premiums earned 2,313 2,269 3,148 3,229 10,959 9,055 Claims and claims adjustment expenses incurred 1,349 1,351 1,940 2,046 6,686 5,315 Underwriting expenses 972 901 1,061 1,237 4,171 3,690 Underwriting profit (loss) (8) 17 147 (54) 102 50 Net investment income 68 59 83 91 301 351 Operating income (loss) 60 76 230 37 403 401
Underwriting ratios: Loss ratio 58.3 59.5 61.6 63.4 61.0 58.7 Expense ratio 42.0 39.7 33.7 38.3 38.1 40.8 Combined ratio 100.3 99.2 95.3 101.7 99.1 99.5 Combined ratio excluding significant current year catastrophe-related losses 99.0 97.9 95.1 101.7 98.5 99.5 Combined ratio excluding significant current year catastrophe-related losses and prior year loss development 99.8 98.1 95.4 102.7 99.1 98.7 Pre-tax catastrophe-related losses and prior year loss reserve development: Pre-tax catastrophe-related losses $ 31 $ 30 $ 5 $ - $ 66 $ - Reinstatement premium related to catastrophes - - - - - - Prior year loss reserve development (favorable) / unfavorable (18) (4) (8) (36) (66) 75 Returned / (additional) premium related to prior year development - - - - - - Net loss and loss expense reserve (at period end) $ 4,845 $ 4,768 $ 5,070 $ 5,030 $ 5,030 $ 3,428 See Accompanying Notes on Page 29
23
American International Group, Inc.
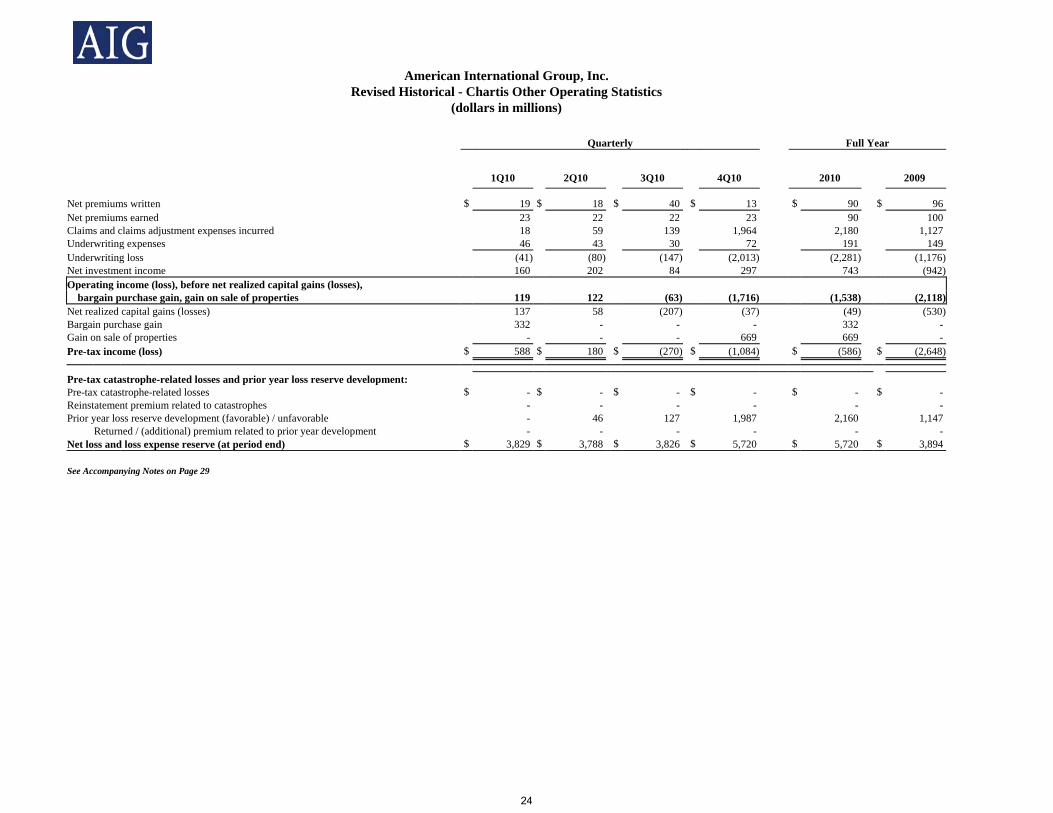
Revised Historical - Chartis Other Operating Statistics (dollars in millions)
Quarterly Full Year
1Q10 2Q10 3Q10 4Q10 2010 2009
Net premiums written $ 19 $ 18 $ 40 $ 13 $ 90 $ 96 Net premiums earned 23 22 22 23 90 100 Claims and claims adjustment expenses incurred 18 59 139 1,964 2,180 1,127 Underwriting expenses 46 43 30 72 191 149 Underwriting loss (41) (80) (147) (2,013) (2,281) (1,176) Net investment income 160 202 84 297 743 (942) Operating income (loss), before net realized capital gains (losses), bargain purchase gain, gain on sale of properties 119 122 (63) (1,716) (1,538) (2,118) Net realized capital gains (losses) 137 58 (207) (37) (49) (530) Bargain purchase gain 332 - - - 332 - Gain on sale of properties - - - 669 669 - Pre-tax income (loss) $ 588 $ 180 $ (270) $ (1,084) $ (586) $ (2,648)
Pre-tax catastrophe-related losses and prior year loss reserve development: Pre-tax catastrophe-related losses $ - $ - $ - $ - $ - $ - Reinstatement premium related to catastrophes - - - - - - Prior year loss reserve development (favorable) / unfavorable - 46 127 1,987 2,160 1,147 Returned / (additional) premium related to prior year development - - - - - - Net loss and loss expense reserve (at period end) $ 3,829 $ 3,788 $ 3,826 $ 5,720 $ 5,720 $ 3,894 See Accompanying Notes on Page 29
24
American International Group, Inc.
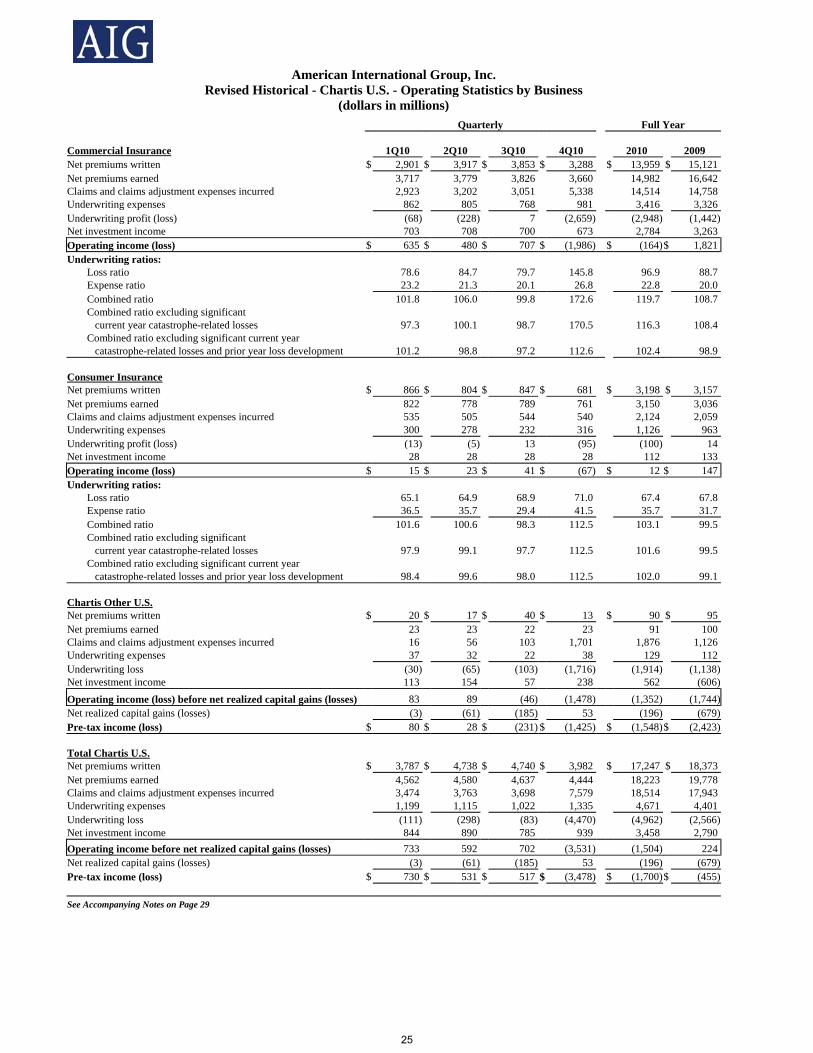
Revised Historical - Chartis U.S. - Operating Statistics by Business (dollars in millions)
Quarterly Full Year
Commercial Insurance 1Q10 2Q10 3Q10 4Q10 2010 2009 Net premiums written $ 2,901 $ 3,917 $ 3,853 $ 3,288 $ 13,959 $ 15,121 Net premiums earned 3,717 3,779 3,826 3,660 14,982 16,642 Claims and claims adjustment expenses incurred 2,923 3,202 3,051 5,338 14,514 14,758 Underwriting expenses 862 805 768 981 3,416 3,326 Underwriting profit (loss) (68) (228) 7 (2,659) (2,948) (1,442)Net investment income 703 708 700 673 2,784 3,263 Operating income (loss) $ 635 $ 480 $ 707 $ (1,986) $ (164)$ 1,821 Underwriting ratios: Loss ratio 78.6 84.7 79.7 145.8 96.9 88.7 Expense ratio 23.2 21.3 20.1 26.8 22.8 20.0 Combined ratio 101.8 106.0 99.8 172.6 119.7 108.7 Combined ratio excluding significant current year catastrophe-related losses 97.3 100.1 98.7 170.5 116.3 108.4 Combined ratio excluding significant current year catastrophe-related losses and prior year loss development 101.2 98.8 97.2 112.6 102.4 98.9 Consumer Insurance Net premiums written $ 866 $ 804 $ 847 $ 681 $ 3,198 $ 3,157 Net premiums earned 822 778 789 761 3,150 3,036 Claims and claims adjustment expenses incurred 535 505 544 540 2,124 2,059 Underwriting expenses 300 278 232 316 1,126 963 Underwriting profit (loss) (13) (5) 13 (95) (100) 14 Net investment income 28 28 28 28 112 133 Operating income (loss) $ 15 $ 23 $ 41 $ (67) $ 12 $ 147 Underwriting ratios: Loss ratio 65.1 64.9 68.9 71.0 67.4 67.8 Expense ratio 36.5 35.7 29.4 41.5 35.7 31.7 Combined ratio 101.6 100.6 98.3 112.5 103.1 99.5 Combined ratio excluding significant current year catastrophe-related losses 97.9 99.1 97.7 112.5 101.6 99.5 Combined ratio excluding significant current year catastrophe-related losses and prior year loss development 98.4 99.6 98.0 112.5 102.0 99.1 Chartis Other U.S. Net premiums written $ 20 $ 17 $ 40 $ 13 $ 90 $ 95 Net premiums earned 23 23 22 23 91 100 Claims and claims adjustment expenses incurred 16 56 103 1,701 1,876 1,126 Underwriting expenses 37 32 22 38 129 112 Underwriting loss (30) (65) (103) (1,716) (1,914) (1,138)Net investment income 113 154 57 238 562 (606)Operating income (loss) before net realized capital gains (losses) 83 89 (46) (1,478) (1,352) (1,744)Net realized capital gains (losses) (3) (61) (185) 53 (196) (679)Pre-tax income (loss) $ 80 $ 28 $ (231) $ (1,425) $ (1,548)$ (2,423) Total Chartis U.S. Net premiums written $ 3,787 $ 4,738 $ 4,740 $ 3,982 $ 17,247 $ 18,373 Net premiums earned 4,562 4,580 4,637 4,444 18,223 19,778 Claims and claims adjustment expenses incurred 3,474 3,763 3,698 7,579 18,514 17,943 Underwriting expenses 1,199 1,115 1,022 1,335 4,671 4,401 Underwriting loss (111) (298) (83) (4,470) (4,962) (2,566)Net investment income 844 890 785 939 3,458 2,790 Operating income before net realized capital gains (losses) 733 592 702 (3,531) (1,504) 224 Net realized capital gains (losses) (3) (61) (185) 53 (196) (679)Pre-tax income (loss) $ 730 $ 531 $ 517 $ (3,478) $ (1,700)$ (455) See Accompanying Notes on Page 29
25
American International Group, Inc.
Revised Historical - Chartis International - Operating Statistics by Business (dollars in millions)
Quarterly Full Year
Commercial Insurance 1Q10 2Q10 3Q10 4Q10 2010 2009 Net premiums written $ 2,297 $ 1,490 $ 1,482 $ 1,238 $ 6,507 $ 6,340 Net premiums earned 1,588 1,663 1,601 1,638 6,490 6,464 Claims and claims adjustment expenses incurred 1,169 963 979 1,376 4,487 4,162 Underwriting expenses 494 567 564 711 2,336 2,332 Underwriting profit (loss) (75) 133 58 (449) (333) (30)Net investment income 140 144 140 140 564 620 Operating income (loss) $ 65 $ 277 $ 198 $ (309) $ 231 $ 590 Underwriting ratios: Loss ratio 73.6 57.9 61.1 84.0 69.1 64.4 Expense ratio 31.1 34.1 35.2 43.4 36.0 36.1 Combined ratio 104.7 92.0 96.3 127.4 105.1 100.5 Combined ratio excluding significant current year catastrophe-related losses 85.9 89.2 94.8 119.7 97.5 100.5 Combined ratio excluding significant current year catastrophe-related losses and prior year loss development 88.4 89.2 95.2 111.8 96.2 101.3 Consumer Insurance Net premiums written $ 1,561 $ 1,563 $ 2,376 $ 2,358 $ 7,858 $ 5,939 Net premiums earned 1,491 1,491 2,359 2,468 7,809 6,019 Claims and claims adjustment expenses incurred 814 846 1,396 1,506 4,562 3,256 Underwriting expenses 672 623 829 921 3,045 2,727 Underwriting profit 5 22 134 41 202 36 Net investment income 40 31 55 63 189 218 Operating income (loss) $ 45 $ 53 $ 189 $ 104 $ 391 $ 254 Underwriting ratios: Loss ratio 54.6 56.7 59.2 61.0 58.4 54.1 Expense ratio 45.1 41.8 35.1 37.3 39.0 45.3 Combined ratio 99.7 98.5 94.3 98.3 97.4 99.4 Combined ratio excluding significant current year catastrophe-related losses 99.6 97.3 94.3 98.3 97.2 99.4 Combined ratio excluding significant current year catastrophe-related losses and prior year loss development 100.6 97.3 94.5 99.8 97.9 98.4 Chartis Other Int'l Net premiums written $ (1) $ 1 $ - $ - $ - $ 1 Net premiums earned - (1) - - (1) - Claims and claims adjustment expenses incurred 2 3 36 263 304 1 Underwriting expenses 9 11 8 34 62 37 Underwriting loss (11) (15) (44) (297) (367) (38)Net investment income 47 48 27 59 181 (336)Operating income before net realized capital gains (losses), bargain purchase gain and gain on sale of properties 36 33 (17) (238) (186) (374)Net realized capital gains (losses) 140 119 (22) (90) 147 149 Bargain purchase gain 332 - - - 332 - Gain on sale of properties - - - 669 669 - Pre-tax income (loss) $ 508 $ 152 $ (39) $ 341 $ 962 $ (225)
Total Chartis Int'l Net premiums written $ 3,857 $ 3,054 $ 3,858 $ 3,596 $ 14,365 $ 12,280 Net premiums earned 3,079 3,153 3,960 4,106 14,298 12,483 Claims and claims adjustment expenses incurred 1,985 1,812 2,411 3,145 9,353 7,419 Underwriting expenses 1,175 1,201 1,401 1,666 5,443 5,096 Underwriting profit (loss) (81) 140 148 (705) (498) (32)Net investment income 227 223 222 262 934 502 Operating income before net realized capital gains (losses), bargain purchase gain and gain on sale of properties 146 363 370 (443) 436 470 Net realized capital gains (losses) 140 119 (22) (90) 147 149 Bargain purchase gain 332 - - - 332 - Gain on sale of properties - - - 669 669 - Pre-tax income (loss) $ 618 $ 482 $ 348 $ 136 $ 1,584 $ 619
See Accompanying Notes on Page 29
26

Chartis – Worldwide Net Premiums Written (NPW) by Line of ( )Business & Region(dollars in millions)
2010 Worldwide NPW by Line of Business = $31,612Commercial – 65% and Consumer – 35%
2011 Worldwide NPW by Line of Business = $34,840Commercial – 62% and Consumer – 38%
17%
17%13%
10%
11% A&H
Personal Lines
Life
Casualty
17%12%
10% A&H
Personal Lines
Life
Casualty17%
1%31%
13% Casualty
Financial Lines
Property
Specialty
19%
2%28%
12% Casualty
Financial Lines
Property
Specialty
9% U.S. & Canada
2010 Worldwide NPW by Region
9% U.S. & Canada
2011 Worldwide NPW by Region
55%
18%
18%Europe
Far East
50%
17%
24%Europe
Far East
1
Growth Economies17%
Growth Economies
27
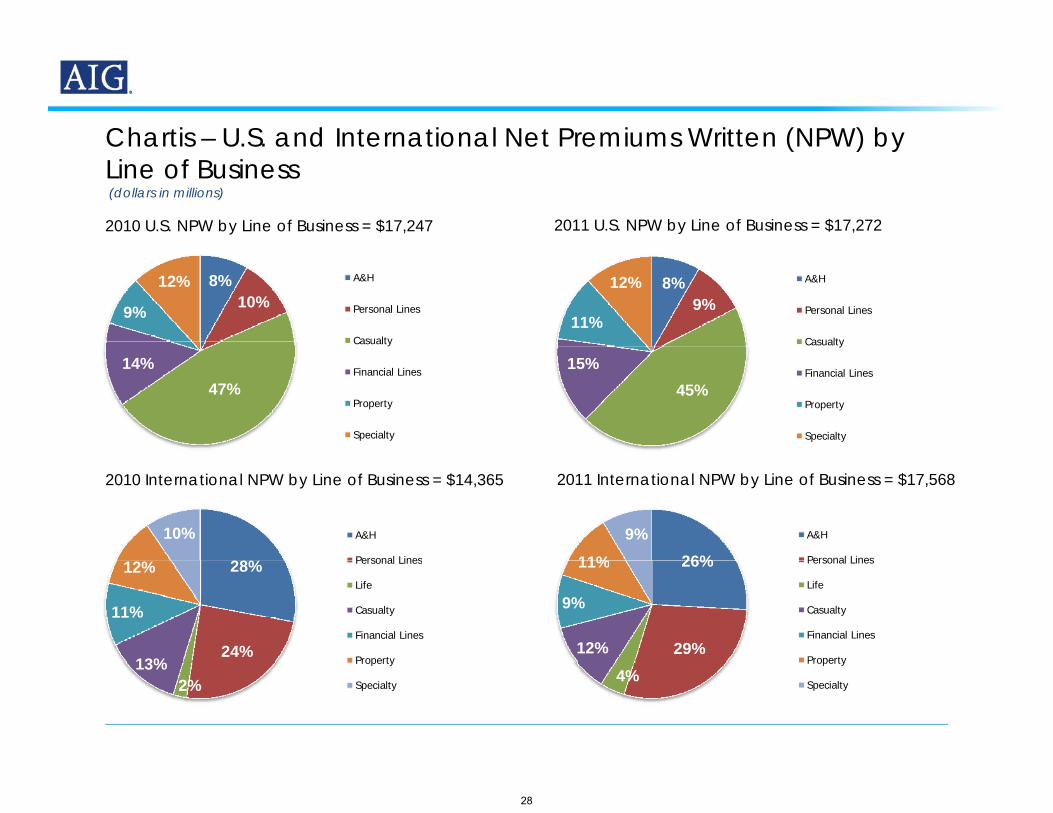
Chartis – U.S. and International Net Premiums Written (NPW) by ( ) yLine of Business(dollars in millions)
2010 U.S. NPW by Line of Business = $17,247 2011 U.S. NPW by Line of Business = $17,272
8%10%9%
12% A&H
Personal Lines
Casualty
8%9%
11%
12% A&H
Personal Lines
Casualty
47%14%
Financial Lines
Property
Specialty
45%15%
Financial Lines
Property
Specialty
28%
10% A&H
Personal Lines
2010 International NPW by Line of Business = $14,365
26%11%9% A&H
Personal Lines
2011 International NPW by Line of Business = $17,568
28%
24%13%
11%
12% Personal Lines
Life
Casualty
Financial Lines
Property
26%
29%12%
9%
11% Personal Lines
Life
Casualty
Financial Lines
Property
2
2%13% Property
Specialty4%
Property
Specialty
28

American International Group, Inc.
Chartis - Notes
Chartis, AIG’s property and casualty insurance operation, manages its business in two operating segments – Commercial Insurance and Consumer Insurance – as well as a Chartis Other operations category. Effective January 17, 2012 Chartis has aligned its geographic structure to enhance execution of its commercial and consumer strategies and to add greater focus on its growth economies initiatives. Under this framework, Chartis is organized under three major geographic areas: the Americas, Asia Pacific, and EMEA (Europe, Middle East and Africa). Previously, Chartis was organized into four principal regions: U.S, and Canada, Europe, Far East, and Growth Economies.
Commercial Insurance is distributed primarily through global, regional and local brokers, agents and wholesalers. Major lines of businesses include casualty, property, specialty (including aerospace, environmental, marine, export credit and political risk coverages, and various product offerings to small and medium enterprises (SME)) and financial lines. Consumer Insurance primarily sells its products to individual consumers or groups of consumers through insurance brokers, agents, direct-to-customer, and affinity groups. Offerings within Consumer Insurance include accident and health (A&H), personal lines, and life insurance. Chartis Other consists primarily of certain run-off lines of business, including Excess Workers’ Compensation and Asbestos, certain Chartis expenses relating to global corporate initiatives, expense allocations from AIG Parent, net investment income allocations not attributable to the Commercial Insurance or Consumer Insurance segments, realized capital gains and losses (including foreign exchange transactions), the 2010 bargain purchase gain relating the purchase of Fuji and gains relating to the sale of properties.
Chartis has historically assessed the performance of its operating segments based in part on underwriting profit, loss ratio, expense ratio and combined ratio. Chartis believes these metrics provide long-term measures of the performance of the business compared to historical results and peer companies. In addition, Chartis is developing new value based metrics that provide management shorter-term measures to evaluate its performance across multiple lines and various countries. As an example, Chartis has implemented a risk-adjusted profitability model as a business performance measure, which it will continue to refine. Along with underwriting results, this risk-adjusted profitability model incorporates elements of capital allocations, costs of capital and net investment income. Chartis believes that such performance measures will allow it to manage changes in its business mix.
During the first quarter of 2011, as part of its on-going initiatives to reduce exposure to capital intensive long-tail lines, Chartis determined to cease writing Excess Workers’ Compensation business as a stand-alone product. Based on this decision, Chartis further determined that this legacy line would be included in Chartis Other and not included in the ongoing Commercial Insurance operating results. As it relates to asbestos, beginning in 1985, standard Chartis policies contained an absolute exclusion for asbestos related exposure. Asbestos has historically been included in Chartis Other. On June 17, 2011 and retroactive to January 1, 2011, Chartis completed a transaction with National Indemnity Insurance Company (NICO) under which a majority of the Chartis domestic asbestos exposures were transferred to NICO. Chartis paid NICO $1.67 billion as consideration for this transfer and NICO assumed $1.82 billion of net asbestos liabilities, with an aggregate limit of $3.5 billion. As a result, Chartis recorded a deferred gain of approximately $150 million in the second quarter of 2011, which is being amortized into the Chartis Other operating results as the underlying claims are settled. Reclassifications:
Beginning in the fourth quarter of 2011, investment income is being allocated to the Commercial Insurance and Consumer Insurance segments based on an internal investment income allocation model. The model estimates investable funds based upon the loss reserves, unearned premium and a capital allocation for each segment. The investment income allocation is calculated based on the estimated investable funds and risk-free yields (plus an illiquidity premium) consistent with the approximate duration of the liabilities. The actual yields in excess of the allocated amounts and the investment income from the assets not attributable to the Commercial Insurance and Consumer Insurance segments are assigned to Chartis Other. Prior period amounts have been reclassified to conform with the current period presentation.
Additionally, reclassifications have been made to the Chartis Commercial and Chartis Other segments. The Claims and claims adjustment expenses incurred and the corresponding underwriting ratios for 4Q10 and Full Year
2010 as well as the Net loss and loss expense reserve for all periods presented have been impacted. These reclassifications did not impact the overall Chartis amounts previously reported.
Additional noteworthy items are as follows:
(1) Results include changes in future policy benefits for certain A&H insurance contracts and Fuji life insurance. (2) Other investment income is comprised principally of real estate income, changes in market value, and income (loss) from equity method investments. (3) Bargain purchase gain of $332 million related to the acquisition of Fuji on March 31, 2010. (4) In May 2009, AIG completed the sale of its interest in the AIG Otemachi Building in Japan, including the lands and development rights. Approximately fifty percent of these interests were held by
Chartis subsidiaries with the remainder included in AIG’s Other operations category. Although the transaction qualified as a legal sale, it did not qualify as a sale for U.S. GAAP purposes due to AIG’s continued involvement as a lessee, primarily in the form of a lease deposit. As the leases expired in December 2010, and AIG vacated the building, the gain of approximately $1.3 billion was recognized in AIG’s earnings, of which $669 million was included in the Chartis results.
(5) Computed using a constant exchange rate for each period. (6) Income statement accounts expressed in non-U.S. functional currencies are translated into U.S. dollars using average exchange rates.
29

American International Group, Inc.
SunAmerica Financial Group Operating Statistics (dollars in millions)
Quarterly Full Year
4Q11 3Q11 2Q11 1Q11 4Q10 2011 2010 Premiums, deposits and other considerations (1) $ 5,722 $ 5,746 $ 6,144 $ 6,226 $ 4,943 $ 23,838 $ 19,086
Revenues: Premiums $ 639 $ 591 $ 662 $ 621 $ 600 $ 2,513 $ 2,520 Policy fees 681 658 682 684 732 2,705 2,710 Net investment income: Interest and dividends (2) 2,372 2,247 2,099 2,325 2,257 9,043 9,380 Call and tender income 24 67 97 34 140 222 418 Alternative investments 31 89 309 413 378 842 963 Other (3) 12 (46) 13 41 49 20 176 Investment expenses (67) (62) (57) (59) (47) (245) (169) Total net investment income 2,372 2,295 2,461 2,754 2,777 9,882 10,768 Other income (4) 209 - - - - 209 - Total revenues excluding net realized capital gains (losses) 3,901 3,544 3,805 4,059 4,109 15,309 15,998 Benefits and expenses: Policyholder benefits and claims incurred 1,197 1,190 1,212 1,015 1,005 4,614 4,276 Interest credited 1,097 1,134 1,110 1,105 1,119 4,446 4,480 Amortization of deferred policy acquisition costs 225 360 303 340 366 1,228 1,275 Non deferrable commissions 125 125 122 120 123 492 467 General operating expenses 326 291 315 336 453 1,268 1,452 Total benefits and expenses 2,970 3,100 3,062 2,916 3,066 12,048 11,950
Operating income excluding net realized capital gains (losses) and related amortization of acquisition costs, VOBA and sales inducements 931 444 743 1,143 1,043 3,261 4,048
Benefit (amortization) of DAC, VOBA and SIA related to net realized capital gains (losses) (142) (173) (59) 17 (235) (357) (85) Net realized capital gains (losses) 97 38 91 (220) 491 6 (1,251) Pre-tax income $ 886 $ 309 $ 775 $ 940 $ 1,299 $ 2,910 $ 2,712
Assets under management: Total invested assets $ 189,804 $ 188,236 $ 182,915 $ 181,795 $ 179,099 $ 189,804 $ 179,099 Separate account reserves 51,383 48,107 56,098 56,464 54,427 51,383 54,427 Group retirement mutual funds 9,516 8,563 9,815 9,624 9,032 9,516 9,032 Retail mutual funds 6,221 5,718 6,041 6,059 5,975 6,221 5,975 Total assets under management $ 256,924 $ 250,624 $ 254,869 $ 253,942 $ 248,533 $ 256,924 $ 248,533
Investment yield: Base yield (5) 5.44 % 5.49 % 5.41 % 5.04 % 5.30 % 5.34 % 5.46 % Alternative investments (6) (0.24)% (0.11) % 0.39 % 0.62 % 0.49 % 0.17 % 0.17 % Other enhancements (7) 0.13 % (0.17) % (0.16) % 0.70 % 0.66 % 0.12 % 0.70 % Total 5.33 % 5.21 % 5.64 % 6.36 % 6.45 % 5.63 % 6.33 % See Accompanying Notes on Pages 43 and 44
30
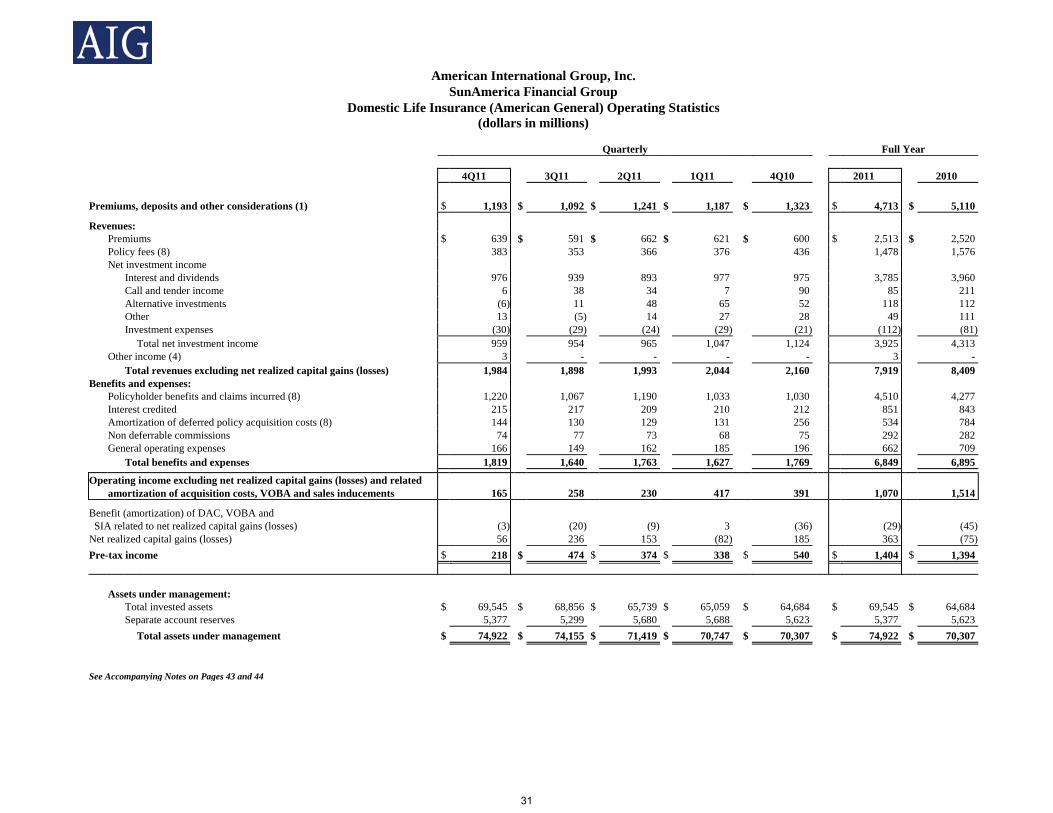
American International Group, Inc. SunAmerica Financial Group Domestic Life Insurance (American General) Operating Statistics (dollars in millions)
Quarterly Full Year 4Q11 3Q11 2Q11 1Q11 4Q10 2011 2010 Premiums, deposits and other considerations (1) $ 1,193 $ 1,092 $ 1,241 $ 1,187 $ 1,323 $ 4,713 $ 5,110
Revenues: Premiums $ 639 $ 591 $ 662 $ 621 $ 600 $ 2,513 $ 2,520 Policy fees (8) 383 353 366 376 436 1,478 1,576 Net investment income Interest and dividends 976 939 893 977 975 3,785 3,960 Call and tender income 6 38 34 7 90 85 211 Alternative investments (6) 11 48 65 52 118 112 Other 13 (5) 14 27 28 49 111 Investment expenses (30) (29) (24) (29) (21) (112) (81) Total net investment income 959 954 965 1,047 1,124 3,925 4,313 Other income (4) 3 - - - - 3 - Total revenues excluding net realized capital gains (losses) 1,984 1,898 1,993 2,044 2,160 7,919 8,409 Benefits and expenses: Policyholder benefits and claims incurred (8) 1,220 1,067 1,190 1,033 1,030 4,510 4,277 Interest credited 215 217 209 210 212 851 843 Amortization of deferred policy acquisition costs (8) 144 130 129 131 256 534 784 Non deferrable commissions 74 77 73 68 75 292 282 General operating expenses 166 149 162 185 196 662 709 Total benefits and expenses 1,819 1,640 1,763 1,627 1,769 6,849 6,895
Operating income excluding net realized capital gains (losses) and related amortization of acquisition costs, VOBA and sales inducements 165 258 230 417 391 1,070 1,514
Benefit (amortization) of DAC, VOBA and SIA related to net realized capital gains (losses) (3) (20) (9) 3 (36) (29) (45) Net realized capital gains (losses) 56 236 153 (82) 185 363 (75) Pre-tax income $ 218 $ 474 $ 374 $ 338 $ 540 $ 1,404 $ 1,394 Assets under management: Total invested assets $ 69,545 $ 68,856 $ 65,739 $ 65,059 $ 64,684 $ 69,545 $ 64,684 Separate account reserves 5,377 5,299 5,680 5,688 5,623 5,377 5,623 Total assets under management $ 74,922 $ 74,155 $ 71,419 $ 70,747 $ 70,307 $ 74,922 $ 70,307 See Accompanying Notes on Pages 43 and 44
31
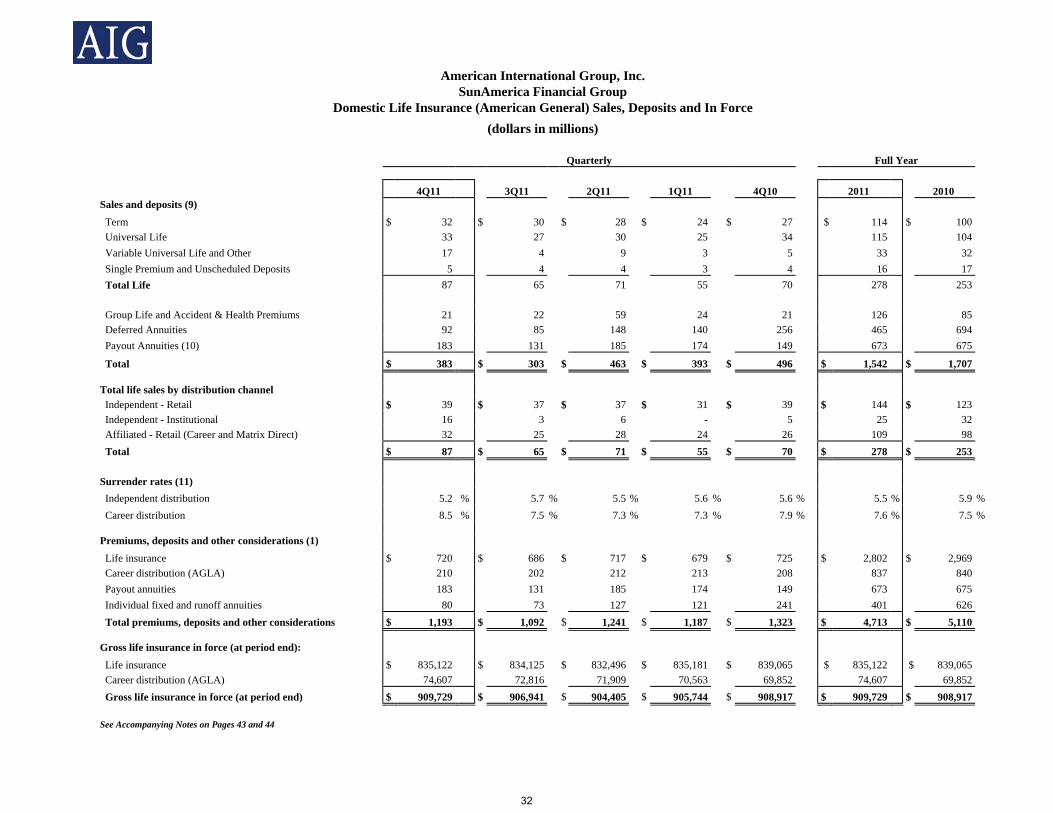
American International Group, Inc. SunAmerica Financial Group Domestic Life Insurance (American General) Sales, Deposits and In Force (dollars in millions)
Quarterly Full Year
4Q11 3Q11 2Q11 1Q11 4Q10 2011 2010 Sales and deposits (9) Term $ 32 $ 30 $ 28 $ 24 $ 27 $ 114 $ 100 Universal Life 33 27 30 25 34 115 104 Variable Universal Life and Other 17 4 9 3 5 33 32 Single Premium and Unscheduled Deposits 5 4 4 3 4 16 17 Total Life 87 65 71 55 70 278 253 Group Life and Accident & Health Premiums 21 22 59 24 21 126 85 Deferred Annuities 92 85 148 140 256 465 694 Payout Annuities (10) 183 131 185 174 149 673 675
Total $ 383 $ 303 $ 463 $ 393 $ 496 $ 1,542 $ 1,707 Total life sales by distribution channel Independent - Retail $ 39 $ 37 $ 37 $ 31 $ 39 $ 144 $ 123 Independent - Institutional 16 3 6 - 5 25 32 Affiliated - Retail (Career and Matrix Direct) 32 25 28 24 26 109 98 Total $ 87 $ 65 $ 71 $ 55 $ 70 $ 278 $ 253 Surrender rates (11) Independent distribution 5.2 % 5.7 % 5.5 % 5.6 % 5.6 % 5.5 % 5.9 % Career distribution 8.5 % 7.5 % 7.3 % 7.3 % 7.9 % 7.6 % 7.5 % Premiums, deposits and other considerations (1) Life insurance $ 720 $ 686 $ 717 $ 679 $ 725 $ 2,802 $ 2,969 Career distribution (AGLA) 210 202 212 213 208 837 840 Payout annuities 183 131 185 174 149 673 675 Individual fixed and runoff annuities 80 73 127 121 241 401 626 Total premiums, deposits and other considerations $ 1,193 $ 1,092 $ 1,241 $ 1,187 $ 1,323 $ 4,713 $ 5,110 Gross life insurance in force (at period end): Life insurance $ 835,122 $ 834,125 $ 832,496 $ 835,181 $ 839,065 $ 835,122 $ 839,065 Career distribution (AGLA) 74,607 72,816 71,909 70,563 69,852 74,607 69,852 Gross life insurance in force (at period end) $ 909,729 $ 906,941 $ 904,405 $ 905,744 $ 908,917 $ 909,729 $ 908,917 See Accompanying Notes on Pages 43 and 44
32
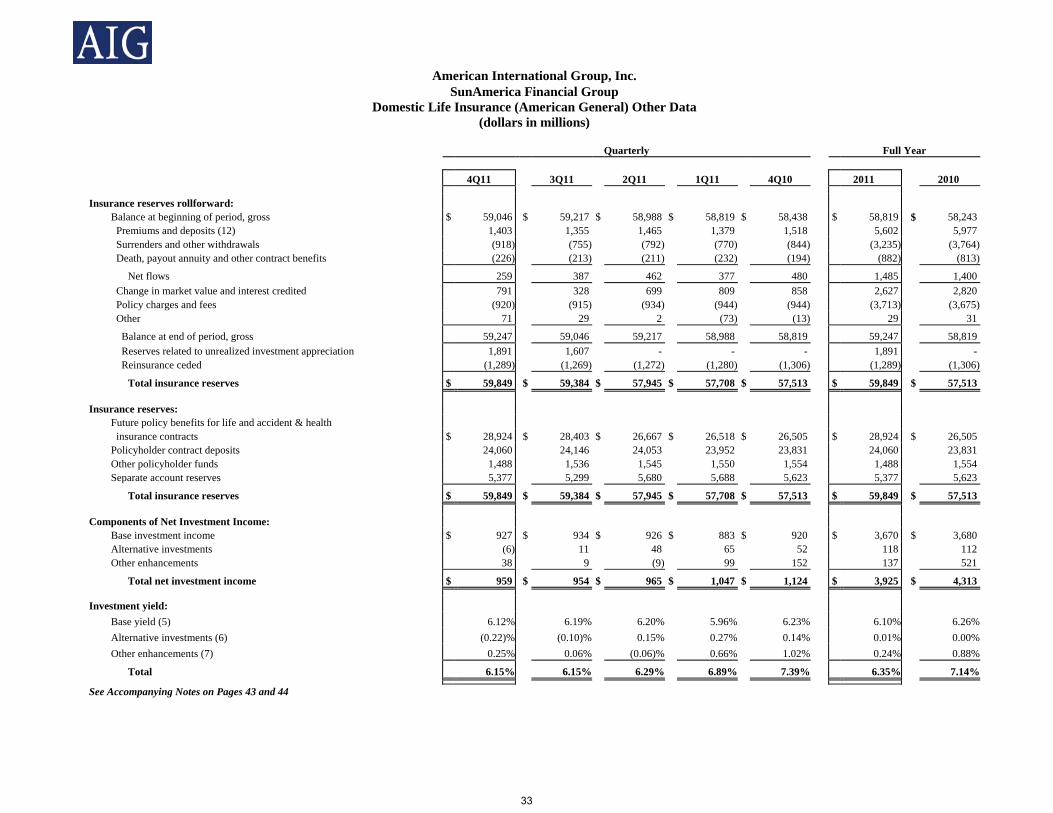
American International Group, Inc. SunAmerica Financial Group Domestic Life Insurance (American General) Other Data (dollars in millions) Quarterly Full Year 4Q11 3Q11 2Q11 1Q11 4Q10 2011 2010
Insurance reserves rollforward: Balance at beginning of period, gross $ 59,046 $ 59,217 $ 58,988 $ 58,819 $ 58,438 $ 58,819 $ 58,243 Premiums and deposits (12) 1,403 1,355 1,465 1,379 1,518 5,602 5,977 Surrenders and other withdrawals (918) (755) (792) (770) (844) (3,235) (3,764) Death, payout annuity and other contract benefits (226) (213) (211) (232) (194) (882) (813)
Net flows 259 387 462 377 480 1,485 1,400 Change in market value and interest credited 791 328 699 809 858 2,627 2,820 Policy charges and fees (920) (915) (934) (944) (944) (3,713) (3,675) Other 71 29 2 (73) (13) 29 31
Balance at end of period, gross 59,247 59,046 59,217 58,988 58,819 59,247 58,819 Reserves related to unrealized investment appreciation 1,891 1,607 - - - 1,891 - Reinsurance ceded (1,289) (1,269) (1,272) (1,280) (1,306) (1,289) (1,306)
Total insurance reserves $ 59,849 $ 59,384 $ 57,945 $ 57,708 $ 57,513 $ 59,849 $ 57,513 Insurance reserves: Future policy benefits for life and accident & health insurance contracts $ 28,924 $ 28,403 $ 26,667 $ 26,518 $ 26,505 $ 28,924 $ 26,505 Policyholder contract deposits 24,060 24,146 24,053 23,952 23,831 24,060 23,831 Other policyholder funds 1,488 1,536 1,545 1,550 1,554 1,488 1,554 Separate account reserves 5,377 5,299 5,680 5,688 5,623 5,377 5,623
Total insurance reserves $ 59,849 $ 59,384 $ 57,945 $ 57,708 $ 57,513 $ 59,849 $ 57,513 Components of Net Investment Income: Base investment income $ 927 $ 934 $ 926 $ 883 $ 920 $ 3,670 $ 3,680 Alternative investments (6) 11 48 65 52 118 112 Other enhancements 38 9 (9) 99 152 137 521
Total net investment income $ 959 $ 954 $ 965 $ 1,047 $ 1,124 $ 3,925 $ 4,313
Investment yield: Base yield (5) 6.12% 6.19% 6.20% 5.96% 6.23% 6.10% 6.26% Alternative investments (6) (0.22)% (0.10)% 0.15% 0.27% 0.14% 0.01% 0.00% Other enhancements (7) 0.25% 0.06% (0.06)% 0.66% 1.02% 0.24% 0.88%
Total 6.15% 6.15% 6.29% 6.89% 7.39% 6.35% 7.14%
See Accompanying Notes on Pages 43 and 44
33
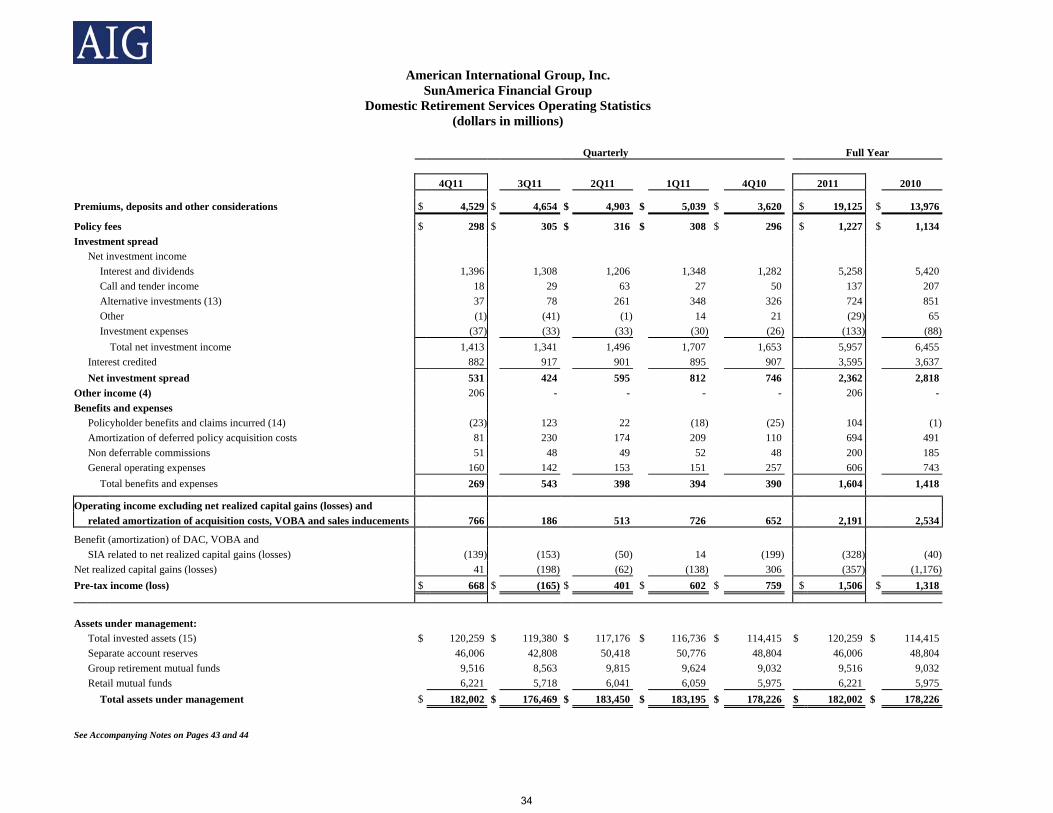
American International Group, Inc. SunAmerica Financial Group Domestic Retirement Services Operating Statistics (dollars in millions) Quarterly Full Year 4Q11 3Q11 2Q11 1Q11 4Q10 2011 2010
Premiums, deposits and other considerations $ 4,529 $ 4,654 $ 4,903 $ 5,039 $ 3,620 $ 19,125 $ 13,976
Policy fees $ 298 $ 305 $ 316 $ 308 $ 296 $ 1,227 $ 1,134 Investment spread Net investment income Interest and dividends 1,396 1,308 1,206 1,348 1,282 5,258 5,420 Call and tender income 18 29 63 27 50 137 207 Alternative investments (13) 37 78 261 348 326 724 851 Other (1) (41) (1) 14 21 (29) 65 Investment expenses (37) (33) (33) (30) (26) (133) (88) Total net investment income 1,413 1,341 1,496 1,707 1,653 5,957 6,455 Interest credited 882 917 901 895 907 3,595 3,637 Net investment spread 531 424 595 812 746 2,362 2,818 Other income (4) 206 - - - - 206 - Benefits and expenses Policyholder benefits and claims incurred (14) (23) 123 22 (18) (25) 104 (1) Amortization of deferred policy acquisition costs 81 230 174 209 110 694 491 Non deferrable commissions 51 48 49 52 48 200 185 General operating expenses 160 142 153 151 257 606 743 Total benefits and expenses 269 543 398 394 390 1,604 1,418
Operating income excluding net realized capital gains (losses) and related amortization of acquisition costs, VOBA and sales inducements 766 186 513 726 652 2,191 2,534
Benefit (amortization) of DAC, VOBA and SIA related to net realized capital gains (losses) (139) (153) (50) 14 (199) (328) (40) Net realized capital gains (losses) 41 (198) (62) (138) 306 (357) (1,176) Pre-tax income (loss) $ 668 $ (165) $ 401 $ 602 $ 759 $ 1,506 $ 1,318
Assets under management: Total invested assets (15) $ 120,259 $ 119,380 $ 117,176 $ 116,736 $ 114,415 $ 120,259 $ 114,415 Separate account reserves 46,006 42,808 50,418 50,776 48,804 46,006 48,804 Group retirement mutual funds 9,516 8,563 9,815 9,624 9,032 9,516 9,032 Retail mutual funds 6,221 5,718 6,041 6,059 5,975 6,221 5,975 Total assets under management $ 182,002 $ 176,469 $ 183,450 $ 183,195 $ 178,226 $ 182,002 $ 178,226 See Accompanying Notes on Pages 43 and 44
34
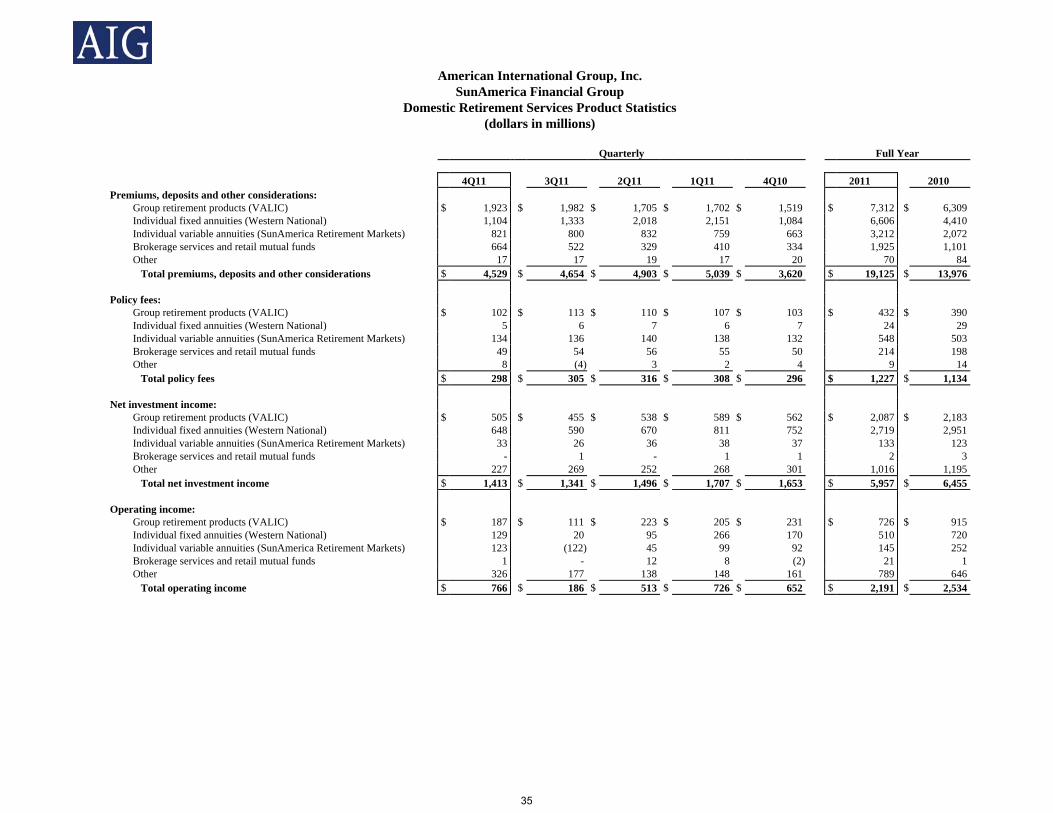
American International Group, Inc. SunAmerica Financial Group Domestic Retirement Services Product Statistics (dollars in millions) Quarterly Full Year 4Q11 3Q11 2Q11 1Q11 4Q10 2011 2010 Premiums, deposits and other considerations: Group retirement products (VALIC) $ 1,923 $ 1,982 $ 1,705 $ 1,702 $ 1,519 $ 7,312 $ 6,309 Individual fixed annuities (Western National) 1,104 1,333 2,018 2,151 1,084 6,606 4,410 Individual variable annuities (SunAmerica Retirement Markets) 821 800 832 759 663 3,212 2,072 Brokerage services and retail mutual funds 664 522 329 410 334 1,925 1,101 Other 17 17 19 17 20 70 84 Total premiums, deposits and other considerations $ 4,529 $ 4,654 $ 4,903 $ 5,039 $ 3,620 $ 19,125 $ 13,976 Policy fees: Group retirement products (VALIC) $ 102 $ 113 $ 110 $ 107 $ 103 $ 432 $ 390 Individual fixed annuities (Western National) 5 6 7 6 7 24 29 Individual variable annuities (SunAmerica Retirement Markets) 134 136 140 138 132 548 503 Brokerage services and retail mutual funds 49 54 56 55 50 214 198 Other 8 (4) 3 2 4 9 14 Total policy fees $ 298 $ 305 $ 316 $ 308 $ 296 $ 1,227 $ 1,134 Net investment income: Group retirement products (VALIC) $ 505 $ 455 $ 538 $ 589 $ 562 $ 2,087 $ 2,183 Individual fixed annuities (Western National) 648 590 670 811 752 2,719 2,951 Individual variable annuities (SunAmerica Retirement Markets) 33 26 36 38 37 133 123 Brokerage services and retail mutual funds - 1 - 1 1 2 3 Other 227 269 252 268 301 1,016 1,195 Total net investment income $ 1,413 $ 1,341 $ 1,496 $ 1,707 $ 1,653 $ 5,957 $ 6,455 Operating income: Group retirement products (VALIC) $ 187 $ 111 $ 223 $ 205 $ 231 $ 726 $ 915 Individual fixed annuities (Western National) 129 20 95 266 170 510 720 Individual variable annuities (SunAmerica Retirement Markets) 123 (122) 45 99 92 145 252 Brokerage services and retail mutual funds 1 - 12 8 (2) 21 1 Other 326 177 138 148 161 789 646 Total operating income $ 766 $ 186 $ 513 $ 726 $ 652 $ 2,191 $ 2,534
35

American International Group, Inc. SunAmerica Financial Group Domestic Retirement Services Account Value Rollforward (dollars in millions) Quarterly Full Year 4Q11 3Q11 2Q11 1Q11 4Q10 2011 2010 Group retirement products (VALIC) (16) Balance at beginning of period $ 66,655 $ 71,133 $ 70,565 $ 68,365 $ 65,782 $ 68,365 $ 63,419 Deposits - annuities (17) 1,447 1,611 1,303 1,291 1,178 5,652 4,937 Deposits - mutual funds (17) 476 371 402 411 341 1,660 1,372 Deposits - subtotal 1,923 1,982 1,705 1,702 1,519 7,312 6,309 Surrenders and other withdrawals (1,454) (1,448) (1,448) (1,503) (1,820) (5,853) (6,647) Death benefits (112) (86) (90) (83) (92) (371) (317) Net flows 357 448 167 116 (393) 1,088 (655) Change in fair value of underlying investments, interest credited, net of fees 2,898 (4,926) 401 2,084 2,976 457 5,601 Reserves related to unrealized investment appreciation 15 - - - - 15 - Balance at end of period 69,925 66,655 71,133 70,565 68,365 69,925 68,365 Individual fixed annuities (Western National) Balance at beginning of period 51,548 50,994 49,854 48,489 48,147 48,489 47,202 Deposits (17) 1,104 1,333 2,018 2,151 1,084 6,606 4,410 Surrenders and other withdrawals (870) (833) (913) (840) (869) (3,456) (3,520) Death benefits (351) (392) (425) (402) (346) (1,570) (1,479) Net flows (117) 108 680 909 (131) 1,580 (589) Change in fair value of underlying investments, interest credited, net of fees 466 446 460 456 473 1,828 1,876 Reserves related to unrealized investment appreciation 379 - - - - 379 -
Balance at end of period 52,276 51,548 50,994 49,854 48,489 52,276 48,489 Individual variable annuities (SunAmerica Retirement Markets) Balance at beginning of period 23,717 26,083 26,277 25,581 25,044 25,581 24,637 Deposits 821 800 832 759 663 3,212 2,072 Surrenders and other withdrawals (616) (690) (838) (838) (754) (2,982) (2,725) Death benefits (108) (119) (115) (110) (110) (452) (437) Net flows 97 (9) (121) (189) (201) (222) (1,090) Change in fair value of underlying investments, interest credited, net of fees 1,082 (2,357) (73) 885 738 (463) 2,034 Balance at end of period 24,896 23,717 26,083 26,277 25,581 24,896 25,581
Retail mutual funds Balance at beginning of period 5,718 6,041 6,059 5,975 5,832 5,975 5,879 Deposits 664 522 329 410 334 1,925 1,101 Redemptions (328) (415) (324) (380) (342) (1,447) (1,252) Net flows 336 107 5 30 (8) 478 (151) Change in fair value of underlying investments, interest credited, net of fees 167 (430) (23) 54 151 (232) 247 Balance at end of period 6,221 5,718 6,041 6,059 5,975 6,221 5,975 Total Balance at beginning of period, excluding runoff and GICs 147,638 154,251 152,755 148,410 144,805 148,410 141,137 Deposits 4,512 4,637 4,884 5,022 3,600 19,055 13,892 Surrenders, redemptions and other withdrawals (3,268) (3,386) (3,523) (3,561) (3,785) (13,738) (14,144) Benefit and death payments (571) (597) (630) (595) (548) (2,393) (2,233) Net flows 673 654 731 866 (733) 2,924 (2,485) Change in fair value of underlying investments, interest credited, net of fees 4,613 (7,267) 765 3,479 4,338 1,590 9,758 Reserves related to unrealized investment appreciation 394 - - - - 394 - Balance at end of period, excluding runoff and GICs 153,318 147,638 154,251 152,755 148,410 153,318 148,410 Individual annuities runoff 4,299 4,311 4,346 4,386 4,430 4,299 4,430 GICs 6,706 6,712 6,836 7,823 8,486 6,706 8,486 Balance at end of period $ 164,323 $ 158,661 $ 165,433 $ 164,964 $ 161,326 $ 164,323 $ 161,326 General and separate account reserves Policyholder contract deposits $ 102,580 $ 101,572 $ 99,159 $ 98,505 $ 97,515 $ 102,580 $ 97,515 Separate account reserves 46,006 42,808 50,418 50,776 48,804 46,006 48,804 Total general and separate account reserves 148,586 144,380 149,577 149,281 146,319 148,586 146,319 Group retirement mutual funds off-balance sheet 9,516 8,563 9,815 9,624 9,032 9,516 9,032 Retail mutual funds off-balance sheet 6,221 5,718 6,041 6,059 5,975 6,221 5,975 Total reserves and mutual funds $ 164,323 $ 158,661 $ 165,433 $ 164,964 $ 161,326 $ 164,323 $ 161,326 Surrender rates Group retirement products (VALIC) 8.4 % 8.4 % 8.2 % 8.7 % 10.9 % 8.4 % 10.3 % Individual fixed annuities (Western National) 6.7 % 6.5 % 7.2 % 6.9 % 7.2 % 6.8 % 7.4 % Individual variable annuities (SunAmerica Retirement Markets) 10.3 % 11.3 % 12.9 % 13.0 % 12.2 % 11.9 % 11.4 % See Accompanying Notes on Pages 43 and 44
36

American International Group, Inc. SunAmerica Financial Group Domestic Retirement Services Spread Information (dollars in millions) Quarterly Full Year 4Q11 3Q11 2Q11 1Q11 4Q10 2011 2010 Spread information Group retirement products (VALIC) Base investment income $ 507 $ 496 $ 476 $ 439 $ 457 $ 1,918 $ 1,862 Alternative investments (7) (20) 57 92 65 122 142 Other enhancements 5 (21) 5 58 40 47 179 Total net investment income $ 505 $ 455 $ 538 $ 589 $ 562 $ 2,087 $ 2,183 Base yield (5) 5.28 % 5.28 % 5.17 % 4.80 % 5.05 % 5.14 % 5.24 % Alternative investments (6) (0.31)% (0.43)% 0.35 % 0.72 % 0.47 % 0.07 % 0.17 % Other enhancements (7) 0.06 % (0.23)% 0.05 % 0.64 % 0.42 % 0.12 % 0.50 % Total 5.03 % 4.62 % 5.57 % 6.16 % 5.94 % 5.33 % 5.91 % Cost of funds (a) 3.62 % 3.72 % 3.69 % 3.66 % 3.83 % 3.67 % 3.84 % Net investment spread, as reported (a) 1.41 % 0.90 % 1.88 % 2.50 % 2.11 % 1.66 % 2.07 % Base net investment spread (b) 1.66 % 1.56 % 1.48 % 1.14 % 1.22 % 1.47 % 1.40 % Individual fixed annuities (Western National) Base investment income $ 682 $ 682 $ 645 $ 576 $ 596 $ 2,585 $ 2,421 Alternative investments (36) (34) 72 131 103 133 217 Other enhancements 2 (58) (47) 104 53 1 313 Total net investment income $ 648 $ 590 $ 670 $ 811 $ 752 $ 2,719 $ 2,951 Base yield (5) 5.08 % 5.13 % 4.93 % 4.53 % 4.79 % 4.92 % 4.93 % Alternative investments (6) (0.46)% (0.45)% 0.34 % 0.76 % 0.58 % 0.04 % 0.19 % Other enhancements (7) 0.01 % (0.43)% (0.36)% 0.83 % 0.43 % - % 0.64 % Total 4.63 % 4.25 % 4.91 % 6.12 % 5.80 % 4.96 % 5.76 % Cost of funds (a) 3.28 % 3.38 % 3.39 % 3.45 % 3.58 % 3.37 % 3.63 % Net investment spread, as reported (a) 1.35 % 0.87 % 1.52 % 2.67 % 2.22 % 1.59 % 2.13 % Base net investment spread (b) 1.80 % 1.75 % 1.54 % 1.08 % 1.21 % 1.55 % 1.30 % (a) Excludes the amortization of sales inducement assets (b) Excludes impact of alternative investments and other enhancements See Accompanying Notes on Pages 43 and 44
37
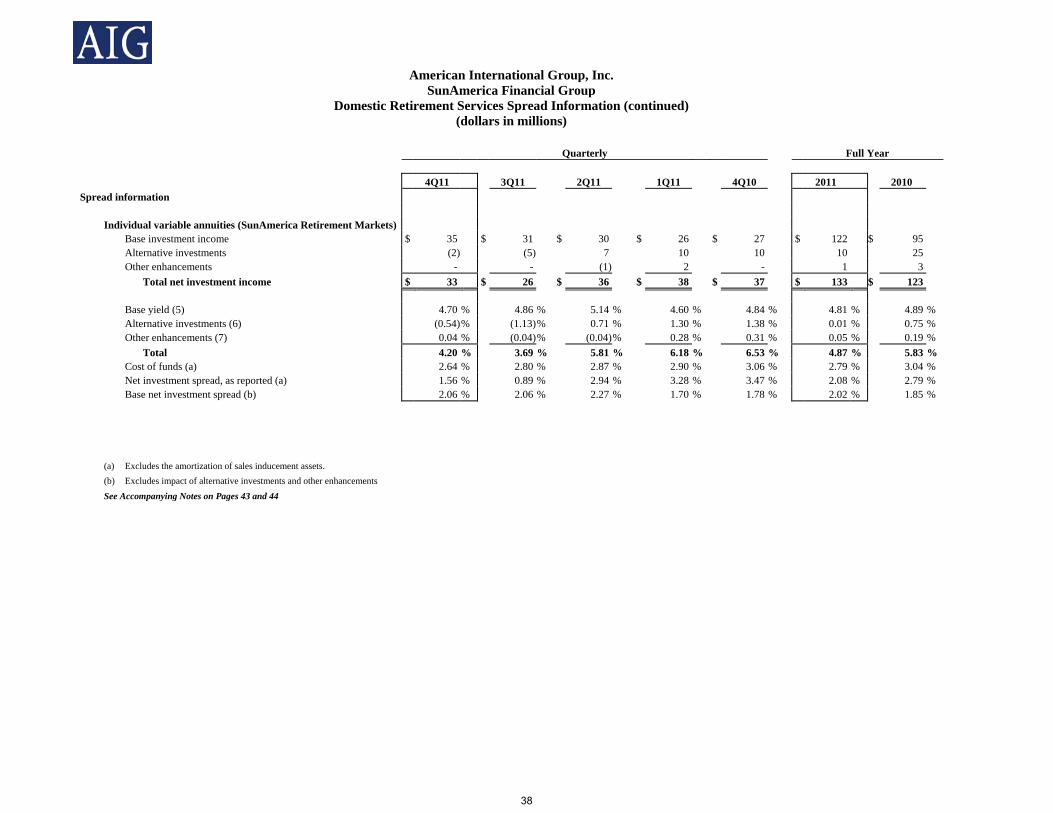
American International Group, Inc. SunAmerica Financial Group Domestic Retirement Services Spread Information (continued) (dollars in millions) Quarterly Full Year 4Q11 3Q11 2Q11 1Q11 4Q10 2011 2010 Spread information Individual variable annuities (SunAmerica Retirement Markets) Base investment income $ 35 $ 31 $ 30 $ 26 $ 27 $ 122 $ 95 Alternative investments (2) (5) 7 10 10 10 25 Other enhancements - - (1) 2 - 1 3 Total net investment income $ 33 $ 26 $ 36 $ 38 $ 37 $ 133 $ 123 Base yield (5) 4.70 % 4.86 % 5.14 % 4.60 % 4.84 % 4.81 % 4.89 % Alternative investments (6) (0.54)% (1.13)% 0.71 % 1.30 % 1.38 % 0.01 % 0.75 % Other enhancements (7) 0.04 % (0.04)% (0.04) % 0.28 % 0.31 % 0.05 % 0.19 % Total 4.20 % 3.69 % 5.81 % 6.18 % 6.53 % 4.87 % 5.83 % Cost of funds (a) 2.64 % 2.80 % 2.87 % 2.90 % 3.06 % 2.79 % 3.04 % Net investment spread, as reported (a) 1.56 % 0.89 % 2.94 % 3.28 % 3.47 % 2.08 % 2.79 % Base net investment spread (b) 2.06 % 2.06 % 2.27 % 1.70 % 1.78 % 2.02 % 1.85 % (a) Excludes the amortization of sales inducement assets. (b) Excludes impact of alternative investments and other enhancements See Accompanying Notes on Pages 43 and 44
38

American International Group, Inc. SunAmerica Financial Group Domestic Retirement Services - Group Retirement Products (VALIC) Guaranteed Benefits (f) (dollars in millions) December 31, 2011 Account Net Amount Retained Value at Risk ("NAR") NAR Guaranteed Minimum Death Benefit ("GMDB") Type (including Earnings Enhancement Benefit) (a): Return of premium (b) $ 3,625 $ - $ - Roll-up (c) 42,794 1,774 1,774 Return of premium (b) (Coinsurance - Japan) - 355 355 46,419 2,129 2,129 Guaranteed Minimum Income Benefit Type: No Roll-up (Coinsurance - Japan) - 28 28 Guaranteed Minimum Withdrawal Benefit ("GMWB") Type (d): Lifetime guarantees (e) 2,637 132 132 Return of premium (b) (Coinsurance - Japan) - 327 327 $ 2,637 $ 459 $ 459 Notes: (a) A guaranteed minimum death benefit is an amount paid from a variable annuity at death of the owner. This benefit protects beneficiaries from market volatility and may be different than the account value. Each of these benefits may be subject to a maximum amount based on age of owner or dollar amount. (b) Premium deposited into the contract. (c) An amount equal to premiums deposited accumulated at a set interest rate. (d) A guaranteed minimum withdrawal benefit establishes an amount that can be taken as withdrawals which can be taken over a fixed period or for life, regardless of market performance, even if the account value drops to zero. (e) Amount is available over the life of the owner (and spouse, if elected). (f) SunAmerica uses hedging to mitigate risks related to guaranteed benefits in certain VALIC variable annuity contracts. VALIC variable annuities include a GMDB that is not reinsured as the base rollup benefit reverts to return of premium at attained age 70. GMWB liabilities are included in the company's dynamic hedging program. VALIC also reinsures certain guaranteed benefits (closed block) from ALICO Japan, a former affiliate. The guaranteed benefits in the coinsured business, which includes GMDB and either GMIB or GMWB are in scope for the SunAmerica dynamic hedging program. VALIC's hedging program is focused on mitigating economic risk, not GAAP earnings risk. The program manages equity market risk (delta), interest rate risk (rho), volatility risk (vega and gamma) within specified levels. The hedge portfolio is regularly rebalanced to manage gamma and to maintain delta and rho neutrality and to maintain vega within exposure limits established by SunAmerica and AIG Enterprise Risk Management. Vega is not fully hedged due to potential adverse effects on statutory capital and the immaterial level of exposure.
39

American International Group, Inc. Domestic Retirement Services - Individual Variable Annuities (SunAmerica Retirement Markets) Guaranteed Benefits (q) (dollars in millions) December 31, 2011 Account Net Amount Retained Value at Risk ("NAR") ( r ) NAR Guaranteed Minimum Death Benefit ("GMDB") Type (including Earnings Enhancement Benefit) (a): Return of premium (b) $ 6,575 $ 223 $ 223 Reset (c) 512 27 27 Ratchet (d) 11,459 1,581 1,375 Roll-up (e) 3,933 971 903 Combination (f) 189 49 49 Return of premium, with earnings enhancement (g) 2 - - Ratchet, with earnings enhancement (h) 931 179 75 Roll-up, with earnings enhancement (i) 382 87 27 Combination with earnings enhancement (j) 34 17 16 $ 24,017 $ 3,134 $ 2,695 Guaranteed Minimum Income Benefit ("GMIB") Type (k): Roll-up (e) $ 308 $ 179 $ 61 No roll-up (l) 2,822 92 49 $ 3,130 $ 271 $ 110 Guaranteed Minimum Account Value ("GMAV") Type (m): Ten year waiting period $ 1,009 $ 27 $ 27 Guaranteed Minimum Withdrawal Benefit ("GMWB") Type (n): Minimum amount guarantees (o) 976 89 89 Lifetime guarantees (p) 10,083 1,333 1,333 $ 11,059 $ 1,422 $ 1,422 See Accompanying Notes on page 41
40
American International Group, Inc. Domestic Retirement Services - Individual Variable Annuities (SunAmerica Retirement Markets) Guaranteed Benefits Notes (a) A guaranteed minimum death benefit is an amount paid from a variable annuity at death of the owner. This benefit protects beneficiaries from market volatility and may be different than the account value. Each of these benefits may be subject to a maximum amount based on age of owner or dollar amount. (b) Premium deposited into the contract. (c) An amount that is reset to the account value, if greater, at a specified contract anniversary. (d) An amount equal to the highest account value achieved on any contract anniversary. (e) An amount equal to premiums deposited accumulated at a set interest rate. (f) An amount equal to the greater of a ratchet or a roll-up. (g) A return of premium benefit which also pays a percent of the earnings in the contract, if any. (h) A ratchet benefit that also pays a percent of earnings in the contract, if any. (i) A roll-up benefit that also pays a percent of earnings in the contract, if any. (j) A combination benefit which also pays a percent of earnings in the contract, if any. (k) A guaranteed minimum income benefit establishes a minimum amount available to be annuitized regardless of actual performance in the product. The benefit is not available until a set number of years after contract issue. (l) An amount based on premiums deposited or other set amount. (m) A guaranteed minimum account value ensures a return of premium invested at the end of 10 years. The amount is based on premium in a defined period. (n) A guaranteed minimum withdrawal benefit establishes an amount that can be taken as withdrawals which can be taken over a fixed period or for life, regardless of market performance, even if the account value drops to zero. (o) Amount is available over a fixed period. (p) Amount is available over the life of the owner (and spouse, if elected). (q) SunAmerica uses reinsurance and hedging to mitigate risks related to guaranteed benefits in the individual variable annuity business contracts. Certain GMDB benefits written before 2004 are reinsured. The majority of GMIB benefits, which are no longer offered, are reinsured. GMWB liabilities and GMAV liabilities (GMAV is no longer offered) are included in SunAmerica's dynamic hedging program. The hedging program is focused on mitigating economic risk, not GAAP earnings risk. The program manages equity market risk (delta), interest rate risk (rho), volatility risk (vega and gamma) within specified levels. The hedge portfolio is regularly rebalanced to manage gamma and to maintain delta neutrality and to maintain rho and vega within exposure limits established by SunAmerica and AIG Enterprise Risk Management. Rho and vega are not fully hedged due to potential adverse effects on statutory capital from the mismatch between fair value accounting for hedge assets and prescribed methods for calculating statutory reserves and capital. (r) Declines in NAR from the third quarter of 2011 were due to equity market appreciation in the fourth quarter of 2011.
41

American International Group, Inc. Domestic Retirement Services - Individual Variable Annuities (SunAmerica Retirement Markets) Guaranteed Benefits (continued) (dollars in millions) Dec. 31, Sept. 30, June 30, March 31, Dec. 31, 2011 2011 2011 2011 2010 Other Data S&P 500 Index value 1,258 1,131 1,321 1,326 1,258 10 year US Treasury Yield 1.876% 1.915% 3.160% 3.470% 3.294% CBOE SPX Volatility Index (VIX) 23.40 42.96 16.52 17.74 17.75 Total Account Value $ 24,896 $ 23,717 $ 26,083 $ 26,277 $ 25,581 Account value by benefit type: Guaranteed Minimum Death Benefits 24,017 22,517 25,708 25,937 25,154 Guaranteed Minimum Income Benefits 3,130 3,040 3,665 3,873 3,894 Guaranteed Minimum Account Value 1,009 988 1,210 1,300 1,324 Guaranteed Minimum Withdrawal Benefits 11,059 9,892 10,778 10,344 9,560 Net amount at risk: Guaranteed Minimum Death Benefits 3,134 4,351 1,995 1,938 2,416 Guaranteed Minimum Income Benefits 271 315 119 89 179 Guaranteed Minimum Account Value 27 43 11 11 16 Guaranteed Minimum Withdrawal Benefits 1,422 1,906 669 593 749 Retained net amount at risk: Guaranteed Minimum Death Benefits 2,695 3,757 1,698 1,645 2,040 Guaranteed Minimum Income Benefits 110 127 53 38 79 Guaranteed Minimum Account Value 27 43 11 11 16 Guaranteed Minimum Withdrawal Benefits 1,422 1,906 669 593 749 Liability for guaranteed benefits (GMDB & GMIB) $ 414 $ 458 $ 360 352 $ 376
42
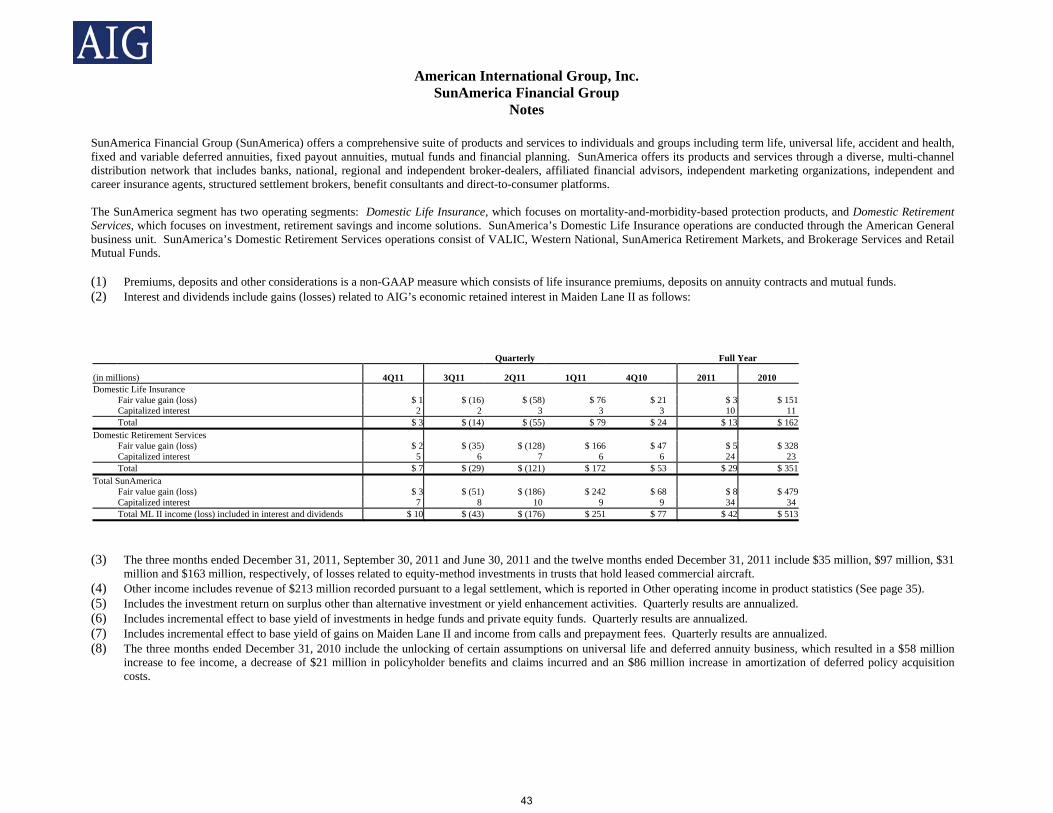
American International Group, Inc.
SunAmerica Financial Group Notes
SunAmerica Financial Group (SunAmerica) offers a comprehensive suite of products and services to individuals and groups including term life, universal life, accident and health, fixed and variable deferred annuities, fixed payout annuities, mutual funds and financial planning. SunAmerica offers its products and services through a diverse, multi-channel distribution network that includes banks, national, regional and independent broker-dealers, affiliated financial advisors, independent marketing organizations, independent and career insurance agents, structured settlement brokers, benefit consultants and direct-to-consumer platforms. The SunAmerica segment has two operating segments: Domestic Life Insurance, which focuses on mortality-and-morbidity-based protection products, and Domestic Retirement Services, which focuses on investment, retirement savings and income solutions. SunAmerica’s Domestic Life Insurance operations are conducted through the American General business unit. SunAmerica’s Domestic Retirement Services operations consist of VALIC, Western National, SunAmerica Retirement Markets, and Brokerage Services and Retail Mutual Funds. (1) Premiums, deposits and other considerations is a non-GAAP measure which consists of life insurance premiums, deposits on annuity contracts and mutual funds. (2) Interest and dividends include gains (losses) related to AIG’s economic retained interest in Maiden Lane II as follows:
Quarterly Full Year
(in millions) 4Q11 3Q11 2Q11 1Q11 4Q10 2011 2010 Domestic Life Insurance Fair value gain (loss) $ 1 $ (16) $ (58) $ 76 $ 21 $ 3 $ 151 Capitalized interest 2 2 3 3 3 10 11 Total $ 3 $ (14) $ (55) $ 79 $ 24 $ 13 $ 162 Domestic Retirement Services Fair value gain (loss) $ 2 $ (35) $ (128) $ 166 $ 47 $ 5 $ 328 Capitalized interest 5 6 7 6 6 24 23 Total $ 7 $ (29) $ (121) $ 172 $ 53 $ 29 $ 351 Total SunAmerica Fair value gain (loss) $ 3 $ (51) $ (186) $ 242 $ 68 $ 8 $ 479 Capitalized interest 7 8 10 9 9 34 34 Total ML II income (loss) included in interest and dividends $ 10 $ (43) $ (176) $ 251 $ 77 $ 42 $ 513
(3) The three months ended December 31, 2011, September 30, 2011 and June 30, 2011 and the twelve months ended December 31, 2011 include $35 million, $97 million, $31 million and $163 million, respectively, of losses related to equity-method investments in trusts that hold leased commercial aircraft.
(4) Other income includes revenue of $213 million recorded pursuant to a legal settlement, which is reported in Other operating income in product statistics (See page 35). (5) Includes the investment return on surplus other than alternative investment or yield enhancement activities. Quarterly results are annualized. (6) Includes incremental effect to base yield of investments in hedge funds and private equity funds. Quarterly results are annualized. (7) Includes incremental effect to base yield of gains on Maiden Lane II and income from calls and prepayment fees. Quarterly results are annualized. (8) The three months ended December 31, 2010 include the unlocking of certain assumptions on universal life and deferred annuity business, which resulted in a $58 million
increase to fee income, a decrease of $21 million in policyholder benefits and claims incurred and an $86 million increase in amortization of deferred policy acquisition costs.
43

American International Group, Inc.
SunAmerica Financial Group Notes
(Continued)
(9) Life insurance sales include periodic premiums from new business expected to be collected over a one-year period and 10 percent of unscheduled and single premiums from new and existing policyholders. Sales of group accident and health insurance represent annualized first-year premium from new policies. Annuity sales represent deposits from new and existing customers.
(10) Includes structured settlements, single premium immediate annuities and terminal funding annuities. (11) Surrender rates are reported on a 90 day lag basis to include grace period processing. Independent distribution are face amounts surrendered and career distribution measures
annual premiums surrendered. (12) Represents premiums and deposits before reinsurance premiums. (13) Includes Affordable Housing Partnership Income as follows:
Quarterly Full Year
(in millions) 4Q11 3Q11 2Q11 1Q11 4Q10 2011 2010
Affordable Housing Partnership Income $ 64 $ 59 $ 56 $ 53 $ 45 $ 232 $ 141
(14) Policyholder benefits and claims incurred is negative in the three months ended December 31, 2011, March 31, 2011, December 31, 2010, and the twelve months ended
December 31, 2010 due to reductions in SOP 03-01 reserves (primarily guaranteed minimum death benefits) resulting from positive equity markets. (15) Includes invested assets of runoff blocks as follows:
Quarterly Full Year
(in millions) 4Q11 3Q11 2Q11 1Q11 4Q10 2011 2010
Total Invested Assets
$ 14,514 $ 14,343 $ 14,137 $ 15,906 $ 16,289 $ 14,514 $ 16,289
(16) Includes group retirement annuities and group mutual funds. The balances at the beginning and end of the period for Group Mutual Funds are as follows: Quarterly Full Year
(in millions) 4Q11 3Q11 2Q11 1Q11 4Q10 2011 2010
Beginning Balance $ 8,563 $ 9,815 $ 9,624 $ 9,032 $ 8,388 $ 9,032 $ 8,075
Ending Balance $ 9,516 $ 8,563 $ 9,815 $ 9,624 $ 9,032 $ 9,516 $ 9,032
(17) Excludes internal replacements from one contract into a new contract. If included, deposits and surrenders for group retirement products and individual fixed annuities would increase.
44

American International Group, Inc. Aircraft Leasing Operating Statistics (1) (dollars in millions) Quarterly Full Year 4Q11 3Q11 2Q11 1Q11 4Q10 2011 2010 Revenues: Rental revenue $ 1,078 $ 1,117 $ 1,111 $ 1,141 $ 1,152 $ 4,447 $ 4,727 Interest and other revenues (1) (30) 12 23 15 (12) 20 22 Total aircraft leasing revenues $ 1,048 $ 1,129 $ 1,134 $ 1,156 $ 1,140 $ 4,467 $ 4,749 Operating expenses: Interest expense (2) $ 345 $ 353 $ 360 $ 369 $ 367 $ 1,427 $ 1,397 Loss on extinguishment of debt - - 61 - - 61 - Aircraft leasing expense: Depreciation expense 491 468 459 453 520 1,871 1,968 Impairment charges, fair value adjustments and lease-related charges 16 1,518 42 113 742 1,689 1,704 Other expenses 77 107 126 104 117 414 378 Total aircraft leasing expenses 584 2,093 627 670 1,379 3,974 4,050 Operating income (loss) before net realized capital gains (losses) 119 (1,317) 86 117 (606) (995) (698) Net realized capital gains (losses) (2) (12) 1 3 (1) (10) (31) Pre-tax income (loss) $ 117 $ (1,329) $ 87 $ 120 $ (607) $ (1,005) $ (729) (1) Includes intercompany activity eliminated in consolidation. (2) Excludes amortization of deferred debt issue costs, deferred debt discount, and the effect of derivatives. Amortization of deferred debt issue costs and deferred debt discount are included in Other expenses. Gains / (losses) relating to derivatives are included in Net realized capital gains (losses).
45
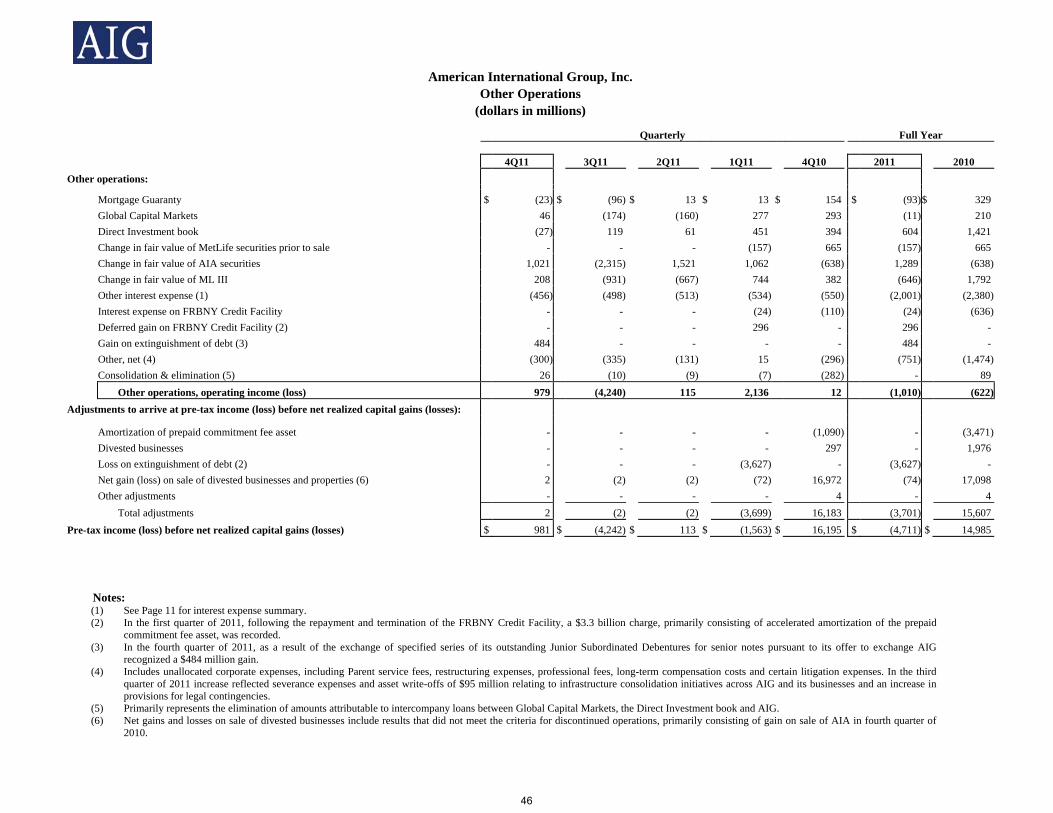
American International Group, Inc.
Other Operations (dollars in millions)
Quarterly Full Year 4Q11 3Q11 2Q11 1Q11 4Q10 2011 2010 Other operations:
Mortgage Guaranty $ (23) $ (96) $ 13 $ 13 $ 154 $ (93)$ 329 Global Capital Markets 46 (174) (160) 277 293 (11) 210 Direct Investment book (27) 119 61 451 394 604 1,421 Change in fair value of MetLife securities prior to sale - - - (157) 665 (157) 665 Change in fair value of AIA securities 1,021 (2,315) 1,521 1,062 (638) 1,289 (638) Change in fair value of ML III 208 (931) (667) 744 382 (646) 1,792 Other interest expense (1) (456) (498) (513) (534) (550) (2,001) (2,380) Interest expense on FRBNY Credit Facility - - - (24) (110) (24) (636) Deferred gain on FRBNY Credit Facility (2) - - - 296 - 296 - Gain on extinguishment of debt (3) 484 - - - - 484 - Other, net (4) (300) (335) (131) 15 (296) (751) (1,474) Consolidation & elimination (5) 26 (10) (9) (7) (282) - 89 Other operations, operating income (loss) 979 (4,240) 115 2,136 12 (1,010) (622)Adjustments to arrive at pre-tax income (loss) before net realized capital gains (losses):
Amortization of prepaid commitment fee asset - - - - (1,090) - (3,471) Divested businesses - - - - 297 - 1,976 Loss on extinguishment of debt (2) - - - (3,627) - (3,627) - Net gain (loss) on sale of divested businesses and properties (6) 2 (2) (2) (72) 16,972 (74) 17,098 Other adjustments - - - - 4 - 4 Total adjustments 2 (2) (2) (3,699) 16,183 (3,701) 15,607 Pre-tax income (loss) before net realized capital gains (losses) $ 981 $ (4,242) $ 113 $ (1,563) $ 16,195 $ (4,711) $ 14,985
Notes:
(1) See Page 11 for interest expense summary. (2) In the first quarter of 2011, following the repayment and termination of the FRBNY Credit Facility, a $3.3 billion charge, primarily consisting of accelerated amortization of the prepaid
commitment fee asset, was recorded. (3) In the fourth quarter of 2011, as a result of the exchange of specified series of its outstanding Junior Subordinated Debentures for senior notes pursuant to its offer to exchange AIG
recognized a $484 million gain. (4) Includes unallocated corporate expenses, including Parent service fees, restructuring expenses, professional fees, long-term compensation costs and certain litigation expenses. In the third
quarter of 2011 increase reflected severance expenses and asset write-offs of $95 million relating to infrastructure consolidation initiatives across AIG and its businesses and an increase in provisions for legal contingencies.
(5) Primarily represents the elimination of amounts attributable to intercompany loans between Global Capital Markets, the Direct Investment book and AIG. (6) Net gains and losses on sale of divested businesses include results that did not meet the criteria for discontinued operations, primarily consisting of gain on sale of AIA in fourth quarter of
2010.
46
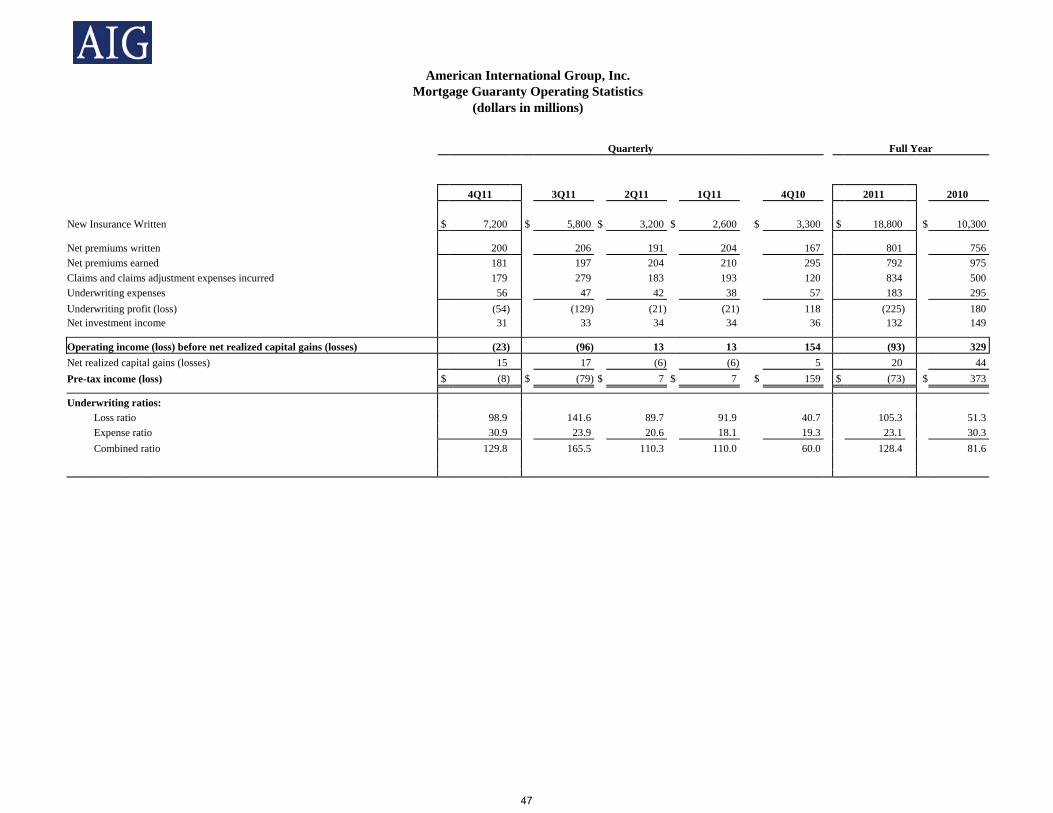
American International Group, Inc.
Mortgage Guaranty Operating Statistics (dollars in millions)
Quarterly Full Year 4Q11 3Q11 2Q11 1Q11 4Q10 2011 2010 New Insurance Written $ 7,200 $ 5,800 $ 3,200 $ 2,600 $ 3,300 $ 18,800 $ 10,300
Net premiums written 200 206 191 204 167 801 756 Net premiums earned 181 197 204 210 295 792 975 Claims and claims adjustment expenses incurred 179 279 183 193 120 834 500 Underwriting expenses 56 47 42 38 57 183 295 Underwriting profit (loss) (54) (129) (21) (21) 118 (225) 180 Net investment income 31 33 34 34 36 132 149
Operating income (loss) before net realized capital gains (losses) (23) (96) 13 13 154 (93) 329 Net realized capital gains (losses) 15 17 (6) (6) 5 20 44 Pre-tax income (loss) $ (8) $ (79) $ 7 $ 7 $ 159 $ (73) $ 373
Underwriting ratios: Loss ratio 98.9 141.6 89.7 91.9 40.7 105.3 51.3 Expense ratio 30.9 23.9 20.6 18.1 19.3 23.1 30.3 Combined ratio 129.8 165.5 110.3 110.0 60.0 128.4 81.6
47
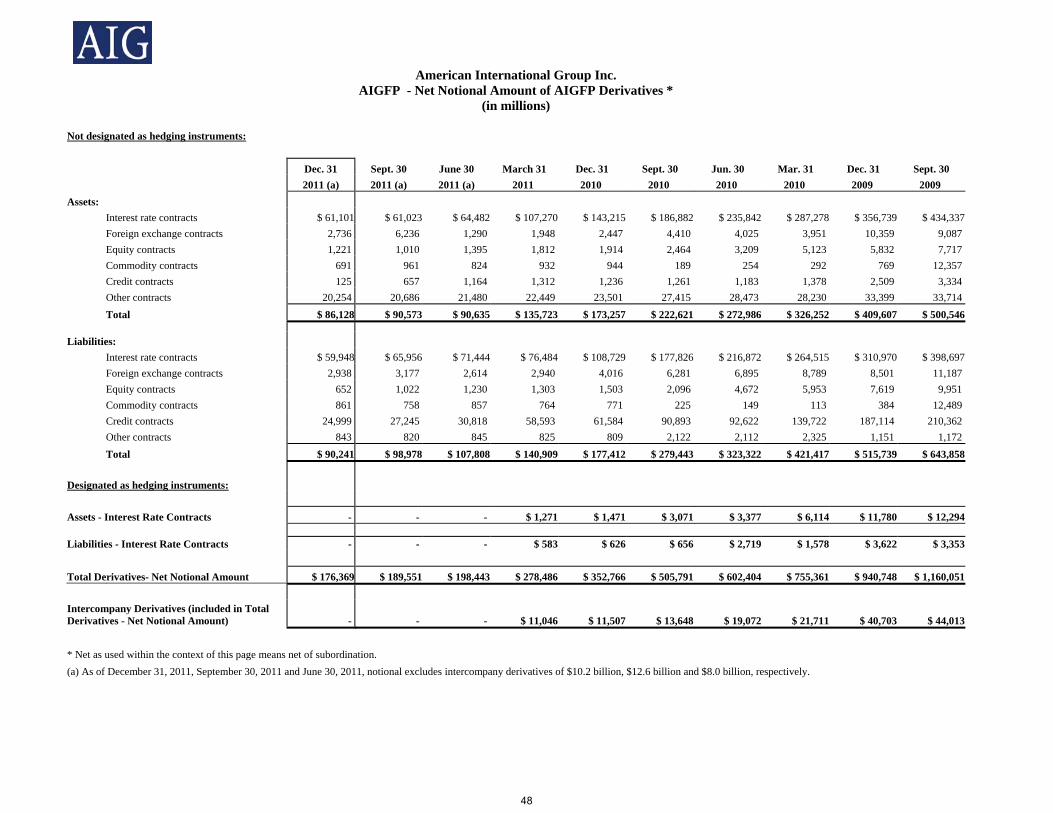
American International Group Inc.
AIGFP - Net Notional Amount of AIGFP Derivatives * (in millions)
Not designated as hedging instruments: Dec. 31 Sept. 30 June 30 March 31 Dec. 31 Sept. 30 Jun. 30 Mar. 31 Dec. 31 Sept. 30 2011 (a) 2011 (a) 2011 (a) 2011 2010 2010 2010 2010 2009 2009 Assets: Interest rate contracts $ 61,101 $ 61,023 $ 64,482 $ 107,270 $ 143,215 $ 186,882 $ 235,842 $ 287,278 $ 356,739 $ 434,337 Foreign exchange contracts 2,736 6,236 1,290 1,948 2,447 4,410 4,025 3,951 10,359 9,087 Equity contracts 1,221 1,010 1,395 1,812 1,914 2,464 3,209 5,123 5,832 7,717 Commodity contracts 691 961 824 932 944 189 254 292 769 12,357 Credit contracts 125 657 1,164 1,312 1,236 1,261 1,183 1,378 2,509 3,334 Other contracts 20,254 20,686 21,480 22,449 23,501 27,415 28,473 28,230 33,399 33,714 Total $ 86,128 $ 90,573 $ 90,635 $ 135,723 $ 173,257 $ 222,621 $ 272,986 $ 326,252 $ 409,607 $ 500,546
Liabilities: Interest rate contracts $ 59,948 $ 65,956 $ 71,444 $ 76,484 $ 108,729 $ 177,826 $ 216,872 $ 264,515 $ 310,970 $ 398,697 Foreign exchange contracts 2,938 3,177 2,614 2,940 4,016 6,281 6,895 8,789 8,501 11,187 Equity contracts 652 1,022 1,230 1,303 1,503 2,096 4,672 5,953 7,619 9,951 Commodity contracts 861 758 857 764 771 225 149 113 384 12,489 Credit contracts 24,999 27,245 30,818 58,593 61,584 90,893 92,622 139,722 187,114 210,362 Other contracts 843 820 845 825 809 2,122 2,112 2,325 1,151 1,172 Total $ 90,241 $ 98,978 $ 107,808 $ 140,909 $ 177,412 $ 279,443 $ 323,322 $ 421,417 $ 515,739 $ 643,858 Designated as hedging instruments: Assets - Interest Rate Contracts - - - $ 1,271 $ 1,471 $ 3,071 $ 3,377 $ 6,114 $ 11,780 $ 12,294 Liabilities - Interest Rate Contracts - - - $ 583 $ 626 $ 656 $ 2,719 $ 1,578 $ 3,622 $ 3,353 Total Derivatives- Net Notional Amount $ 176,369 $ 189,551 $ 198,443 $ 278,486 $ 352,766 $ 505,791 $ 602,404 $ 755,361 $ 940,748 $ 1,160,051 Intercompany Derivatives (included in Total Derivatives - Net Notional Amount) - - - $ 11,046 $ 11,507 $ 13,648 $ 19,072 $ 21,711 $ 40,703 $ 44,013 * Net as used within the context of this page means net of subordination.(a) As of December 31, 2011, September 30, 2011 and June 30, 2011, notional excludes intercompany derivatives of $10.2 billion, $12.6 billion and $8.0 billion, respectively.
48
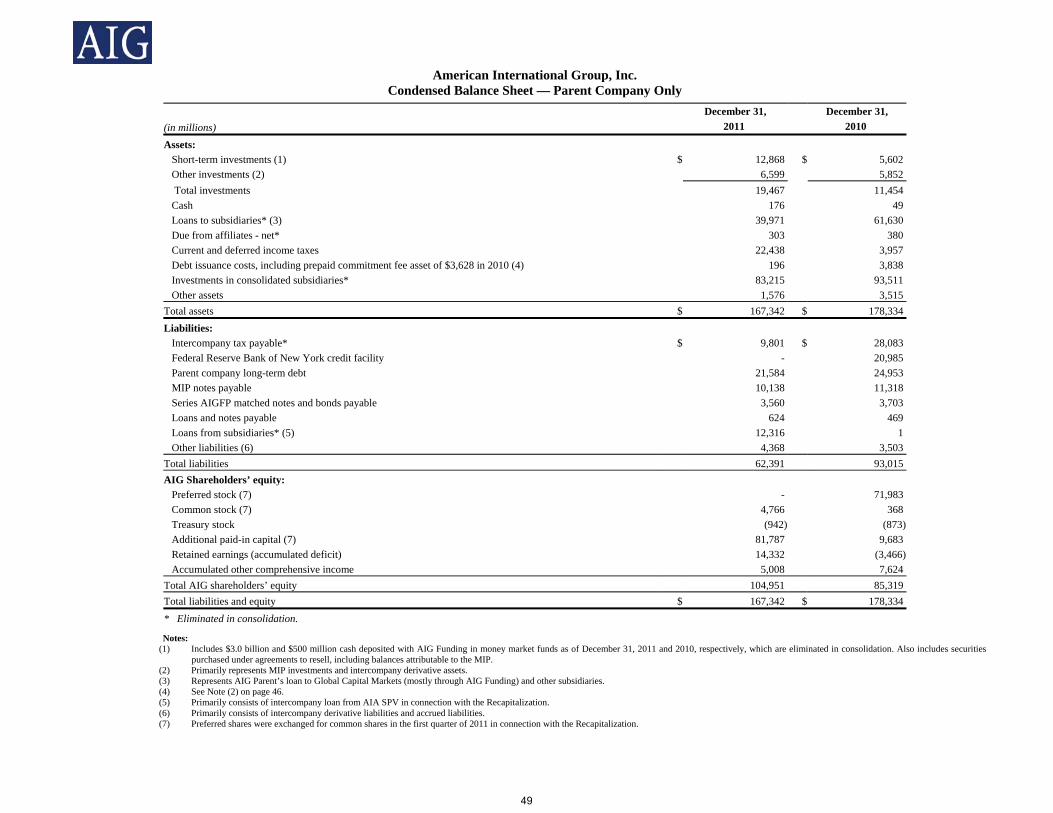
American International Group, Inc. Condensed Balance Sheet — Parent Company Only December 31, December 31, (in millions) 2011 2010
Assets: Short-term investments (1) $ 12,868 $ 5,602 Other investments (2) 6,599 5,852 Total investments 19,467 11,454 Cash 176 49 Loans to subsidiaries* (3) 39,971 61,630 Due from affiliates - net* 303 380 Current and deferred income taxes 22,438 3,957 Debt issuance costs, including prepaid commitment fee asset of $3,628 in 2010 (4) 196 3,838 Investments in consolidated subsidiaries* 83,215 93,511 Other assets 1,576 3,515 Total assets $ 167,342 $ 178,334 Liabilities: Intercompany tax payable* $ 9,801 $ 28,083 Federal Reserve Bank of New York credit facility - 20,985 Parent company long-term debt 21,584 24,953 MIP notes payable 10,138 11,318 Series AIGFP matched notes and bonds payable 3,560 3,703 Loans and notes payable 624 469 Loans from subsidiaries* (5) 12,316 1 Other liabilities (6) 4,368 3,503 Total liabilities 62,391 93,015 AIG Shareholders’ equity: Preferred stock (7) - 71,983 Common stock (7) 4,766 368 Treasury stock (942) (873) Additional paid-in capital (7) 81,787 9,683 Retained earnings (accumulated deficit) 14,332 (3,466) Accumulated other comprehensive income 5,008 7,624 Total AIG shareholders’ equity 104,951 85,319 Total liabilities and equity $ 167,342 $ 178,334 * Eliminated in consolidation.
Notes: (1) Includes $3.0 billion and $500 million cash deposited with AIG Funding in money market funds as of December 31, 2011 and 2010, respectively, which are eliminated in consolidation. Also includes securities
purchased under agreements to resell, including balances attributable to the MIP. (2) Primarily represents MIP investments and intercompany derivative assets. (3) Represents AIG Parent’s loan to Global Capital Markets (mostly through AIG Funding) and other subsidiaries. (4) See Note (2) on page 46. (5) Primarily consists of intercompany loan from AIA SPV in connection with the Recapitalization. (6) Primarily consists of intercompany derivative liabilities and accrued liabilities. (7) Preferred shares were exchanged for common shares in the first quarter of 2011 in connection with the Recapitalization.
49

American International Group, Inc.
Condensed Statement of Income (Loss) — Parent Company Only
Quarterly Full Year (in millions) 4Q11 3Q11 2Q11 1Q11 4Q10 2011 2010 Revenues Equity in earnings of consolidated subsidiaries * $ 2,675 $ (2,661)$ 2,194 $ 3,014 $ 19,450 $ 5,222 $ 18,040 Interest income 112 90 126 268 718 596 3,249 Change in fair value of ML III 108 (484) (347) - - (723) - Net realized capital gains (losses) 208 299 (25) (269) 193 213 (209) Other revenue 129 17 91 42 5 279 6 Expenses Interest expense on FRBNY Credit Facility - - - 72 1,200 72 4,107 Other interest expense 651 712 731 751 544 2,845 2,279 (Gain) Loss on extinguishment of debt (484) - 18 3,313 104 2,847 104 Other expenses, net 365 230 225 47 384 867 1,664 Income (loss) from continuing operations before income tax expense (benefit) 2,700 (3,681) 1,065 (1,128) 18,134 (1,044) 12,932 Income tax expense (benefit) (17,099) 223 (767) (266) 6,973 (17,909) 5,144 Income (loss) from discontinued operations (1) (205) 8 1,131 15 933 (2)Net income (loss) $ 19,798 $ (4,109)$ 1,840 $ 269 $ 11,176 $ 17,798 $ 7,786 * Eliminated in consolidation.
50
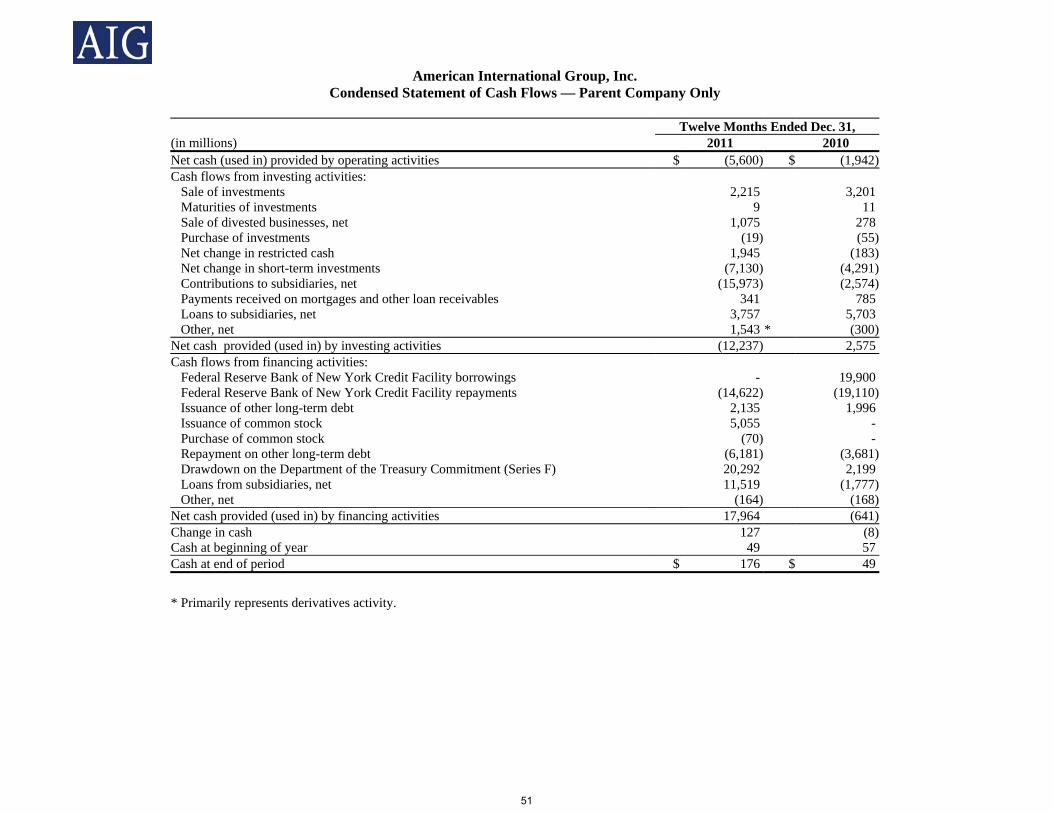
American International Group, Inc. Condensed Statement of Cash Flows — Parent Company Only Twelve Months Ended Dec. 31, (in millions) 2011 2010 Net cash (used in) provided by operating activities $ (5,600) $ (1,942) Cash flows from investing activities: Sale of investments 2,215 3,201 Maturities of investments 9 11 Sale of divested businesses, net 1,075 278 Purchase of investments (19) (55) Net change in restricted cash 1,945 (183) Net change in short-term investments (7,130) (4,291) Contributions to subsidiaries, net (15,973) (2,574) Payments received on mortgages and other loan receivables 341 785 Loans to subsidiaries, net 3,757 5,703 Other, net 1,543 * (300) Net cash provided (used in) by investing activities (12,237) 2,575 Cash flows from financing activities: Federal Reserve Bank of New York Credit Facility borrowings - 19,900 Federal Reserve Bank of New York Credit Facility repayments (14,622) (19,110) Issuance of other long-term debt 2,135 1,996 Issuance of common stock 5,055 - Purchase of common stock (70) - Repayment on other long-term debt (6,181) (3,681) Drawdown on the Department of the Treasury Commitment (Series F) 20,292 2,199 Loans from subsidiaries, net 11,519 (1,777) Other, net (164) (168) Net cash provided (used in) by financing activities 17,964 (641) Change in cash 127 (8) Cash at beginning of year 49 57 Cash at end of period $ 176 $ 49
* Primarily represents derivatives activity.
51
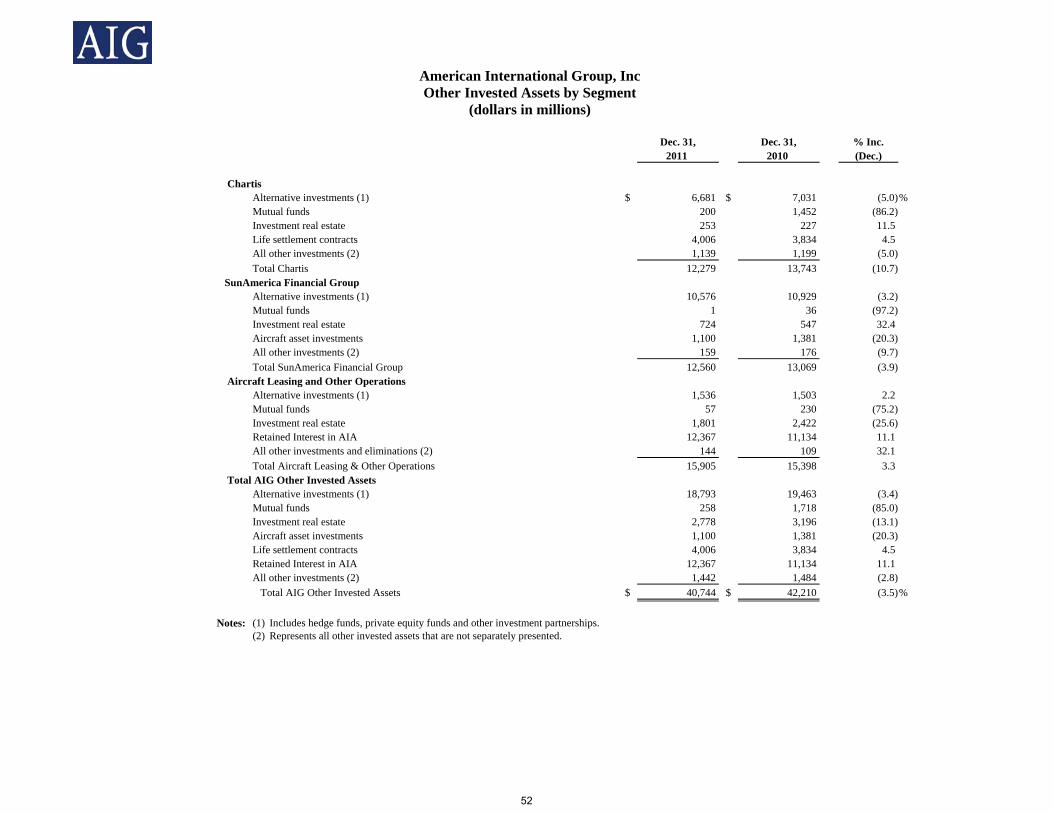
American International Group, Inc Other Invested Assets by Segment (dollars in millions) Dec. 31, Dec. 31, % Inc. 2011 2010 (Dec.) Chartis Alternative investments (1) $ 6,681 $ 7,031 (5.0)% Mutual funds 200 1,452 (86.2) Investment real estate 253 227 11.5 Life settlement contracts 4,006 3,834 4.5 All other investments (2) 1,139 1,199 (5.0) Total Chartis 12,279 13,743 (10.7) SunAmerica Financial Group Alternative investments (1) 10,576 10,929 (3.2) Mutual funds 1 36 (97.2) Investment real estate 724 547 32.4 Aircraft asset investments 1,100 1,381 (20.3) All other investments (2) 159 176 (9.7) Total SunAmerica Financial Group 12,560 13,069 (3.9) Aircraft Leasing and Other Operations Alternative investments (1) 1,536 1,503 2.2 Mutual funds 57 230 (75.2) Investment real estate 1,801 2,422 (25.6) Retained Interest in AIA 12,367 11,134 11.1 All other investments and eliminations (2) 144 109 32.1 Total Aircraft Leasing & Other Operations 15,905 15,398 3.3 Total AIG Other Invested Assets Alternative investments (1) 18,793 19,463 (3.4) Mutual funds 258 1,718 (85.0) Investment real estate 2,778 3,196 (13.1) Aircraft asset investments 1,100 1,381 (20.3) Life settlement contracts 4,006 3,834 4.5 Retained Interest in AIA 12,367 11,134 11.1 All other investments (2) 1,442 1,484 (2.8) Total AIG Other Invested Assets $ 40,744 $ 42,210 (3.5)%
Notes: (1) Includes hedge funds, private equity funds and other investment partnerships. (2) Represents all other invested assets that are not separately presented.
52

American International Group, Inc. Net Realized Capital Gains (Losses) (dollars in millions) Quarterly Full Year 4Q11 3Q11 2Q11 1Q11 4Q10 2011 2010 Chartis Bonds available for sale $ 211 $ 88 $ 341 $ 90 $ 94 $ 730 $ 381 Stocks available for sale 6 7 27 84 60 124 217 Other transactions (29) (30) (236) (77) 5 (372) 4 Other than temporary impairment charges:
Severity (5) (23) (13) (6) (8) (47) (31) Change in intent - (1) - - (76) (1) (389) Foreign currency declines (19) (8) (3) (2) (2) (32) (17) Issuer-specific credit events (74) (82) (26) (11) (12) (193) (141) Adverse projected cash flows on structured securities 1 (1) (1) - - (1) - Total other than temporary impairment charges (97) (115) (43) (19) (98) (274) (578) Foreign exchange transactions 157 (2) (58) (6) (47) 91 (57) Derivative instruments 196 109 8 (25) (51) 288 (16) Total pre-tax realized capital gains (losses) $ 444 $ 57 $ 39 $ 47 $ (37) $ 587 $ (49) SunAmerica Financial Group Bonds available for sale $ 338 $ 496 $ 283 $ 30 $ 321 $ 1,147 $ 1,196 Stocks available for sale (3) 11 9 19 29 36 82 Other transactions 15 76 (7) 12 (30) 96 (229) Other than temporary impairment charges: Severity - (2) - (2) (1) (4) (13) Change in intent (4) (3) - (4) (4) (11) (35) Issuer-specific credit events (242) (367) (130) (204) (517) (943) (1,907) Adverse projected cash flows on structured securities (2) (2) (2) (13) (3) (19) (4) Total other than temporary impairment charges (248) (374) (132) (223) (525) (977) (1,959) Foreign exchange transactions 5 104 (41) (70) (28) (2) 29 Derivative instruments (10) (275) (21) 12 724 (294) (370) Total pre-tax realized capital gains (losses) $ 97 $ 38 $ 91 $ (220) $ 491 $ 6 $ (1,251) Aircraft Leasing & Other Operations Bonds available for sale $ 6 $ 17 $ - $ 13 $ 125 $ 36 $ 269 Stocks available for sale 1 2 1 - 232 4 426 Other transactions 7 (33) 27 9 34 10 (114) Other than temporary impairment charges: Severity - - - - (10) - (29) Change in intent - - - - - - (17) Foreign currency declines - - - - (40) - (45) Issuer-specific credit events (3) (7) (6) (13) (95) (29) (411) Total other than temporary impairment charges (3) (7) (6) (13) (145) (29) (502) Change in the fair value of MetLife securities prior to the sale - - - (191) 315 (191) 315 Foreign exchange transactions 148 509 (247) (615) (8) (205) 206 Derivative instruments (6) (171) 161 319 300 303 525 Total pre-tax realized capital gains (losses) $ 153 $ 317 $ (64) $ (478) $ 853 $ (72) $ 1,125 Total realized gains (losses) Bonds available for sale $ 555 $ 601 $ 624 $ 133 $ 540 $ 1,913 $ 1,846 Stocks available for sale 4 20 37 103 321 164 725 Other transactions (7) 13 (216) (56) 9 (266) (339) Other than temporary impairment charges: Severity (5) (25) (13) (8) (19) (51) (73) Change in intent (4) (4) - (4) (80) (12) (441) Foreign currency declines (19) (8) (3) (2) (42) (32) (62) Issuer-specific credit events (319) (456) (162) (228) (624) (1,165) (2,459) Adverse projected cash flows on structured securities (1) (3) (3) (13) (3) (20) (4) Total other than temporary impairment charges (348) (496) (181) (255) (768) (1,280) (3,039) Change in the fair value of MetLife securities prior to the sale - - - (191) 315 (191) 315 Foreign exchange transactions 310 611 (346) (691) (83) (116) 178 Derivative instruments 180 (337) 148 306 973 297 139 Total pre-tax realized capital gains (losses) $ 694 $ 412 $ 66 $ (651) $ 1,307 $ 521 $ (175) Total realized losses, net of tax $ 377 $ 302 $ 44 $ (387) $ 317 $ 336 $ (860)
53
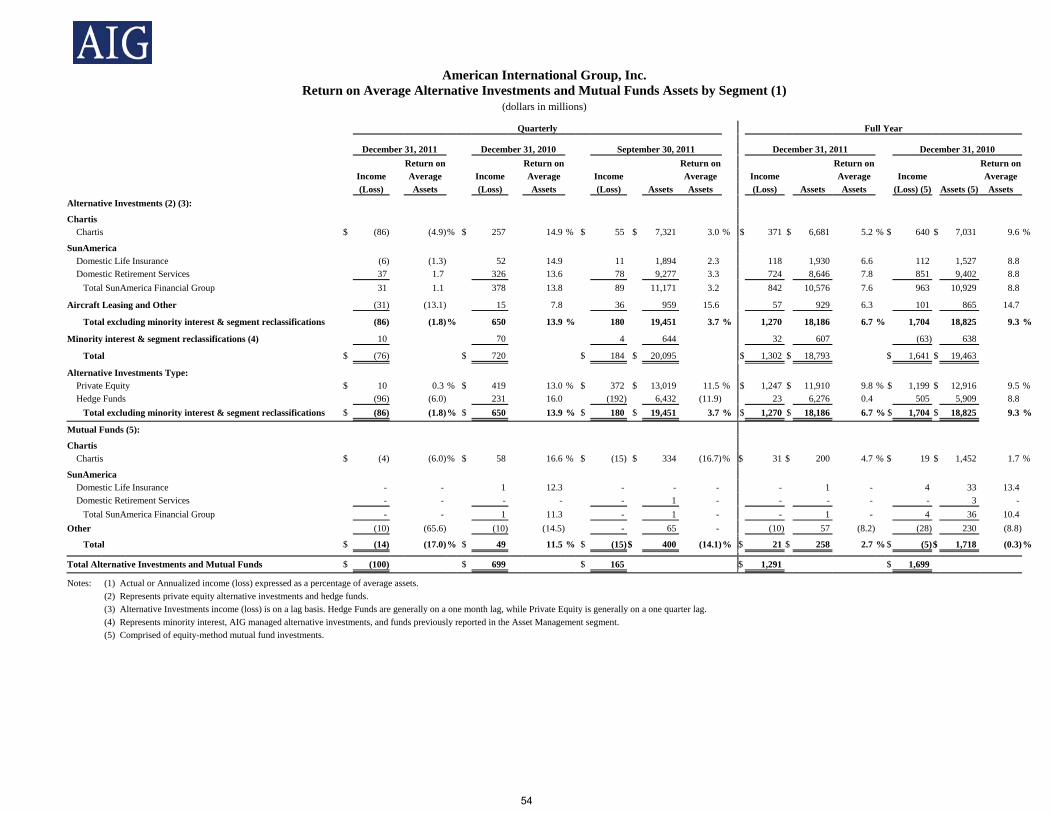
American International Group, Inc.
Return on Average Alternative Investments and Mutual Funds Assets by Segment (1) (dollars in millions)
Quarterly Full Year
December 31, 2011 December 31, 2010 September 30, 2011 December 31, 2011 December 31, 2010 Return on Return on Return on Return on Return on Income Average Income Average Income Average Income Average Income Average (Loss) Assets (Loss) Assets (Loss) Assets Assets (Loss) Assets Assets (Loss) (5) Assets (5) Assets Alternative Investments (2) (3):
Chartis Chartis $ (86) (4.9)% $ 257 14.9 % $ 55 $ 7,321 3.0 % $ 371 $ 6,681 5.2 % $ 640 $ 7,031 9.6 %
SunAmerica Domestic Life Insurance (6) (1.3) 52 14.9 11 1,894 2.3 118 1,930 6.6 112 1,527 8.8 Domestic Retirement Services 37 1.7 326 13.6 78 9,277 3.3 724 8,646 7.8 851 9,402 8.8 Total SunAmerica Financial Group 31 1.1 378 13.8 89 11,171 3.2 842 10,576 7.6 963 10,929 8.8
Aircraft Leasing and Other (31) (13.1) 15 7.8 36 959 15.6 57 929 6.3 101 865 14.7
Total excluding minority interest & segment reclassifications (86) (1.8)% 650 13.9 % 180 19,451 3.7 % 1,270 18,186 6.7 % 1,704 18,825 9.3 %
Minority interest & segment reclassifications (4) 10 70 4 644 32 607 (63) 638
Total $ (76) $ 720 $ 184 $ 20,095 $ 1,302 $ 18,793 $ 1,641 $ 19,463
Alternative Investments Type: Private Equity $ 10 0.3 % $ 419 13.0 % $ 372 $ 13,019 11.5 % $ 1,247 $ 11,910 9.8 % $ 1,199 $ 12,916 9.5 % Hedge Funds (96) (6.0) 231 16.0 (192) 6,432 (11.9) 23 6,276 0.4 505 5,909 8.8 Total excluding minority interest & segment reclassifications $ (86) (1.8)% $ 650 13.9 % $ 180 $ 19,451 3.7 % $ 1,270 $ 18,186 6.7 % $ 1,704 $ 18,825 9.3 %
Mutual Funds (5):
Chartis Chartis $ (4) (6.0)% $ 58 16.6 % $ (15) $ 334 (16.7)% $ 31 $ 200 4.7 % $ 19 $ 1,452 1.7 %
SunAmerica Domestic Life Insurance - - 1 12.3 - - - - 1 - 4 33 13.4 Domestic Retirement Services - - - - - 1 - - - - - 3 - Total SunAmerica Financial Group - - 1 11.3 - 1 - - 1 - 4 36 10.4 Other (10) (65.6) (10) (14.5) - 65 - (10) 57 (8.2) (28) 230 (8.8)
Total $ (14) (17.0)% $ 49 11.5 % $ (15) $ 400 (14.1)% $ 21 $ 258 2.7 % $ (5)$ 1,718 (0.3) %
Total Alternative Investments and Mutual Funds $ (100) $ 699 $ 165 $ 1,291 $ 1,699
Notes: (1) Actual or Annualized income (loss) expressed as a percentage of average assets. (2) Represents private equity alternative investments and hedge funds. (3) Alternative Investments income (loss) is on a lag basis. Hedge Funds are generally on a one month lag, while Private Equity is generally on a one quarter lag. (4) Represents minority interest, AIG managed alternative investments, and funds previously reported in the Asset Management segment. (5) Comprised of equity-method mutual fund investments.
54