Embed Size (px)
Citation preview

American Journal Of Business Education – May/June 2012 Volume 5, Number 3
© 2012 The Clute Institute 245
Theory And Practice In CEO Pay:
A Course Module And Integrative
Case Based On Boeing Inc. John F. Boschen, Ph.D., College of William and Mary, USA
Kimberly J. Smith, Ph.D., College of William and Mary, USA
ABSTRACT
Business students may dream of receiving pay packages like that of Michael Eisner at Disney.
However, many of them will work for the compensation consultant who determines the economics
of the pay arrangements, for the valuation consultant who values the different components of the
pay arrangements, for the accountant who must audit the financial statement impacts of the pay
arrangements, or as a manager in the company whose employees respond to the incentives
provided by the pay arrangements. No matter their eventual role, it is critical that every student
understands these various aspects of executive pay arrangements, and how these practices have
evolved over time. The course module presented herein is designed to effectively integrate these
perspectives in as few as five or as many as nine 80-minute sessions that could be a substantive
component of an MBA or Master of Accounting capstone course, or a component of a corporate
governance elective. A case based on the CEO compensation of Boeing Inc. over the last 60 years
provides a series of assignments that effectively integrate the module.
Keywords: Executive Compensation; Agency Theory; Teaching Methods; Employee Stock Options; CEO Pay
INTRODUCTION
he importance of incorporating a module on incentives of corporate leaders into business education
cannot be overstated. It is critical that students be able to analyze the agency problems inherent in a
business scenario, as well as understand the implications and effectiveness of pay plans in
mitigating—or exacerbating—these problems. This module presents an efficient and relatively comprehensive
coverage of the economics, finance, and accounting issues related to executive pay arrangements.
This module is structured to address the following questions:
What is the principal-agent problem and how does it relate to corporate managers?
What types of compensation arrangements do companies use to align the incentives of managers and
shareholders?
What disclosure requirements and other regulations are in effect for executive pay over this timeframe?
How do we determine the fair value of cash- and stock-based compensation?
Is the fair value the same for the company and the executives?
Why has the level of executive pay increased so much?
Which measure of company performance should we tie executive pay to?
How strong is the relation between executive pay and company performance? How strong should it be?
How has the accounting for executive pay in the company’s financial statements evolved over time?
What are the current accounting standards for stock-based compensation?
Have executive stock options changed in response to the changes in accounting standards for stock-based
compensation?
T

American Journal Of Business Education – May/June 2012 Volume 5, Number 3
246 © 2012 The Clute Institute
There are three major pedagogical components in the module: a research component, a case component,
and an optional writing component. The research component relies on a series of recommended research papers, any
or all of which can be assigned for students to read. The case component is based on a unique dataset consisting of
the CEO compensation of Boeing Inc. from 1950-2009. This 60-year dataset allows students to see practical
implementation of the theoretical ideas discussed in the research papers, and to follow the evolution of
compensation arrangements over time. The optional integrative writing component requires students to design,
implement, and write-up their own mini-research study.
To complete the full module as described, students will be required to complete challenging readings,
manipulate data graphically, utilize a Black Scholes option valuation model, run a linear regression, and write about
technical issues. However, the module allows for flexibility in implementation. For example, rather than assign
extensive reading of the research papers, the faculty member can summarize the research papers in a lecture, or ask
students to read only certain sections of (some of) the papers. The faculty member may illustrate the option
valuation and/or the linear regression analyses in class. Finally, the faculty member could complete certain parts of
the mini-research study in class and then allow students (or student teams) to focus on the write-up. Note that all
compensation and performance data is available in an Excel spreadsheet from the corresponding author on request.
Below is a teaching plan based on nine 80-minute sessions (i.e., 12 contact hours). A topic and learning
goals are provided for each session. References to recommended research papers are also provided. Specific
assignments for the data from Boeing Inc. are included for each session. Finally several Harvard Business School
cases are recommended for possible supplementation.
A number of the sessions are denoted as optional, to allow the implementation of a shorter module.
Specifically, the shorter module requires five 80-minute sessions (i.e., 6.7 contact hours). Any modules that are
skipped can be discussed briefly by the instructor during an adjacent session.
TEACHING PLAN
Session 1
Topic: What is the principal-agent problem and how does it relate to corporate managers?
Learning goal: Students will understand and be able to discuss principal-agent problems stemming from the
information asymmetry and moral hazard that result from hiring specialized managers to run a company.
Assignment to be completed before class: Read Jensen and Meckling (1976).
Assignment to be completed after class: Read about the history of Boeing Inc. at the company website:
http://www.boeing.com/history/index.html. Note significant events in the history of Boeing that you think might
affect the incentives of the senior executives and the CEO.
Deliverable: Each team should turn in a timeline of their noted events in the history of Boeing that affect the
incentives of the senior executives and the CEO. Define years as the horizontal axis and make the timeline no longer
than two 8.5x11 pages with landscape orientation. This timeline should be created in Microsoft excel and allow
room to add additional data as the course continues (see assignments below).
We suggest using class time to discuss examples of activities where the outcome is partly a function of inputs (e.g.,
effort) and partly a function of chance (e.g., external events over which you have no control). Then, building on
these ideas, we recommend a discussion of how to pay for effort when it is unobservable, and what the consequences
are for managerial behavior. A nice basis for this discussion is presented in Christensen and Feltham (2005, 3-6).
American Journal Of Business Education – May/June 2012 Volume 5, Number 3
© 2012 The Clute Institute 247
Session 2 (optional)
Topic: What types of compensation arrangements do companies use to align the incentives of managers and
shareholders? What disclosure requirements and other regulations are in effect for executive pay over this
timeframe?
Learning goal: Students will understand and be able to discuss various components of compensation (e.g., salary,
bonus, stock options, stock grants, pensions etc.) and how these components have been regulated and reported to
shareholders over time.
Assignment to be completed before class: Read Lynch and Perry (2003); Examine the CEO pay data presented in
Tables 1 and 2. Read Murphy (2011).
Assignment to be completed during or after class: Compare the excerpts from Boeing’s proxy statement for 1960 in
Table 3 and the proxy for 1980 in Table 4 with the proxy statement from the SEC website (www.sec.gov) for fiscal
2009 (note that the proxy filing is labeled “DEF 14A” and is issued in early 2010).
Deliverable: Each team should turn in an updated timeline after adding notations for the significant regulatory
changes and disclosure changes.
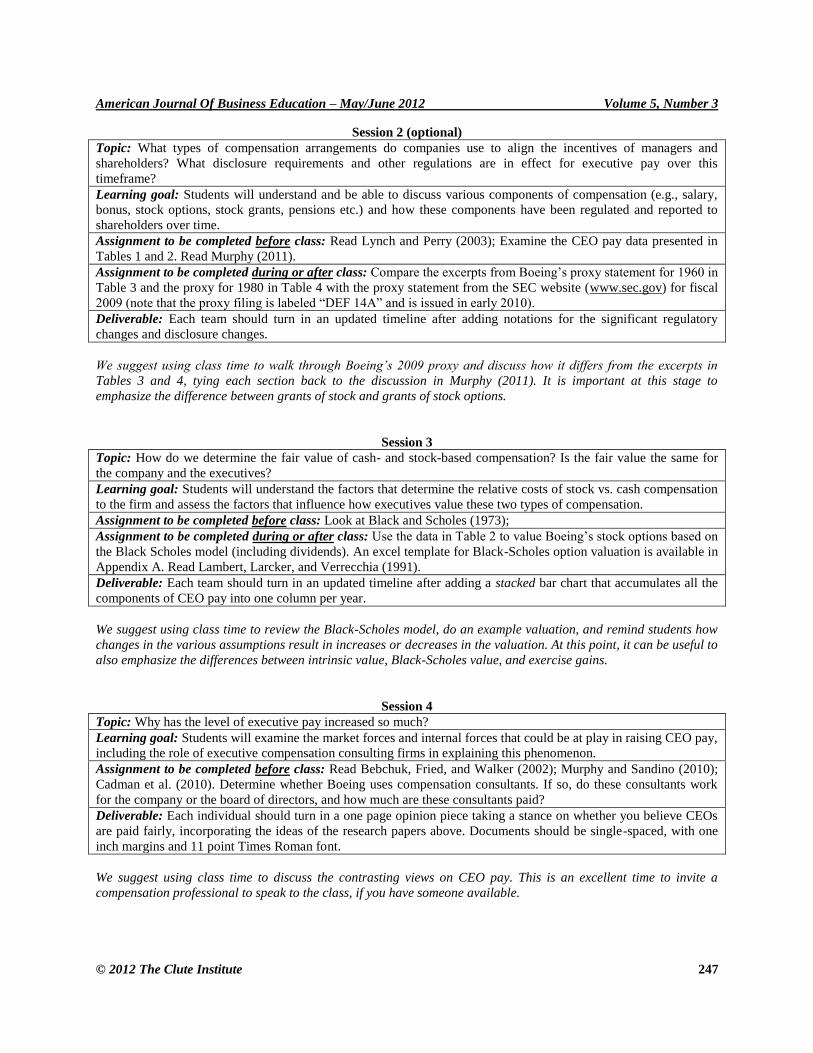
We suggest using class time to walk through Boeing’s 2009 proxy and discuss how it differs from the excerpts in
Tables 3 and 4, tying each section back to the discussion in Murphy (2011). It is important at this stage to
emphasize the difference between grants of stock and grants of stock options.
Session 3
Topic: How do we determine the fair value of cash- and stock-based compensation? Is the fair value the same for
the company and the executives?
Learning goal: Students will understand the factors that determine the relative costs of stock vs. cash compensation
to the firm and assess the factors that influence how executives value these two types of compensation.
Assignment to be completed before class: Look at Black and Scholes (1973);
Assignment to be completed during or after class: Use the data in Table 2 to value Boeing’s stock options based on
the Black Scholes model (including dividends). An excel template for Black-Scholes option valuation is available in
Appendix A. Read Lambert, Larcker, and Verrecchia (1991).
Deliverable: Each team should turn in an updated timeline after adding a stacked bar chart that accumulates all the
components of CEO pay into one column per year.
We suggest using class time to review the Black-Scholes model, do an example valuation, and remind students how
changes in the various assumptions result in increases or decreases in the valuation. At this point, it can be useful to
also emphasize the differences between intrinsic value, Black-Scholes value, and exercise gains.
Session 4
Topic: Why has the level of executive pay increased so much?
Learning goal: Students will examine the market forces and internal forces that could be at play in raising CEO pay,
including the role of executive compensation consulting firms in explaining this phenomenon.
Assignment to be completed before class: Read Bebchuk, Fried, and Walker (2002); Murphy and Sandino (2010);
Cadman et al. (2010). Determine whether Boeing uses compensation consultants. If so, do these consultants work
for the company or the board of directors, and how much are these consultants paid?
Deliverable: Each individual should turn in a one page opinion piece taking a stance on whether you believe CEOs
are paid fairly, incorporating the ideas of the research papers above. Documents should be single-spaced, with one
inch margins and 11 point Times Roman font.
We suggest using class time to discuss the contrasting views on CEO pay. This is an excellent time to invite a
compensation professional to speak to the class, if you have someone available.

American Journal Of Business Education – May/June 2012 Volume 5, Number 3
248 © 2012 The Clute Institute
Session 5 (optional)
Topic: Which measure of company performance should we tie executive pay to?
Learning goal: Students will understand and be able to discuss the challenges surrounding the goal of selecting
performance measures that align the incentives of managers and shareholders, along with whether and how to hold
managers responsible for outcomes they do not control.
Assignment to be completed before class: Read Albuquerque (2009). Consider some of the attributes of the data on
Boeing’s performance presented in Table 1.
Deliverable: Each team should turn in an updated timeline after adding Boeing’s performance: the total stock
returns, ROA (e.g., return on assets), and the return on the market index. Introduce a second y-axis and use lines for
the performance data.
We suggest using class time to discuss the differences between stock returns, market returns, and accounting-based
return on investment (ROA). It is useful to emphasize the differences in volatility among the three measures. The
ideas behind relative performance evaluation (RPE) may require some discussion and explanation.
Session 6
Topic: How strong is the relation between executive pay and company performance? How strong should it be?
Learning goal: Students will investigate the relation between executive pay and company performance using
regression analysis, and will interpret their findings in the context of the related research questions.
Assignment to be completed before class: Read introductions and conclusions of Jensen and Murphy (1990);
Garvey and Milbourn (2006); Dial and Murphy (1995)
Assignment to be completed after class: Estimate linear regression models of Boeing’s CEO pay on measures of
performance to investigate whether (1) Boeing’s CEO pay is significantly associated with its performance, (2)
Boeing pays its CEO for “luck” (i.e., does not control for market performance), and (3) Boeing pays its CEO for
good performance but does not penalize him for poor performance.
Deliverable: Each team should turn in a two page summary of conclusions from the regression analysis. Documents
should be single-spaced, with one inch margins and 11 point Times Roman font. One appendix of up to two pages
should be attached with your regression results. A second appendix should be attached with your finalized timeline.
Optional Related case: General Dynamics: Compensation and Strategy (A) and (B).
We suggest using class time to review regression analysis and to interpret some of the regressions run in Jensen and
Murphy (1990). It may be important to explain how to use interaction terms and dummy variables.
Session 7 (optional)
Topic: How has the accounting for executive pay in the company’s financial statements evolved over time?
Learning goal: Students will understand the evolution of accounting for stock-based compensation from APB 25
through SFAS No. 123R, the unintended consequences of these standards, and the challenges of the standard setting
process.
Assignment to be completed before class: Read Jones and Smith (2012). Then, go to www.sec.gov and look at
Boeing’s 10-Ks for fiscal years 2009 and 1997. How much expense is recognized for the stock options Boeing
granted to all employees in each of these years? If the current accounting standards had been in place in 1997, how
much expense would have been recognized? How do the disclosures about employee stock options differ in these
two years?
Assignment to be completed after class: Read Lie (2005).
We recommend using class time to walk through Jones and Smith (2012) and discuss the political aspects of
standard setting. It is useful to work through the examples of accounting for “fixed” and” variable” options. It is
probably important to emphasize that most companies continued to use APB 25 accounting when the original SFAS
No. 123 was passed—only their disclosures changed. This process sets up the students to understand the motivation
behind option back-dating in Lie (2005).

American Journal Of Business Education – May/June 2012 Volume 5, Number 3
© 2012 The Clute Institute 249
Session 8
Topic: What are the current accounting standards for stock-based compensation?
Learning goal: Students will understand the basic accounting for stock options under SFAS No. 123R, including
accounting for service, performance and market conditions.
Assignment to be completed before class: Read Topic 718 in the Codification (or SFAS No. 123R).
Assignment to be completed after class: Refer to Boeing’s most current proxy statement. Do you see any new types
of stock options granted to executives (e.g., indexed options, performance-based options)?
Students will have difficulty understanding the current accounting for stock options (i.e., SFAS No. 123R), and it
may be useful to narrow the scope of their reading. We suggest using class time to discuss some examples of stock
options with service conditions, performance conditions, and market conditions. Also, it is important to emphasize
that these new types of options (e.g., with performance or market conditions) may provide substantially improved
incentives to executives. This sets up the students to understand why we would be interested in investigating whether
more companies began using these more complex (but possibly superior) options when SFAS No. 123R was
implemented.
Session 9 (optional)
Topic: Have executive stock options changed in response to the changes in accounting standards for stock-based
compensation? [Note: this session could be used instead as a continuation of Session 8 if more time is desired to
cover that topic.]
Learning goal: Students will experience conducting a mini-research study that includes a literature review, data
gathering, and descriptive statistics.
Assignment to be completed after class: Conduct your own research study on the question of whether the change in
accounting standards is associated with a significant increase in the use of more complex types of options (e.g.,
market indexed options). Search for research or popular press articles that address this issue. Search for companies
that have changed their option plans, collect data, and report descriptive statistics. Carefully describe your methods.
Do you find any evidence that the change in accounting standards has resulted in changes in the types of options
granted to CEOs?
Deliverable: Each team should turn in a research paper, maximum 6 pages of writing, not including exhibits,
appendices, and references. An appendix should show all data used in the analysis, in table form. Documents should
be single-spaced, with one inch margins and 11 point Times Roman font.
Grading Rubric: See Ahlawat et al. (2012) for an excellent research paper grading rubric.
We suggest using class time to further reinforce the current accounting for stock compensation and discussing how
to lay out a research paper.
CONCLUSION
In this module we provide a course of study for important aspects of executive pay arrangements and how
they address agency problems in public corporations. The module includes components on research, case analysis,
and an optional writing assignment. The module also presents a unique 60-year time-series of compensation and
performance data set for Boeing Inc. that allows a unique opportunity to examine the evolution of executive pay
arrangements.
AUTHOR INFORMATION
John F. Boschen is Brinkley-Mason Professor of Economics and Finance at The College of William and Mary. He
completed his PhD in Economics at Brown University in 1981. He was an economist at the Federal Reserve Board,
and has been Visiting Scholar at the Federal Reserve Banks of Kansas City and Richmond. His research interests
include business cycles, monetary policy, and inflation risk, and he has published over two dozen articles in such
respected journals as the Journal of Business, Journal of Money Credit and Banking, the Journal of Monetary
Economics and The Accounting Review. E-mail: [email protected]
American Journal Of Business Education – May/June 2012 Volume 5, Number 3
250 © 2012 The Clute Institute
Kimberly J. Smith is Professor and KPMG Accounting Fellow at The College of William and Mary. She
completed her Ph.D. in Business Administration at the University of Maryland in 1989. In 2003-2004, she served as
the Academic Accounting Fellow at the Office of the Chief Accountant of the U.S. Securities and Exchange
Commission. Her research interests include CEO pay and performance, and off-balance sheet arrangements, and she
has published a number of articles in leading journals such as The Accounting Review, Journal of Business,
Accounting Organizations and Society, Journal of Management Accounting Research, and Issues in Accounting
Education. E-mail: [email protected]. Corresponding author.
REFERENCES
1. Accounting Principles Board (APB) of the American Institute of Certified Public Accountants (AICPA).
1972. Accounting for Stock Issued to Employees. APB Opinion No. 25. New York, NY: AICPA.
2. Ahlawat, S., Miller, G., Shahid, A. (2012). “Promoting liberal learning in a capstone accounting course.”
American Journal of Business Education 5 (1), 11-24.
3. Albuquerque, A. (2009). “Peer firms in relative performance evaluation.” Journal of Accounting and
Economics 48 (1), 69-89.
4. Antle, R., and Demski, J. (1988). “The controllability principle in responsibility accounting.” The
Accounting Review 63 (4), 700-718.
5. Bebchuk, L., Fried, A. (2003). “Executive compensation as an agency problem.” Journal of Economic
Perspectives 17 (3), 71-92.
6. Black, F., Scholes, M. (1973). “The pricing of options and corporate liabilities.” Journal of Political
Economy 81 (3), 637-654.
7. Cadman, B., Carter, M., Hillegeist, S. (2010). “The incentives of compensation consultants.” Journal of
Accounting and Economics 49 (3), 263-280.
8. Christensen, P., and Feltham, G. (2005). Economics of Accounting Volume II: Performance Evaluation,
New York: Springer Science+Business Media.
9. Dial, J., and Murphy, K. (1995). “Incentives, downsizing, and value creation at General Dynamics.”
Journal of Financial Economics 37 (3), 261-314.
10. Jensen, M.,Meckling, W. (1976). “Theory of the firm: Managerial behavior, agency costs, and ownership
structure.” Journal of Financial Economics 3 (4), 305-360.
11. Jones, D., Smith, K. (2012). “Employee stock options.” (working paper).
12. Lambert, R., Larcker, D.,Verrecchia, R. (1991). “Portfolio considerations in valuing executive
compensation.” Journal of Accounting Research 19 (Supplement), 129-49.
13. Lie, E. (2005). “On the timing of CEO stock option awards.” Management Science 51 (5), 802-812.
14. Lynch, L., Perry, S. (2003). “An overview of management compensation.” Journal of Accounting
Education 21 (1), 43-60.
15. Murphy, K. (2002). “Explaining executive compensation: Managerial power versus the perceived cost of
stock options.” University of Chicago Law Review 69 (Summer), 847-869.
16. Murphy, K. (2011). “The politics of pay: A legislative history of executive compensation.” In: Hill, J.,
Thomas, R., (Eds.), The Research Handbook on Executive Pay, Edward Elgar Publishers (forthcoming).
17. Murphy, K., and Dial, J. (1993). General Dynamics: Compensation and strategy (A and B), HBS cases no.
9-494-048 and 9-494-049 (Harvard Business School, Boston, MA).
18. Murphy, K., Sandino, T. (2010). “Executive pay and ‘independent’ compensation consultants.” Journal of
Accounting and Economics 49 (3), 247-262.
19. Narayanan, V., Ferri, F., Brem, L. (2010). Executive Pay and the Credit Crisis of 2008 (A and B), HBS
cases no. 9-109-036 and 9-110-005 (Harvard Business School, Boston, MA).
American Journal Of Business Education – May/June 2012 Volume 5, Number 3
© 2012 The Clute Institute 251
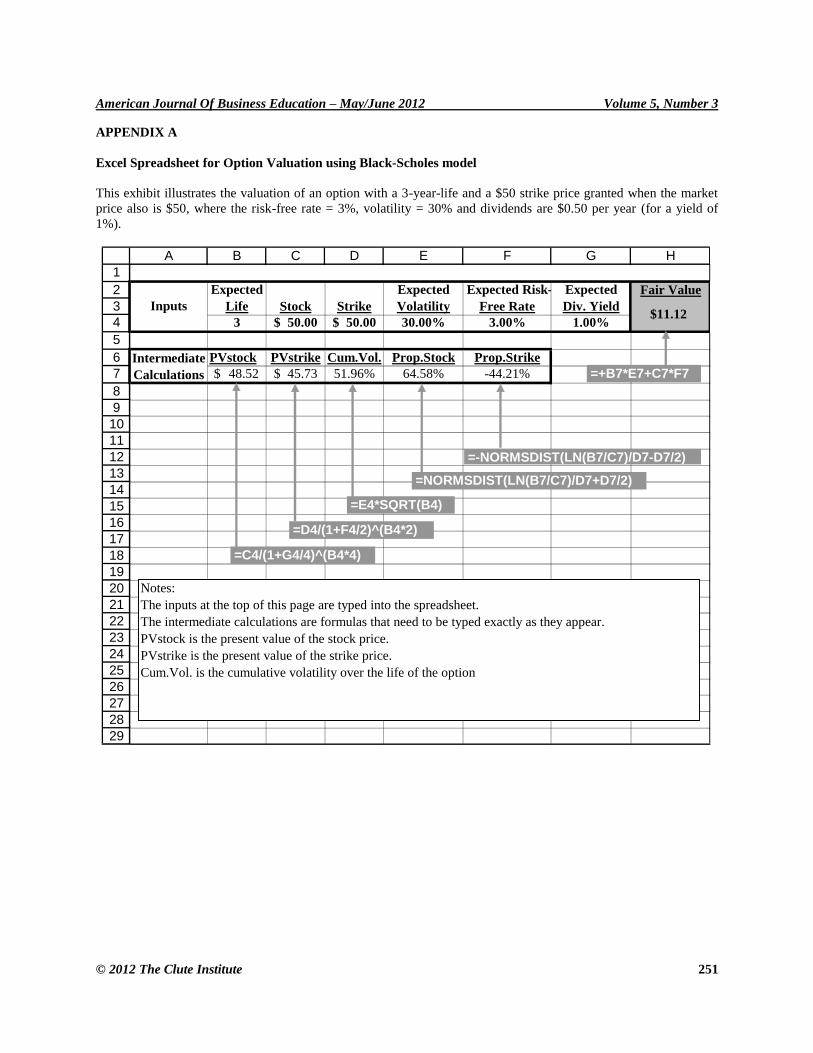
APPENDIX A
Excel Spreadsheet for Option Valuation using Black-Scholes model
This exhibit illustrates the valuation of an option with a 3-year-life and a $50 strike price granted when the market
price also is $50, where the risk-free rate = 3%, volatility = 30% and dividends are $0.50 per year (for a yield of
1%).
1
2
3
4
5
6
7
8
9
10
11
12
13
14
15
16
17
18
19
20
21
22
23
24
25
26
27
28
29
A B C D E F G H
Fair Value
3 50.00$ 50.00$ 30.00% 3.00% 1.00%
PVstock PVstrike Cum.Vol. Prop.Stock Prop.Strike
48.52$ 45.73$ 51.96% 64.58% -44.21%
Intermediate
Calculations
Inputs
Expected
Life Stock Strike
Expected
Volatility
Expected Risk-
Free Rate
Expected
Div. Yield$11.12
=D4/(1+F4/2)^(B4*2)
=-NORMSDIST(LN(B7/C7)/D7-D7/2)
=NORMSDIST(LN(B7/C7)/D7+D7/2)
=NORMSDIST(LN(B7/C7)/D7+D7/2) =E4*SQRT(B4)
=C4/(1+G4/4)^(B4*4)
=+B7*E7+C7*F7
Notes:
The inputs at the top of this page are typed into the spreadsheet.
The intermediate calculations are formulas that need to be typed exactly as they appear.
PVstock is the present value of the stock price.
PVstrike is the present value of the strike price.
Cum.Vol. is the cumulative volatility over the life of the option

American Journal Of Business Education – May/June 2012 Volume 5, Number 3
252 © 2012 The Clute Institute
Table 1
Boeing Inc. Data on CEO Compensation and Performance
Year Name Position Base Pay
(000) Code
Bonus
(000)
Other
(000)
LTIP
(000)
Change in
Pension (000)
Value of Stock
Grant (000)
Boeing annual
stock return
Boeing
ROA
Value-
weighted
Market Index
1950 Allen CEO $67.3 SB 94.20% 8.73% 30.02%
1951 Allen CEO $86.0 SB 16.60% 4.42% 20.83%
1952 Allen CEO $86.9 SB 45.00% 6.82% 13.29%
1953 Allen CEO $101.6 SB 28.50% 6.74% 0.35%
1954 Allen CEO $107.5 SB 224.50% 11.50% 50.18%
1955 Allen CEO $118.4 SB 12.90% 10.16% 25.30%
1956 Allen CEO $117.4 SB 61.60% 9.68% 8.47%
1957 Allen CEO $120.1 SB -34.50% 7.77% -10.37%
1958 Allen CEO $135.2 SB 33.10% 4.85% 44.83%
1959 Allen P $130.8 AR -30.60% 2.09% 12.60%
1960 Allen P $135.2 AR 24.00% 4.55% 1.16%
1961 Allen P $139.4 AR 41.40% 6.04% 26.94%
1962 Allen P $144.2 AR -22.50% 4.19% -10.32%
1963 Allen P $137.1 AR 2.00% 3.27% 20.89%
1964 Allen P $148.9 AR 99.40% 6.96% 16.30%
1965 Allen P $161.9 AR $4.0 95.10% 10.27% 14.39%
1966 Allen P $175.0 AR $4.3 8.50% 5.27% -8.69%
1967 Allen P $186.5 AR $4.6 39.80% 4.13% 28.57%
1968 Allen CB&P $198.5 AR $4.9 -36.00% 3.80% 14.17%
1969 Wilson P&CEO $180.5 AR $5.9 -49.00% 0.39% -10.84%
1970 Wilson P&CEO $139.8 AR $8.5 -48.10% 0.84% 0.07%
1971 Wilson P&CEO $124.5 AR $8.3 33.60% 1.71% 16.20%
1972 Wilson CB&CEO $141.3 AR $8.1 36.50% 1.43% 17.34%
1973 Wilson CB&CEO $180.1 AR $9.1 -49.40% 3.04% -18.75%
1974 Wilson CB&CEO $239.2 AR $11.8 32.90% 4.15% -27.94%
1975 Wilson CB&CEO $295.2 AR $11.8 61.20% 4.27% 37.36%
1976 Wilson CB&CEO $341.3 AR $13.0 89.90% 5.36% 26.77%
1977 Wilson CB&CEO $397.0 AR $15.8 29.90% 7.39% -2.98%
1978 Wilson CB&CEO $516.7 SB 163.90% 9.04% 8.54%
1979 Wilson CB&CEO $551.9 SB 11.50% 10.32% 24.41%

American Journal Of Business Education – May/June 2012 Volume 5, Number 3
© 2012 The Clute Institute 253
Table 1, continued
Year Name Position Base Pay
(000) Code
Bonus
(000)
Other
(000)
LTIP
(000)
Pension
(000)
Stock
(000)
Stock
Return ROA
Market
Index
1980 Wilson CB&CEO $649.3 SB 35.70% 10.12% 33.24%
1981 Wilson CB&CEO $751.3 SB -46.30% 6.80% -3.99%
1982 Wilson CB&CEO $807.4 SB 60.50% 3.85% 20.42%
1983 Wilson CB&CEO $873.2 CC 33.80% 4.75% 22.65%
1984 Wilson CB&CEO $996.8 CC 33.40% 9.28% 3.16%
1985 Wilson CB&CEO $998.0 CC 41.60% 6.12% 31.41%
1986 Shrontz P&CEO $674.4 CC 0.00% 3.01% 15.56%
1987 Shrontz P&CEO $737.2 CC -25.40% 3.82% 1.83%
1988 Shrontz P&CEO $846.3 CC 68.50% 4.87% 17.56%
1989 Shrontz CB&CEO $910.3 CC 50.20% 7.33% 28.43%
1990 Shrontz CB&CEO $1094.5 CC 16.90% 9.49% -6.08%
1991 Shrontz CB&CEO $1188.0 CC $188.4 7.50% 9.93% 33.64%
1992 Shrontz CB&CEO $821.4 S $554.0 $55.5 $185.0 $184.0 -13.90% 3.04% 9.07%
1993 Shrontz CB&CEO $796.9 S $624.0 $66.7 $218.4 $170.2 10.70% 6.08% 11.58%
1994 Shrontz CB&CEO $844.8 S $600.0 $75.0 $404.8 $149.2 11.10% 3.99% -0.76%
1995 Shrontz CB&CEO $944.1 S $712.0 $85.3 $573.9 $287.1 69.60% 1.78% 35.67%
1996 Condit P&CEO $694.8 S $639.0 $58.0 $258.7 37.56% 4.02% 21.16%
1997 Condit CB&CEO $884.7 S $446.0 $69.5 $204.4 -7.12% -0.47% 30.33%
1998 Condit CB&CEO $998.9 S $0 $81.8 $192.2 -32.43% 3.05% 22.28%
1999 Condit CB&CEO $1093.1 S $1900.8 $86.3 $1431.5 28.77% 6.39% 25.27%
2000 Condit CB&CEO $1359.2 S $1978.2 $187.3 $12104.6 $3068.6 61.20% 5.06% -11.08%
2001 Condit CB&CEO $1479.2 S $1134.0 $296.7 $1127.2 -40.44% 5.85% -11.27%
2002 Condit CB&CEO $1547.3 S $982.8 $444.4 $903.4 -13.45% 0.94% -20.84%
2003 Condit CB&CEO $1620.0 S $599.0 $483.1 $621.3 30.40% 1.35% 33.14%
2004 Stonecipher P&CEO $1500.0 S $1260.0 $819.5 $1234.8 24.81% 3.47% 13.00%
2005 McNerney CB&P&CEO $841.3 S $2297.5 $426.6 $25289.9 37.84% 4.28% 7.32%
2006 McNerney CB&P&CEO $1750.0 S $4025.0 $2063.5 $1149.9 $8712.3 28.40% 4.28% 16.22%
2007 McNerney CB&P&CEO $1800.1 S $4299.5 $966.3 $3459.1 $4845.5 -0.08% 6.91% 7.30%
2008 McNerney CB&P&CEO $1915.3 S $1476.5 $846.1 $4613.1 $1860.8 $2660.2 -49.97% 4.97% -38.31%
2009 McNerney CB&P&CEO $1930.0 S $2340.3 $1002.6 $2160.0 $5738.0 $3136.3 31.90% 2.11% 31.63%
Positions held by the top executive are denoted as follows: chairman of the board (CB); president (P); chief executive officer (CEO). Compensation base pay includes the measure
of base pay reported in the proxy as follows: salary plus bonus (SB); aggregate remuneration (AR); cash compensation (CC); salary (S). Bonus is presented separately where it is
disclosed separately. LTIP is long-term incentive pay. Pension is the change in the value of the executive’s pension plan. Stock is the value of Boeing shares of stock granted to the
executive (not stock options). ROA is net income ÷ total assets; Stock return is measured annually and includes dividends; Market return is based on the value-weighted market
index; both returns are based on aggregated monthly returns from CRSP.

American Journal Of Business Education – May/June 2012 Volume 5, Number 3
254 © 2012 The Clute Institute
Table 2
Boeing Inc. CEO Stock Option Grant Data
Year Name Grant Date Number of
Options Term
Strike
Price ($) Volatility (%) Dividend Yield (%) Risk-Free Rate (%)
1958 Allen unknown 3000 10 48.8750 31.40 3.13 3.86
1959 Allen unknown 7500 10 30.5000 31.99 2.83 4.69
1970 Wilson unknown 10,000 5 20.8750 36.98 2.27 5.95
1972 Wilson unknown 14,000 5 23.0000 42.14 1.73 6.16
1974 Wilson unknown 12,000 5 13.2500 45.01 4.59 7.31
1976 Wilson unknown 6,500 5 27.5000 38.15 3.38 6.10
1978 Wilson unknown 10,500 5 46.3250 34.58 3.71 9.08
1980 Wilson unknown 15,750 5 44.5000 35.37 3.59 13.25
1981 Wilson unknown 15,000 5 37.0000 36.25 4.76 13.60
1982 Wilson unknown 20,000 5 18.7500 45.06 6.38 10.22
1983 Wilson unknown 17,500 5 36.1250 42.20 3.47 11.54
1984 Wilson unknown 25,000 10 42.6250 41.42 2.95 11.50
1985 Wilson unknown 37,500 10 42.2500 38.80 2.39 9.26
1986 Shrontz unknown 40,000 10 53.6875 37.19 2.17 7.11
1987 Shrontz unknown 30,000 10 54.3750 27.89 3.00 8.99
1988 Shrontz unknown 30,000 10 46.5625 27.50 2.77 9.11
1989 Shrontz unknown 45,000 10 42.8750 26.91 2.36 7.84
1990 Shrontz unknown 52,500 10 43.1250 29.49 2.05 8.08
1991 Shrontz unknown 31,875 10 48.1250 29.16 2.09 7.09
1992 Shrontz 2/28/1992 31,875 10 46.0000 26.23 2.43 6.77
1993 Shrontz 2/26/1993 31,875 10 34.5000 24.89 2.63 5.77
1993 Shrontz 12/13/1993 200,000 5 40.5600 24.89 2.63 5.77
1994 Shrontz 2/29/1994 53,125 10 47.2500 23.48 2.22 7.81
1995 Shrontz 2/27/1995 177,883 10 46.5000 21.35 1.63 5.71
1996 Condit 2/26/1996 75,000 10 82.0000 20.03 1.22 6.30
1997 Condit 2/24/1997 120,000 10 53.2188 20.32 1.14 5.81
2003 Condit 4/28/2003 3,000 10 28.2230 35.05 2.04 4.27
2006 McNerney 2/27/2006 261,000 10 74.4500 24.21 1.51 4.56
2007 McNerney 2/26/2007 215,000 10 89.6500 21.55 1.47 4.10
2008 McNerney 2/25/2008 252,000 10 83.9300 23.79 2.41 2.42
2009 McNerney 2/23/2009 282,037 10 35.5700 31.20 3.75 3.59
Note that Mr. Shrontz received two stock option grants in 1993. In all cases, the strike price is equal to the stock price on the day of the grant.

American Journal Of Business Education – May/June 2012 Volume 5, Number 3
© 2012 The Clute Institute 255
Table 3
Partial Excerpt on Executive Pay from Boeing Inc. Proxy Statement dated May 3, 1960
Remuneration of Directors and Officers
Set forth below is the aggregate remuneration (including awards under the Incentive Compensation Plan which relate to the year 1958 but were paid in 1959: (1) to each
Director and each of the three highest paid officers of the company whose aggregate remuneration exceeded $30,000, and (2) to all Directors and officers of the Company as a
group; and the estimated annual benefits each of such persons will be paid under the Company’s retirement plan upon retirement at the normal retirement date:
Name and Individual or Identity of Group and Capacities
in Which Remuneration Was Received Aggregate Remuneration
Estimated Net Remuneration After Deduction of
Estimated Federal Income Taxes
Estimated Annual
Benefits Upon Retirement
WILLIAM M. ALLEN, President $124,519 $54,070 $22,607
WELLWOOD E. BEALL, Senior Vice President 87,882 44,481 27,196
FRED P. LAUDAN, Vice President Manufacturing 43,542 28,270 11,413
EDWARD C. WELLS, Vice President Engineering 76,165 40,768 24,676
J. O. YEASTING, Vice President Finance 59,028 34,554 14,808
DIRECTORS AND OFFICERS AS A GROUP 904,602 233,607
Note: original footnotes deleted.
STOCK OPTIONS GRANTED
On December 22, 1959, the Stock Option Committee, acting pursuant to the provisions of the Stock Option Plan adopted by the stockholders at the Annual Meeting held
May 6, 1958, granted options to purchase capital stock of the Company of the par value of $5 a share to 55 employees, for a total of 71,000 shares at an option price of $30.50 per
share, which was the closing price of capital stock of the Company on the New York Stock Exchange on the date the options were granted. The options are evidenced by
agreements between the Company and the employees to whom such options were granted, the material provisions of which may be summarized as follows:
The options may be exercised at any time, and from time to time, after the expiration of two years after the date of the agreements, but only to the extent of the following
cumulative percentages of the total number of shares covered by the options during the periods of time indicated:
2 years after date of agreement—up to 20%
4 years after date of agreement—up to 40%
6 years after date of agreement—up to 70%
8 years after date of agreement—up to 100%
The options expire ten years after the date of the agreements or on the date the employee’s employment with the Company terminates, whichever first occurs, except that
(i) If an employee retires under the Company’s retirement plan or by reason of his health, the option may be exercised as to all remaining shares at any time within three months
after such termination of employment, and (ii) If the employment of an employee is terminated by death the option may be exercised as to all remaining shares within one year
after the date of employee’s death by the person to whom the employee’s rights under the agreement pass by the applicable laws of descent and distribution. The employee’s rights
under the option agreement are non-assignable and the number of shares is subject to adjustment for stock dividends, stock splits, or other changes in the capital stock of the
Company. The options are restricted stock options within the meaning of that term as used in Section 421 of the Federal Internal Revenue Code.
The persons named in the table under the heading “Remuneration of Directors and Officers” to whom options were granted and the number of shares covered thereby
and similar information with respect to all directors and officers as a group is set forth in the following table:

American Journal Of Business Education – May/June 2012 Volume 5, Number 3
256 © 2012 The Clute Institute
Table 3, continued
Name Present Office Number of Shares
WILLIAM M. ALLEN President 7500
WELLWOOD E. BEALL Senior Vice President 4,750
FRED P. LAUDAN Vice President—Manufacturing 1,000
EDWARD C. WELLS Vice President—Engineering 4,250
J. O. YEASTING Vice President—General Manager, Transport Division 4,000
DIRECTORS AND OFFICERS AS A GROUP 39,750
Note: original footnotes deleted.
Table 4
Partial Excerpt on Executive Pay from Boeing Inc. Proxy Statement dated March 7, 1980
MANAGEMENT REMUNERATION
The following is a description of the types of remuneration included in each column of the table on [the next page]:
Incentive Compensation
The Company’s Incentive Compensation Plan, initially adopted by the stockholders in 1947, provides, in general, that for any year the Board of Directors may set aside
into a fund an amount not to exceed 6% of net earnings for the year (before provisions are made for federal and state income taxes). Awards are made out of such funds at such
time or times and to such officers and employees as may be determined by the Compensation Committee, or, when so authorized by that committee, as may be determined by the
Chief Executive Officer of the Company or his authorized delegate. Members of the committee are not eligible for awards and no awards in excess of 5% of the amount set aside in
the fund for any one year may be made to any one officer or employee. The following awards are payable in cash: (a) awards the payment of which is to be deferred pursuant to the
terms of the awards of deferred compensation arrangements; (b) awards to holders of exercisable stock options who elect to have their awards applied all or in part to the payment
for shares as to which options have been exercised; and (c) awards made by the Chief Executive Officer or his authorized delegate. All other awards may be paid in cash or in
common stock of the Company, or in any combination thereof, at the discretion of the committee. The number of shares of common stock, if any, issued in payment of any award
is determined by the committee based on the market price on the distribution date of the award. The Company has a Deferred Compensation Plan for Employees pursuant to which
Messrs. T. A. Wilson, H. W. Haynes, and O. C. Boileau and certain other officers have elected that all or specified portions of Incentive Compensation Plan awards will not be
paid currently but will be credited to deferred compensation accounts and be paid to them over periods of years following their retirement from or termination of active
employment with the Company. Their deferred account balances are also credited quarterly with interest established annually based upon industrial bond rates for the previous year
as reported by Moody’s Investor Service. The interest rate for 1979 was 8.5%.
All Incentive Compensation awards attributable to 1979 performance are included in Column C-1 of the table. Interest credited to deferred compensation accounts during
1979 is included in Column C-2.
Voluntary Investment Plan
Under the Company’s present Voluntary Investment Plan which became effective in its original form on December 1, 1965, all eligible hourly and salaried employees,
including officers, may contribute from 1% to 8% of their base wage or salary to any one or more of four separate investment trust funds, each of which has a different investment
objective. All employees are eligible except those within collective bargaining units which have not agreed to the Plan and certain nonresident aliens. The Company contributes an
amount equal to 50% of the employee’s contribution. The Company’s contribution becomes fully vested after five years. The funds become distributable to participants, with
certain exceptions, upon termination of employment. Included in Column C-2 is the vested portion of the Company’s 1979 contribution to the employee’s account and the increase
or decrease in value during 1979 of the previously vested amounts in the account. Included in Column D is the unvested portion of the Company’s 1979 contribution to the
employee’s account.

American Journal Of Business Education – May/June 2012 Volume 5, Number 3
© 2012 The Clute Institute 257
Table 4, continued
Financial Security Plan
An employee Financial Security Plan was approved by the stockholders on April 25, 1966. Under the Plan, in which most of the employees of the Company participate,
the Company makes contributions to a trust from current and accumulated earnings and profits on the basis of the number of hours in each employee’s sick leave reserve account
(up to a maximum of 720 hours) multiplied by the employee’s hourly rate or base compensation. The Company’s contribution to the trust is invested in a balanced portfolio of
securities. Funds may be withdrawn in the event of loss o earnings due to sickness and the balance becomes distributable upon termination of employment. Included in Column C-
2 of the table is the amount credited in 1979 to the employee’s account under the plan and the increase or decrease in value during 1979 of the employee’s account.
Stock Options
Options granted under the 1969 Stock Option Plan were granted at the market price on the data of grant. Nonqualified options granted under the 1969 Plan are
exercisable in part after one year, with the remaining portions exercisable in increments after three, five and in most cases seven years, and expire ten years from the date of grant.
Qualified options granted under the 1969 Plan are exercisable 50% after one year, 100% after three years and expire five years from the date of grant, and contain restrictions upon
exercise if the optionee holds certain unexercised prior qualified options at a higher price. All options are subject to termination under certain conditions. No additional options
may be granted under the 1969 Plan.
Options granted under the 1979 Stock Option Plan which became effective January 1, 1979 were granted at the market price on the date of grant. There are 1,125,000
shares currently authorized to be granted and issued under the 1979 Plan subject to adjustment for stock splits and similar adjustments in capital stock. Only nonqualified options
may be granted by the Stock Option Committee. The terms and conditions of options granted under the 1979 Plan are similar to nonqualified options granted under the 1969 Plan.
Included in Column C-2 of the table are amounts consisting of the difference between the option price and the market price of the Company’s stock on the date of
exercise for all shares exercised during 1979 offset by any amounts attributable to such shares included in the remuneration table previously. Although such amounts are
considered income for federal tax purposes, the Company makes no cash payment to the optionee.
Stock Appreciation Rights
At the sole discretion of the Compensation Committee of the Board of Directors, stock appreciation rights (“SAR’s”) may be granted in connection with all or part of any
options granted under the 1969 or 1979 Stock Option Plans to employees who may be deemed directors or officers for purposes of Section 16 of the Securities Exchange Act of
1934. SAR’s entitle the holder thereof, upon exercise of such rights, to surrender the related option or any portion thereof and to receive without payment to the Company (except
for applicable withholding taxes) an amount equal to the excess of the fair market value on the date of such exercise of the stock covered by such option or portion thereof over the
option price of such stock. The committee has sole discretion to determine the form in which payment will be made upon the exercise of any SAR (i.e., common stock, cash, or any
combination thereof), or to consent to or disapprove the election of any participant to receive cash in full or partial settlement of the right. SAR’s may be exercised only during the
ten business days beginning on the third day following announcement of the Company’s quarterly earnings.
Payments made by the Company for all SAR’s exercised in 1979 are included in Column C-2 offset by any amounts attributable to such rights included in the
remuneration table previously. For each SAR exercised, an exercisable option was surrendered. Included in Column D are amounts accrued for SAR’s which became exercisable
in 1979 and were unexercised as of December 31, 1979, based on the difference between the option price and the market price of the Company’s stock on that date.
Remuneration Table
The following table sets forth information concerning the remuneration of (1) each of the five most highly compensated executive officers or directors of the Company
whose total remuneration in Columns C-1 and C-2 combined exceeds $50,000, and (2) all remuneration of all officers and directors of the Company as a group for services in all
capacities to the Company and its subsidiaries during 1979.

American Journal Of Business Education – May/June 2012 Volume 5, Number 3
258 © 2012 The Clute Institute
Table 4, continued
(A)
Name of Individual or
Persons in Group
(B)
Capacities in Which Served
(C-1)
Salaries, Directors’ Fees,
Incentive Compensation
(C-2)
Securities, Stock Appreciation
Rights, Personal Benefits
(D)
Aggregate of Contingent
Forms of Remuneration
O. C. Boileau Vice President; President, Boeing Aerospace $166,809 $641,267 $ 5,338
H. W. Haynes Executive Vice President—Chief Financial Officer 297,530 264,402 516,867
W. M. Maulden Senior Vice President 239,587 175,897 306,902
M. T. Stamper President 338,564 831,494 6,674
T.A. Wilson Chairman of the Board and Chief Executive Officer 551,860 107,905 1,342,727
All directors and officers of the Company as a group (67 persons) $7,869,462 $5,482,021 $8,362,738
Note: parts of original footnotes deleted.
The following tabulation shows the estimated annual pension payable to an employee, including any employee who is a director or officer, assuming retirement in 1979
at age 65 after selected periods of service.
Average Basic Compensation Estimated Annual Pension Payable Based on Service of:
20 Years 25 Years 30 Years 35 Years
$50,000 $12,684 $16,008 $19,356 $22,680
100,000 26,928 34,008 41,100 48,180
150,000 41,184 52,008 62,856 73,680
200,000 55,428 70,008 84,600 99,180
250,000 69,672 88,008 106,344 124,680
300,000 83,928 106,008 128,100 150,180

American Journal Of Business Education – May/June 2012 Volume 5, Number 3
© 2012 The Clute Institute 259
Table 4, continued
Stock Option Plans
The following tabulation shows as to those officers named in the table on [the previous page] and as to all directors and officers as a group (1) the amount of options and
stock appreciation rights (SAR’s) granted between January 1, 1979 and February 1, 1980, pursuant to the Company’s 1969 and 1979 Stock Option Plans, (2) the number of shares
of the Company’s common stock acquired during such period through the exercise of options previously granted under the Plan, and the number of shares surrendered upon
exercise of SAR’s, and (3) the number of shares subject to all unexercised options and the unexercised SAR’s held as of February 1, 1980 as adjusted for the three-for-two stock
split effective March 12, 1979.
GRANTED 1-1-79 to 2-1-80 O. C. Boileau H. W. Haynes W. M. Maulden M. T. Stamper T. A. Wilson
All Directors and Officers as
a Group (67 persons)
Number of shares 3,750 4,500 3,750 6,000 10,500 138,225
Average option price per share $46.3333 $46.3333 $46.3333 $46.3333 $46.3333 $46.0665
Number of SAR’s 9,000 10,125 7,950 13,125 21,000 269,332
Average Price per share of options as to
which SAR’s were granted
$23.32 $24.44 $25.49 $24.90 $27.00 $27.54
EXERCISED 1-1-79 TO 2-1-80
Number of shares 0 0 0 0 0 9,524
Aggregate option price — — — — — $69,110
Aggregate market value on dates of exercise — — — — — $439,472
Number of option shares surrendered upon
exercise of SAR’s
36,625 6,050 11,250 22,725 0 215,296
Aggregate option price of option shares
surrendered upon exercies of SAR’S
$281,631 $41,208 $88,950 $216,590 0 $1,963,316
Aggregate market value on dates of exercise
of SAR’s
$1,452,618 $269,225 $497,812 $1,036,224 0 $9,479,233
UNEXERCISED at 2-1-80
Number of shares * 31,375 24,000 18,225 69,000 675,324
Average options price per share — $15.37 $15.80 $23.40 $12.91 $23.60
Number of SAR’s * 22,450 16,650 6,000 60,000 449,428
Average price per share of options to which
SAR’s were granted
— $16.81 $16.91 $46.33 $14.19 $20.03
*Mr. Boileau resigned his positions with the Company effective January 10, 1980, thereby forfeiting his right to exercise any remaining unexercised stock options and SAR’s.

American Journal Of Business Education – May/June 2012 Volume 5, Number 3
260 © 2012 The Clute Institute
NOTES