Embed Size (px)
Citation preview
A Demographic Portrait of Asian Americans By Yu Xie and Kimberly A. Goyette
THEAMERICAN PEOPLECensus 2000
Russell Sage FoundationNew York, NY
Population Reference BureauWashington, DC
The Russell Sage FoundationThe Russell Sage Foundation, one of the oldest of America’s general purpose foundations, was established in 1907 by Mrs. Margaret Olivia Sage for “the improvement of social and living conditions in the United States.” The Foundation seeks to fulfill this mandate by fostering the development and dissemination of knowledge about the country’s political, social, andeconomic problems. While the Foundation endeavors to assure the accuracy and objectivity of each book it publishes, the conclusions and interpretations in Russell Sage Foundation publications are those of the authors and not of the Foundation, itsTrustees, or its staff. Publication by Russell Sage, therefore, does not imply Foundation endorsement.
BOARD OF TRUSTEESRobert E. Denham, Chair
Alan S. Blinder Jennifer L. Hochschild Cora B. MarrettChristine K. Cassel Timothy A. Hultquist Eugene SmolenskyThomas D. Cook Kathleen Hall Jamieson Eric WannerJohn A. Ferejohn Melvin Konner Mary C. WatersLarry V. Hedges
The Population Reference BureauFounded in 1929, the Population Reference Bureau is the leader in providing timely and objective information on U.S. and international population trends and their implications. PRB informs policymakers, educators, the media, and concerned citi-zens working in the public interest around the world through a broad range of activities, including publications, informationservices, seminars and workshops, and technical support. Our efforts are supported by government contracts, foundationgrants, individual and corporate contributions, and the sale of publications. PRB is governed by a Board of Trustees represent-ing diverse community and professional interests.
BOARD OF TRUSTEESDouglas Richardson, Chair
Patty Perkins Andringa Richard F. Hokenson Terry D. PeighMichael P. Bentzen James H. Johnson Jr. Gary B. SchermerhornSuzanne M. Bianchi Wolfgang Lutz Barbara Boyle TorreyWilliam P. Butz Elizabeth Maguire Leela VisariaJoel Cohen Mildred Marcy Montague YudelmanBert T. Edwards Faith Mitchell
Copyright © 2004 by the Russell Sage Foundation. All rights reserved. Printed in the United States of America. No part of thispublication may be reproduced, stored in a retrieval system, or transmitted in any form or by any means, electronic, mechanical,
photocopying, recording, or otherwise, without the prior written permission of the publisher.
ADVISORY PANEL FOR THE AMERICAN PEOPLE SERIESMargo Anderson, University of Wisconsin–Milwaukee Suzanne M. Bianchi, University of Maryland–College Park
Reynolds Farley, University of Michigan John Haaga, Population Reference BureauFrank Levy, Massachusetts Institute of Technology Kenneth W. Wachter, University of California–Berkeley
Editors: Ellen Carnevale, Mary M. Kent, Allison TarmannDesign: Heather Lilley, Population Reference Bureau
Production: Jon Howard, JH Design, Inc.
RUSSELL SAGE FOUNDATION112 E. 64th St.
New York, NY 10021
POPULATION REFERENCE BUREAU1875 Connecticut Ave., NW, Suite 520
Washington, DC 20009
iTHE AMERICAN PEOPLE
TABLE OF CONTENTS
Foreword ........................................................................................................................................................ii
History of Asian Americans ....................................................................................................................1Box 1: Asian Americans in the U.S. Census.................................................................................................2Table 1: Asian American Population by Major Ethnicity: 1980, 1990, and 2000 Censuses ...................3Figure 1: Asian Ethnic Groups as Percent of U.S. Population, 1860–2000 ..............................................4Table 2: Population Size and Key Demographic Characteristics by Asian
American Ethnicity, 2000..............................................................................................................................6Box 2: Significant Laws, Treaties, and Court Cases Affecting Asian Americans ...................................8
Educational Attainment ............................................................................................................................9Table 3: Percent Completing High School and Attaining College Degrees by Asian
Ethnicity and Race, Americans Ages 25–34, 1960–2000 ..........................................................................9Table 4: High School Completion and College Enrollment of Asian Ethnic Groups,
Whites, and Blacks Within Six Years of Eighth Grade, 1994 ................................................................11
Labor Force Outcomes ..........................................................................................................................13Table 5: Labor Force Participation by Race and Asian Ethnicity, Americans
Ages 21–64, 1960–2000................................................................................................................................14Table 6: Ratio of Asian Americans’ Earnings to Whites’ Earnings: Observed and
Adjusted for Education and Experience, 1959–1999..............................................................................15Table 7: Percent Asian by Occupation and Index of Dissimilarity, 1960-2000 ......................................18
Marriage and Family ................................................................................................................................19Table 8: Family Characteristics by Race and Asian Ethnic Group, 2000................................................20Table 9: Percent Currently Married and Ever-Married and Median Age of Marriage,
by Race/Ethnicity and Gender, 2000 .......................................................................................................22Box 3: The One-Drop Rule vs. the 50-Percent Rule..................................................................................23Table 10: Intermarriage Rates Among Asian Americans by Ethnic Group and Gender, 2000...........24
Residence ....................................................................................................................................................25Figure 2: Asian Share of State Populations, 2000 ......................................................................................26 Table 11: Ten U.S. Cities With Largest Asian Populations, 2000 .............................................................27Table 12: Residential Segregation Indices in the 10 U.S. Cities With the Largest Asian
Populations, 2000 ........................................................................................................................................28
Conclusion...................................................................................................................................................29
References ..................................................................................................................................................31
For Further Reading.................................................................................................................................32
THE AMERICAN PEOPLEii
In December 1862, Abraham Lincoln struggled tomaintain support for the Civil War. Several months
before, he had signed the Emancipation Proclamation, akey step in transforming a war to save the Union into awar to end slavery. This was a deeply unpopular moveamong many, even on the Union side. The war itselfwas becoming a disaster. The president had recentlyfired the cautious George McClellan, commander of thelargest Union army. His replacement, Ambrose Burn-side, was in the process of leading that army to itscostly and demoralizing defeat at Fredericksburg, just30 miles away from the White House, where PresidentLincoln was revising his annual message to Congress.
Not, one would have thought, a moment when theCommander-in-Chief’s mind would be on long-rangedemographic projections. But that 1862 annual messagedevoted several paragraphs to a summary of thegrowth of the American population, with tabular datafrom decennial censuses from 1790 through 1860, calcu-lations of the growth rate, and projections for 70 yearsinto the future. This was not, of course, an academicexercise. Lincoln was concerned to show the feasibilityof a major peace proposal, to borrow enough money tocompensate Southern slaveholders for the emancipationof the human beings they considered their “property.”With the expected growth of the population, Lincolnargued, there would be plenty of prosperous Americansto share the burden of the national debt.
Today, we face dilemmas of our own—in political,social, and economic life; in our families and neighbor-hoods and workplaces. None of these, certainly, is sogreat as the agonizing choices faced by Lincoln. But hisexample is still valid. Now, as then, a deep understand-ing of the American population, and how it is changing,is an essential underpinning for decisions of all sorts.Now, as then, the first source to consult is the decennialcensus, our national record of two centuries of growth,transformation, and movement.
This series of reports from the Russell Sage Founda-tion and the Population Reference Bureau, The Ameri-can People, sets the results of Census 2000 in context.Growth of the overall population is only one part of thestory. The transformation of our experience of race, thegrowth of new minorities, immigration of millions fromLatin America and Asia, the aging of the largest-evergeneration (the baby boomers), migration to the Westand South, the growth of outlying suburbs, the transfor-
mation of family and work, the well-being of children—all these build the national stage on which our dramasof the next few decades will be enacted.
The reports in this series cover all these issues,using the census and other data sources, collectivelyproviding a portrait of the American people in a newcentury. The first in the series looks at the census itself,a technical triumph of applied social science in anincreasingly politicized environment. Subsequentreports in the series investigate the experiences of majorracial and ethnic groups, immigrants, and Americans ofdifferent generations, the growth of new regions, andchanges in household life. Each is written by an authoror team of authors selected for their expertise with thedata and broad understanding of the implications ofdemographic trends.
The Russell Sage Foundation and the PopulationReference Bureau were both founded in the earlydecades of the 20th century, closer to Lincoln’s timethan to our own. Both are dedicated to bringing theresults of first-rate social science to those who can usethe results for practical improvements in public life.Both institutions, in particular, have a long record ofelucidating the results of the decennial censuses.
President Lincoln, by the way, brilliant as he was,did not turn out to be much of a forecaster. He expectedan American population in 1930 of 252 million; thenumber actually enumerated that year was just underhalf that size. The population of the United States didnot exceed the number he expected by 1930 until the1990 Census. We no longer expect U.S. presidents to dotheir own demography; that is probably progress.
REYNOLDS FARLEY is professor of sociology at the University of Michiganand a research scientist in its Population Studies Center. As author, editor,adviser to the U.S. Census Bureau, and interviewer, he has been an active participant in each of the last four censuses.
JOHN HAAGA is director of Domestic Programs and director of the Center for Public Information on Population Research at the Population Reference Bureau.
FOREWORD
1THE AMERICAN PEOPLE
Asian Americans are a diverse group who either aredescendants of immigrants from some part of Asia
or are themselves such immigrants. They come fromEast Asia (China, Japan, and Korea); Southeast Asia(Cambodia, Indonesia, Laos, Malaysia, the Philippines,Thailand, and Vietnam); and South Asia (Bangladesh,India, Myanmar, Nepal, and Pakistan). Cultural her-itage, economic conditions, political systems, religiouspractices, and languages are quite different across thesecountries and, in some cases, have changed over time.As a result, ethnic differences among Asian Americansare so large that they call into question the use of a sin-gle, overarching category to group them.
The broad category of Asian Americans is used forseveral reasons. Besides the practical need to collapseracial categories in statistical tabulations, there are alsomany ways in which Asian Americans are distinct fromother major racial groups in the United States. First,Asian Americans are physically and culturally distin-guishable from whites and other minorities. Second,except for those of Japanese descent, most Asian Ameri-cans arrived in the United States recently, as beneficiar-ies of the 1965 Immigration and Nationality Act(Chinese, Koreans, Filipinos, and Asian Indians) or asrefugees (Vietnamese, Laotians, and Cambodians).Finally, again with the exception of Japanese Americans,most Asian Americans speak their native languages athome and maintain their distinct ethnic cultures andvalues, signaling that they either face difficulties fullyassimilating into the American mainstream or purpose-fully resist full assimilation. As this report will show,Asian Americans have socioeconomic experiences anddemographic profiles that are overall distinct from thoseof whites and blacks.
With available census data and supplemental mate-rial, this report documents racial differences in demo-graphic and socioeconomic characteristics between Asianand non-Asian Americans, as well as ethnic differences inthese characteristics among Asian Americans. The reportbegins with an historical review of the immigration his-
tory of the major Asian groups. It then examines the edu-cational achievements of Asian Americans relative towhites and blacks and across Asian ethnicities over thepast 40 years; the labor force outcomes of Asian Ameri-cans relative to whites and blacks and variations acrossAsian ethnicities over time; Asian Americans’ familycharacteristics and marriage patterns; and spatial distri-bution and residential patterns in the United States.
The 2000 U.S. Census provided the first opportunityto enumerate individuals of more than one race and/ormultiple Asian ethnicities. The option to choose one ormore races on the 2000 Census form presents difficultiesfor comparing Asian populations both over time andacross Asian ethnic groups in 2000. In discussing ethnicdifferences, this report focuses on individuals whoreported only one Asian ethnicity.
HISTORY OF ASIAN AMERICANS
Although Asian ethnic groups in the United Stateshave had diverse immigration and settlement expe-
riences, these experiences can be divided into two broadhistorical periods demarcated by the landmark 1965Immigration and Nationality Act (also known as theHart-Cellar Act). The first, prior to 1965, is characterizedby a U.S. economy hungry for low-wage labor and bysevere racial conflicts. In this period, Asian Americansfaced competition, racial violence, and discrimination.The second period, after 1965, reflects a relatively moretolerant racial environment following the Civil RightsMovement and a growing need in the U.S. economy foran educated, skilled labor force. Since 1965, AsianAmericans have been perceived more positively, in thewords of some as a “model minority.”1 A brief review ofthe immigration histories of the most populous Asianethnic groups in the United States follows, highlightingsome of the similarities and differences in immigrationexperiences by Asian American ethnicity.
YU XIE holds several faculty appointments at the University of Michigan. He is Frederick G.L. Huetwell Professor of Sociology and Statistics and Research Professor inthe Survey Research Center and the Population Studies Center, Institute for Social Research (ISR), where he directs the Quantitative Methodology Program (QMP). Heis also a faculty associate at the Center for Chinese Studies. Xie’s areas of interest are social stratification, demography, statistical methods, and the sociology of science.
KIMBERLY A. GOYETTE is an assistant professor of sociology at Temple University. Her research interests include education, Asian Americans, and stratification.Kim has recently explored the influence of social class on graduate school attendance and major choice. She is beginning a project on how families choose schoolsthrough their choice of residences.
A Demographic Portrait of Asian AmericansBy Yu Xie and Kimberly A. Goyette
ChineseChinese were among the first Asians to settle in theUnited States.2 Some Chinese were present in Hawaii asearly as 1835, but thousands of Chinese arrived both inHawaii and on the mainland during the 1840s and1850s. The 1860 U.S. Census documented almost 35,000Chinese on the mainland (see Box 1). These Chineseimmigrants came to the United States for various rea-sons. Some sought shelter from wars and rebellions inthe mid-1800s. Others sought better economic opportu-nities. Tremendous social and political turmoil in Chinaduring this period led the Imperial Qing Dynasty tolevy high taxes, and in trying to pay them, peasantsoften lost their land. Frequent floods destroyed crops,and the population lived under the threat of starvation.
Early Chinese immigrants were primarily peasants,with little or no formal schooling. Large waves of themcame to the United States as manual workers when therapid development of the West demanded cheap labor.Immigrants were also drawn by the promise of the dis-covery of gold in California. Most Chinese immigrantsto the United States in the 19th century were men. Theyenvisioned making money in the United States and thenreturning to China at some future date. Married womenremained home to care for their children and for theirhusbands’ parents. At the turn of the century, only 5percent of all Chinese on the mainland, and 14 percentin Hawaii, were female.
Chinese immigrants initially settled in rural areasbut soon gravitated toward urban centers: San Fran-cisco, and later New York and Boston. By 1900, 45 per-cent of Chinese in California lived in the city of SanFrancisco. Chinese in urban areas were predominantlyemployed in service-sector jobs—working in laundries,for example—and lived in their ethnic communities.Because Chinese in these communities were isolatedfrom mainstream American society, many children ofChinese immigrants grew up speaking only Chineseand interacting with few whites. Some supplementedtheir American public school experiences by attendingChinese schools at the end of the day or on weekends.
Chinese immigrants found work outside theirenclaves in agriculture, in construction, in mining, and asshopkeepers. Chinese laborers represented 90 percent ofthe workforce responsible for the construction of the Cen-tral Pacific Railroad. Chinese workers were often broughtinto factories after white workers went on strike overlabor disputes. Because of this, Chinese in the UnitedStates were perceived as a threat to white workers andwere often a target of hatred and racial violence. In thelate 1870s, federal courts ruled that Chinese immigrantsshould be barred from naturalization as “aliens ineligiblefor citizenship.” Later, Chinese immigration was legallyrestricted by the Chinese Exclusion Act of 1882. Immigra-tion of all Asians except Filipinos, who were residents ofa U.S. territory at that time, was prohibited by the
National Origins Act of 1924, which barred the immigra-tion of all “aliens ineligible for citizenship.” From a highof over 107,000 in 1890, the Chinese population in theUnited States dwindled over the following decades. Chi-nese immigration practically stalled until 1965, whenimmigration law changed significantly.
The American People2
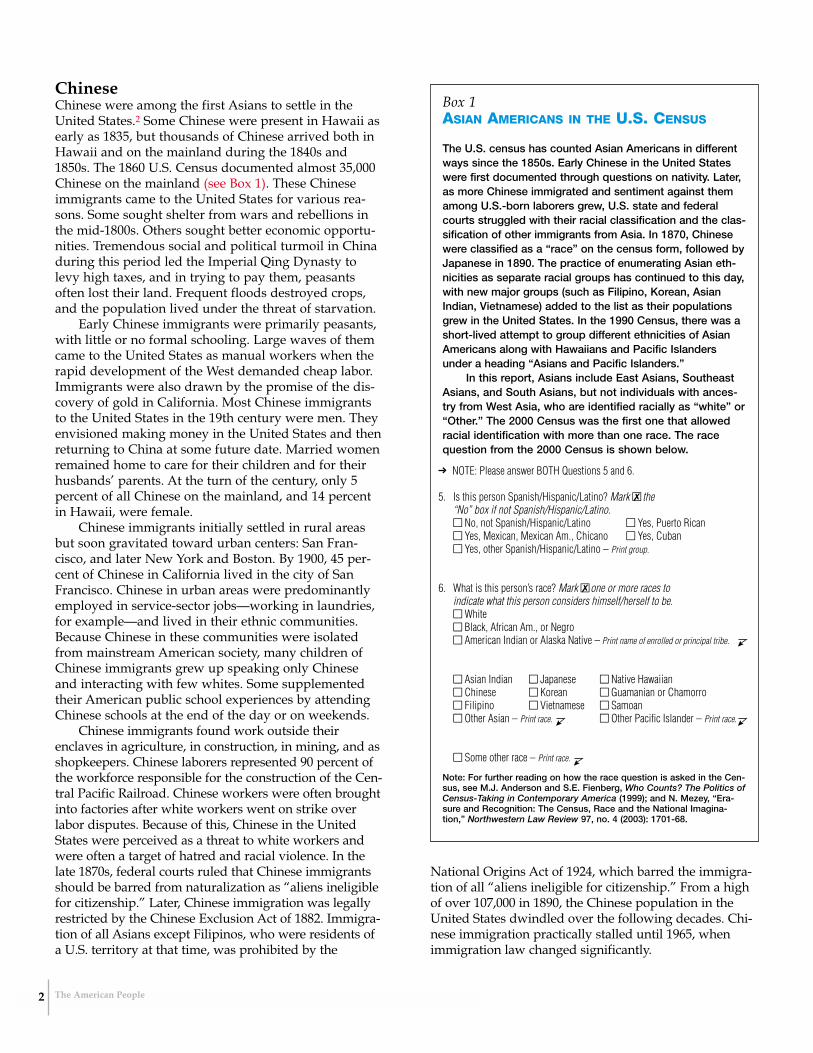
Box 1ASIAN AMERICANS IN THE U.S. CENSUS
The U.S. census has counted Asian Americans in differentways since the 1850s. Early Chinese in the United Stateswere first documented through questions on nativity. Later,as more Chinese immigrated and sentiment against themamong U.S.-born laborers grew, U.S. state and federalcourts struggled with their racial classification and the clas-sification of other immigrants from Asia. In 1870, Chinesewere classified as a “race” on the census form, followed byJapanese in 1890. The practice of enumerating Asian eth-nicities as separate racial groups has continued to this day,with new major groups (such as Filipino, Korean, AsianIndian, Vietnamese) added to the list as their populationsgrew in the United States. In the 1990 Census, there was ashort-lived attempt to group different ethnicities of AsianAmericans along with Hawaiians and Pacific Islandersunder a heading “Asians and Pacific Islanders.”
In this report, Asians include East Asians, SoutheastAsians, and South Asians, but not individuals with ances-try from West Asia, who are identified racially as “white” or“Other.” The 2000 Census was the first one that allowedracial identification with more than one race. The racequestion from the 2000 Census is shown below.
Note: For further reading on how the race question is asked in the Cen-sus, see M.J. Anderson and S.E. Fienberg, Who Counts? The Politics ofCensus-Taking in Contemporary America (1999); and N. Mezey, “Era-sure and Recognition: The Census, Race and the National Imagina-tion,” Northwestern Law Review 97, no. 4 (2003): 1701-68.
NOTE: Please answer BOTH Questions 5 and 6.
5. Is this person Spanish/Hispanic/Latino? Mark ■✗ the “No” box if not Spanish/Hispanic/Latino.■ No, not Spanish/Hispanic/Latino ■ Yes, Puerto Rican■ Yes, Mexican, Mexican Am., Chicano ■ Yes, Cuban■ Yes, other Spanish/Hispanic/Latino – Print group.
6. What is this person’s race? Mark ■✗ one or more races to indicate what this person considers himself/herself to be.■ White■ Black, African Am., or Negro■ American Indian or Alaska Native – Print name of enrolled or principal tribe.
■ Asian Indian ■ Japanese ■ Native Hawaiian■ Chinese ■ Korean ■ Guamanian or Chamorro■ Filipino ■ Vietnamese ■ Samoan■ Other Asian – Print race. ■ Other Pacific Islander – Print race.
■ Some other race – Print race.
3The American People
Although small numbers of Chinese people wereallowed to immigrate following the repeal of the Chi-nese Exclusion Act in 1943, immigration of Chinese andother Asians to the United States did not really flourishuntil the passage of the Immigration and NationalityAct in 1965. This act repealed all previous quotas andimmigration restrictions, and established preferences forimmigrants who wished to reunite with family mem-bers or who had skills valued in the U.S. labor market.Following the passage of this landmark legislation, Chi-nese immigrating to the United States tended to behighly educated, to have professional and technicaloccupations, and to arrive with their families. Manycame from Hong Kong and Taiwan, places where theyhad taken refuge after the 1949 military defeat of theNationalists in China. Some of these new immigrantssettled in urban ethnic enclaves like Chinatowns, whileothers, especially those with professional occupations,established themselves in suburban communities. Before1900, Chinese made up the largest Asian group in theUnited States, though eventually the Japanese grewlarger. Since 1970, Chinese have again been the mostpopulous Asian ethnic group in the United States (seeTable 1). Currently, there are more than 2.6 millionAmericans of Chinese descent in the United States.
JapaneseJapanese first started immigrating to the United States inthe 19th century. Like Chinese, they came as agriculturalworkers. Unlike Chinese, a large proportion of Japaneseimmigrants became plantation workers in Hawaii. In the1920s, 43 percent of the Hawaiian population was Japan-ese. On the mainland, many Japanese who were initiallyemployed as agricultural workers soon became self-employed merchants and farmers. By 1925, 46 percent ofJapanese immigrants were involved in agriculture. Incities like San Francisco, they established small enclaves
where they could support and socialize with each other,eat familiar food, and speak their native language. AfterJapanese had established themselves with farms or busi-nesses, they sent for wives, and wives worked with theirhusbands in businesses and on farms. Japanese, morethan other early Asian immigrants, came to the UnitedStates to settle and raise families.
Given their intention to settle, Japanese emphasizedto their children the importance of learning to be Ameri-can to avoid discrimination. Japanese sent their childrento American public schools and encouraged their chil-dren to become fluent in English. They saved money fortheir children to go to college, believing educationwould help them overcome discrimination.
Their efforts did not protect them from massive gov-ernment-sponsored discrimination, however. Becausewhite workers saw the Japanese, as they had the Chinese,as a source of unfair competition, immigration of Japan-ese was restricted by the Gentlemen’s Agreement of 1907-1908. Japanese immigration was later completelyprohibited in 1924. Further, during World War II, over100,000 Japanese from California and other states in thePacific Northwest were placed in internment camps bythe U.S. government. Whole families were herded intocamps under suspicions that they had colluded or wouldcollude with Japan to attack the mainland United States.Many Japanese families lost their land while residing inthese camps. Some Japanese Americans fought in the U.S.Army to show their loyalty to the United States.
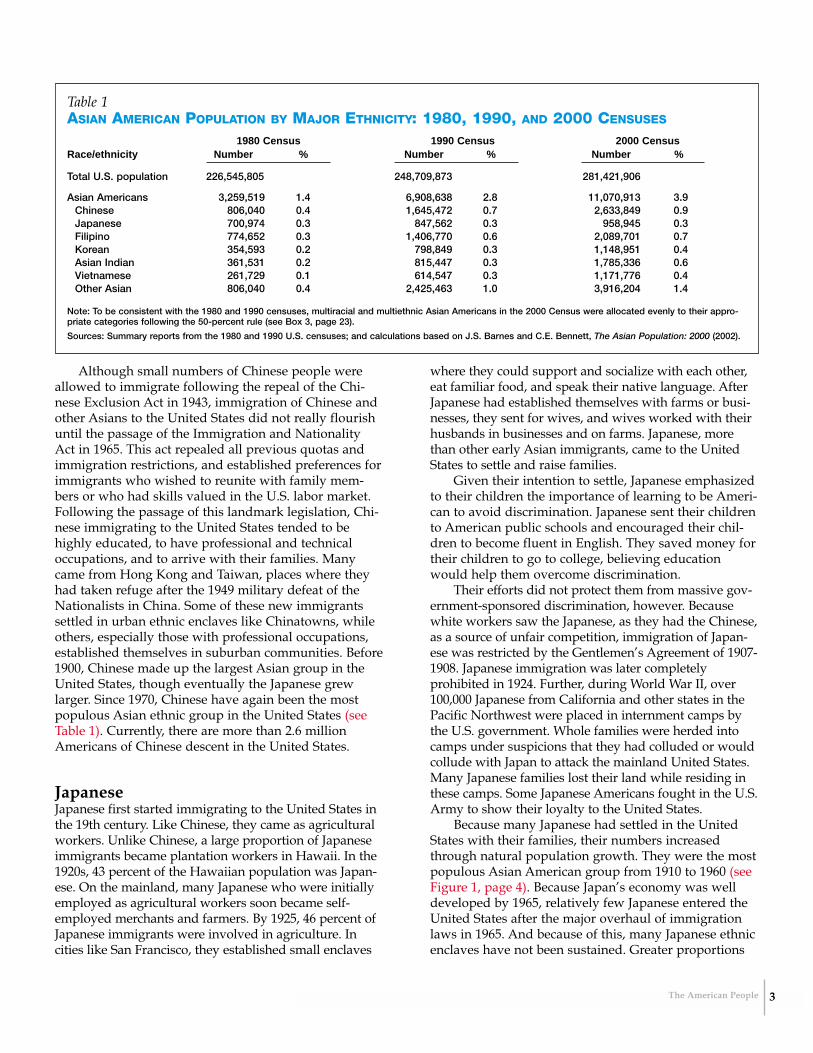
Because many Japanese had settled in the UnitedStates with their families, their numbers increasedthrough natural population growth. They were the mostpopulous Asian American group from 1910 to 1960 (seeFigure 1, page 4). Because Japan’s economy was welldeveloped by 1965, relatively few Japanese entered theUnited States after the major overhaul of immigrationlaws in 1965. And because of this, many Japanese ethnicenclaves have not been sustained. Greater proportions
Table 1ASIAN AMERICAN POPULATION BY MAJOR ETHNICITY: 1980, 1990, AND 2000 CENSUSES
1980 Census 1990 Census 2000 CensusRace/ethnicity Number % Number % Number %
Total U.S. population 226,545,805 248,709,873 281,421,906
Asian Americans 3,259,519 1.4 6,908,638 2.8 11,070,913 3.9Chinese 806,040 0.4 1,645,472 0.7 2,633,849 0.9Japanese 700,974 0.3 847,562 0.3 958,945 0.3Filipino 774,652 0.3 1,406,770 0.6 2,089,701 0.7Korean 354,593 0.2 798,849 0.3 1,148,951 0.4Asian Indian 361,531 0.2 815,447 0.3 1,785,336 0.6Vietnamese 261,729 0.1 614,547 0.3 1,171,776 0.4Other Asian 806,040 0.4 2,425,463 1.0 3,916,204 1.4
Note: To be consistent with the 1980 and 1990 censuses, multiracial and multiethnic Asian Americans in the 2000 Census were allocated evenly to their appro-priate categories following the 50-percent rule (see Box 3, page 23).
Sources: Summary reports from the 1980 and 1990 U.S. censuses; and calculations based on J.S. Barnes and C.E. Bennett, The Asian Population: 2000 (2002).
of Japanese speak English well, and Japanese tend to bemore structurally assimilated—that is, to have attain-ment in education and occupation that is equal to thatof whites—than other ethnic groups such as Chineseand Koreans. Currently, fewer than 1 million people areestimated to be Japanese Americans.
FilipinosFew Filipinos lived in the United States before the turn ofthe 20th century. Most of the early Filipino immigrantsarrived as American nationals after 1898, the year that the
United States acquired the Philippines at the conclusionof the Spanish-American War. Filipinos immigrated to theUnited States in search of employment on plantations inHawaii and other agricultural work on the mainland. Fil-ipinos also worked in fisheries in the Pacific Northwestand as domestic and other service workers. Many Fil-ipino workers organized labor unions during the early20th century, but their efforts to win wage increases weremet with hostility not only from their employers but alsofrom white workers who feared competition. More likelyto intermarry than Chinese and the Japanese, Filipinomen also provoked racial hatred and violence by marry-ing white women. Because a large portion of the Filipinopopulation worked as plantation or migrant agriculturalworkers, they did not establish ethnic communities inurban centers. As a result of their geographical dispersionand their propensity to intermarry, Filipinos soon becamemore structurally assimilated in the United States thanChinese and Japanese.
Filipinos were the only Asian ethnic group not pro-hibited from immigrating by the 1924 National OriginsAct, because they came from an American territory.However, when the Philippines was established as acommonwealth of the United States in 1934, severerestrictions were placed on Filipino immigration. TheFilipino population in the United States dropped fromabout 108,000 to 98,000 in the following decade.
After changes to immigration laws were enacted in1965, many Filipinos came to the United States fleeing therepressive Marcos regime and seeking better economicopportunities. For example, Filipino doctors, nurses, andpharmacists were better compensated for their skills inthe United States than in the Philippines. From 1980 on,Filipinos constituted the second most populous AsianAmerican group in the United States. Currently, FilipinoAmericans number slightly over 2 million.
KoreansMost early Korean immigrants, both men and women,began their journey to the U.S. mainland working onplantations in Hawaii. Plantation owners in Hawaii capi-talized on ethnic enmity, using Korean plantation workersto break strikes by Japanese workers. About 40 percent ofKorean immigrants were Christians. They built manychurches and formed Christian associations in Hawaii. By1907, almost 1,000 had left Hawaii for the U.S. mainland.
Other Koreans came to the mainland after Japanannexed Korea in 1910. The 1910 Census countedaround 4,500 Koreans. Koreans maintained strong loy-alty to Korea and a strong desire to liberate their coun-try from Japanese rule. Korean Christian churches oftenserved to maintain this nationalism, as did Korean lan-guage schools, in which second-generation Koreans notonly spoke Korean but also learned about the cultureand politics of the homeland.
The American People4
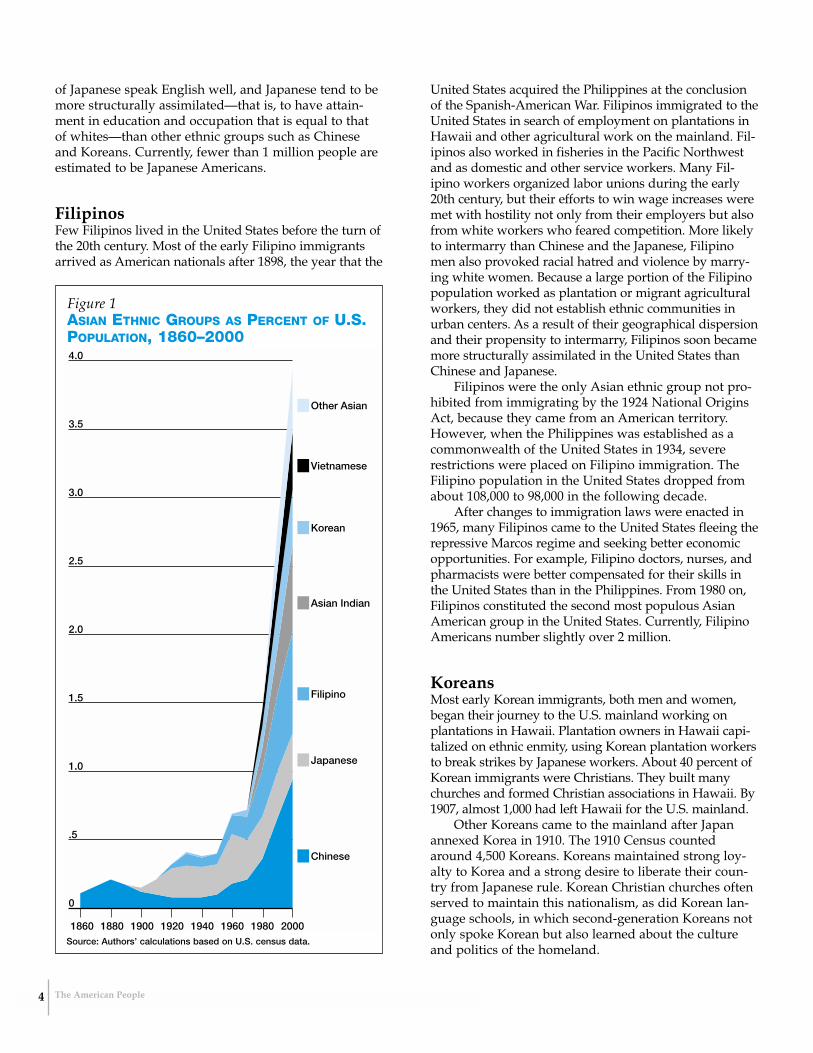
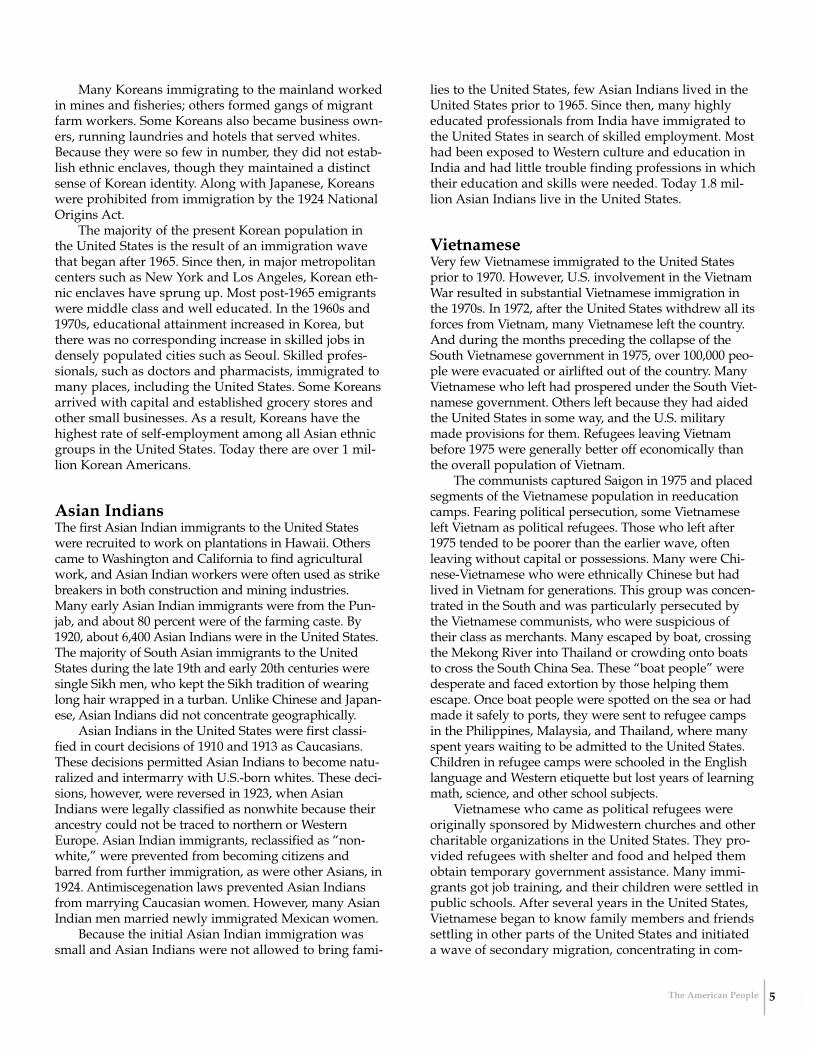
Figure 1ASIAN ETHNIC GROUPS AS PERCENT OF U.S.POPULATION, 1860–2000
1860 1880 1900 1920 1940 1960 1980 2000
4.0
3.5
3.0
2.5
2.0
1.5
1.0
.5
0
Other Asian
Vietnamese
Korean
Asian Indian
Filipino
Japanese
Chinese
Source: Authors’ calculations based on U.S. census data.
5The American People
Many Koreans immigrating to the mainland workedin mines and fisheries; others formed gangs of migrantfarm workers. Some Koreans also became business own-ers, running laundries and hotels that served whites.Because they were so few in number, they did not estab-lish ethnic enclaves, though they maintained a distinctsense of Korean identity. Along with Japanese, Koreanswere prohibited from immigration by the 1924 NationalOrigins Act.
The majority of the present Korean population inthe United States is the result of an immigration wavethat began after 1965. Since then, in major metropolitancenters such as New York and Los Angeles, Korean eth-nic enclaves have sprung up. Most post-1965 emigrantswere middle class and well educated. In the 1960s and1970s, educational attainment increased in Korea, butthere was no corresponding increase in skilled jobs indensely populated cities such as Seoul. Skilled profes-sionals, such as doctors and pharmacists, immigrated tomany places, including the United States. Some Koreansarrived with capital and established grocery stores andother small businesses. As a result, Koreans have thehighest rate of self-employment among all Asian ethnicgroups in the United States. Today there are over 1 mil-lion Korean Americans.
Asian IndiansThe first Asian Indian immigrants to the United Stateswere recruited to work on plantations in Hawaii. Otherscame to Washington and California to find agriculturalwork, and Asian Indian workers were often used as strikebreakers in both construction and mining industries.Many early Asian Indian immigrants were from the Pun-jab, and about 80 percent were of the farming caste. By1920, about 6,400 Asian Indians were in the United States.The majority of South Asian immigrants to the UnitedStates during the late 19th and early 20th centuries weresingle Sikh men, who kept the Sikh tradition of wearinglong hair wrapped in a turban. Unlike Chinese and Japan-ese, Asian Indians did not concentrate geographically.
Asian Indians in the United States were first classi-fied in court decisions of 1910 and 1913 as Caucasians.These decisions permitted Asian Indians to become natu-ralized and intermarry with U.S.-born whites. These deci-sions, however, were reversed in 1923, when AsianIndians were legally classified as nonwhite because theirancestry could not be traced to northern or WesternEurope. Asian Indian immigrants, reclassified as “non-white,” were prevented from becoming citizens andbarred from further immigration, as were other Asians, in1924. Antimiscegenation laws prevented Asian Indiansfrom marrying Caucasian women. However, many AsianIndian men married newly immigrated Mexican women.
Because the initial Asian Indian immigration wassmall and Asian Indians were not allowed to bring fami-
lies to the United States, few Asian Indians lived in theUnited States prior to 1965. Since then, many highlyeducated professionals from India have immigrated tothe United States in search of skilled employment. Mosthad been exposed to Western culture and education inIndia and had little trouble finding professions in whichtheir education and skills were needed. Today 1.8 mil-lion Asian Indians live in the United States.
VietnameseVery few Vietnamese immigrated to the United Statesprior to 1970. However, U.S. involvement in the VietnamWar resulted in substantial Vietnamese immigration inthe 1970s. In 1972, after the United States withdrew all itsforces from Vietnam, many Vietnamese left the country.And during the months preceding the collapse of theSouth Vietnamese government in 1975, over 100,000 peo-ple were evacuated or airlifted out of the country. ManyVietnamese who left had prospered under the South Viet-namese government. Others left because they had aidedthe United States in some way, and the U.S. militarymade provisions for them. Refugees leaving Vietnambefore 1975 were generally better off economically thanthe overall population of Vietnam.
The communists captured Saigon in 1975 and placedsegments of the Vietnamese population in reeducationcamps. Fearing political persecution, some Vietnameseleft Vietnam as political refugees. Those who left after1975 tended to be poorer than the earlier wave, oftenleaving without capital or possessions. Many were Chi-nese-Vietnamese who were ethnically Chinese but hadlived in Vietnam for generations. This group was concen-trated in the South and was particularly persecuted bythe Vietnamese communists, who were suspicious oftheir class as merchants. Many escaped by boat, crossingthe Mekong River into Thailand or crowding onto boatsto cross the South China Sea. These “boat people” weredesperate and faced extortion by those helping themescape. Once boat people were spotted on the sea or hadmade it safely to ports, they were sent to refugee campsin the Philippines, Malaysia, and Thailand, where manyspent years waiting to be admitted to the United States.Children in refugee camps were schooled in the Englishlanguage and Western etiquette but lost years of learningmath, science, and other school subjects.
Vietnamese who came as political refugees wereoriginally sponsored by Midwestern churches and othercharitable organizations in the United States. They pro-vided refugees with shelter and food and helped themobtain temporary government assistance. Many immi-grants got job training, and their children were settled inpublic schools. After several years in the United States,Vietnamese began to know family members and friendssettling in other parts of the United States and initiateda wave of secondary migration, concentrating in com-
munities such as Orange County, Calif.; Houston; andeven New Orleans. Vietnamese Americans now numberover 1 million.
Other AsiansThere are other Asian ethnic groups in the United States.They include Southeast Asians from Thailand, Indone-sia, Malaysia, Laos, and Cambodia. Cambodians andLaotians are similar to Vietnamese in that they immi-grated to the United States primarily as refugees fromthe Vietnam War. Other Asians came from South Asiancountries such as Nepal, Pakistan, and Sri Lanka. Theyare similar to Asian Indians in that they were primarilyimmigrants seeking better economic opportunities. Likethe groups discussed above, other Asians represent adiversity of languages, cultures, national heritages, andimmigration and settlement experiences.
Combined PopulationAfter the passage of the 1965 Immigration and National-ity Act, Asia quickly became the second-largest sourceof immigrants to the United States, and, as a result, theAsian American population has grown rapidly. Forexample, Asian Americans represented 1.4 percent ofthe population in 1980 and almost 4 percent in 2000 (seeTable 1, page 3). With the exception of Japanese Ameri-cans, all Asian ethnic groups have more than doubled inpopulation since 1980. By comparison, the total U.S.population increased by only 24 percent in this period.
Most of the increase in the Asian American popula-tion is due to immigration rather than to naturalgrowth, a circumstance reflected in the proportions offoreign-born among Asians in the United States (see
Table 2). Although these proportions vary greatly byethnicity, with Japanese at the low end (41 percent) andKoreans at the high end (79 percent), overall 64 percentof Asians in the United States were born abroad.
Foreign birth and speaking a language other thanEnglish at home are crude measures of assimilation intoAmerican society. While the highest foreign-born frac-tion is found among Koreans, the highest percentage ofnon-English speaking at home is among Vietnamese (at93 percent). Other than multiracial Asians, the Japanesehave the lowest rates of foreign birth and of non-Englishspeaking at home—both below 50 percent. The multi-ethnic and multiracial Asians are similar to the Japanesein having low rates of both being foreign-born and non-English speaking at home.
Despite a long history of disproportionately maleimmigration, the sex ratio among Asian Americans overallis either balanced or in favor of women. The only ethnicgroup with an underrepresentation of women is AsianIndians, at 47 percent female. The age composition variesgreatly by ethnicity. The Japanese American populationshows signs of aging, with 20 percent at age 65 or olderand 12 percent below age 18. Among all the other groups,children constitute a much larger percentage (from 21 per-cent to 45 percent), and the elderly a much smaller per-centage (from 4 percent to 10 percent). The relative youthof the other Asian groups is due to immigration, as immi-grants tend to be young people who either bring childrento America or rear children soon after immigration.
From Discrimination to Model MinorityFor the convenience of statistical reporting, Asian Ameri-cans are often treated as a single race and compared withother major racial groups such as whites and blacks. That
The American People6
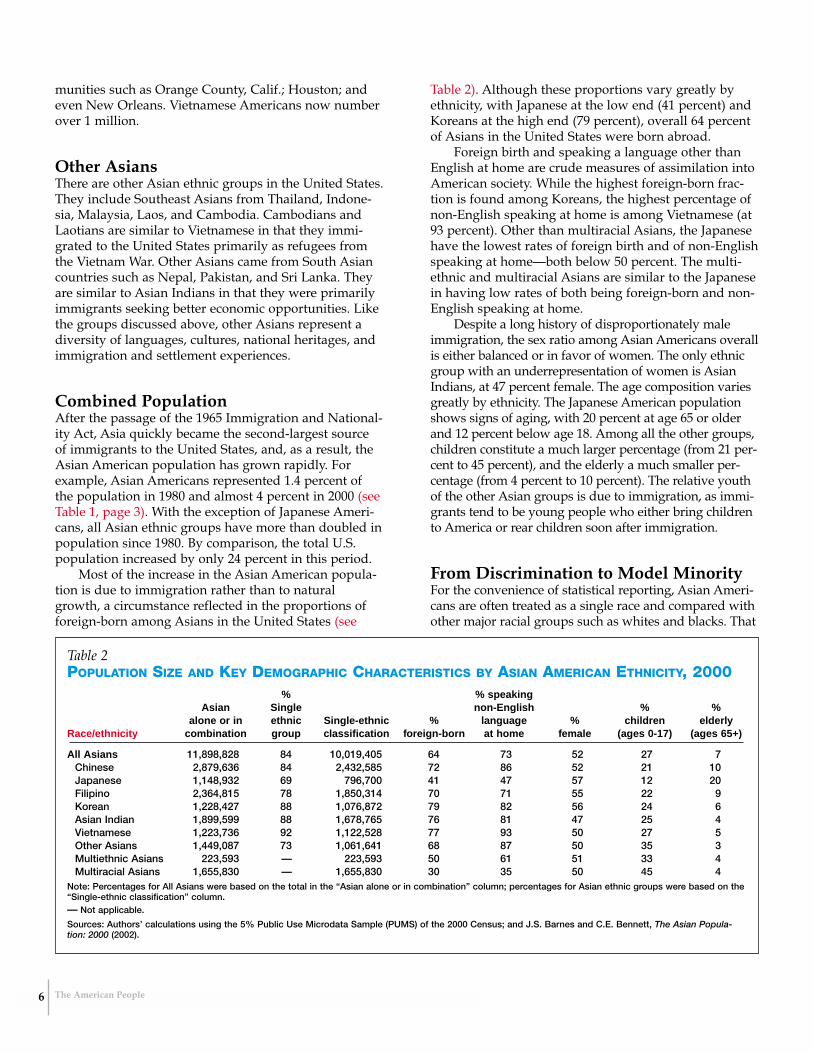
Table 2POPULATION SIZE AND KEY DEMOGRAPHIC CHARACTERISTICS BY ASIAN AMERICAN ETHNICITY, 2000
% % speaking Asian Single non-English % %
alone or in ethnic Single-ethnic % language % children elderly Race/ethnicity combination group classification foreign-born at home female (ages 0-17) (ages 65+)
All Asians 11,898,828 84 10,019,405 64 73 52 27 7Chinese 2,879,636 84 2,432,585 72 86 52 21 10Japanese 1,148,932 69 796,700 41 47 57 12 20Filipino 2,364,815 78 1,850,314 70 71 55 22 9Korean 1,228,427 88 1,076,872 79 82 56 24 6Asian Indian 1,899,599 88 1,678,765 76 81 47 25 4Vietnamese 1,223,736 92 1,122,528 77 93 50 27 5Other Asians 1,449,087 73 1,061,641 68 87 50 35 3Multiethnic Asians 223,593 — 223,593 50 61 51 33 4Multiracial Asians 1,655,830 — 1,655,830 30 35 50 45 4
Note: Percentages for All Asians were based on the total in the “Asian alone or in combination” column; percentages for Asian ethnic groups were based on the“Single-ethnic classification” column.— Not applicable.
Sources: Authors’ calculations using the 5% Public Use Microdata Sample (PUMS) of the 2000 Census; and J.S. Barnes and C.E. Bennett, The Asian Popula-tion: 2000 (2002).
7The American People
is the practice adopted here. Yet cultural heritage andimmigration paths vary greatly by country of originamong Asian Americans. Owing to this diversity, mostAsian Americans would not accept the proposition thatthey belong to a single Asian race. When given a choice,they often would rather identify themselves as part of anAsian ethnic group (such as Chinese, Japanese, or Viet-namese) than as simply Asian American. However,because Asian groups are all numerically small and lack-ing in political strength, some Asian Americans feel theneed to develop a panethnic Asian American identity.
In this context, three distinctions are drawn betweenrace and ethnicity. First, it is commonly accepted that racerefers to distinctions drawn from physical appearance,whereas ethnicity refers to distinctions based on culturalmarkers such as national origin, language, religion, andfood. Second, race has serious social consequences forindividuals’ life chances, whereas ethnicity is for the mostpart considered optional in contemporary America. Third,individuals’ freedom of racial identification is limited, inthe sense that racial identification requires external con-sent from others, whereas ethnic identity can be internal.
Therefore, regardless of their own views concerningwhether or not they belong to a single race, AsianAmericans face categorization into a single race inAmerica, as they are often defined in contrast to theother racial groups—whites, blacks, and American Indi-ans. This categorization of Asian Americans as a racialminority has differed historically, geographically, andlegally. In Hawaii, Asians often adopted the identity ofHawaiian, speaking a dialect of English called pidgin,which mixed elements of English, Portuguese, NativeHawaiian, and Asian languages. In Mississippi, earlyChinese immigrants were subject to the same segrega-tion as blacks, though later they would achieve “hon-orary” white status as they became economicallysuccessful. Despite these regional differences, U.S.Supreme Court cases such as People v. Hall (1854) andSaito v. United States (1893) ruled that Asians wereeither classified as “a lesser caste similar to Indians” (inthe case of Chinese) or Mongolian (in the case of theJapanese), but not Caucasian or white. These two courtcases, among others, reaffirmed that Asian immigrantscould not obtain citizenship, because citizenship wasonly possible for “free whites” or for those born on U.S.soil. Asian Indians, first considered Caucasian accordingto two separate court cases in 1910 and 1913, weredenied citizenship in 1923 (United States v. BhagatSingh Thind) because they were not of northern orWestern European descent.3 The restriction on natural-ization was lifted for Chinese immigrants in 1943 andfor other Asian immigrants in 1952.
How Asian Americans were defined raciallyaffected whether or not they could be citizens of theUnited States, own land, and hold certain jobs. Becausethe courts defined Asians as nonwhite, most Asian
immigrants in the 19th and early 20th centuries wereprevented from becoming citizens of the United States.However, children of Asian immigrants, born on U.S.soil, were citizens. In 1913, alien land law acts preventedAsian immigrants from owning land or leasing land formore than three years. Taxes were levied on “foreign”miners’ earnings in California in 1850. Race also deter-mined where Asians lived and whom they could marry.Chinese people attempting to settle in Tacoma, Wash.,were prevented from doing so by white residents of thetown. Koreans were prohibited from settling in River-side County, Calif. Antimiscegenation laws forbiddingmarriage specifically between whites and Mongolianswere enacted in some states as early as 1880.
In different places and at various points in U.S. his-tory, Asian Americans have also been subjected to preju-dice, hatred, and racial violence. An 1870 poem, entitled“The Heathen Chinee,” reflected a negative sentimenttoward Chinese at that time. The poem was reprintedand republished across the country, and “its sensationalpopularity made Bret Harte [its author] the most cele-brated literary man in America in 1870.” It begins with:
“Which I wish to remark,And my language is plain,That for ways that are darkAnd for tricks that are vain,The heathen Chinee is peculiar,Which the same I would rise to explain.”4
Mob violence against Asian Americans was firstdocumented in 1871, when European Americans enteredneighborhoods in Los Angeles’ Chinatown and shot andhanged 21 Chinese people. Settlements of Asians wereburned, and Asian residents were forced out of towns.Fear of and prejudice toward Asian immigrants eventu-ally led to the prohibition of all Asian immigration,which was enacted in stages. Chinese immigration wasfirst limited in 1882 with the Chinese Exclusion Act;Japanese immigration was restricted in 1907-1908; andthen in 1924 all Asian immigration was prohibited.Changes were not made to these discriminatory immi-gration laws until 1943 (see Box 2, page 8).
The generally negative image of Asian immigrantsin America between the 1860s and 1920s is far from themodel minority label widely used to characterize AsianAmericans in recent decades.5 Since the 1960s, AsianAmericans’ success in education and their high concen-tration in professional occupations have been widelypublicized by the popular press. Asian Americans’ val-ues have been declared compatible with the Protestantwork ethic of the United States.6
Demographic changes in the population of Asianimmigrants are in part responsible for the shift in thepublic’s image of them from negative to positive. Whenthe prohibition of Asian immigrants was repealed in
1965, immigration priority was given to family membersof immigrants and workers with needed skills. There-fore, Asian immigrants to the United States after the1960s were more likely to be highly skilled workers thanthose who immigrated during the 19th century, andmany had been exposed to the English language andWestern culture.
Political refugees formed another major componentof immigration to the United States during the 1970sand 1980s. During the 1970s, Vietnamese, Cambodian,Lao, and Hmong refugees who aided the United Statesin military operations were helped to escape from theircountries. Other refugees left Vietnam after 1975, whenthe communist forces gained control over the South. Cit-izens of the United States were sympathetic to the plightof these noncommunist refugees, having waged war onbehalf of these people against what they perceived to be
a communist threat. Many aid organizations andchurches organized the immigration and settlement ofthese groups.
Another popular explanation for the portrayal ofAsian Americans as a model minority is that immigrantAsian Americans invest heavily in their children’s edu-cation. Cultural explanations for this investment stressthe compatibility of Confucian cultural values with theProtestant work ethic. Other research adds that anticipa-tion of discrimination and marginalization in the laborforce leads Asian Americans to choose education as aviable means to achieve upward mobility.
Despite the overall educational and economic suc-cesses of Asian Americans, heterogeneity among them ishigh. Just as the image of the model minority is an unin-formed characterization of Asian Americans, the attribu-tion of all observed disadvantages of Asian Americans to
The American People8
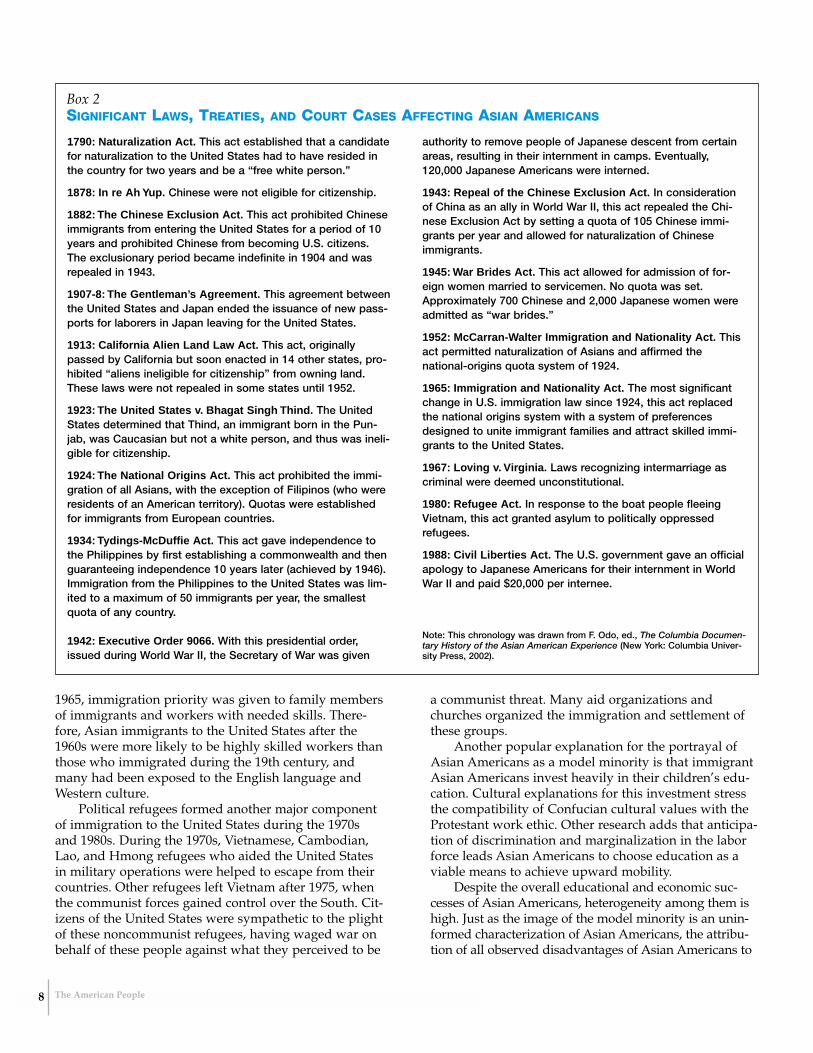
1790: Naturalization Act. This act established that a candidatefor naturalization to the United States had to have resided inthe country for two years and be a “free white person.”
1878: In re Ah Yup. Chinese were not eligible for citizenship.
1882: The Chinese Exclusion Act. This act prohibited Chineseimmigrants from entering the United States for a period of 10years and prohibited Chinese from becoming U.S. citizens.The exclusionary period became indefinite in 1904 and wasrepealed in 1943.
1907-8: The Gentleman’s Agreement. This agreement betweenthe United States and Japan ended the issuance of new pass-ports for laborers in Japan leaving for the United States.
1913: California Alien Land Law Act. This act, originallypassed by California but soon enacted in 14 other states, pro-hibited “aliens ineligible for citizenship” from owning land.These laws were not repealed in some states until 1952.
1923: The United States v. Bhagat Singh Thind. The UnitedStates determined that Thind, an immigrant born in the Pun-jab, was Caucasian but not a white person, and thus was ineli-gible for citizenship.
1924: The National Origins Act. This act prohibited the immi-gration of all Asians, with the exception of Filipinos (who wereresidents of an American territory). Quotas were establishedfor immigrants from European countries.
1934: Tydings-McDuffie Act. This act gave independence tothe Philippines by first establishing a commonwealth and thenguaranteeing independence 10 years later (achieved by 1946).Immigration from the Philippines to the United States was lim-ited to a maximum of 50 immigrants per year, the smallestquota of any country.
1942: Executive Order 9066. With this presidential order,issued during World War II, the Secretary of War was given
authority to remove people of Japanese descent from certainareas, resulting in their internment in camps. Eventually,120,000 Japanese Americans were interned.
1943: Repeal of the Chinese Exclusion Act. In considerationof China as an ally in World War II, this act repealed the Chi-nese Exclusion Act by setting a quota of 105 Chinese immi-grants per year and allowed for naturalization of Chineseimmigrants.
1945: War Brides Act. This act allowed for admission of for-eign women married to servicemen. No quota was set.Approximately 700 Chinese and 2,000 Japanese women wereadmitted as “war brides.”
1952: McCarran-Walter Immigration and Nationality Act. Thisact permitted naturalization of Asians and affirmed thenational-origins quota system of 1924.
1965: Immigration and Nationality Act. The most significantchange in U.S. immigration law since 1924, this act replacedthe national origins system with a system of preferencesdesigned to unite immigrant families and attract skilled immi-grants to the United States.
1967: Loving v. Virginia. Laws recognizing intermarriage ascriminal were deemed unconstitutional.
1980: Refugee Act. In response to the boat people fleeingVietnam, this act granted asylum to politically oppressedrefugees.
1988: Civil Liberties Act. The U.S. government gave an officialapology to Japanese Americans for their internment in WorldWar II and paid $20,000 per internee.
Note: This chronology was drawn from F. Odo, ed., The Columbia Documen-tary History of the Asian American Experience (New York: Columbia Univer-sity Press, 2002).
Box 2SIGNIFICANT LAWS, TREATIES, AND COURT CASES AFFECTING ASIAN AMERICANS
9The American People
racial discrimination is too simplistic. Complex by nature,social phenomena routinely defy simple explanations andrequire nuanced analyses. The experience of Asian Ameri-cans is no exception. The remainder of this report focuseson the empirical question of how Asian Americans havefared in terms of measurable indicators of socioeconomicstatus relative to whites and blacks in this country.
EDUCATIONAL ATTAINMENT
One important empirical finding that distinguishesAsian Americans is that they have indeed attained
socioeconomic status that is overall comparable with,and in some instances superior to, that of whites. Instudying the relatively high socioeconomic status ofAsian Americans, scholars have invariably pointed outthat Asian Americans have successfully attained highlevels of education.7 Hence, a fruitful examination of thesocioeconomic conditions of Asian Americans requiresknowledge of their educational experiences.
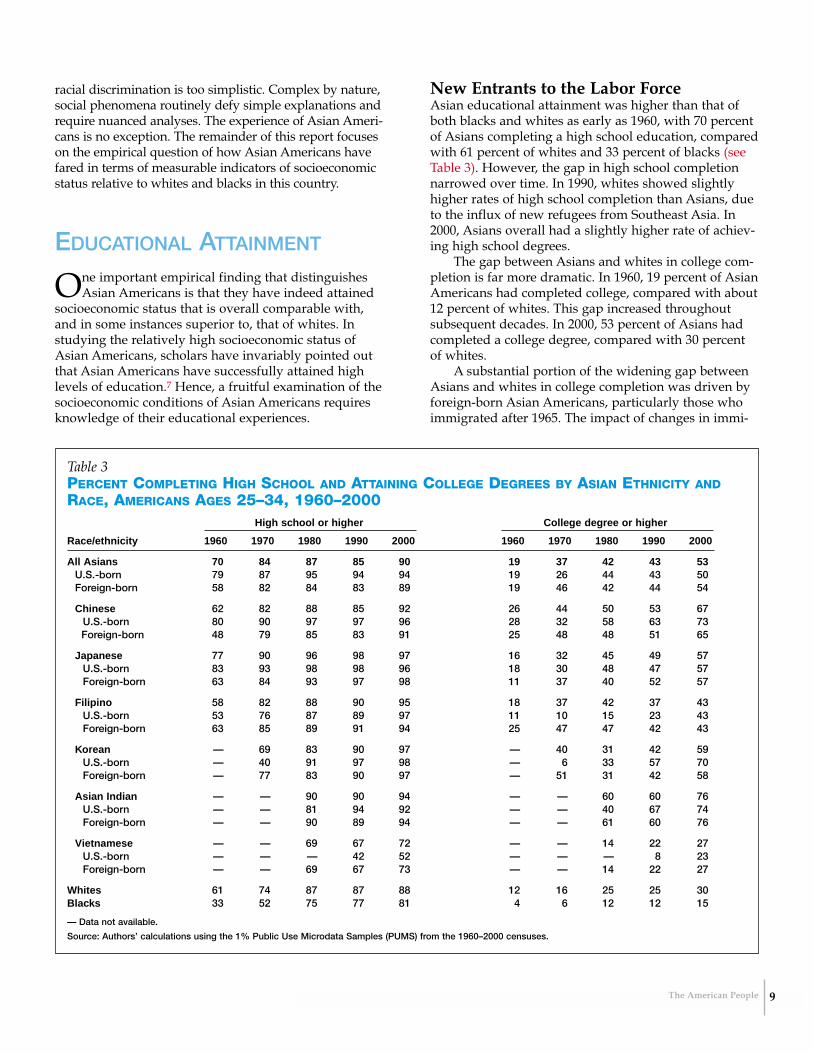
New Entrants to the Labor ForceAsian educational attainment was higher than that ofboth blacks and whites as early as 1960, with 70 percentof Asians completing a high school education, comparedwith 61 percent of whites and 33 percent of blacks (seeTable 3). However, the gap in high school completionnarrowed over time. In 1990, whites showed slightlyhigher rates of high school completion than Asians, dueto the influx of new refugees from Southeast Asia. In2000, Asians overall had a slightly higher rate of achiev-ing high school degrees.
The gap between Asians and whites in college com-pletion is far more dramatic. In 1960, 19 percent of AsianAmericans had completed college, compared with about12 percent of whites. This gap increased throughoutsubsequent decades. In 2000, 53 percent of Asians hadcompleted a college degree, compared with 30 percentof whites.
A substantial portion of the widening gap betweenAsians and whites in college completion was driven byforeign-born Asian Americans, particularly those whoimmigrated after 1965. The impact of changes in immi-
Table 3PERCENT COMPLETING HIGH SCHOOL AND ATTAINING COLLEGE DEGREES BY ASIAN ETHNICITY ANDRACE, AMERICANS AGES 25–34, 1960–2000
High school or higher College degree or higher
Race/ethnicity 1960 1970 1980 1990 2000 1960 1970 1980 1990 2000
All Asians 70 84 87 85 90 19 37 42 43 53U.S.-born 79 87 95 94 94 19 26 44 43 50Foreign-born 58 82 84 83 89 19 46 42 44 54
Chinese 62 82 88 85 92 26 44 50 53 67U.S.-born 80 90 97 97 96 28 32 58 63 73Foreign-born 48 79 85 83 91 25 48 48 51 65
Japanese 77 90 96 98 97 16 32 45 49 57U.S.-born 83 93 98 98 96 18 30 48 47 57Foreign-born 63 84 93 97 98 11 37 40 52 57
Filipino 58 82 88 90 95 18 37 42 37 43U.S.-born 53 76 87 89 97 11 10 15 23 43Foreign-born 63 85 89 91 94 25 47 47 42 43
Korean — 69 83 90 97 — 40 31 42 59U.S.-born — 40 91 97 98 — 6 33 57 70Foreign-born — 77 83 90 97 — 51 31 42 58
Asian Indian — — 90 90 94 — — 60 60 76U.S.-born — — 81 94 92 — — 40 67 74Foreign-born — — 90 89 94 — — 61 60 76
Vietnamese — — 69 67 72 — — 14 22 27U.S.-born — — — 42 52 — — — 8 23Foreign-born — — 69 67 73 — — 14 22 27
Whites 61 74 87 87 88 12 16 25 25 30Blacks 33 52 75 77 81 4 6 12 12 15
— Data not available.
Source: Authors’ calculations using the 1% Public Use Microdata Samples (PUMS) from the 1960–2000 censuses.
gration laws, which established preferences for skilledworkers, is seen in the dramatic differences in collegecompletion among foreign-born Asian Americans from1960 to 1970. In 1960, 19 percent of both foreign- andU.S.-born Asian Americans had attained a collegedegree. In 1970, this percentage jumped to 46 percent forthe foreign-born. Although some foreign-born AsianAmericans were educated in the United States, theimmigration of highly educated Asians is largelyresponsible for this jump. By comparison, the collegecompletion rate among U.S.-born Asian Americans in1970 was 26 percent, while whites’ college completionrate was at 16 percent.
Variation in Asian Americans’ educational attain-ment is evident not only by nativity but also by ethnic-ity. In 1960, Japanese had the highest level of highschool attainment, but Chinese had the highest level ofcollege attainment. In later decades, Chinese, Koreans,and Asian Indians are among the most educationallysuccessful, with college completion rates of 67 percent,59 percent, and 76 percent in 2000, respectively. Viet-namese are among the least successful, with rates ofhigh school and college completion below whites, andrates of high school completion below blacks.
The comparison by nativity does not follow thesame pattern over time. Among Filipinos, for example,the foreign-born seem to have had an advantage in edu-cation even before 1965. Foreign-born Japanese had alower college completion rate than the U.S.-born in1960, but this reversed in 1970 and reversed again inlater years. Koreans show a different pattern still. Whilein earlier decades foreign-born Koreans had more edu-cation than their U.S.-born counterparts, in 2000, 58 per-cent of foreign-born Koreans had completed collegecompared with 70 percent of U.S.-born Koreans. Itshould be noted that, while some foreign-born Asianscame as immigrant children who received all or most oftheir education in the United States, most foreign-bornAsian Americans completed their education beforeimmigrating to the United States.8
Children in School Asian American children were not always educationallyadvantaged. Data from the 1910 Census, for example,reveal that Chinese and Japanese children ages 7 to 17were less likely to be enrolled in school than werewhites (77 percent for Chinese and 73 percent for Japanese versus 88 percent for whites). In part, this dis-advantage was due to segregation laws that preventedChinese and Japanese children from attending schoolswith majority whites. In California in the late 1800s, theeffect of such laws was to restrict Chinese and Japanesechildren to segregated schools for “Orientals.” In stateswith smaller Asian populations, like Mississippi, Asianchildren were required to attend segregated schools
with blacks. Asians, like other minorities, fought vehe-mently for integration and educational opportunity.And, as early as 1930, Chinese and Japanese enrollmentin elementary and secondary schools surpassed that ofwhites, although segregation laws were not removedofficially in many states until the 1950s.
In today’s elementary and secondary schools, theacademic performance of Asian American students isgenerally high. According to the National Center forEducation Statistics (NCES), in 1999, only 7 percent ofAsians in grades K through 12 had ever repeated agrade, compared with 9 percent of whites. Additionalresults drawn from the 1988-1994 National EducationLongitudinal Study (NELS), administered by NCES to anationally representative sample of eighth-graders in1988, show that Asian Americans scored significantlyhigher on a standardized math test than whites; differ-ences in verbal scores were statistically insignificantbetween whites and Asians.
These results are confirmed by scores on theScholastic Aptitude Test (SAT) in the academic year2000-2001. On the verbal SAT, Asian American studentstaking the test scored slightly lower than their whitepeers (501 versus 528) but higher than blacks and His-panics (at 430 and 460, respectively). On the math SATduring that same year, Asians scored higher than all theother groups, with an average score of 566 comparedwith whites at an average of 531.
Asian American high school students also earnhigher grade point averages than do their white coun-terparts. Asian American eighth- and 10th-graders inNELS reported grade point averages of 3.2 and 3.0 on afour-point scale, compared with 2.9 and 2.7 for whites.9Furthermore, Asian American students take moreadvanced math and science courses than do students ofother race and ethnic groups. In 1998, NCES reportedthat 74 percent of Asian high school graduates hadtaken advanced science and that 56 percent of them hadtaken advanced math. The comparable percentages forwhites were 64 percent and 45 percent.
Asian American teenagers seem to have fewerbehavioral problems in schools as well. From the 1999National Household Survey, the NCES reports that thepercentages of students in grades 7 to 12 who had everbeen expelled or suspended from school were 13 per-cent for Asians, 15 percent for whites, 20 percent forHispanics, and 35 percent for blacks. Asian Americanstudents are also unlikely to drop out of high school.According to data from the October 2000 Current Popu-lation Survey, 4 percent of Asian American 16-to-24-year-olds were considered high school dropouts, whilethe corresponding percentages were 7 percent amongwhites, 13 percent among blacks, and 28 percent amongHispanics. The high school completion rates among 18-to-24-year-olds in 2000 were 95 percent among Asiansand 92 percent among whites. Similarly, 92 percent of
The American People10
11The American People
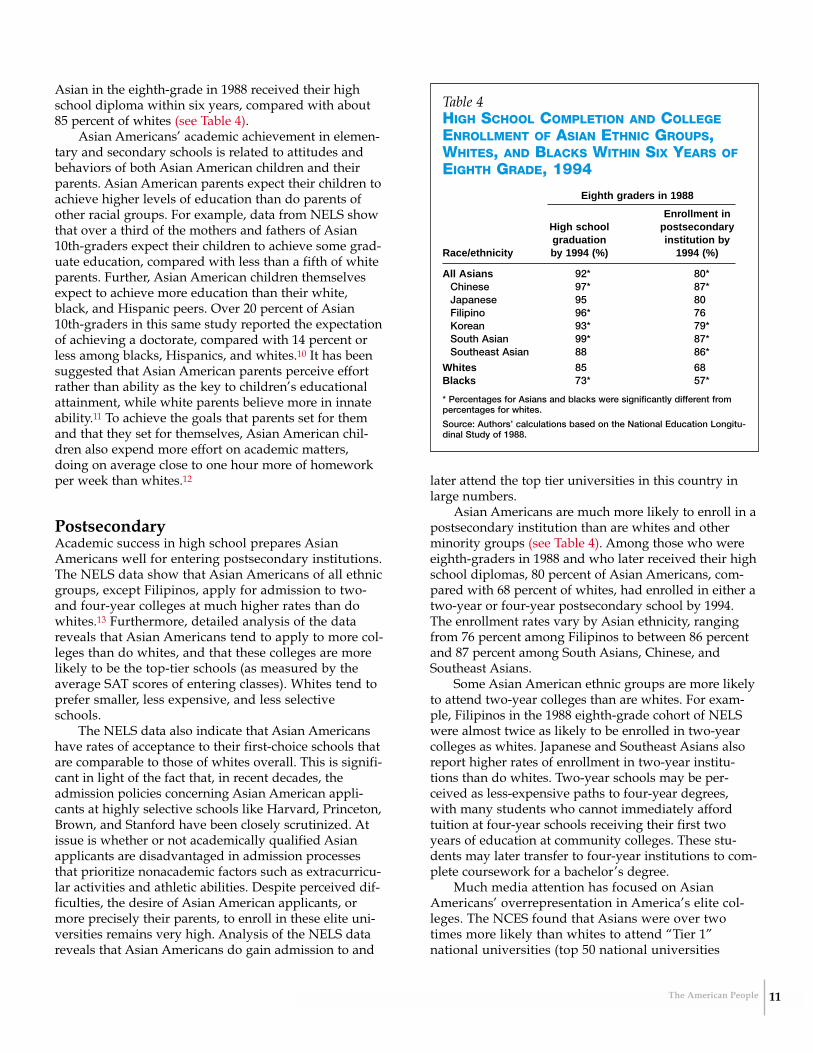
Asian in the eighth-grade in 1988 received their highschool diploma within six years, compared with about85 percent of whites (see Table 4).
Asian Americans’ academic achievement in elemen-tary and secondary schools is related to attitudes andbehaviors of both Asian American children and theirparents. Asian American parents expect their children toachieve higher levels of education than do parents ofother racial groups. For example, data from NELS showthat over a third of the mothers and fathers of Asian10th-graders expect their children to achieve some grad-uate education, compared with less than a fifth of whiteparents. Further, Asian American children themselvesexpect to achieve more education than their white,black, and Hispanic peers. Over 20 percent of Asian10th-graders in this same study reported the expectationof achieving a doctorate, compared with 14 percent orless among blacks, Hispanics, and whites.10 It has beensuggested that Asian American parents perceive effortrather than ability as the key to children’s educationalattainment, while white parents believe more in innateability.11 To achieve the goals that parents set for themand that they set for themselves, Asian American chil-dren also expend more effort on academic matters,doing on average close to one hour more of homeworkper week than whites.12
PostsecondaryAcademic success in high school prepares AsianAmericans well for entering postsecondary institutions.The NELS data show that Asian Americans of all ethnicgroups, except Filipinos, apply for admission to two-and four-year colleges at much higher rates than dowhites.13 Furthermore, detailed analysis of the datareveals that Asian Americans tend to apply to more col-leges than do whites, and that these colleges are morelikely to be the top-tier schools (as measured by theaverage SAT scores of entering classes). Whites tend toprefer smaller, less expensive, and less selectiveschools.
The NELS data also indicate that Asian Americanshave rates of acceptance to their first-choice schools thatare comparable to those of whites overall. This is signifi-cant in light of the fact that, in recent decades, theadmission policies concerning Asian American appli-cants at highly selective schools like Harvard, Princeton,Brown, and Stanford have been closely scrutinized. Atissue is whether or not academically qualified Asianapplicants are disadvantaged in admission processesthat prioritize nonacademic factors such as extracurricu-lar activities and athletic abilities. Despite perceived dif-ficulties, the desire of Asian American applicants, ormore precisely their parents, to enroll in these elite uni-versities remains very high. Analysis of the NELS datareveals that Asian Americans do gain admission to and
later attend the top tier universities in this country inlarge numbers.
Asian Americans are much more likely to enroll in apostsecondary institution than are whites and otherminority groups (see Table 4). Among those who wereeighth-graders in 1988 and who later received their highschool diplomas, 80 percent of Asian Americans, com-pared with 68 percent of whites, had enrolled in either atwo-year or four-year postsecondary school by 1994.The enrollment rates vary by Asian ethnicity, rangingfrom 76 percent among Filipinos to between 86 percentand 87 percent among South Asians, Chinese, andSoutheast Asians.
Some Asian American ethnic groups are more likelyto attend two-year colleges than are whites. For exam-ple, Filipinos in the 1988 eighth-grade cohort of NELSwere almost twice as likely to be enrolled in two-yearcolleges as whites. Japanese and Southeast Asians alsoreport higher rates of enrollment in two-year institu-tions than do whites. Two-year schools may be per-ceived as less-expensive paths to four-year degrees,with many students who cannot immediately affordtuition at four-year schools receiving their first twoyears of education at community colleges. These stu-dents may later transfer to four-year institutions to com-plete coursework for a bachelor’s degree.
Much media attention has focused on AsianAmericans’ overrepresentation in America’s elite col-leges. The NCES found that Asians were over twotimes more likely than whites to attend “Tier 1”national universities (top 50 national universities
Table 4 HIGH SCHOOL COMPLETION AND COLLEGEENROLLMENT OF ASIAN ETHNIC GROUPS,WHITES, AND BLACKS WITHIN SIX YEARS OFEIGHTH GRADE, 1994
Eighth graders in 1988
Enrollment in High school postsecondary graduation institution by
Race/ethnicity by 1994 (%) 1994 (%)
All Asians 92* 80* Chinese 97* 87* Japanese 95 80Filipino 96* 76Korean 93* 79*South Asian 99* 87*Southeast Asian 88 86*
Whites 85 68Blacks 73* 57*
* Percentages for Asians and blacks were significantly different frompercentages for whites.
Source: Authors’ calculations based on the National Education Longitu-dinal Study of 1988.
according to U.S. News and World Report).14 Analysis ofthe NELS data shows that the proportion attendingsuch universities among Asian students is very high,ranging from 18 percent and 22 percent among Japan-ese and South Asians to 42 percent and 44 percentamong Korean and Chinese students. This can be com-pared with whites’ rate of about 9 percent. However,Asian Americans are not more likely than whites toattend first-tier liberal arts colleges.
Asian American college students differ from whitestudents in the choice of majors. Asians are more likelythan whites to major in science, math, and engineeringand less likely than whites to choose fields in thehumanities and education. Data from the 1993-1994 Baccalaureate and Beyond study indicate that 20 percentof Asian American graduates were granted bachelor’sdegrees in science or math, compared with 13 percent ofwhites. By comparison, 9 percent of Asians receiveddegrees in the humanities, compared with 14 percent ofwhites.
For 1999-2000, the NCES reports that Asian Ameri-cans received about 5 percent of all the associate’sdegrees and 6.5 percent of all the bachelor’s degreesconferred in the United States.
PostgraduateEarlier data from the Educational Testing Service showthat Asian Americans’ scores on the Graduate RecordExamination during the 1980s were close to those ofwhites, with higher quantitative scores and slightlylower verbal scores. For example, Asian Americans in1984-1985 scored 479 on verbal, 603 on quantitative, and533 on the analytic portions of the test, compared with513, 537, and 550 for whites. Similar Asian-white pat-terns have been observed in scores for the business, law,and medical school entrance exams.15
Asian Americans appear to be about as likely toenroll in master’s and doctoral graduate degree pro-grams as whites. However, analysis of data from theBaccalaureate and Beyond study reveals that AsianAmericans are more likely than whites to enroll ingraduate professional programs even when familybackground, test performance, and other undergradu-ate characteristics are taken into account. Among thosein professional schools, Asians are more likely to be inmedical school, while whites are more likely to be inlaw school. Similar to the situation for undergraduatemajors, Asian Americans in doctoral programs aremore likely than whites to be found in science andengineering programs and less likely to be in the lib-eral arts.
According to the NCES, Asian Americans received 5percent of the master’s degrees, 11 percent of the profes-sional degrees, and about 5 percent of the doctoraldegrees conferred between 1999 and 2000.
ExplanationsWhat accounts for Asian Americans’ overall high educa-tional achievement? There are five potential explanations.
Socioeconomic background. The socioeconomicexplanation highlights the role of family socioeconomicresources in Asian American children’s educational suc-cess. Many Asian ethnic groups arrive in the UnitedStates with high levels of education. Others arrive withfinancial capital to enable them to set up small busi-nesses. Asian parents may make good use of thesesocioeconomic resources to facilitate their children’seducational achievement. However, it is important torecognize the diverse backgrounds of Asian Americans.Vietnamese and other Southeast Asians immigratedwith little human or financial capital, and variation inincome within groups like Chinese and Koreans is alsovery high. Poverty rates among Chinese, Koreans, andVietnamese are higher than they are among whites.Thus, the socioeconomic explanation is simply notapplicable to all Asian Americans.
Ability. The second popular explanation for highAsian American academic achievement focuses on theirability. On various standardized tests, Asian Americansshow a greater proficiency in math and only slightlylower verbal aptitude than do whites. Popular attentionto racial differences in tested proficiency has led tomuch speculation about the sources of these differences.While some contend that the differences are biologicalin nature, others attribute differences in measured profi-ciency to parents’ socioeconomic resources, neighbor-hood and community environments, immigrationselectivity, and perhaps culture.
Community and identity. Another explanation forAsian American educational success considers the com-munity-level support, encouragement, and informationthat is available to students. Because Asian Americanshold high educational expectations, they serve as exam-ples for each other, encourage and support each other’sachievement, and serve as sources of information aboutcolleges and application procedures. For example, AsianAmerican adults who have attended college act as rolemodels for Asian American high school students. AsianAmericans may also benefit from peer groups composedpredominantly of other Asian Americans. Students inclose-knit ethnic communities, like the New OrleansVietnamese community, benefit from the supervisionand support of community members. Children whomaintain their ethnic distinctiveness through theirnative language and ethnic self-identification link them-selves to this community. They are then accountable tothe community and closely supervised by its members.Children not only learn norms that contribute to theirsuccess from this community, but also benefit from theconnectedness of its members.16
Attitudes, values, and beliefs concerning educa-tion. Attitudes, values, and beliefs held by Asian Ameri-
The American People12
13The American People
cans that differ from those of whites may have their ori-gins in Asian cultures or in the self-selection of immi-grants. Researchers suggest that one legacy ofConfucianism in many Asian countries (notably China,Korea, Japan, and Vietnam) is the notion that humanbeings are perfectible if they work hard to improvethemselves. Given this cultural heritage, some AsianAmericans may be more likely than whites to believethat hard work in school will be rewarded. It is alsoargued that Asian Americans may presume greaterreturns to education, both material and symbolic, thando whites and other minorities, based on beliefs origi-nating in Asian home countries. In traditional Confuciansocieties, individuals of low social origin are encouragedto achieve upward mobility through intensive study. Inparticular, sought-after civil service jobs are tied to thesuccessful completion of examinations. Because of thisculture, Asian American parents and their children maybe more likely to view education as a prominent, if notsole, means to greater occupational prestige, socialstanding, and income. In addition, Asian Americansmay be more likely to hold particular values, attitudes,and beliefs because they are voluntary immigrants tothe United States. Voluntary immigrants are self-selected in having high motivations to achieve, evi-denced by the fact that they chose to immigrate.Therefore, values encouraging success and hard workmay be a product of the self-selected immigrationprocess itself rather than of any particular ethnic or cul-tural heritage.
Blocked opportunities. The blocked opportunitiesperspective is closely related to the last two explana-tions. It suggests that Asian Americans use educationas a means to overcome obstacles to social mobility.17
As recent immigrants, Asian Americans lack social net-works to help them obtain good jobs in the mainstreameconomy, although they may have ethnic networks thatare conducive to educational attainment. For example,Asian Americans may lack access to social networksthat will help them obtain well-paid manufacturingjobs after graduating from high school because fewAsian Americans work in such occupations. They alsolack population bases for political careers. Thus, Asianparents stress education as a means for their childrento overcome their disadvantages in achieving socialmobility. In an economy where the demand for knowl-edge-based skill is high and meritocracy is held as anorm (even if not fully implemented in practice), thisstrategy for social mobility is quite appealing, espe-cially when accompanied by the Confucian culturalnorm that human imperfections can be improved bypersistent learning and practice. Asian Americans’strong belief in the connection between hard work andsuccess underlies their heavy investment in educationas a means to achieve the social mobility that mightotherwise elude them.
The five explanations overlap. Together, they provideplausible explanations of the educational achievement ofAsian Americans. Many Asian American youths havehighly educated parents and/or high family incomes.Overall, Asian Americans perform better on standardizedmath tests than do whites. Asian American students mayalso have highly educated role models and motivatedpeers, and reside in interconnected ethnic communities.Some Asian Americans, either because they are selectiveimmigrants or because of their cultural backgrounds,may believe hard work is rewarded with success andmay perceive high returns to education. Further, thesevalues—coupled with limited opportunities for AsianAmericans’ social mobility through means other thaneducation—may lead Asian American families to stresseducation as a means to high social standing and eco-nomic success in the United States.
LABOR FORCE OUTCOMES
Socioeconomic status is multidimensional, with edu-cation and labor force outcomes as two of its main
components. Thus, racial inequality or ethnic inequalityusually refers to racial or ethnic differences in educationand labor force outcomes. The last section examinededucation and found that Asian Americans overall havesurpassed whites in key outcomes, despite substantialdifferences across ethnic groups among Asian Ameri-cans. This section focuses on labor force outcomes.
Labor force outcomes are quite different from edu-cational outcomes in some respects. First, labor forceoutcomes have direct economic consequences for indi-viduals and their families, whereas the consequences ofeducational outcomes are indirect, mostly mediated bytheir effects on labor force outcomes. Second, labor forceoutcomes are not only affected by individuals’ ownefforts and family resources but also by relationshipswith others—employers, supervisors, and co-workers.Third, except for slots in prestigious universities, theeducational achievement of Asian Americans does notnecessarily pose a threat to whites and other minorities.Some workers, however, feel that, as more positions aretaken by Asians in the labor market, fewer are availablefor non-Asians.
Because labor force outcomes are more likely thaneducational outcomes to be influenced by racial resent-ment or discrimination, they are more direct indicatorsof Asian Americans’ social status in American society.This section analyzes three dimensions of labor forceoutcomes—labor supply, earnings, and occupation—and draws comparisons by race and ethnicity as wellas by gender. A focus on gender is necessary becausework has been traditionally segregated by gender inAmerican society.
Labor Supply The labor force participation rate refers to the proportionof the adult population that is either employed or activelylooking for work. Labor force participation excludes peo-ple who are not employed and not seeking employment.If nonparticipation in the labor force reflects not only anindividual’s own choice but also market forces (such aslittle hope of finding meaningful employment), labor forceparticipation confounds labor supply with demand.
Here, labor force participation is treated as laborsupply. The assumption made is that workers canincrease the number of hours worked at will. That is,part-time workers can work full-time if they wish, evenif this change requires them to change employment. Noresults concerning employment are shown, for two rea-sons. First, employment (or unemployment) measuresdemand more than supply. Second, preliminary analysisindicates only very small, unsystematic racial differ-ences in employment rates between Asians and non-Asians and across Asian ethnic groups.
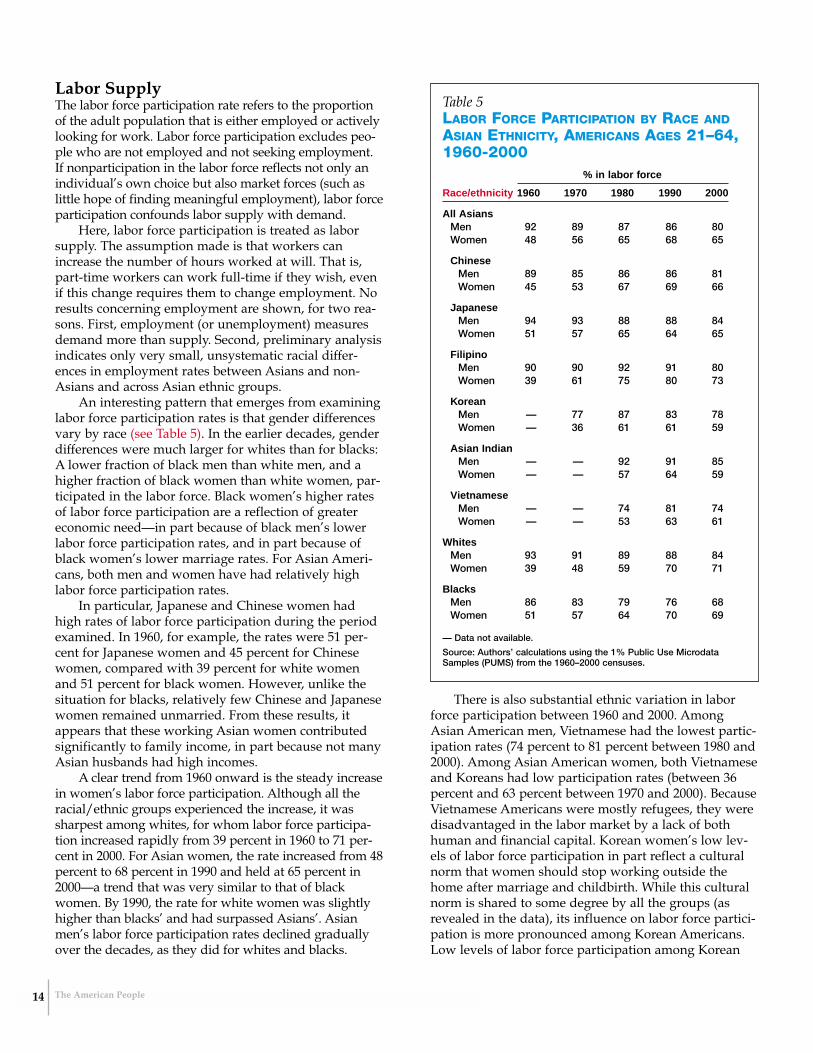
An interesting pattern that emerges from examininglabor force participation rates is that gender differencesvary by race (see Table 5). In the earlier decades, genderdifferences were much larger for whites than for blacks:A lower fraction of black men than white men, and ahigher fraction of black women than white women, par-ticipated in the labor force. Black women’s higher ratesof labor force participation are a reflection of greatereconomic need—in part because of black men’s lowerlabor force participation rates, and in part because ofblack women’s lower marriage rates. For Asian Ameri-cans, both men and women have had relatively highlabor force participation rates.
In particular, Japanese and Chinese women hadhigh rates of labor force participation during the periodexamined. In 1960, for example, the rates were 51 per-cent for Japanese women and 45 percent for Chinesewomen, compared with 39 percent for white womenand 51 percent for black women. However, unlike thesituation for blacks, relatively few Chinese and Japanesewomen remained unmarried. From these results, itappears that these working Asian women contributedsignificantly to family income, in part because not manyAsian husbands had high incomes.
A clear trend from 1960 onward is the steady increasein women’s labor force participation. Although all theracial/ethnic groups experienced the increase, it wassharpest among whites, for whom labor force participa-tion increased rapidly from 39 percent in 1960 to 71 per-cent in 2000. For Asian women, the rate increased from 48percent to 68 percent in 1990 and held at 65 percent in2000—a trend that was very similar to that of blackwomen. By 1990, the rate for white women was slightlyhigher than blacks’ and had surpassed Asians’. Asianmen’s labor force participation rates declined graduallyover the decades, as they did for whites and blacks.
There is also substantial ethnic variation in laborforce participation between 1960 and 2000. AmongAsian American men, Vietnamese had the lowest partic-ipation rates (74 percent to 81 percent between 1980 and2000). Among Asian American women, both Vietnameseand Koreans had low participation rates (between 36percent and 63 percent between 1970 and 2000). BecauseVietnamese Americans were mostly refugees, they weredisadvantaged in the labor market by a lack of bothhuman and financial capital. Korean women’s low lev-els of labor force participation in part reflect a culturalnorm that women should stop working outside thehome after marriage and childbirth. While this culturalnorm is shared to some degree by all the groups (asrevealed in the data), its influence on labor force partici-pation is more pronounced among Korean Americans.Low levels of labor force participation among Korean
The American People14
Table 5LABOR FORCE PARTICIPATION BY RACE ANDASIAN ETHNICITY, AMERICANS AGES 21–64,1960-2000
% in labor force
Race/ethnicity 1960 1970 1980 1990 2000
All AsiansMen 92 89 87 86 80Women 48 56 65 68 65
ChineseMen 89 85 86 86 81Women 45 53 67 69 66
JapaneseMen 94 93 88 88 84Women 51 57 65 64 65
FilipinoMen 90 90 92 91 80Women 39 61 75 80 73
KoreanMen — 77 87 83 78Women — 36 61 61 59
Asian IndianMen — — 92 91 85Women — — 57 64 59
VietnameseMen — — 74 81 74Women — — 53 63 61
WhitesMen 93 91 89 88 84Women 39 48 59 70 71
BlacksMen 86 83 79 76 68Women 51 57 64 70 69
— Data not available.
Source: Authors’ calculations using the 1% Public Use Microdata Samples (PUMS) from the 1960–2000 censuses.
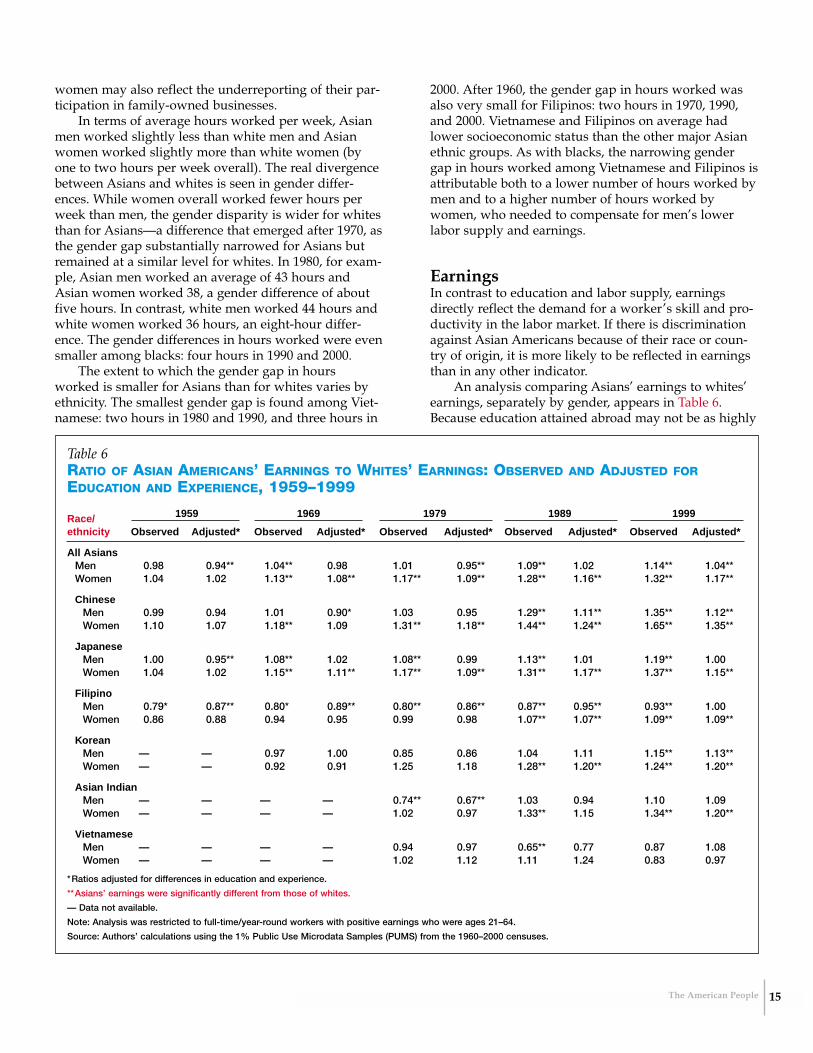
15The American People
women may also reflect the underreporting of their par-ticipation in family-owned businesses.
In terms of average hours worked per week, Asianmen worked slightly less than white men and Asianwomen worked slightly more than white women (byone to two hours per week overall). The real divergencebetween Asians and whites is seen in gender differ-ences. While women overall worked fewer hours perweek than men, the gender disparity is wider for whitesthan for Asians—a difference that emerged after 1970, asthe gender gap substantially narrowed for Asians butremained at a similar level for whites. In 1980, for exam-ple, Asian men worked an average of 43 hours andAsian women worked 38, a gender difference of aboutfive hours. In contrast, white men worked 44 hours andwhite women worked 36 hours, an eight-hour differ-ence. The gender differences in hours worked were evensmaller among blacks: four hours in 1990 and 2000.
The extent to which the gender gap in hoursworked is smaller for Asians than for whites varies byethnicity. The smallest gender gap is found among Viet-namese: two hours in 1980 and 1990, and three hours in
2000. After 1960, the gender gap in hours worked wasalso very small for Filipinos: two hours in 1970, 1990,and 2000. Vietnamese and Filipinos on average hadlower socioeconomic status than the other major Asianethnic groups. As with blacks, the narrowing gendergap in hours worked among Vietnamese and Filipinos isattributable both to a lower number of hours worked bymen and to a higher number of hours worked bywomen, who needed to compensate for men’s lowerlabor supply and earnings.
Earnings In contrast to education and labor supply, earningsdirectly reflect the demand for a worker’s skill and pro-ductivity in the labor market. If there is discriminationagainst Asian Americans because of their race or coun-try of origin, it is more likely to be reflected in earningsthan in any other indicator.
An analysis comparing Asians’ earnings to whites’earnings, separately by gender, appears in Table 6.Because education attained abroad may not be as highly
Table 6RATIO OF ASIAN AMERICANS’ EARNINGS TO WHITES’ EARNINGS: OBSERVED AND ADJUSTED FOREDUCATION AND EXPERIENCE, 1959–1999
Race/ 1959 1969 1979 1989 1999
ethnicity Observed Adjusted* Observed Adjusted* Observed Adjusted* Observed Adjusted* Observed Adjusted*
All AsiansMen 0.98 0.94** 1.04** 0.98 1.01 0.95** 1.09** 1.02 1.14** 1.04**Women 1.04 1.02 1.13** 1.08** 1.17** 1.09** 1.28** 1.16** 1.32** 1.17**
ChineseMen 0.99 0.94 1.01 0.90* 1.03 0.95 1.29** 1.11** 1.35** 1.12**Women 1.10 1.07 1.18** 1.09 1.31** 1.18** 1.44** 1.24** 1.65** 1.35**
JapaneseMen 1.00 0.95** 1.08** 1.02 1.08** 0.99 1.13** 1.01 1.19** 1.00Women 1.04 1.02 1.15** 1.11** 1.17** 1.09** 1.31** 1.17** 1.37** 1.15**
FilipinoMen 0.79* 0.87** 0.80* 0.89** 0.80** 0.86** 0.87** 0.95** 0.93** 1.00Women 0.86 0.88 0.94 0.95 0.99 0.98 1.07** 1.07** 1.09** 1.09**
KoreanMen — — 0.97 1.00 0.85 0.86 1.04 1.11 1.15** 1.13**Women — — 0.92 0.91 1.25 1.18 1.28** 1.20** 1.24** 1.20**
Asian IndianMen — — — — 0.74** 0.67** 1.03 0.94 1.10 1.09Women — — — — 1.02 0.97 1.33** 1.15 1.34** 1.20**
VietnameseMen — — — — 0.94 0.97 0.65** 0.77 0.87 1.08Women — — — — 1.02 1.12 1.11 1.24 0.83 0.97
*Ratios adjusted for differences in education and experience.
**Asians’ earnings were significantly different from those of whites.
— Data not available.
Note: Analysis was restricted to full-time/year-round workers with positive earnings who were ages 21–64.
Source: Authors’ calculations using the 1% Public Use Microdata Samples (PUMS) from the 1960–2000 censuses.
valued in the American labor market as educationacquired in the United States, Asian American immi-grants who completed their education prior to immigra-tion may suffer an earnings disadvantage.18
The entries in Table 6 are the Asian/white earningsratios, observed and adjusted. An observed earningsratio is the ratio of Asians’ average earnings to whites’average earnings. An adjusted earnings ratio accountsfor education and experience. Comparison of the tworatios indicates Asian Americans suffer an earnings dis-advantage after adjustment for schooling and years ofwork experience. (Asians are said by some to achieveeconomic parity with whites through “overeducation”;this is called the net disadvantage thesis.19 Since AsianAmericans are advantaged relative to whites in educa-tion but not in work experience, the difference betweenobserved earnings ratios and adjusted earnings ratios isattributable to Asians’ higher educational attainment.
A value of 1.00 in Table 6 means earnings equity. Aratio value less than 1.00 indicates Asians’ disadvantage.Likewise, a number greater than 1.00 indicates Asians’advantage. For example, in 1959 all Asian men earned 98percent as much as white men on average, but the racialdifference is not statistically significant (in other words, itcould be due to chance). However, after adjusting forhuman capital, Asians earned 94 percent as much as com-parable whites in 1959, and this racial difference is statis-tically significant (not likely to be due to chance). Thusthe apparent equality of observed earnings is the result ofAsians’ higher levels of educational attainment.
Several findings emerge from the earnings results.First, Asian Americans compared more favorably withwhites in observed earnings than in adjusted earnings.Asians’ advantage over whites in observed earnings isparticularly large in 1989 and 1999, in part reflecting theincreased return to higher education in the U.S. labormarket during this period. Second, there is a significantand steady trend over the decades in Asians’ favor.Without adjustment, Asian men earned about as muchas white men between 1959 and 1979, but earned 9 per-cent more in 1989 and 14 percent more in 1999. Afteradjustment, Asian men experienced an earnings disad-vantage of 6 percent in 1959 and 5 percent in 1979, but a4 percent advantage in 1999. Similar increases in theAsian/white ratio for the six major ethnicities are alsoapparent. Third, Asian women have fared well relativeto white women. Throughout the period and for all thegroups considered, Asian women’s earnings were notsignificantly lower than white women’s. In fact, Asianwomen’s observed earnings and adjusted earningsbegan to surpass those of whites in 1969, and theiradvantage over whites grew rapidly. By 1999, Asianwomen earned 32 percent more than whites beforeadjustment and 17 percent more after adjustment.
Finally, substantial variation occurred across Asianethnic groups. Of the three major Asian groups that
were observed throughout the four-decade period, Fil-ipinos did not do as well as Chinese and Japanese. In1959, Filipino men earned 79 percent as much as whitesbefore adjustment and 87 percent as much as whitesafter adjustment. The gap between Filipino men andwhite men gradually closed by 1999. However, in noyear were the earnings of Filipino men higher thanthose of white men, either observed or adjusted. The Fil-ipina-white gap for women was not statistically signifi-cant between 1959 and 1979, after which the gap turnedto Filipinas’ favor. In fact, in 1999 Filipinas earned 9 per-cent more than white women, in both observed andadjusted earnings. While Vietnamese overall had rela-tively low earnings, the only statistically significant dis-parity between Vietnamese and whites was for observedearnings in 1989. Asian Indians actually had low earn-ings relative to whites as recently as in 1979, whenIndian men earned 74 percent as much as whites beforeadjustment and merely 67 percent as much after adjust-ment. After 1989, Asian Indian men reached parity withwhites in both observed and adjusted earnings. AsianIndian women had about one-third higher observedearnings than whites in 1989, and about one-fifth higheradjusted earnings in 1999.
These results suggest that the net disadvantage the-sis may be a valid characterization of the experiences ofAsian American men prior to 1989. However, it does notappear to hold for either Asian American women ingeneral, or for Asian American men since 1989. Due toboth their higher educational attainment and higherearnings within levels of education, Asian Americanwomen have had an advantage over white women since1969. Relative earnings of Asian American men alsoimproved dramatically, to the point of surpassingwhites, even after adjusting for education and experi-ence. If there is some evidence that Asian Americanmen’s lower adjusted earnings relative to white men’searnings reflected racial discrimination from 1959 to1979, this ceased to be true after 1989.
Occupation Occupation has been of central interest to those whostudy inequality for several reasons. First, one’s occupa-tion is usually known to friends, relatives, and acquain-tances, and it is often considered a shorthanddescription of social status. In contrast, earnings are cus-tomarily private and are seldom used by others todescribe a person’s social status. Second, occupation is arelatively stable attribute that does not change muchover the life cycle or the business cycle. In some ways,occupation can be thought of as a proxy measure ofone’s permanent income. Third, occupations are con-crete social positions that are filled by actual workers.Forces such as technological innovation or economicdevelopment change the occupational structure and
The American People16
17The American People
generate new positions, which in turn provide opportu-nities for social mobility. Sociologists have long beeninterested in who benefits and who loses as a result ofsuch structural changes.
Occupation is significant for another reason that isespecially germane to the discussion of inequalityamong Asian Americans. Some occupations may pro-vide channels of mobility that are less subject to poten-tial discrimination.20 First, the extent to which objectivecriteria can be used for performance assessment varies,or is perceived to vary, from occupation to occupation.For example, universalism is a core normative principlein science, where extraneous factors—such as race, gen-der, nationality, and religion—should not play a role inthe evaluation of performance. Similarly, in occupationssuch as engineering and computer programming, deliv-ery of products and services can be more directlyobserved and assessed than in other occupations, suchas the military, teaching, and clerical work.
Furthermore, there is a direct correspondencebetween educational credentials and entry into certainoccupations. For example, it usually takes a doctoraldegree in science to be a scientist, and a medical degreeto be a physician. Attaining such credentials is a longand arduous process, and no matter how privileged aperson is—either because of family background orrace—he/she cannot become a scientist or a physicianwithout the requisite educational credentials. However,regardless of one’s social origin (including race), jobopportunities in these fields are widely available onceone attains the educational credentials. This close linkbetween education and entry into many prestigiousoccupations makes it reasonable for Asian Americans touse educational attainment as an effective channel ofmobility to overcome either real or perceived barriers tosome high-status occupations.
Given that Asian Americans have achieved high edu-cational and academic credentials, they may rationallyseek to work in occupations in which they can demon-strate their skills and in which objective criteria are usedto evaluate performance. One 30-year-old Korean Ameri-can summed up Asians’ motivation in this way:
“I don’t think that Asians prefer the sciences. Some-times it is the only avenue open to them. In the sciences, empirical results matter more than in theesoteric discussion of humanities. So that at least asan engineer, you know how to put machines in, andyou can be a useful bolt and nut. And I think the jobopportunities for us lie in this field.”21
Asians, then, may be concentrated in certain occu-pations on the basis of their desire to maximize socio-economic outcomes. However, racial concentration incertain occupations can also occur through other socialmechanisms. An historical example illustrates how this
can happen. In San Francisco in the late 19th century, asmall group of Chinese people began working in thelaundry service occupation in response to discrimina-tion and labor competition from whites. Their successdemonstrated that they could operate laundries, notnecessarily that they were best suited to running laun-dries relative to other kinds of work. Somehow, throughsocial networks and role modeling, many other Chinesefollowed suit and started their own laundry businesses,thus creating a concentration of Chinese in the laundryservice through the 1920s.22
The clustering of Asian workers in certain occupa-tions is presented in Table 7 (page 18). Values in eachrow should be compared with the corresponding entriesin the second row from the bottom, the total percentageof Asian workers in the civilian labor force within eachcensus year. A number greater than the total percentageindicates an overrepresentation of Asians in a particularoccupation. Likewise, a number smaller than the totalpercentage represents an underrepresentation of Asians.The last row of the table presents the index of dissimi-larity, measuring the occupational segregation of Asiansfrom non-Asians.
The table supports the notion that Asians may con-sciously pursue certain occupations, such as life scien-tists, architects, physicians, and dentists, to maximizetheir chances for upward social mobility, since these arehigh-status occupations requiring high educationalattainment. Asians’ presence in some other occupations,like farmers and textile operators, reflects the laborniches that early Asian immigrants occupied.
As described earlier, the Asian population grew rap-idly after 1965. This growth is reflected in the steadyincrease in the percentage of Asians in the labor force,from 0.5 percent in 1960 to 4.1 percent in 2000—aneightfold increase in four decades. However, theincrease in Asian representation was much steeper insome occupational areas than in others. Foremostamong these areas were scientific and engineering occu-pations. For example, the percentage of Asians in physi-cal science jobs jumped from an unremarkable 0.7percent in 1960 to an astonishingly high 15.3 percent in2000. The percentage of Asians among computer spe-cialists, an occupation that did not exist in the 1960 cen-sus occupation classification, increased from 1.2 percentin 1970 to 13.2 percent in 2000. Also, Asians’ representa-tion increased markedly in all other professional jobsexcept for elementary and preschool teachers, secondaryand vocational teachers, lawyers and judges, and socialand recreation workers. For example, the percentage ofAsians among physicians, dentists, and related occupa-tions increased rapidly from 1.4 percent in 1960 to 13.6percent in 2000. Third, and surprisingly, Asians rapidlyincreased their share in skilled manual work, such astextile operators, craftsmen, and other operators (respec-tively to 10.1 percent, 4.7 percent, and 4.0 percent in
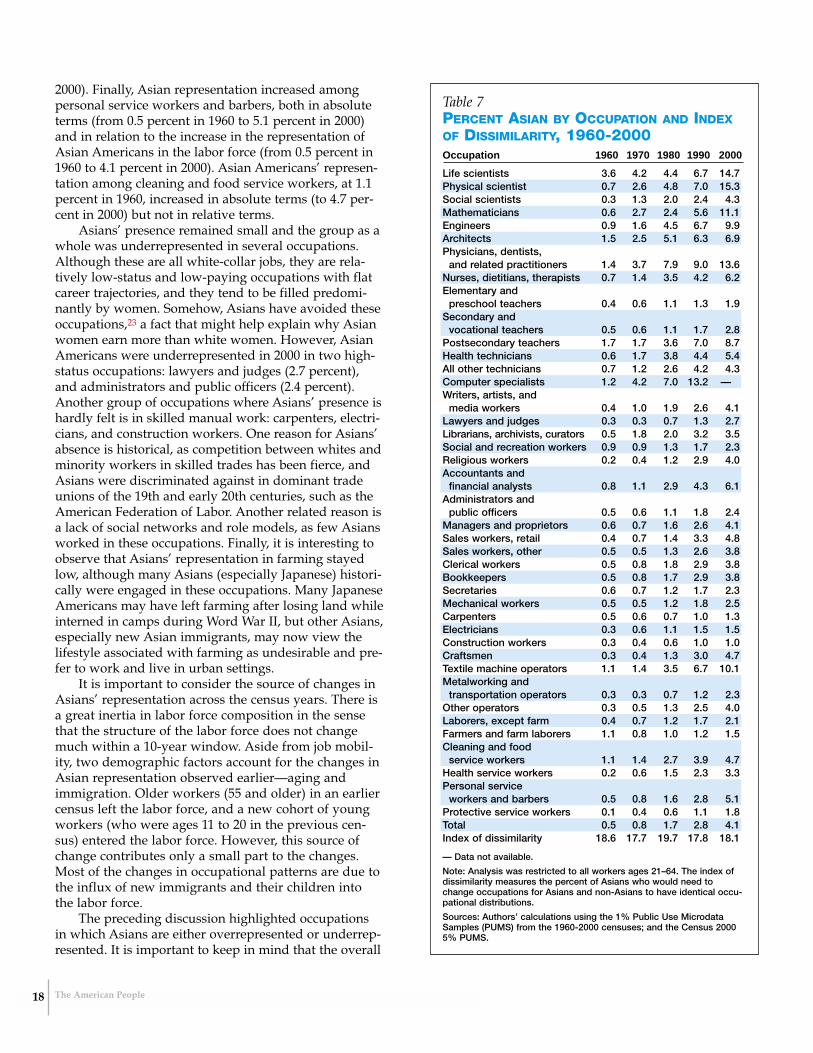
2000). Finally, Asian representation increased amongpersonal service workers and barbers, both in absoluteterms (from 0.5 percent in 1960 to 5.1 percent in 2000)and in relation to the increase in the representation ofAsian Americans in the labor force (from 0.5 percent in1960 to 4.1 percent in 2000). Asian Americans’ represen-tation among cleaning and food service workers, at 1.1percent in 1960, increased in absolute terms (to 4.7 per-cent in 2000) but not in relative terms.
Asians’ presence remained small and the group as awhole was underrepresented in several occupations.Although these are all white-collar jobs, they are rela-tively low-status and low-paying occupations with flatcareer trajectories, and they tend to be filled predomi-nantly by women. Somehow, Asians have avoided theseoccupations,23 a fact that might help explain why Asianwomen earn more than white women. However, AsianAmericans were underrepresented in 2000 in two high-status occupations: lawyers and judges (2.7 percent),and administrators and public officers (2.4 percent).Another group of occupations where Asians’ presence ishardly felt is in skilled manual work: carpenters, electri-cians, and construction workers. One reason for Asians’absence is historical, as competition between whites andminority workers in skilled trades has been fierce, andAsians were discriminated against in dominant tradeunions of the 19th and early 20th centuries, such as theAmerican Federation of Labor. Another related reason isa lack of social networks and role models, as few Asiansworked in these occupations. Finally, it is interesting toobserve that Asians’ representation in farming stayedlow, although many Asians (especially Japanese) histori-cally were engaged in these occupations. Many JapaneseAmericans may have left farming after losing land whileinterned in camps during Word War II, but other Asians,especially new Asian immigrants, may now view thelifestyle associated with farming as undesirable and pre-fer to work and live in urban settings.
It is important to consider the source of changes inAsians’ representation across the census years. There isa great inertia in labor force composition in the sensethat the structure of the labor force does not changemuch within a 10-year window. Aside from job mobil-ity, two demographic factors account for the changes inAsian representation observed earlier—aging andimmigration. Older workers (55 and older) in an earliercensus left the labor force, and a new cohort of youngworkers (who were ages 11 to 20 in the previous cen-sus) entered the labor force. However, this source ofchange contributes only a small part to the changes.Most of the changes in occupational patterns are due tothe influx of new immigrants and their children intothe labor force.
The preceding discussion highlighted occupationsin which Asians are either overrepresented or underrep-resented. It is important to keep in mind that the overall
The American People18
Table 7PERCENT ASIAN BY OCCUPATION AND INDEXOF DISSIMILARITY, 1960-2000Occupation 1960 1970 1980 1990 2000
Life scientists 3.6 4.2 4.4 6.7 14.7Physical scientist 0.7 2.6 4.8 7.0 15.3Social scientists 0.3 1.3 2.0 2.4 4.3Mathematicians 0.6 2.7 2.4 5.6 11.1Engineers 0.9 1.6 4.5 6.7 9.9Architects 1.5 2.5 5.1 6.3 6.9Physicians, dentists,
and related practitioners 1.4 3.7 7.9 9.0 13.6Nurses, dietitians, therapists 0.7 1.4 3.5 4.2 6.2Elementary and
preschool teachers 0.4 0.6 1.1 1.3 1.9Secondary and
vocational teachers 0.5 0.6 1.1 1.7 2.8Postsecondary teachers 1.7 1.7 3.6 7.0 8.7Health technicians 0.6 1.7 3.8 4.4 5.4All other technicians 0.7 1.2 2.6 4.2 4.3Computer specialists 1.2 4.2 7.0 13.2 —Writers, artists, and
media workers 0.4 1.0 1.9 2.6 4.1Lawyers and judges 0.3 0.3 0.7 1.3 2.7Librarians, archivists, curators 0.5 1.8 2.0 3.2 3.5Social and recreation workers 0.9 0.9 1.3 1.7 2.3Religious workers 0.2 0.4 1.2 2.9 4.0Accountants and
financial analysts 0.8 1.1 2.9 4.3 6.1Administrators and
public officers 0.5 0.6 1.1 1.8 2.4Managers and proprietors 0.6 0.7 1.6 2.6 4.1Sales workers, retail 0.4 0.7 1.4 3.3 4.8Sales workers, other 0.5 0.5 1.3 2.6 3.8Clerical workers 0.5 0.8 1.8 2.9 3.8Bookkeepers 0.5 0.8 1.7 2.9 3.8Secretaries 0.6 0.7 1.2 1.7 2.3Mechanical workers 0.5 0.5 1.2 1.8 2.5Carpenters 0.5 0.6 0.7 1.0 1.3Electricians 0.3 0.6 1.1 1.5 1.5Construction workers 0.3 0.4 0.6 1.0 1.0Craftsmen 0.3 0.4 1.3 3.0 4.7Textile machine operators 1.1 1.4 3.5 6.7 10.1Metalworking and
transportation operators 0.3 0.3 0.7 1.2 2.3Other operators 0.3 0.5 1.3 2.5 4.0Laborers, except farm 0.4 0.7 1.2 1.7 2.1Farmers and farm laborers 1.1 0.8 1.0 1.2 1.5Cleaning and food
service workers 1.1 1.4 2.7 3.9 4.7Health service workers 0.2 0.6 1.5 2.3 3.3Personal service
workers and barbers 0.5 0.8 1.6 2.8 5.1Protective service workers 0.1 0.4 0.6 1.1 1.8Total 0.5 0.8 1.7 2.8 4.1Index of dissimilarity 18.6 17.7 19.7 17.8 18.1
— Data not available.
Note: Analysis was restricted to all workers ages 21–64. The index ofdissimilarity measures the percent of Asians who would need tochange occupations for Asians and non-Asians to have identical occu-pational distributions.
Sources: Authors’ calculations using the 1% Public Use MicrodataSamples (PUMS) from the 1960-2000 censuses; and the Census 20005% PUMS.
19The American People
differences in the distributions of Asians and non-Asians across occupations are small. This is shown inthe last row of Table 7, which presents the index of dis-similarity measuring the racial occupational segregation.According to this index, which varies between 18 per-cent (in 1970, 1990, and 2000) and 20 percent (in 1980),levels of racial segregation are low. The index indicatesthat only 18 percent to 20 percent of all Asians (or non-Asians) would need to change occupations in order forAsians and non-Asians to have identical distributionsacross the occupational classifications.
Education and Hard WorkEducation is at the core of Asian Americans’ socialmobility. Their high educational achievement has facili-tated their entry into many occupations that require col-lege and advanced degrees. Asian Americans’ largepresence in science, engineering, and medicine evolvedgradually from 1960 to 2000. While part of this transfor-mation is attributable to the influx of new immigrantsand their children, who increased the overall share ofAsian Americans in the labor force, the main explana-tion is that a large portion (indeed most by 2000) ofAsian Americans, either U.S.-born or foreign-born,attained postsecondary education. High educational cre-dentials facilitated Asian Americans’ entry into profes-sional jobs in the labor market.
Asian Americans’ high educational attainment isalso a major reason for their relatively high earnings.Among U.S.-born workers, Asian American menreached parity in earnings with whites in earlierdecades in the 1960s and 1970s through higher educa-tional attainment. Within levels of education, however,Asian American men suffered an earnings disadvantageof 5 percent. That is, education accounted for about a 5percent difference in observed earnings between AsianAmericans and whites between 1960 and 1980. The dif-ference attributable to education increased to 10 percentin 2000. By then Asian American men earned more thanwhite men, not only in observed earnings (by 14 per-cent) but also in adjusted earnings (by 4 percent).Among women, Asian Americans consistently outper-formed whites in earnings throughout the period, inboth observed and adjusted earnings. In recent decades,education seems to play a particularly large role in thehigher earnings of Asian American women. In 2000,Asian American women’s observed earnings were 32percent greater than those of white women. This pre-mium goes down to 17 percent for adjusted earnings,suggesting that education accounts for almost half of theobserved advantage enjoyed by Asian Americanwomen. Again, Asian Americans’ higher earnings, eitherobserved or adjusted, did not happen instantly. In fact,Asian American men experienced a net disadvantage inthe 1960s.
Finally, there are substantial ethnic differencesacross Asian groups. In both education and earnings,Filipinos and Vietnamese lagged behind the other majorAsian groups. Indeed, the Vietnamese (even U.S.-bornVietnamese) are the only Asian group that had a lowerrate of college education than whites. However, socioe-conomic conditions for Filipinos and Vietnamese havesignificantly improved over time, and both groups hadearnings roughly comparable to whites in 2000.
MARRIAGE AND FAMILY
Asian Americans have effectively used education as avehicle for social mobility. However, educational
attainment normally occurs early in the life course,when an individual is still dependent on parents forboth financial and emotional support. Because parents’emotional encouragement and financial support facili-tate educational attainment, the high levels of educationfound among Asian American youth reflect the largeinvestment of Asian American parents. Seen in thislight, achieving social mobility through education is afamily strategy. Thus, knowledge of Asian Americans’situations and experiences in the United States would beincomplete without understanding the Asian Americanfamily.
This section looks at family characteristics and mar-riage patterns of Asian Americans, relative to those ofwhites and blacks. For simplicity, only the results fromthe 2000 Census are presented.24 Tremendous changehas occurred in American families in recent decades,such as increases in age of marriage (that is, the post-ponement of marriage), decreases in marriage, andincreases in divorce and premarital cohabitation rates.These trends have affected all racial groups, and analy-sis of 2000 Census data provides sharp comparisonsbetween Asians and non-Asians, and across differentAsian ethnicities.
Another important trend has been the steadyincrease in women’s labor force participation. Somescholars hypothesize that women’s growing involve-ment in the labor force has contributed both to theirpostponement of marriage and to their disinclinationtoward marriage, as it has provided financial stabilityfor women outside of marriage. This hypothesis mayalso explain why marriage rates are lower among blacksthan among whites. Historically, black women havebeen more active than whites in the U.S. labor force; siz-able fractions of black men have lacked steady employ-ment, which made them less appealing as marriagepartners.
The labor force participation rates of Asian womenwere historically higher than whites’ and close to blacks’prior to 1990. Asian women also tended to work long

hours and to earn more than their white or black coun-terparts. Thus, all available evidence indicates thatAsian American women have been active in economicpursuits, although there is ethnic variation, with Koreanwomen less economically active than other groups.However, this greater economic independence amongAsian women has not caused them to avoid marriage.In fact, marriage rates are relatively high and divorcerates relatively low among Asian Americans.
Family CharacteristicsAsian Americans are more likely to live in married-cou-ple or husband-wife families than are whites or blacks(see Table 8). As defined here, a husband-wife family isnot the same as a nuclear family—which includes solelya married couple and their own children—but it encom-passes a nuclear family. For instance, an elderly womanwho lives with her daughter and her son-in-law is con-sidered to live in a husband-wife family, as is a childwho lives with his or her grandparents. Individuals wholive by themselves or in families headed by unmarriedadults are not considered to live in a husband-wife fam-
ily. The husband-wife family is used here as a measureof the stability and support—both emotional and mate-rial—of family life that are commonly associated withmarriage.
For all people regardless of age, the share living inhusband-wife families is 73 percent among AsianAmericans, compared with 67 percent among whitesand 40 percent among blacks. For children, the percent-age is 84 percent among Asians, compared with 78 per-cent among whites and 40 percent among blacks. Thereis some cross-ethnic variation among Asian Americans.Most notable is that only 65 percent of all Japanese, themost assimilated Asian group, live in husband-wifefamilies. However, the percentage of Japanese childrenliving in husband-wife families is very high, at 88 per-cent. The only Asian American group with a signifi-cantly lower percentage of children living inhusband-wife families is multiracial Asians, whose rateis similar to whites’ on this measure. The overall picturethat emerges from these numbers is that an overwhelm-ing majority of Asians, especially Asian children, live infamilies headed by married couples and thus benefitfrom this living arrangement.
The American People20
Table 8FAMILY CHARACTERISTICS BY RACE AND ASIAN ETHNIC GROUP, 2000
% % in 1999 mean 1999 median %in husband- multigeneration Mean family income family income in poverty,
Race/ethnicity and age wife families families family size ($1,000) ($1,000) 1999
All personsAll Asians 73 15 4.2 $77 $61 13
Chinese 73 15 3.9 82 63 13Japanese 65 5 3.2 91 74 9Filipino 73 22 4.4 81 70 6Korean 74 10 3.7 71 53 15Asian Indian 80 14 4.0 94 70 10Vietnamese 72 16 4.7 65 52 15Other Asian 74 19 5.3 56 44 23Multiethnic Asian 72 13 4.3 78 64 12Multiracial Asian 66 11 4.1 71 55 13
Whites 67 5 3.5 70 55 9Blacks 40 14 3.9 45 35 24
Children (ages 0-17)All Asians 84 17 4.8 74 57 14
Chinese 88 19 4.5 82 63 13Japanese 88 7 4.1 98 80 6Filipino 82 27 5.0 77 67 6Korean 88 11 4.2 73 56 12Asian Indian 92 18 4.6 91 66 10Vietnamese 81 17 5.1 59 45 20Other Asian 82 21 6.1 49 38 30Multiethnic Asian 84 15 4.7 80 65 11Multiracial Asian 77 13 4.4 72 56 11
Whites 78 7 4.4 68 52 11Blacks 40 18 4.4 39 29 32
Note: Mean family size, mean family income, and median family income were computed for individuals in each group.
Source: Authors’ calculations using the Census 2000 1% (for whites and blacks) and 5% (for Asian groups) Public Use Microdata Samples (PUMS).
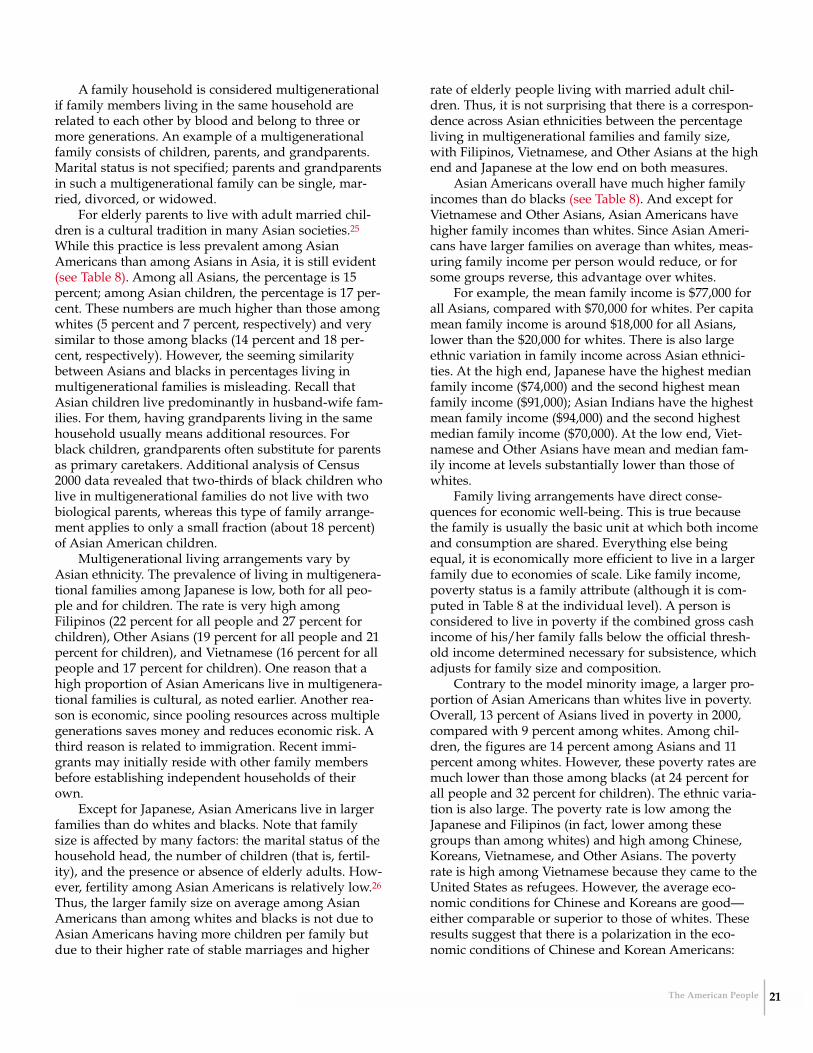
21The American People
A family household is considered multigenerationalif family members living in the same household arerelated to each other by blood and belong to three ormore generations. An example of a multigenerationalfamily consists of children, parents, and grandparents.Marital status is not specified; parents and grandparentsin such a multigenerational family can be single, mar-ried, divorced, or widowed.
For elderly parents to live with adult married chil-dren is a cultural tradition in many Asian societies.25
While this practice is less prevalent among AsianAmericans than among Asians in Asia, it is still evident(see Table 8). Among all Asians, the percentage is 15percent; among Asian children, the percentage is 17 per-cent. These numbers are much higher than those amongwhites (5 percent and 7 percent, respectively) and verysimilar to those among blacks (14 percent and 18 per-cent, respectively). However, the seeming similaritybetween Asians and blacks in percentages living inmultigenerational families is misleading. Recall thatAsian children live predominantly in husband-wife fam-ilies. For them, having grandparents living in the samehousehold usually means additional resources. Forblack children, grandparents often substitute for parentsas primary caretakers. Additional analysis of Census2000 data revealed that two-thirds of black children wholive in multigenerational families do not live with twobiological parents, whereas this type of family arrange-ment applies to only a small fraction (about 18 percent)of Asian American children.
Multigenerational living arrangements vary byAsian ethnicity. The prevalence of living in multigenera-tional families among Japanese is low, both for all peo-ple and for children. The rate is very high amongFilipinos (22 percent for all people and 27 percent forchildren), Other Asians (19 percent for all people and 21percent for children), and Vietnamese (16 percent for allpeople and 17 percent for children). One reason that ahigh proportion of Asian Americans live in multigenera-tional families is cultural, as noted earlier. Another rea-son is economic, since pooling resources across multiplegenerations saves money and reduces economic risk. Athird reason is related to immigration. Recent immi-grants may initially reside with other family membersbefore establishing independent households of theirown.
Except for Japanese, Asian Americans live in largerfamilies than do whites and blacks. Note that familysize is affected by many factors: the marital status of thehousehold head, the number of children (that is, fertil-ity), and the presence or absence of elderly adults. How-ever, fertility among Asian Americans is relatively low.26
Thus, the larger family size on average among AsianAmericans than among whites and blacks is not due toAsian Americans having more children per family butdue to their higher rate of stable marriages and higher
rate of elderly people living with married adult chil-dren. Thus, it is not surprising that there is a correspon-dence across Asian ethnicities between the percentageliving in multigenerational families and family size,with Filipinos, Vietnamese, and Other Asians at the highend and Japanese at the low end on both measures.
Asian Americans overall have much higher familyincomes than do blacks (see Table 8). And except forVietnamese and Other Asians, Asian Americans havehigher family incomes than whites. Since Asian Ameri-cans have larger families on average than whites, meas-uring family income per person would reduce, or forsome groups reverse, this advantage over whites.
For example, the mean family income is $77,000 forall Asians, compared with $70,000 for whites. Per capitamean family income is around $18,000 for all Asians,lower than the $20,000 for whites. There is also largeethnic variation in family income across Asian ethnici-ties. At the high end, Japanese have the highest medianfamily income ($74,000) and the second highest meanfamily income ($91,000); Asian Indians have the highestmean family income ($94,000) and the second highestmedian family income ($70,000). At the low end, Viet-namese and Other Asians have mean and median fam-ily income at levels substantially lower than those ofwhites.
Family living arrangements have direct conse-quences for economic well-being. This is true becausethe family is usually the basic unit at which both incomeand consumption are shared. Everything else beingequal, it is economically more efficient to live in a largerfamily due to economies of scale. Like family income,poverty status is a family attribute (although it is com-puted in Table 8 at the individual level). A person isconsidered to live in poverty if the combined gross cashincome of his/her family falls below the official thresh-old income determined necessary for subsistence, whichadjusts for family size and composition.
Contrary to the model minority image, a larger pro-portion of Asian Americans than whites live in poverty.Overall, 13 percent of Asians lived in poverty in 2000,compared with 9 percent among whites. Among chil-dren, the figures are 14 percent among Asians and 11percent among whites. However, these poverty rates aremuch lower than those among blacks (at 24 percent forall people and 32 percent for children). The ethnic varia-tion is also large. The poverty rate is low among theJapanese and Filipinos (in fact, lower among thesegroups than among whites) and high among Chinese,Koreans, Vietnamese, and Other Asians. The povertyrate is high among Vietnamese because they came to theUnited States as refugees. However, the average eco-nomic conditions for Chinese and Koreans are good—either comparable or superior to those of whites. Theseresults suggest that there is a polarization in the eco-nomic conditions of Chinese and Korean Americans:
Whereas a large portion of these groups has realized theAmerican dream by achieving middle-class status,another large portion has been left behind and economi-cally deprived. This economic diversity of Asian Ameri-cans within the same ethnic group is often overlooked.
Prevalence and Timing of MarriageExamining Asian Americans’ marriage patterns is not aneasy task because census data provide informationabout current marital status only, not marital history. Inparticular, for respondents who said they were currentlymarried, it is not known for how long they were mar-ried or whether they had previously married anddivorced. For those who were divorced, neither the tim-ing of the divorce nor the marital history preceding thedivorce is known. The following analysis relies on acrude measure of divorce, calculated as the differencebetween ever married and currently married, ignoringremarriage and widowhood.
Proportionately more Asian Americans are currentlymarried than are whites and blacks (see Table 9).Among men ages 35 to 44, 78 percent of Asian Ameri-cans are currently married, compared with 69 percent ofwhites and 52 percent of blacks. Among women ages 35to 44, 80 percent of Asian Americans are currently mar-ried, compared with 71 percent of whites and 42 percentof blacks. There is some evidence that, relative towhites, Asians’ higher rates of current marriage areattributable to Asians’ lower likelihood of divorce.
The rates of ever being married are comparablebetween Asian Americans and whites (85 percent formen and 90 percent for women). The difference betweenever married and currently married for people ages 35to 44, a crude measure of divorce, is 7 percentage pointsamong Asian men and about 10 percentage pointsamong Asian women. In contrast, the difference standsat 15 percentage points for white men and 18 percentagepoints for white women. Blacks’ rates of being currentlymarried are low for two reasons, both because a lowerproportion ever marries (71 percent for men and 69 per-cent for women) and because a higher percentage ofthose who were previously married is no longer mar-ried (19 percent among men and 27 percent amongwomen).
There are notable ethnic variations in the percent-ages currently married and ever married. The Japanesehave relatively low marriage rates, and Koreans andAsian Indians have the highest marriage rates. Further-more, multiracial Asians have marriage rates thatclosely resemble those of whites. In particular, the dif-ference in the two marriage rates, ever married minuscurrently married, is slightly higher among multiracialAsian women (19 percentage points) than among whitewomen (18 percentage points). This result suggests thatmultiracial Asians have assimilated to the degree that
their marriage patterns resemble more closely those ofwhites than those of monoracial Asians.
The proportion of first marriages occurring in ages 45to 54 is twice as high among Asian American men (8 per-
The American People22
Table 9PERCENT CURRENTLY MARRIED AND EVER-MARRIED AND MEDIAN AGE OF MARRIAGE,BY RACE/ETHNICITY AND GENDER, 2000
Median% % % % age at
currently ever currently ever marriagemarried married married married among(ages (ages (ages (ages all ever-
Race/ethnicity 35-44) (35-44) (45-54) (45-54) married
All AsiansMen 78 85 85 93 28Women 80 90 78 94 25
ChineseMen 82 87 87 94 29Women 82 90 81 94 27
JapaneseMen 64 72 72 84 30Women 74 85 75 91 27
FilipinoMen 76 84 83 92 28Women 77 89 76 92 25
KoreanMen 85 91 90 98 30Women 84 94 81 98 27
Asian IndianMen 88 92 92 97 27Women 90 95 87 97 23
VietnameseMen 75 80 84 93 30Women 76 87 76 93 26
Other AsianMen 79 86 86 95 28Women 81 92 76 94 24
Multiethnic AsianMen 76 82 83 93 —Women 75 88 78 94 —
Multiracial AsianMen 67 80 74 90 28Women 68 87 65 91 25
WhitesMen 69 84 74 91 26Women 71 89 70 93 24
BlacksMen 52 71 55 82 27Women 42 69 43 82 28
— Insufficient data.
Source: Authors’ calculations using the Census 2000 1% (for whitesand blacks) and 5% (for Asian groups) Public Use Microdata Samples(PUMS).
23The American People
centage points) as it is among Asian American women (4percentage points). A similar gender difference existsbetween white men (7 percentage points) and whitewomen (4 percentage points). Overall, the data show thatamong Asian Americans and whites a very small propor-tion of people get married for the first time past age 44,because an overwhelming majority of them has alreadybeen married before that age. However, the proportion ismuch higher among blacks (around 12 percent).
Change across age groups in the proportion currentlymarried is an indicator of divorce, remarriage, or newmarriage. The difference is a positive 7 percentage pointsfor Asian American men but a negative 2 percentagepoints among Asian American women. This gender dif-ference probably reflects the fact that a higher proportionof divorced men than divorced women get remarried, pre-sumably to younger women. This gender asymmetry isalso true for whites and blacks. In any event, in ages 45 to54, 85 percent of Asian American men and 78 percent ofAsian American women are still married, compared with74 percent of white men and 70 percent of white women.Thus, the data show that Asian Americans, with theexception of Japanese and multiracial Asians, are stillmore likely to be married than are whites in this later agerange.
The median age of marriage is estimated to be 28among Asian men and 25 among Asian women. Compar-ing these numbers to those of whites (26 for white menand 24 for white women) leads to two conclusions: First,Asian Americans marry at later ages than do whites. Sec-ond, the age gap between men and women in the medianage of marriage is also slightly wider for Asian Ameri-cans (three years) than for whites (two years). The lateage of marriage for Asian Americans may reflect a tradi-tional expectation that a person (especially a man) needsto be economically established before marriage. The pat-terns of late marriage and a high gender gap in the age ofmarriage are true across all Asian American groups. Forexample, among Japanese Americans, the most assimi-lated Asian group, the median age of marriage is esti-mated to be 30 for men and 27 for women. Interestingly,black women have a high median age of marriage, 28.
Data from Census 2000 shed some light on AsianAmericans’ marriage patterns. Compared with whitesand blacks, Asian Americans have relatively high ratesof marriage, low rates of divorce, but a high median ageof marriage. All of these results seem to suggest thatAsian Americans are still influenced by a culture thatemphasizes the importance of the family and familyresponsibility.
IntermarriageEarly Asian immigrants were predominantly male man-ual workers. There were very few Asian women inAmerica who could be their marriage partners. To make
the situation worse, Asian workers were not allowed tobring their wives to the United States. In fear of Asianmen marrying U.S.-born white women, many statesinstituted antimiscegenation laws to prohibit marriagesbetween Asians and whites. This situation lasted untilthe end of World War II, when U.S. servicemen whofought and were stationed overseas in Asia began tobring home war brides from Asia. This started a new erain which Asian women are accepted, and sometimeseven preferred, as wives by white and black men.
However, large-scale immigration from Asia did notoccur until the landmark 1965 Immigration and Nation-ality Act. The beginning of this new wave of immigra-tion coincided with the Civil Rights Movement, whichresulted in the abolition of antimiscegenation laws in1967. Intermarriage between Asian Americans and otherracial groups began to increase. Whereas American cul-ture has applied a one-drop rule when racially identify-
Box 3THE ONE-DROP RULE VS. THE 50-PERCENTRULE
The 2000 U.S. Census allowed for the first time the enu-meration of people with multiple racial/ethnic affiliations.For comparison with historical data and for simplicity, it issometimes necessary to reclassify multiracial people in the2000 Census into single-race categories in statistical tabu-lations.
There are two possible simple rules for such an objec-tive: the “one-drop rule” and the 50-percent rule. The one-drop rule defines race in reference to the white majority. Itspecifies that anyone with any minority ancestry is consid-ered nonwhite. The 50-percent rule evenly assigns biracialpeople to the two racial groups to which they partiallybelong for statistical purposes. These two rules serve asideal types, as more rules can be devised to allocate multi-racial people based on fourth or eighth fractions accordingto the mixture of their parents’ and grandparents’ races.
In much of the U.S. history and culture, a common rulefor categorizing multiracial blacks has been the one-droprule, although it is unclear how rigidly it has been practiced.For multiracial Asians, who are a relatively recent phenome-non, it appears that the 50-percent rule is a close approxi-mation. Prior research has found children of parents whohad one Asian and one white parent (the majority of multira-cial Asians) were almost equally likely to be identified asAsian or white when forced to choose a single race.
For this report, the 50-percent rule was applied when itwas necessary to reclassify multiracial Asians in the 2000Census into single-race categories. For example, the sizeof the 2000 Asian American population was estimated at11,070,913 (3.93 percent of total) if the racial classificationsystem had not been changed (see Table 1, page 3). Inmost of the analyses reported in the report, rich informationpertaining to multiracials in the 2000 Census was preservedby separating multiethnic and multiracial Asians.
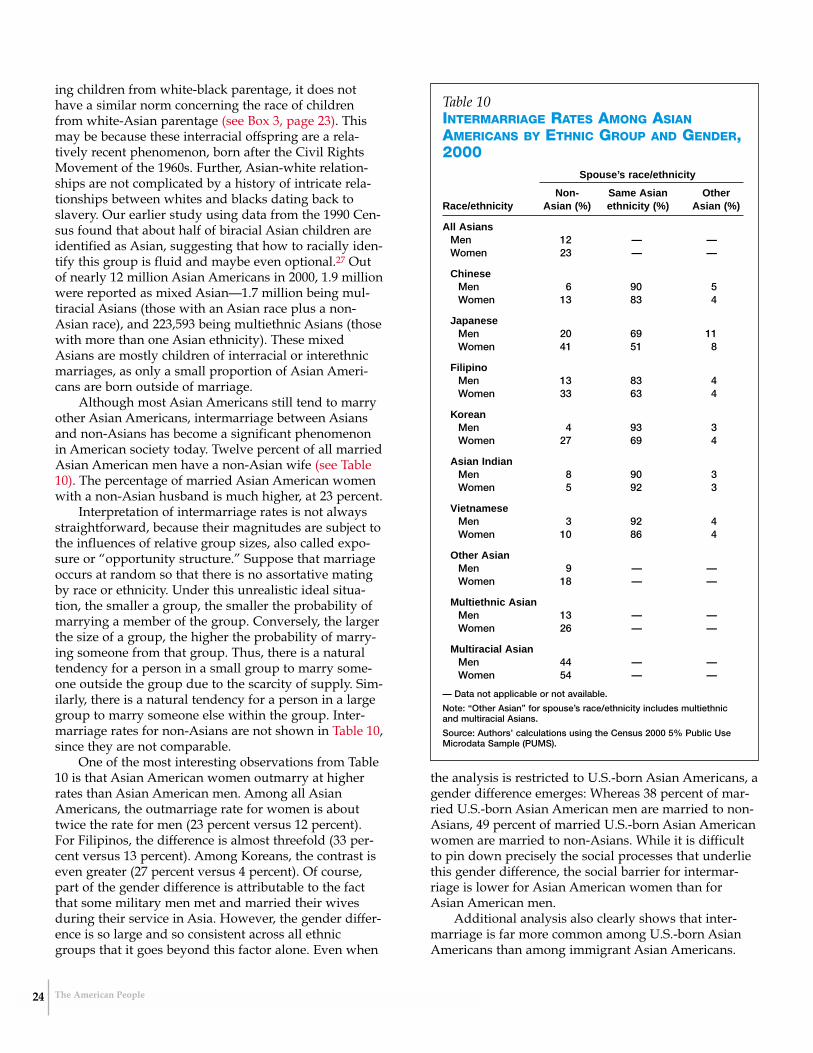
ing children from white-black parentage, it does nothave a similar norm concerning the race of childrenfrom white-Asian parentage (see Box 3, page 23). Thismay be because these interracial offspring are a rela-tively recent phenomenon, born after the Civil RightsMovement of the 1960s. Further, Asian-white relation-ships are not complicated by a history of intricate rela-tionships between whites and blacks dating back toslavery. Our earlier study using data from the 1990 Cen-sus found that about half of biracial Asian children areidentified as Asian, suggesting that how to racially iden-tify this group is fluid and maybe even optional.27 Outof nearly 12 million Asian Americans in 2000, 1.9 millionwere reported as mixed Asian—1.7 million being mul-tiracial Asians (those with an Asian race plus a non-Asian race), and 223,593 being multiethnic Asians (thosewith more than one Asian ethnicity). These mixedAsians are mostly children of interracial or interethnicmarriages, as only a small proportion of Asian Ameri-cans are born outside of marriage.
Although most Asian Americans still tend to marryother Asian Americans, intermarriage between Asiansand non-Asians has become a significant phenomenonin American society today. Twelve percent of all marriedAsian American men have a non-Asian wife (see Table10). The percentage of married Asian American womenwith a non-Asian husband is much higher, at 23 percent.
Interpretation of intermarriage rates is not alwaysstraightforward, because their magnitudes are subject tothe influences of relative group sizes, also called expo-sure or “opportunity structure.” Suppose that marriageoccurs at random so that there is no assortative matingby race or ethnicity. Under this unrealistic ideal situa-tion, the smaller a group, the smaller the probability ofmarrying a member of the group. Conversely, the largerthe size of a group, the higher the probability of marry-ing someone from that group. Thus, there is a naturaltendency for a person in a small group to marry some-one outside the group due to the scarcity of supply. Sim-ilarly, there is a natural tendency for a person in a largegroup to marry someone else within the group. Inter-marriage rates for non-Asians are not shown in Table 10,since they are not comparable.
One of the most interesting observations from Table10 is that Asian American women outmarry at higherrates than Asian American men. Among all AsianAmericans, the outmarriage rate for women is abouttwice the rate for men (23 percent versus 12 percent).For Filipinos, the difference is almost threefold (33 per-cent versus 13 percent). Among Koreans, the contrast iseven greater (27 percent versus 4 percent). Of course,part of the gender difference is attributable to the factthat some military men met and married their wivesduring their service in Asia. However, the gender differ-ence is so large and so consistent across all ethnicgroups that it goes beyond this factor alone. Even when
the analysis is restricted to U.S.-born Asian Americans, agender difference emerges: Whereas 38 percent of mar-ried U.S.-born Asian American men are married to non-Asians, 49 percent of married U.S.-born Asian Americanwomen are married to non-Asians. While it is difficultto pin down precisely the social processes that underliethis gender difference, the social barrier for intermar-riage is lower for Asian American women than forAsian American men.
Additional analysis also clearly shows that inter-marriage is far more common among U.S.-born AsianAmericans than among immigrant Asian Americans.
The American People24
Table 10INTERMARRIAGE RATES AMONG ASIANAMERICANS BY ETHNIC GROUP AND GENDER,2000
Spouse’s race/ethnicity
Non- Same Asian Other Race/ethnicity Asian (%) ethnicity (%) Asian (%)
All AsiansMen 12 — —Women 23 — —
ChineseMen 6 90 5Women 13 83 4
JapaneseMen 20 69 11Women 41 51 8
FilipinoMen 13 83 4Women 33 63 4
KoreanMen 4 93 3Women 27 69 4
Asian IndianMen 8 90 3Women 5 92 3
VietnameseMen 3 92 4Women 10 86 4
Other AsianMen 9 — —Women 18 — —
Multiethnic AsianMen 13 — —Women 26 — —
Multiracial AsianMen 44 — —Women 54 — —
— Data not applicable or not available.
Note: “Other Asian” for spouse’s race/ethnicity includes multiethnicand multiracial Asians.
Source: Authors’ calculations using the Census 2000 5% Public UseMicrodata Sample (PUMS).
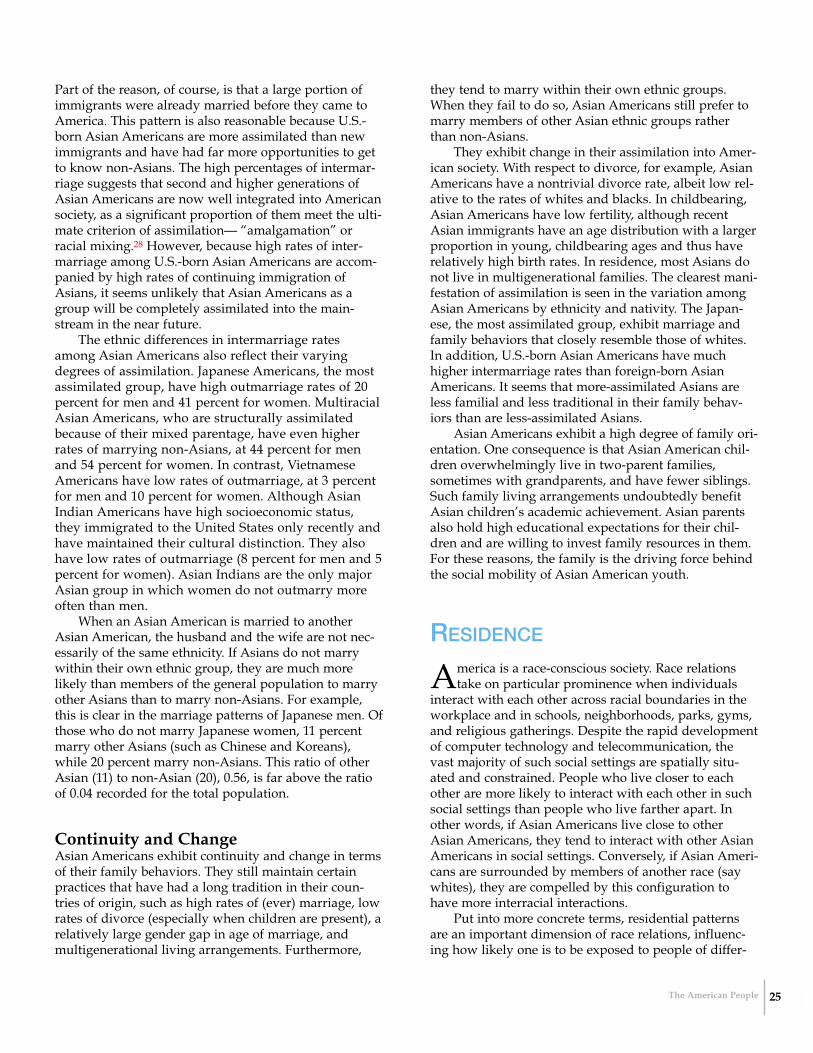
25The American People
Part of the reason, of course, is that a large portion ofimmigrants were already married before they came toAmerica. This pattern is also reasonable because U.S.-born Asian Americans are more assimilated than newimmigrants and have had far more opportunities to getto know non-Asians. The high percentages of intermar-riage suggests that second and higher generations ofAsian Americans are now well integrated into Americansociety, as a significant proportion of them meet the ulti-mate criterion of assimilation— “amalgamation” orracial mixing.28 However, because high rates of inter-marriage among U.S.-born Asian Americans are accom-panied by high rates of continuing immigration ofAsians, it seems unlikely that Asian Americans as agroup will be completely assimilated into the main-stream in the near future.
The ethnic differences in intermarriage ratesamong Asian Americans also reflect their varyingdegrees of assimilation. Japanese Americans, the mostassimilated group, have high outmarriage rates of 20percent for men and 41 percent for women. MultiracialAsian Americans, who are structurally assimilatedbecause of their mixed parentage, have even higherrates of marrying non-Asians, at 44 percent for menand 54 percent for women. In contrast, VietnameseAmericans have low rates of outmarriage, at 3 percentfor men and 10 percent for women. Although AsianIndian Americans have high socioeconomic status,they immigrated to the United States only recently andhave maintained their cultural distinction. They alsohave low rates of outmarriage (8 percent for men and 5percent for women). Asian Indians are the only majorAsian group in which women do not outmarry moreoften than men.
When an Asian American is married to anotherAsian American, the husband and the wife are not nec-essarily of the same ethnicity. If Asians do not marrywithin their own ethnic group, they are much morelikely than members of the general population to marryother Asians than to marry non-Asians. For example,this is clear in the marriage patterns of Japanese men. Ofthose who do not marry Japanese women, 11 percentmarry other Asians (such as Chinese and Koreans),while 20 percent marry non-Asians. This ratio of otherAsian (11) to non-Asian (20), 0.56, is far above the ratioof 0.04 recorded for the total population.
Continuity and ChangeAsian Americans exhibit continuity and change in termsof their family behaviors. They still maintain certainpractices that have had a long tradition in their coun-tries of origin, such as high rates of (ever) marriage, lowrates of divorce (especially when children are present), arelatively large gender gap in age of marriage, andmultigenerational living arrangements. Furthermore,
they tend to marry within their own ethnic groups.When they fail to do so, Asian Americans still prefer tomarry members of other Asian ethnic groups ratherthan non-Asians.
They exhibit change in their assimilation into Amer-ican society. With respect to divorce, for example, AsianAmericans have a nontrivial divorce rate, albeit low rel-ative to the rates of whites and blacks. In childbearing,Asian Americans have low fertility, although recentAsian immigrants have an age distribution with a largerproportion in young, childbearing ages and thus haverelatively high birth rates. In residence, most Asians donot live in multigenerational families. The clearest mani-festation of assimilation is seen in the variation amongAsian Americans by ethnicity and nativity. The Japan-ese, the most assimilated group, exhibit marriage andfamily behaviors that closely resemble those of whites.In addition, U.S.-born Asian Americans have muchhigher intermarriage rates than foreign-born AsianAmericans. It seems that more-assimilated Asians areless familial and less traditional in their family behav-iors than are less-assimilated Asians.
Asian Americans exhibit a high degree of family ori-entation. One consequence is that Asian American chil-dren overwhelmingly live in two-parent families,sometimes with grandparents, and have fewer siblings.Such family living arrangements undoubtedly benefitAsian children’s academic achievement. Asian parentsalso hold high educational expectations for their chil-dren and are willing to invest family resources in them.For these reasons, the family is the driving force behindthe social mobility of Asian American youth.
RESIDENCE
America is a race-conscious society. Race relationstake on particular prominence when individuals
interact with each other across racial boundaries in theworkplace and in schools, neighborhoods, parks, gyms,and religious gatherings. Despite the rapid developmentof computer technology and telecommunication, thevast majority of such social settings are spatially situ-ated and constrained. People who live closer to eachother are more likely to interact with each other in suchsocial settings than people who live farther apart. Inother words, if Asian Americans live close to otherAsian Americans, they tend to interact with other AsianAmericans in social settings. Conversely, if Asian Ameri-cans are surrounded by members of another race (saywhites), they are compelled by this configuration tohave more interracial interactions.
Put into more concrete terms, residential patternsare an important dimension of race relations, influenc-ing how likely one is to be exposed to people of differ-
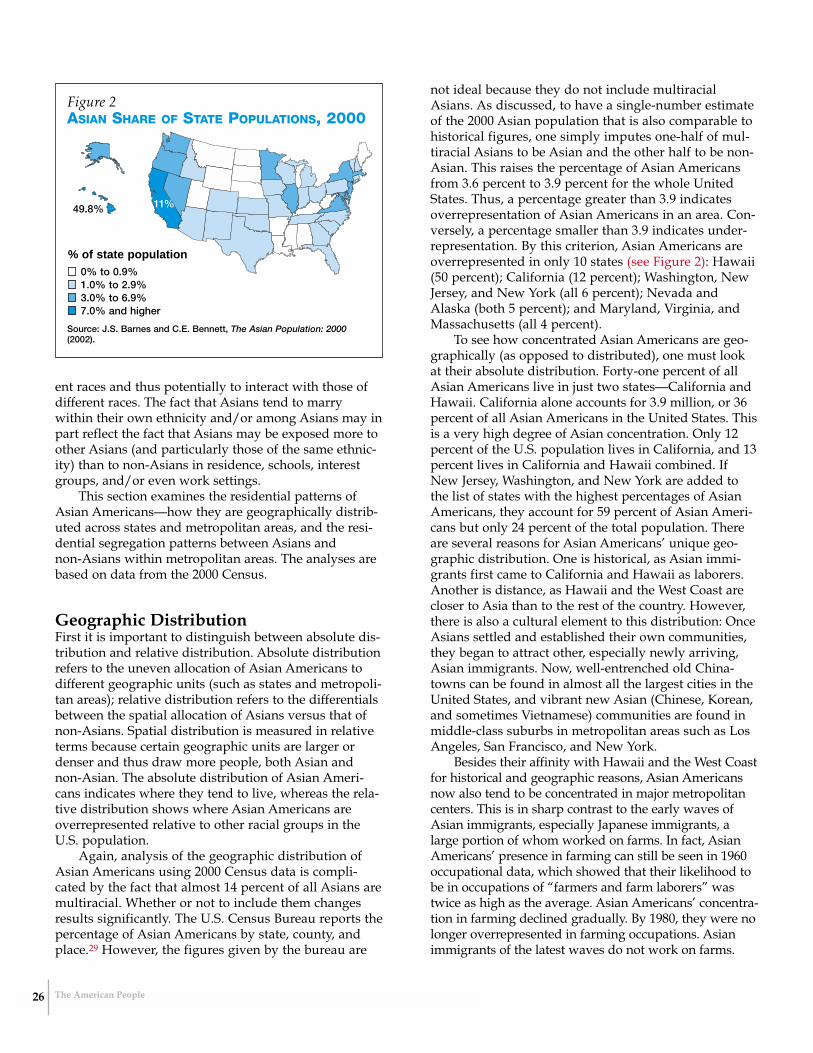
ent races and thus potentially to interact with those ofdifferent races. The fact that Asians tend to marrywithin their own ethnicity and/or among Asians may inpart reflect the fact that Asians may be exposed more toother Asians (and particularly those of the same ethnic-ity) than to non-Asians in residence, schools, interestgroups, and/or even work settings.
This section examines the residential patterns ofAsian Americans—how they are geographically distrib-uted across states and metropolitan areas, and the resi-dential segregation patterns between Asians andnon-Asians within metropolitan areas. The analyses arebased on data from the 2000 Census.
Geographic DistributionFirst it is important to distinguish between absolute dis-tribution and relative distribution. Absolute distributionrefers to the uneven allocation of Asian Americans todifferent geographic units (such as states and metropoli-tan areas); relative distribution refers to the differentialsbetween the spatial allocation of Asians versus that ofnon-Asians. Spatial distribution is measured in relativeterms because certain geographic units are larger ordenser and thus draw more people, both Asian andnon-Asian. The absolute distribution of Asian Ameri-cans indicates where they tend to live, whereas the rela-tive distribution shows where Asian Americans areoverrepresented relative to other racial groups in theU.S. population.
Again, analysis of the geographic distribution ofAsian Americans using 2000 Census data is compli-cated by the fact that almost 14 percent of all Asians aremultiracial. Whether or not to include them changesresults significantly. The U.S. Census Bureau reports thepercentage of Asian Americans by state, county, andplace.29 However, the figures given by the bureau are
not ideal because they do not include multiracialAsians. As discussed, to have a single-number estimateof the 2000 Asian population that is also comparable tohistorical figures, one simply imputes one-half of mul-tiracial Asians to be Asian and the other half to be non-Asian. This raises the percentage of Asian Americansfrom 3.6 percent to 3.9 percent for the whole UnitedStates. Thus, a percentage greater than 3.9 indicatesoverrepresentation of Asian Americans in an area. Con-versely, a percentage smaller than 3.9 indicates under-representation. By this criterion, Asian Americans areoverrepresented in only 10 states (see Figure 2): Hawaii(50 percent); California (12 percent); Washington, NewJersey, and New York (all 6 percent); Nevada andAlaska (both 5 percent); and Maryland, Virginia, andMassachusetts (all 4 percent).
To see how concentrated Asian Americans are geo-graphically (as opposed to distributed), one must lookat their absolute distribution. Forty-one percent of allAsian Americans live in just two states—California andHawaii. California alone accounts for 3.9 million, or 36percent of all Asian Americans in the United States. Thisis a very high degree of Asian concentration. Only 12percent of the U.S. population lives in California, and 13percent lives in California and Hawaii combined. IfNew Jersey, Washington, and New York are added tothe list of states with the highest percentages of AsianAmericans, they account for 59 percent of Asian Ameri-cans but only 24 percent of the total population. Thereare several reasons for Asian Americans’ unique geo-graphic distribution. One is historical, as Asian immi-grants first came to California and Hawaii as laborers.Another is distance, as Hawaii and the West Coast arecloser to Asia than to the rest of the country. However,there is also a cultural element to this distribution: OnceAsians settled and established their own communities,they began to attract other, especially newly arriving,Asian immigrants. Now, well-entrenched old China-towns can be found in almost all the largest cities in theUnited States, and vibrant new Asian (Chinese, Korean,and sometimes Vietnamese) communities are found inmiddle-class suburbs in metropolitan areas such as LosAngeles, San Francisco, and New York.
Besides their affinity with Hawaii and the West Coastfor historical and geographic reasons, Asian Americansnow also tend to be concentrated in major metropolitancenters. This is in sharp contrast to the early waves ofAsian immigrants, especially Japanese immigrants, alarge portion of whom worked on farms. In fact, AsianAmericans’ presence in farming can still be seen in 1960occupational data, which showed that their likelihood tobe in occupations of “farmers and farm laborers” wastwice as high as the average. Asian Americans’ concentra-tion in farming declined gradually. By 1980, they were nolonger overrepresented in farming occupations. Asianimmigrants of the latest waves do not work on farms.
The American People26
Figure 2ASIAN SHARE OF STATE POPULATIONS, 2000
Source: J.S. Barnes and C.E. Bennett, The Asian Population: 2000(2002).
% of state population0% to 0.9%1.0% to 2.9%3.0% to 6.9%7.0% and higher
11%49.8%
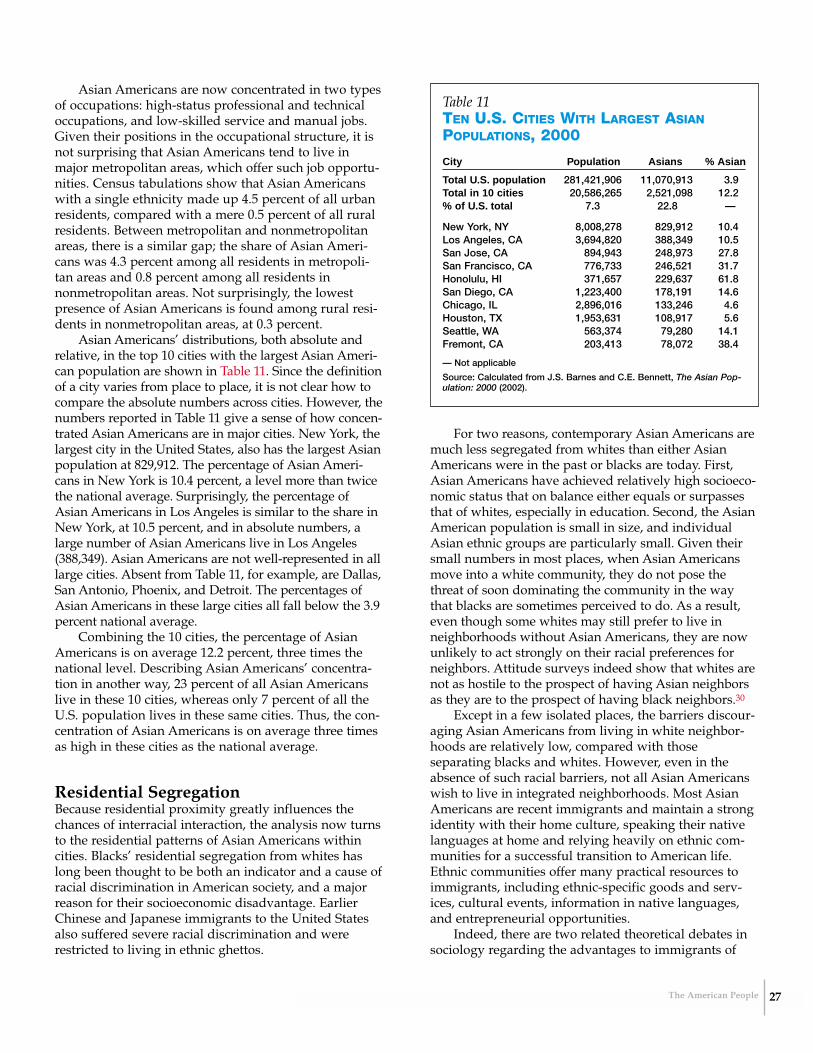
27The American People
Asian Americans are now concentrated in two typesof occupations: high-status professional and technicaloccupations, and low-skilled service and manual jobs.Given their positions in the occupational structure, it isnot surprising that Asian Americans tend to live inmajor metropolitan areas, which offer such job opportu-nities. Census tabulations show that Asian Americanswith a single ethnicity made up 4.5 percent of all urbanresidents, compared with a mere 0.5 percent of all ruralresidents. Between metropolitan and nonmetropolitanareas, there is a similar gap; the share of Asian Ameri-cans was 4.3 percent among all residents in metropoli-tan areas and 0.8 percent among all residents innonmetropolitan areas. Not surprisingly, the lowestpresence of Asian Americans is found among rural resi-dents in nonmetropolitan areas, at 0.3 percent.
Asian Americans’ distributions, both absolute andrelative, in the top 10 cities with the largest Asian Ameri-can population are shown in Table 11. Since the definitionof a city varies from place to place, it is not clear how tocompare the absolute numbers across cities. However, thenumbers reported in Table 11 give a sense of how concen-trated Asian Americans are in major cities. New York, thelargest city in the United States, also has the largest Asianpopulation at 829,912. The percentage of Asian Ameri-cans in New York is 10.4 percent, a level more than twicethe national average. Surprisingly, the percentage ofAsian Americans in Los Angeles is similar to the share inNew York, at 10.5 percent, and in absolute numbers, alarge number of Asian Americans live in Los Angeles(388,349). Asian Americans are not well-represented in alllarge cities. Absent from Table 11, for example, are Dallas,San Antonio, Phoenix, and Detroit. The percentages ofAsian Americans in these large cities all fall below the 3.9percent national average.
Combining the 10 cities, the percentage of AsianAmericans is on average 12.2 percent, three times thenational level. Describing Asian Americans’ concentra-tion in another way, 23 percent of all Asian Americanslive in these 10 cities, whereas only 7 percent of all theU.S. population lives in these same cities. Thus, the con-centration of Asian Americans is on average three timesas high in these cities as the national average.
Residential Segregation Because residential proximity greatly influences thechances of interracial interaction, the analysis now turnsto the residential patterns of Asian Americans withincities. Blacks’ residential segregation from whites haslong been thought to be both an indicator and a cause ofracial discrimination in American society, and a majorreason for their socioeconomic disadvantage. EarlierChinese and Japanese immigrants to the United Statesalso suffered severe racial discrimination and wererestricted to living in ethnic ghettos.
For two reasons, contemporary Asian Americans aremuch less segregated from whites than either AsianAmericans were in the past or blacks are today. First,Asian Americans have achieved relatively high socioeco-nomic status that on balance either equals or surpassesthat of whites, especially in education. Second, the AsianAmerican population is small in size, and individualAsian ethnic groups are particularly small. Given theirsmall numbers in most places, when Asian Americansmove into a white community, they do not pose thethreat of soon dominating the community in the waythat blacks are sometimes perceived to do. As a result,even though some whites may still prefer to live inneighborhoods without Asian Americans, they are nowunlikely to act strongly on their racial preferences forneighbors. Attitude surveys indeed show that whites arenot as hostile to the prospect of having Asian neighborsas they are to the prospect of having black neighbors.30
Except in a few isolated places, the barriers discour-aging Asian Americans from living in white neighbor-hoods are relatively low, compared with thoseseparating blacks and whites. However, even in theabsence of such racial barriers, not all Asian Americanswish to live in integrated neighborhoods. Most AsianAmericans are recent immigrants and maintain a strongidentity with their home culture, speaking their nativelanguages at home and relying heavily on ethnic com-munities for a successful transition to American life.Ethnic communities offer many practical resources toimmigrants, including ethnic-specific goods and serv-ices, cultural events, information in native languages,and entrepreneurial opportunities.
Indeed, there are two related theoretical debates insociology regarding the advantages to immigrants of
Table 11TEN U.S. CITIES WITH LARGEST ASIANPOPULATIONS, 2000
City Population Asians % Asian
Total U.S. population 281,421,906 11,070,913 3.9Total in 10 cities 20,586,265 2,521,098 12.2% of U.S. total 7.3 22.8 —
New York, NY 8,008,278 829,912 10.4Los Angeles, CA 3,694,820 388,349 10.5San Jose, CA 894,943 248,973 27.8San Francisco, CA 776,733 246,521 31.7Honolulu, HI 371,657 229,637 61.8San Diego, CA 1,223,400 178,191 14.6Chicago, IL 2,896,016 133,246 4.6Houston, TX 1,953,631 108,917 5.6Seattle, WA 563,374 79,280 14.1Fremont, CA 203,413 78,072 38.4
— Not applicable
Source: Calculated from J.S. Barnes and C.E. Bennett, The Asian Pop-ulation: 2000 (2002).
living in ethnic communities.31 The first debate is con-cerned with the potential economic benefits of workingin an ethnic niche—an ethnic enclave economy. Somescholars argue that an enclave economy provides a pro-tective work environment to new immigrant workerswhere they can derive economic benefits that would notbe available in the mainstream economy. These benefitscould include pay that reflects their skills, education,and experience; social mobility to supervisory positions;and opportunities to be entrepreneurs. However, otherscholars contend that an enclave economy primarilybenefits business owners of enclave firms rather thantheir co-ethnic workers, for whom working in the main-stream economy would facilitate assimilation and thusupward mobility.
The second debate is around segmented assimila-tion theory, which is concerned with the long-term (par-ticularly educational) benefits for immigrant children ofmaintaining a strong ethnic identity and social networksamong co-ethnics and thus not being fully assimilatedinto the American mainstream. The basis for this argu-ment is that America is now extremely diverse and seg-mented, with an underclass residing in central citieswhere a large portion of new immigrant families firstsettle upon arrival. Thus, it is argued that there existdivergent assimilation paths for new immigrants. Onepath is full and direct assimilation into mainstreamAmerican society; another possible path of full assimila-tion, to which new residents of central cities are espe-cially vulnerable, is downward assimilation into theurban underclass. To avoid this, according to the theory,it is better for immigrants to maintain their own culturewhile acquiring skills for the labor market. This middlepath of assimilation is called “selective acculturation.”
So far, empirical evidence pertaining to the enclaveeconomy debate and the segmented assimilation debateleaves them unresolved. However, even without thehypothesized benefits, many Asians may still wish tolive close together to share a common culture or for theconvenience of seeing relatives and friends. Thus, onewould expect to see clustering patterns of residenceamong Asian Americans.
A commonly used segregation index (the index ofdissimilarity) appears in Table 12. It measures residen-tial segregation between Asian Americans and whitesin the top 10 cities with the largest Asian population.32
As discussed earlier, close to a quarter of all AsianAmericans live in these cities. Measurement of segrega-tion is at the level of census tracts. The index variesbetween a low of 29 percent in Fremont to a high of 50percent in San Diego. A dissimilarity index of 29 per-cent means that either 29 percent of Asian Americans or29 percent of whites in the city would need to move todifferent census tracts for the two groups to reach equaldistributions across all census tracts. The second col-umn presents the dissimilarity index between AsianAmericans and blacks, and the last column gives thedissimilarity index between whites and blacks for com-parison. The segregation between Asian Americans andwhites and the segregation between Asian Americansand blacks are still substantial. In Los Angeles, forexample, the dissimilarity index is 47 percent betweenAsian Americans and whites and 69 percent betweenAsian Americans and blacks, although the indexbetween whites and blacks is even higher, at 73 percent.These numbers mean that residential segregation isvery high between whites and blacks and betweenAsian Americans and blacks in Los Angeles. By com-parison, residential segregation is moderately highbetween whites and Asians.
With the exception of Fremont and San Jose, thelevel of residential segregation between Asian Americansand whites is much lower than that between whites andblacks. Fremont is unusual also for having very low seg-regation levels between any two of the three groups (29percent or lower). For six of the 10 cities—New York, LosAngeles, San Francisco, Honolulu, Chicago, and Hous-ton—the segregation between Asians and whites is muchlower than that between Asians and blacks. However, forthe remaining cities, the segregation between Asians andblacks is either comparable to that between Asians andwhites (San Diego and Fremont) or even smaller (SanJose and Seattle).
The results in Table 12 are crude in the sense thatthey do not present segregation indices separately byAsian ethnicity. This tends to understate levels of segre-gation for Asian Americans, if there is a tendency, as isthe case, for residential clustering within an ethnicity.Japanese and Filipino Americans are less segregated fromwhites than are other Asian American groups (such as
The American People28
Table 12RESIDENTIAL SEGREGATION INDICES IN THE10 U.S. CITIES WITH THE LARGEST ASIANPOPULATIONS, 2000
Asian Asian White City and white and black and black
New York, NY 42 63 63Los Angeles, CA 47 69 73San Jose, CA 48 31 41San Francisco, CA 41 58 59Honolulu, HI 36 58 47San Diego, CA 50 50 62Chicago, IL 48 87 86Houston, TX 45 68 72Seattle, WA 48 34 60Fremont, CA 29 26 24
Note: The segregation index measures the percentage of a racial groupthat would have to move to a different census tract to reach equal dis-tribution across all census tracts.
Source: www.psc.isr.umich.edu/residentialsegregation, accessed June21, 2004.
29The American People
Chinese and Vietnamese).33 Still, one can draw an overallobservation that Asian Americans live in somewhat con-centrated communities that are separate from whites andblacks on the whole. However, Asian Americans’ residen-tial segregation is less pronounced than residential segre-gation for blacks. The difference is also qualitative, in thatat least in contemporary America, Asian Americans donot face the same kind of racial discrimination and preju-dice that blacks do in the housing market. To the extentthat Asian Americans’ residential patterns show signs ofconcentration, they appear to reflect Asians’ own prefer-ences to live near other Asian Americans rather thanexternal constraints limiting their residential choices.
However, culturally based preferences to live withco-ethnics indicate a lack of assimilation into the Ameri-can mainstream and thus should weaken over time asimmigrants become more assimilated. In the literatureon immigrants, residence in desirable neighborhoods(such as those in suburbs with a high average familyincome and a high percentage of non-Hispanic whites)has long been viewed as spatial assimilation or residen-tial assimilation.34 Given the well-known relationshipbetween assimilation and generation, second- and third-generation Asian Americans (such as most JapaneseAmericans) are likely to be less segregated residentiallyfrom whites than first-generation Asian Americans. Oneconsequence of less segregation is a structural increase inAsian Americans’ opportunities for interacting with non-Asians in daily life, thus promoting intermarriage withnon-Asians. This partly explains why the Japanese, whoare the most assimilated group of Asian Americans, alsohave the highest rates of outmarriage. In fact, all U.S.-born Asian Americans have high rates of outmarriage.
Close ProximityFor a variety of reasons, Asian Americans tend to livenear other Asian Americans. This statement is true attwo geographic levels. At the national level, AsianAmericans tend to be concentrated in a few states (suchas California and Hawaii) and a few metropolitan areas(such as New York and Los Angeles). At the city level,Asians tend to be concentrated in certain neighborhoodsor communities, not fully assimilated into white orblack neighborhoods. However, in most cities AsianAmericans are more residentially integrated with whitesthan with blacks, and Asian Americans and whites aremore integrated than are blacks and whites.
While these empirical findings are clear, theoreticalinterpretations of them are less so. Do Asian Americanslive near other Asian Americans due to their desire tomaintain their culture or out of the need to cope with thepotential risks of racial discrimination? That is, are theunique residential patterns of Asian Americans really theresult of their own choices or of a structural constraintimposed on them? These theoretically interesting ques-
tions cannot be answered with census data. But at leastcompared with blacks, Asians’ barriers to living in whiteneighborhoods are relatively low. And indeed, the levelof segregation between Asians and whites is also rela-tively low. If blacks suffer dire socioeconomic conse-quences because of residential segregation from whites,Asians do not face similar disadvantages.
CONCLUSION
Although Asian Americans were first recorded in theU.S. census as early as 1860, their social significance
in American society was not widely recognized until thepost-1965 waves of immigrants fundamentally changedthe demographic composition of the U.S. population.Because post-1965 immigrants are primarily from Asiaand Latin America, traditional race relations in Americaconstructed around whites and blacks have been furthercomplicated by the presence of sizable and rapidlygrowing populations of Asians and Hispanics. ShouldAsian Americans be treated as a single race in the raciallandscape of America? While this question was contem-plated well before 1965, it is becoming more and morepressing due to the rapid growth of the Asian Americanpopulation.
The answer to this question is mixed, depending onone’s definition of race.35 There are four simple basesfor deriving a definition of race: psychological, physio-logical, social, and external. The psychological defini-tion equates race to the self-identification of groupmembership based on one’s ancestral origin. The physi-ological definition equates race to shared physicalappearance. The social definition connects race to acommon set of social consequences (such as confrontingracial discrimination and residential segregation). Theexternal definition links race to a common perception ofa nominal group by people outside the group. AsianAmericans are clearly not a race according to the psy-chological definition, as most of them prefer to be iden-tified as members of their ethnic groups—such asChinese and Koreans—rather than as Asians. Whetherthey are a race according to the physiological and socialdefinitions is unclear. There is large variation in physi-cal appearance, especially between South Asians (suchas Asian Indians) and East Asians (such as Chinese).Further, social outcomes are similar for some Asiansgroups (Chinese and Koreans) but quite different forothers (Japanese versus Vietnamese). It seems to us thatthe most plausible definition for Asian Americans isexternal, as non-Asians may perceive Asian Americansas a homogeneous group and treat them as a race.Indeed, the popular model minority label implicitlytreats Asian Americans as a race, with minority mean-ing a racial minority.
Demographers explore the question of whetherAsian Americans exhibit distinct demographic charac-teristics that differentiate them from whites and otherminority groups. Thus, whether Asian Americansshould be treated as a race is a question that can beaddressed, in part, with demographic data. Based on theresults presented in this report, the answer is a caution-ary yes. It is yes because some distinct demographiccharacteristics among Asian Americans set them apartfrom whites and other minority groups:
� The residential patterns of Asian Americans aredistinct. They live in different parts of the country,concentrated in Hawaii, California, and a few largemetropolitan areas. Within cities, they also tend tobe concentrated in communities that attract otherAsian Americans. � Asian Americans are familial in orientation. Theyhave a high rate of marriage and a low rate ofdivorce, and they maintain traditional practicessuch as living in multigenerational family house-holds. � Asian Americans have high levels of educationalattainment. � Asian Americans have dramatically improvedtheir labor force outcomes, such as earnings andoccupation, since 1960.
However, substantial variations across Asian ethnicgroups and by nativity have been seen in almost all thedemographic dimensions examined in this report. Thesedifferences make the characterization of Asian Ameri-cans with a simple label like model minority problem-atic. For example, the earnings of Filipinos andVietnamese lag behind those of other Asian Americans.The prevalence of multigenerational living arrange-ments also varies greatly by ethnicity, with the Japanesebeing less likely to be in multigenerational families thanwhites. Further, as the education results indicate, ethnicdifferences are more pronounced among foreign-bornAsian Americans than among U.S.-born Asian Ameri-cans.36 Assimilation may exert a homogenizing force,making Asian Americans of different ethnicities appearsimilar. However, it is also plausible that similarities
among Asian Americans of different ethnicities arisebecause of the common difficulties they face. For exam-ple, Asian American families may make exceptionalinvestments in their children’s education as a consciousstrategy to compensate for disadvantages they believethey face as a racial minority group, such as racial dis-crimination and a lack of mainstream social capital.
With further assimilation and continuing success insocioeconomic spheres, Asian Americans may more andmore constitute part of the American mainstream ratherthan a racial minority. The finding that intermarriagerates are high among U.S.-born Asian Americans sup-ports this prediction. However, given the constant flowof new immigrants from Asia, it is a demographicimpossibility that all Asian Americans will be fullyassimilated at any time in the near future. Indeed, alarge portion of Asian Americans are, and for the fore-seeable future will be, new immigrants. Because of this,it is highly likely that Asian Americans will exhibit cer-tain distinct demographic characteristics (such as resi-dential segregation from non-Asians). At least part ofthis is attributable to the fact that many Asians are newimmigrants.
With today’s data, it is difficult to separate raceeffects from immigration effects, because most AsianAmericans are immigrants. With time, however, thereshould be a steady increase in the share of U.S.-bornsecond- and higher-generation Asian Americans. Onepossible scenario in the near future is that racial differ-ences between Asians and whites become blurred, butdifferences between foreign-born Asian Americans andU.S.-born Asian Americans become more pronouncedby comparison. Another possible scenario is that thecontinuous growth of the Asian American populationand its gradual assimilation into the American main-stream will heighten the awareness of their racial dis-tinction among second- and higher-generation AsianAmericans. Whether or not Asian Americans are consid-ered a single race in the future, one thing is certain: Theever-changing Asian American population and thediversity of Asian Americans’ experiences by ethnicityand nativity present constant challenges to the logic ofracial categorizations and to the understanding of racerelations in the United States.
The American People30
31The American People
1. For a discussion of the origins of the term “model minor-ity,” see Sucheng Chan, Asian Americans: An Interpretive His-tory (Boston: Twayne Publishers, 1991). Chan argues thatthis term was used politically to divide Asian Americansfrom other minority groups.
2. Most of the information in this section was drawn fromRonald Takaki, Strangers from a Different Shore: A History ofAsian Americans (Boston: Little, Brown, and Company, 1989).
3. Tomás Almaguer, Racial Fault Lines: The Historical Origins ofWhite Supremacy in California (Berkeley: University of Cali-fornia Press, 1994).
4. Bret Harte, “Plain Language from Truthful James,” TheOverland Monthly Magazine (September 1870), accessedonline at http://etext.lib.virginia.edu/railton/roughin-git/map/chiharte.html, on June 10, 2004.
5. Won Moo Hurh and Kwang Chung Kim, “The ‘Success’Image of Asian Americans: Its Validity, and Its Practical andTheoretical Implications,” Racial and Ethnic Studies 12, no. 4(1989): 512-38; and Grace Kao, “Asian-Americans as ModelMinorities? A Look at Their Academic Performance,” Ameri-can Journal of Education 103, no. 2 (1995): 121-59.
6. Despite this generally positive portrayal of Asian Ameri-cans, discrimination and hatred against Asian Americanshas persisted. In 1982, for example, Vincent Chin, a ChineseAmerican mistaken as Japanese, was beaten to death byunemployed autoworkers near Detroit.
7. See, for example, Charles Hirschman and Morrison G.Wong, “Socioeconomic Gains of Asian Americans, Blacks,and Hispanics: 1960-1976,” American Journal of Sociology 90,no. XX (1984): 584-607; and Yu Xie and Kimberly Goyette,“Social Mobility and the Educational Choices of AsianAmericans,” Social Science Research 32, no. XX (2003): 467-98.
8. See Zhen Zeng and Yu Xie, “Asian Americans’ Earnings Dis-advantage Reexamined: The Role of Place of Education,”American Journal of Sociology 109, no. XX (2004): 1075-1108.
9. Grace Kao, Marta Tienda, and Barbara Schnieder, “Racialand Ethnic Variation in Academic Performance,” in Researchin Sociology of Education and Socialization, Vol. 11, ed. AaronM. Pallas (Greenwich, CT: JAI Press, 1996).
10. See Kimberly Goyette and Yu Xie, “Educational Expecta-tions of Asian American Youths: Determinants and EthnicDifferences,” Sociology of Education 71, no. XX (1999): 24-38;and Simon Cheng and Brian Starks, “Racial Differences inthe Effects of Significant Others on Students’ EducationalExpectations,” Sociology of Education 75, no. 4 (2002): 306-27.
11. Chuansheng Chen and Harold Stevenson, “Motivation andMathematics Achievement: A Comparative Study of Asian-American, Caucasian-American, and East Asian HighSchool Students,” Child Development 66, no. 4 (1995): 1215-34.
12. Kao, Tienda, and Schnieder, “Racial and Ethnic Variation inAcademic Performance.”
13. Much of the material in this section based on NELS wasextracted from Kimberly Goyette, The College Attendance ofAsian Americans (doctoral dissertation, University of Michi-gan, Ann Arbor, 1999).
14. National Center for Education Statistics, “Who Goes toAmerica’s Highly Ranked ‘National’ Universities?” NCES98-095 (Washington, DC: U.S. Department of Education,1998).
15. Jayjia Hsia, Asian Americans in Higher Education and at Work(Hillsdale, NJ: Lawrence Erlbaum Associates, 1988).
16. Min Zhou and Carl L. Bankston III, Growing Up American:How Vietnamese Children Adapt to Life in the United States(New York: Russell Sage Foundation, 1998).
17. Kao, Tienda, and Schneider, “Racial and Ethnic Variation inAcademic Performance”; Sue Stanley and Sumie Okazaki,“Asian-American Educational Achievements: A Phenome-non in Search of an Explanation,” in The Asian AmericanEducational Experience: A Source Report for Teachers and Stu-dents, ed. Don T. Nakanishi and Tina Yamano Nishida(New York: Routledge, 1995); and Xie and Goyette, “SocialMobility and the Educational Choices of Asian Americans.”
18. Zeng and Xie, “Asian Americans’ Earnings DisadvantageReexamined.”
19. Joe R. Feagin and Clairece B. Feagin, Racial and Ethnic Rela-tions (Englewood Cliffs, NJ: Prentice-Hall, 1993).
20. For a fuller account of the argument, see Xie and Goyette,“Social Mobility and the Educational Choices of AsianAmericans.”
21. Joann Faung Jean Lee. Asian American Experiences in theUnited States (Jefferson, NC: McFarland and Company,1991).
22. Takaki, Strangers from a Different Shore: A History of AsianAmericans.
23. Indeed, in preliminary analyses of the 2000 Census data,Emily Greenman has found that Asian American womenare more likely to be in certain professional (and tradition-ally male-dominated) fields than white women, particularlyin science and engineering.
24. In order to compute reliable estimates across Asian ethnici-ties, we used the Census 2000 5% Public Use MicrodataSample (PUMS) for the analysis of Asian Americans. Wethen combined the results with those pertaining to whitesand blacks from the 1% PUMS.
25. Albert Hermalin, ed., The Well-Being of the Elderly in Asia: AFour-Country Comparative Study (Ann Arbor, MI: Universityof Michigan Press, 2002).
26. Amara Bachu and Martin O’Connell, “Fertility of AmericanWomen: June 2000,” Current Population Reports P20-543RV(Washington, D.C.: U.S. Census Bureau, 2001).
27. Yu Xie and Kimberly A. Goyette, “The Racial Identificationof Biracial Children with One Asian Parent: Evidence fromthe 1990 Census.” Social Forces 76, no. XX (1997): 547-70.
28. Robert E. Park, Race and Culture (Glencoe, IL: Free Press,1950).
29. See http://quickfacts.census.gov and www.census.gov/population/www/cen2000/phc-t6.html.
30. Lawrence Bobo and Camille L. Zubrinsky, “Attitudes onResidential Integration: Perceived Status Differences, MereIn-Group Preference, or Racial Prejudice?” Social Forces 74,no. 3 (1996): 883-909.
REFERENCESIf provided by the authors, additional text and data associated with this report are available at www.prb.org/AmericanPeople.
The American People32
31. Alejandro Portes and Robert L. Bach, Latin Journey: Cubanand Mexican Immigrants in the United States (Berkeley: Uni-versity of California Press, 1985); and Alejandro Portes andRubèn G. Rumbaut, Legacies: The Story of the Immigrant Sec-ond Generation (New York: Russell Sage Foundation, 2001).For counterarguments, see Richard Alba and Victor Nee,Remaking the American Mainstream: Assimilation and Contem-porary Immigration. (Cambridge, MA: Harvard UniversityPress, 2003).
32. Population Studies Center, University of Michigan, RacialResidential Segregation Measurement Project, accessedonline at www.psc.isr.umich.edu/residentialsegregation, onJune 10, 2004.
33. This statement is based on unpublished tabulations pro-vided by John Logan, Lewis Mumford Center, State Univer-sity of New York-Albany.
34. Richard D. Alba et al., “Immigrant Groups in the Suburbs:A Reexamination of Suburbanization and Spatial Assimila-tion” American Sociological Review 64, no. XX (1999): 446-60.
35. The authors benefited from informal discussions withDavid Harris on this topic.
36. For similar results on earnings, see Zeng and Xie, “AsianAmericans’ Earnings Disadvantage Reexamined.”
FOR FURTHER READING
Barringer, Herbert R., Robert W. Gardner, and Michael J. Levin. Asians and Pacific Islanders in the United States. New York: Russell SageFoundation, 1993.
Barnes, Jessica S., and Claudette E. Bennett. “The Asian Population: 2000.” Census 2000 Brief C2KBR01-16 (February 2002). Accessedonline at www.census.gov/prod/2002pubs/c2kbr01-16.pdf, on June 11, 2004.
Goyette, Kimberly. The College Attendance of Asian Americans. Doctoral dissertation. University of Michigan, Ann Arbor, 1999.
Hirschman, Charles, and Morrison G. Wong. “Socioeconomic Gains of Asian Americans, Blacks, and Hispanics: 1960-1976.” AmericanJournal of Sociology 90, no. XX (1984): 584-607.
Hsia, Jayjia. Asian Americans in Higher Education and at Work. Hillsdale, NJ: Lawrence Erlbaum Associates, 1988.
Kao, Grace. “Asian-Americans as Model Minorities? A Look at Their Academic Performance.” American Journal of Education 103, no. XX(1995): 121-59.
Kitano, Harry H.L., and Roger Daniels. Asian Americans: Emerging Minorities. Englewood Cliffs, NJ: Prentice-Hall, 1988.
Lee, Joanne Faung Jean. Asian American Experiences in the United States. Jefferson, NC: McFarland and Company, 1991.
Lee, Sharon M. “Asian Americans: Diverse and Growing.” Population Bulletin 53, no. 2 (1998).
Takaki, Ronald. Strangers from a Different Shore: A History of Asian Americans. New York: Penguin Reports, 1989.
Xie, Yu, and Kimberly Goyette. “The Racial Identification of Biracial Children with One Asian Parent: Evidence from the 1990 Census.”Social Forces 76, no. XX (1997): 547-70.
Xie, Yu, and Kimberly Goyette. “Social Mobility and the Educational Choices of Asian Americans.” Social Science Research 32, no. XX(2003): 467-98.
Zhou, Min. “Are Asian Americans Becoming ‘White?’” Contexts 3, no. 1 (2003): 25-27.
Zhou, Min, and James V. Gatewood. “Introduction: Revisiting Contemporary Asian America.” In Contemporary Asian America: A Multi-disciplinary Reader, ed. Min Zhou and James V. Gatewood. New York: New York University Press, 2000.
Zeng, Zhen, and Yu Xie. “Asian Americans’ Earnings Disadvantage Reexamined: The Role of Place of Education.” American Journal ofSociology 109, no. XX (2004): 1057-1108.