Embed Size (px)
Citation preview
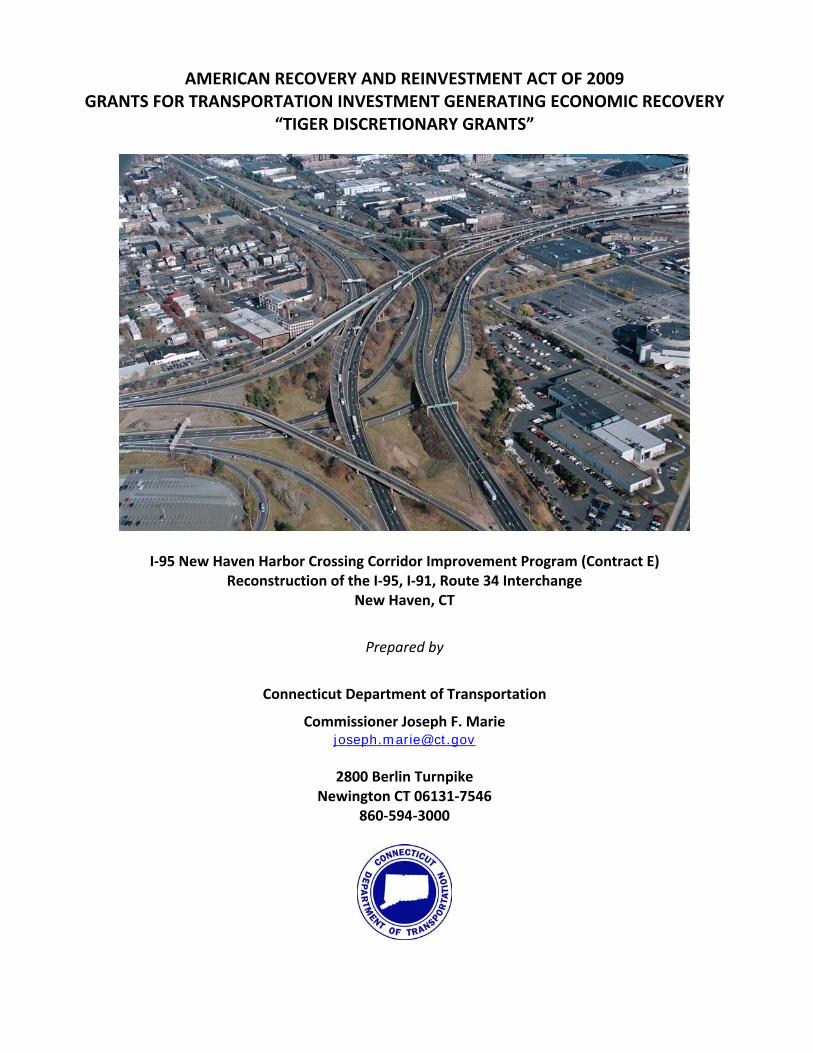
AMERICAN RECOVERY AND REINVESTMENT ACT OF 2009 GRANTS FOR TRANSPORTATION INVESTMENT GENERATING ECONOMIC RECOVERY
“TIGER DISCRETIONARY GRANTS”
I‐95 New Haven Harbor Crossing Corridor Improvement Program (Contract E) Reconstruction of the I‐95, I‐91, Route 34 Interchange
New Haven, CT
Prepared by
Connecticut Department of Transportation
Commissioner Joseph F. Marie [email protected]
2800 Berlin Turnpike
Newington CT 06131‐7546 860‐594‐3000

2
Project Overview
i. Type of project (highway, transit, rail, port or other): Highway
ii. Project location, including state, city, county, and congressional district: New Haven, CT New Haven County 3rd Congressional District
iii. Is project in urban or rural area? The project is located in an urban area.
iv. Amount of TIGER grant funds requested: Grant Amount Funds Requested ‐ $50,000,000. Connecticut Department of Transportation DUNS number ‐ 807854583 Central Contractor Registration Confirmation Number ‐ QZX9NA
v. Grant Application Summary: The Connecticut Department of Transportation (CTDOT) is requesting a TIGER Grant for the construction of the Interstate 95 (I‐95)/Interstate 91 (I‐91)/Route 34 Interchange (Contract E) highway improvement project in New Haven, CT. The total project cost is approximately $684 million. The amount of TIGER grant funding being requested is $50 million, or 7.3% of the total project cost. Contract E is part of the I‐95 New Haven Harbor Crossing Improvement Program, which reconstructs approximately 7.2 miles of I‐95 through Connecticut. The total cost of the corridor is approximately $2.2 billion of which, $550 million has been spent to date and another $712 million is obligated for construction that is ongoing. Contract E is the last portion of the corridor to be constructed and is required for the other portions of the corridor to be opened to traffic and fully utilized. If Contract E does not move forward, approximately $140 million will be required for temporary construction to complete the approach spans to the major river crossing currently under construction in an adjacent project. The amount of TIGER grant funding represents only 2.3% of the entire corridor improvement project. The corridor has a Financial Plan that has been approved by the Federal Highway Administration. The design is more than 98% complete and all state and federal permits and approvals are in place to start construction in March 2011. The proposed project will fundamentally reconfigure the geometry of this system interchange resulting in substantial mobility and safety improvements. Positive effects will extend to travelers along three highway corridors. The existing Interchange is virtual
Objective
This TIGER grant funding request of $50 million is to construct Contract E of the $2.2 billion I‐95 New Haven Harbor Crossing Improvement Program. This is the last segment of the corridor to be constructed and an essential element which must be built before other portions of the corridor can be opened to traffic.
3
gridlock during the AM and PM peak hours. The Interchange was originally designed in the 1950’s for an average daily traffic (ADT) of 40,000 but currently services an ADT of 155,000. The major freeway to freeway connections are one lane ramps that carry over 3,300 vehicles per hour in the peak hour, nearly double the capacity of a single lane ramp. Based on CTDOT statistical data and actual accident rates, the highway sections and interchanges within the project limits have an accident rate of more than double the normal rate for a facility of this type, which is one of the highest rates on the I‐95 corridor within Connecticut. Construction of Contract E is vital to the mobility and economic success of not only Connecticut, but the entire east coast and New England Region. Interstate 95, beginning in Florida and ending in Maine, is the anchor of surface transportation for the east coast of the continental United States. It passes through Connecticut connecting the southern tier population and employment centers to nearly all major north/south arterials. I‐95 is Connecticut’s most heavily traveled roadway with 155,000 vehicles per day in the project area. I‐91, carrying 130,000 vehicles per day, begins at I‐95 in New Haven and extends northerly through Massachusetts and Vermont to the Canadian border. The City of New Haven is one of Connecticut’s major employment centers with a population of 124,000. As the home to Yale University and Yale Medical Center, the city is a leader in the field of education, health care and medical technology and research. These fields have created major opportunities for employment in the region and are expected to continue to grow, thus increasing the demand for improved transportation services. The
City of New Haven has a large number of manufacturing and service businesses and is home to the State’s largest port facility. New Haven serves as a major transportation hub with train (Metro‐North, Shoreline East and Amtrak), bus and air (Tweed‐New Haven Airport) services provided within the limits of the city.
Beginning in 2011, the Contract E project is expected to generate significant economic benefits for the region. An estimated average of 1,221 jobs will be created annually by the project, including an average of 707
direct jobs per year. At the peak of spending, in the third quarter of 2011, approximately 1,685 FTE persons are employed as a result of the project, including 979 direct jobs. In total, the project is projected to create 7,987 person years of employment, including 4,626 direct job person years.
An index to most of the internet links contained in this application can be found at http://www.ct.gov/dot/cwp/view.asp?a=1372&Q=444928&PM=1.
Grant Statistics – At a Glance
Contract E Grant Request: $50 million
Total Construction Cost: $684 million
Average Daily Traffic thru Interchange: 155,000
Estimated Annual Job Creation: 1,221
Peak Annual Direct Job Creation: 707
Total Person Years of Employment: 7,987
Project Benefits: To reconfigure the geometry of the existing interchange to provide substantial mobility and safety improvements on the I‐95 corridor that serves vital inter and intrastate transport and commerce in the Northeast U.S.

4
Table of Contents
1 PROJECT DESCRIPTION 5
2 PROJECT PARTIES 8
3 GRANT FUNDS 8
4 SELECTION CRITERIA 10
4.1 Selection Criteria: Primary 10 4.1.1 Long Term Outcomes 10 4.1.2 Evaluation of Expected Project Costs and Benefits 13 4.1.3 Evaluation of Project Performance 17 4.1.4 Job Creation & Economic Stimulus 17 4.1.5 Project Readiness 21
4.2 Selection Criteria: Secondary 22 4.2.1 Innovation 22 4.2.2 Partnership 22 4.2.3 Program‐Specific Criteria 22
5 FEDERAL WAGE RATE REQUIREMENT 22
6 NEPA REQUIREMENT 23
7 ENVIRONMENTALLY RELATED FEDERAL, STATE, AND LOCAL ACTIONS 23
8 CONFIDENTIAL INFORMATION 23 Contact Information Commissioner Joseph F. Marie 860‐594‐3000 [email protected] State of Connecticut Department of Transportation 2800 Berlin Turnpike Newington, CT 06131‐7546

5
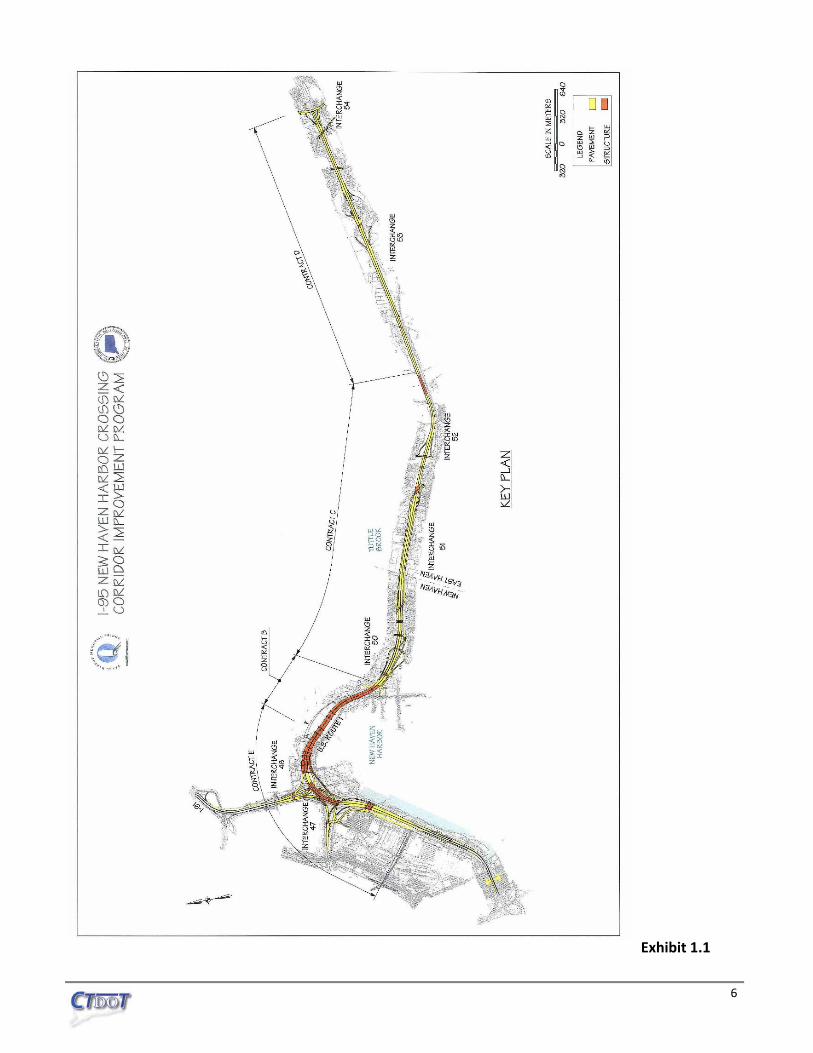
1. Project Description Background Information In 1999, a Record of Decision (ROD) was signed, authorizing the Connecticut Department of Transportation (CTDOT) to proceed with the I‐95 New Haven Harbor Crossing Corridor Improvement Program that includes approximately 7.2 miles of roadway widening and safety improvements along I‐95. The Corridor is divided into Segments referred to as Contracts A – E. Contract A consists of the construction of a new Commuter Train Station as well as upgrades to various commuter train stations along the I‐95 Corridor. Contracts B‐E are highway infrastructure improvement contracts, as shown on the overall plan. Contracts A‐C have been completed and Contract B is currently under construction. The subject project for this TIGER Discretionary Grant application is Contract E, Reconstruction of the Interstate 95, Interstate 91, Route 34 Interchanges (Interchange 47 and 48) in New Haven, CT, referred to herein as the Interchange. A map of the overall corridor is shown below in Exhibit 1.1. Constructed in 1956 and 1957 as part of the original Connecticut Turnpike, Interchange 47 is a full freeway–to‐freeway interchange that provides direct access to State Route 34, a limited access expressway that provides highway access for the New Haven Central Business District. Interchange 48 is also a full freeway‐to‐freeway interchange that provides direct access to Interstate 91. It is located immediately east of Interchange 47 and also provides direct connections between I‐91 and Route 34. The proposed project will fundamentally reconfigure the geometry of this system interchange resulting in substantial mobility and safety improvements. Operational Deficiencies Periods of traffic congestion and delay presently exist. Overall, the cause of traffic congestion is insufficient lane capacity and general design deficiencies. The existing Interchange is virtual gridlock during the AM and PM peak hours. The Interchange was originally designed in the 1950’s for an average daily traffic (ADT) of 40,000 but currently services an ADT of 155,000. Several design features contribute to recurring (daily) multi‐hour periods of AM and PM congestion. In addition to the number of I‐95 travel lanes (two) through the interchange, left‐hand connecting ramps and narrow shoulders are principal causes of poor operations. Left‐hand exits and entrances necessitate the mixing of low and high speed vehicles in the same lane and violate driver expectancy. Additionally, existing (substandard width) shoulders are too narrow to serve as a refuge for disabled vehicles. Both conditions will be remedied by the proposed project.
6
Exhibit 1.1

7
Operational Improvements The proposed project will reduce the duration of recurring forced flow operations. The Interchange project includes reconstruction of approximately 1,600 meters (1 mile) of I‐95 and approximately 1,100 meters (3,500 feet) of I‐91. Three travel lanes with full shoulders on I‐95 will be provided through the Interchange. The additional mainline highway lane in each direction will provide additional capacity and improve mainline operations to acceptable levels (LOS D or better) during peak hours of traffic in the Design Year. Major freeway to freeway ramp connections, currently one lane connections carrying in excess of 3,300 vehicles per hour in the peak hours, will be increased to two lane connections with full shoulders.
Exhibit 1.2: Contract E Project Area
This project eliminates a left‐side entrance ramp from I‐91 Southbound that connects to I‐95 Northbound. This will eliminate the weaving of mainline traffic in this area in order to access the I‐95 northbound exit ramp at Interchange 50, immediately to the east. The two closely spaced I‐95 Southbound exit ramps for Interchanges 48 and 49 (to I‐91 Northbound and Route 34 Westbound) will be consolidated into one multi‐lane right‐side diverge. This will reduce the confusion of signing two closely spaced exit ramps for the traveling public by having one diverge point along the mainline highway for exits in this area. A map of the Contract E project area is shown above in Exhibit 1.2.
8
Safety Accident data compiled by CTDOT was examined to determine the type, frequency and location of accidents in the vicinity of the proposed project. The data compiled includes all accidents resulting in injury, death or property damage to one person exceeding $1000 in value. CTDOT categorizes and analyzes this data utilizing a Rate Number Quality Control Method, which cross‐correlates roadways by type and environment. Average statewide accident data have been computed for each roadway type and environment type. From this data, an average critical accident rate, which is the upper limit of what is considered normal or expected for a facility of this type, is determined and a comparison is made to the actual rate. The highway sections and interchanges within the project limits have an accident rate of 2.12 times the expected rate for a facility of this type, which is one of the highest rates on the I‐95 corridor within Connecticut. As a result of the highway capacity and safety improvements discussed above, the number of anticipated accidents will decrease.
2. Project Parties The project sponsor for Contract E is CTDOT. CTDOT is responsible for the maintenance and reconstruction of all Interstate Highways in Connecticut and as such has the ultimate responsibility for Contract E. The Federal Highway Administration has been an integral partner through the planning and design of the project. In addition, collaboration with various municipalities, state and federal environmental agencies, regional planning organizations and other stakeholders was required to implement the I‐95 New Haven Harbor Crossing Corridor Improvement Program. While these parties will not be responsible for the Project after completion, their input was necessary to bring the Project to its current stage of implementation.
3. Grant Funds The grant request for the Contract E is $50 million. The total project cost is approximately $684 million; therefore TIGER grant funding is approximately 7.3 percent of the total project costs. It is assumed any TIGER grant funding will be used during the first year of construction (Federal fiscal year 2011). Contract E is part of the I‐95 New Haven Harbor Crossing Corridor Improvement Program, which has an approved Financial Plan with the Federal Highway Administration (FHWA) as required for all major projects exceeding $500 million (Section 1904(a) of SAFETEA‐LU). FHWA requires that all costs be covered by Federal or State contributions and the impact of the project on the State’s Transportation Capital Plan be assessed. The Financial Plan shows Federal funding from various sources including State of Connecticut FHWA Apportionments and SAFTEA‐LU Discretionary Grants. The Federal share of the Program is approximately 87 percent of total project costs with the remaining funds being provided by the State of Connecticut. This application is requesting supplemental funding to replace sources already indicated in the financial plan. The magnitude of this project, in conjunction with State Project No. 138‐221, The Reconstruction of I‐95 over the Housatonic River (the Moses Wheeler Bridge), also along the I‐95 corridor, is committing nearly all of the Major FHWA Programs for new construction in the FHWA's Annual Highway/Bridge Capital Budget for the next several years. The State of Connecticut relies almost entirely on the FHWA for its Capital Improvement Program in the Highway/Bridge transportation modes. This seriously impacts the ability of the State of Connecticut to fund much needed projects in

9
other areas of the State. Using the TIGER Grant Funds for this project will allow the State of Connecticut to carry out other needed projects that will also create jobs for economically distressed areas. The following chart demonstrates the State of Connecticut’s current federal funding needs in relation to the amount of federal funding allocated to the state in the next four years. The State has also committed to providing the State match for all federal funding, which varies from 10% to 20% depending on the specific federal program.
Exhibit 3.1: Federal Funding in Relation to CTDOT’s Highway Needs
Exhibit 3.2, provides an overview of Connecticut's transportation funding picture. It indicates that two initiatives (I‐95 NHHCCIP and Moses Wheeler Bridge) will essentially exhaust Connecticut's apportioned Federal funds through Federal fiscal year 2013. TIGER grants applications are being submitted for both I‐95 NHHCCIP (this application) and Moses Wheeler Bridge (separately). Without additional Federal funding, nearly all other transportation needs across the State will be deferred. It is also noted, that while Exhibit 3.2 addresses two major initiatives, all other expenditures fiscal described in this grant application apply exclusively to the I‐95 NHHCCIP.

10
The following table presents construction expenditures and funding sources for Contract E by Federal fiscal year, along with the assumed funding sources for each year.
Exhibit 3.2: Project Expenditures and Funding Sources by Federal Fiscal Year (in millions)
TOTAL FY'11 FY'12 FY'13 FY'14 FY'15 FY'16 FY'17
Project Expenditures $684.21 $79.21 $142.11 $150.22 $108.10 $90.89 $96.61 $17.07
TIGER Discretionary Grant 50.00 50.00 ‐ ‐ ‐ ‐ ‐ ‐ Other Federal Funds 545.26 18.91 123.64 130.69 94.05 79.07 84.05 14.85 Funds 88.95 10.30 18.47 19.53 14.05 11.82 12.56 2.22
Net Required Funding $0.00 $0.00 $0.00 $0.00 $0.00 $0.00 $0.00 $0.00
In order to validate the construction cost estimates, review the design to minimize risks associated with construction and to study cost saving measures, CTDOT sponsored two (2) Value Engineering Studies for the project. Senior staff from CTDOT, FHWA and Parsons Brinckerhoff, the Program Manager for the corridor, conducted a week long study of the project in March 1999 and again in March 2001. Several recommendations were incorporated into the design to reduce construction costs, minimize delays during construction and control risks. In addition project interfaces and construction packaging was reviewed and adjusted to minimize potential claims during construction of adjacent contracts.
4. Selection Criteria
4.1 Selection Criteria: Primary
4.1.1 Long Term Outcomes (i) State of Good Repair Construction of this section of I‐95 began in 1956 and it was designed to standards of that era. Although some sections of the highway have been redesigned and reconstructed to these standards, many key sections remain as originally constructed. The original highway was designed to meet demands of a 20 year forecast, which means that the highway reached its design capacity nearly 30 years ago. There are twenty two (22) existing bridges in the Interchange Project Area that have reached their design life and are in various states of disrepair. With minimal shoulders, any repair work on the bridges results in substantial back ups on I‐95 and extremely long delays. Contract repairs totaling $9.78 million were recently undertaken as a stop gap measure to extend the serviceability of the Q‐Bridge approach structures. The proposed project will reduce the number of bridges within the project limits to sixteen (16), which have been designed for a 75 year service life. ii) Economic Competitiveness This project contributes to the economic competitiveness of the United States as it is part of the I‐95 corridor that connects the U.S. on the east coast from Florida to Maine. The corridor is located in the most densely populated areas of the U.S., with 14 of the 16 states the corridor passes through having

11
population densities greater than the average U.S. population density. The top five most densely populated I‐95 corridor states have densities ranging from nearly seven times to 14 times the U.S. average population density. Connecticut is the fourth most densely populated state of the I‐95 corridor, with approximately nine times the average population density of the United States. This corridor is extremely important for inter and intrastate commerce, as approximately 20% of U.S. road miles and approximately 35% of vehicle miles traveled (VMTs) are located in the eastern United States region of the I‐95 corridor. In addition, there are nearly 50 seaports and over 100 commercial airports within the region. The region also contributes approximately 40% to the total of the U.S. Gross Domestic Product. This corridor is located near many of the nation’s largest seaports (New York, New Haven, and Boston). These ports are essential to the movements of goods within the U.S., contributing to nearly 30% of all U.S. exports and approximately 35% of all U.S. imports. The attractiveness of these ports to shippers is enhanced by their location near a corridor that reaches at least 37 percent of the nation’s population. Additional information regarding the importance of the I‐95 corridor can be found at the I‐95 Coalition’s website at the following internet link: www.i95coalition.org. (iii) Livability Interstate 95 begins in Florida and ends in Maine. It is the anchor of surface transportation for the east coast of the continental United States. It passes through Connecticut in an east–west direction connecting the southern tier population and employment centers to nearly all major north/south arterials. I‐95 is Connecticut’s most heavily traveled roadway, meeting the transportation needs of some of the State’s largest cities. Within Connecticut the highway serves and connects the cities of Stamford, Bridgeport, New Haven and New London, as well as a number of smaller communities around and in between these cities. I‐91 begins at I‐95 in New Haven and extends northerly bisecting the State. It continues north through Massachusetts and Vermont to the Canadian border. The highway connects the City of New Haven with Connecticut’s capitol city, Hartford. It also serves a number of smaller communities along its route and provides connections with Interstate 691 and Interstate 84, as well as a number of principal arterials within the state. The City of New Haven, where the reconfigured interchanges are located, is one of Connecticut’s major employment centers with a population of 124,000. It is part of the South Central Regional Council of Governments (SCRCOG) and is within a Transportation Management Area (TMA). As the home to Yale University and Yale Medical Center, the city is a leader in the field of education, health care and medical technology and research. These fields have created major opportunities for employment in the region and are expected to continue to grow, thus increasing the demand for improved transportation services. The City of New Haven has a large number of manufacturing and service businesses and is home to the State’s largest port facility, which is located off Interchange 49 (reconfigured Interchange 50 will serve this facility once the proposed project is complete). New Haven serves as a major transportation hub with train (Metro‐North, Shoreline East and Amtrak), bus and air (Tweed‐New Haven Airport) services provided within the limits of the city.
12
The proposed project has several aesthetic features incorporated into the design that will provide visual appeal to the area. Architectural guidelines were established to set bridge steel colors, aesthetic treatments to retaining walls, such as decorative panels and/or form liner treatments for concrete structures, battered abutment faces and decorative fencing and railings. The Q Bridge itself will be an extra‐dosed bridge, similar to a cable stayed bridge with shorter towers, and will be the first of its kind in the United States. Decorative lighting will be applied to the bridge as well. (iv) Sustainability CTDOT has made efforts to ensure the design of the Project promotes a more environmentally sustainable transportation system. These efforts are particularly evident in the areas of drainage and stormwater management, which are discussed in detail below. Drainage Due to the construction of major vertical and horizontal roadway alignment improvements and the age and/or inadequacy of the original drainage systems, all systems that originally drained I‐95 and the Interchange within the project limits will be replaced with new systems. With regard to the proposed construction, new drainage systems are proposed that include deep sump catch basins, hydrodynamic separator (HDS) units and three water quality (WQ) Ponds to improve stormwater quality; existing systems will either be eliminated or modified; state systems have been separated from city systems to the greatest extent possible. Stormwater Management To minimize impacts to tidal wetlands, the existing outfalls will be maintained and end pipes of these outlets will not be modified. The treatment of runoff from the project limit area in the proposed condition will be significantly improved over existing conditions by use of the following items that have been incorporated into the proposed drainage design to treat stormwater runoff within the interchange system: • Curbing has been minimized wherever possible to promote overland flow. • Grass‐lined and riprap swales and channels will be used to convey stormwater in lieu of pipes as
much as possible. • HDS units are provided for State of Connecticut (I‐95) systems with 10 or more inlets. • 1200mm sumps (deep sump catch basins) have been provided in areas where discharge to a
HDS unit or WQ Pond is not feasible. • Three WQ ponds are provided within the interchange portion of Contract E. These ponds will
attenuate the increase in peak flows due to the increase in impervious areas. • Stone check dams and stone dikes will be used in swales during construction and will be left in
place until grass is completely established. • DEP Bulletin 34 “2002 Connecticut Guidelines for Soil Erosion and Sediment Control” details
have been incorporated into the plans. • Erosion Control Matting (ECM/TRM) will be used on fill slopes steeper than 3:1 and special
riprap on sloped steeper than 2:1. • The HDS units and the WQ ponds were designed in accordance with the 2004 Connecticut
Stormwater Quality Manual published by the CTDEP.
13
(v) Safety As stated in previous sections, the project area currently experiences more than double accident rate as compared to statewide averages of facilities of the same type and function. Several of the contributing factors associated with high numbers of accidents such as left hand exits, lane reductions, and substandard roadway curvature will be eliminated in the proposed project. Additional through lanes will be added to I‐95 mainline, all exits will be from the right (replacing left‐hand exits) and two lane connections will replace existing one lane freeway to freeway ramps.
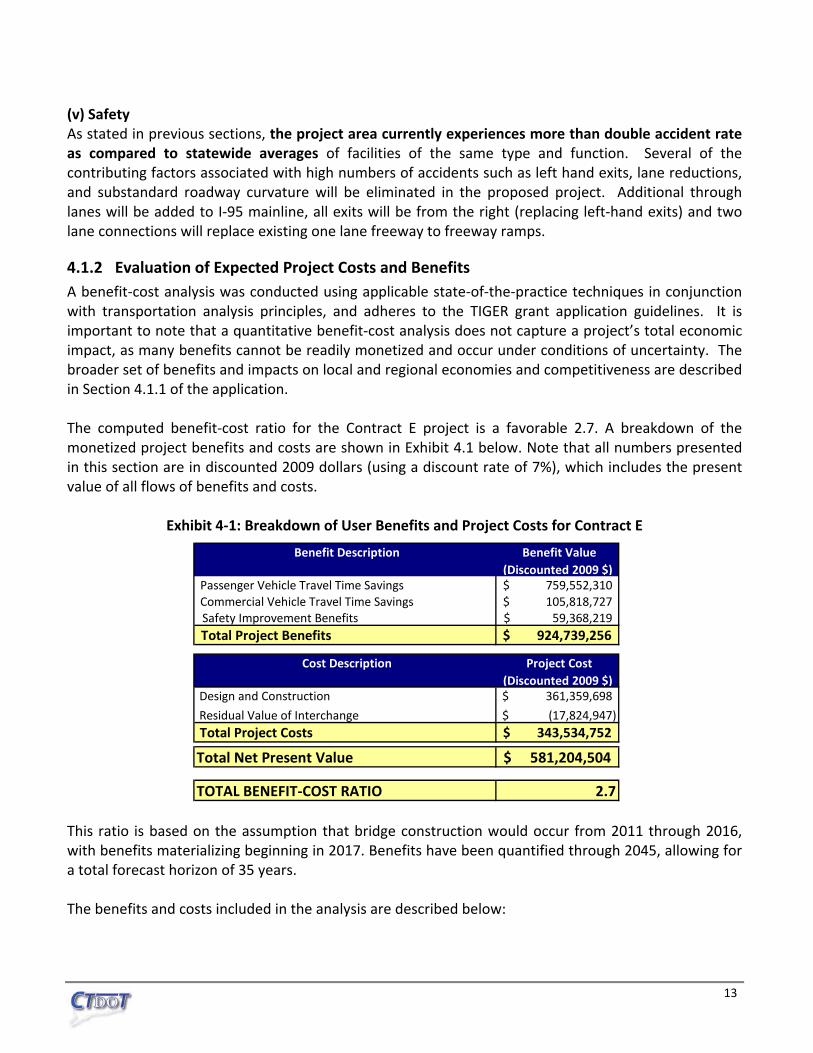
4.1.2 Evaluation of Expected Project Costs and Benefits A benefit‐cost analysis was conducted using applicable state‐of‐the‐practice techniques in conjunction with transportation analysis principles, and adheres to the TIGER grant application guidelines. It is important to note that a quantitative benefit‐cost analysis does not capture a project’s total economic impact, as many benefits cannot be readily monetized and occur under conditions of uncertainty. The broader set of benefits and impacts on local and regional economies and competitiveness are described in Section 4.1.1 of the application. The computed benefit‐cost ratio for the Contract E project is a favorable 2.7. A breakdown of the monetized project benefits and costs are shown in Exhibit 4.1 below. Note that all numbers presented in this section are in discounted 2009 dollars (using a discount rate of 7%), which includes the present value of all flows of benefits and costs.
Exhibit 4‐1: Breakdown of User Benefits and Project Costs for Contract E
Benefit Description Benefit Value(Discounted 2009 $)
Passenger Vehicle Travel Time Savings 759,552,310$ Commercial Vehicle Travel Time Savings 105,818,727$ Safety Improvement Benefits 59,368,219$ Total Project Benefits 924,739,256$
Cost Description Project Cost(Discounted 2009 $)
Design and Construction 361,359,698$
Residual Value of Interchange (17,824,947)$ Total Project Costs 343,534,752$
Total Net Present Value 581,204,504$
TOTAL BENEFIT‐COST RATIO 2.7 This ratio is based on the assumption that bridge construction would occur from 2011 through 2016, with benefits materializing beginning in 2017. Benefits have been quantified through 2045, allowing for a total forecast horizon of 35 years. The benefits and costs included in the analysis are described below:

14
Design & Construction Costs The Contract E capital construction cost in real 2009 dollars is estimated to be $624 million. However, if Contract E was not implemented, the no‐build scenario would still require $140 million in real 2009 expenditures to link the new Q‐Bridge (also constructed as part of the Corridor Improvement Program) to the existing interchange. Thus, the real capital cost of the Project relative to the no‐build scenario used for the benefit‐cost analysis was $484 million, or $361 million in discounted 2009 dollars. Residual Value – Negative Cost The average useful life of the new highways and bridges in the interchange is estimated to be 50 years. At the end of the forecast horizon in 2045, the interchange facilities will have approximately 21 years remaining before major rehabilitation and replacement would be necessary. Therefore, the interchange facilities will carry a residual value past the forecast horizon that has been estimated as a negative cost for this analysis. The residual value has been estimated at $18 million in discounted dollars. Underlying this estimate is the assumption that the interchange facilities will depreciate on a straight‐line basis, with the residual value of the interchange equal to the real value of its construction cost multiplied by the share of its useful life remaining at the end of the forecast period. Passenger and Commercial Vehicle Travel Time Benefits The major benefit of the Contract E project to users of the existing transportation network will be a reduction in congestion‐related vehicle delays and more reliable travel times on I‐95, I‐91 and US‐34. The increase in capacity through the interchange is expected to primarily benefit passenger travel, since passenger vehicles comprise roughly 90 percent of all interchange traffic. Moreover, because the interchange delays occur most severely during peak periods, the highest percentage of benefits will most likely accrue to passengers traveling to and from work. Travel time benefits were quantified by analyzing results from the MPO travel demand model, which generated forecasts of traffic volumes and travel speeds at various points through the interchange in 2015 build and no‐build scenarios. An annual forecast of peak morning and evening traffic volumes and speeds was derived from the MPO model, which was used to compute annual reductions in travel times during both peak periods for passenger and commercial trips. Daily backups on I‐95, I‐91 and US‐34 entering the interchange averaged 2 miles during the morning rush hour, and 1 mile during the evening rush hour. Observations and modeling showed such backups to last two hours during each rush hour. In a no‐build scenario, travel speeds will fall to 10 miles per hour for the span of the interchange and traffic backup, while traffic speeds in the build scenario taken from the MPO travel demand model estimates averaged approximately 50 miles per hour. Using these assumptions, average travel times through the interchange and backup during morning and evening rush hours was estimated to fall from 18 minutes to 3.3 minutes in the 2 morning peak hours, and from 12 minutes to 2.1 minutes in the 2 evening peak hours. Applying peak period traffic volumes estimates from the travel demand model, along with the historical average of 1.424 passengers per

15
vehicle1, it was calculated that roughly 15,000 hours of travel time would be saved per day for all passengers due to the reduction in peak delays. Travel time reductions for passenger trips were valued at 50 percent of total average 2009 hourly wage in Connecticut, which is estimated by the Bureau of Labor Statistics (BLS) to be $28.20. Commercial travel time benefits will be valued at $32.22, the 2009 average hourly compensation of freight truck drivers in Connecticut (from the BLS)2. Using these values of time estimates, the annual travel time savings due to a reduction in peak period delays was valued at $760 million in discounted 2009 dollars for passenger vehicles, and $106 million in discounted dollars for commercial vehicles. Safety Improvement Benefits The Contract E project is also expected to reduce the number of vehicle accidents, injuries and property damage. By eliminating left hand entrance and exit ramps between the three highway facilities and reducing congestion, vehicle accidents due to rear‐end collisions or sideswipes are expected to decrease. Fewer accidents translate into less vehicle property damage and passenger injuries relative to a no‐build scenario, which carry positive user benefits. Analyzing interchange accident data from 2005 to 2007, an average ratio of accidents per million vehicle miles (mvm) of 2.75 was computed, which includes accidents on US‐34, I‐91, and I‐95 through the interchange. This metric was assumed to fall to the statewide average accidents/mvm ratio of 1.62, measured over the same period, once Contract E is complete. Applying the forecasted traffic volumes from the travel demand model, annual accidents were estimated to fall from 361 to 213 in 2017, the first year of full operation, and by the same ratio throughout the rest of the forecast horizon. USDOT guidelines state that accident benefits should be valued according to the severity of the injuries and damages incurred by each accident. Injuries and damages data from 2005 to 2007 in the interchange were used to compute historical shares of accidents falling into the following categories: fatal accidents (0.2%), category A injuries (0.3%), category B injuries (5.1%), category C injuries (19.8%), and property damage only (74.6%). The latest values of injuries and statistical lives from USDOT and FHWA3 were applied to the breakdown of accidents into these categories to obtain the total benefit of accident reductions, valued at $59 million in discounted 2009 dollars. Other Evaluated Benefits Other potential benefits were evaluated for the benefit‐cost analysis, but were ultimately excluded from the BCA calculation because their expected benefits were negligible or difficult to measure. Each of these potential benefits is briefly discussed below. Reduced Operations & Maintenance Costs The Reconstruction of the interchange is expected to decrease annual Operations & Maintenance (O & M) costs, since the current facility is near the end of its useful life. However, due to a lack of available current and projected O & M cost information for both the build and no‐build scenarios, this benefit was not able to be quantified. 1 Source: Connecticut Department of Transportation. 2 Hourly compensation is defined in this case as hourly wages plus fringe benefits. Hourly wage for truck drivers in Connecticut is valued at $24.23. A fringe benefit factor of 1.33 was used to arrive at an hourly compensation estimate of $32.22. 3 Source: http://ostpxweb.dot.gov/policy/reports/VSL%20Guidance%20031809%20a.pdf; http://www.fhwa.dot.gov/legsregs/directives/techadvs/t75702.htm

16
Noise Benefits The Project also includes the construction of new retaining walls and noise barriers throughout the interchange, and existing barriers will be reconstructed to provide additional protection for residences located adjacent to the interchange. Noise‐related user benefits are usually computed through increases in property value due to reductions in noise decibel levels4. Because there are few residential properties located near the interchange, and such properties already benefit from noise barriers, the monetized marginal benefits of the reconstructed barriers with regard to property values is expected to be negligible. Air Quality Benefits The results of mesoscale and microscale analyses indicate that there will be no notable air quality impacts. Since both analyses demonstrate that regional emissions are below NAAQS, those budgeted in the State Implementation Plan, as well as though predicted for the no‐build alternative, there is no mitigation warranted. Fuel Consumption Benefits Similar to air quality benefits, there is not expected to be any net reduction in fuel consumption for vehicles using the interchange. While improved congestion will reduce fuel consumption per vehicle following project completion, the additional vehicle traffic expected on the network is expected to offset such per‐vehicle fuel savings. Multimodal Transportation There are several transit related aspects of the corridor designed to reduce the number vehicles on the highway. These include:
• upgrades to five existing commuter rail facilities, including ADA compliance • construction of a new commuter rail station within walking distance of downtown New Haven • enhanced regional bus service • free carpool/vanpool matching • incentives to businesses to promote telecommuting • guaranteed ride services for employees who use commuter train services
The corridor also has a Transportation Management Plan intended to provide real time traffic updates and diversion routes to motorists through Incident Management Systems to reduce backups and subsequently fuel consumption.
4Source: “Trends and Forecasts of Highway Costs”, FHWA, 1997. http://www.fhwa.dot.gov/policy/hcas/final/three.htm

17
4.1.3 Evaluation of Project Performance CTDOT has initiated a Performance Measures Program. Performance measurement is the use of statistical evidence to determine progress toward specific organizational objectives. These objectives include safety and security, preservation, efficiency and effectiveness, quality of life, and accountability and transparency. The measurements include evidence of actual facts, such as measurement of external factors (e.g., pavement smoothness and customer satisfaction), as well as internal measurements of product delivery. Each quarter a Performance Measures Quarterly Update is produced by CTDOT to evaluate project performance. A link to the most recent Performance Measures Quarterly Update can be found at the following internet link: http://www.ct.gov/dot/lib/dot/documents/dcommunications/misc/Performance_Measures__Q1_2009_Combined_rev82109_DAL_.pdf These types of measures have also been implemented for the I‐95 New Haven Harbor Crossing Corridor Improvement Program. A link to the Program’s most recent Performance Measures report can be found at the following internet link: http://www.ct.gov/dot/lib/dot/documents/dcommunications/majorprojectupdates/qbridgeprojectupdateJune2009x.pdf. As the project progresses and Contract E is under construction, updates to the reports will monitor current and future performance within the corridor and will be modified to include economic recovery updates and statistics.
4.1.4 Job Creation & Economic Stimulus (i) Job Creation The Contract E project is expected to create significant near‐term economic benefits for the New Haven County area, the State of Connecticut, in addition to other regions of the United States. Connecticut’s economic benefits from the project would be driven by an increase in construction spending in the region. These project expenditures would generate a short term increase in demand for engineering and technical services, as well as constriction‐related labor and materials.
To quantify the near‐term economic benefits of this project an analysis was conducted utilizing Bureau of Economic Analysis (BEA) Regional Input‐Output Modeling System (RIMS II) multipliers. RIMS II multipliers classify each capital cost category according to industrial sectors using North American Industry Classification System (NAICS) codes and can vary widely depending on the geographic region being analyzed. This particular analysis utilizes RIMS II data for the State of Connecticut and New Haven County8. The multipliers were used to determine the quantity and industry composition of benefits generated by the project resulting in estimations of short‐term job creation, earnings, and economic output as a result of the project. The multipliers estimate two types of impacts:
• Direct Impacts: Direct impacts represent new spending, hiring, and production by civil engineering construction companies to accommodate the demand for resources in order to complete the project.
8 RIMS II industry codes 7 (Construction), 16 and 47 (Professional, Scientific, and Technical Services) were utilized in this analysis.

18
• Indirect/Induced Impacts: Indirect impacts result from the quantity of inter‐industry purchases necessary to support the increase in production from the construction industry experiencing new demand for its goods and services. All industries that produce goods and services consumed by the construction industry will also increase production and, if necessary, hire new workers to meet the additional demand. The level of inter‐industry trade within the area will determine the size of the indirect impact. Induced impacts stem from the re‐spending of wages earned by workers benefiting from the direct and indirect activity within area. For example, if an increase in demand leads to new employment and earnings in a set of industries, workers in these industries will spend some proportion of their increased earnings at local retail shops, restaurants, and other places of commerce, further stimulating economic activity.
In addition to measuring the effects of the project on the New Haven County economy, the economic impacts that will accrue to the rest of the state due to the project were also quantified. These impacts, referred to as “spillover” benefits, reflect the inter‐county trade that occurs to supply industries in New Haven County with the goods and services it needs to increase production. The results of the short term economic impacts are shown below in Exhibit 4.1.4a:
Exhibit 4.1.4a: Summary of Near‐Term Economic Impacts Resulting from the Project.
Direct Impacts Employment (Average Annual FTE Employment) 707 Earnings (2009 $) $227,547,000 Output (2009 $) $438,057,000 Indirect/Induced Impacts Employment (Average Annual FTE Employment) 514 Earnings (2009 $) $131,852,000 Output (2009 $) $694,322,000 Total Impacts Employment (Average Annual FTE Employment) 1,221 Earnings (2009 $) $359,399,000 Output (2009 $) $1,132,380,000
Beginning in 2011, the Contract E project is expected to generate significant economic benefits for the region. An estimated average of 1,221 jobs will be created annually by the project, including an average of 707 direct jobs per year. Exhibit 4.1.4b shows the profile of average annual full‐time equivalent (FTE) employment generated by the project’s expenditures. At the peak of spending, in the third quarter of 2011, approximately 1,685 FTE persons are employed as a result of the project, including 979 direct jobs.

19
Exhibit 4.1.4b: Average Annual Employment per Year During Construction
1,313
1,676 1,671
940 900 826
-
500
1,000
1,500
2,000
2011 2012 2013 2014 2015 2016
Ave
rage
Ann
ual F
TEEm
ploy
men
t
Direct Jobs Indirect/Induced Jobs
In total, the project is projected to create 7,987 person years of employment, including 4,626 direct job person years. Exhibit 4.1.4c, below, shows the number of persons directly employed on the project per quarter.
Exhibit 4.1.4c: Direct (On‐Project) Jobs by Quarter
Q1 Q2 Q3 Q4 Q1 Q2 Q3 Q4182 852 979 979 969 969 979 979
Q1 Q2 Q3 Q4 Q1 Q2 Q3 Q4958 969 979 979 609 522 527 527
Q1 Q2 Q3 Q4 Q1 Q2 Q3 Q4516 522 527 527 522 522 527 350
2015 2016
2011 2012
2013 2014
Exhibit 4.1.4d shows the breakdown of jobs created by industry and type of impact. As expected, the civil engineering construction industry is estimated to receive the largest increase in jobs from the project (3,827 person years), almost all of which are direct jobs created. The industries that will see the largest number of indirect jobs created include retail trade (735 person years), health care (457 person years), professional services (416 person years), manufacturing (300 person years), administration and waste management (222 person years), food services (214 person years), finance and insurance (197 person years) and other services (195 person years).
Exhibit 4.1.4d: Breakdown of Job Creation by Industry and Type of Impact
3,827
735457 416 300 222 214 197 195 159 131 115 104 74 63 37 31 29 12 5
- 500
1,0001,5002,0002,5003,0003,5004,0004,500
Cons
truct
ion
Reta
il Tra
deHe
alth
car
ePr
ofes
siona
l Ser
vices
Man
ufac
turin
g
Adm
in. &
Was
te M
gmt.
Food
Ser
vices
Fina
nce
& In
sura
nce
Oth
er S
ervi
ces
Who
lesa
le T
rade
Real
Est
ate
Educ
atio
nTr
ans.
& W
areh
ousin
gAr
ts &
Ent
erta
inm
ent
Info
rmat
ion
Mgm
t. of
Com
pani
esHo
useh
olds
Agric
ultu
re
Utilit
ies
Min
ing
Job
s Cr
eate
d (
Per
son
Ye
ars
)
Spillover Jobs
Indirect/Induced Jobs
Direct Jobs
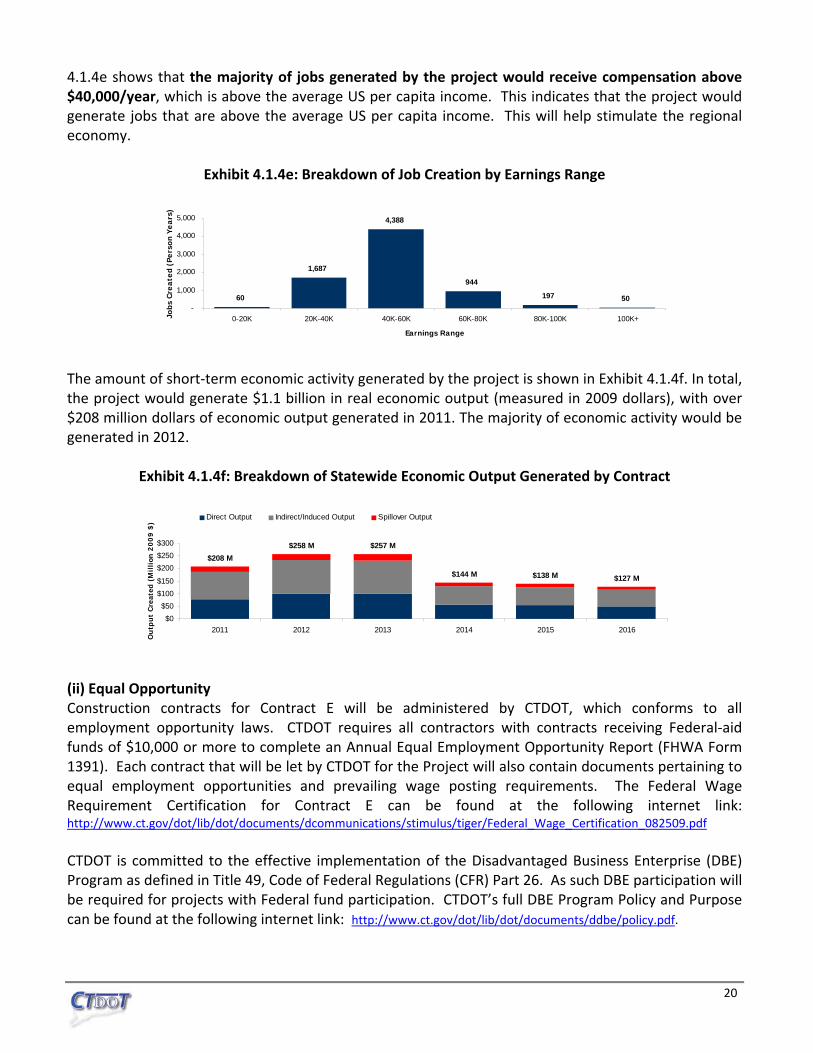
It is also important to consider the quality of the jobs that would be created by the project, which can be most easily measured by the number of jobs created at various levels of compensation. Exhibit
20
4.1.4e shows that the majority of jobs generated by the project would receive compensation above $40,000/year, which is above the average US per capita income. This indicates that the project would generate jobs that are above the average US per capita income. This will help stimulate the regional economy.
Exhibit 4.1.4e: Breakdown of Job Creation by Earnings Range
60
1,687
4,388
944
197 50-
1,000
2,000
3,000
4,000
5,000
0-20K 20K-40K 40K-60K 60K-80K 80K-100K 100K+
Earnings Range
Job
s C
rea
ted
(Pe
rso
n Y
ea
rs)
The amount of short‐term economic activity generated by the project is shown in Exhibit 4.1.4f. In total, the project would generate $1.1 billion in real economic output (measured in 2009 dollars), with over $208 million dollars of economic output generated in 2011. The majority of economic activity would be generated in 2012.
Exhibit 4.1.4f: Breakdown of Statewide Economic Output Generated by Contract
$208 M$258 M $257 M
$144 M $138 M $127 M
$0$50
$100$150
$200$250$300
2011 2012 2013 2014 2015 2016
Ou
tpu
t C
reat
ed (
Mil
lion
20
09
$)
Direct Output Indirect/Induced Output Spillover Output
(ii) Equal Opportunity Construction contracts for Contract E will be administered by CTDOT, which conforms to all employment opportunity laws. CTDOT requires all contractors with contracts receiving Federal‐aid funds of $10,000 or more to complete an Annual Equal Employment Opportunity Report (FHWA Form 1391). Each contract that will be let by CTDOT for the Project will also contain documents pertaining to equal employment opportunities and prevailing wage posting requirements. The Federal Wage Requirement Certification for Contract E can be found at the following internet link: http://www.ct.gov/dot/lib/dot/documents/dcommunications/stimulus/tiger/Federal_Wage_Certification_082509.pdf CTDOT is committed to the effective implementation of the Disadvantaged Business Enterprise (DBE) Program as defined in Title 49, Code of Federal Regulations (CFR) Part 26. As such DBE participation will be required for projects with Federal fund participation. CTDOT’s full DBE Program Policy and Purpose can be found at the following internet link: http://www.ct.gov/dot/lib/dot/documents/ddbe/policy.pdf.

21
4.1.5 Project Readiness (i) Project Schedule The project is currently at the 90 percent design stage with final plans expected to be complete in October 2009. Construction is expected to begin in March 2011 with the entire project to be complete in November 2016. Exhibit 3 presents the number of direct jobs projected to be created by quarter for Contract E Facility. As shown in Exhibit 3, the project is projected to create a total of 979 direct job person years. (ii) Environmental Approvals A Record of Decision (ROD) for the Federal Environmental Impact Statement (FEIS) for the entire I‐95 New Haven Harbor Crossing Corridor Improvement Program was received by CTDOT and issued in 1999. The entire ROD can be accessed via the following internet link http://www.ct.gov/dot/LIB/dot/Documents/dpolicy/qbridge/qrod.pdf with a summary located at this internet link: http://i95newhaven.com/pdfs/rod_1208.pdf (iii) Legislative Approvals The Project has received all required State of Connecticut approvals. Documents pertaining to these approvals can be found at the following internet link http://www.ct.gov/dot/cwp/view.asp?a=1372&Q=444928&PM=1 (iv) State and Local Planning The Project is included in the “Long‐Range Transportation Plan for the State of Connecticut, 2009‐2035”, which was completed in June 2009. The complete plan can be found at the following internet link: http://www.ct.gov/dot/lib/dot/documents/dpolicy/lrp/2009lrp/lrp2009_final_document_june_2009.pdf The project is also included in the 2007 Statewide Transportation Improvement Program (STIP) as of March 13, 2009. The STIP can be found at the following internet link http://www.ct.gov/dot/lib/dot/documents/dpolicy/stip/2007stipprojects.pdf (v) Technical Feasibility As previously mentioned, the Interchange is currently at the 90 percent design stage with final design expected to be complete in October 2009. Thus far, through the planning, environmental approval and design phases of the project nothing has indicated the project to be technically infeasible. The Federal Highway Administration has been involved in the project since its inception and has provided design input at all milestone submissions. In addition, two separate Value Engineering sessions were conducted that also focused on any potential design or construction issues that could impact the project. (vi) Financial Feasibility The Project is financially feasible as it is projected to be funded entirely with both State and Federal funds. A 10 percent contingency is included in the project cost estimate. CTDOT is a regular recipient of Federal grants in aid for transportation projects and has repeatedly demonstrated its ability to manage the receipt of Federal grants and comply with all Federal grant requirements. The 2008 Financial Plan Update for the entire I‐95 New Haven Harbor Crossing Improvement Program can be found at the following internet link: http://www.ct.gov/dot/cwp/view.asp?a=1372&Q=444928&PM=1.
22
4.2 Selection Criteria: Secondary
4.2.1 Innovation CTDOT maintains an Incident Management System for surveillance of traffic conditions from Closed Circuit Television (CCTV) camera stations spaced approximately every ½ to ¾ mile along a 56‐mile segment of I‐95 from Greenwich to Branford. Each camera station also has two (2) traffic flow monitors to collect vehicular speed and count data. Video from each camera and data from each detector is transmitted over fiber optic cable to display monitors at the Bridgeport Traffic Operations Center (BTOC) located in the State Police Barracks G. The camera video and detector data is used to detect traffic incidents and traffic tie‐ups as they occur. Personnel at the BTOC then can dispatch traffic information and alternate route information to the traveling public by the way of display messages on Variable Message Signs or a broadcast over short‐range, dedicated radio frequencies (Highway Advisory Radio). There will be five new camera stations, traffic flow monitors and variable message signs installed within the project limits that will be connected to the existing system and back to the BTOC.
4.2.2 Partnership In October 1989, a study was initiated to evaluate I‐95 between New Haven and Branford. A Draft Environmental Impact Statement (DEIS), released in January 1992, outlined and evaluated several improvement alternatives. When citizens, businesses, commuters and public officials were presented with the set of alternatives, many voiced dissatisfaction with the selections. CTDOT then initiated the Intermodal Concept Development Committee (ICDC), whose members represented 26 diverse community, environmental and business groups with interests in the socio‐economic viability of the region. The ICDC developed alternatives that would address transportation issues while minimizing the impact of construction on the environment or property within the corridor. The ICDC evaluated over one hundred alternates for the Corridor, and reached consensus on seven of those options, which were analyzed in detail as part of the April, 1997 Supplemental DEIS (SDEIS). The Final Environmental Impact Statement (FEIS) was released in March, 1999 and was followed in August 1999 by the FHWA Record of Decision (ROD), which detailed the recommended alternative. An inventory of the over‐500 comment letters and the Public Hearing Transcript are included in CTDOT's report: New Haven Harbor Crossing SDEIS Evaluation, Comments (April, 1997). Since that time, CTDOT and the Federal Highway Administration (FHWA) have worked closely with the South Central Regional Council of Governments (COG) and other federal and local agencies to develop an acceptable strategy to address transit and transportation needs in the corridor.
4.2.3 Program‐Specific Criteria There are no Program Specific Criteria required for surface transportation projects. Therefore, no discussion of Program Specific Criteria is included in this application.
5. Federal Wage Rate Requirement CTDOT has signed federal a wage rate certification stating that it will comply with Subchapter IV of Chapter 31 of Title 40 of the United States Code. This certification can be found at the following internet link: http://www.ct.gov/dot/lib/dot/documents/dcommunications/stimulus/tiger/Federal_Wage_Certification_082509.pdf

23
6. NEPA Requirement In accordance with the Connecticut Environmental Policy Act (CEPA) and the National Environmental Policy Act (NEPA) procedures, the following environmental documents have been prepared and widely distributed:
• Draft Environmental Impact Statement/Section 4(f) Evaluation (DEIS/4(F)) document, signed by FHWA in November 1991.
• Supplemental Draft Environmental Impact Statement/Section 4(f) Evaluation (SDEIS/4(F)) document, signed by FHWA in April 1997.
• Final Environmental Impact Statement/Section 4(f) Evaluation (FEIS/4(F)) document, signed by FHWA in May 1999.
• Federal Highway Administration Record of Decision (ROD) for Interstate 95 New Haven Harbor Crossing, signed by FHWA in August 1999.
The record of Decision can be accessed at the following internet link: http://www.ct.gov/dot/cwp/view.asp?a=1383&q=259772. During the course of the CEPA and NEPA process, a significant public outreach program was conducted. This included public meetings and hearings, as well as a significant on‐going public information program that has been on‐going during the project’s design and construction phases. This includes a series of informational meetings and presentations to interested groups and organizations, as well as press releases and a dedicated website for the project.
7. Environmentally Related Federal, State, and Local Actions The project area is immediately adjacent to Long Island Sound, and therefore is subject to various State and Federal environmental permits. A list of required permits and the date of acquisition is as follows:
• U.S. Army Corps of Engineers Programmatic General Permit (Category I or II) (10/22/04, Permit #NAE‐2004‐1510)
• Connecticut Department of Environmental Protection Flood Management Certification (1/29/08, Permit #FM‐200701987)
• Connecticut Department of Environmental Protection 401 Water Quality Certification (10/27/04, Permit #2004‐00154‐KZ)
• Connecticut Department of Environmental Protection Office of Long Island Sound Programs Structures, Dredging and Fill Permit (10/27/04, Permit #2004‐00154‐KZ)
• Connecticut Department of Environmental Protection Coastal Area Management Review (10/27/04, Permit #2004‐00154‐KZ)
Copies of the Environmental Permits can be viewed at the following link: http://www.ct.gov/dot/cwp/view.asp?a=1372&Q=444928&PM=1.
8. Confidential Information There is no confidential information that should be noted for this application per the Guidelines published in the Federal Register.