Embed Size (px)
Citation preview

American Sociological Review2015, Vol. 80(2) 329 –358© American Sociological Association 2015DOI: 10.1177/0003122414568788http://asr.sagepub.com
Social capital has been an important concept and an explanatory variable for a number of issues in the social sciences. Particularly in economic sociology and organization studies, a burgeoning literature explains a wide range of outcomes using this concept (for an over-view, see Adler and Kwon 2002; Castilla, Lan, and Rissing 2013a, 2013b; Payne et al. 2011; Phelps, Heidl, and Wadhwa 2012). A central finding is that social capital has a
functional dimension for labor markets: it reduces information and search costs, matches supply with demand, and positively affects
568788 ASRXXX10.1177/0003122414568788American Sociological ReviewLutter2015
aMax Planck Institute for the Study of Societies
Corresponding Author:Mark Lutter, Max Planck Institute for the Study of Societies, Paulstr. 3, 50676 Cologne, Germany E-mail: [email protected]
Do Women Suffer from Network Closure? The Moderating Effect of Social Capital on Gender Inequality in a Project-Based Labor Market, 1929 to 2010
Mark Luttera
AbstractThat social capital matters is an established fact in the social sciences. Less clear, however, is how different forms of social capital affect gender disadvantages in career advancement. Focusing on a project-based type of labor market, namely the U.S. film industry, this study argues that women suffer a “closure penalty” and face severe career disadvantages when collaborating in cohesive teams. At the same time, gender disadvantages are reduced for women who build social capital in open networks with higher degrees of diversity and information flow. Using large-scale longitudinal data on career profiles of about one million performances by 97,657 film actors in 369,099 film productions between the years 1929 and 2010, I analyze career survival models and interaction effects between gender and different measures of social capital and information openness. Findings reveal that female actors have a higher risk of career failure than do their male colleagues when affiliated in cohesive networks, but women have better survival chances when embedded in open, diverse structures. This study contributes to the understanding of how and what type of social capital can be either a beneficial resource for otherwise disadvantaged groups or a constraining mechanism that intensifies gender differences in career advancement.
Keywordssocial capital, social networks, gender inequality, film, project-based labor markets, closure penalty, diversity
at Max Planck Society on April 2, 2015asr.sagepub.comDownloaded from

330 American Sociological Review 80(2)
individual career advancement. Specifically, it helps in acquiring new jobs, establishing future collaborations, and creating teams (Gabbay and Zuckerman 1998; Godechot and Mariot 2004; Granovetter 1995; Podolny and Baron 1997). Social capital facilitates the sharing and transfer of knowledge within teams and among co-workers (Inkpen and Tsang 2005; Reagans and McEvily 2003; Tortoriello, Reagans, and McEvily 2012; Wei, Zheng, and Zhang 2011), hastens the diffusion and creation of innovations (Obst-feld 2005; Rost 2011; Tsai and Ghoshal 1998), and enhances the productivity of teams and firms (Fernandez, Castilla, and Moore 2000; Reagans and Zuckerman 2001). More-over, social capital affects team success and performance even in highly competitive, cre-ative, and uncertain environments, such as careers in arts, video game production, musi-cals, professional soccer, and film production (Accominotti 2009; Becker 1982; de Vaan, Vedres, and Stark 2011, forthcoming; Ferri-ani, Cattani, and Baden-Fuller 2009; Giuffre 1999, 2010; Grund 2012; Lutter 2014; Uzzi and Spiro 2005; White 1993).
Especially in project-based labor markets such as film, where recruitment depends on interpersonal networks (Bielby and Bielby 1999; Blair 2009; Cattani and Ferriani 2008; Faulkner 1983; Faulkner and Anderson 1987; Jones 1996), social capital is highly important for getting jobs and structuring the market. While much of the literature on social capital highlights its positive and functional aspects, there is a dysfunctional, “dark” side (Gargiulo and Benassi 1999): social exclusion. If recruitment is to a great extent a result of interpersonal networks, there is a tendency to exclude and discriminate actors based on ascriptive characteristics, regardless of talent (Bourdieu 1984; DiMaggio and Garip 2012; Lin 1999, 2001). Qualitative research sug-gests that women in particular suffer from labor markets structured by informal recruit-ment practices (Christopherson 2009; Grugu-lis and Stoyanova 2012).
However, research has still not systemati-cally investigated whether and how social
capital and network structures affect women’s chances to advance their careers. The persis-tence of gender inequalities in project-based labor markets is a well-studied fact (Bielby and Bielby 1992, 1996; Lincoln and Allen 2004), but it is less clear how different forms of social capital affect existing gender disad-vantages. So far, insight has come from knowledge generated from case-study research (Grugulis and Stoyanova 2012), but quantitative accounts examining how expo-sure to different types of network structures affects gender disadvantages in career advancement are rare. For instance, Petersen, Saporta, and Seidel (2000) review the empiri-cal literature on networks and gender segre-gation and conclude that systematic knowledge is still very limited. They quote Granovetter, who notes in his review that this research gap is precisely the one “most in need of filling” (Granovetter 1995:177).
The few existing studies that deal explic-itly with the differential returns of social capi-tal on careers for men and women are mixed and inconclusive in their findings. For instance, Burt (1998:16) argues that women “do better with a small network of intercon-nected contacts” and do not profit from bro-kerage per se (as men do), but that women can benefit indirectly from brokerage through strong ties to established sponsors. Others, however, argue that women’s close circles are detrimental for their careers. Women’s gender-homophilous ties (i.e., exchange occurs mainly through ties with the same sex) create stronger disadvantages because they tend to be lower in status and consist of fewer connections to important sponsors (Groys-berg 2010; Ibarra 1992; McPherson, Smith-Lovin, and Cook 2001).
In addition, prior studies almost exclu-sively rely on cross-sectional data, and it is less clear if differences in returns on social capital are the cause or the effect of disadvan-taged positions and career outcomes. As Mouw (2006) suggests, studies should rely on longitudinal data that take whole career pat-terns into account to perform stricter tests on the causality of possible network effects.
at Max Planck Society on April 2, 2015asr.sagepub.comDownloaded from

Lutter 331
Consequently, as a recent review argues, “to truly understand the causes, realities, and implications of gender differences in social networks, we must study them dynamically and longitudinally” (Cabrera and Thomas-Hunt 2007:7).
This article attempts to fill this gap. Build-ing on prior research, I propose that gender inequality is particularly striking when women are exposed to cohesive project teams during their careers, whereas gender inequal-ity is less severe when they are involved in weaker, more diverse network structures. This is because information flow in cohesive networks is likely to be redundant and gender-homophilous, which creates stronger disadvantages for women compared to men, because women’s close information networks are lower in status and consist of fewer ties to important (mostly male) sponsors. In diverse net-works, however, information is non-redundant, non-exclusive, and beneficial especially to women, because women face fewer network constraints and can more strategically exploit external, weak tie relationships.
Using a unique panel dataset that includes full career profiles of more than one million performances by 97,657 film actors in the U.S. film industry and advanced measures of cohesion, familiarity, and different aspects of diversity, this study sheds light on the long-discussed but never quantitatively analyzed idea that women are more likely to suffer career penalties from network closure. By analyzing interaction effects between gender and measures of cohesion, social capital, and information diversity, I find that, controlling for human capital and other success-related factors, women who are affiliated with cohe-sive networks during their careers face sig-nificant disadvantages. In contrast, gender disadvantages are reduced substantially in careers that feature collaborations with less cohesive relations, weaker ties, and greater information diversity. I find that if women engage in teams with greater diversity, they can reduce their risk of career failure to a level indistinguishable from that of men. Gender differences are then fully negated.
SoCIAL CAPITAL AND GENDEr: ThEory AND hyPoThESES
The number and quality of relationships—such as colleagues or collaborations, friends or family—can be subsumed under the notion of social capital if this social structure in any way forms an asset or resource (Burt 1992). The strength of personal ties is usually con-ceptualized by the amount or frequency of contact, emotional affection, reciprocal behavior, or trustworthiness (Granovetter 1973). Network structures can create social capital in different ways, either through strong, dense, and cohesive ties—network closure (Coleman 1988)—or through “net-work betweenness” (Freeman 1977), that is, networks in which weakly connected ties act as brokers between different core groups (Burt 2000).
The classical approach comes from Cole-man (1988) and highlights the assumption that network closure forms a beneficiary resource of social capital. According to Cole-man, actors with frequent relationships are more likely to develop trust, conjoint identifi-cation, and shared norms, which in turn lead to reciprocal, cooperative, and pro-social behavior. In cohesive networks where actors interact repeatedly, the incentive to cooperate is relatively high, because cooperation enhances a person’s chances to receive help the next time it is needed. Any favor an actor receives from a colleague imposes an obliga-tion to reciprocate in the future. As a conse-quence, actors in frequent relationships invest more in social capital, because they can expect a higher return from this investment, as opposed to actors in weaker relationships or one-shot interactions.
While trust and information exchange are enhanced within cohesive networks, informa-tion on how to get jobs or other career- relevant information tends to be redundant, because it resonates within the same set of people, who potentially share similar back-grounds (Burt 1992; Granovetter 1995; Rea-gans and Zuckerman 2001). Moreover,
at Max Planck Society on April 2, 2015asr.sagepub.comDownloaded from

332 American Sociological Review 80(2)
cohesive networks might foster discrimina-tion and exclusion, as network closure is likely to divide actors into insiders and out-siders (Lin 1999; Portes 1998). According to Bourdieu (1984), members of a social group develop a specific habitus, which is social-ized, shared, and maintained, often uncon-sciously. The habitus imparts the “feel for the game” (Blair 2009:121), attaches members to the group, and makes membership visible. It creates distinctive features that signal belong-ing or exclusion, and restricts outsiders from gaining access to the group or from receiving important information.
The second approach on social capital assumes that actors in weak or loosely con-nected networks benefit from social capital. Referring to the famous “strength of weak ties” theorem (Granovetter 1973), weak ties are exposed to a broader range of diverse communities because they bridge what Burt (1992) calls “structural holes”—insular groups of cohesive and distant networks. Actors who maintain weak ties can benefit from a brokerage position, because they con-nect otherwise separated groups and tend to control the information flowing between them. Most important, the position equips the broker with access to different sorts of peo-ple, communities, and cultures. Therefore, weak tie networks offer a much broader infor-mation variety, which is advantageous in building and making use of social capital.1
With regard to gender inequality, women are in danger of being disadvantaged by cohe-sive networks, but they can profit from open, weaker, and more diverse network structures. Prior research suggests two mechanisms that explain why women are potentially disadvan-taged when they work in cohesive networks. First, women’s gender-homophilous networks (i.e., their identity networks to other women) tend to be negatively associated with posi-tional power, whereas men’s homophilous networks are positively associated to power and authority and are larger in absolute num-bers (Brass 1985; Ibarra 1992, 1993). Men are therefore more effective in creating career-relevant, “hard” social capital (van Emmerik 2006). For instance, they are more
likely to take up leadership positions within informally occurring, close entrepreneurial groups (Yang and Aldrich 2014).
Gender-segregated informal, personal net-works seem to be reflected in segregated workgroups (Fernandez and Sosa 2005). Research finds that job-seekers in white/male networks receive more relevant job informa-tion than do those in minority/female net-works, because of the white/male networks’ higher-status contacts (McDonald 2011; Petersen et al. 2000; Stainback 2008). In addition, women with children might be at a particular disadvantage, because they tend to have fewer work-related ties, or less time to invest in building beneficial strong ties (Munch, McPherson, and Smith-Lovin 1997). As a consequence, women tend to be concen-trated in “pink collar” jobs (Burt 1998:19), where they find fewer career opportunities and meager returns on their network resources (Bielby and Baron 1986).
Second, women’s careers tend to suffer from poor mentorship. Burt (1998) shows that women need to “borrow” social capital with the help of a powerful mentor, and if they do, the effects are strong. Groysberg (2010), however, points out that most women have difficulty finding sponsors, have generally fewer sponsors than men, or receive less sup-port from their (mostly male) sponsors. Lin (2001), in addition, argues that disadvantaged labor market groups (such as women) receive fewer benefits from high-status ties simply because they lack the experience to appropri-ately mobilize beneficial social capital. This is supported by McGuire (2002), who finds that women face disadvantages even when they have ties to powerful employees.
Applied to careers in film, these mecha-nisms might be especially dominant because the main decision-makers—the producers, directors, and stars in leading roles—are 80 to 90 percent male (Bielby and Bielby 1996; Christopherson 2009; Levy 1989). Hence, cohesive network structures within a team are likely to cause gender- and status-biased information flow in which women receive lesser quality information. Men in cohesive circles also suffer from information
at Max Planck Society on April 2, 2015asr.sagepub.comDownloaded from

Lutter 333
redundancy, but men do better than women because their identity networks tend to con-sist of more ties to positions of higher status.
Taken together, gender-homophilous information flow, low-status identity net-works, poor returns on mentorship, and, as a consequence, redundant and narrow informa-tion on future possible projects can result in cumulative disadvantages for women build-ing their careers in cohesive networks. Par-ticularly in project-based labor markets, initial differences in success likely trigger future success (DiPrete and Eirich 2006; Faulkner and Anderson 1987; Rossman, Esparza, and Bonacich 2010). Therefore, exclusion from access to important informa-tion burdens those who already face informa-tion penalties, giving rise to the accumulation of disadvantages over the course of a career (Fernandez-Mateo 2009).
Hypothesis 1: If women are more often attached to cohesive teams during their careers, their chances for career survival decrease relative to men’s career survival chances.
While women might suffer from exclusion and information penalties in cohesive net-works, they can take advantage of weaker and more diverse networks. This is supported by three insights from the sociology of social capital. First, Burt (1997) argues that the ben-efits of brokerage through weak ties—although beneficial in general—increase if actors are less constrained and have less legitimacy. Women benefit more from diver-sity precisely because they are less embedded in job-relevant cohesive circles (i.e., fewer mentors and less powerful identity networks). Facing fewer network constraints, women are free to exploit and take advantage of diver-sity. This view is supported by Ibarra (1997:93), who argues that “women may respond to the limited availability of homo-philous contacts by reaching beyond their immediate work groups.” Consequently, she concludes, “broad-ranging networks . . . offer greater benefits to women than to men by linking them to peer and senior women in other subunits.” In the same way, Lin (2001)
argues that diversion of ties is a better strat-egy for disadvantaged groups (see also Son and Lin 2012), because diversity makes them less dependent on a few (mostly male) decision-makers who decide whether they are to be included in the in-group.
Second, Podolny (2001) suggests that the benefits of brokerage increase with high ego-centric uncertainty. Women face higher mar-ket uncertainties due to their higher drop-out rates. Hence, while men benefit from internal sponsors and gender-homophilous, high- status identity networks, women must rely on external and diverse network ties to survive (Ibarra 1993). Accordingly, Groysberg (2010) argues that women profit from external ties because they are much more cautious, strate-gic, and selective than men when making choices on future projects. Indeed, Ibarra (1997) shows empirically that network diver-sity pays off for women: women with high potential in career advancement have wider-ranging information networks than do their male counterparts.
Finally, as Burt (2004) shows, network diversity enhances not only the generation of good ideas, but also how performance is evaluated by others. This is especially benefi-cial to women, as it increases their visibility and reduces opportunities for discrimination (Petersen and Saporta 2004). Accordingly, research on valuation finds that creative actors at the periphery receive more attention from external, professional critics, whereas actors at the core receive recognition from their peers (Cattani, Ferriani, and Allison 2014).
In summary, women suffer a “closure pen-alty” in cohesive projects, because their iden-tity relationships (multiplex ties to the same sex) are more likely to be less powerful, whereas men’s identity ties tend to be of higher status. However, being “unbound,” women benefit from diversity because they are free to exploit it. They also have little choice other than to exploit diversity, because they do not naturally profit from internal sponsors as men do. Consequently, women are more cautious and strategic in making choices.
at Max Planck Society on April 2, 2015asr.sagepub.comDownloaded from

334 American Sociological Review 80(2)
A non-representative but illustrative exam-ple of women’s careers in film can be seen in the acting careers of Mia Farrow and Diane Keaton. Relatively early in their careers, both were in a relationship with director Woody Allen. Their careers, however, evolved very differently. Diane Keaton, on the one hand, built her career very successfully by working in diverse genres with different directors and producers. Mia Farrow, on the other hand, narrowed her network during her relationship with Woody Allen by working almost exclu-sively in his productions. After they split up, Farrow was much less successful and appeared in only a handful of movies, whereas Keaton managed to become one of the most successful female actors to date.
Hypothesis 2: If, during their careers, women are more often attached to open teams with regard to diversity of ties, information flow, and genre background, their chances for ca-reer survival are increased relative to men’s career survival chances.
DATA AND METhoD
This study uses data from the Internet Movie Database, which is currently the most com-plete database on movies, filmmakers, and the film industry worldwide. At present, it contains information on approximately two million film and TV productions, as well as more than four million individuals (e.g., actors, producers, directors, cinematogra-phers, writers, and designers). The database has a relatively high degree of validity, because users can report errors to an editorial team; actors, their representatives, or other people listed in the database can provide information as well. Several sociological studies have used these data, confirming their validity (Hsu 2006; Rossman et al. 2010; Rossman and Schilke 2014; Zuckerman and Kim 2003; Zuckerman et al. 2003).
From these raw data, which is provided by imdb.com for noncommercial use,2 I gener-ated career profiles of male and female actors by their performances in film productions listed in this database. I include individuals’
full career profile if they appeared at least once in a film produced in the United States. A career profile includes all of a person’s roles that were recorded in the database between the years 1929 and 2010. Although I have data from 1900 onward, I begin the analysis with the year 1929, yielding a more time-robust analysis.3 Smith-Doerr (2010) shows that after 1929 (the beginning of the sound film era and development of the Hol-lywood studio system), the film industry matured and professionalized. As the industry matured, it became more attractive for male professionals as a legitimate labor market. Consequently, more males entered the busi-ness, which affected women’s chances in this labor market. Starting the analysis in 1929 produces a much more representative picture of the film business in its current form.
I only include performances in films and thereby exclude television productions, video-only movies, and pornographic movies. The final dataset contains a total of 1,072,067 performances by 97,657 actors (of which 31,124, or 32 percent, are female) in 369,099 film productions.
In a project-based labor market such as the film business, the most basic measure for career advancement is survival. As Faulkner and Anderson (1987) show for producers and directors in Hollywood, the majority drop out after one or two movie productions. Only a small fraction actually “survives” for more than two movies. Simply to stay in the busi-ness means to advance a successful career. Accordingly, I use event history methods to estimate factors that influence career survival (Cleves, Gould, and Gutierrez 2004). In par-ticular, I use Cox regression to estimate haz-ards for career failure, that is, the risk of dropping out of the business.
Career failure is a binary variable that takes the value 1 at an actor’s last entry in the database—which constitutes an actor’s last performance.4 Otherwise, it is zero. Because the time frame of the study ends in 2010, I do not know whether a career continues after 2010. This points to the common problem of censoring in survival data (Cleves et al. 2004). To handle this problem, I treat only actors
at Max Planck Society on April 2, 2015asr.sagepub.comDownloaded from

Lutter 335
who were inactive within the 10 years prior to 2010 as having failed careers.5 In other words, if actors were not involved in a production since 2000, I treat their last production as career failure = 1. If there is a record after 2000, I treat the career as ongoing, hence, career failure status = 0.
Out of a total of 97,657 actors, I count 36,490 careers that failed (37 percent). The median survival time is seven years (mean = 13); seven years for women (mean = 12) and eight years for men (mean = 13). This corre-sponds to an overall median of four produc-tions (mean = 11); four for women (mean = nine) and three for men (mean = 12). Kaplan-Meier estimates reveal that women have a higher risk of career failure, especially at the beginning of their careers, but once women manage to survive the early career stage, their risk of dropping out becomes slightly lower than men’s. Women also have slightly longer career breaks than men (about 1.3-times longer, i.e., 1.24 years on average).
I fit Cox proportional hazard models because the literature suggests these as the most flexible instrument to estimate survival data (Cleves et al. 2004). Previous tests of the proportionality assumption suggest that Cox modeling is appropriate. To surmount possi-ble violations in the regression assumptions, such as error independence among observa-tions, all estimations rely on robust standard errors clustered by actors. I also present results of a few alternative model specifica-tions and sensitivity analyses to test the robustness of the discussed findings (see Table S4 in the online supplement and note 8). In particular, these models include differ-ent specifications of time to control for pos-sible heterogeneity due to unobserved time trends that might affect both dependent and independent variables.
Measurement of Variables
Table 1 presents descriptive statistics for all variables used in this study. Hypothesis 1 assumes that women face disadvantages when they work more often in cohesive team
structures rather than in weaker structures. To measure the cohesion of a film production team, I follow de Vaan and colleagues (2011) and rely on their two related but distinct mea-sures of social capital: interpersonal team familiarity and recurring cohesion. Interper-sonal familiarity, developed by Newman (2001) in its core form, measures the intensity of prior relations between each pair of col-laborators within a film production team. In a dataset sorted by the release date of each film, the strength of collaboration between indi-vidual i and j (if any) is given by the following:
wnij
f
ifjf
f
=−∑
δ δ1
where δif is 1 if i was part of film f and zero
otherwise; likewise, δjf equals 1 if individual j was
part of film f and zero otherwise. If there has been any collaboration between i and j in any film production, then δi
f δjf will count as 1, and
zero otherwise. ηf is the number of crew members in film f. By dividing by ηf – 1, I give collaborations in smaller productions a greater weight, assuming that members know each other better if they worked together in crews of a smaller size as opposed to larger crews. wij then gives us a number of prior col-laborations over all film productions for each pair of individuals in the dataset. I then calcu-late the sum of the off-diagonal, lower trian-gular values of wij for each film crew c in the dataset, and adjust it by crew size nc. Note that taking the lower triangle elements pre-vents the same collaboration from being counted twice. The sum yields a measure of interpersonal team familiarity:
Team familiarityn
wcc i j
ij=>∑1
Team familiarity conceptualizes social capital at the dyadic, person-to-person level. It measures the degree to which people in a current team know each other from past col-laborations. Naturally, this variable includes both weak and strong ties. To better capture
at Max Planck Society on April 2, 2015asr.sagepub.comDownloaded from

336 American Sociological Review 80(2)
Table 1. Descriptive Statistics for All Variables Used in This Study
Variable Mean SD Min. Max.
Dependent Variable Career failure .03 .18 0 1 Career duration 13.27 11.49 0 85Predictors Female .26 .44 0 1 Age 41.57 14.67 3 86 Number of movies produced 40.16 65.73 1 1456 Cumulative number of awards .21 1.51 0 93 Cumulative billing position 161.42 221.06 0 11444 Number of roles not credited 19.14 45.17 0 1402 Origin USA .55 .50 0 1 Origin UK .05 .22 0 1 Origin Germany .02 .15 0 1 Origin France .03 .17 0 1 Origin Italy .02 .15 0 1 Titles in English 30.76 59.28 0 1005 Titles in German 1.32 6.99 0 246 Titles in French 1.98 8.15 0 234 Titles in Italian 1.20 6.04 0 195 Productions USA 31.34 64.93 0 1449 Productions Germany .69 5.86 0 256 Productions France 1.72 8.59 0 237 Productions Italy 1.38 7.34 0 216 Has been producer .21 4.25 0 1094 Has been director .67 7.57 0 619 Major titles 37.67 64.36 0 1448 Sequels 1.29 2.93 0 287 Novels 5.48 8.72 0 140 Crew size 48.50 44.83 1 1311 Genre: thriller/crime .05 1.06 –3.52 4.95 Genre: family/adventure/comedy .11 1.06 –1.64 8.50 Genre: action/adventure/Western .04 1.08 –3.36 11.36 Genre: drama/romance/history .27 .99 –7.70 3.74 Person per movie ratio 14.68 3.64 6.84 22.84 Team familiarity .14 1.09 0 73.02 Recurring cohesion 2.20 6.70 0 310.24 Share of newcomers .19 .18 0 1 Niche width 2.13 1.13 0 10 Genre diversity .31 .05 0 .42
Note: Calculated on all observations (N = 1,072,067 actor-film data).
possible closure tendencies from cohesion, I follow de Vaan and colleagues (2011) and calculate their measure of recurring cohesion. Recurring cohesion considers cliques of at least three people who have repeatedly col-laborated in past productions. For instance, if actors A, B, and C worked together in a movie and repeat their collaboration in a later
production, this later production is considered more cohesive because a full clique, rather than just a dyadic relationship, reassembles itself in a new team. Recurring cohesion is calculated as follows: for each film team in the dataset, I identify all cliques of three or more members who collaborated in a prior film. Having identified qc cliques ranging
at Max Planck Society on April 2, 2015asr.sagepub.comDownloaded from

Lutter 337
from clique v = 1 to qc for each team c, I measure the overlap of individuals recurring in these cliques. This results in a non- symmetric qc × qc matrix Lc, in which each entry Lc
vw contains the number of people appearing in both clique v and w, recorded as a share of the number of persons in clique v. If Sv is the number of individuals of the current film crew c in clique v, and Sc is the number of individuals in film crew c, then recurring cohesion is given by the following:
Recurring cohesion
LS
S
qc
v w vwc v
c
c
=+( )−( )
≠∑ 1
2 1
The variable can be read as a team’s average degree of cohesion, measured as the extent to which past cliques of at least three people reassemble in the current production. The quantity takes the value 0 if no cohesion exists, that is, no clique of recurring collabo-ration is present in the focal team; it takes a positive value if there is cohesion in a team. Higher values indicate a greater degree of recurring cliques.
The second hypothesis assumes that gen-der disadvantages become less severe in careers in which a person associates more often with teams structured by open and diverse networks. These networks should facilitate the flow of information in a way that benefits otherwise disadvantaged groups. To test this, I rely on three measures of team openness and information diversity. The first is simply the share of newcomers within a film team c. I follow Perretti and Negro (2006) as well as March (1991) and assume that the higher the percentage of newcomers within a team, the more likely that fresh ideas will be brought into the production, as well as new perspectives, new combinations of rela-tionships, and heterogeneous information pools.
The second diversity measure takes into account individual exposure to different genre backgrounds. Each film in the database is described by a total of 28 genre dummies (for a list, see Table A1 in the Appendix), the
combination of which determines the genre of the film. For example, the Spielberg movie E.T. (1982) is described by the three genre dummies adventure, drama, and family; Zemeckis’s Back to the Future (1985) is adventure, comedy, and sci-fi. I calculate Hsu’s (2006) measure of niche width, which is the total number of distinct genre catego-ries that each film production addresses, accumulated over an actor’s career. In line with Hsu (2006) and Zuckerman and col-leagues (2003), I assume that the broader an actor’s genre identity, the greater the likely exposure to diverse categories, genre cul-tures, different schools of thought, and diverse information pools.
While this measure takes individual genre diversity into account, I also calculate a team-based diversity measure. In line with Stark (2009), I assume that different genre back-grounds among crew members generate sty-listic dissonance between different genre standards and the way cultural products are produced. This creates an atmosphere of pro-ductive friction in which innovation and crea-tive synergy within a team reaches an optimal level. Women can profit from this diversity because the exposure to various people with different cultural genre backgrounds provides access to various sources of information and opens up beneficial opportunities in job searches—as opposed to uniform, homoge-nous film teams sharing basically the same artistic standards and the same channels of knowledge.
To measure the genre diversity of a team, I calculate the distance measure used by de Vaan and colleagues (2011), which is based on Jaffe’s (1986) well-known measure of proximity/dissimilarity (see also Rodan and Galunic 2004; Phelps 2010). This distance measure calculates the stylistic distance between each team member of a focal team based on their genre backgrounds from past productions. To construct this measure, I first quantify each actor’s genre history using the 28 distinct genre dummies. In doing this, I count the number of movies in each of the 28 genres in which an actor performed, up to
at Max Planck Society on April 2, 2015asr.sagepub.comDownloaded from
338 American Sociological Review 80(2)
each time point t. In a second step, I focus on the team level and calculate the sum of genre histories for all members of a focal film crew. I do this for all film teams in the dataset and for each of the 28 genres. This gives a distri-bution showing the degree to which each genre k is represented within the experience background of the whole crew. I now calcu-late K-dimensional vectors fi = ( fi1, …, fiK), where fik is the fraction of crew member i’s genre history in genre category k. Based on Jaffe (1986), the genre distance d between team members i and j is derived by the following:
df f
f f
ijk
K
ik jk
k
K
ik k
K
jk
= −
=
= =
∑
∑ ∑1 1
1
2
1
2
1
2
1
2
That is, dij is one minus the length of the pro-jection of the normed vector fi onto the normed vector fj. fi and fj have only non- negative entries, hence, the distance measure can take values between 0, representing com-plete similarity in the genre backgrounds of members i and j, and 1, which stands for the maximum possible dissimilarity in genre his-tory between i and j. I then sum this index for all members of a crew and adjust for team size. For each film crew c, genre diversity is defined as follows:
genre diversityn
dcc i j
ij=>∑1
where dij is the genre distance measure of crew member i from j, and nc is the number of crew members of focal film crew c. Again, note that the measure takes the off-diagonal elements of the lower triangle of the distance matrix into account and adjusts for crew size.
Controls
I control for a number of variables at the film- and person-specific level that should have an effect on career survival chances. Age (in
years) is calculated from the birth year infor-mation in the database. I assume that the hazard rate for career failure increases with age. Number of movies produced is a human capital variable reflecting job experience, as measured by the number of movies an actor has been associated with by time point t. Greater job experience should decrease the risk of career failure. Cumulative number of awards measures prior critical success. In constructing this variable, I record all award nominations and winnings an actor received personally (e.g., best male or female actor, best supporting role) for a film production at an important film festival. I use awards data from the 45 most important film festivals worldwide (see Table A2 in the Appendix), including the 14 most important U.S. film awards, all 14 international “A” film festi-vals, and another 17 “B” film festivals.6
Cumulative billing position represents the ranking position occupied by an actor within a production’s credits. Billing position is available in the database for each film pro-duction that offers a competitive role ranking. The lower this number, the better the position: billing position number 1 represents the lead-ing role, position 2 the second leading role, position 3 the main supporting role, and so on. Rankings are usually a competitive part of the contract and reflect an actor’s star power or ability to negotiate a starring role within a production. A better ranking is usually associ-ated with greater visibility, pay, and audience recognition, and should therefore positively affect an actor’s reputation and ability to acquire future roles. I accumulate this varia-ble over all roles to reflect past experiences and leading roles that might still affect future projects. Not all roles within a production are ranked by billing position. Roles below the top-10 or top-20 cast are often not listed in the credits. Number of roles not credited records the cumulative number of movies an actor worked on without having a credited role. Career survival chances should be higher if this variable is lower on average.
The following variables account for regional heterogeneity in the sample. The five
at Max Planck Society on April 2, 2015asr.sagepub.comDownloaded from

Lutter 339
dummy variables for origin (USA, UK, Ger-many, France, and Italy) control for an actor’s country of origin. They reflect the five most frequent birthplaces in the database. All remaining birthplaces act as the reference category. Titles in English (German, French, Italian) measure the number of English- language productions an actor appeared in (and German-, French-, and Italian-language, respectively). Productions USA (Germany, France, Italy) count the number of U.S.- produced movies an actor appeared in (and German, French, and Italian productions, respectively).
Actors also work as directors or producers, which normally demonstrates a stronger and more stable career position (Baker and Faulkner 1991). I include two measures, has been producer/director, that count the cumu-lative number of movies at time point t in which an actor has worked as a producer or director, respectively. Major titles is the num-ber of major movie productions in which an actor performed. Compared to independent movies, major productions have a higher budget, a greater number of theater screen-ings, and eventually, more box-office returns. Sequels represents the cumulative number of sequels in which an actor appeared. Sequels (e.g., Rocky III ) often attract large audiences and return much higher profits than do non-sequels. Similarly, productions based on nov-els often yield higher returns. Novels represents the number of times an actor appeared in films with a novel-based script. Crew size shows the number of crew mem-bers for each production. Because costly pro-ductions usually have larger crews, this represents a proxy for a movie’s budget (see Rossman et al. 2010).
To control for genre effects, four variables— thriller/crime; family/adventure/comedy; action/adventure/Western; and drama/romance/ history—represent the factor scores from a principal component analysis on the 28 genre dummies that classify every film production in the dataset. Table A1 in the Appendix dis-plays the varimax-rotated solution of the fac-tor analysis. Person per movie ratio reflects
the opportunity structure for each actor in the business. If a greater number of actors com-pete for fewer available jobs in a particular year, I assume that the hazard rates of career failure are increased. This variable is defined as the total number of actors in a given year, divided by the total number of movies released in that year.
rESuLTSTable 2 presents results of a set of nested model estimations. For all metric variables, I use logged values to control for skewness and to account for diminishing marginal returns of success.7 I begin with a covariate baseline model in which I enter the female dummy and all control variables (Model 1). Controlling for all other factors in the model, women drop out of the business much earlier than do men. According to Model 1, the risk of failure for female artists is about 8 percent higher than that for their male counterparts.
The controls are all in line with my expec-tations. Age has a significant positive effect. The risk of failure increases with seniority. At the same time, job experience lowers the risk of ending a career. The same holds true for number of awards: the more awards an actor receives, the lower the hazard of failure. In the same way, having a portfolio of higher-ranked billing positions, having worked as a pro-ducer, appearing in English-language produc-tions, having a major distributor, and having a part in a sequel all increase survival chances. However, productions based on novels decrease survival chances. This is probably because scripts based on novels are often “art-house”-type productions and less appealing to large audiences. Hence, these productions do not increase an actor’s visibility, which can be detrimental to a career. The same holds true for actors appearing in U.S. productions, com-pared with actors working in other countries. Actors based in the United States have less chance for survival, probably because the U.S. business is more competitive than film indus-tries in other countries. The effects of the ori-gin variables point in the same direction—actors
at Max Planck Society on April 2, 2015asr.sagepub.comDownloaded from

340
Tabl
e 2.
Mai
n R
esu
lts:
Cox
Reg
ress
ion
s on
Car
eer
Fai
lure
Haz
ard
s
(1)
(2)
(3)
(4)
(5)
(6)
C
ovar
iate
B
asel
ine
Mod
elS
ocia
l C
apit
al
Mea
sure
sD
iver
sity
M
easu
res
Fu
ll M
odel
Inte
ract
ion
E
ffec
ts 1
Inte
ract
ion
E
ffec
ts 2
Fem
ale
.081
***
.073
***
.073
***
.073
***
.010
.536
***
(6
.858
)(6
.228
)(6
.211
)(6
.244
)(.
656)
(4.9
04)
Age
(ln
).1
02***
.110
***
.108
***
.110
***
.110
***
.108
***
(5
.877
)(6
.413
)(6
.229
)(6
.361
)(6
.404
)(6
.274
)N
um
ber
of m
ovie
s p
rod
uce
d (
ln)
–.30
3***
–.35
5***
–.30
7***
–.34
7***
–.35
0***
–.35
5***
(–
12.4
57)
(–14
.611
)(–
12.6
52)
(–14
.260
)(–
14.3
70)
(–14
.537
)C
um
ula
tive
nu
mbe
r of
aw
ard
s (l
n)
–.96
7***
–.94
6***
–.95
6***
–.94
4***
–.94
2***
–.94
5***
(–
23.0
59)
(–22
.752
)(–
22.8
54)
(–22
.673
)(–
22.6
06)
(–22
.619
)C
um
ula
tive
bil
lin
g p
osit
ion
(ln
).0
55***
.072
***
.069
***
.077
***
.078
***
.079
***
(1
0.79
3)(1
3.93
9)(1
3.46
4)(1
5.00
2)(1
5.19
9)(1
5.25
3)N
um
ber
of r
oles
not
cre
dit
ed (
ln)
.214
***
.191
***
.205
***
.188
***
.193
***
.195
***
(1
9.12
8)(1
7.07
8)(1
8.42
4)(1
6.92
3)(1
7.33
0)(1
7.43
0)O
rigi
n U
SA
.028
*.0
44**
.038
**.0
45**
.043
**.0
43**
(2
.036
)(3
.129
)(2
.706
)(3
.216
)(3
.082
)(3
.082
)O
rigi
n U
K.1
27***
.115
***
.123
***
.119
***
.118
***
.116
***
(5
.103
)(4
.624
)(4
.959
)(4
.795
)(4
.714
)(4
.636
)O
rigi
n G
erm
any
.040
.030
.032
.031
.030
.030
(.
896)
(.67
7)(.
731)
(.70
4)(.
688)
(.68
1)O
rigi
n F
ran
ce.1
19*
.100
*.1
13*
.105
*.1
07*
.107
*
(2
.544
)(2
.157
)(2
.419
)(2
.259
)(2
.306
)(2
.288
)O
rigi
n I
taly
.018
–.01
8–.
010
–.02
2–.
020
–.01
9
(.35
6)(–
.373
)(–
.208
)(–
.433
)(–
.398
)(–
.388
)T
itle
s in
En
glis
h (
ln)
–.14
6***
–.10
4***
–.12
6***
–.09
8***
–.09
6***
–.09
4***
(–
7.97
1)(–
5.59
1)(–
6.82
8)(–
5.29
6)(–
5.17
5)(–
5.06
0)T
itle
s in
Ger
man
(ln
).1
24***
.130
***
.129
***
.130
***
.131
***
.133
***
(7
.947
)(8
.382
)(8
.351
)(8
.437
)(8
.494
)(8
.594
)T
itle
s in
Fre
nch
(ln
)–.
065***
–.06
3***
–.07
4***
–.07
0***
–.07
2***
–.07
1***
(–
4.02
7)(–
3.89
5)(–
4.60
9)(–
4.37
8)(–
4.45
8)(–
4.41
0)T
itle
s in
Ita
lian
(ln
)–.
161***
–.14
8***
–.15
8***
–.15
1***
–.15
0***
–.15
0***
(–
8.20
5)(–
7.62
3)(–
8.12
8)(–
7.74
6)(–
7.70
8)(–
7.70
6)
(con
tin
ued
)
at Max Planck Society on April 2, 2015asr.sagepub.comDownloaded from

341
(1)
(2)
(3)
(4)
(5)
(6)
C
ovar
iate
B
asel
ine
Mod
elS
ocia
l C
apit
al
Mea
sure
sD
iver
sity
M
easu
res
Fu
ll M
odel
Inte
ract
ion
E
ffec
ts 1
Inte
ract
ion
E
ffec
ts 2
Pro
du
ctio
ns
US
A (
ln)
.554
***
.544
***
.534
***
.533
***
.533
***
.532
***
(3
3.44
4)(3
2.51
7)(3
2.09
7)(3
1.79
5)(3
1.82
6)(3
1.74
6)P
rod
uct
ion
s G
erm
any
(ln
)–.
374***
–.32
6***
–.34
4***
–.31
7***
–.31
8***
–.31
8***
(–
13.3
27)
(–11
.915
)(–
12.5
07)
(–11
.664
)(–
11.6
79)
(–11
.707
)P
rod
uct
ion
s F
ran
ce (
ln)
–.11
7***
–.09
2***
–.08
9***
–.07
9***
–.07
7***
–.07
9***
(–
5.64
5)(–
4.42
0)(–
4.28
2)(–
3.75
3)(–
3.70
4)(–
3.75
3)P
rod
uct
ion
s It
aly
(ln
).2
45***
.248
***
.248
***
.250
***
.249
***
.250
***
(1
0.59
9)(1
0.72
7)(1
0.71
9)(1
0.77
2)(1
0.71
6)(1
0.77
5)H
as b
een
pro
du
cer
(ln
)–.
416***
–.39
2***
–.40
5***
–.38
9***
–.39
3***
–.39
0***
(–
13.3
48)
(–12
.676
)(–
13.1
12)
(–12
.592
)(–
12.6
72)
(–12
.565
)H
as b
een
dir
ecto
r (l
n)
–.01
1–.
004
.001
.003
.008
.012
(–
.668
)(–
.236
)(.
066)
(.19
6)(.
447)
(.67
1)M
ajor
tit
les
(ln
)–.
108***
–.18
0***
–.17
6***
–.19
7***
–.19
7***
–.19
7***
(–
5.94
5)(–
9.90
5)(–
9.70
3)(–
10.8
73)
(–10
.882
)(–
10.8
55)
Seq
uel
s (l
n)
–.17
6***
–.18
3***
–.18
5***
–.18
9***
–.18
7***
–.18
5***
(–
12.7
14)
(–13
.421
)(–
13.4
72)
(–13
.806
)(–
13.6
76)
(–13
.540
)N
ovel
s (l
n)
.142
***
.157
***
.137
***
.149
***
.148
***
.151
***
(1
1.84
0)(1
3.21
2)(1
1.47
3)(1
2.47
2)(1
2.38
7)(1
2.60
1)C
rew
siz
e (l
n)
.030
***
–.06
9***
.075
***
–.01
6–.
017*
–.01
8*
(3
.821
)(–
8.22
6)(9
.250
)(–
1.78
1)(–
1.99
2)(–
2.06
1)G
enre
: th
rill
er/c
rim
e–.
042***
–.03
7***
–.03
1***
–.02
6***
–.02
4***
–.02
4***
(–
8.48
3)(–
7.39
1)(–
5.91
9)(–
4.76
8)(–
4.53
5)(–
4.54
0)G
enre
: fam
ily/
adve
ntu
re/c
omed
y.0
22***
.015
**.0
35***
.034
***
.035
***
.035
***
(4
.701
)(3
.255
)(6
.067
)(5
.924
)(6
.089
)(6
.146
)G
enre
: act
ion
/ad
ven
ture
/Wes
tern
.002
–.00
3–.
001
–.00
3–.
002
–.00
3
(.38
7)(–
.602
)(–
.321
)(–
.560
)(–
.471
)(–
.749
)G
enre
: dra
ma/
rom
ance
/his
tory
.072
***
.073
***
.106
***
.103
***
.104
***
.105
***
(1
3.29
1)(1
3.10
8)(1
6.74
1)(1
5.81
1)(1
5.98
5)(1
6.08
8)P
erso
n p
er m
ovie
rat
io.0
43***
.058
***
.056
***
.061
***
.061
***
.061
***
(2
5.14
8)(3
2.31
7)(3
1.61
3)(3
3.52
7)(3
3.53
0)(3
3.48
7)
Tabl
e 2.
(co
nti
nu
ed)
(con
tin
ued
)
at Max Planck Society on April 2, 2015asr.sagepub.comDownloaded from

342
(1)
(2)
(3)
(4)
(5)
(6)
C
ovar
iate
B
asel
ine
Mod
elS
ocia
l C
apit
al
Mea
sure
sD
iver
sity
M
easu
res
Fu
ll M
odel
Inte
ract
ion
E
ffec
ts 1
Inte
ract
ion
E
ffec
ts 2
Team
fam
ilia
rity
(ln
)–.
574***
–.49
8***
–.32
4***
–.50
4***
(–
8.27
4)(–
7.10
5)(–
4.38
9)(–
7.14
9)R
ecu
rrin
g co
hes
ion
(ln
).4
42***
.353
***
.294
***
.355
***
(3
0.68
0)(2
1.69
6)(1
6.78
4)(2
1.74
4)S
har
e of
new
com
ers
(ln
)–1
.756
***
–.91
8***
–.90
8***
–.63
3***
(–
32.7
25)
(–13
.829
)(–
13.6
64)
(–8.
566)
Nic
he
wid
th (
ln)
–.26
4***
–.21
6***
–.22
0***
–.18
5***
(–
11.8
87)
(–9.
642)
(–9.
804)
(–7.
455)
Gen
re d
iver
sity
(ln
)–4
.523
***
–3.2
04***
–3.1
76***
–2.9
52***
(–
29.5
91)
(–19
.006
)(–
18.8
27)
(–15
.536
)F
emal
e x
fam
ilia
rity
–.58
6***
(–3.
871)
F
emal
e x
coh
esio
n.1
90***
(7.2
61)
F
emal
e x
new
com
ers
–.83
3***
(–
8.37
0)F
emal
e x
nic
he
wid
th–.
107**
(–
3.19
4)F
emal
e x
gen
re d
iver
sity
–.59
4*
(–
1.99
0)
L
og-l
ikel
ihoo
d–3
7432
3.44
0–3
7367
5.61
1–3
7378
2.72
2–3
7349
9.21
5–3
7346
6.79
7–3
7344
5.73
8C
hi2
6437
.017
7960
.990
7711
.736
8325
.125
8376
.814
8365
.011
AIC
7487
06.8
8074
7415
.223
7476
31.4
4474
7068
.430
7470
07.5
9374
6967
.476
Nu
mbe
r of
fai
lure
s36
,490
36,4
9036
,490
36,4
9036
,490
36,4
90N
(ac
tors
)97
,657
97,6
5797
,657
97,6
5797
,657
97,6
57N
(ac
tor-
film
obs
erva
tion
s)1,
072,
067
1,07
2,06
71,
072,
067
1,07
2,06
71,
072,
067
1,07
2,06
7
Not
e: C
ox p
rop
orti
onal
haz
ard
reg
ress
ion
s; t
sta
tist
ics
in p
aren
thes
es; r
obu
st s
tan
dar
d e
rror
s cl
ust
ered
by
acto
r id
; Bre
slow
met
hod
for
tie
d e
ven
ts.
* p <
.05;
** p
< .0
1; ***
p <
.001
(tw
o-ta
iled
tes
ts).
Tabl
e 2.
(co
nti
nu
ed)
at Max Planck Society on April 2, 2015asr.sagepub.comDownloaded from

Lutter 343
born in English-speaking countries face greater career hazards.
Models 2, 3, and 4 add the main predictors to the model. Model 2 enters the first set of predictors: familiarity and cohesion. Model 3 includes the second set (share of newcomers, niche width, and genre diversity). In Model 4, all main predictors are included together. These results show that interpersonal famili-arity reduces the likelihood of failure, whereas recurring cohesion considerably increases it. The diversity coefficients all point in the same direction and show negative signs. This means that chances for career survival increase if actors pursue their careers in open teams with greater genre diversity and a higher percentage of newcomers, and when they establish a broader genre portfolio.
How do these effects vary between female and male actors? Can women reduce their disadvantaged position through open network structures? Is there a female closure penalty? Models 5 and 6 specify interaction effects between the female dummy and the main predictors. The female dummy as well as the signs of the interaction terms support both hypotheses—a result that remains robust under different model specifications.8 Because of the interaction term, the main coefficient of the female dummy now refers to the case in which both interacted variables are zero. As seen in Model 5, if familiarity and cohesion are completely absent, the female dummy becomes insignificant. In that case, there is no difference in survival between the genders anymore. By contrast in Model 6, the coefficient of the female dummy increases as compared to the full model (Model 4). This coefficient refers to the case in which all diversity variables are zero. This means gen-der differences are large if a career has not been exposed to diversity.
To facilitate interpretation of the interac-tion effects, Figures 1 and 2 display the entire range of values of the interaction effects in a marginal effects plot.9 This allows us to exam-ine how and with what statistical precision the effect of the female dummy changes across the full range of the interacted predictors.
Figures 1 and 2 show point estimates of the model-based conditional marginal effects of the female dummy on the relative hazards of career failure, conditional on the values of the interacted predictor. All covariates are constant at their means. The figures also graph the upper and lower bounds of the 95 percent confidence interval (see the two dashed lines). The effects are significant when the y-zero line is outside the interval. If the effect is positive, this means women have lower survival chances than men. The dotted vertical reference lines on the x-axis display the 25th, 50th (the median), 75th, and 90th percentiles. This shows the distribution of the interacted predictor and tells to what extent the interaction matters, that is, to how many cases the interacted effect applies. As seen in the right panel of Figure 1, the differences in the likelihood of career survival between male and female actors clearly become stronger as the cohesion variable increases. Hypothesis 1 is well supported by the figure. At the same time, gender disadvantages are reduced with higher degrees of familiarity, after controlling for cohesion and all other variables in the model. Familiarity, as it turns out, is a measure of weak ties, once the mod-els control for cohesion. Figure 2 graphs the interaction effects of the diversity variables. Again, results strongly support Hypothesis 2. The differences between males and females in career survival become less strong as infor-mation diversity and team openness increase. The broader the niche width, the more new-comers in a team, and the greater a team’s genre diversity, the better the chances become for women, or, to put it differently, the more equal is career duration between males and females.
Figures 3 and 4 explore how men’s and women’s survivor functions change with dif-ferent levels of cohesion and diversity—again based on the full covariate model and includ-ing the interaction effects.10 Figure 3 com-pares men’s and women’s survival curves for the case of zero cohesion (i.e., complete absence of any cohesive team within an actor’s career) versus cohesion at average and
at Max Planck Society on April 2, 2015asr.sagepub.comDownloaded from

344 American Sociological Review 80(2)
-.6-.4
-.20
.2.4
Effe
cts
of th
e fe
mal
e du
mm
y on
car
eer f
ailu
re h
azar
d
0 .1 .2 .3 .4 .5 .6 .7 .8 .9 1Team familiarity (ln)
p25 p50 p75 p90
01
23
4E
ffect
s of
the
fem
ale
dum
my
on c
aree
r fai
lure
haz
ard
0 .5 1 1.5 2 2.5 3 3.5 4Recurring cohesion (ln)
p25 p50 p75 p90
Figure 1. Change of Female Effect with Increasing Familiarity and Cohesion; Model-Based Marginal Effects of the Female Dummy on the Risk of Career Failure (Based on Model 5), Conditional on Familiarity and CohesionNote: All covariates fixed at their means. Dashed curves: 95 percent confidence interval of female effect. Dotted vertical lines: 25th, 50th, 75th, and 90th percentile of interacted predictor.
one to three standard deviations above its mean. If cohesion is absent, there is virtually no difference between men’s and women’s career survival. If cohesion increases to val-ues above the average, gender differences start to grow. In the same way, Figure 4 com-pares scenarios for the three diversity varia-bles. In the case of high-diversity careers (all diversity measures one standard deviation above their means), there is no difference in survival between men and women. However, in careers moving from high to average to lower-than-average diversity, differences in career survival increase sharply.
These model-based scenarios offer sub-stantial evidence that the hypotheses hold for a majority of people. For instance, if cohesion takes the median value (see Figure 1, right panel)—that is, 50 percent of cases have cohesion values higher than the figure’s p-50 dotted reference line—differences in survival between men and women start to become
significant and steadily increase after that point. If cohesion increases to one standard deviation above the mean (applies to approxi-mately 25 percent of all cases), survival chances for women are constantly about 10 percent lower than for men. These scenarios also show that women can significantly reduce their failure hazards to a level indistin-guishable from men’s. About 25 percent of cases lie at or very close to zero, meaning an absence of or very little cohesion. For these cases, there is virtually no difference in drop-out hazards between men and women. In the same vein, Figure 4 shows that if diversity is as high as one standard deviation above the average, gender inequalities disappear (this is true in 20 to 30 percent of cases). In summary, if women build their careers within diversity structures that are slightly above the average or within team structures of low or absent recurring cohesion, they can significantly reduce their disadvantageous position:
at Max Planck Society on April 2, 2015asr.sagepub.comDownloaded from

Lutter 345
women’s survival rates then become essen-tially the same as men’s.
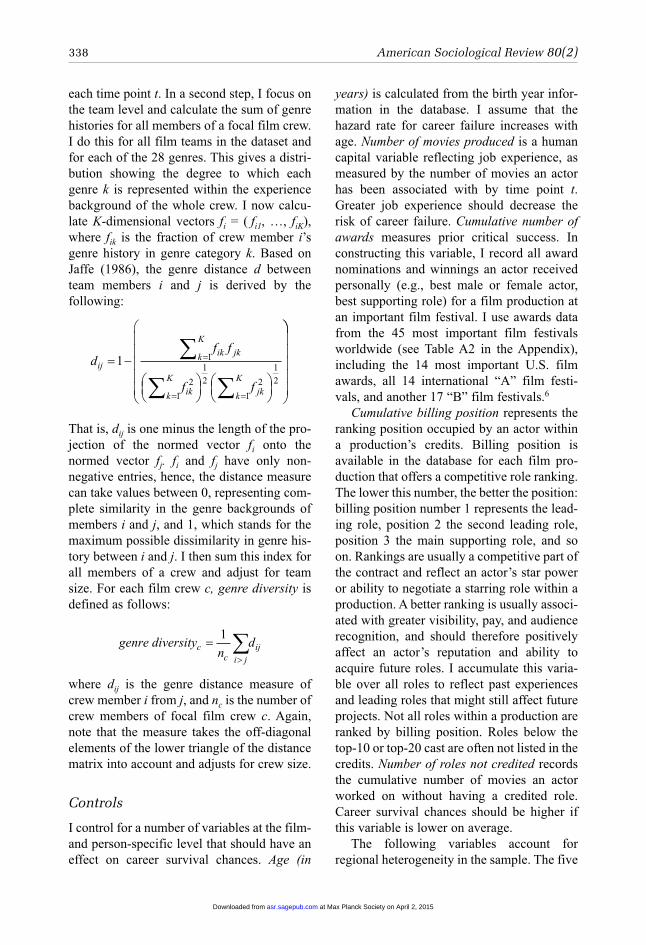
To further examine possible mechanisms that explain the female closure penalty, such as the role of poor mentorship, female penal-ties through male-dominated circles, and the role of high- versus low-status careers, Table 3 estimates additional models. Model 1 tests an interaction effect between the female dummy and the percentage of females among the team of producers and directors. Gender differences are high if the percentage of males in the team of producers and directors increases. This supports the assumption that women, as opposed to men, are probably at a greater disadvantage in building important mentorship ties to male sponsors. Model 2 tests whether gender differences in survival increase or decrease if a career moves through typically female or male genres.11 The nega-tive interaction coefficient indicates that
women have lower career prospects if they work in male-dominated genres, but they do better in female-dominated genres. This sug-gests that women are more able to develop beneficial contacts, probably of higher status, when they work in female environments. In both instances, the female-cohesion penalty remains significant (see the female-cohesion interaction in Model 4) but is slightly reduced (compare with Model 5 in Table 2). This sug-gests that at least part of the cohesion-penalty effect is captured through these mechanisms. However, the cohesion penalty remains a sig-nificant effect, suggesting that information penalties through dense network attachments do matter even if these mechanisms are taken into account. A further analysis compares high- and low-status careers (Models 5 and 6). Model 5 replicates the main results and the female-cohesion effect for actors who have zero awards throughout their careers (n =
-.4-.2
0.2
.4.6
Effe
cts
of th
e fe
mal
e du
mm
y on
car
eer f
ailu
re h
azar
d
0 .1 .2 .3 .4 .5 .6Share of newcomers (ln)
p25 p50 p75 p90
-.20
.2.4
.6.8
Effe
cts
of th
e fe
mal
e du
mm
y on
car
eer f
ailu
re h
azar
d
0 .5 1 1.5 2 2.5Niche width (ln)
p25 p50 p75 p90
0.5
11.
52
Effe
cts
of th
e fe
mal
e du
mm
y on
car
eer f
ailu
re h
azar
d0 .1 .2 .3 .4
Genre diversity (ln)
p25p50p75p90
Figure 2. Change of Female Effect with Increasing Diversity; Model-Based Marginal Effects of the Female Dummy on the Risk of Career Failure (Based on Model 6), Conditional on Diversity MeasuresNote: All covariates fixed at their means. Dashed curves: 95 percent confidence interval of female effect. Dotted vertical lines: 25th, 50th, 75th, and 90th percentile of interacted predictor.
at Max Planck Society on April 2, 2015asr.sagepub.comDownloaded from

346 American Sociological Review 80(2)
0.2
.4.6
.81
Pre
dict
ed s
urvi
val
0 20 40 60 80Career duration (years)
f: cohesion average (mean) m: cohesion average (mean)f: cohesion zero (min) m: cohesion zero (min)
0.2
.4.6
.81
Pre
dict
ed s
urvi
val
0 20 40 60 80Career duration (years)
f: cohesion high (m+1Stdv) m: cohesion high (m+1Stdv)f: cohesion zero (min) m: cohesion zero (min)
0.2
.4.6
.81
Pre
dict
ed s
urvi
val
0 20 40 60 80Career duration (years)
f: cohesion high (m+2Stdv) m: cohesion high (m+2Stdv)f: cohesion zero (min) m: cohesion zero (min)
0.2
.4.6
.81
Pre
dict
ed s
urvi
val
0 20 40 60 80Career duration (years)
f: cohesion high (m+3Stdv) m: cohesion high (m+3Stdv)f: cohesion zero (min) m: cohesion zero (min)
Figure 3. Career Survival for Men and Women Comparing Different Levels of Cohesion; Plotted Survivor Function after Model Estimation (Based on Model 5 of Table 2) for Male (m) and Female (f) Actors, Varying Different Levels of the Cohesion VariableNote: All covariates fixed at their means.
94,853), and Model 6 for actors with at least one award (n = 2,822). The female-cohesion penalty is especially strong in lower-status careers (Model 5) but insignificant in higher-status careers (Model 6). Again, this result supports the assumption that women suffer more than men from lower status, and that this mechanism could possibly contribute to explaining the female closure penalty.
CoNCLuSIoNSOn the basis of a large-scale, longitudinal career database consisting of full career pro-files of almost one hundred thousand film actors and covering more than one million film roles, this study analyzed how measures of cohesion, social capital, and information diversity moderate gender disadvantages in pursuing careers in film. Building on prior research, I argued that women likely suffer from cohesive social structures but can take advantage of less cohesive, weaker structures
that are more open with regard to job-relevant information flow. Results from career survival models confirm the proposed assumptions: gender disadvantages grow significantly with increases in team cohesion, but differences are reduced in careers that move through weaker social ties and have higher degrees of infor-mation diversity. If women pursue their careers in open and diverse network architec-tures, they can reduce their disadvantaged position and the risk of dropping out of the business to a level that is statistically indistin-guishable from the risk men run. The more open and diverse team structures become, the more gender equality can be expected in project-based career advancement.
The findings contribute to the literatures on gender inequality and networks in several ways. First, to the best of my knowledge, this study is the first to examine differential returns to men and women on their social capital based on large-scale longitudinal data, using sophisticated measures of network
at Max Planck Society on April 2, 2015asr.sagepub.comDownloaded from

Lutter 347
0.2
.4.6
.81
Pre
dict
ed s
urvi
val
0 20 40 60 80Career duration (years)
f: diversity high (m+1Stdv) m: diversity high (m+1Stdv)f: diversity average (mean) m: diversity average (mean)
0.2
.4.6
.81
Pre
dict
ed s
urvi
val
0 20 40 60 80Career duration (years)
f: diversity high (m+1Stdv) m: diversity high (m+1Stdv)f: diversity low (m-1Stdv) m: diversity low (m-1Stdv)
0.2
.4.6
.81
Pre
dict
ed s
urvi
val
0 20 40 60 80Career duration (years)
f: diversity high (m+1Stdv) m: diversity high (m+1Stdv)f: diversity low (m-2Stdv) m: diversity low (m-2Stdv)
0.2
.4.6
.81
Pre
dict
ed s
urvi
val
0 20 40 60 80Career duration (years)
f: diversity high (m+1Stdv) m: diversity high (m+1Stdv)f: diversity zero (min) m: diversity zero (min)
Figure 4. Career Survival for Men and Women Comparing Different Levels of Diversity; Plotted Survivor Function after Model Estimation (Based on Model 6 of Table 2) for Male (m) and Female (f) Actors, Varying Different Levels of the Three Diversity MeasuresNote: All covariates fixed at their means.
closure and diversity. In doing this, I explore a unique dataset covering a labor market in its entirety, including almost all products that have ever been produced in that market, all actors who have ever been involved in mak-ing these products, and their complete col-laboration networks. Seldom in sociological research has it been possible to gain insight into an almost complete social network struc-ture from a full population of labor market actors.
Second, prior research shows that women remain disadvantaged at the network periph-ery and need to “borrow” social capital through ties to important brokers (Burt 1998; Ibarra 1992). This study builds on these find-ings and argues that in the context of project-based labor markets, within which recruitment largely depends on informal ties, job-relevant information flow is generally low and redun-dant in cohesive structures, but high and vari-ous in diverse and open network structures. At the same time, cohesive networks tend to
exclude actors from relevant sources of infor-mation. As this study shows, if women attach themselves more often within cohesive teams, their likelihood for career failure becomes much higher than if men are attached to cohe-sive teams. The fact that women experience a greater failure hazard indicates they are at a greater job-relevant information disadvan-tage, which could point to possible male clo-sure tendencies occurring within cohesive teams. This is supported by the finding that women’s failure hazard increases if they work in teams with a higher percentage of males at the managerial level (directors and produc-ers). Moreover, women’s failure hazards also increase if they work in male-dominated film genres, and the female closure penalty is especially strong among low-status careers.
Therefore, while prior research argues that women could potentially benefit if they attach in dense, interconnected teams (Burt 1998), this study highlights the possibility of exclu-sion and information penalties, which are
at Max Planck Society on April 2, 2015asr.sagepub.comDownloaded from

348
Tabl
e 3.
Ad
dit
ion
al R
esu
lts:
Exp
lori
ng
the
Fem
ale
Clo
sure
Pen
alty
(1)
(2)
(3)
(4)
(5)
(6)
Fem
ale
.105
***
.076
***
.106
***
.055
**.0
15–.
090
(7
.996
)(6
.519
)(8
.101
)(3
.215
)(.
972)
(–.6
60)
Age
(ln
).1
08***
.107
***
.105
***
.106
***
.078
***
.507
(6
.192
)(6
.176
)(6
.058
)(6
.093
)(4
.618
)(1
.341
)N
um
ber
of m
ovie
s p
rod
uce
d (
ln)
–.34
7***
–.34
4***
–.34
5***
–.34
6***
–.31
4***
–.96
0***
(–
14.2
51)
(–14
.124
)(–
14.1
37)
(–14
.193
)(–
12.8
44)
(–3.
403)
Cu
mu
lati
ve n
um
ber
of a
war
ds
(ln
)–.
943***
–.94
4***
–.94
3***
–.94
2***
(–22
.612
)(–
22.6
62)
(–22
.598
)(–
22.5
59)
C
um
ula
tive
bil
lin
g p
osit
ion
(ln
).0
81***
.077
***
.081
***
.081
***
.070
***
.056
(1
5.56
5)(1
5.01
1)(1
5.56
5)(1
5.67
6)(1
3.54
5)(.
751)
Nu
mbe
r of
rol
es n
ot c
red
ited
(ln
).1
90***
.188
***
.189
***
.192
***
.168
***
–.16
4
(17.
056)
(16.
831)
(16.
989)
(17.
243)
(14.
845)
(–1.
864)
Ori
gin
US
A.0
46***
.043
**.0
45**
.043
**.0
46***
.127
(3
.318
)(3
.059
)(3
.195
)(3
.084
)(3
.309
)(.
965)
Ori
gin
UK
.115
***
.123
***
.118
***
.117
***
.112
***
–.05
4
(4.6
26)
(4.9
48)
(4.7
49)
(4.6
96)
(4.4
83)
(–.2
01)
Ori
gin
Ger
man
y.0
17.0
31.0
17.0
16.0
43–.
025
(.
384)
(.69
3)(.
378)
(.36
7)(.
965)
(–.0
92)
Ori
gin
Fra
nce
.090
.103
*.0
88.0
89.1
13*
–.29
5
(1.9
31)
(2.2
14)
(1.8
94)
(1.9
21)
(2.4
12)
(–.7
71)
Ori
gin
Ita
ly–.
027
–.02
1–.
026
–.02
5–.
011
–.15
0
(–.5
47)
(–.4
20)
(–.5
38)
(–.5
14)
(–.2
10)
(–.4
20)
Tit
les
in E
ngl
ish
(ln
)–.
090***
–.10
0***
–.09
1***
–.09
0***
–.09
0***
.012
(–
4.85
5)(–
5.37
8)(–
4.92
0)(–
4.85
0)(–
4.83
3)(.
082)
Tit
les
in G
erm
an (
ln)
.121
***
.131
***
.121
***
.122
***
.122
***
.285
***
(7
.819
)(8
.462
)(7
.840
)(7
.870
)(7
.727
)(3
.600
)T
itle
s in
Fre
nch
(ln
)–.
071***
–.06
9***
–.07
0***
–.07
1***
–.06
2***
–.36
4***
(–
4.40
1)(–
4.29
0)(–
4.33
5)(–
4.38
2)(–
3.82
2)(–
3.97
0)T
itle
s in
Ita
lian
(ln
)–.
149***
–.15
0***
–.14
9***
–.14
9***
–.14
3***
–.05
9
(–7.
680)
(–7.
720)
(–7.
662)
(–7.
626)
(–7.
165)
(–.5
95)
(con
tin
ued
)
at Max Planck Society on April 2, 2015asr.sagepub.comDownloaded from
349
(1)
(2)
(3)
(4)
(5)
(6)
Pro
du
ctio
ns
US
A (
ln)
.541
***
.531
***
.539
***
.539
***
.533
***
.054
(3
2.49
3)(3
1.68
2)(3
2.39
9)(3
2.41
9)(3
1.75
3)(.
425)
Pro
du
ctio
ns
Ger
man
y (l
n)
–.27
1***
–.31
6***
–.27
1***
–.27
1***
–.31
3***
–.33
3**
(–
10.2
41)
(–11
.646
)(–
10.2
36)
(–10
.248
)(–
11.0
24)
(–3.
198)
Pro
du
ctio
ns
Fra
nce
(ln
)–.
057**
–.07
8***
–.05
7**
–.05
6**
–.07
3***
–.06
2
(–2.
704)
(–3.
738)
(–2.
691)
(–2.
657)
(–3.
401)
(–.6
31)
Pro
du
ctio
ns
Ital
y (l
n)
.244
***
.249
***
.243
***
.242
***
.235
***
.248
*
(1
0.52
8)(1
0.72
2)(1
0.49
3)(1
0.43
8)(9
.857
)(2
.301
)H
as b
een
pro
du
cer
(ln
)–.
381***
–.38
8***
–.38
0***
–.38
3***
–.39
7***
–.22
1
(–12
.325
)(–
12.5
70)
(–12
.304
)(–
12.3
62)
(–12
.283
)(–
1.79
6)H
as b
een
dir
ecto
r (l
n)
.007
.004
.007
.010
.009
.091
(.
385)
(.24
0)(.
413)
(.55
0)(.
525)
(.84
9)M
ajor
tit
les
(ln
)–.
224***
–.20
0***
–.22
6***
–.22
6***
–.20
5***
.451
(–
12.4
31)
(–11
.007
)(–
12.5
36)
(–12
.527
)(–
11.2
63)
(1.9
59)
Seq
uel
s (l
n)
–.18
1***
–.18
9***
–.18
2***
–.18
1***
–.19
5***
–.11
8
(–13
.260
)(–
13.8
23)
(–13
.280
)(–
13.2
05)
(–14
.048
)(–
1.52
0)N
ovel
s (l
n)
.137
***
.152
***
.140
***
.138
***
.154
***
.318
**
(1
1.42
3)(1
2.69
9)(1
1.60
1)(1
1.50
5)(1
2.79
7)(3
.250
)C
rew
siz
e (l
n)
–.01
3–.
015
–.01
3–.
014
–.01
9*–.
028
(–
1.51
7)(–
1.70
7)(–
1.48
0)(–
1.57
2)(–
2.14
0)(–
.374
)G
enre
: th
rill
er/c
rim
e–.
041***
–.04
6***
–.05
7***
–.05
6***
–.02
5***
–.00
3
(–7.
549)
(–6.
592)
(–8.
145)
(–8.
042)
(–4.
597)
(–.0
56)
Gen
re: f
amil
y/ad
ven
ture
/com
edy
.018
**.0
12.0
00.0
01.0
35***
–.03
8
(3.0
46)
(1.5
91)
(.03
7)(.
083)
(6.0
70)
(–.6
83)
Gen
re: a
ctio
n/a
dve
ntu
re/W
este
rn–.
002
–.02
6***
–.02
1**
–.02
1**
–.00
1.0
08
(–.4
10)
(–3.
854)
(–3.
048)
(–3.
054)
(–.2
35)
(.19
9)G
enre
: dra
ma/
rom
ance
/his
tory
.090
***
.102
***
.089
***
.090
***
.112
***
–.18
8***
(1
3.85
2)(1
5.55
7)(1
3.64
6)(1
3.74
7)(1
7.08
3)(–
3.61
4)P
erso
n p
er m
ovie
rat
io.0
65***
.061
***
.065
***
.065
***
.063
***
.101
***
(3
5.81
3)(3
3.54
0)(3
5.79
3)(3
5.84
0)(3
4.39
7)(6
.964
)Te
am f
amil
iari
ty (
ln)
–.45
4***
–.49
6***
–.45
4***
–.28
6***
–.32
2***
.156
(–
6.39
9)(–
7.01
8)(–
6.35
3)(–
3.85
5)(–
4.33
0)(.
282)
Rec
urr
ing
coh
esio
n (
ln)
.315
***
.346
***
.310
***
.263
***
.287
***
.492
**
(1
9.30
8)(2
1.14
6)(1
8.92
4)(1
4.94
0)(1
6.32
2)(3
.272
)
Tabl
e 3.
(co
nti
nu
ed)
(con
tin
ued
)
at Max Planck Society on April 2, 2015asr.sagepub.comDownloaded from

350
(1)
(2)
(3)
(4)
(5)
(6)
Sh
are
of n
ewco
mer
s (l
n)
–.77
8***
–.90
2***
–.76
4***
–.75
9***
–.90
8***
–.91
3
(–11
.688
)(–
13.5
69)
(–11
.469
)(–
11.3
89)
(–13
.604
)(–
1.70
4)N
ich
e w
idth
(ln
)–.
176***
–.19
7***
–.16
0***
–.16
3***
–.21
7***
–.29
7
(–7.
833)
(–8.
582)
(–7.
005)
(–7.
112)
(–9.
621)
(–1.
429)
Gen
re d
iver
sity
(ln
)–2
.958
***
–3.1
70***
–2.9
28***
–2.9
11***
–3.1
17***
–3.2
21
(–17
.469
)(–
18.7
65)
(–17
.262
)(–
17.1
56)
(–18
.411
)(–
1.88
2)F
emal
e x
fam
ilia
rity
–.56
3***
–.59
2***
–2.0
04
(–3.
627)
(–3.
900)
(–1.
460)
Fem
ale
x co
hes
ion
.152
***
.196
***
–.01
4
(5.6
13)
(7.4
76)
(–.0
54)
Per
cen
t fe
mal
es d
irec
tors
/pro
du
cers
–.01
2***
–.01
2***
–.01
2***
(–24
.440
)(–
24.4
55)
(–24
.804
)
Fem
ale
x p
erce
nt
fem
ales
dir
ecto
rs/p
rod
uce
rs–.
002**
–.00
2*–.
001
(–2.
756)
(–2.
569)
(–1.
518)
F
emal
e ge
nre
–.23
5**
–.17
4*–.
192**
(–3.
190)
(–2.
374)
(–2.
611)
F
emal
e x
fem
ale
gen
re–.
363***
–.32
9***
–.28
1***
(–4.
338)
(–3.
879)
(–3.
297)
L
og-l
ikel
ihoo
d–3
7284
9.87
0–3
7347
9.43
8–3
7283
5.85
4–3
7281
6.18
5–3
6733
0.99
2–3
115.
250
Ch
i295
55.0
7383
71.4
3995
76.9
5696
00.9
1278
39.0
7128
4.52
8A
IC74
5773
.740
7470
32.8
7674
5749
.708
7457
14.3
7073
4733
.985
6302
.500
Nu
mbe
r of
fai
lure
s36
,490
36,4
9036
,490
36,4
9035
,993
497
N (
acto
rs)
97,6
5797
,657
97,6
5797
,657
94,8
352,
822
N (
acto
r-fi
lm o
bser
vati
ons)
1,07
2,06
71,
072,
067
1,07
2,06
71,
072,
067
980,
519
91,5
48
Not
e: C
ox p
rop
orti
onal
haz
ard
reg
ress
ion
s; t
sta
tist
ics
in p
aren
thes
es; r
obu
st s
tan
dar
d e
rror
s cl
ust
ered
by
acto
r id
; Bre
slow
met
hod
for
tie
d e
ven
ts.
* p <
.05;
** p
< .0
1; ***
p <
.001
(tw
o-ta
iled
tes
ts).
Tabl
e 3.
(co
nti
nu
ed)
at Max Planck Society on April 2, 2015asr.sagepub.comDownloaded from

Lutter 351
likely to occur in cohesive team structures, and which are more detrimental for women than for men. Hence, this study moves beyond existing knowledge and advances our under-standing of how social capital and network structures shape career trajectories differently for men and women.
Moreover, prior research draws conclu-sions largely from cross-sectional datasets, which poses problems for causal reasoning. In a cross-sectional context, it is not clear whether, for instance, certain network struc-tures in which people are embedded are the cause or the effect of career success or failure. This study echoes Mouw’s (2006) call to more rigorously estimate the causality of net-work effects by using panel data research designs. Yet, one might argue that the pro-posed network causality is reversed. Women’s careers might suffer more from being type-cast (Zuckerman et. al 2003), leading to cohe-sive but less successful project teams, which in turn reduces career survival. However, the results presented here are robust to this pos-sible scenario, because the models control for genre, genre spanning, prior success, and other career-relevant factors. The coefficients of this study robustly show that if women have been attached to cohesive teams in their past productions—controlling for their past success and genre identity—their chances for future roles decrease, which substantially reduces their career longevity.
An important further contribution lies in the fact that this study shows how inequalities are being reduced. While there is much research on what factors cause increasing gender inequalities, research on how inequal-ities disappear is still underdeveloped. Kalev (2009) is important in this respect: it shows that the organization of labor in diverse, cross-functional teams—as opposed to classi-cal bureaucratic work hierarchies—generally has great potential to improve women’s visi-bility, and hence reduce gender differences in career success. By focusing on a pure project and team-based labor market, this article sig-nificantly adds to this research by showing under exactly what conditions existing (and persisting) gender inequalities diminish or
even disappear within team-organized labor. I show that it is not the mere fact that labor is organized in teams, but how teams are socially composed and structured, that is important. This study reveals that exposure to broad and diverse social ties, different cultural genre backgrounds, and different conventional standards are especially beneficial factors for women. This finding might also carry practi-cal consequences for team design or optimal career choices for women, and further explor-ing exactly why diversity has these beneficial effects can provide a launching pad for future case-study research.
In addition, the way different mechanisms of inequality interact with each other has rarely been studied. Does the simultaneous effect of two or more mechanisms of inequal-ity lessen or intensify the severity of inequal-ity, and if so, how? As a consequence, cumulative or conditional effects of inequal-ity are poorly understood. By analyzing inter-action effects on individual career data, this study heeds the call to more seriously study the conditional nature of inequality (DiPrete and Eirich 2006). This study asked whether different network structures interact with gen-der inequalities, and future research could analyze whether cumulative advantages reward males or females differently in cohe-sive or diverse network structures. Given the results of this study, how do networks and cumulative advantages interact with gender inequalities? In other words, does the Mat-thew effect cancel out the negative effects of cohesion for women? Or does it intensify inequalities caused by network closure?
This study focuses on careers in which gender disadvantages do not result from direct competition between males and females—male and female jobs are mostly predefined with a film’s script—but rather from disadvantages at an aggregate level. The sociological causes of these disadvantages lie beyond the scope of this study. Gender disad-vantages might be induced through processes of allocative discrimination (Petersen and Saporta 2004), motherhood penalties, or dis-crimination based on ascriptive rather than meritocratic judgments. Differences in careers
at Max Planck Society on April 2, 2015asr.sagepub.comDownloaded from
352 American Sociological Review 80(2)
between males and females might also be induced through self-chosen changes in per-sonal preference structures, yielding different human capital investments across genders (Becker 1975). Instead, this study shows how observed career inequalities between males and females decrease or increase through dif-ferent forms of network embeddedness. In doing this, I show that careers in cohesive networks can be a “double jeopardy” (Lin-coln and Allen 2004) for women who already face labor market disadvantages.
One potential limitation of this study comes from the fact that the dataset does not contain roles other than those in film productions. Would the results have been different had I included roles in TV or theater productions? Or, in the project-based labor markets for TV and theater, would the same network mecha-nisms apply? If the same mechanisms are pre-sent, including those roles would not alter the results. At the same time, omission of these data creates an opportunity for future research to replicate and analyze the findings presented here in these related labor markets. I also leave it to future case-study research to see whether certain external shocks for which I do not have data—such as big box-office failures, personal troubles (e.g., drug abuse), marriage, having children, or getting divorced—affect male and female careers differently. Again, the study’s design assumes that these single events are randomly distributed across the genders and do not affect men’s and women’s career trajecto-ries differently.
Another limitation might be that the net-work measures used here do not accurately reflect acquaintanceship or even friendship, and hence might not accurately measure whether job-relevant information flows. This is not solely a problem of this study, but a problem for all studies using affiliation or co-working data (Borgatti and Halgin 2011). I believe, however, that this is a minor issue. The study’s measures rely on the assumption that co-workers who have been affiliated with a project at least know each other, which is a condition for job-relevant information flow. This is reasonable because film crews often stay together on a set for weeks, sometimes
months, often working extensive 12-hour shifts or more, and living on the same site (Grugulis and Stoyanova 2012; Jones 1996). Bechky (2006) calls this a Goffman-type “total institution” (Goffman 1961), in which intense social ties are established. Moreover, affiliation data is task- and work-related net-work data and thus directly relevant to career advancement. One can easily assume that job-relevant information flows first and foremost through these collaboration networks. Future research, however, could try to replicate these results using different network measures, such as calculating centrality scores on an actor-by-actor matrix and comparing these scores for men versus women.
Finally, the specific empirical setting of the study, an artistic labor market, might limit the extent to which generalities can be drawn. However, I believe the findings can be gener-alized beyond this cultural industry and expanded to other flexible, project-based labor markets. Examples could be the labor market for managers, architects, journalists, designers, academics, or any other innovation industry operating within firm- or discipline-spanning teams and networks, such as fast-changing high-tech areas or start-ups in biotechnology (Powell, Koput, and Smith-Doerr 1996). Moreover, I believe the empiri-cal setting is important on a much broader scale. The economy as a whole is experienc-ing a shift from hierarchical to network-based organization of labor, and from physical labor or administrative work to creative, knowledge-oriented tasks (Boltanski and Chiapello 2005; Castells 1996). At the same time, career tra-jectories are shifting from internal promotion and life-long employment within a single company to flexible careers moving through open organizations in a growing boundaryless economy (Arthur and Rousseau 1996).
Future research could and should try to apply the indicators used here to other labor markets. This would not only prove and vali-date the findings presented here, but would contribute to an advanced understanding of how inequalities emerge, why they intensify, and most importantly, under what conditions inequalities disappear.
at Max Planck Society on April 2, 2015asr.sagepub.comDownloaded from

Lutter 353
APPENDIx
Table A1. Rotated Factor Loadings and Unique Variances, from Principal Component Factor Analysis
Genre
Factor 1 Factor 2 Factor 3 Factor 4
UniquenessThriller/
Crime
Family/Adventure/
Comedy
Action/Adventure/
Western
Drama/Romance/
History
Short –.3365 .7626Drama .7106 .4466Comedy –.5792 .5295Romance .3886 .7658Action .5413 .5851Animation .5289 .7039Thriller .6741 .5137Family .6406 .5704Crime .5547 .6134Adventure .5193 .4661 .5102Music .9357Horror .3881 –.3283 .7309Fantasy .5506 .6872Mystery .5278 .7197Sci-fi –.3157 .7256Western .3326 .764Musical .8559Biography .7945Sport .9651War .3311 .3173 .7526History .4021 .6928Film noir .8486Adult .9873Reality .9997News .993Game show .9991Documentary .7924Talk show .9993Factor
eigenvalue1.979 1.814 1.592 1.371
Note: Blanks represent factor loadings < .3.
at Max Planck Society on April 2, 2015asr.sagepub.comDownloaded from

354 American Sociological Review 80(2)
AcknowledgmentsI would like to thank the four anonymous ASR reviewers and the ASR editors for their constructive comments. The article also greatly benefited from discussions and presen-tations at several workshops, seminars, and conferences, including the 2014 Annual Meeting of the American Socio-logical Association in San Francisco, the 2014 EGOS Col-loquium in Rotterdam, the 2013 Congress of the Swiss Sociological Association in Bern, and the 2013 MaxPo/SciencePo SCOOPS colloquium in Paris. I appreciate help-ful comments on this project by Annina Aßmann, Jens Beckert, Frank Dobbin, Juan J. Férnandez, Mark Granovet-ter, Olivier Godechot, Uwe Gotzes, Emmanuel Lazega, Siegwart M. Lindenberg, Isabella Reichert, Martin Schröder, David Stark, Richard Swedberg, and Jörg Sydow.
Notes 1. The combination of both types of social capital is an
important feature for team success, especially for cre-ative teams. Referring to this structure as “network complementarity,” Uzzi (1999:491) concludes that the simultaneous mixture between diverse sets of ties and cohesion bolsters mutual benefits among team
members and ultimately increases team performance. Creative teams need a certain degree of cohesion to facilitate trust, but too much cohesion carries creative restrictions, resulting in less innovative outcomes (de Vaan, Vedres, and Stark forthcoming; Perretti and Negro 2007; Reagans and Zuckerman 2001; Stark 2009; Uzzi and Spiro 2005; Vedres and Stark 2010).
2. These raw data are accessible at (ftp://ftp.fu-berlin .de/pub/misc/movies/database/). Data and replication material for this article are available at (http://www.mpifg.de/projects/wta).
3. I had included the early years in a previous version of this study. The results were essentially the same but less pronounced than in this version. In addition, I repeated the analysis starting in 1949, to account for the beginning of Hollywood’s post-studio era. The results remain the same as those presented here (see Table S1 in the online supplement [http://asr .sagepub.com/supplemental]).
4. This naturally includes actors who died. I assume that the event of death is randomly distributed across genders and should not affect the results.
5. I repeated the analysis using a less conservative time frame of five years. The results did not differ from those presented here (available upon request).
Table A2. List of Awards Used for This Study
U.S. Awards International “A” Festivals International “B” Festivals
Academy AwardsBroadcast Film Critics
Association AwardsDirectors Guild of America
AwardsGolden Globe AwardsIndependent Spirit AwardsLaurel AwardsLos Angeles Film Critics
Association AwardsMTV Movie AwardsNational Board of Review
AwardsNational Society of Film Critics
AwardsNew York Film Critics Circle
AwardsPeople’s Choice AwardsScreen Actors Guild AwardsWriters Guild of America
Awards
Berlin International Film Festival
European Film AwardsGerman Film AwardsGhent International Film
FestivalLondon Critics Circle Film
AwardsLondon Film FestivalMiami International Film
FestivalMonaco International Film
FestivalMoondance International Film
FestivalMunich Film FestivalNorwegian International Film
FestivalSarajevo Film FestivalSeattle International Film
FestivalThessaloniki Film FestivalToronto International Film
FestivalUndine Awards, AustriaVienna International Film
FestivalZurich Film Festival
Cairo International Film Festival
Cannes Film FestivalInternational Film Festival of
IndiaKarlovy Vary International Film
FestivalLocarno International Film
FestivalMar del Plata Film FestivalMontreal World Film FestivalMoscow International Film
FestivalSan Sebastian International
Film FestivalShanghai International Film
FestivalTokyo International Film
FestivalVenice Film FestivalWarsaw International Film
Festival
at Max Planck Society on April 2, 2015asr.sagepub.comDownloaded from

Lutter 355
6. The number of awards is a measure of artistic repu-tation. I believe the multidimensional concept of reputation is best measured by accounting for a full variety of awards, as in this approach. How-ever, results do not change if I use different sets of awards (such as U.S. awards only, or “A” fes-tivals only, see Tables S2 and S3 in the online supplement).
7. For all variables that have a zero value, I add the constant 1 to enable taking the natural logarithm.
8. Table S4 (in the online supplement) tests the robust-ness and time sensitivity of the results. In particular, I use discrete-time estimations using probit regres-sions with different specifications of time (qua-dratic and cubic polynomials in Models 1 through 4), as suggested by Carter and Signorino (2010). Models 5 and 6 specify a complementary log-log regression (e.g., as used by Dobbin, Kim, and Kalev 2011). The results remain unaffected under these different model specifications.
9. I produced the figures using the commands margins and marginsplot in Stata 13.
10. I created the figures using Stata’s postestimation command stcurve after stcox.
11. The female genre variable measures the extent to which a certain film genre is dominated by males or females. The variable is an additive index of weighted genre dummies, weighted by their cor-relation with the percentage of females within each production. Higher values indicate female- dominated genres (typically comedy, drama, and family); lower values indicate male-dominated genres (typically action, adventure, and war).
referencesAccominotti, Fabien. 2009. “Creativity from Interaction:
Artistic Movements and the Creativity Careers of Modern Painters.” Poetics 37(3):267–94.
Adler, Paul S., and Seok-Woo Kwon. 2002. “Social Capi-tal: Prospects for a New Concept.” Academy of Man-agement Review 27(1):17–40.
Arthur, Michael B., and Denise M. Rousseau, eds. 1996. The Boundaryless Career: A New Employment Principle for a New Organizational Era. Oxford, UK: Oxford University Press.
Baker, Wayne E., and Robert R. Faulkner. 1991. “Role as Resource in the Hollywood Film Industry.” American Journal of Sociology 97(2):279–309.
Bechky, Beth A. 2006. “Gaffers, Gofers, and Grips: Role-Based Coordination in Temporary Organizations.” Organization Science 17(1):3–21.
Becker, Gary. 1975. Human Capital. New York: National Bureau of Economic Research.
Becker, Howard S. 1982. Art Worlds. Berkeley: Univer-sity of California Press.
Bielby, Denise D., and William T. Bielby. 1996. “Women and Men in Film: Gender Inequality among Writers in a Culture Industry.” Gender and Society 10(3):248–70.
Bielby, William T., and James N. Baron. 1986. “Men and Women at Work: Sex Segregation and Statisti-cal Discrimination.” American Journal of Sociology 91(4):759–99.
Bielby, William T., and Denise D. Bielby. 1992. “Cumu-lative versus Continuous Disadvantage in an Unstruc-tured Labor Market: Gender Differences in the Careers of Television Writers.” Work and Occupa-tions 19(4):366–86.
Bielby, William T., and Denise D. Bielby. 1999. “Organi-zational Mediation of Project-Based Labor Markets: Talent Agencies and the Careers of Screenwriters.” American Sociological Review 64(1):64–85.
Blair, Helen. 2009. “Active Networking: Action, Social Structure and the Process of Networking.” Pp. 116–34 in Creative Labour: Working in the Creative Industries, edited by A. McKinlay and C. Smith. Bas-ingstoke, Hampshire: Palgrave Macmillan.
Boltanski, Luc, and Eve Chiapello. 2005. The New Spirit of Capitalism. London: Verso.
Borgatti, Stephen P., and Daniel S. Halgin. 2011. “Ana-lyzing Affiliation Networks.” Pp. 417–33 in The Sage Handbook of Social Network Analysis, edited by P. J. Carrington and J. G. Scott. London: Sage.
Bourdieu, Pierre. 1984. Distinction: A Social Critique of the Judgement of Taste. Cambridge, MA: Harvard University Press.
Brass, Daniel J. 1985. “Men’s and Women’s Networks: A Study of Interaction Patterns and Influence in an Organization.” Academy of Management Journal 28(2):327–43.
Burt, Ronald S. 1992. Structural Holes: The Social Struc-ture of Competition. Cambridge, MA: Harvard Uni-versity Press.
Burt, Ronald S. 1997. “The Contingent Value of Social Capital.” Administrative Science Quarterly 42(2):339–65.
Burt, Ronald S. 1998. “The Gender of Social Capital.” Rationality and Society 10(1):5–46.
Burt, Ronald S. 2000. “The Network Structure of Social Cap-ital.” Research in Organizational Behavior 22:345–423.
Burt, Ronald S. 2004. “Structural Holes and Good Ideas.” American Journal of Sociology 110(2):349–99.
Cabrera, Susan F., and Melissa C. Thomas-Hunt. 2007. “‘Street Cred’ and the Executive Woman: The Effects of Gender Differences in Social Networks on Career Advancement.” Cornell University (http://scholar ship.sha.cornell.edu/articles/371).
Carter, David B., and Curtis S. Signorino. 2010. “Back to the Future: Modeling Time Dependence in Binary Data.” Political Analysis 18(3):271–92.
Castells, Manuel. 1996. The Rise of Network Society. Cambridge, MA: Blackwell.
Castilla, Emilio J., George J. Lan, and Ben A. Rissing. 2013a. “Social Networks and Employment: Mecha-nisms (Part 1).” Sociology Compass 7(12):999–1012.
Castilla, Emilio J., George J. Lan, and Ben A. Rissing. 2013b. “Social Networks and Employment: Out-comes (Part 2).” Sociology Compass 7(12):1013–26.
at Max Planck Society on April 2, 2015asr.sagepub.comDownloaded from

356 American Sociological Review 80(2)
Cattani, Gino, and Simone Ferriani. 2008. “A Core/Periphery Perspective on Individual Creative Per-formance: Social Networks and Cinematic Achieve-ments in the Hollywood Film Industry.” Organization Science 19(6):824–44.
Cattani, Gino, Simone Ferriani, and Paul D. Allison. 2014. “Insiders, Outsiders, and the Struggle for Consecra-tion in Cultural Fields: A Core-Periphery Perspec-tive.” American Sociological Review 79(2):258–81.
Christopherson, Susan. 2009. “Working in the Creative Economy: Risk, Adaption, and the Persistence of Exclusionary Networks.” Pp. 72–90 in Creative Labour: Working in the Creative Industries, edited by A. McKinlay and C. Smith. Basingstoke, Hampshire: Palgrave Macmillan.
Cleves, Mario A., William W. Gould, and Roberto G. Gutierrez. 2004. An Introduction To Survival Analysis Using Stata. College Station, TX: Stata Press.
Coleman, James S. 1988. “Social Capital in the Creation of Human Capital.” American Journal of Sociology 94:95–121.
de Vaan, Mathijs, Balázs Vedres, and David Stark. 2011. “Disruptive Diversity and Recurring Cohesion: Assembling Creative Teams in the Video Game Indus-try, 1979–2009.” Working Paper, Center on Organi-zational Innovation, Columbia University, New York.
de Vaan, Mathijs, Balázs Vedres, and David Stark. Forth-coming. “Game Changer: The Topology of Creativ-ity.” American Journal of Sociology.
DiMaggio, Paul, and Filiz Garip. 2012. “Network Effects and Social Inequality.” Annual Review of Sociology 38:93–118.
DiPrete, Thomas A., and Gregory M. Eirich. 2006. “Cumulative Advantage as a Mechanism for Inequal-ity: A Review of Theoretical and Empirical Develop-ments.” Annual Review of Sociology 32:271–97.
Dobbin, Frank, Soohan Kim, and Alexandra Kalev. 2011. “You Can’t Always Get What You Need: Organiza-tional Determinants of Diversity Programs.” Ameri-can Sociological Review 76(3):386–411.
Faulkner, Robert R. 1983. Music on Demand: Compos-ers and Careers in the Hollywood Film Industry. New Brunswick, NJ: Transaction Publishers.
Faulkner, Robert R., and Andy B. Anderson. 1987. “Short-Term Projects and Emergent Careers: Evi-dence from Hollywood.” American Journal of Soci-ology 92(4):879–909.
Fernandez, Roberto M., Emilio Castilla, and Paul Moore. 2000. “Social Capital at Work: Networks and Employment at a Phone Center.” American Journal of Sociology 105(5):1288–1356.
Fernandez, Roberto M., and Lourdes Sosa. 2005. “Gender-ing the Job: Networks and Recruitment at a Call Cen-ter.” American Journal of Sociology 111(3):859–904.
Fernandez-Mateo, Isabel. 2009. “Cumulative Gender Disadvantage in Contract Employment.” American Journal of Sociology 114(4):871–923.
Ferriani, Simone, Gino Cattani, and Charles Baden-Fuller. 2009. “The Relational Antecedents of
Project-Entrepreneurship: Network Centrality, Team Composition and Project Performance.” Research Policy 38(10):1545–58.
Freeman, Linton C. 1977. “A Set of Measures of Central-ity Based on Betweenness.” Sociometry 40(1):35–41.
Gabbay, Shaul M., and Ezra W. Zuckerman. 1998. “Social Capital and Opportunity in Corporate R&D: The Con-tingent Effect of Contact Density on Mobility Expec-tations.” Social Science Research 27(2):189–217.
Gargiulo, Martin, and Mario Benassi. 1999. “The Dark Side of Social Capital.” Pp. 298–322 in Corporate Social Capital and Liability, edited by R. T. A. J. Leenders and S. M. Gabbay. Norwell, MA: Kluver.
Giuffre, Katherine. 1999. “Sandpiles of Opportunity: Success in the Art World.” Social Forces 77(3):815–32.
Giuffre, Katherine. 2010. “Half the Right People: Net-work Density and Creativity.” Culture Unbound 2:819–46.
Godechot, Olivier, and Nicolas Mariot. 2004. “Les Deux Formes du Capital Social: Structure Relationnelle des Jurys de Thèses et Recrutement en Science Poli-tique.” Revue Française de Sociologie 45(2):243–82.
Goffman, Erving. 1961. Asylums: Essays on the Social Situation of Mental Patients and Other Inmates. New York: Doubleday.
Granovetter, Mark S. 1973. “The Strength of Weak Ties.” American Journal of Sociology 78(6):1360–80.
Granovetter, Mark S. 1995. Getting a Job: A Study of Contacts and Careers. Chicago: University of Chi-cago Press.
Groysberg, Boris. 2010. Chasing Stars: The Myth of Tal-ent and the Portability of Performance. Princeton, NJ: Princeton University Press.
Grugulis, Irena, and Dimitrinka Stoyanova. 2012. “Social Capital and Networks in Film and TV: Jobs for the Boys?” Organization Studies 33(10):1311–31.
Grund, Thomas U. 2012. “Network Structure and Team Performance: The Case of English Premier League Soccer Teams.” Social Networks 34(4):682–90.
Hsu, Greta. 2006. “Jacks of All Trades and Masters of None: Audiences’ Reactions to Spanning Genres in Feature Film Production.” Administrative Science Quarterly 51(3):420–50.
Ibarra, Herminia. 1992. “Homophily and Differential Returns: Sex Differences in Network Structure and Access in an Advertising Firm.” Administrative Sci-ence Quarterly 37(3):422–47.
Ibarra, Herminia. 1993. “Personal Networks of Women and Minorities in Management: A Conceptual Frame-work.” Academy of Management Review 18(1):56–87.
Ibarra, Herminia. 1997. “Paving an Alternative Route: Gender Differences in Managerial Networks.” Social Psychology Quarterly 60(1):91–102.
Inkpen, Andrew C., and Eric W. K. Tsang. 2005. “Social Capital, Networks, and Knowledge Transfer.” Acad-emy of Management Review 30(1):146–65.
Jaffe, Adam B. 1986. “Technological Opportunity and Spillovers of R & D: Evidence from Firms’ Patents,
at Max Planck Society on April 2, 2015asr.sagepub.comDownloaded from
Lutter 357
Profits, and Market Value.” American Economic Review 76(5):984–1001.
Jones, Candace. 1996. “Careers in Project Networks: The Case of the Film Industry.” Pp. 58–75 in The Bound-aryless Career: A New Employment Principle for a New Organizational Era, edited by M. B. Arthur and D. M. Rousseau. Oxford: Oxford University Press.
Kalev, Alexandra. 2009. “Cracking the Glass Cages? Restructuring and Ascriptive Inequality at Work.” American Journal of Sociology 114(6):1591–1643.
Levy, Emanuel. 1989. “The Democratic Elite: America’s Movie Stars.” Qualitative Sociology 12(1):29–54.
Lin, Nan. 1999. “Social Networks and Status Attain-ment.” Annual Review of Sociology 25:467–87.
Lin, Nan. 2001. Social Capital: A Theory of Social Struc-ture and Action. New York: Cambridge University Press.
Lincoln, Anne E., and Michael Patrick Allen. 2004. “Double Jeopardy in Hollywood: Age and Gender in the Careers of Film Actors, 1926–1999.” Sociological Forum 19(4):611–31.
Lutter, Mark. 2014. “Creative Success and Network Embeddedness: Explaining Critical Recognition of Film Directors in Hollywood, 1900–2010.” MPIfG Discussion Paper 14/11. Cologne: Max Planck Insti-tute for the Study of Societies.
March, James G. 1991. “Exploration and Exploitation in Organizational Learning.” Organization Science 2(1):71–87.
McDonald, Steve. 2011. “What’s in the ‘Old Boys’ Net-work? Accessing Social Capital in Gendered and Racialized Networks.” Social Networks 33(4):317–30.
McGuire, Gail M. 2002. “Gender, Race, and the Shadow Structure: A Study of Informal Networks and Inequal-ity in a Work Organization.” Gender & Society 16(3):303–322.
McPherson, Miller, Lynn Smith-Lovin, and James M. Cook. 2001. “Birds of a Feather: Homophily in Social Networks.” Annual Review of Sociology 27:415–44.
Mouw, Ted. 2006. “Estimating the Causal Effect of Social Capital: A Review of Recent Research.” Annual Review of Sociology 32:79–102.
Munch, Allison, J. Miller McPherson, and Lynn Smith-Lovin. 1997. “Gender, Children, and Social Contact: The Effects of Childrearing for Men and Women.” American Sociological Review 62(4):509–520.
Newman, M. E. J. 2001. “Scientific Collaboration Net-works. II. Shortest Paths, Weighted Networks, and Centrality.” Physical Review E 64(1):016132.
Obstfeld, David. 2005. “Social Networks, the Tertius Iungens Orientation, and Involvement in Innovation.” Administrative Science Quarterly 50(1):100–130.
Payne, G. Tyge, Curt B. Moore, Stanley E. Griffis, and Chad W. Autry. 2011. “Multilevel Challenges and Opportunities in Social Capital Research.” Journal of Management 37(2):491–520.
Perretti, Fabrizio, and Giacomo Negro. 2006. “Filling Empty Seats: How Status and Organizational Hier-archies Affect Exploration versus Exploitation in
Team Design.” Academy of Management Journal 49(4):759–77.
Perretti, Fabrizio, and Giacomo Negro. 2007. “Mixing Genres and Matching People: A Study in Innovation and Team Composition in Hollywood.” Journal of Organizational Behavior 28(5):563–86.
Petersen, Trond, and Ishak Saporta. 2004. “The Opportu-nity Structure for Discrimination.” American Journal of Sociology 109(4):852–901.
Petersen, Trond, Ishak Saporta, and Marc-David L. Seidel. 2000. “Offering a Job: Meritocracy and Social Networks.” American Journal of Sociology 106(3):763–816.
Phelps, Corey C. 2010. “A Longitudinal Study of the Influence of Alliance Network Structure and Compo-sition on Firm Exploratory Innovation.” Academy of Management Journal 53(4):890–913.
Phelps, Corey C., Ralph Heidl, and Anu Wadhwa. 2012. “Knowledge, Networks, and Knowledge Networks: A Review and Research Agenda.” Journal of Manage-ment 38(4):1115–66.
Podolny, Joel M. 2001. “Networks as the Pipes and Prisms of the Market.” American Journal of Sociol-ogy 107(1):33–60.
Podolny, Joel M., and James N. Baron. 1997. “Resources and Relationships: Social Networks and Mobility in the Workplace.” American Sociological Review 62(5):673–93.
Portes, Alejandro. 1998. “Social Capital: Its Origins and Applications in Modern Sociology.” Annual Review of Sociology 24:1–24.
Powell, Walter W., Kenneth W. Koput, and Laurel Smith-Doerr. 1996. “Interorganizational Collaboration and the Locus of Innovation: Networks of Learning in Biotechnology.” Administrative Science Quarterly 41(1):116–45.
Reagans, Ray, and Bill McEvily. 2003. “Network Struc-ture and Knowledge Transfer: The Effects of Cohe-sion and Range.” Administrative Science Quarterly 48(2):240–67.
Reagans, Ray, and Ezra W. Zuckerman. 2001. “Net-works, Diversity, and Productivity: The Social Capital of Corporate R&D Teams.” Organization Science 12(4):502–517.
Rodan, Simon, and Charles Galunic. 2004. “More Than Network Structure: How Knowledge Hetero-geneity Influences Managerial Performance and Innovativeness.” Strategic Management Journal 25(6):541–62.
Rossman, Gabriel, Nicole Esparza, and Phillip Bonacich. 2010. “I’d Like to Thank the Academy, Team Spill-overs, and Network Centrality.” American Sociologi-cal Review 75(1):31–51.
Rossman, Gabriel, and Oliver Schilke. 2014. “Close, But No Cigar: The Bimodal Rewards to Prize-Seeking.” American Sociological Review 79(1):86–108.
Rost, Katja. 2011. “The Strength of Strong Ties in the Creation of Innovation.” Research Policy 40(4):588–604.
at Max Planck Society on April 2, 2015asr.sagepub.comDownloaded from

358 American Sociological Review 80(2)
Smith-Doerr, Laurel. 2010. “Flexible Organizations, Innovation and Gender Equality: Writing for the US Film Industry, 1907–27.” Industry and Innovation 17(1):5–22.
Son, Joonmo, and Nan Lin. 2012. “Network Diversity, Contact Diversity, and Status Attainment.” Social Networks 34(4):601–613.
Stainback, Kevin. 2008. “Social Contacts and Race/Eth-nic Job Matching.” Social Forces 87(2):857–86.
Stark, David. 2009. The Sense of Dissonance: Accounts of Worth in Economic Life. Princeton, NJ: Princeton University Press.
Tortoriello, Marco, Ray Reagans, and Bill McEvily. 2012. “Bridging the Knowledge Gap: The Influence of Strong Ties, Network Cohesion, and Network Range on the Transfer of Knowledge between Organiza-tional Units.” Organization Science 23(4):1024–39.
Tsai, Wenpin, and Sumantra Ghoshal. 1998. “Social Capital and Value Creation: The Role of Intrafirm Networks.” Academy of Management Journal 41(4):464–76.
Uzzi, Brian. 1999. “Embeddedness in the Making of Financial Capital: How Social Relations and Networks Benefit Firms Seeking Financing.” Ameri-can Sociological Review 64(4):481–505.
Uzzi, Brian, and Jarrett Spiro. 2005. “Collaboration and Creativity: The Small World Problem.” American Journal of Sociology 111(2):447–504.
van Emmerik, I. J. Hetty. 2006. “Gender Differences in the Creation of Different Types of Social Capital: A Multilevel Study.” Social Networks 28(1):24–37.
Vedres, Balázs, and David Stark. 2010. “Structural Folds: Generative Disruption in Overlapping Groups.” American Journal of Sociology 115(4):1150–90.
Wei, Jun, Wei Zheng, and Mian Zhang. 2011. “Social Capital and Knowledge Transfer: A Multi-level Anal-ysis.” Human Relations 64(11):1401–1423.
White, Harrison C. 1993. Careers and Creativity: Social Forces in the Arts. Boulder, CO: Westview Press.
Yang, Tiantian, and Howard E. Aldrich. 2014. “Who’s the Boss? Explaining Gender Inequality in Entre-preneurial Teams.” American Sociological Review 79(2):303–327.
Zuckerman, Ezra W., and Tai-Young Kim. 2003. “The Critical Trade-off: Identity Assignment and Box-Office Success in the Feature Film Industry.” Indus-trial and Corporate Change 12(1):27–67.
Zuckerman, Ezra W., Tai-Young Kim, Kalinda Ukanwa, and James von Rittmann. 2003. “Robust Identities or Nonentities? Typecasting in the Feature-Film Labor Market.” American Journal of Sociology 108(5):1018–74.
Mark Lutter is head of a research group at the Max Planck Institute for the Study of Societies, Cologne. His main research areas are economic sociology, political sociology, social inequality research, and organizational theory. Much of his research focuses on how social struc-tures (such as networks or social capital) affect outcomes in economic life. He received his PhD from University of Duisburg-Essen and has held visiting positions at Har-vard University, ETH Zurich, and Science Po, Paris.
at Max Planck Society on April 2, 2015asr.sagepub.comDownloaded from