Embed Size (px)
Citation preview

American’s with Disabilities Act GIS Inventory and Analysis
Justin Furch, GIT ManagerFebruary 2014
2
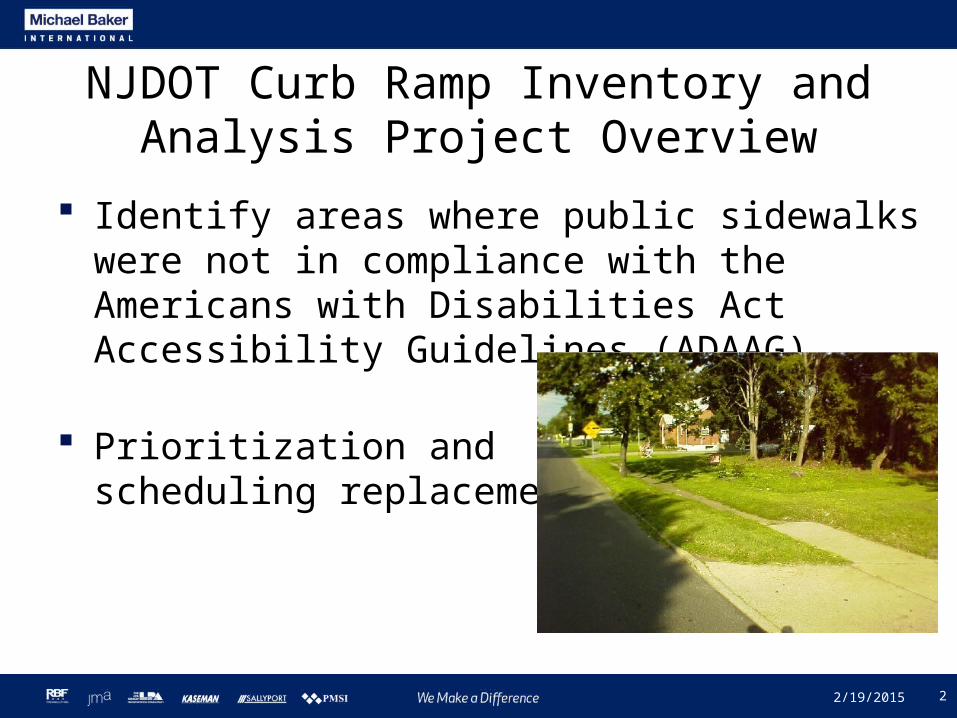
NJDOT Curb Ramp Inventory and Analysis Project Overview
Identify areas where public sidewalks were not in compliance with the Americans with Disabilities Act Accessibility Guidelines (ADAAG)
Prioritization and scheduling replacement.
2/19/2015
3
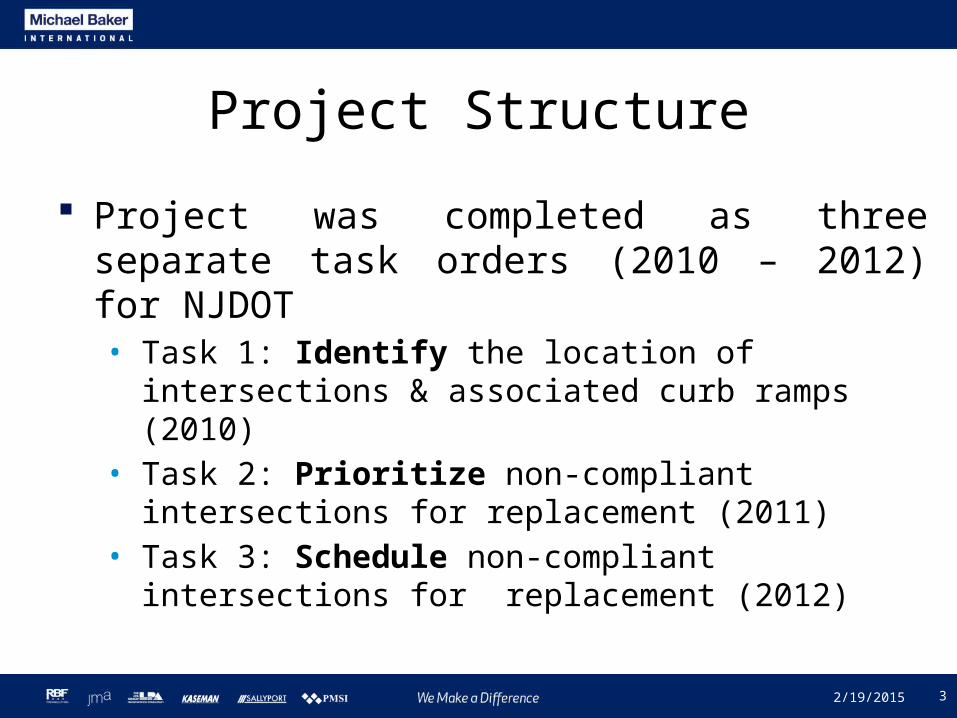
Project Structure
Project was completed as three separate task orders (2010 – 2012) for NJDOT• Task 1: Identify the location of intersections &
associated curb ramps (2010)• Task 2: Prioritize non-compliant intersections
for replacement (2011)• Task 3: Schedule non-compliant intersections
for replacement (2012)
2/19/2015
4
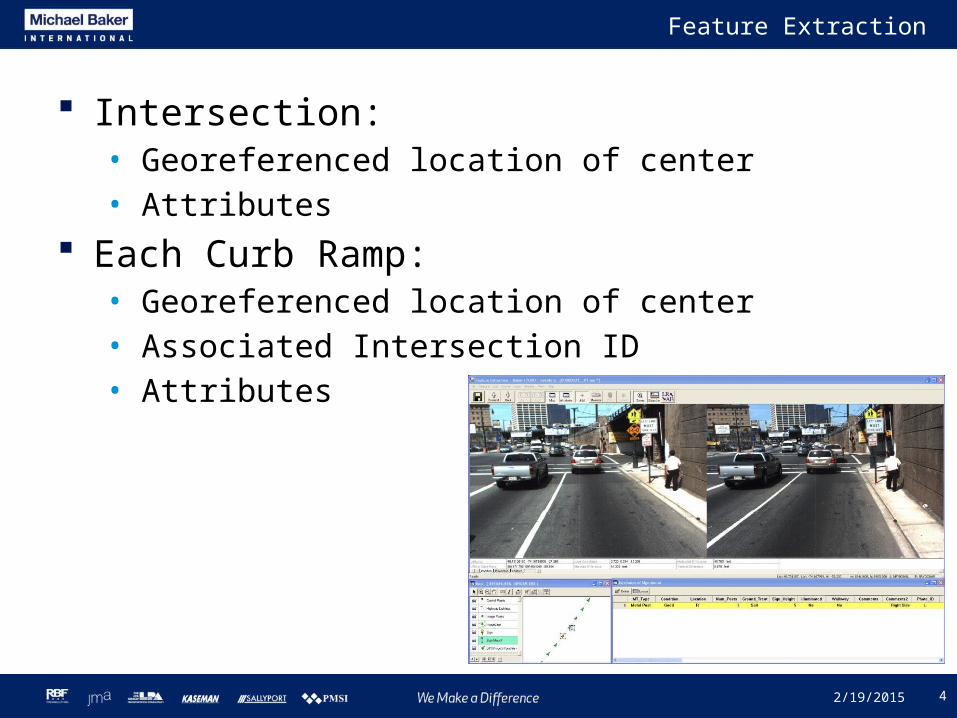
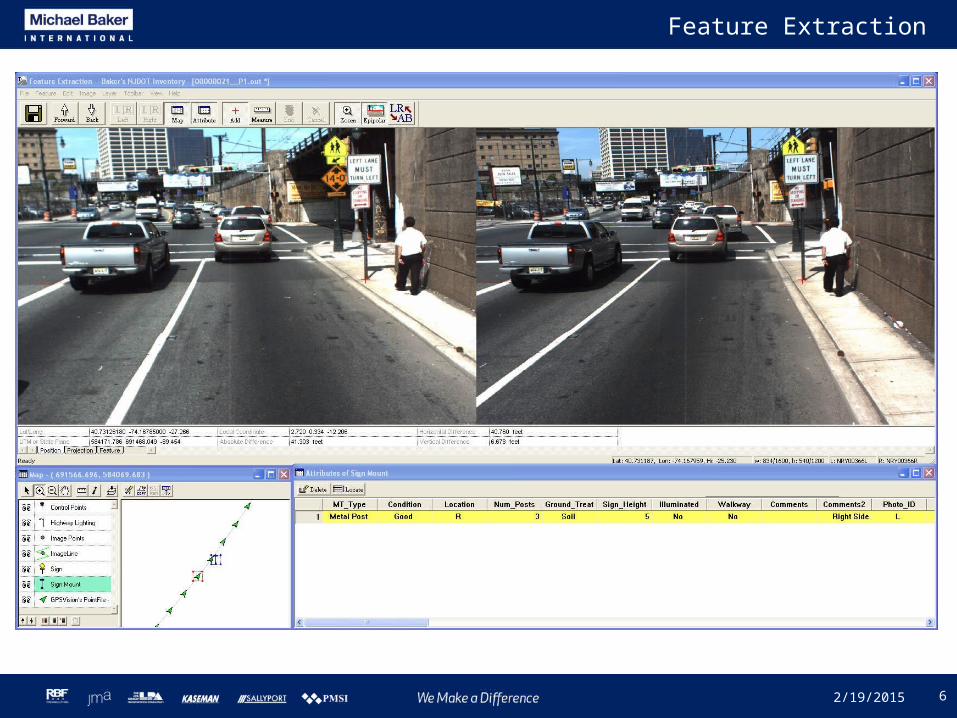
Feature Extraction
Intersection:• Georeferenced location of center• Attributes
Each Curb Ramp:• Georeferenced location of center• Associated Intersection ID• Attributes
2/19/2015

5
Image Collection Van
Image Collection:• Front, Right, and Left Facing Cameras• 40 ft image spacing• Geo-referenced “Smart” Images
2/19/2015
6
Feature Extraction
2/19/2015
7
Task 1 - Identify Non-Compliant Intersections
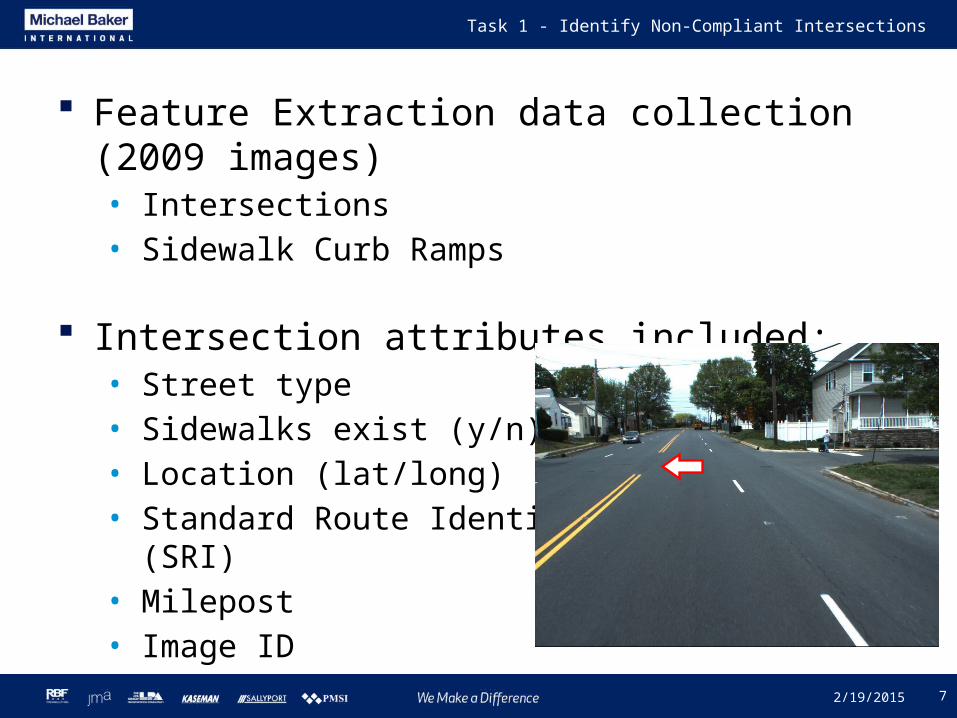
Feature Extraction data collection (2009 images)• Intersections• Sidewalk Curb Ramps
Intersection attributes included:• Street type• Sidewalks exist (y/n)• Location (lat/long)• Standard Route Identifier
(SRI)• Milepost• Image ID
2/19/2015
8
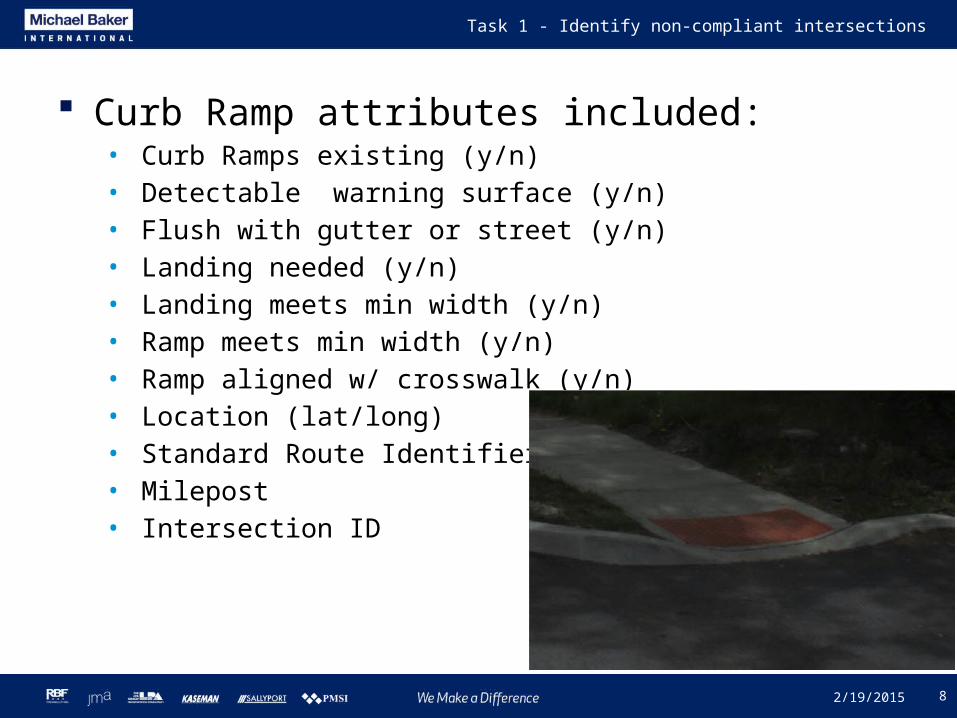
Task 1 - Identify non-compliant intersections
Curb Ramp attributes included:• Curb Ramps existing (y/n)• Detectable warning surface (y/n)• Flush with gutter or street (y/n)• Landing needed (y/n)• Landing meets min width (y/n)• Ramp meets min width (y/n)• Ramp aligned w/ crosswalk (y/n)• Location (lat/long)• Standard Route Identifier (SRI)• Milepost• Intersection ID
2/19/2015
9
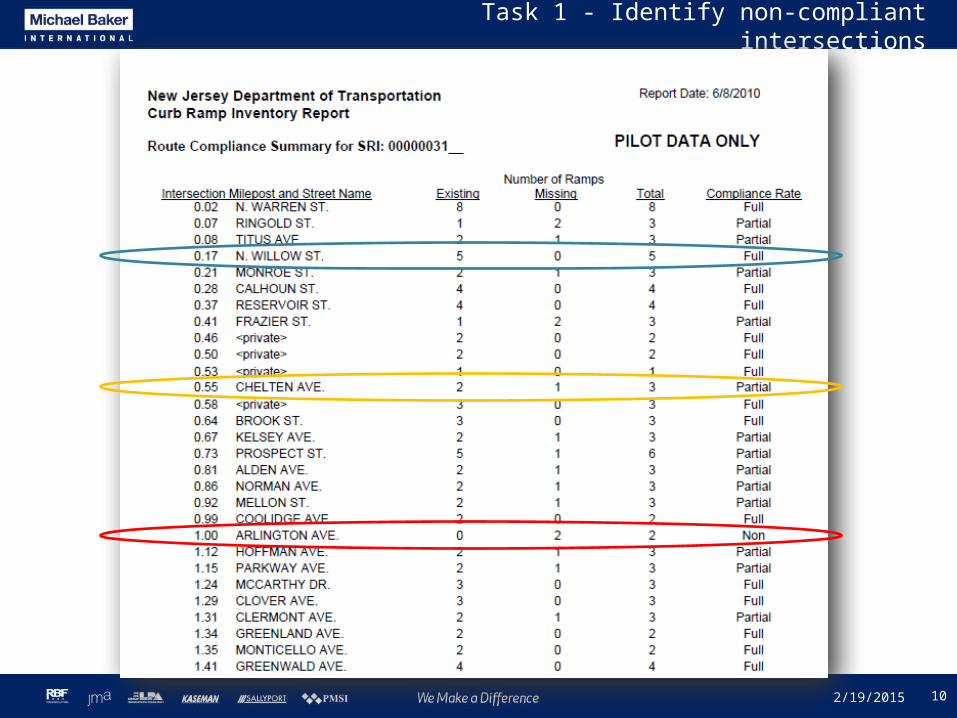
Task 1 - Identify non-compliant intersections
A compliance rating (Full, Partial, Non) was assigned to each intersection
Data delivered to NJDOT in Access database. • 10,093 intersections were inventoried along NJ
State highways• 1,706 intersections were found to be non-
compliant throughout the State
GIS layers delivered in personal geodatabase and shapefile format, including FGDC compliant metadata
2/19/2015
10
Task 1 - Identify non-compliant intersections
2/19/2015
11
Task 1 - Identify non-compliant intersections
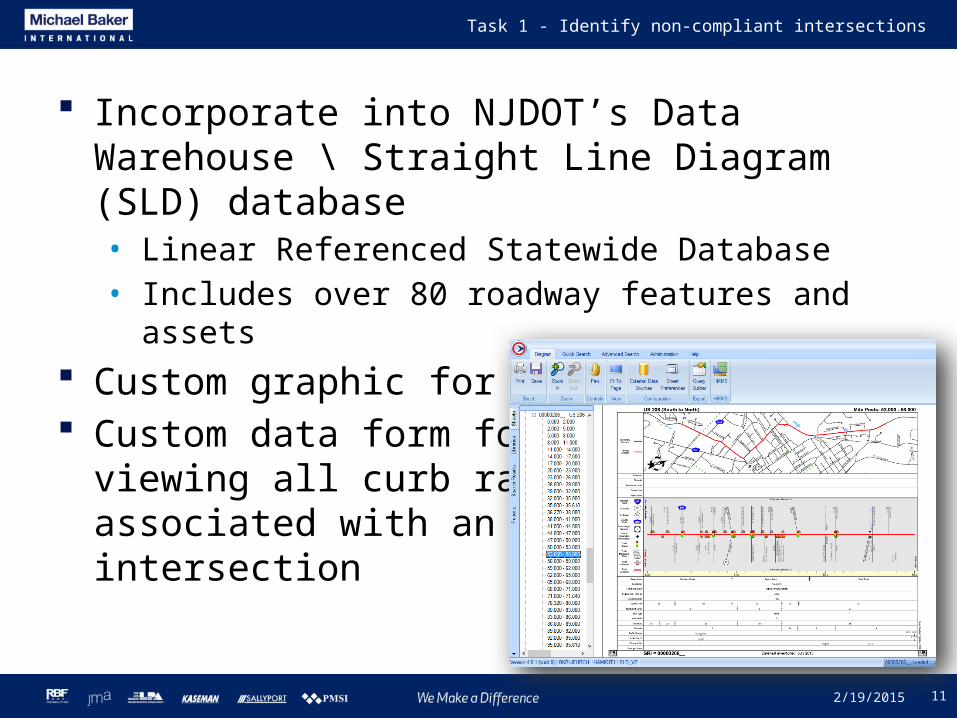
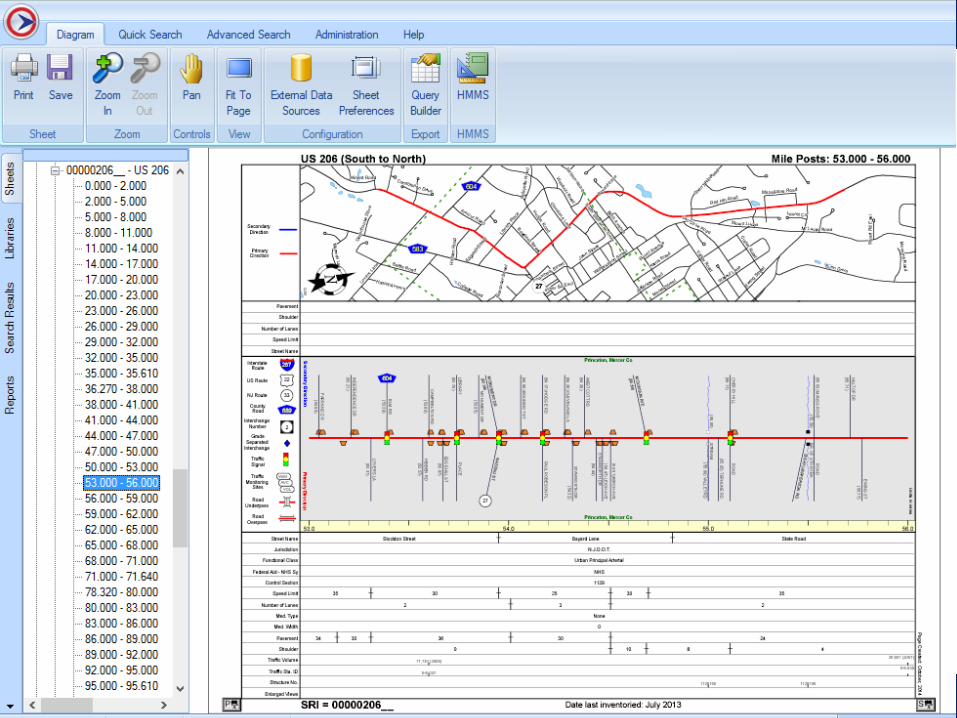
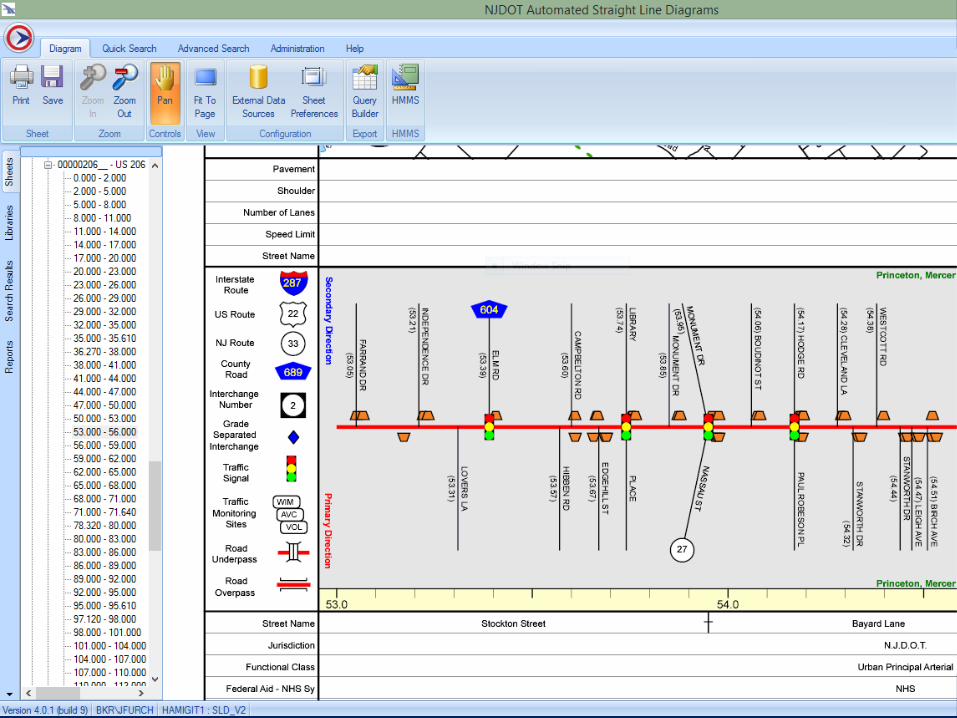
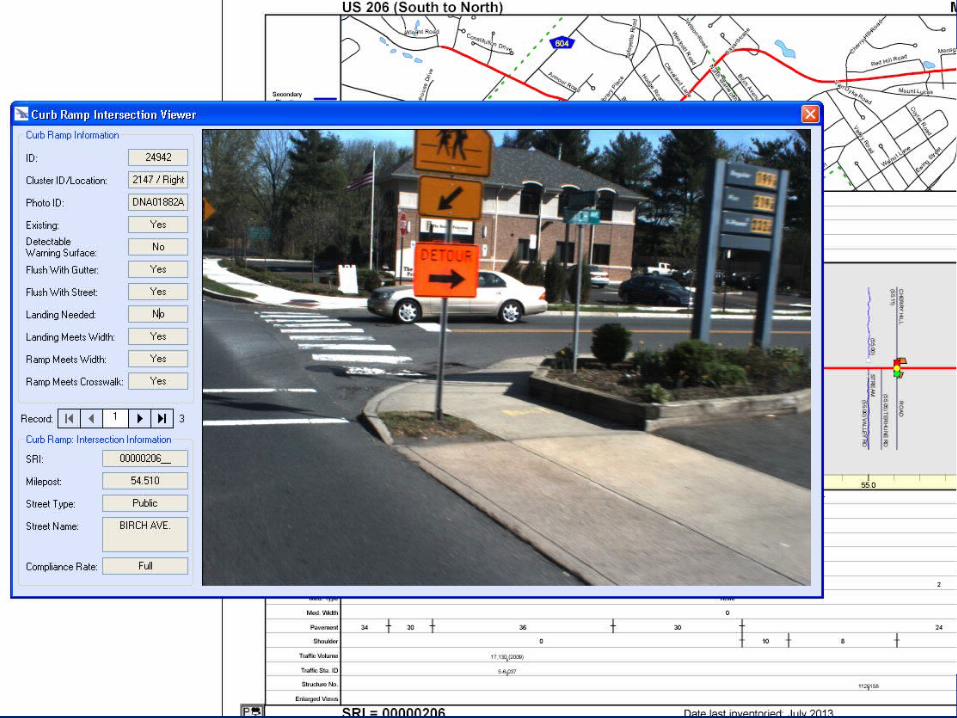
Incorporate into NJDOT’s Data Warehouse \ Straight Line Diagram (SLD) database• Linear Referenced Statewide Database• Includes over 80 roadway features and assets
Custom graphic for display Custom data form for
viewing all curb ramps associated with an intersection
2/19/2015
12
Task 1 - Identify non-compliant intersections
2/19/2015
132/19/2015
142/19/2015
15
Task 2 - Prioritize non-compliant intersections
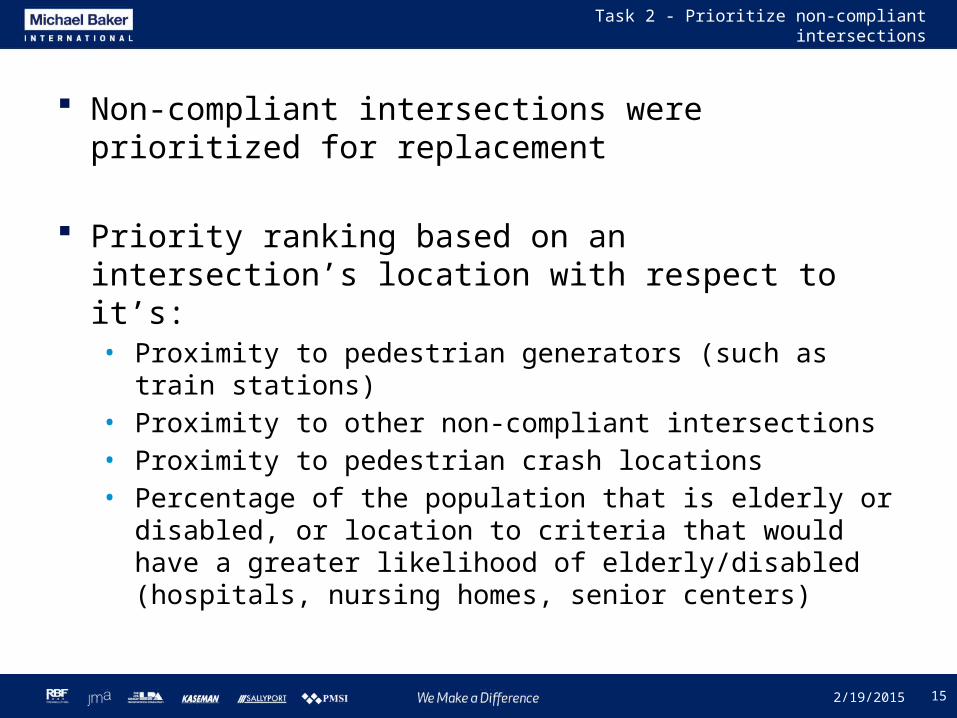
Non-compliant intersections were prioritized for replacement
Priority ranking based on an intersection’s location with respect to it’s:• Proximity to pedestrian generators (such as train
stations)• Proximity to other non-compliant intersections • Proximity to pedestrian crash locations• Percentage of the population that is elderly or
disabled, or location to criteria that would have a greater likelihood of elderly/disabled (hospitals, nursing homes, senior centers)
2/19/2015
16
Task 2 - Prioritize non-compliant intersections
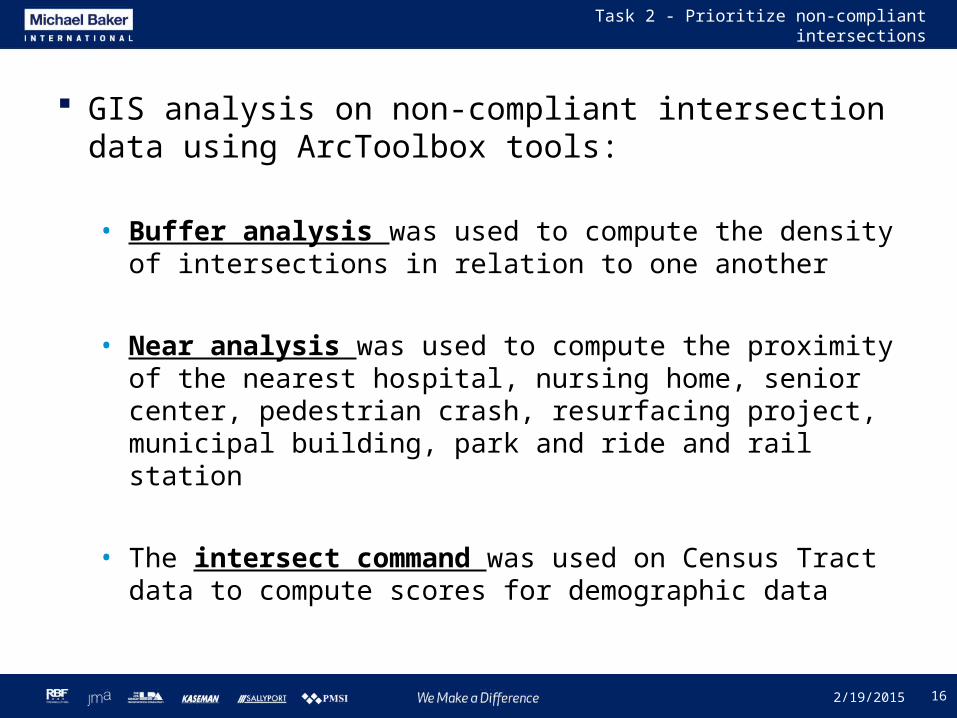
GIS analysis on non-compliant intersection data using ArcToolbox tools:
• Buffer analysis was used to compute the density of intersections in relation to one another
• Near analysis was used to compute the proximity of the nearest hospital, nursing home, senior center, pedestrian crash, resurfacing project, municipal building, park and ride and rail station
• The intersect command was used on Census Tract data to compute scores for demographic data
2/19/2015
17
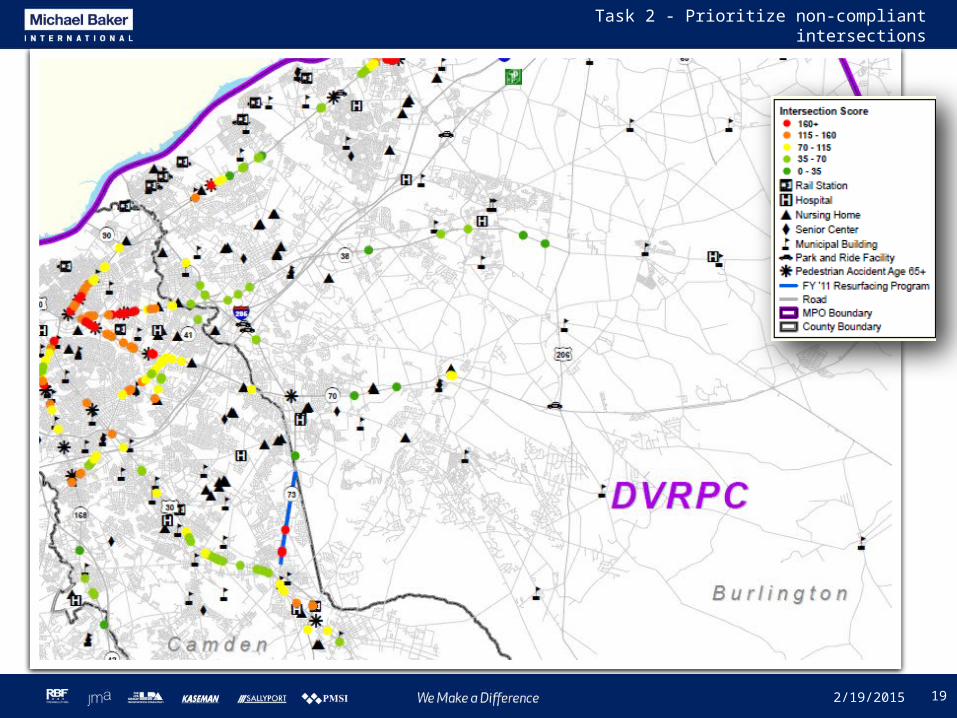
Task 2 - Prioritize non-compliant intersections
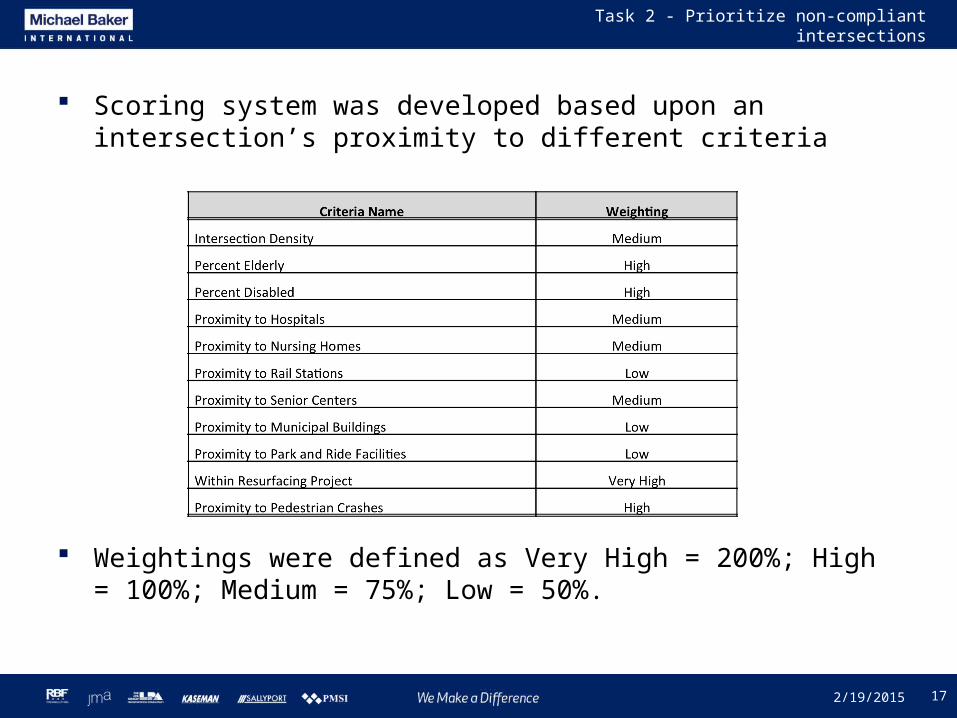
Scoring system was developed based upon an intersection’s proximity to different criteria
Weightings were defined as Very High = 200%; High = 100%; Medium = 75%; Low = 50%.
2/19/2015
18
Task 2 - Prioritize non-compliant intersections
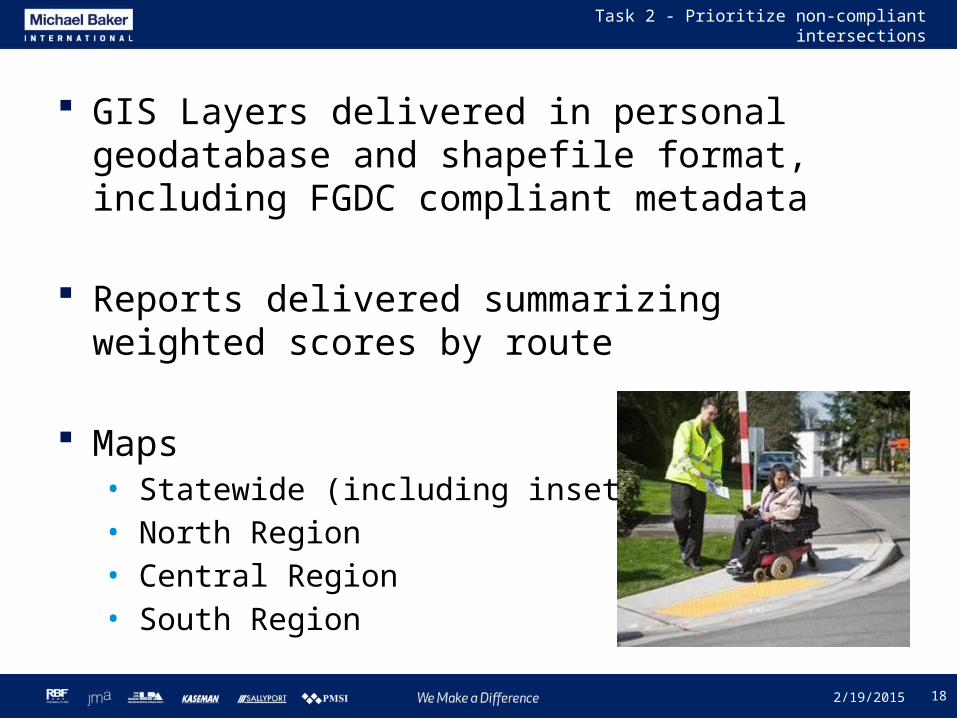
GIS Layers delivered in personal geodatabase and shapefile format, including FGDC compliant metadata
Reports delivered summarizing weighted scores by route
Maps• Statewide (including insets)• North Region• Central Region• South Region
2/19/2015
19
Task 2 - Prioritize non-compliant intersections
2/19/2015
20
Task 3 – Scheduling Non-Compliant Intersections for Replacement
Identify non-compliant intersections that fall within limits of projects in the 2012 – 2021 New Jersey Statewide Transportation Improvement Program (STIP)
Curb ramps not located within STIP project limits were assigned to maintenance contracts (2012 – 2021) for replacement
Develop a schedule and cost estimate for installation of curb ramps
2/19/2015
22
Task 3 – Scheduling Non-Compliant Intersections for Replacement
STIP data manually filtered for relevant projects
• STIP database contained 3,751 records; Filtered down to 444
Identified non compliant intersections within STIP project limits
• Of the 1,706 non-compliant intersections, 428 were within STIP project limits
2/19/2015
23
Task 3 – Scheduling Non-Compliant Intersections for Replacement
2/19/2015
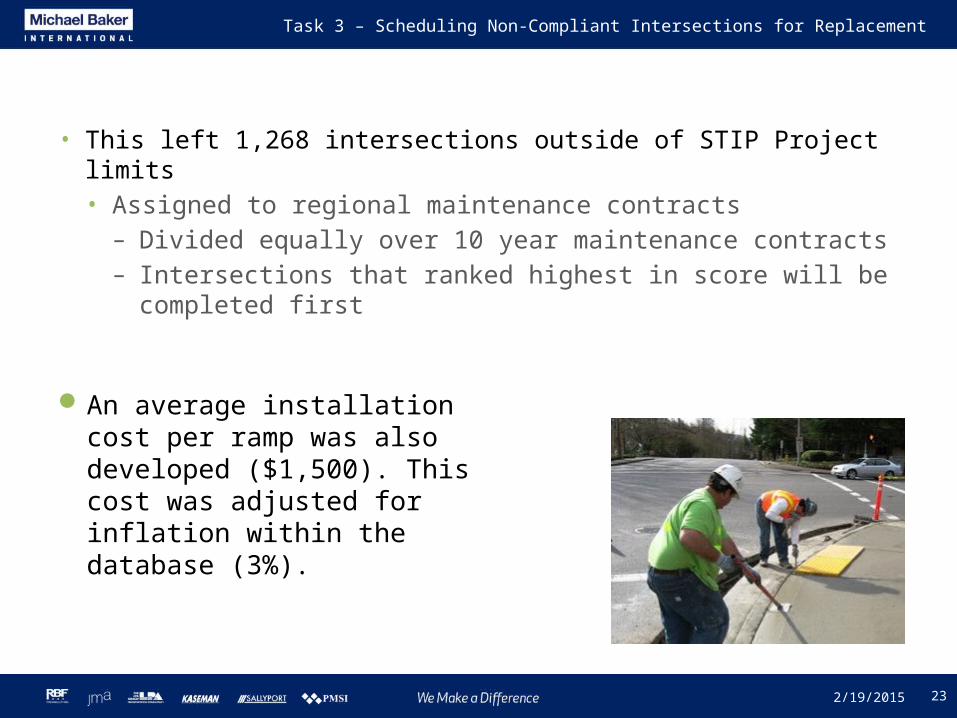
• This left 1,268 intersections outside of STIP Project limits• Assigned to regional maintenance contracts– Divided equally over 10 year maintenance contracts– Intersections that ranked highest in score will be
completed first
An average installation cost per ramp was also developed ($1,500). This cost was adjusted for inflation within the database (3%).
24
Task 3 – Scheduling Non-Compliant Intersections for Replacement
2/19/2015
25
Task 3 – Scheduling Non-Compliant Intersections for Replacement
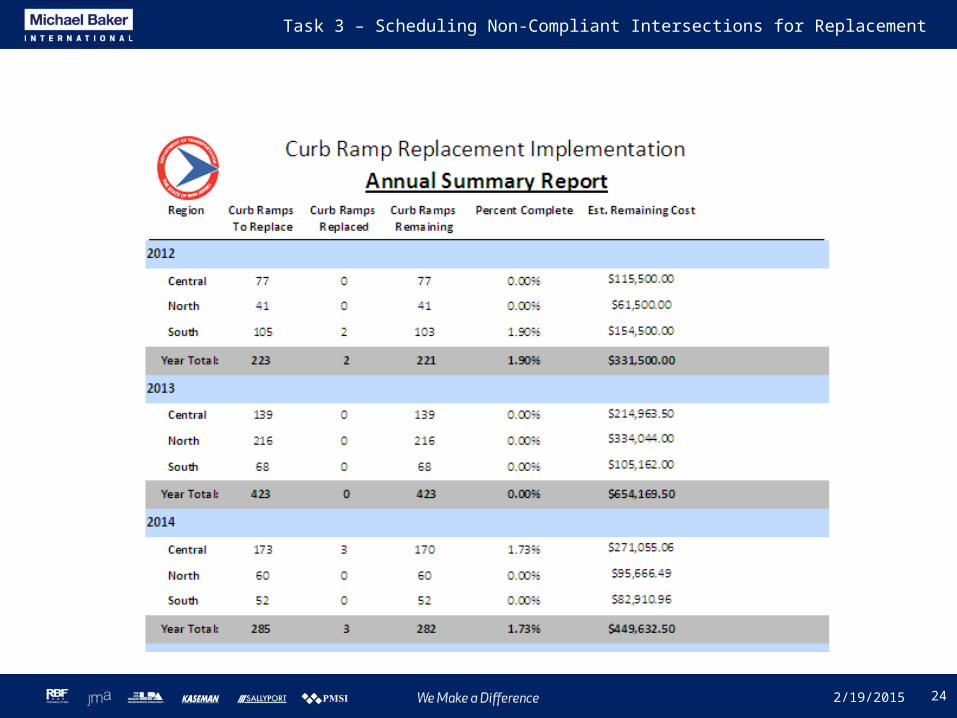
Data delivered to NJDOT in Access database which contained queries to generate summary reports• Annual Summary Report• Route Summary Report• Project Detail Report
Database allows NJDOT to filter data by County/Municipality or SRI, as well as update the “Date Replaced” field
Also allows updates to cost field, as well as adjustments for inflation
2/19/2015
26
Task 3 – Scheduling Non-Compliant Intersections for Replacement
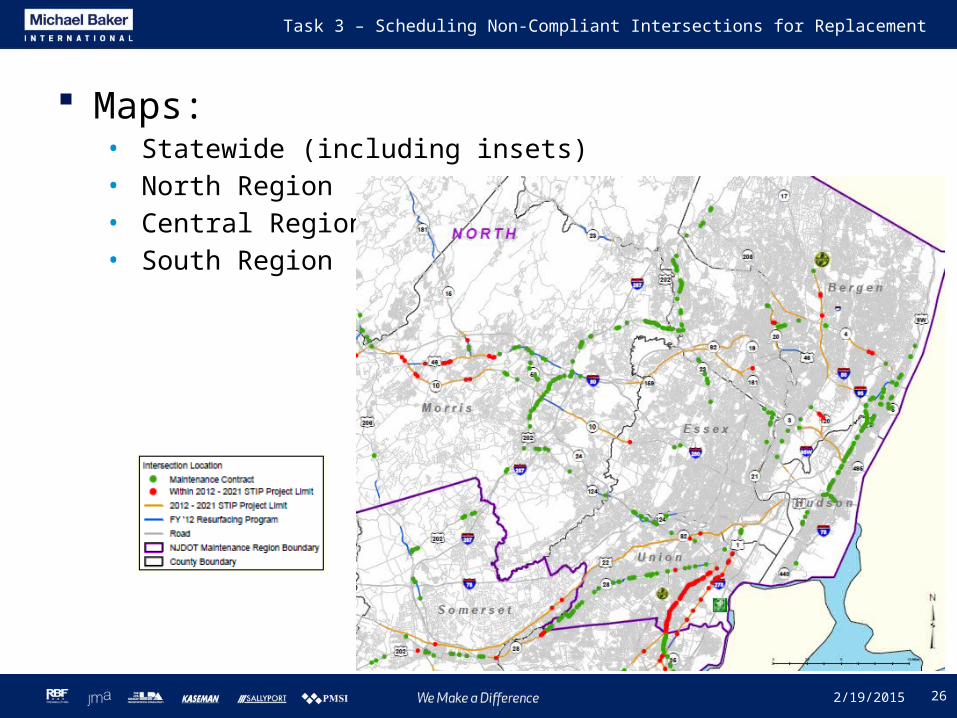
Maps:• Statewide (including insets)• North Region• Central Region• South Region
2/19/2015
27
Inventory Innovation - Sidewalk
2/19/2015
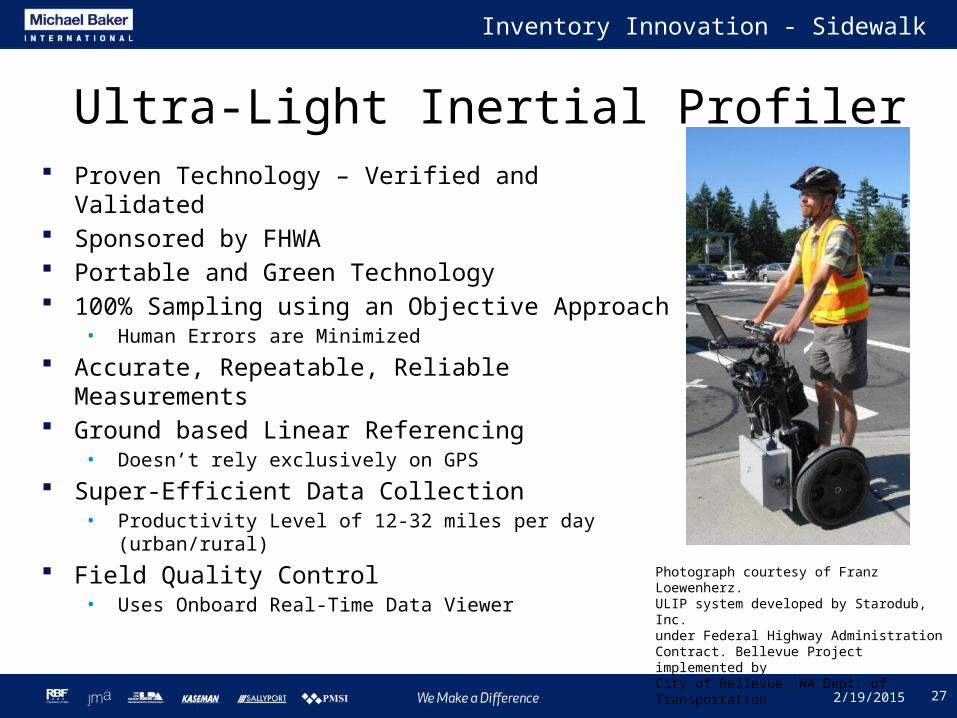
Proven Technology – Verified and Validated Sponsored by FHWA Portable and Green Technology 100% Sampling using an Objective Approach
• Human Errors are Minimized
Accurate, Repeatable, Reliable Measurements Ground based Linear Referencing
• Doesn’t rely exclusively on GPS
Super-Efficient Data Collection• Productivity Level of 12-32 miles per day
(urban/rural)
Field Quality Control• Uses Onboard Real-Time Data Viewer
Technical Advantages of ULIP
Ultra-Light Inertial Profiler
Photograph courtesy of Franz Loewenherz.ULIP system developed by Starodub, Inc.under Federal Highway Administration Contract. Bellevue Project implemented byCity of Bellevue, WA Dept. of Transportation
Ultra-Light Inertial Profiler
28
Inventory Innovation - Sidewalk
2/19/2015
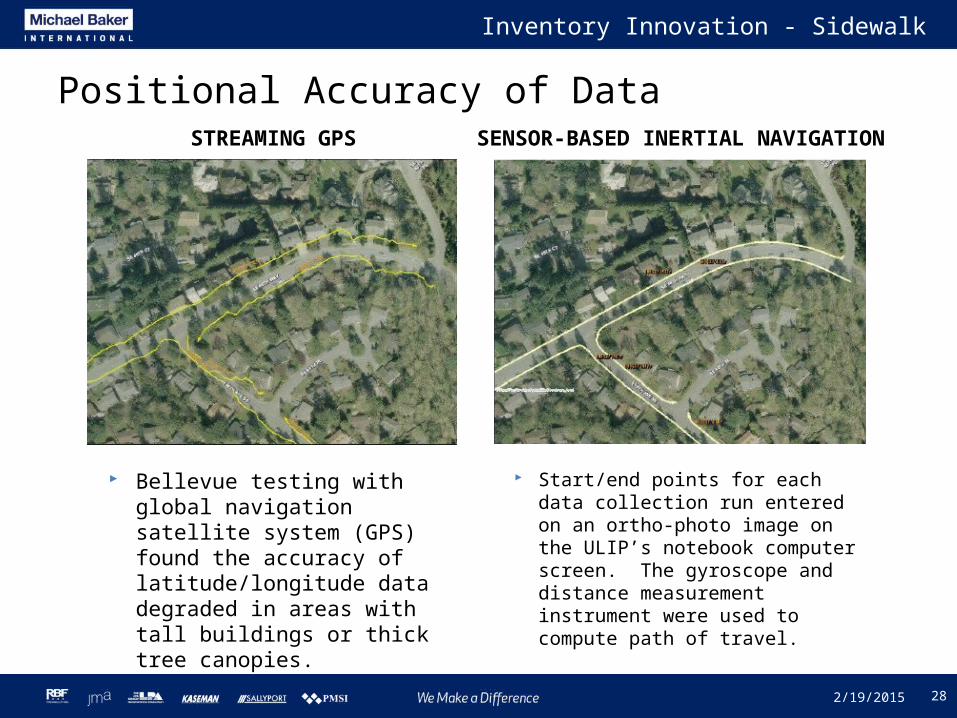
Bellevue testing with global navigation satellite system (GPS) found the accuracy of latitude/longitude data degraded in areas with tall buildings or thick tree canopies.
Positional Accuracy of DataSTREAMING GPS SENSOR-BASED INERTIAL NAVIGATION
Start/end points for each data collection run entered on an ortho-photo image on the ULIP’s notebook computer screen. The gyroscope and distance measurement instrument were used to compute path of travel.
29
Questions?
2/19/2015
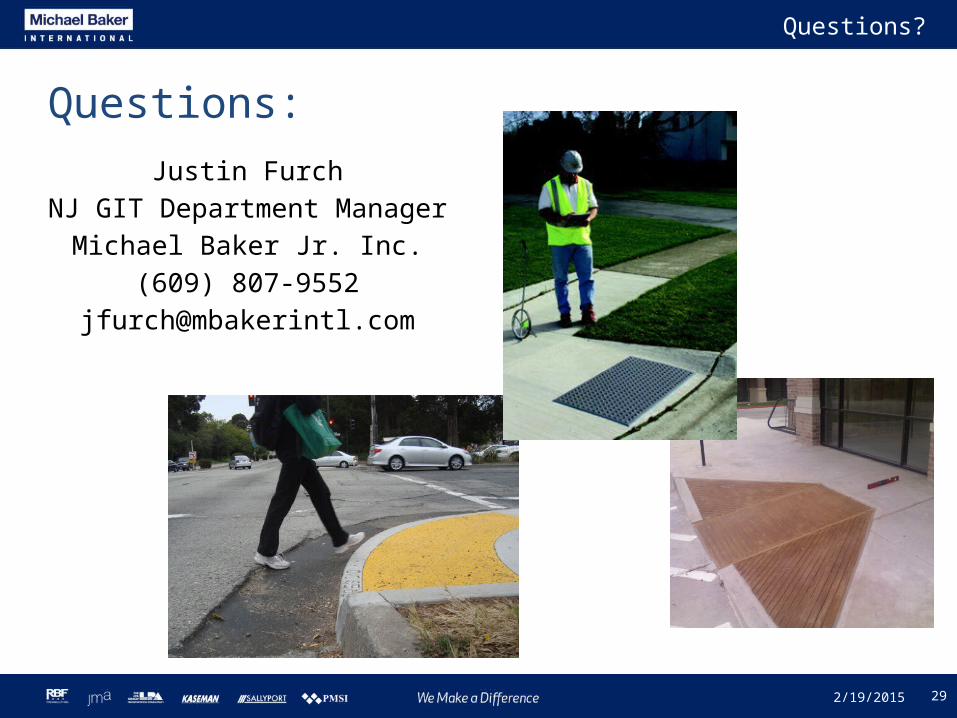
Justin FurchNJ GIT Department Manager
Michael Baker Jr. Inc.(609) 807-9552
Questions:


![[US] The Periodic Table Of SEO Ranking Factors: 2015/16 Edition - Daniel Furch](https://img.pdfslide.net/doc/110x75/587c63971a28ab633c8b64c1/us-the-periodic-table-of-seo-ranking-factors-201516-edition-daniel-furch.jpg)