Embed Size (px)
Citation preview

Amgen 2000 Annual Report dramatically improving people’s lives
vitality freedom
determination confidence
independence agility

Contents
Selected Financial InformationLetter to the ShareholdersChronic Kidney DiseaseCancerRheumatoid ArthritisProducts and Product CandidatesManagement’s Discussion and Analysis
of Financial Condition and Results of OperationsQuantitative and Qualitative Disclosures about Market RiskConsolidated Financial StatementsReport of Ernst & Young LLP, Independent AuditorsOperating SubsidiariesBoard of Directors and Executive OfficersCorporate Information
24
14161820
22272845464748

We aspire to be the best human
therapeutics company. We will
live the Amgen Valuesand use science and innovation to
dramatically improvepeople’s lives.
Co(In
Yea 9 1997 1996 1995 1994 1993 1992 1991
Re8 ,219.8 $ 2,088.2 $ 1,818.6 $ 1,549.6 $ 1,306.3 $ 1,050.7 $ 645.33 181.2 151.6 121.3 98.3 67.5 42.3 36.7
Tot 1 ,401.0 2,239.8 1,939.9 1,647.9 1,373.8 1,093.0 682.0Re 8 630.8 528.3 451.7 323.6 255.3 182.3 120.9Se 3 483.8 470.6 418.4 359.8 328.4 292.2 202.6Ot 0 157.0 — — 116.4 (13.9) (77.1) 129.1Ne 4 644.3 679.8 537.7 319.7 383.3 357.6 97.9Dil 2 0.59 0.61 0.48 0.29 0.33 0.30 0.08Ca — — — — — — —
Co(In m
At D 9 1997 1996 1995 1994 1993 1992 1991
Tot 6 ,110.2 $ 2,765.6 $ 2,432.8 $ 1,994.1 $ 1,765.5 $ 1,374.3 $ 865.5Lo 0 229.0 59.0 177.2 183.4 181.2 129.9 39.7Sto 5 ,139.3 1,671.8 1,274.3 1,172.0 933.7 531.1
1 Due the Compan (E(Filg led $45 mill
2 Amo ous legal pro uidev mount in 20 geand the amounts ) ein 2 94, $0.01 in
Selected Financial Information
2 3
Tot($ in
91
ncome illions)
959493 9
esearch and Development Expenses$ in millions)
98
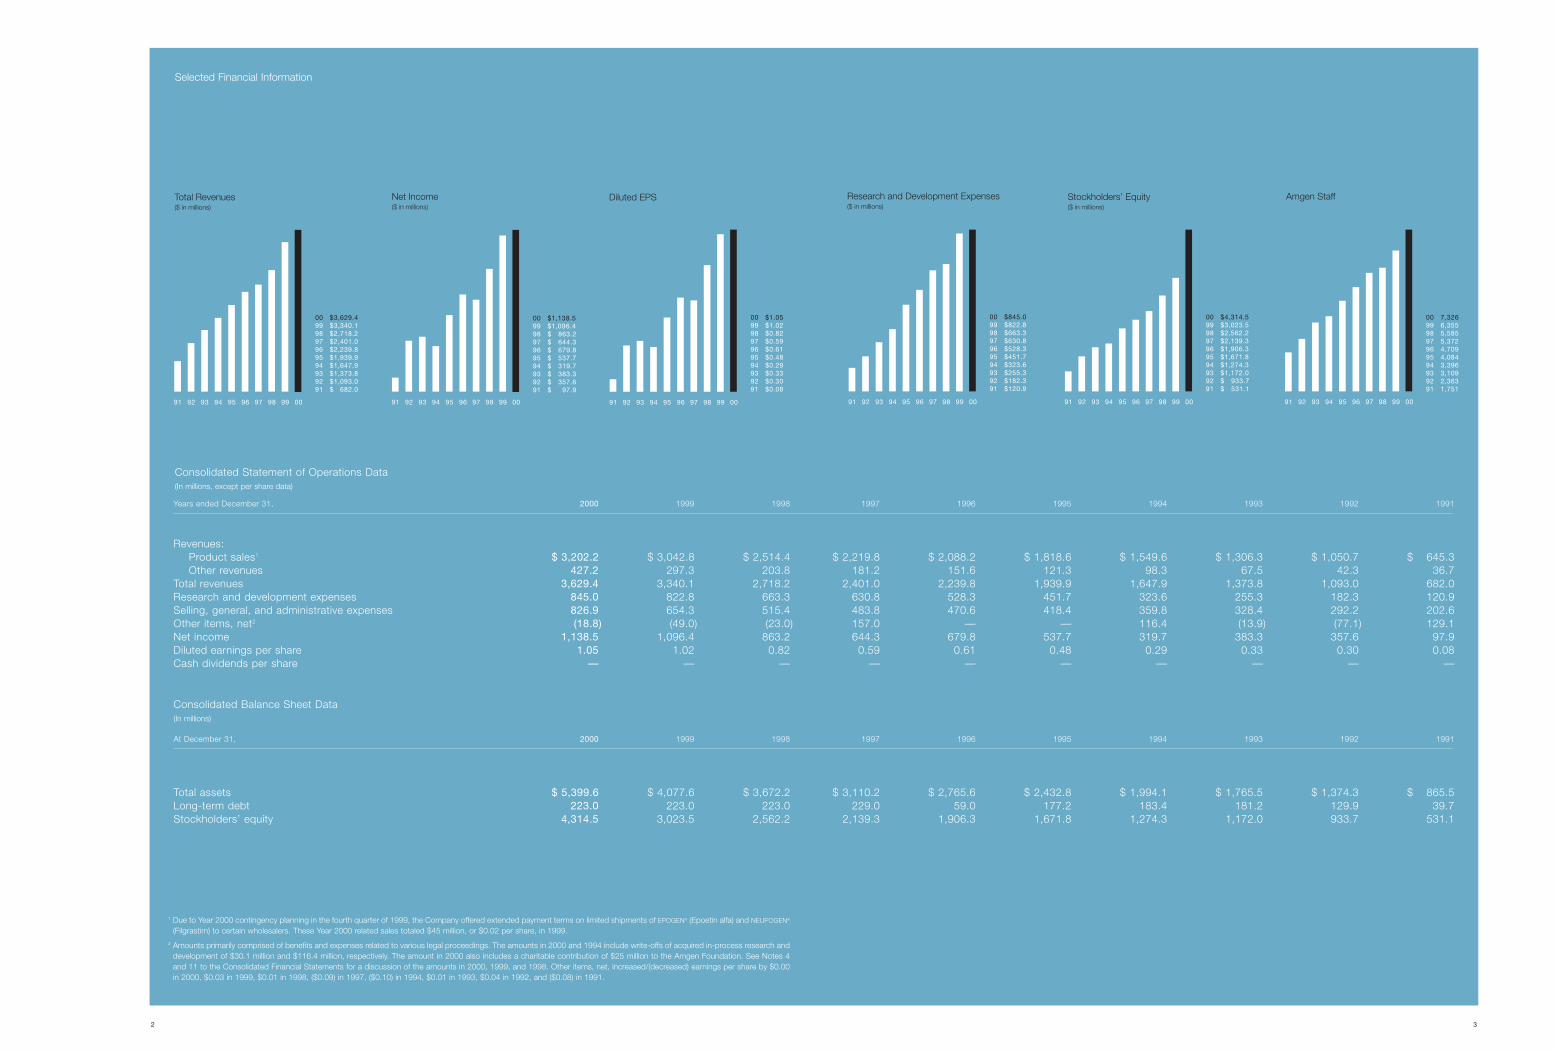
00 $845.099 $822.898 $663.397 $630.896 $528.395 $451.794 $323.693 $255.392 $182.391 $120.9
99 0097969594939291
Stockholders’ Equity($ in millions)
98
00 $4,314.599 $3,023.598 $2,562.297 $2,139.396 $1,906.395 $1,671.894 $1,274.393 $1,172.092 $ 933.791 $ 531.1
99 0097969594939291
Amgen Staff
98
00 7,32699 6,35598 5,58597 5,37296 4,70995 4,08494 3,39693 3,10992 2,36391 1,751
99 0097969594939291
al revenues search and development expenses lling, general, and administrative expenses her items, net2
t income uted earnings per share sh dividends per share
nsolidated Balance Sheet Dataillions)
ecember 31,
al assets ng-term debt ckholders’ equity
to Year 2000 contingency planning in the fourth quarter of 1999, rastim) to certain wholesalers. These Year 2000 related sales tota
unts primarily comprised of benefits and expenses related to varielopment of $30.1 million and $116.4 million, respectively. The a 11 to the Consolidated Financial Statements for a discussion of 000, $0.03 in 1999, $0.01 in 1998, ($0.09) in 1997, ($0.10) in 19
nsolidated Statement of Operations Datamillions, except per share data)
rs ended December 31,
venues:Product sales1
Other revenues
al Revenues
millions)
98
00 $3,629.499 $3,340.198 $2,718.297 $2,401.096 $2,239.895 $1,939.994 $1,647.993 $1,373.892 $1,093.091 $ 682.0
99 00979695949392
Net I($ in m
9291
2000 199
$ 3,202.2 $ 3,042.427.2 297.
3,629.4 3,340.845.0 822.826.9 654.(18.8) (49.
1,138.5 1,096.1.05 1.0
— —
2000 199
$ 5,399.6 $ 4,077.223.0 223.
4,314.5 3,023.
y offered extended payment terms on limited shipments of EPOGEN®
ion, or $0.02 per share, in 1999.
ceedings. The amounts in 2000 and 1994 include write-offs of acq00 also includes a charitable contribution of $25 million to the Am in 2000, 1999, and 1998. Other items, net, increased/(decreased 1993, $0.04 in 1992, and ($0.08) in 1991.
98
00 $1,138.599 $1,096.498 $ 863.297 $ 644.396 $ 679.895 $ 537.794 $ 319.793 $ 383.392 $ 357.691 $ 97.9
99 009796
Diluted EPS
969594939291
1,906.3
1998
$ 2,514.4 $ 2203.8
2,718.2 2 663.3 515.4 ) (23.0) 863.2 0.82
—
1998
$ 3,672.2 $ 3 223.0 2,562.2 2
poetin alfa) and NEUPOGEN®
red in-process research andn Foundation. See Notes 4arnings per share by $0.00
98
00 $1.0599 $1.0298 $0.8297 $0.5996 $0.6195 $0.4894 $0.2993 $0.3392 $0.3091 $0.08
99 007
R(

4
DEAR FELLOW SHAREHOLDER:
Amgen Values• Be science-based• Work in teams• Compete intensely and win• Create value for patients, staff, and stockholders• Trust and respect each other• Collaborate, communicate, and build consensus• Ensure quality• Be ethical
The year 2000 was one of accomplishment and growth forAmgen, and the future has never looked more promising.This year is off to a great start with our recent victory in theAventis/TKT litigation regarding erythropoietin in the U.S.District Court. In the next five years, we hope to more thandouble the size of the company in terms of revenues andproducts on the market. We also will substantially expand thenumber of patients we serve and the size of Amgen’s staff.There are challenges, to be sure, in meeting our goals, butwe are confident that we have the people, the strategy, andthe resources necessary to make our future even brighterthan our past.
Reviewing the significant progress Amgen made towardeach of the six goals established by our executive manage-ment team after I became CEO last May provides a goodsummary of our recent progress and plans for the future.
The first goal was to align the company around ashared aspiration built from a common set of values. Wereaffirmed our commitment to eight fundamental Amgen values developed several years ago: be science-based;work in teams; compete intensely and win; create value forpatients, staff, and stockholders; trust and respect eachother; collaborate, communicate, and build consensus;ensure quality; and be ethical.
As a company, we also worked hard to develop a sharedaspiration. The pace of scientific innovation and medicalunderstanding is accelerating every day, making a technology-based foundation too limiting for us. At the same time, thecompetitive landscape is changing as the industry restructuresand competition for innovative therapeutics increases in intensity. In the face of these and other changes, we stronglyagreed—as a company— that one approach would serve usenduringly: focus our efforts on using science and innovationto dramatically improve people’s lives. Broadening this
thought, we agreed on a shared aspiration to become theworld’s best human therapeutics company.
There is no single definition that captures what we meanby “best.” We know it includes delivering a stream of innova-tive products that dramatically improve people’s lives, being aplace where the best people choose to work, and outperform-ing our peers in delivering value to shareholders. By adoptingsuch a broad aspiration, we are committing ourselves fully toimproving continuously along every important dimension ofAmgen’s activities.
The second goal was to prepare to launch a stream ofnew products beginning in 2001, with a particular focus on ARANESP™ (darbepoetin alfa). Depending upon regulatoryapprovals, we could launch four new products in the next 18months — ARANESP™, anakinra, abarelix-depot, and SD/01.That is why we have spent heavily on clinical development toensure our products’ characteristics are widely and thoroughlytested and documented. We have prepared and submitted regulatory filings around the world to obtain the fastest and bestapprovals possible. We have worked hard to understand physi-cians’ and other providers’ attitudes to be sure our messageswill be persuasive and reimbursement will be available, and wehave built new field forces to ensure that our voice is heard.
We believe ARANESP™ represents a new standard of carefor treating anemia in chronic renal failure, and in other settings. Amgen is determined to become the world leader intreating patients with all types of anemia, one of the mostunder-recognized and under-treated of diseases. We estimatethe worldwide anemia market could be as large as $10 billionby 2005. Introducing ARANESP™ globally gives it the potentialto be Amgen’s biggest product ever.
Anakinra, interleukin-1 receptor antagonist (IL-1ra), is thecornerstone of our inflammation franchise. We estimate themarket for biological therapies in rheumatoid arthritis could

5
Kevin W. SharerChairman, Chief Executive Officer, and President
reach $3 billion by 2005. Anakinra is unique in that it will be theonly therapy that mitigates inflammation and reverses orreduces joint destruction by specifically blocking IL-1, a pivotalcytokine.
Abarelix-depot is a prostate cancer treatment with anovel mechanism of action that will distinguish it from otheravailable therapies. In clinical trials, abarelix-depot rapidlyreduces testosterone and follicle-stimulating hormone levelswithout the troubling testosterone surge associated with othertreatments. Abarelix-depot will compete in the hormonal therapy market for prostate cancer estimated to reach $1.5billion by 2005 and is expected to be an important addition toour oncology franchise.
SD/01 is a longer-acting and therefore a less-frequentlyadministered form of NEUPOGEN® (Filgrastim). We expectSD/01 to help more people successfully get throughchemotherapy and stay out of the hospital by making protection from infection simpler with a once-per-cycle, “one-size-fits-all” configuration. Phase 3 trials of SD/01 have beencompleted, and we expect to file for regulatory approval ofthis therapy in the first half of 2001.
Our third goal was to expand our research and develop-ment capabilities, and grow and advance the product pipeline.R&D is the core of Amgen, and we made good progress inexpanding our activities. We defined more clearly where todirect our discovery resources, added significant talent andleadership to our scientific and medical staffs, and grew ourpipeline. Our core technology base is in large molecules. Ourplan is both to protect and enhance this strength, by expandingto monoclonal antibody therapeutics, while continuing to growour small molecule capabilities. We believe this three-modalityapproach is the one that best enables Amgen to capitalize onthe increased understanding of disease mechanisms and therapeutic targets emerging in the postgenomic era.
Our acquisition of Kinetix Pharmaceuticals was an impor-tant step in continuing to build our small molecule capabilities.Choosing disease areas around which to cluster our productdevelopment activities was another important step. Increasingour R&D spending to nearly $1 billion in 2001, up from approx-imately $850 million in 2000, is yet another key towardachieving this goal.
We are very pleased with our pipeline progress. Oneproduct application was filed in the U.S., and applications fortwo products were filed in the European Union, Canada,Australia, and New Zealand. We started, or made the decisionto start, four registration trials and received one line extension.One new product candidate already in clinical developmentwas in-licensed, and we in-licensed or acquired another eightresearch and preclinical projects. We plan in 2001 to begin fivenew product-registration and label-extension trials and file twonew-product or label-extension applications in the U.S. andother countries. Also, we continue aggressive efforts to acquireproduct opportunities from outside Amgen.
Goal four was to strengthen our organization capabilitiesand help our staff grow professionally. We did this with theaddition of Roger Perlmutter, MD, PhD, as executive vice president of Research and Development and George Morrowas executive vice president of Worldwide Sales and Marketing.Roger Perlmutter formerly was executive vice president ofWorldwide Basic Research and Preclinical Development forMerck Research Laboratories. George Morrow formerly waspresident and CEO of GlaxoWellcome, North America. We alsohired several additional executives with broad industry experi-ence in research and development at the vice president level.
Despite these additions, we have more work to do in thearea of developing our staff. The Executive Committee isfocusing more time and effort on this issue than ever before,and I expect to be able to report significant progress on this

6
front in next year’s annual report. Another area in which weneed to make greater progress is diversity. We have madesome progress—for example, we now have eight women vicepresidents, up from three a year ago. But we are redoublingour efforts and taking a more broad-based and energeticapproach to fully tap the potential of the widest range of possible contributors to Amgen’s work. We are committed tomaking advances in this area.
Our fifth goal was to be successful in the Aventis/TKT
erythropoietin patent litigation. We won in the U.S. DistrictCourt thanks to a magnificent effort by our legal team, led byGeneral Counsel Steve Odre and Vice President of IntellectualProperty Stuart Watt. This successful defense of our intellectual property was important, not only for Amgen but forour entire industry.
Goal six was to deliver on our short-term financial prom-ises and, at the same time, invest wisely for the future. Amgenhas an outstanding record in providing value to shareholders,and we are working hard to continue to deliver. We achievedour profit targets in 2000 even though U.S. NEUPOGEN® saleswere somewhat short of expectations. NEUPOGEN® is used insupport of patients undergoing chemotherapy, and somechanges in chemotherapy usage patterns have resulted in less NEUPOGEN® usage in those settings. However, overall, morepatients than ever are receiving NEUPOGEN®, and we expectNEUPOGEN® sales to grow this year.
As I write this letter today, Amgen’s stock price has grownby 12 percent in the last twelve months while stocks in general have performed worse, with the S&P 500 declining by13 percent. As we now prepare to launch ARANESP™, I recallthe historic day in December 1998 when arbitrators affirmedAmgen’s exclusive rights to ARANESP™. Since that day,Amgen’s stock price has increased by 195 percent versus theperformance of the S&P 500, which increased by 1 percent.
Looking forward, sales and earnings are expected to accel-erate beginning in 2001, fueled by new product launches. By2005, five or more new products may be launched that coulddrive product sales to the $8 to 9 billion range.
Don Rice and Paul Reason recently joined our board,bringing a wealth of industry and government experience. Atthe same time, Gordon Binder, our CEO from October 1988 toMay 2000, has retired and left our board. Gordon’s dedicationto the company and our purpose was unmatched, and all thepeople at Amgen deeply appreciate his tireless efforts and theextraordinary results Amgen achieved under his leadership.
Kevin W. Sharer
Chairman, Chief Executive Officer, and President
March 13, 2001
Accomplishments• Received favorable judgement in patent litigation relating to erythropoietin• Completed a phase 3 clinical trial in Europe of ARANESP™ (darbepoetin alfa) in patients with solid tumors and anemia• Completed phase 3 clinical trials for abarelix-depot in patients with prostate cancer, and the license application was submitted to the FDA• Successfully completed phase 3 clinical trials of SD/01 in patients with cancer• Submitted the license application in Europe for IL-1ra in patients with rheumatoid arthritis• In-licensed epratuzumab, a monoclonal antibody that may be a potential treatment for patients with non-Hodgkin’s lymphoma• Enhanced our small molecule capabilities through the acquisition of Kinetix• Sales and Marketing teams prepared for the launch of ARANESP™ and other late-stage product candidates• Received FDA licensing of our Longmont, Colorado, manufacturing facility

launching a streamof products that willdramatically improve
people’s lives
7

54
vitalityfreedom
Treatment gives Danielle
the vitality andfreedom to livemore actively,
which includesenjoying her
grandson more.
chronic kidneydisease
DanielleEnd-StageRenalDisease

76
determinationconfidence
Focused on completing his
treatments, Jeff also is
determined andconfident that he
will soon get back to the
ballpark with his son.
cancer JeffNon-Hodgkin’sLymphoma

98
independenceagility
Janis hopes that treatment
will give her agility and
independence forthose specialmorning visits
with not only hermom but also her
own daughter.
rheumatoidarthritis
JanisRheumatoid Arthritis

14
CHRONIC KIDNEY DISEASE
EPOGEN ® (Epoetin alfa)End-Stage Renal Disease PatientsAnemia
It is believed that more than 3 million people in the UnitedStates have signs of chronic kidney disease. The approx-imately 250,000 of these people whose disease hasprogressed to kidney failure must undergo regular dialysistreatments to remove wastes from their blood. These patientshave a condition known as end-stage renal disease (ESRD).
Nearly 12 years ago, Amgen’s first product, EPOGEN®,revolutionized the treatment of anemia for ESRD patientsundergoing dialysis. EPOGEN® supplements dialysis patients’inadequate supply of erythropoietin, a protein produced by thekidneys to stimulate oxygen-carrying red blood cell supply.Appropriate anemia management lessens fatigue, improvescognitive and physical functioning, and has allowed many dialysis patients to regain the vitality and freedom to participatemore actively in life, without the need for blood transfusions.
Amgen’s late-stage product candidate, ARANESP™
(darbepoetin alfa), may represent an important advance foranemic patients with chronic kidney disease. Through molecular engineering, Amgen scientists developed ARANESP™
to permit less-frequent dosing than EPOGEN®.Just as important, because we have retained exclusive
rights for ARANESP™, Amgen may be able to work with doctorsearlier to help simplify anemia management for many morepatients in the U.S. and around the world. If approved by regulatory agencies, doctors may start treating anemia fromchronic kidney disease with ARANESP™ early in the disease’sprogression, before patients require dialysis treatment. Thisearly stage of kidney disease is known as chronic renal insuf-ficiency (CRI).
Of the more than 3 million patients with chronic kidneydisease in the U.S., more than 1 million patients have CRI, and350,000 of these patients with CRI could be anemic. Only asmall proportion of these patients are treated for their anemia,despite a growing awareness that when there are fewer circu-
lating red blood cells the heart has to work harder and that thiscondition may result in cardiovascular disease. The potentialbenefit of less frequent dosing may allow more of thesepatients to have their anemia treated.
Amgen is now introducing a program called the RenalAnemia Management Period (RAMP) to nephrologists, the doc-tors who manage kidney disease patients. RAMP helps doctorsidentify anemic patients with CRI sooner and manage theiranemia earlier. Additionally, Amgen is supporting the devel-opment of guidelines by the National Kidney Foundation for thetreatment of all stages of kidney disease —the Kidney DiseaseOutcomes Quality Initiative (KDOQI). We believe that earliertreatment of anemia could have important benefits for patients.
A further complication for patients with chronic kidney failure is the development of secondary hyperparathyroidism.In patients with this condition, the parathyroid glands detectlow levels of calcium and increase production of parathyroid hormone (PTH) — the most important regulator of body calcium.Abnormally high levels of PTH may result in many comp-lications, including weak bones and abnormal calciumdeposits in blood vessels and other soft tissues.
Amgen’s calcimimetics program may offer benefits topatients with chronic kidney disease and secondary hyperpara-thyroidism. Encouraging data from phase 2 studies, publishedin the past year, suggest that treatment with small-moleculecalcimimetics results in dose-dependent decreases in PTH
levels and may provide effective reduction of calcium levels. Amgen is proud to be developing and delivering important
therapeutics to growing numbers of patients worldwide and isdedicated to remaining at the forefront of renal care.

“The best way to illustrate the remarkable breakthrough fordialysis patients that EPOGEN® has been is to relate a storyabout one of my patients.
Congenital malformations in his urinary tract led to kidneyfailure when he was 14. He then started hemodialysis. Twoyears later he received a cadaveric kidney transplant. But afterone year of slow rejection, he returned to hemodialysis. At age19, he moved to Los Angeles and was struggling to graduatefrom high school. On top of kidney failure, he was severely anemic. Without blood transfusions his hemoglobin was 7.0-8.0 g/dL; twice that level would have been normal for hisage. To have enough energy to go to school and concentrateon his work, he required two to three blood transfusionsmonthly. Even with these, his hemoglobin rarely was higherthan 10 g/dL.
In 1986 he agreed to participate in the phase 3 clinical trialwith Epoetin alfa. Within 12 weeks of starting, his hemoglobinwas 12 g/dL, and he said he felt as well as he had before hiskidneys failed. He has since received no blood transfusions,although he has continued with hemodialysis. In 1991 he hadhip replacement surgery to repair damage done by the highdoses of steroids he had received during his kidney transplantexperience. Prior to surgery, he donated two units of his ownblood, to be held in the blood bank. What a remarkable reversal— from requiring blood transfusions just to get by todonating his own blood prior to surgery! His hip replacementwas successful. He went on to get his bachelor’s degree inaccounting and is now a practicing CPA. Just last year hewas married.
This story illustrates the huge contribution EPOGEN® hasmade to the lives of kidney patients. ARANESP™, by requiringless frequent administration, may be another significant step for-ward in the treatment of anemia in patients with kidney disease.”
Dr. Allen Nissenson, MDProfessor of Medicine, Director, Dialysis Program UCLA School of MedicineChair, Amgen Nephrology National Advisory Board
15

16
CANCER NEUPOGEN® (Filgrastim)Chemotherapy PatientsNeutropenia
Each year, more than 1 million people are diagnosed with cancer in the United States alone. Since 1991, Amgen’s NEUPOGEN® has helped patients with cancer undergoingmyelosuppressive chemotherapy battle one of the treatment’sserious possible side effects—a reduction in white blood cellscalled neutrophils. Neutropenia—the resulting condition—canlead to infection and to delays in chemotherapy delivery. In thepast year, Amgen made significant progress with three addi-tional product candidates that may lessen some of the seriousside effects associated with chemotherapy treatment.
Pivotal clinical trials of SD/01 were completed in womenwith breast cancer. This innovative product candidate is a sus-tained duration form of NEUPOGEN®. If approved by regulatoryagencies, SD/01 may benefit patients by permitting less-frequent dosing than the current daily dosing of NEUPOGEN®.SD/01 may be effective given as infrequently as once per cycleof myelosuppressive chemotherapy. Chemotherapy cycles areoften scheduled every three to four weeks. As a result, patientsmay benefit from protection from infections, as manifested byfever and neutropenia.
ARANESP™ (darbepoetin alfa), in addition to its potentialuse in kidney disease treatment, is being evaluated for treat-ment of cancer-related anemia. Many patients with cancersuffer from anemia. This anemia may be caused by the canceritself or may be a side effect of chemotherapy. Phase 2 clinicaltrials suggest that treatment with ARANESP™ of patients withcancer-related anemia may be effective given once weekly oronce every three weeks.
Cancer treatments such as chemotherapy and radio-therapy are also often toxic to the mucosal cells lining themouth and the gastrointestinal tract, resulting in ulceration ofthe mucosal lining—mucositis. This condition results in painfulsores in the mouth and along the length of the gastrointestinaltract that may prevent patients from eating. Patients frequently
require pain medication and have reduced quality of life.Another of Amgen’s product candidates, keratinocyte growthfactor (KGF), is a recombinant form of a naturally-occurringgrowth factor that stimulates the development of mucosalcells. Early clinical trials suggest KGF may offer benefit forpatients who experience mucositis following chemotherapyand radiotherapy.
Amgen is now broadening its cancer franchise to includethe discovery and development of novel cancer therapeutics totarget and eradicate tumor cells.
Abarelix-depot, the first long-acting gonadotrophin-releasing hormone antagonist, is a potential cancer therapeuticthat Amgen licensed from Praecis Pharmaceuticals in 1999.Researchers from Amgen and Praecis are collaborating on thedevelopment of abarelix-depot to treat men with prostate cancer, aiming to limit cancer cell stimulation by loweringtestosterone levels. Abarelix-depot is currently under regula-tory review for the treatment of patients with prostate cancerand also is being studied in women with endometriosis, acommonly occurring, painful, and potentially debilitating pelvicdisorder affecting women of childbearing age.
In the past year, Amgen licensed a novel cancer therapeu-tic antibody, epratuzumab, from Immunomedics. Epratuzumabis currently being evaluated for its ability to treat indolent (lowgrade) and aggressive non-Hodgkin’s lymphoma (NHL). In NHL,cells in the lymphatic system become abnormal. NHL can startin any of the many parts of the body where there is lymphatictissue and spread to almost any part of the body.
These efforts illustrate Amgen’s continued dedication toimproving the lives of patients with cancer.
16

“Amgen is committed to turning the unprecedented possibil-ities of science into the realities of therapeutic cancertreatment. It’s a commitment supported by Amgen’s substan-tial resources in areas ranging from exploratory research andcancer biology to clinical oncology and development. FulfillingAmgen’s aspiration to be the best human therapeutics company demands more than the success we have had incancer supportive care. It demands that we produce solutionsthat make us the therapeutic partner of choice in cancer treat-ment. This is why I recently left academia to join Amgen.
Amgen uses a broad spectrum of approaches to developcancer therapeutics, including small molecule, antibody, andprotein approaches. Supporting this work, the company hasmade major investments in genomics, proteomics, geneexpression analysis, small molecule science, antibody tech-nologies, and kinase biology. Our researchers work closelywith Amgen’s preclinical and clinical oncology groups to expe-dite the development of novel cancer therapies. All researcherslikewise support the in-licensing of exciting new cancer thera-peutic candidates.
Before joining Amgen, I worked for 11 years as a tenuredcancer researcher at the University of Texas M.D. AndersonCancer Center. My work there focused on host/tumor interac-tions mediating tumor cell survival, growth, and angiogenesisduring the spread of cancer cells to distant organs in the body.
The opportunity to continue my translational cancerresearch at a science-based company with a clear commit-ment to targeted cancer therapeutics was, simply, too great topass up. As a PhD molecular and cellular cancer biologist whohas worked in all aspects of cancer research (from laboratorybench to bedside), I have sworn to helping patients first.Working at Amgen, I believe I can help more patients than inany other way.”
Bob Radinsky, PhDPreclinical Cancer ResearcherAmgen
Colorized micrograph of colon cancer,prepared following surgical resection.
17

18
RHEUMATOID ARTHRITIS
More than 6 million people worldwide have rheumatoid arthritis (RA), a systemic disease that commonly involvesinflammation of small joints with bone and cartilage destruc-tion. This course of the disease eventually may lead to disabilityand decreased life expectancy.
In RA, the inflamed joint lining may invade and damagebone and cartilage, while inflammatory proteins stimulate therelease of enzymes that actually digest bone and cartilage.This results in loss of shape and alignment of the joint, pain,and reduced mobility. X-rays of patients with rheumatoid arthritis show that the most rapid deterioration of joint functionoften occurs within the first few years of the disease, leaving asmall window of opportunity for intervention before irreversibledamage may occur.
Though joint erosion can begin early in RA, more than halfthe people with this debilitating disease are undiagnosed ornot seeking treatment. While there is no cure for this disease,doctors traditionally have used drugs originally developed foruse in other therapeutic areas— such as cancer treatment andorgan transplantation — to reduce swelling, alleviate pain andstiffness, and preserve joint function for patients with RA. Still,there remains a clear unmet medical need. Many doctors saythat now is a promising time to be treating patients with RAgiven the potential of new biological therapies. Nonetheless,fewer than 10 percent of patients with RA receive these newerdrugs, and many may suffer the progression of RA.
Cytokines are proteins that deliver chemical messagesamong cells. Cytokines activate immune responses to fight offinfections and decrease tissue injury and cell death. But inpatients with RA, there is persistent activation of the immunesystem, which leads to an overabundance of certain cytokinesthat induce structural damage and inflammation. The two keycytokines in RA are Interleukin-1 (IL-1) and Tumor NecrosisFactor-alpha (TNF-α). These two cytokines act together to
induce production of other cytokines and enzymes that causemuch of RA’s pain, swelling, and destruction. Preclinical stud-ies have demonstrated that IL-1 plays the dominant role inbone and cartilage destruction. Additionally, clinical evidencehas shown that patients with bone erosion have higher levelsof IL-1 in their joints. Amgen has two potential candidates indevelopment to block each of these cytokines.
Anakinra, a recombinant form of naturally-occurring IL-1
receptor antagonist (IL-1ra, a protein the body produces to reg-ulate IL-1) is the most advanced product candidate. Clinicalstudies suggest that by binding to IL-1 receptors, anakinraappears to interfere with the action of excess IL-1 and may helpregulate the inflammatory imbalance between IL-1 and IL-1ra.Clinical trials suggest that anakinra may reduce the progres-sion of joint destruction in patients with RA. Long-term studiesalso suggest that patients who continue on anakinra for longerperiods may have a further slowing in the rate of disease pro-gression. Amgen has submitted regulatory files for theapproval of anakinra for the treatment of rheumatoid arthritispatients around the world.
Amgen’s second product candidate for RA, soluble TNF-
receptor type I (sTNF-RI), is in early studies to assess itseffectiveness in blocking the impact of TNF-α in patients withRA. Another clinical trial is evaluating the effectiveness ofanakinra and sTNF-RI together in treating patients with RA.
Amgen is committed to advancing the science of rheuma-tology and hopes to soon offer an important new treatment toimprove the lives of people affected by the serious and debili-tating disease of rheumatoid arthritis.

“As an inflammation researcher, I am convinced of the prom-ise of a new therapy that targets and selectively blocksinterleukin-1 (IL-1). This therapy may provide improved thera-peutic impact in RA patients whose inflamed joints produceincreased levels of this cytokine that drives the devastatingjoint erosion of the disease.
The potency of therapy with Amgen’s product candidate,anakinra, a recombinant form of naturally-occurring interleukin-1 receptor antagonist (IL-1ra), has been consistently shown inarthritis models. In preclinical studies, reaching sufficient levelsof IL-1ra appears to block progression of joint inflammation andfully prevent activation of erosive enzymes, called metallopro-teinases, and the resulting cartilage destruction. Moreover,results from studies in RA patients suggest that treatment withIL-1ra may reduce joint erosion.
Studies also suggest that IL-1 is more potent than anothercytokine involved in RA, TNF-α, in inducing cartilage and boneerosion. It appears that IL-1 is a critical mediator in TNF-drivenarthritis, since IL-1 blocking appears to fully prevent TNF-induced pathology. In addition, IL-1 production that occursindependently of TNF-α is seen in many forms of arthritis.Further preclinical studies also suggest that erosive arthritiscannot be induced in IL-1 deficient mice, in contrast to findingsin TNF-deficient mice. However, spontaneous destructivearthritis appears to occur in mice lacking IL-1 receptor antago-nist (IL-1ra), illustrating that insufficient control of IL-1 by itsnatural inhibitor, IL-1ra, causes joint destruction.
To me, this is an exciting time in the science and treatmentof rheumatoid arthritis when a significant and much neededadvance may be met by blocking the devastating erosioncaused by excess levels of IL-1 in the joints of RA patients.”
Wim B. van den Berg, PhDInflammation ResearcherUniversity Medical CenterNijmegen, The Netherlands
Synovialmembrane
Cartilage
Pannus
Synovial (joint) cavity
CapsuleCartilage
Synovialmembrane
Pannus
Bone
TNF-α
IL-1β
Activity of IL-1β and TNF-α as proinflammatorycytokines in rheumatoid joints.
19

21
Amgen late-stage Amgen early-stageease Description Amgen products 1 product candidates 2 product candidates 3
LAMMATION
eumatoid arthritis A disease characterized by pain and Anakinra Soluble tumorswelling of the joints in which the body’s (Interleukin-1 necrosis factor-natural immune system attacks healthy receptor receptor type Ijoint tissue as it would foreign cells antagonist, IL-1ra) (sTNF-RI)
UROLOGY/METABOLISM
esity The storage of excess fat in the body Leptin
rkinson’s disease A motor system disorder characterized Neuroimmuno-by tremors of hands, arms, legs, jaw, philin programand face; stiffness of the limbs andtrunk; slowness of movement; andimpaired balance and coordination
HER
teoporosis A disease of the skeleton in which the Osteoprotegerinamount of calcium present in the (OPG) programbones slowly decreases to the pointwhere the bones become brittle andprone to fracture
dometriosis A painful disease wherein fragments Abarelix-depotof endometrial tissue implant outsidethe uterine cavity, usually in otherareas of the pelvis, in women
Primary Excessive production of parathyroid Calcimimetichyperparathyroidism hormone by a benign tumor program
Hepatitis C A liver disease caused by the INFERGEN ®
hepatitis C virus (HCV), which is (Interferonfound in the blood of persons who alfacon-1)have this disease
1 Denotes marketed products in the United States and other countries.2 Denotes product candidates in phase 3 clinical trials or filed with regulatory agencies.3 Denotes product candidates in phase 1 or 2 clinical trials.4 STEMGEN® is marketed in Canada and Australia only.
The Company’s ability to develop and commercialize new products is highly uncertain because very few pharmaceutical/biotechnology research and development productsever produce a commercial product. In addition, while the Company routinely seeks to obtain patents for its products, the protection offered by patents and patent appli-cations may be challenged, invalidated, or circumvented. The Company believes that in some cases third party patent rights could limit product commercialization.
Disease
CHRONIC KIDNEY DIS
Anemia
Secondaryhyperparathyroidism
CANCER
Neutropenia
Anemia
Stem celltransplantation
Aplastic anemia A failure of the bone marrow to STEMGEN ®
generate cells (Ancestim)
Mucositis Inflammation of the mucosal lining Keratinocyteof the gastrointestinal tract as a growth factorresult of cancer treatment (KGF)
Bone metastases Invasion of bone by cancer cells Osteoprotegerinoriginating in other parts of the body (OPG) programthat may induce bone destruction
Prostate cancer A slow-growing malignant tumor in men Abarelix-depotthat arises in the prostate gland and canspread to other parts of the body
Non-Hodgkin’s A heterogeneous group of Epratuzumablymphoma lymphoproliferative malignancies that
usually originate in lymphoid tissuesand may spread to other organs
Amgen is discovering and
By leveraging its core biois focused on four mainpatient-delivery modalities
Amgen Products and
20
Description Amgen products 1
EASE
A decrease in the normal amounts EPOGEN ®
of red blood cells that develops in (Epoetin alfa)chronic kidney disease patients dueto a decrease in the production of erythropoietin by the kidneys
Excessive production of parathyroidhormone
A decrease in a type of white blood NEUPOGEN ®
cell called a neutrophil that may occur (Filgrastim)following chemotherapy treatmentresulting in an increased risk ofinfection
A decrease in the normal amountof red blood cells that may occurfollowing chemotherapy treatmentor due to the cancer itself
A procedure in which the bone NEUPOGEN ®
marrow destroyed by high doses (Filgrastim)of chemotherapy or radiation is STEMGEN ®
replaced by stem cells that (Ancestim) 4
produce white blood cells, redblood cells, and platelets
developing a stream of product candidates using science and innovation
logy and protein expertise and aggressively pursuing outside innovation, A therapeutic areas—chronic kidney disease, cancer, inflammation, and n—protein, small-molecule, and antibody therapeutics.
Product Candidates
Amgen late-stage Amgen early-stageproduct candidates 2 product candidates 3
ARANESP TM
(darbepoetinalfa)
Calcimimeticprogram
SD/01
ARANESP ®
(darbepoetin alfa)
to dramatically improve people’s lives.
mgen’s research and development strategyeurology/metabolism—and three potential
Dis
INF
Rh
NE
Ob
Pa
OT
Os
En

Liquidity and Capital Resources
The Company had cash, cash equivalents and marketable securi-
ties of $2,028.1 million at December 31, 2000, compared with
$1,333.0 million at December 31, 1999. Cash provided by operat-
ing activities has been and is expected to continue to be the
Company’s primary source of funds. In 2000, operations provided
$1,634.6 million of cash compared with $1,226.9 million in 1999.
authorized the Company to repurchase up to $2 billion of common
stock between January 1, 2001 and December 31, 2002. The
amount the Company spends on and the number of shares repur-
chased each quarter varies based on a variety of factors, including
the stock price and blackout periods in which the Company is
restricted from repurchasing shares.
To provide for financial flexibility and increased liquidity, the
Company has established several sources of debt financing. As of
December 31, 2000, the Company had $223 million of unsecured
long-term debt securities outstanding. These unsecured long-term
debt securities consisted of: 1) $100 million of debt securities that
bear interest at a fixed rate of 6.5% and mature in 2007 under a
$500 million debt shelf registration (the “Shelf”), 2) $100 million of
debt securities that bear interest at a fixed rate of 8.1% and mature
in 2097 and 3) $23 million of debt securities that bear interest at a
fixed rate of 6.2% and mature in 2003. Under the Shelf, all of the
remaining $400 million of debt securities available for issuance
may be offered under the Company’s medium-term note program
with terms to be determined by market conditions.
The Company’s sources of debt financing also include a com-
mercial paper program which provides for unsecured short-term
borrowings up to an aggregate face amount of $200 million. As of
Management’s Discussion and Analysis
of Financial Condition and Results of Operations
Cash, Cash Equivalents and Marketable Securities($ in millions)
98
00 $2,028.199 $1,333.098 $1,276.097 $1,026.596 $1,077.0
99 009796
Capital expenditures totaled $437.7 million in 2000 compared with
$304.2 million in 1999. The Company anticipates spending
approximately $450 million to $550 million in 2001 on capital proj-
ects and equipment to expand the Company’s operations.
The Company receives cash from the exercise of employee stock
options and proceeds from the sale of stock by Amgen pursuant
to the employee stock purchase plan. In 2000, employee stock
option exercises and proceeds from the sale of stock by Amgen
pursuant to the employee stock purchase plan provided $333.7
million of cash compared with $248.8 million in 1999. Proceeds
from the exercise of employee stock options will vary from period
to period based upon, among other factors, fluctuations in the
market value of the Company’s stock relative to the exercise price
of such options.
The Company has a stock repurchase program primarily to reduce
the dilutive effect of its employee stock option and stock purchase
plans. In 2000, the Company repurchased 12.2 million shares of its
common stock at a total cost of $799.9 million, and in 1999, the
Company repurchased 27.1 million shares of common stock at a
cost of $1,024.7 million. In December 2000, the Board of Directors
December 31, 2000, commercial paper with a face amount of
$100 million was outstanding. These borrowings had maturities of
less than two months and had effective interest rates averaging
6.7%. In addition, the Company has an unsecured $150 million
credit facility that expires on May 28, 2003. This credit facility sup-
ports the Company’s commercial paper program. As of December
31, 2000, no amounts were outstanding under this line of credit.
The primary objectives for the Company’s investment portfolio are
liquidity and safety of principal. Investments are made to achieve
the highest rate of return to the Company, consistent with these
two objectives. The Company’s investment policy limits invest-
ments to certain types of instruments issued by institutions with
investment grade credit ratings and places restrictions on maturi-
ties and concentration by type and issuer.
The Company believes that existing funds, cash generated from
operations and existing sources of debt financing are adequate to
satisfy its working capital and capital expenditure requirements for
the foreseeable future, as well as to support its stock repurchase
program. However, the Company may raise additional capital from
time to time.
22

prior year. This increase was primarily due to higher demand, prin-
cipally driven by the administration of higher doses and growth in
the U.S. dialysis patient population. The administration of higher
doses of EPOGEN® was principally due to dialysis providers man-
aging more patients into the hematocrit range of 33 to 36 percent
as recommended by the Dialysis Outcomes Quality Initiative, as
well as the use of hemoglobin instead of hematocrit to measure
red blood cell volume.
Management’s Discussion and Analysis
of Financial Condition and Results of Operations
Total Assets($ in millions)
98
00 $5,399.699 $4,077.698 $3,672.297 $3,110.296 $2,765.6
99 009796
Results of Operations
Product Sales
Product sales were $3,202.2 million in 2000, an increase of $159.4
million or 5% over the prior year. In 1999, product sales were
$3,042.8 million, an increase of $528.4 million or 21% over the
prior year. Quarterly product sales are influenced by a number of
factors, including underlying demand, wholesaler inventory man-
agement practices and foreign exchange effects.
EPOGEN® (Epoetin alfa) EPOGEN® sales were $1,962.9 million in
2000, an increase of $203.8 million or 12% over the prior year.
This increase was primarily due to higher demand, which was prin-
cipally driven by growth in the U.S. dialysis patient population and
to a lesser extent, the effect of higher prices. Sales in 2000 were
adversely impacted by Year 2000-related sales to wholesalers in
the fourth quarter of 1999 for which the Company provided
extended payment terms and, the Company believes, by dialysis
provider inventory drawdowns in 2000 of additional 1999 year-end
stockpiling. The Company believes that some of this dialysis
provider stockpiling may have been due to Year 2000 concerns
and year-end contract expirations. In 1999, EPOGEN® sales were
$1,759.1 million, an increase of $377.1 million or 27% over the
EPOGEN® Sales($ in millions)
98
00 $1,962.999 $1,759.198 $1,382.097 $1,160.796 $1,071.9
99 009796
NEUPOGEN® (Filgrastim) Worldwide NEUPOGEN® sales were
$1,223.7 million in 2000, a decrease of $32.9 million or 3% from
the prior year. This decrease was primarily due to the adverse
impact of wholesaler buying patterns, including Year 2000-related
sales to wholesalers in the fourth quarter of 1999 for which the
Company provided extended payment terms, as well as adverse
foreign exchange effects. The Company believes these factors
were partially offset by a mid-single digit rate increase in demand,
which includes the effect of higher prices in the U.S. In 1999,
worldwide NEUPOGEN® sales were $1,256.6 million, an increase of
$140.0 million or 13% over the prior year. This increase was pri-
marily due to higher demand, which includes the effect of higher
prices in the U.S., and the impact of approximately $29 million of
Year 2000-related sales to wholesalers in the fourth quarter of
1999 for which the Company provided extended payment terms.
23

Management’s Discussion and Analysis
of Financial Condition and Results of Operations
NEUPOGEN® Sales($ in millions)
98
00 $1,223.799 $1,256.698 $1,116.697 $1,055.796 $1,016.3
99 009796
Other Product Sales Other product sales primarily consist of
INFERGEN® (Interferon alfacon-1). INFERGEN® sales were $14.5 mil-
lion in 2000, a decrease of $11.7 million or 45% from the prior
year. In 1999, INFERGEN® sales were $26.2 million, an increase of
$10.4 million or 66% over the prior year. INFERGEN® was launched
in October 1997 for the treatment of chronic hepatitis C virus
infection. There are other treatments, including combination ther-
apy, for this infection against which INFERGEN® competes. The
Company cannot predict the extent to which it will maintain its
share or further penetrate this market.
Corporate Partner Revenues
In 2000, corporate partner revenues increased $84.8 million or 53%
over the prior year. In 1999, corporate partner revenues increased
$33.5 million or 26% over the prior year. These increases were pri-
marily due to amounts earned from Kirin-Amgen, Inc. related to the
development program for ARANESPTM (darbepoetin alfa), the
Company’s novel erythropoiesis stimulating protein.
24
Total Product Sales($ in millions)
98
00 $3,202.299 $3,042.898 $2,514.497 $2,219.896 $2,088.2
99 009796
Cost of Sales
Cost of sales as a percentage of product sales was 12.8%, 13.2%
and 13.7% for 2000, 1999 and 1998, respectively. The decreases
in these percentages were primarily due to increased manufactur-
ing efficiencies.
Research and Development
In 2000, research and development expenses increased $22.2
million or 3% over the prior year. This increase was primarily due
to higher staff-related costs necessary to support ongoing
research and product development activities and higher clinical
trial costs. These increases were substantially offset by a reduction
in clinical manufacturing and product licensing costs. In 1999,
research and development expenses increased $159.5 million or
24% over the prior year. This increase was primarily due to product
licensing and development costs related to the collaboration with
PRAECIS PHARMACEUTICALS INCORPORATED and higher staff-
related costs necessary to support ongoing research and product
development activities.

Selling, General and Administrative
In 2000, selling, general and administrative (“SG&A’’) expenses
increased $172.6 million or 26% over the prior year. This increase
was primarily due to higher staff-related costs and outside market-
ing expenses as the Company continues to support its existing
products and prepares for anticipated new product launches. In
1999, SG&A expenses increased $138.9 million or 27% over the
prior year primarily due to higher staff-related costs and outside
marketing expenses as the Company prepared for anticipated new
product launches.
Interest and Other Income
In 2000, interest and other income increased $57.9 million or 66%
over the prior year. This increase was primarily due to gains realized
on the sale of certain equity securities in the Company’s portfolio
and higher interest income generated from the Company’s invest-
ment portfolio as a result of higher average cash balances and
higher interest rates. In 1999, interest and other income increased
$42.6 million or 93% over the prior year. This increase was princi-
pally due to the absence of write-downs recorded in 1998 of certain
non-current assets, primarily marketable equity securities.
Income Taxes
The Company’s effective tax rate was 32.0%, 30.0% and 29.5%
for 2000, 1999 and 1998, respectively. The tax rate in all three
years reflected the tax benefits from the sale of products manufac-
tured in the Company’s Puerto Rico manufacturing facility. The
Company’s tax rate has increased as a result of increased taxable
income combined with a provision in the federal tax law that caps
tax benefits associated with the Company’s Puerto Rico operations
at the 1995 income level. In addition, the 2000 tax rate increased
as a result of the write-off of acquired in-process research and
development, which is not deductible for tax purposes.
Management’s Discussion and Analysis
of Financial Condition and Results of Operations
91 $97.992 $319.793 $357.694 $537.795 $644.3
R&DSG&ACost of Sales
Selected Operating Expenses (as a Percent of Product Sales)
25
.3%
22
.5%
96
13
.6%
28
.4%
21
.8%
97
13
.6%
26
.4%
20
.5%
98
13
.7%
27
.0%
21
.5%
99
13
.2%
26
.4%
25
.8%
00
12
.8%
Other Items, Net
Other items, net consisted of three non-recurring items: 1) legal
awards associated with the spillover arbitration with Johnson &
Johnson, 2) a write-off of acquired in-process research and devel-
opment associated with the acquisition of Kinetix Pharmaceuticals,
Inc. and 3) a charitable contribution to the Amgen Foundation.
See Note 4 to the Consolidated Financial Statements.
25

Financial Outlook
In December 1999 and early 2000, the Company filed regulatory
submissions for the use of ARANESP TM in patients with chronic renal
insufficiency and chronic renal failure in the U.S., the European
Union, Canada, Australia and New Zealand. The Company antici-
pates selling ARANESP TM, if approved, in most of these markets
beginning in 2001. Because the Company is unable to predict the
timing and the extent to which health care providers in the U.S.
may transition from administering EPOGEN® to ARANESP TM, 2001
sales guidance for EPOGEN® and ARANESP TM will be provided on a
combined basis. The Company expects the percentage increase
of 2001 sales of EPOGEN® and ARANESP TM combined over 2000
EPOGEN® sales to be in the range of high teens to low twenties.
Patients receiving treatment for end stage renal disease are cov-
ered primarily under medical programs provided by the federal
government. Therefore, EPOGEN® sales may also be affected by
future changes in reimbursement rates or a change in the basis for
reimbursement by the federal government. In addition, ARANESP TM
sales will be affected by government and private payor reimburse-
ment policies.
In 2001, the Company expects the NEUPOGEN® sales growth rate
to be in the high single digits. The Company believes that there is
a trend in some cancer settings towards the use of chemotherapy
treatments that are less myelosuppressive. Chemotherapy treat-
ments that are less myelosuppressive may require less NEUPOGEN®.
Future NEUPOGEN® demand is dependent primarily upon penetra-
tion of existing markets and the effects of competitive products.
NEUPOGEN® usage is expected to continue to be affected by cost
containment pressures from governments and private insurers on
health care providers worldwide. In addition, reported NEUPOGEN®
sales will continue to be affected by changes in foreign currency
exchange rates. In both domestic and foreign markets, sales of
NEUPOGEN® are dependent, in part, on the availability of reim-
bursement from third party payors such as governments (for
example, Medicare and Medicaid programs in the U.S.) and private
insurance plans. Therefore, NEUPOGEN® sales may also be affect-
ed by future changes in reimbursement rates or changes in the
bases for reimbursement.
INFERGEN® (Interferon alfacon-1) was launched in October 1997
for the treatment of chronic hepatitis C virus infection. There are
other treatments, including combination therapy, for this infection
against which INFERGEN® competes. The Company cannot predict
the extent to which it will maintain its share or further penetrate
this market.
For 2001, total product sales are expected to grow in the mid to
high teens, cost of sales is expected to be in the range of 11.5%
to 12.5% of total product sales, corporate partner revenues are
expected to be approximately the same as in 2000, research and
development expenses and SG&A expenses are each estimated to
be in the range of 25% to 27% of total product sales, the effective
tax rate is expected to be approximately 34%, and earnings per
share is expected to grow in the mid teens.
Estimates of future product sales, operating expenses and earn-
ings per share are necessarily speculative in nature and are difficult
to predict with accuracy.
Except for the historical information contained herein, the matters
discussed herein are by their nature forward-looking. Investors are
cautioned that forward-looking statements or projections made by
the Company, including those made in this document, are subject to
risks and uncertainties that may cause actual results to differ mate-
rially from those projected. Reference is made in particular to for-
ward-looking statements regarding product sales, earnings per
share and expenses. Amgen operates in a rapidly changing environ-
ment that involves a number of risks, some of which are beyond the
Company’s control. Future operating results and the Company’s
stock price may be affected by a number of factors, including,
without limitation: (i) the results of preclinical and clinical trials; (ii)
regulatory approvals of product candidates, new indications and
manufacturing facilities; (iii) reimbursement for Amgen’s products
by governments and private payors; (iv) health care guidelines and
policies relating to Amgen’s products; (v) intellectual property mat-
ters (patents) and the results of litigation; (vi) competition; (vii) fluc-
tuations in operating results and (viii) rapid growth of the Company.
These factors and others are discussed herein and in the sections
appearing under the heading “Business - Factors That May Affect
Amgen” in the Company’s Annual Report on Form 10-K for the
year ended December 31, 2000, which sections are incorporated
herein by reference.
26
Management’s Discussion and Analysis
of Financial Condition and Results of Operations

Quantitative and Qualitative Disclosures about Market Risk
Interest income earned on the Company’s investment portfolio is
affected by changes in the general level of U.S. interest rates. The
Company’s short-term borrowings effectively bear interest at
variable rates and therefore, changes in U.S. interest rates affect
interest expense incurred thereon. The Company had reduced this
exposure to interest rate changes by entering into an interest rate
swap agreement, which expired during 2000, that effectively
changed the interest expense incurred on a portion of its short-term
borrowings to a fixed rate. Changes in interest rates do not affect
interest expense incurred on the Company’s long-term borrowings
because they all bear interest at fixed rates. The following tables
provide information about the Company’s financial instruments that
are sensitive to changes in interest rates. For the Company’s invest-
ment portfolio and debt obligations, the tables present principal
cash flows and related weighted-average interest rates by expect-
ed maturity dates. Additionally, the Company has assumed its
available-for-sale debt securities, comprised primarily of corporate
debt instruments and treasury securities, are similar enough to
aggregate those securities for presentation purposes. For the
interest rate swap, the tables present the notional amount and
weighted-average interest rates by contractual maturity date. The
notional amount is used to calculate the contractual cash flows to
be exchanged under the contract.
Interest Rate Sensitivity
Principal Amount by Expected Maturity as of 12/31/99
Dollars in Millions, Fair ValueAverage Interest Rate 2000 2001 2002 2003 2004 Thereafter Total 12/31/99
Available-for-sale debt securities $ 376.8 $ 721.8 $ 177.7 $ 17.0 $ 5.0 — $ 1,298.3 $ 1,293.6 Interest rate 6.3% 6.4% 6.5% 6.0% 5.6% —
Commercial paper $ 100.0 — — — — — $ 100.0 $ 100.0Interest rate 6.4% — — — — —
Long-term debt — — — $ 23.0 — $ 200.0 $ 223.0 $ 216.6Interest rate — — — 6.2% — 7.3%
Interest rate swap related tocommercial paper issuances:
Pay fixed/receive variable $ 50.0 — — — — — $ 50.0 $ 0.3 Avg. pay rate 5.3% — — — — —Avg. receive rate 6.0% — — — — —
Principal Amount by Expected Maturity as of 12/31/00
Dollars in Millions, Fair ValueAverage Interest Rate 2001 2002 2003 2004 2005 Thereafter Total 12/31/00
Available-for-sale debt securities $ 780.4 $ 740.6 $ 232.3 $ 118.5 $ 60.0 — $ 1,931.8 $ 1,950.2 Interest rate 6.6% 6.7% 7.0% 6.5% 7.0% —
Commercial paper $ 100.0 — — — — — $ 100.0 $ 100.0Interest rate 6.7% — — — — —
Long-term debt — — $ 23.0 — — $ 200.0 $ 223.0 $ 222.0Interest rate — — 6.2% — — 7.3%
27
The Company is exposed to equity price risks on the marketable portion of equity securities included in its portfolio of investments
entered into for the promotion of business and strategic objectives. These investments are generally in small capitalization stocks in the
biotechnology industry sector. The Company typically does not attempt to reduce or eliminate its market exposure on these securities.
An 80% adverse change in equity prices would result in a decrease of approximately $178 million and $72 million in the fair value of the
Company’s available-for-sale marketable equity securities at December 31, 2000 and 1999, respectively.

28
Consolidated Statements of Operations(In millions, except per share data)
Years ended December 31, 2000 1999 1998
Revenues:
Product sales $ 3,202.2 $ 3,042.8 $ 2,514.4
Corporate partner revenues 246.2 161.4 127.9
Royalty income 181.0 135.9 75.9
Total revenues 3,629.4 3,340.1 2,718.2
Operating expenses:
Cost of sales 408.4 402.1 345.2
Research and development 845.0 822.8 663.3
Selling, general and administrative 826.9 654.3 515.4
Loss of affiliates, net 23.9 16.8 28.6
Other items, net (18.8) (49.0) (23.0)
Total operating expenses 2,085.4 1,847.0 1,529.5
Operating income 1,544.0 1,493.1 1,188.7
Other income (expense):
Interest and other income, net 146.2 88.3 45.7
Interest expense, net (15.9) (15.2) (10.0)
Total other income 130.3 73.1 35.7
Income before income taxes 1,674.3 1,566.2 1,224.4
Provision for income taxes 535.8 469.8 361.2
Net income $ 1,138.5 $ 1,096.4 $ 863.2
Earnings per share:
Basic $ 1.11 $ 1.07 $ 0.85
Diluted $ 1.05 $ 1.02 $ 0.82
Shares used in calculation of earnings per share:
Basic 1,029.6 1,021.7 1,020.2
Diluted 1,084.7 1,078.3 1,057.3
See accompanying notes.

29
Consolidated Balance Sheets(In millions, except per share data)
December 31, 2000 1999
Assets
Current assets:
Cash and cash equivalents $ 226.5 $ 130.9
Marketable securities 1,801.6 1,202.1
Trade receivables, net of allowance for doubtful
accounts of $21.2 in 2000 and $26.0 in 1999 389.2 412.2
Inventories 305.2 184.3
Other current assets 214.6 135.8
Total current assets 2,937.1 2,065.3
Property, plant and equipment at cost, net 1,781.5 1,553.6
Other assets 681.0 458.7
$ 5,399.6 $ 4,077.6
Liabilities and Stockholders’ Equity
Current liabilities:
Accounts payable $ 143.2 $ 83.4
Commercial paper 99.7 99.5
Accrued liabilities 619.2 648.2
Total current liabilities 862.1 831.1
Long-term debt 223.0 223.0
Stockholders’ equity:
Preferred stock; $0.0001 par value; 5.0 shares authorized;
none issued or outstanding — —
Common stock and additional paid-in capital; $0.0001 par value;
2,750.0 shares authorized; outstanding - 1,037.4 shares in
2000 and 1,017.9 shares in 1999 2,947.3 2,072.3
Retained earnings 1,304.6 966.0
Accumulated other comprehensive income (loss) 62.6 (14.8)
Total stockholders’ equity 4,314.5 3,023.5
$ 5,399.6 $ 4,077.6
See accompanying notes.

30
Consolidated Statements of Stockholders’ Equity(In millions)
Common stock otherNumber and additional Retained comprehensive
Years ended December 31, 2000, 1999 and 1998 of shares paid-in capital earnings income (loss) Total
Balance at December 31, 1997 1,033.1 $ 1,218.2 $ 943.2 $ (22.1) $ 2,139.3
Comprehensive Income:
Net income — — 863.2 — 863.2
Other comprehensive income, net of tax:
Unrealized gains on securities, net of reclassification adjustments — — — 9.1 9.1
Foreign currency translation adjustments — — — 9.0 9.0
Total other comprehensive income — — — — 18.1
Comprehensive income — — — — 881.3
Issuance of common stock upon the exercise of employee stock options and in connection with an employee stock purchase plan 42.8 345.5 — — 345.5
Tax benefits related to employee stock options — 108.2 — — 108.2
Repurchases of common stock (57.4) — (912.1) — (912.1)
Balance at December 31, 1998 1,018.5 1,671.9 894.3 (4.0) 2,562.2
Comprehensive Income:
Net income — — 1,096.4 — 1,096.4
Other comprehensive loss, net of tax:
Unrealized gains on securities,net of reclassification adjustments — — — 7.3 7.3
Foreign currency translation adjustments — — — (18.1) (18.1)
Total other comprehensive loss — — — — (10.8)
Comprehensive income — — — — 1,085.6
Issuance of common stock upon the exercise ofemployee stock options 26.5 248.8 — — 248.8
Tax benefits related to employee stock options — 151.6 — — 151.6
Repurchases of common stock (27.1) — (1,024.7) — (1,024.7)
Balance at December 31, 1999 1,017.9 2,072.3 966.0 (14.8) 3,023.5
Comprehensive Income:
Net income — — 1,138.5 — 1,138.5
Other comprehensive income, net of tax:
Unrealized gains on securities,net of reclassification adjustments — — — 99.0 99.0
Foreign currency translation adjustments — — — (21.6) (21.6)
Total other comprehensive income — — — — 77.4
Comprehensive income — — — — 1,215.9
Issuance of common stock upon the exercise of employee stock options and in connectionwith an employee stock purchase plan 29.1 333.7 — — 333.7
Tax benefits related to employee stock options — 376.6 — — 376.6
Issuance of common stock for the acquisitionof Kinetix Pharmaceuticals, Inc. 2.6 164.7 — — 164.7
Repurchases of common stock (12.2) — (799.9) — (799.9)
Balance at December 31, 2000 1,037.4 $ 2,947.3 $ 1,304.6 $ 62.6 $ 4,314.5
See accompanying notes.
Accumulated

31
Consolidated Statements of Cash Flows(In millions)
Years ended December 31, 2000 1999 1998
Cash flows from operating activities:
Net income $ 1,138.5 $ 1,096.4 $ 863.2
Write-off of acquired in-process research and development 30.1 — —
Depreciation and amortization 211.8 176.8 143.8
Tax benefits related to employee stock options 376.6 151.6 108.2
Gain on equity investments (31.8) — (17.3)
Other non-cash expenses 6.2 9.8 27.5
Loss of affiliates, net 23.9 16.8 28.6
Cash provided by (used in):
Trade receivables, net 23.0 (92.3) (50.9)
Inventories (120.9) (73.5) (1.6)
Other current assets (51.4) (9.0) (21.2)
Accounts payable 59.8 (38.2) 17.7
Accrued liabilities (31.2) (11.5) 51.7
Net cash provided by operating activities 1,634.6 1,226.9 1,149.7
Cash flows from investing activities:
Purchases of property, plant and equipment (437.7) (304.2) (407.8)
Proceeds from maturities of marketable securities — 40.0 20.1
Proceeds from sales of marketable securities 1,067.8 843.5 466.2
Purchases of marketable securities (1,638.7) (1,032.7) (766.3)
Other (27.7) (10.1) 14.1
Net cash used in investing activities (1,036.3) (463.5) (673.7)
Cash flows from financing activities:
Increase (decrease) in commercial paper 0.2 (0.2) 99.7
Net proceeds from issuance of common stock upon the
exercise of employee stock options and in
connection with an employee stock purchase plan 333.7 248.8 345.5
Repurchases of common stock (799.9) (1,024.7) (912.1)
Other (36.7) (57.5) (47.1)
Net cash used in financing activities (502.7) (833.6) (514.0)
Increase (decrease) in cash and cash equivalents 95.6 (70.2) (38.0)
Cash and cash equivalents at beginning of period 130.9 201.1 239.1
Cash and cash equivalents at end of period $ 226.5 $ 130.9 $ 201.1
See accompanying notes.

Note 1
Summary of Significant Accounting Policies
Business
Amgen Inc. (“Amgen” or the “Company”) is a global biotech-
nology company that discovers, develops, manufactures and
markets human therapeutics based on advances in cellular and
molecular biology.
Principles of Consolidation
The consolidated financial statements include the accounts of
the Company and its wholly owned subsidiaries as well as affil-
iated companies in which the Company has a controlling financial
interest and exercises control over their operations (“majority
controlled affiliates”). All material intercompany transactions and
balances have been eliminated in consolidation. Investments in
affiliated companies which are 50% or less owned and where the
Company exercises significant influence over operations are
accounted for using the equity method. All other equity invest-
ments are accounted for under the cost method. The caption
“Loss of affiliates, net” includes Amgen’s equity in the operating
results of affiliated companies and the minority interest others hold
in the operating results of Amgen’s majority controlled affiliates.
Cash and Cash Equivalents
The Company considers cash equivalents to be only those invest-
ments which are highly liquid, readily convertible to cash and which
mature within three months from date of purchase. Under the
Company’s cash management system, the bank notifies the
Company daily of checks presented for payment against its primary
disbursement accounts. The Company transfers funds from short-
term investments to cover the checks presented for payment. This
system results in a book cash overdraft in the primary disbursement
accounts as a result of checks outstanding. The book overdraft,
which was reclassified to accounts payable, was $101.2 million and
$43.9 million at December 31, 2000 and 1999, respectively.
Available-for-Sale Securities
The Company considers its investment portfolio and marketable
equity investments available-for-sale as defined in Statement of
Financial Accounting Standards (“SFAS”) No. 115 and, accord-
ingly, these investments are recorded at fair value (see Note 9,
“Fair Values of Financial Instruments”). Realized gains totaled
$32.4 million, $2.8 million and $17.3 million for the years ended
December 31, 2000, 1999 and 1998, respectively. Realized loss-
es totaled $2.5 million, $6.6 million and $33.1 million for the years
ended December 31, 2000, 1999 and 1998, respectively. The
cost of securities sold is based on the specific identification
method. The fair value of available-for-sale investments by type of
security, contractual maturity and classification in the balance
sheets are as follows (in millions):
32
Notes to Consolidated Financial StatementsDecember 31, 2000
Gross GrossAmortized Unrealized Unrealized Estimated
Cost Gains Losses Fair Value
December 31, 2000
Type of security:
Corporate debt securities $ 1,054.7 $ 11.3 $ (1.4) $ 1,064.6
U.S. Treasury securities and obligations of
U.S. government agencies 663.6 5.9 — 669.5
Other interest bearing securities 215.8 0.4 (0.1) 216.1
Total debt securities 1,934.1 17.6 (1.5) 1,950.2
Equity securities 73.1 179.2 (7.0) 245.3
$ 2,007.2 $ 196.8 $ (8.5) $ 2,195.5
December 31, 1999
Type of security:
Corporate debt securities $ 963.8 $ 0.4 $ (10.8) $ 953.4
U.S. Treasury securities and obligations of
U.S. government agencies 209.9 — (1.6) 208.3
Other interest bearing securities 132.4 — (0.5) 131.9
Total debt securities 1,306.1 0.4 (12.9) 1,293.6
Equity securities 66.8 46.7 (8.9) 104.6
$ 1,372.9 $ 47.1 $ (21.8) $ 1,398.2

33
December 31, 2000 1999
Contractual maturity:
Maturing in one year or less $ 783.6 $ 376.4
Maturing after one year
through three years 986.1 896.0
Maturing after three years 180.5 21.2
Total debt securities 1,950.2 1,293.6
Equity securities 245.3 104.6
$ 2,195.5 $ 1,398.2
Classification in balance sheets:
Cash and cash equivalents $ 226.5 $ 130.9
Marketable securities 1,801.6 1,202.1
Other assets–noncurrent 285.3 144.6
2,313.4 1,477.6
Less cash (117.9) (79.4)
$ 2,195.5 $ 1,398.2
The primary objectives for the Company’s investment portfolio are
liquidity and safety of principal. Investments are made to achieve
the highest rate of return to the Company, consistent with these
two objectives. The Company’s investment policy limits invest-
ments to certain types of instruments issued by institutions with
investment grade credit ratings and places restrictions on maturi-
ties and concentration by type and issuer.
Inventories
Inventories are stated at the lower of cost or market. Cost is deter-
mined in a manner which approximates the first-in, first-out (FIFO)
method. Inventories consist of currently marketed products and
product candidates which the Company expects to commercialize.
The inventory balance of such product candidates totaled $112.7
million and $20.3 million as of December 31, 2000 and 1999,
respectively. Inventories are shown net of applicable reserves and
allowances. Inventories consisted of the following (in millions):
December 31, 2000 1999
Raw materials $ 29.4 $ 37.5
Work in process 238.7 96.6
Finished goods 37.1 50.2
$ 305.2 $ 184.3
Depreciation and Amortization
Depreciation of buildings and equipment is provided over their
estimated useful lives on a straight-line basis. Leasehold improve-
ments are amortized on a straight-line basis over the shorter of their
estimated useful lives or lease terms, including periods covered by
options which are expected to be exercised. Useful lives by asset
category are as follows:
Asset Category Years
Buildings and building improvements 10 – 30
Manufacturing equipment 5 – 10
Laboratory equipment 5 – 10
Furniture and office equipment 3 – 10
Long-Lived Assets
The Company reviews its long-lived assets for impairment when-
ever events or changes in circumstances indicate that the carry-
ing amount of an asset may not be recoverable.
Product Sales
Product sales primarily consist of sales of EPOGEN® (Epoetin alfa)
and NEUPOGEN® (Filgrastim) (see Note 10, “Segment Information”).
The Company has the exclusive right to sell Epoetin alfa for dial-
ysis, diagnostics and all non-human uses in the United States.
The Company sells Epoetin alfa under the brand name EPOGEN®.
Amgen has granted to Ortho Pharmaceutical Corporation (which
has assigned its rights under the product license agreement to
Ortho Biotech Products, L.P.), a subsidiary of Johnson & Johnson
(“Johnson & Johnson”), a license relating to Epoetin alfa for sales
in the United States for all human uses except dialysis and
diagnostics. Pursuant to this license, Amgen does not recognize
product sales it makes into the exclusive market of Johnson &
Johnson and does recognize the product sales made by Johnson
& Johnson into Amgen’s exclusive market. Sales in Amgen’s
exclusive market and adjustments thereto are derived from
Company shipments and from third-party data on shipments to
end users and their usage (see Note 4, “Other Items, Net – Legal
Award”). Sales of the Company’s other products are recognized
when shipped and title has passed.
Research and Development Costs
Research and development costs are expensed as incurred,
including the cost to acquire in-process research and develop-
ment (see Note 11, “Business Combination”).
Notes to Consolidated Financial Statements

34
Foreign Currency Transactions
The Company has a program to manage foreign currency risk. As
part of this program, it has purchased foreign currency option and
forward contracts to hedge against possible reductions in values
of certain anticipated foreign currency cash flows generally over
the next 12 months. At December 31, 2000, the Company had
option contracts and forward contracts to exchange foreign cur-
rencies for U.S. dollars of $10.0 million and $150.6 million,
respectively, all having maturities of eleven months or less. The
option contracts, which have only nominal intrinsic value at the
time of purchase, are designated as effective hedges of anticipat-
ed foreign currency transactions for financial reporting purposes
and, accordingly, the net gains on such contracts are deferred and
recognized in the same period as the hedged transactions. The
forward contracts do not qualify as hedges for financial reporting
purposes and, accordingly, are marked-to-market. Net gains real-
ized on option contracts and changes in market values of forward
contracts are reflected in “Interest and other income, net” in the
accompanying consolidated statements of operations. The
deferred premiums on option contracts and fair values of forward
contracts are included in “Other current assets” in the accom-
panying consolidated balance sheets.
The Company has additional foreign currency forward contracts
to hedge exposures to foreign currency fluctuations of certain
assets and liabilities denominated in foreign currencies. At
December 31, 2000, the Company had forward contracts to
exchange foreign currencies for U.S. dollars of $37.8 million, all
having maturities of less than one month. These contracts are
designated as effective hedges and, accordingly, gains and loss-
es on these forward contracts are recognized in the same period
the offsetting gains and losses of hedged assets and liabilities are
realized and recognized. The fair values of the forward contracts
are included in the corresponding captions of the hedged assets
and liabilities. Gains and losses on forward contracts and the
related hedged assets and liabilities are included in “Interest and
other income, net” in the accompanying consolidated statements
of operations.
Recent Accounting Pronouncements
In June 1998, the Financial Accounting Standards Board issued
SFAS No. 133, “Accounting for Derivative Instruments and Hedging
Activities”. SFAS No. 133 establishes accounting and reporting
standards requiring that all derivatives be recorded in the balance
sheet as either an asset or liability measured at fair value and that
changes in fair value be recognized currently in earnings, unless
specific hedge accounting criteria are met. Certain provisions of
SFAS No. 133, including its required implementation date, were
subsequently amended. The Company will adopt SFAS No. 133, as
amended, in the first quarter of 2001 and its adoption will not have
a material effect on the Company’s results of operations or finan-
cial position.
In December 1999, the Securities and Exchange Commission
issued Staff Accounting Bulletin No. 101, “Revenue Recognition in
Financial Statements” (“SAB 101”). SAB 101 provides guidance on
applying generally accepted accounting principles to revenue
recognition issues in financial statements. The Company adopted
SAB 101 in the fourth quarter of 2000 and its adoption has not had
a material effect on the Company’s results of operations or finan-
cial position.
In July 2000, the Emerging Issues Task Force (“EITF”) issued EITF
00-15, “Classification in the Statement of Cash Flows of the
Income Tax Benefit Realized by a Company upon Employee
Exercise of a Nonqualified Stock Option”, which requires com-
panies to classify the income tax benefits related to employee
exercises of nonqualified stock options as an operating activity in
the statement of cash flows for both current and prior periods.
Prior to the adoption of EITF 00-15 in the third quarter of 2000,
Amgen had classified these amounts in financing activities in the
consolidated statements of cash flows. In addition, the Company
has included the income tax benefits related to disqualifying dis-
positions of incentive stock options within this reclassification.
Interest
Interest costs are expensed as incurred, except to the extent such
interest is related to construction in progress, in which case inter-
est is capitalized. Interest costs capitalized for the years ended
December 31, 2000, 1999 and 1998, were $12.3 million, $11.6
million and $19.2 million, respectively.
Employee Stock Option and Stock Purchase Plans
The Company’s employee stock option and stock purchase
plans are accounted for under Accounting Principles Board
Opinion No. 25, “Accounting for Stock Issued to Employees”
(“APB 25”). See Note 7, “Employee Stock Option, Stock Purchase
and Defined Contribution Plans”.
Earnings Per Share
Basic earnings per share is based upon the weighted-average
number of common shares outstanding. Diluted earnings per
share is based upon the weighted-average number of common
shares and dilutive potential common shares outstanding.
Potential common shares are outstanding options under the
Company’s employee stock option plans, restricted stock and
potential issuances of stock under the employee stock purchase
plan which are included under the treasury stock method.
Notes to Consolidated Financial Statements
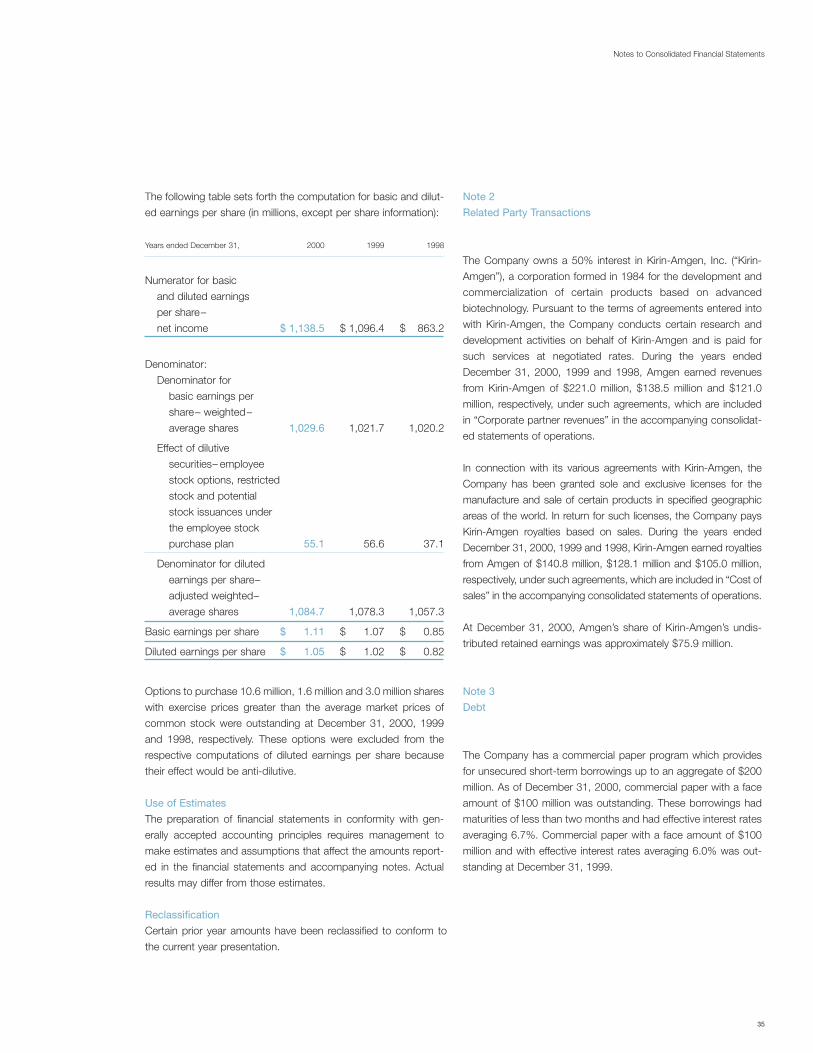
35
The following table sets forth the computation for basic and dilut-
ed earnings per share (in millions, except per share information):
Years ended December 31, 2000 1999 1998
Numerator for basic
and diluted earnings
per share–
net income $ 1,138.5 $ 1,096.4 $ 863.2
Denominator:
Denominator for
basic earnings per
share– weighted–
average shares 1,029.6 1,021.7 1,020.2
Effect of dilutive
securities– employee
stock options, restricted
stock and potential
stock issuances under
the employee stock
purchase plan 55.1 56.6 37.1
Denominator for diluted
earnings per share–
adjusted weighted–
average shares 1,084.7 1,078.3 1,057.3
Basic earnings per share $ 1.11 $ 1.07 $ 0.85
Diluted earnings per share $ 1.05 $ 1.02 $ 0.82
Options to purchase 10.6 million, 1.6 million and 3.0 million shares
with exercise prices greater than the average market prices of
common stock were outstanding at December 31, 2000, 1999
and 1998, respectively. These options were excluded from the
respective computations of diluted earnings per share because
their effect would be anti-dilutive.
Use of Estimates
The preparation of financial statements in conformity with gen-
erally accepted accounting principles requires management to
make estimates and assumptions that affect the amounts report-
ed in the financial statements and accompanying notes. Actual
results may differ from those estimates.
Reclassification
Certain prior year amounts have been reclassified to conform to
the current year presentation.
Note 2
Related Party Transactions
The Company owns a 50% interest in Kirin-Amgen, Inc. (“Kirin-
Amgen”), a corporation formed in 1984 for the development and
commercialization of certain products based on advanced
biotechnology. Pursuant to the terms of agreements entered into
with Kirin-Amgen, the Company conducts certain research and
development activities on behalf of Kirin-Amgen and is paid for
such services at negotiated rates. During the years ended
December 31, 2000, 1999 and 1998, Amgen earned revenues
from Kirin-Amgen of $221.0 million, $138.5 million and $121.0
million, respectively, under such agreements, which are included
in “Corporate partner revenues” in the accompanying consolidat-
ed statements of operations.
In connection with its various agreements with Kirin-Amgen, the
Company has been granted sole and exclusive licenses for the
manufacture and sale of certain products in specified geographic
areas of the world. In return for such licenses, the Company pays
Kirin-Amgen royalties based on sales. During the years ended
December 31, 2000, 1999 and 1998, Kirin-Amgen earned royalties
from Amgen of $140.8 million, $128.1 million and $105.0 million,
respectively, under such agreements, which are included in “Cost of
sales” in the accompanying consolidated statements of operations.
At December 31, 2000, Amgen’s share of Kirin-Amgen’s undis-
tributed retained earnings was approximately $75.9 million.
Note 3
Debt
The Company has a commercial paper program which provides
for unsecured short-term borrowings up to an aggregate of $200
million. As of December 31, 2000, commercial paper with a face
amount of $100 million was outstanding. These borrowings had
maturities of less than two months and had effective interest rates
averaging 6.7%. Commercial paper with a face amount of $100
million and with effective interest rates averaging 6.0% was out-
standing at December 31, 1999.
Notes to Consolidated Financial Statements

36
The Company has established a $500 million debt shelf regis-
tration statement. In December 1997, pursuant to this registration
statement, the Company issued $100 million of debt securities
that bear interest at a fixed rate of 6.5% and mature in 2007 (the
“Notes”) and established a $400 million medium-term note pro-
gram. The Company may offer and issue medium-term notes from
time to time with terms to be determined by market conditions.
The Company had $100 million of debt securities outstanding at
December 31, 2000 and 1999 that bear interest at a fixed rate of
8.1% and mature in 2097 (the “Century Notes”). These securities
may be redeemed in whole or in part at the Company’s option at
any time for a redemption price equal to the greater of the princi-
pal amount to be redeemed or the sum of the present values of
the principal and remaining interest payments discounted at a
determined rate plus, in each case, accrued interest.
In addition to the Notes and the Century Notes, debt securities
outstanding at December 31, 2000 and 1999 include $23 million
of debt securities that bear interest at a fixed rate of 6.2% and
mature in 2003. The terms of the debt securities require the
Company to meet certain debt to tangible net asset ratios and
places limitations on liens and sale/leaseback transactions and,
except with respect to the Notes and the Century Notes, places
limitations on subsidiary indebtedness.
The Company has an unsecured credit facility (the “credit facility”)
that includes a commitment expiring on May 28, 2003 for up
to $150 million of borrowings under a revolving line of credit (the
“revolving line commitment”). This credit facility supports
the Company’s commercial paper program. As of December
31, 2000, $150 million was available under the revolving line
commitment for borrowing. Borrowings under the revolving line
commitment bear interest at various rates which are a function of,
at the Company’s option, either the prime rate of a major bank,
the federal funds rate or a Eurodollar base rate. Under the terms
of the credit facility, the Company is required to meet a minimum
interest coverage ratio and maintain a minimum level of tangible
net worth. In addition, the credit facility contains limitations on
investments, liens and sale/leaseback transactions.
The aggregate stated maturities of all long-term obligations due
subsequent to December 31, 2000, are as follows: none in 2001
and 2002; $23 million in 2003; none in 2004 and 2005; and $200
million after 2005.
Note 4
Other Items, Net
Other items, net in the accompanying consolidated statements of
operations consists of the following (income) and expense items
(in millions):
Years ended December 31, 2000 1999 1998
Legal award, net $(73.9) $(49.0) $(23.0)
Write-off of acquired
in-process research and
development (see Note 11) 30.1 — —
Amgen Foundation
contribution 25.0 — —
Other items, net $(18.8) $(49.0) $(23.0)
Legal Award
In September 1985, the Company granted Johnson & Johnson’s
affiliate, Ortho Pharmaceutical Corporation, a license relating to
certain patented technology and know-how of the Company to
sell a genetically engineered form of recombinant human erythro-
poietin, called Epoetin alfa, throughout the United States for all
human uses except dialysis and diagnostics. A number of disputes
have arisen between Amgen and Johnson & Johnson as to their
respective rights and obligations under the various agreements
between them, including the agreement granting the license (the
“License Agreement”).
A dispute between Amgen and Johnson & Johnson that had been
the subject of an arbitration proceeding related to the audit
methodology currently employed by the Company to account for
Epoetin alfa sales. Under the License Agreement, the Company
and Johnson & Johnson are required to compensate each other
for Epoetin alfa sales that either party makes into the other party’s
exclusive market, sometimes described as “spillover” sales. The
Company has established and is employing an audit methodology
to measure each party’s spillover sales and to allocate the net prof-
its from those sales to the appropriate party. The arbitrator in this
dispute (the “Arbitrator”) issued a final order adopting the
Company’s audit methodology with certain adjustments and also
found that the Company was the successful party in the arbitra-
tion. Pursuant to the final order in the arbitration, an independent
panel was formed principally (i) to address ongoing challenges to
the survey results for the years 1995 through 1999 and (ii) to refine
the procedures for measuring the erythropoietin market as may be
necessary. As a result of decisions made by this independent panel
regarding certain challenges by Johnson & Johnson as well as
Notes to Consolidated Financial Statements

37
other reduced uncertainties, the Company reduced amounts pre-
viously provided for potential spillover liabilities by $49 million in the
third quarter of 1999 and $23 million in the fourth quarter of 1998.
Because the Arbitrator ruled that the Company was the success-
ful party in the arbitration, Johnson & Johnson was ordered to pay
to the Company all costs and expenses, including reasonable
attorneys’ fees, that the Company incurred in the arbitration as well
as one-half of the audit costs. On July 17, 2000, the Arbitrator
issued a final order awarding the Company approximately $78 mil-
lion in costs and expenses, including reasonable attorneys’ fees,
that the Company incurred in the arbitration as well as one-half of
the audit costs (the “Fee Award”). As a result, the Company
recorded a net $73.9 million legal award, which represents the Fee
Award reduced by minor amounts related to other miscellaneous
disputes with Johnson & Johnson, in the third quarter of 2000.
Amgen Foundation Contribution
During the fourth quarter of 2000, the Company contributed $25.0
million to the Amgen Foundation. This contribution will allow the
Amgen Foundation to increase its support of non-profit organ-
izations that focus on issues in health and medicine, science
education and other activities that strengthen local communities
over the next several years.
Note 5
Income Taxes
The provision for income taxes includes the following
(in millions):
Years ended December 31, 2000 1999 1998
Current provision:
Federal (including
U.S. possessions) $ 481.7 $ 422.8 $ 339.6
State 47.5 37.2 27.2
Total current provision 529.2 460.0 366.8
Deferred provision (benefit):
Federal (including
U.S. possessions) 9.6 5.3 (4.7)
State (3.0) 4.5 (0.9)
Total deferred provision
(benefit) 6.6 9.8 (5.6)
$ 535.8 $ 469.8 $ 361.2
Deferred income taxes reflect the net tax effects of net operating
loss and credit carryforwards and temporary differences between
the carrying amounts of assets and liabilities for financial reporting
purposes and the amounts used for income tax purposes.
Significant components of the Company’s deferred tax assets and
liabilities are as follows (in millions):
December 31, 2000 1999
Deferred tax assets:
Acquired net operating loss
and credit carryforwards $ 66.0 $ 64.3
Expenses capitalized for
tax purposes 58.9 27.9
Fixed assets 46.0 22.9
Expense accruals 32.9 84.0
Other 20.0 27.4
Total deferred tax assets 223.8 226.5
Valuation allowance (25.4) (46.0)
Net deferred tax assets 198.4 180.5
Deferred tax liabilities:
Purchase of technology rights (95.9) (78.1)
Marketable securities and
investments (62.6) (10.0)
Other (39.3) (13.9)
Total deferred tax liabilities (197.8) (102.0)
$ 0.6 $ 78.5
At December 31, 2000, the Company had operating loss carry-
forwards available to reduce future federal taxable income of
which $29.3 million expire in 2008, $84.0 million expire in 2009
and $16.8 million expire thereafter. These operating loss carry-
forwards relate to the acquisition of companies. Utilization of these
operating loss carryforwards is limited to approximately $26 million
in 2001, $23 million in 2002 and $16 million per year thereafter.
Notes to Consolidated Financial Statements

38
The provision for income taxes varies from income taxes provided
based on the federal statutory rate as follows:
Years ended December 31, 2000 1999 1998
Statutory rate applied
to income before
income taxes 35.0% 35.0% 35.0%
Benefit of Puerto Rico
operations, net
of Puerto Rico
income taxes (2.0)% (2.3)% (3.2)%
Utilization of tax credits,
primarily research and
experimentation (1.4)% (2.1)% (2.4)%
Other, net 0.4% (0.6)% 0.1%
32.0% 30.0% 29.5%
Income taxes paid during the years ended December 31, 2000,
1999 and 1998, totaled $141.3 million, $318.7 million and $251.3
million, respectively.
Note 6
Stockholders’ Equity
Stockholder Rights Agreement
On February 18, 1997, the Board of Directors of the Company
redeemed the rights under the Company’s former common stock
rights plan and declared a dividend of one preferred share pur-
chase right (a “Right”) for each then outstanding share of common
stock of the Company and authorized the distribution of one Right
with respect to each subsequently issued share of common
stock. The Rights were distributed to stockholders of record on
March 21, 1997. On December 12, 2000, the Board of Directors
of the Company amended and restated the preferred stock rights
plan governing the Rights (the “Amended and Restated Rights
Plan”) to, among other things: (i) provide that, as a result of
two-for-one splits of the Company’s common stock effected in
February and November 1999 (the “Stock Splits”), each Right
shall represent the right to purchase one four-thousandth of a
share of Series A Junior Participating Preferred Stock (“Series A
Preferred Stock”) of the Company (which one four-thousandth
gives effect to the Stock Splits); (ii) increase the exercise price of
each Right to $350.00 from $56.25 (as adjusted for the Stock
Splits); (iii) extend the term of the rights agreement to December
12, 2010 from March 21, 2007 and (iv) amend the definition of
“Outside Director”.
Pursuant to the Amended and Restated Rights Plan, each share
of common stock outstanding has attached to it one whole Right.
One Right represents the right to purchase one four-thousandth
(1/4000) of a share of Series A Preferred Stock of the Company at
$350.00. The Rights will expire on December 12, 2010.
Under certain circumstances, if an acquiring person or group
acquires 10% or more of the Company’s outstanding common
stock, an exercisable Right will entitle its holder (other than the
acquirer) to buy shares of common stock of the Company having
a market value of two times the exercise price of one Right.
However, in limited circumstances approved by the outside direc-
tors of the Board of Directors, a stockholder who enters into an
acceptable standstill agreement may acquire up to 20% of the
outstanding shares without triggering the Rights. If an acquirer
acquires at least 10%, but less than 50%, of the Company’s com-
mon stock, the Board of Directors may exchange each Right
(other than those of the acquirer) for one share of common stock
per Right. In addition, under certain circumstances, if the
Company is involved in a merger or other business combination
where it is not the surviving corporation, an exercisable Right will
entitle its holder to buy shares of common stock of the acquiring
company having a market value of two times the exercise price of
one Right. The Company may redeem the Rights at $0.00025 per
Right at any time prior to the public announcement that a 10%
position has been acquired.
Stock Repurchase Program
The Company has a stock repurchase program primarily to
reduce the dilutive effect of its employee stock option and stock
purchase plans. Stock repurchased under the program is intend-
ed to be retired. The amount the Company spends on and the
number of shares repurchased varies based on a variety of fac-
tors, including the stock price and blackout periods in which the
Company is restricted from repurchasing shares. In December
2000, the Board of Directors authorized the Company to repur-
chase up to $2 billion of common stock between January 1, 2001
and December 31, 2002.
Other Comprehensive Income/(Loss)
SFAS No. 130, “Reporting Comprehensive Income”, requires
unrealized gains and losses on the Company’s available-for-
sale securities and foreign currency translation adjustments to be
included in other comprehensive income/(loss).
Notes to Consolidated Financial Statements

39
Information regarding the components of accumulated other
comprehensive income/(loss) are as follows (in millions):
AccumulatedUnrealized Foreign Other
Gains on Currency ComprehensiveSecurities Translation Income/(Loss)
Balance at
December 31, 1999 $ 15.3 $ (30.1) $ (14.8)
Current year other
comprehensive
income/(loss) 99.0 (21.6) 77.4
Balance at
December 31, 2000 $ 114.3 $ (51.7) $ 62.6
Information regarding the income tax effects for items of other
comprehensive income/(loss) are as follows (in millions):
Before-Tax Tax Benefit / After-TaxAmount (Expense) Amount
For the year ended
December 31, 1998:
Unrealized losses on
available-for-sale securities $ (1.8) $ 0.7 $ (1.1)
Less: Reclassification
adjustments for losses
realized in net income (15.8) 5.6 (10.2)
Net unrealized gains on
available-for-sale securities 14.0 (4.9) 9.1
Foreign currency translation
adjustments 9.0 — 9.0
Other comprehensive income $ 23.0 $ (4.9) $ 18.1
For the year ended
December 31, 1999:
Unrealized gains on
available-for-sale securities $ 12.0 $ (5.3) $ 6.7
Less: Reclassification
adjustments for losses
realized in net income (1.0) 0.4 (0.6)
Net unrealized gains on
available-for-sale securities 13.0 (5.7) 7.3
Foreign currency
translation adjustments (18.1) — (18.1)
Other comprehensive loss $ (5.1) $ (5.7) $(10.8)
Before-Tax Tax Benefit / After-TaxAmount (Expense) Amount
For the year ended
December 31, 2000:
Unrealized gains on
available-for-sale securities $ 193.0 $ (75.8) $ 117.2
Less: Reclassification
adjustments for gains
realized in net income 30.0 (11.8) 18.2
Net unrealized gains on
available-for-sale securities 163.0 (64.0) 99.0
Foreign currency
translation adjustments (21.6) — (21.6)
Other comprehensive income $ 141.4 $ (64.0) $ 77.4
Other
In addition to common stock, the Company’s authorized capital
includes 5.0 million shares of preferred stock, $0.0001 par value,
of which 0.7 million shares have been designated Series A
Preferred Stock. At December 31, 2000 and 1999, no shares of
preferred stock were issued or outstanding.
At December 31, 2000, the Company had reserved 183.1 million
shares of its common stock which may be issued through its
employee stock option and stock purchase plans and had
reserved 0.7 million shares of Series A Preferred Stock.
Note 7
Employee Stock Option, Stock Purchase and
Defined Contribution Plans
Employee Stock Option Plans
The Company’s employee stock option plans provide for option
grants designated as either nonqualified or incentive stock
options. Option grants to employees generally vest over a three to
five year period and expire seven years from the date of grant.
Most employees are eligible to receive a grant of stock options
periodically with the number of shares generally determined by the
employee’s salary grade, performance level and the stock price.
In addition, certain management and professional level employees
normally receive a stock option grant upon hire. As of December
31, 2000, the Company had 67.8 million shares of common stock
available for future grant under its employee stock option plans.
Notes to Consolidated Financial Statements

40
At December 31, 2000, 1999 and 1998, employee stock options
to purchase 55.5 million, 61.7 million and 66.1 million shares were
exercisable at weighted-average prices of $15.35, $11.80 and
$9.76, respectively.
Fair Value Disclosures of Employee Stock Options
Employee stock option grants are set at the closing price of the
Company’s common stock on the date of grant and the related
number of shares granted are fixed at that point in time. Therefore,
under the principles of APB 25, the Company does not recognize
compensation expense associated with the grant of employee
stock options. SFAS No. 123, “Accounting for Stock-Based
Compensation,” requires the use of option valuation models to
provide supplemental information regarding options granted after
1994. Pro forma information regarding net income and earnings
per share shown below was determined as if the Company had
accounted for its employee stock options and shares sold under
its employee stock purchase plan under the fair value method of
that statement.
The fair value of the options was estimated at the date of grant
using a Black-Scholes option pricing model with the following
weighted-average assumptions for 2000, 1999 and 1998, respec-
tively: risk-free interest rates of 5.9%, 5.8% and 5.4%; dividend
yields of 0%, 0% and 0%; volatility factors of the expected market
price of the Company’s common stock of 45%, 38% and 34%;
and expected life of the options of 3.4 years, 3.4 years and 3.4
years. These assumptions resulted in weighted-average fair values
of $25.87, $10.55 and $5.11 per share for employee stock options
granted in 2000, 1999 and 1998, respectively.
The Black-Scholes option valuation model was developed for use
in estimating the fair value of traded options. The Company’s
employee stock options have characteristics significantly different
from those of traded options such as vesting restrictions and
extremely limited transferability. In addition, the assumptions used
in option valuation models (see above) are highly subjective, par-
ticularly the expected stock price volatility of the underlying stock.
Because changes in these subjective input assumptions can
materially affect the fair value estimate, in management’s opinion,
existing valuation models do not provide a reliable single measure
of the fair value of its employee stock options.
40
Notes to Consolidated Financial Statements
Exercise Price
Shares Low High Weighted-Average
Balance unexercised at December 31, 1997 141.9 $ 0.58 $ 16.97 $ 10.02
Granted 33.5 $ 11.78 $ 26.22 $ 16.53
Exercised (42.4) $ 0.58 $ 20.77 $ 8.14
Forfeited (6.8) $ 4.48 $ 18.52 $ 13.57
Balance unexercised at December 31, 1998 126.2 $ 0.66 $ 26.22 $ 12.18
Granted 19.0 $ 26.25 $ 57.69 $ 31.48
Exercised (26.9) $ 0.66 $ 39.44 $ 9.45
Forfeited (2.5) $ 5.48 $ 44.97 $ 17.76
Balance unexercised at December 31, 1999 115.8 $ 0.92 $ 57.69 $ 15.88
Granted 13.1 $ 51.31 $ 78.00 $ 67.40
Exercised (28.2) $ 0.92 $ 72.75 $ 11.03
Forfeited (2.0) $ 4.48 $ 74.86 $ 26.02
Balance unexercised at December 31, 2000 98.7 $ 2.55 $ 78.00 $ 23.89
Stock option information with respect to all of the Company’s
employee stock option plans follows (shares in millions):

41
For purposes of pro forma disclosures, the estimated fair values of
the options are amortized over the options’ vesting periods. The
Company’s pro forma information is as follows (in millions, except
per share information):
Years ended December 31, 2000 1999 1998
Pro forma net income $ 1,035.4 $ 1,030.0 $ 735.9
Pro forma earnings
per share:
Basic $ 1.01 $ 1.01 $ 0.72
Diluted $ 0.95 $ 0.95 $ 0.70
Information regarding employee stock options outstanding as of
December 31, 2000 is as follows (shares in millions):
41
Notes to Consolidated Financial Statements
Options Outstanding Options Exercisable
Weighted-AverageWeighted-Average Remaining Weighted-Average
Price Range Shares Exercise Price Contractual Life Shares Exercise Price
$10.00 and under 11.4 $ 7.83 1.1 years 11.4 $ 7.83
Over $10.00 to $15.00 32.4 $ 13.77 3.4 years 26.7 $ 13.72
Over $15.00 to $30.00 25.2 $ 16.94 4.5 years 12.0 $ 17.22
Over $30.00 to $60.00 18.2 $ 33.59 5.5 years 4.9 $ 32.44
Over $60.00 11.5 $ 68.38 6.5 years 0.5 $ 66.48
Employee Stock Purchase Plan
The Company has an employee stock purchase plan whereby, in
accordance with Section 423 of the Internal Revenue Code, eli-
gible employees may authorize payroll deductions of up to 10% of
their salary to purchase shares of the Company’s common stock
at the lower of 85% of the fair market value of common stock on
the first or last day of the offering period. During the years ended
December 31, 2000 and 1998, employees purchased 1.3 million
and 1.0 million shares at weighted-average prices of approxi-
mately $30.33 and $11.46 per share, respectively. No shares were
purchased under the employee stock purchase plan during 1999
because the Company had a 15 month offering period which
extended from January 1, 1999 to March 31, 2000. At December
31, 2000, the Company had 16.2 million shares available for
future issuance under this plan.
Defined Contribution Plans
The Company has defined contribution plans covering substan-
tially all employees in the United States and its possessions. Under
these plans, the Company makes certain amounts of matching
contributions for those employees who elect to contribute to the
plans and makes additional contributions based upon the com-
pensation of eligible employees regardless of whether or not the
employees contribute to the plans. In addition, the Company has
other defined contribution plans covering certain employees of the
Company and employees of its foreign affiliates. The Company’s
expense for its defined contribution plans totaled $42.6 million,
$34.3 million and $26.7 million for the years ended December 31,
2000, 1999 and 1998, respectively.

Note 8
Balance Sheet Accounts
Property, plant and equipment consisted of the following
(in millions):
December 31, 2000 1999
Land $ 120.0 $ 110.1
Buildings and building improvements 901.7 841.4
Manufacturing equipment 287.6 251.8
Laboratory equipment 338.1 306.3
Furniture and office equipment 672.6 577.8
Leasehold improvements 53.7 50.8
Construction in progress 345.5 177.0
2,719.2 2,315.2
Less accumulated depreciation
and amortization (937.7) (761.6)
$ 1,781.5 $ 1,553.6
Accrued liabilities consisted of the following (in millions):
December 31, 2000 1999
Employee compensation
and benefits $ 151.9 $ 149.1
Income taxes 116.7 87.5
Sales incentives, royalties
and allowances 107.6 135.7
Due to affiliated companies
and corporate partners 92.8 160.8
Clinical development costs 50.5 35.4
Other 99.7 79.7
$ 619.2 $ 648.2
Note 9
Fair Values of Financial Instruments
The carrying amounts of cash, cash equivalents, marketable secu-
rities and marketable equity investments approximated their fair
values. Fair values of cash equivalents, marketable securities and
marketable equity investments are based on quoted market prices.
The carrying amount of commercial paper approximated its fair
value as of December 31, 2000 and 1999. The fair values of long-
term debt at December 31, 2000 and 1999 totaled approximately
$222.0 million and $216.6 million, respectively. The fair values of
commercial paper and long-term debt were estimated based on
quoted market rates for instruments with similar terms and
remaining maturities.
The fair values of the foreign currency forward contracts and pur-
chased foreign currency option contracts were not significant
based on the estimated amounts at which the contracts could be
settled taking into account current market exchange rates.
42
Notes to Consolidated Financial Statements

Note 10
Segment Information
Enterprise-wide disclosures about revenues by product, revenues
and long-lived assets by geographic area and revenues from
major customers are presented below.
Revenues
Revenues consisted of the following (in millions):
Years ended December 31, 2000 1999 1998
EPOGEN® $ 1,962.9 $ 1,759.1 $ 1,382.0
NEUPOGEN® 1,223.7 1,256.6 1,116.6
Other product sales 15.6 27.1 15.8
Total product sales 3,202.2 3,042.8 2,514.4
Other revenues 427.2 297.3 203.8
Total revenues $ 3,629.4 $ 3,340.1 $ 2,718.2
Geographic Information
The Company sells NEUPOGEN® through its foreign affiliates in
countries of the European Union, Canada and Australia.
Information regarding revenues and long-lived assets (consisting
of property, plant and equipment) attributable to the United States
and to all foreign countries collectively is stated below. The
geographic classification of product sales was based upon the
location of the customer. The geographic classification of all other
revenues was based upon the domicile of the entity from which
the revenues were earned. Information is as follows (in millions):
Years ended December 31, 2000 1999 1998
Revenues:
United States and
possessions $ 3,343.0 $ 3,024.5 $ 2,441.6
Foreign countries 286.4 315.6 276.6
Total revenues $ 3,629.4 $ 3,340.1 $ 2,718.2
December 31, 2000 1999 1998
Long-lived assets:
United States and
possessions $ 1,706.5 $ 1,475.7 $ 1,360.8
Foreign countries 75.0 77.9 89.4
Total long-lived
assets $ 1,781.5 $ 1,553.6 $ 1,450.2
Major Customers
Amgen uses wholesale distributors of pharmaceutical products as
the principal means of distributing the Company’s products to
clinics, hospitals and pharmacies. The Company monitors the
financial condition of its larger distributors and limits its credit
exposure by setting appropriate credit limits and requiring col-
lateral from certain customers. Sales to two large wholesalers
accounted for more than 10% of the total revenues for the years
ended December 31, 2000, 1999 and 1998. Sales to one whole-
saler were $1,233.4 million, $1,078.0 million and $856.2 million for
the years ended December 31, 2000, 1999 and 1998, respec-
tively. Sales to another wholesaler were $445.2 million, $438.2
million and $366.5 million for the years ended December 31,
2000, 1999 and 1998, respectively. At December 31, 2000 and
1999, amounts due from four large wholesalers accounted for
51% and 59%, respectively, of gross trade receivables.
Note 11
Business Combination
On December 14, 2000, Amgen acquired Kinetix Pharmaceuticals,
Inc. (“Kinetix”), a privately held company with expertise in the dis-
covery of small molecules in the field of protein kinase inhibition.
Amgen acquired all the outstanding shares of Kinetix common
stock in a tax-free exchange for 2.6 million shares of Amgen com-
mon stock. The acquisition has been accounted for under the
purchase method of accounting, and accordingly, the operating
results of Kinetix are included in the accompanying consolidated
financial statements starting from December 14, 2000. The acqui-
sition was valued at $172.2 million, including $1.0 million of related
acquisition costs and $6.5 million of Amgen restricted common
stock issued in exchange for Kinetix restricted common stock held
by employees retained from Kinetix. The $6.5 million will be recog-
nized as compensation expense over the vesting period of the
restricted common stock. The preliminary assignment of the pur-
chase price among identifiable tangible and intangible assets and
liabilities of Kinetix was based upon an analysis of their fair values.
The excess of the purchase price over the fair values of assets and
liabilities acquired of $103.3 million was allocated to goodwill and
will be amortized on a straight-line basis over a 15 year period.
The assets acquired included in-process research and develop-
ment. The value assigned to this asset was determined by an
analysis of data concerning four substantive in-process research
projects. The values of these research projects were determined
based on analyses of cash flows to be generated by the products
that are expected to result from the in-process projects. These
cash flows were estimated by forecasting total revenues expect-
ed from these products and then deducting appropriate operating
43
Notes to Consolidated Financial Statements

44
expenses, cash flow adjustments and contributory asset returns
to establish a forecast of net returns on the in-process technology.
These net returns were substantially reduced to take into account
the time value of money and the risks associated with the inher-
ent difficulties and uncertainties in developing specific molecules
into viable human therapeutics given the stage of development of
these projects at the date of the acquisition. Finally, these net
returns were multiplied by the estimated percentage completed of
each project, based upon analysis of three factors—time, cost
and complexity. The above analysis resulted in $30.1 million of
value assigned to acquired in-process research and development,
which was expensed on the acquisition date in accordance with
generally accepted accounting principles. A discounted, risk-
adjusted cash flow analysis was also performed to value the
technology platform of Kinetix that is expected to generate future
molecules that may be developed into human therapeutics. This
analysis resulted in valuing the acquired base technology at $36.6
million, which was capitalized and will be amortized on a straight-
line basis over a 15 year period. Amgen management believes the
assumptions used in valuing these acquired technologies are rea-
sonable, but are inherently uncertain, and no assurance can be
given that the assumptions made will occur.
This business combination would not have had a material impact
on Amgen’s revenues, net income or earnings per share in either
2000 or 1999.
Notes to Consolidated Financial Statements
Note 12
Quarterly Financial Data (unaudited)
(In millions, except per share data):
2000 Quarter Ended Dec. 311 Sept. 30 2 June 30 Mar. 313
Product sales $ 846.8 $ 851.0 $ 806.8 $ 697.6
Gross margin from product sales 735.3 741.5 705.1 611.9
Net income 210.8 358.9 302.6 266.2
Earnings per share:
Basic 0.20 0.35 0.29 0.26
Diluted 0.19 0.33 0.28 0.25
1999 Quarter Ended Dec. 314 Sept. 30 5 June 30 Mar. 31
Product sales $ 847.4 $ 769.2 $ 737.9 $ 688.3
Gross margin from product sales 735.4 670.3 639.1 595.9
Net income 281.6 300.0 267.6 247.2
Earnings per share:
Basic 0.28 0.29 0.26 0.24
Diluted 0.26 0.28 0.25 0.23
1 During the fourth quarter of 2000, the Company recorded an after-tax charge of $30.1 million to write off acquired in-process research and development related to theacquisition of Kinetix Pharmaceuticals, Inc. (see Note 11, “Business Combination”). In addition, the Company made a contribution of $25 million to the Amgen Foundation(see Note 4, “Other Items, Net - Amgen Foundation Contribution”). After applicable tax effects, these amounts combined with the legal award discussed in item 2 belowhad no impact on net income for the year ended December 31, 2000.
2 During the third quarter of 2000, the Company recorded a net legal award of $73.9 million, which primarily represents an award for certain costs and expenses, includingattorney’s fees, associated with the spillover arbitration with Johnson & Johnson (see Note 4, “Other Items, Net - Legal Award”).
3 During the first quarter of 2000, sales were adversely impacted by Year 2000-related sales totaling $45 million (see item 4 below). In addition, the Company believes saleswere adversely impacted by additional 1999 year-end stockpiling of EPOGEN® by dialysis providers and by wholesalers reducing their inventories of NEUPOGEN®.
4 Due to Year 2000 contingency planning in the fourth quarter of 1999, the Company offered extended payment terms on limited shipments of EPOGEN® and NEUPOGEN® tocertain wholesalers totaling $45 million. Sales in the first quarter of 2000 were adversely impacted by these Year 2000-related sales (see item 3 above).
5 During the third quarter of 1999, due to reduced uncertainties, the Company reduced its potential spillover liabilities to Johnson & Johnson by $49 million (see Note 4,“Other Items, Net - Legal Award”).

45
Report of Ernst & Young LLP, Independent Auditors
The Board of Directors and Stockholders of Amgen Inc.
We have audited the accompanying consolidated balance sheets of
Amgen Inc. as of December 31, 2000 and 1999, and the related
consolidated statements of operations, stockholders’ equity, and
cash flows for each of the three years in the period ended
December 31, 2000. These financial statements are the responsibil-
ity of the Company’s management. Our responsibility is to express
an opinion on these financial statements based on our audits.
We conducted our audits in accordance with auditing standards
generally accepted in the United States. Those standards require
that we plan and perform the audit to obtain reasonable assurance
about whether the financial statements are free of material mis-
statement. An audit includes examining, on a test basis, evidence
supporting the amounts and disclosures in the financial state-
ments. An audit also includes assessing the accounting principles
used and significant estimates made by management, as well as
evaluating the overall financial statement presentation. We believe
that our audits provide a reasonable basis for our opinion.
In our opinion, the financial statements referred to above present
fairly, in all material respects, the consolidated financial position of
Amgen Inc. as of December 31, 2000 and 1999, and the consol-
idated results of its operations and its cash flows for each of the
three years in the period ended December 31, 2000, in accordance
with accounting principles generally accepted in the United States.
Los Angeles, California
January 23, 2001

Amgen AB
Ralambsvägen 17
P.O. Box 34107
S-100 26 Stockholm
Sweden
Amgen Australia Pty Limited
Level 3, 65 Epping Road
P.O. Box 410
North Ryde, Sydney NSW 2113
Australia
Amgen-Bio-Farmacêutica, Lda.
Tagus Park-Parque de Ciência e Tecnologia
Edeficio Eastécnica
2780-920 Porto Salvo
Portugal
Amgen B.V.
Minervum 1150
4817 ZG Breda
The Netherlands
Amgen Canada Inc.
6755 Mississauga Road
Suite 400
Mississauga, Ontario
Canada L5N 7Y2
Amgen (Europe) AG
Alpenquai 30
Postfach 2065
CH-6002 Luzern
Switzerland
Amgen Europe B.V.
European Logistics Center
Minervum 1150
4817 ZG Breda
The Netherlands
Amgen GmbH
Handelskai 388, 661
A-1020 Vienna
Austria
Amgen GmbH
Reisstrasse 25
D-80992 Munich
Germany
Amgen Greater China, Ltd.
Rm 1501-4, 15/F
Dah Sing Financial Centre
108 Gloucester Road
Wanchai
Hong Kong
Amgen K.K.
Hamacho Center Building, 8F
31-1 Nihonbashi Hamacho 2-chome
Chuo-ku, Tokyo 103
Japan
Amgen Limited
240 Cambridge Science Park
Milton Road
Cambridge CB4 4WD
United Kingdom
Amgen N.V.
5 Avenue Ariane
B-1200 Brussels
Belgium
Amgen Puerto Rico, Inc.
State Road 31
Kilometer 24.6
Juncos, Puerto Rico 00777-4060
Amgen S.A.
192 Avenue Charles de Gaulle
92523 Neuilly-sur-Seine Cedex
France
Amgen, S.A.
World Trade Center Barcelona
Moll de Barcelona, s/n
Edifici Sud, 8a planta
08039 Barcelona
Spain
Amgen S.p.A
Via Vitruvio, 38
20124 Milano
Italy
46
Operating Subsidiaries

47
Board of Directors
David Baltimore
President
California Institute of Technology
William K. Bowes, Jr.
General Partner
U.S. Venture Partners
Jerry D. Choate
Retired Chairman and Chief Executive Officer
The Allstate Corporation
Frederick W. Gluck
Retired Vice Chairman
Bechtel Group, Inc.
Franklin P. Johnson, Jr.
General Partner
Asset Management Partners
Steven Lazarus
Managing General Partner
ARCH Venture Partners, L.P.
Gilbert S. Omenn
Executive Vice President for Medical Affairs
University of Michigan;
Chief Executive Officer
University of Michigan Health System; and
Professor of Internal Medicine,
Human Genetics, and Public Health
Judith C. Pelham
President and Chief Executive Officer
Trinity Health
J. Paul Reason
President and Chief Operating Officer
Metro Machine Corporation
Donald B. Rice
President and Chief Executive Officer
UroGenesys, Inc.
Kevin W. Sharer
Chairman of the Board
Chief Executive Officer and President
Amgen Inc.
Executive Officers
Stan M. Benson
Senior Vice President
Sales and Marketing
Fabrizio Bonanni
Senior Vice President
Quality and Compliance
Kathryn E. Falberg
Senior Vice President
Finance
and Chief Financial Officer
Dennis M. Fenton
Executive Vice President
George J. Morrow
Executive Vice President
Worldwide Sales and Marketing
George Morstyn
Senior Vice President
Development
and Chief Medical Officer
Steven M. Odre
Senior Vice President
General Counsel and Secretary
Roger M. Perlmutter
Executive Vice President
Research and Development
Kevin W. Sharer
Chairman of the Board
Chief Executive Officer and President
Board of Directors and Executive Officers

Corporate Office
One Amgen Center Drive
Thousand Oaks, California 91320 -1799
(805) 447-1000
SEC Form 10-K
A copy of the Company’s Annual Report on Form 10-K for the year
ended December 31, 2000, filed with the Securities and Exchange
Commission, is available without charge upon written request to
Corporate Secretary, Amgen Inc., One Amgen Center Drive,
Thousand Oaks, California 91320 -1799; by calling (800) 84-AMGEN;
or by accessing the Company’s web site at www.Amgen.com.
Transfer Agent and Registrar
American Stock Transfer & Trust Company
59 Maiden Lane
New York, New York 10038
Stockholder Inquiries
Inquiries related to stock transfers or lost certificates should
be directed to American Stock Transfer & Trust Company,
(800) 937-5449 or (212) 936-5100. General information regarding
the Company can be obtained by contacting Amgen’s investor
relations department, (805) 447-3352. Recent news releases and
other information can also be obtained by contacting Amgen’s
automated stockholder information line at (800) 84-AMGEN or by
accessing the Company’s web site at www.Amgen.com.
Independent Auditors
Ernst & Young LLP, Los Angeles, California
Annual Meeting
The Annual Meeting will be held on Thursday, May 17, 2001, at
10:30 a.m. at the Beverly Hilton Hotel, 9876 Wilshire Boulevard,
Los Angeles, California 90210.
Price Range of Common Stock
The Company’s Common Stock trades on The Nasdaq Stock
Market under the symbol AMGN. As of February 28, 2001, there
were approximately 17,000 holders of record of the Company’s
Common Stock. No cash dividends have been paid on the
Common Stock to date, and the Company currently intends to
retain any earnings for development of the Company’s business
and repurchases of its Common Stock.
The following table sets forth, for the fiscal periods indicated, the
range of high and low closing sales prices of the Common Stock
as quoted on The Nasdaq Stock Market for the fiscal years 2000
and 1999:
2000 1999
High Low High Low
4th Quarter $ 71.38 $ 54.13 $ 64.88 $ 37.84
3rd Quarter 78.00 64.94 43.78 29.50
2nd Quarter 70.38 51.31 40.00 26.16
1st Quarter 74.69 52.25 39.53 26.14
Trademarks Listed in This Report
Amgen, ARANESP™, EPOGEN®, INFERGEN®, NEUPOGEN®, and STEMGEN®
are trademarks of Amgen Inc.
Hotlines
Amgen Customer Service Hotline (800) 28-AMGEN
Amgen Investor Materials Hotline (800) 84-AMGEN
Amgen Job Hotline (800) 446-4007
Amgen Professional Services Hotline (800) 77-AMGEN
Amgen Reimbursement Hotline (800) 272-9376
Amgen Safety Hotline (800) 835-2879
48
Corporate Information

Des
ign
: H
ow
ry D
esig
n A
sso
ciat
es,
SF
/CA
P
ho
tog
rap
hy:
Cat
her
ine
Led
ner
E
xecu
tive
Po
rtra
it:
Jam
ey S
tilli
ng
s

Amgen Inc.One Amgen Center DriveThousand Oaks, CA91320-1799
www.Amgen.com
© 2001 Amgen Inc. All rights reserved.MC14945 900M/3-01 P50300-2