Embed Size (px)
Citation preview

AMIDD Lecture 9: Pharmacokinetic and Pharmacodynamic Modelling
Dr. Jitao David Zhang, Computational Biologist1 Pharmaceutical Sciences, Pharma Research and Early Development, Roche Innovation Center Basel, F. Hoffmann-La Roche2 Department of Mathematics and Informatics, University of Basel
Mager, Donald E., Sukyung Woo, and William J. Jusko. 2009. “Scaling Pharmacodynamics from In Vitro and Preclinical Animal Studies to Humans.” Drug Metabolism and Pharmacokinetics 24 (1): 16–24.

Topics
• Pharmacokinetic (PK) modelling• Joint pharmacokinetic-pharmacodynamic (PK-PD) modelling
• PBPK modelling
2

3
Questions in preclinical development: what to give, how to give, how much, and how often?
Adapted from Paul et al. “How to Improve R&D Productivity: The Pharmaceutical Industry’s Grand Challenge.” Nature Reviews Drug Discovery, 2010
Target proposal & assessment
Pharmacology in animals: pharmacokinetics, pharmacodynamics, biomarkers
Pharmacology in humans: pharmacokinetics, pharmacodynamics, biomarkers

Pharmacokinetic and pharmacodynamic modelling
• Pharmacokinetics (PK) describes how the drug is absorbed, distributed, metabolised, and excreted by the body. The ADME properties are affected by physicochemical properties of the drug, and other properties such as human behavior (e.g. food and drug intake) and genetics.
• Pharmacodynamics (PD) describes the effect of the drug to the body, mediated by drug-target interactions. PD is affected by PK, as well as other properties such as behaviour and genetics.
4
• A basic mathematical model of PK is a compartment model that can be transcribed as a set of differential equations that describe the relationship between drug concentration and time.
• PD models can have versatile forms, for instance a linear model, or a non-linear model (e.g. Hill’s function), a compartment model, or other forms.
Mortensen, Stig Bousgaard, Anna Helga Jónsdóttir, Søren Klim, and Henrik Madsen. 2008. “Introduction to PK/PD Modelling - with Focus on PK and Stochastic Differential Equations.” Technical University of Denmark, DTU Informatics.

Principles of absorption
• Sometimes preceded by the process of liberation, the release of the active component from the formulation
• Process by which a drug compound transfers from an extravascular site of dosing (e.g. gut, lung, muscle, and skin) into systemic circulation, known as the central compartment.
• Intravenous administration in a bolus dose (single dose, short time) can be modelled as instant absorption. Infusion using a constant rate over time can be modelled as instant absorption by time.
• Extravascular dosing, for instance (a) oral or (b) injection into muscle or fat tissue, needs to be absorbed. During this process the drug concentration may reduce due to metabolism and trapping. The ratio between active drug concentration reaching the central compartment and the in-take concentration is known as the bioavailability.
5
Psychopharmacology, Figure 1.2

Principles of distribution
• Following absorption, drug molecules are distributed into organs and tissues.
• Different organs and tissues receive different doses of the drug, and the concentration-time relationship also varies.
6
We use the Volume of distribution, VD, to describe the extent of a drug distribution. The larger the value is, the better the distribution to tissues. A value larger than human circulation volume (0.08 l/kg) is possible, which indicates good distribution in the tissues.
Major components of drug distribution, U Waterloo
• Distribution of a drug in a tissue depends on both physiological factors, including the vascular permeability, blood flow, the perfusion rate of the tissue, and physicochemical properties of the drug, including plasma protein binding, and lipophilicity.
• Example 1: Liver and kidney are better perfused than muscle and fat, and the brain is usually inaccessible due to the blood-brain barrier.
• Example 2: Only free compounds that are not bound to plasma proteins can exert pharmacological functions. Compounds with excessive protein binding have a delayed distribution.

Principles of metabolism and excretion, which together contribute to clearance
Metabolism
7
• Drug metabolism serves defense against xenobiotics. It facilitates the excretion of the drug by making it hydrophilic.It happens mainly in liver and, for oral drugs, in intestine.
• Drug metabolism can deactivate a compound (very often the case) or activate a compound, turning a pro-drug into its active form, e.g. codeine to morphine, below).
• Drug metabolism varies between individuals, between ages in the same individual, and can be affected by drugs as well. Drugs that induce or repress drug-metabolism genes (e.g. cytochrome P450, CYPs) can cause drug-drug interaction.
Excretion• Excretion follows metabolism
and removes drugs and their metabolites from the body.
• The main excretion route is the urinary and biliary (thereby with feces) excretion.
• Urinary excretion include three components: glomerular filtration, secretion, and reabsorption.
• Patients with kidney diseases may have reduced excretion, calling for adjusted dosing.
codeine morphineCYP2D6
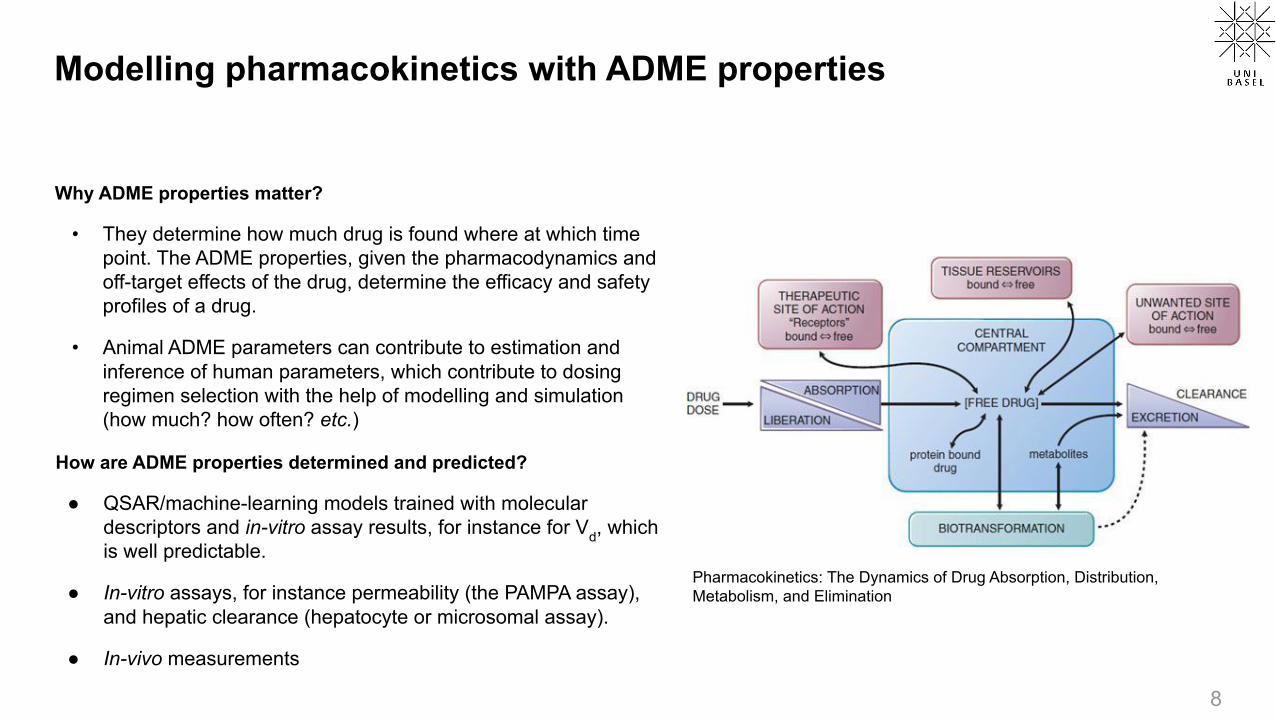
Modelling pharmacokinetics with ADME properties
Why ADME properties matter?
• They determine how much drug is found where at which time point. The ADME properties, given the pharmacodynamics and off-target effects of the drug, determine the efficacy and safety profiles of a drug.
• Animal ADME parameters can contribute to estimation and inference of human parameters, which contribute to dosing regimen selection with the help of modelling and simulation (how much? how often? etc.)
8
Pharmacokinetics: The Dynamics of Drug Absorption, Distribution, Metabolism, and Elimination
How are ADME properties determined and predicted?
● QSAR/machine-learning models trained with molecular descriptors and in-vitro assay results, for instance for Vd, which is well predictable.
● In-vitro assays, for instance permeability (the PAMPA assay), and hepatic clearance (hepatocyte or microsomal assay).
● In-vivo measurements

Mathematical modelling of PK: one-compartment model, bolus
We denote the concentration of the drug as A, and the rate of clearance (metabolism and excretion) as K. Assuming a bolus dose, according to the law of mass action and first-order kinetics, we can write
9
When we denote the initial dose as A0, we can express the general solution of the model as
(Left) simulation from Introduction to PK/PD Modelling - with Focus on PK and Stochastic Differential Equations (Right) empirical data of propacetamol HCl (IV, intravenous) and paracetamol (PO, per os, oral).
Propacetamol is a pro-drug of paracetamol. The chemical modification (esterification) makes it more water soluble, allowing it delivered via IV.
Question: what is the half-life of the drug, t1/2, the time it takes for reducing the amount of drug left in the body by 50%?

One-compartment model, oral dosing
For oral dosing, an extra gut compartment (right) is often sufficient to model the absorption phase
10
Suppose rate the absorption of the drug is faster than the elimination process (Ka>K), we can model the concentration in the central compartment as
In reality, we cannot easily assess the concentration of drug in the gut. Is it possible to derive the relationship between central-compartment concentration A and time t given the initial condition?
Yes: we can find the expression of A(t) analytically in a closed form using Laplace transform, which translates a function of a continuous variable (e.g. time) to a function of a complex variable (frequency) (see backup).
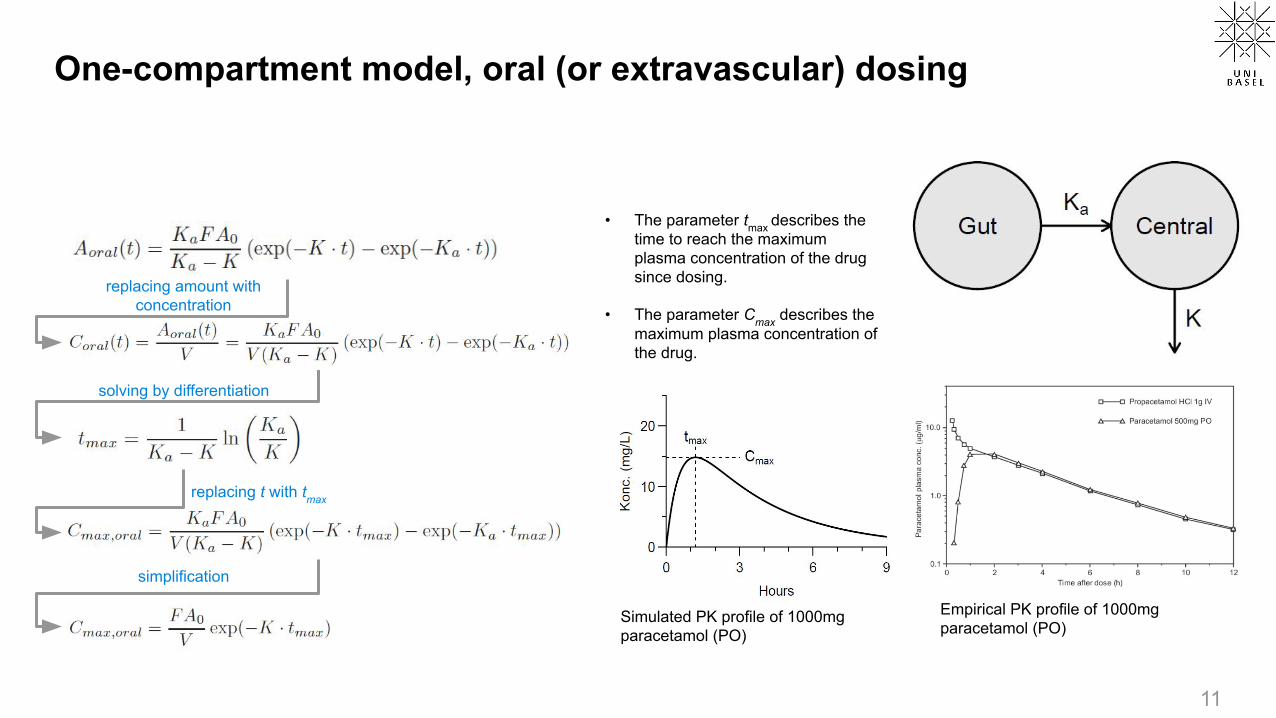
One-compartment model, oral (or extravascular) dosing
• The parameter tmax describes the time to reach the maximum plasma concentration of the drug since dosing.
• The parameter Cmax describes the maximum plasma concentration of the drug.
11
Simulated PK profile of 1000mg paracetamol (PO)
solving by differentiation
replacing amount with concentration
replacing t with tmax
simplification
Empirical PK profile of 1000mg paracetamol (PO)

Constant-rate infusion and multiple dosing
We can administer the drug with infusion over time. If we assume a constant infusion amount Rin and a constant clearance constant CL, we can derive the analytical solution of drug contraration with regard to time.
• Question: what form does it have?
12
If a pill releases its active ingredient gradually, its plasma concentration can be effectively equivalent to that of a constant-rate infusion. If multiple pills are taken with time intervals, the constant Rin can be expressed as a product of bioavailability F and initial dose A0, divided by the time interval of taking pills τ. The concentration of multiple dosing (MD) can be expressed as the sum of individual dosing profiles (N indicates the number of doses)
The system reaches equilibrium when the infusion rate equals the clearance rate (dC/dt=0). Therefore we can deduce the concentration at stead ystate CSS by the ratio of infusion rate and clearance. Due to the exponential distribution, 90% of the the steady-state concentration is reached after 3-4 half-lives.
Multiple dosing of paracetamol, with 4 oral doses of 1g per dose given at two different intervals (top: 4h, bottom: 6h). Thick line: total concentration. Dotted line: the rate of constant infusion.

Why do we care about multi-dosing PK?
• The PK profile determines – dose (how much)– dosing regimen (how much, how often, how
long)– dosage form (which formulation)– dosage route (systemic? local?)
• The therapeutic window (from the view of PK) or the therapeutic index (from the view of PD) determines how much and often a drug is dosed.
• A narrow therapeutic index may lead to additional requests from the regulatory authority in preclinical development or additional labelling in drug product, if not stop of the development project.
13
Courtesy of Jun Shi. MEC: minimal effect concentration; MTC/MSC: minimum toxic concentration/maximum safe concentration
Time (hours)
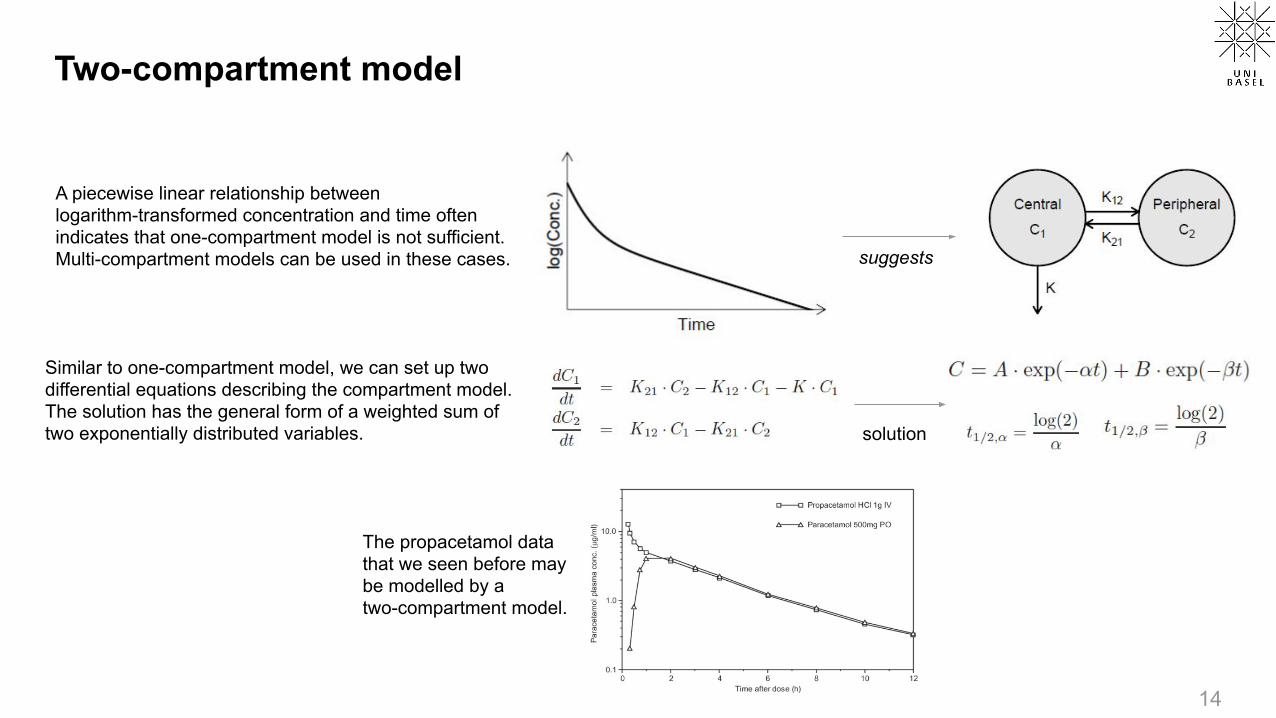
Two-compartment model
A piecewise linear relationship between logarithm-transformed concentration and time often indicates that one-compartment model is not sufficient. Multi-compartment models can be used in these cases.
14
suggests
Similar to one-compartment model, we can set up two differential equations describing the compartment model. The solution has the general form of a weighted sum of two exponentially distributed variables. solution
The propacetamol data that we seen before may be modelled by a two-compartment model.

The simplest joint PK/PD model: a binary PD model with a step function
15
Pharmacokinetic-pharmacodynamic indices of a theoretical drug molecule. MIC: Minimum inhibitory concentration (MIC).
Yu, Yichao, Diether Rüppel, Willi Weber, and Hartmut Derendorf. 2018. “PK/PD Approaches.” In Drug Discovery and Evaluation: Methods in Clinical Pharmacology.

An example of joint PK/PD model of an oral dose of 1000mg paracetamol
• PD models have many forms. The example is taken from Mortensen et al. and Gibb and Anderson (2008). It uses a hypothetical effect compartment with an Emax model (the Hill function that we introduced before) to model the effect. It does not influence of the PK model.
– Question: what good the effect compartment do?
• The effect is measured on a visual analogue scale (VAS) from 0-10 where a reduction indicates pain relief.
16
PK model
Effect compartment
PD model

Physiologically based pharmacokinetic (PBPK) models
(Left) A semi-physiological model (Right) A fully physiology-based PK model
17
PBPK is usually performed in an iterative “learn, confirm, and refine” approach. Initially, the PBPK simulation is performed in animals using animal PBPK models, animal in vitro data, and compound physicochemical data. The animal simulation is compared with the in vivo data, if this simulation in animals is reasonable, then the healthy volunteer simulation is performed using a human PBPK model. These simulations can then be extended to various patient populations using relevant physiology. If the simulation at any stage is inaccurate, further experiments may be performed to understand the mismatch and to improve the PBPK model.
Right figure: Jones, H. M., and K. Rowland‐Yeo. 2013. “Basic Concepts in Physiologically Based Pharmacokinetic Modeling in Drug Discovery and Development.” CPT: Pharmacometrics & Systems Pharmacology 2 (8): 63.

An industrial PK modelling workflow: example of AstraZeneca
Davies, Michael, et al.. 2020. “Improving the Accuracy of Predicted Human Pharmacokinetics: Lessons Learned from the AstraZeneca Drug Pipeline Over Two Decades.” Trends in Pharmacological Sciences 41 (6): 390–408.
18

Summary
Pharmacokinetics: what the body does to the drug
• Determined by ADME properties• Determines dose, dosing regimen, dosage form, and
dosage route• Important parameters:
– Bioavailability (F): absorption - metabolism - efflux - degradation
– Clearance (CL)– Volume of distribution (VD)
19
Pharmacodynamics: what the drug does to the body
• Determined by interaction with targets and off-targets• Determines efficacy and safety profiles• Can be modelled in many different ways. Common
choices include:– Step function– Linear function– Non-linear function (e.g. the Hill function)
From the biophysics wiki article by Andreas Piehler

Offline activities
1. Anonymous feedback form: https://forms.gle/havddpXNmkKZ8LJc6
2. Required reading:
a. The backup slides of Lecture 9 to learn about the principles of population modelling, especially non-linear mixed-effect models (NLMEs) and clinical trials.
3. Optional reading:
a. Davies, Michael, et al.. 2020. “Improving the Accuracy of Predicted Human Pharmacokinetics: Lessons Learned from the AstraZeneca Drug Pipeline Over Two Decades.” Trends in Pharmacological Sciences 41 (6): 390–408. A good introduction to prediction of PK profiles in industry.
b. Jones, H. M., and K. Rowland‐Yeo. 2013. “Basic Concepts in Physiologically Based Pharmacokinetic Modeling in Drug Discovery and Development.” CPT: Pharmacometrics & Systems Pharmacology 2 (8): 63. https://doi.org/10.1038/psp.2013.41. A good introduction to PBPK modelling
20

Molecular modelling Omics & cellular modelling Organ & system modelling Populational modelling
21
Conclusion of the course
Forward translation
Reverse translation
Principles that we covered: molecular biology (the central dogma), bioinformatics (DP and MC/HMM), chemoinformatics and CADD (molecular descriptors, QSAR, docking), omics (RNA sequencing), pharmacology (PK, PD, PBPK), population modelling (NLME), ...

Thank you for...• Attending the course virtually;
• Giving me and the course feedback;
• Hopping between disciplines together with me;
• Reading (maybe too) much material;
• Taking time for offline activities;
• Asking and answering questions;
• Googling strange terms that you have never heard of;
• Bearing with my accent, speaking speed, and poor drawing;
• Being interested in applied mathematics and informatics in drug discovery.
22
Hopefully see some of you in MCBDD 2022!

Backup material

Solving the two-equation system with the Laplace transform
25
See more about the Laplace transform and other numeric transforms in Bracewell, R. N. 1990. “Numerical Transforms.” Science 248 (4956): 697–704.
Marie Davidian, MA/ST 810, Mathematical-Statistical Modelingand Analysis of Complex Systems, NC State University.A table of Laplace transforms can be found on intmath.com

Population modelling deals with two levels of variability, which calls for mixed-effect models
• Consider a simple one-compartment model, with an intravenous bolus dose (right).
• Two types of variability– Between-subject variability, e.g. the differences in clearance
rate among patients – Between-occasion variability, e.g. the differences from one
time point to the other within each patient.• A mixed-effect model (mixed=fixed+random effect model, a type of
hierarchical model or multilevel model) is needed to model such data.
• If we assume that VD is a constant value that is the same for all subjects, but clearance varies between subjects (for instance due to ethnicity), then VD is a fixed-effect parameter and CL is a random-effect parameter.
• If we assume that both VD and CL vary between subjects, then both are random-effect parameters.
26
K=CL/V
Bottom figure: Raymond Miller, in Principles of Clinical Pharmacology (Third Edition), 2012
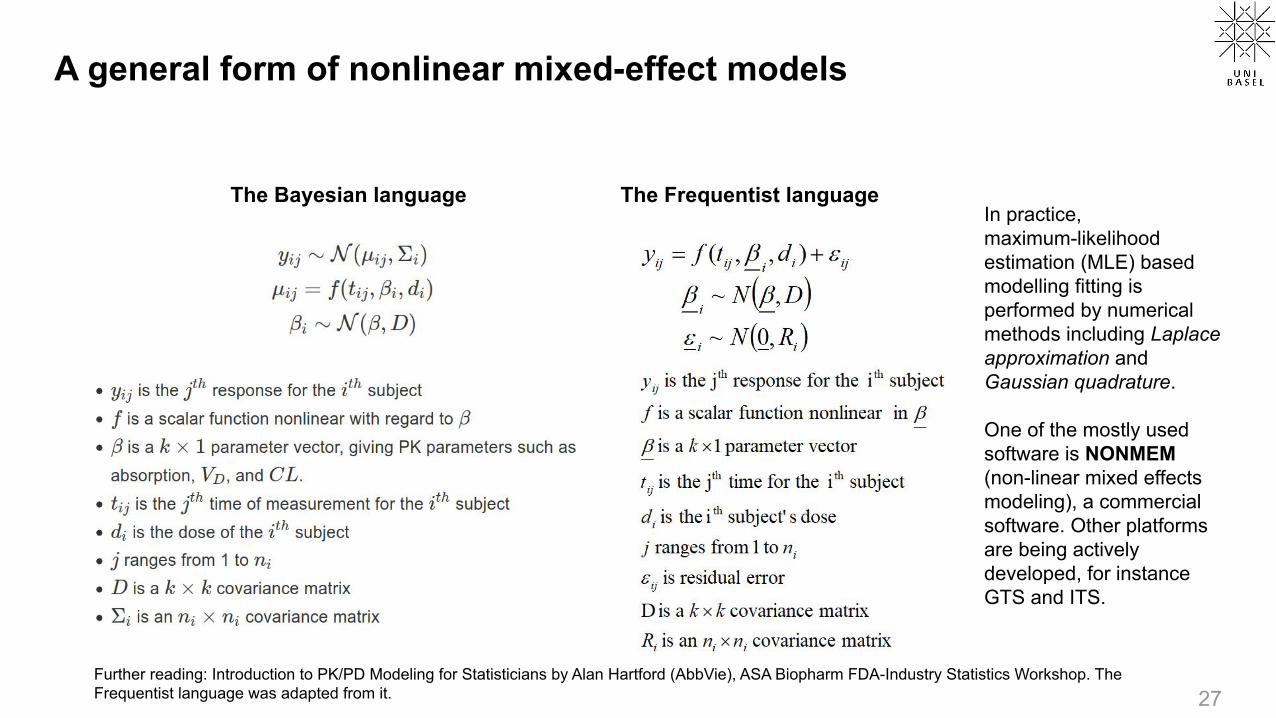
A general form of nonlinear mixed-effect models
27
The Bayesian language The Frequentist language
Further reading: Introduction to PK/PD Modeling for Statisticians by Alan Hartford (AbbVie), ASA Biopharm FDA-Industry Statistics Workshop. The Frequentist language was adapted from it.
In practice, maximum-likelihood estimation (MLE) based modelling fitting is performed by numerical methods including Laplace approximation and Gaussian quadrature.
One of the mostly used software is NONMEM (non-linear mixed effects modeling), a commercial software. Other platforms are being actively developed, for instance GTS and ITS.

NLME modelling helps understanding clinical PK-PD parameters
28
Top: Mould, D R, and R N Upton. 2012. “Basic Concepts in Population Modeling, Simulation, and Model-Based Drug Development.” CPT: Pharmacometrics & Systems Pharmacology 1 (9): 1–14.
Right: Zhang, Weijiang, Dominik Heinzmann, and Joseph F. Grippo. 2017. “Clinical Pharmacokinetics of Vemurafenib.” Clinical Pharmacokinetics 56 (9): 1033–43. AUC8 and AUC168: AUC from time zero to 8h or 168 h.
● Non-linear mixed-effect (NLME) models can model both drug response and disease progression.
● By incorporating covariants (biomarkers, etc.), NLME models can model and reveal group-specific PK/PD responses.

Clinical studies and clinical trials
• A clinical study is research using human volunteers (i.e. participants), with the intention to add to medical knowledge.
• Two main types of clinical studies: clinical trials (also called interventional studies) and observational studies. In clinical trials, participants are assigned to specific interventions by the investigator, which is not the case in observational studies.
• Most drug and vaccine candidates fail.
• Only drugs undergoing successful clinical studies are approved by regulatory agencies. For instance, FDA usually requires that a drug must show statistical significance in two ‘adequate and well-controlled’ pivotal Phase III studies as a precondition of its approval.
29
Data between 2000 and 2015 of 406,038 trials (of which 185,994 were unique) and well over 21,000 compounds were collected. The table was formatted by ACSH.

Phases of clinical trials prior to approval
30
● Aim: To get PK data and to verify the drug behaves as expected.
● Dose: Microdosing e.g. <= 1/100 NOAEL (no observed adverse effect level) or pharmacologically active dose.
● Subjects: Usually <15 healthy subjects
● Time: A few weeks
Phase 0*
● To find a safe dose range and optimal dosing region and identify safety profile. Further PK and PD data are collected.
● Subtherapeutic single and multiple ascending doses
● Usually 20-100 healthy volunteers, in certain indications (e.g. cancer) patients can participate.
● Usually a few months
Phase I
● To test efficacy, effectiveness, and safety profiles in a large number of patients, compared with standard-of-care treatment option
● Therapeutic dose● Usually 300-3000
patients● Usually several years
Phase IIIPhase II
● To assess efficacy and side effects of the drug, and determine dosing regimen
● Therapeutic dose● Usually 100-300 patients
with a specific disease● At least a year and longer
* Since early 2000. See an update-to-date review by Burt, Tal, Graeme Young, Wooin Lee, Hiroyuki Kusuhara, Oliver Langer, Malcolm Rowland, and Yuichi Sugiyama. 2020. “Phase 0/Microdosing Approaches: Time for Mainstream Application in Drug Development?” Nature Reviews Drug Discovery 19 (11): 801–18.
Investigational New Drug (IND) application New Drug Application (NDA)
~70% ~50% ~60%

We use clinical endpoints, biomarkers, and surrogate endpoints to judge whether a drug works or not
• Clinical endpoints: direct evidence of clinical outcome, reflecting how a patient feels (e.g. relieve of anxiety and depression), functions (e.g. hospitalization), responds to pathogens (e.g. infection rate), or how long a patient survives (e.g. progression-free survival, overall survival). It can be expensive and take long to measure them.
• Biomarkers: objectively measured and evaluated as an indicator of normal biological, pathogenic processes or pharmacological response to a drug, which can take many forms
• Biochemical, e.g. alanine aminotransferease (ALT), CD4+, cholesterol
• Anatomical/morphological, e.g. tumor Size, artery diameter, and imaging results of PET, CT-Scan, MRI, etc.
• Histological, e.g. biopsy pathology, whole blood count (WBC)
• Other measurements, e.g. Blood pressure, pain relief, QT interval in electrocardiogram, etc.
• Surrogate endpoints: biomarkers supported by strong evidence so that they may substitute a clinical end point when obtaining registration, e.g. neutralising antibodies against spike proteins of the coronavirus in the plasma as a surrogate of reduced rate of infection. 31
Jusko, William J. 2016. “Foundations of Pharmacodynamic Systems Analysis.” In Systems Pharmacology and Pharmacodynamics, edited by Donald E. Mager and Holly H.C. Kimko, 161–75. AAPS Advances in the Pharmaceutical Sciences Series. Cham: Springer International Publishing.

![This leaflet format has been determined by the Ministry of ... · of CYP2D6 metabolism [see Clinical Pharmacology 12.3]. The potential for a pharmacokinetic interaction exists with](https://img.pdfslide.net/doc/110x75/5d52c28088c993383f8b74ff/this-leaflet-format-has-been-determined-by-the-ministry-of-of-cyp2d6-metabolism.jpg)