Embed Size (px)
Citation preview
AMINO ACID SIDE-CHAIN PARTITION ENERGIES AND
DISTRIBUTION OF RESIDUES IN SOLUBLE PROTEINS
H. ROBERT GuyLaboratory ofBiophysics, National Institute ofNeurological, Communicative Diseases, and Stroke,National Institutes ofHealth, Bethesda, Maryland 20205
ABSTRACT Energies required to transfer amino acid side chains from water to less polar environments were calculatedfrom results of several studies and compared with several statistical analyses of residue distributions in soluble proteins.An analysis that divides proteins into layers parallel with their surfaces is more informative than those that simplyclassify residues as exposed or buried. Most residues appear to be distributed as a function of the distance from theprotein-water interface in a manner consistent with partition energies calculated from partitioning of amino acidsbetween water and octanol phases and from solubilities of amino acids in water, ethanol, and methanol. Lys, Arg, Tyr,and Trp residues tend to concentrate near the water-protein interface where their apolar side-chain components aremore buried than their polar side-chain components. Residue distributions calculated in this manner do not correlatewell with side-chain solvation energies calculated from vapor pressures of side-chain analogs over a water phase. Resultsof statistical studies that classify residues as exposed to solvent or buried inside the protein interior appear to depend onthe method used to classify residues. Data from some of these studies correlate better with solvation energies, but otherdata correlate better with partition energies. Most other statistical methods that have been used to evaluate effects ofwater on residue distributions yield results that correlate better with partition energies than with solvation energies.
INTRODUCTION
It is well known that interactions with water cause polarside chains of soluble proteins to be nearer the proteinsurface than are apolar side chains. Several efforts havebeen made recently to quantitate these solvent effects anduse polarity scales to analyze packing in globular proteins(Rose and Roy, 1980; Kyte and Doolittle, 1982), to predictsecondary structure (Cid et al., 1982; Eisenberg et al.,1984; Finer-Moore and Stroud, 1984), to predict trans-membrane segments (Argos et al., 1982; Engleman andSteitz, 1981; Von Heijne, 1981a, b; Kyte and Doolittle,1982; Guy, 1984), and to evaluate amphiphilicity of a-helices (Eisenberg et al., 1982; Finer-Moore and Stroud,1984; Guy, 1984a). Polarity scales used in these studiesoften do not agree with each other and are sometimesbased on arbitrary assumptions or averaging of differentscales. The purposes of this paper are to suggest causes forsome of the apparent discrepancies among scales, toemphasize the importance of recognizing that most resi-dues are neither completely buried within the protein norcompletely exposed to water and that some large residuesconcentrate near the water-protein interface where theirapolar components are more buried than their polar com-ponents, and to develop an approach that evaluates these
Dr. Guy's present address is Laboratory of Mathematical Biology,National Cancer Institute, National Institutes of Health, Bethesda, MD20205
effects and allows solvent energy terms to be combinedwith other energy terms in more complex conformationalenergy analyses.
Most polarity scales for amino acid side chains are basedon partitioning of amino acids or their analogs betweenwater and a less pola solvent, and on statistical analyses ofamino acid residue distributions within soluble proteins ofknown structures. Chothia (1976), Janin (1979), Wertzand Scheraga (1978), and Robson and Osguthorpe (1979)have performed statistical analyses in which residues inglobular proteins of known structure are classified asburied or exposed to water. Data from the Chothia andJanin studies correlate better with solvation energies calcu-lated from vapor pressures of side-chain analogs (Wol-fenden et al., 1981) than with side-chain partition energiescalculated from solubilities of amino acids in ethanol(Tanford, 1962; Nozaki and Tanford, 1971). This observa-tion has led to claims that solvation energies better simu-late the interior of proteins (Wolfenden et al., 1981;Wolfenden, 1983), and led Kyte and Doolittle (1982) torely primarily on the Wolfenden et al., Janin, and Chothiadata in their analysis of hydrophobicity of proteinsequences.The analysis presented here demonstrates that a prefer-
ence for these data is not justified. The data obtained byWertz and Scheraga and by Robson and Osguthorpecorrelate better with calculated partition energies thanwith solvation energies. Differences among the data of the
BIOPHYS. J. © Biophysical Society * 0006-3495/85/01/61/1 0 $ 1.00Volume 47 January 1985 61-70
61
four statistical studies are probably related to methodsused to classify residues as buried or exposed, and to otherproblems that are inherent in a binary classification meth-od. Prabhakaran and Ponnuswamy (1980) have analyzedamino acid residue distributions by dividing proteins intolayers. This method avoids some of the problems of abinary classification and yields more information. Theirdata are analyzed here to determine the distribution ofresidues as a function of distance from the protein surfaceand relate these distributions to apparent partition ener-gies. Results of this analysis correlate much better withpartition energies calculated from partitioning of aminoacids between organic solvents and water than with solva-tion energies of side-chain analogs. This method has theadditional advantage that absolute values of the energiesrequired to transfer residues from the surface of a proteinto its interior can be estimated and the tendency ofamphiphilic side chains to concentrate near the water-protein interface can be evaluated. Absolute energies arerequired to include solvent effects in conformationalenergy calculations.
GLOSSARY
B, energy required to move residue i from water to thereference layer divided by the energy required tocompletely bury it (Eq. 9)
C constant that determines the steepness of the tran-sition in Sig(x) (Eq. 10)
AFaa mean partition energy scale for side chains deter-mined from studies using amino acids and organicsolvents. Values were normalized to those for octa-nol
AF, energy calculated to transfer the ith amino acidside chain from water to an organic solvent (Eq.1)
AFj apparent energy required to transfer the ith residuefrom the surface of a protein to its interior based ondistribution of residues in soluble proteins ofknown structure (Eq. 6)
Af'(x) apparent energy required to transfer the ith residuefrom water to a distance x from the protein'ssurface (Eq. 5)
AfP(x) apparent energy required to move the ith residuefrom the reference layer to a distance x from theprotein's surface (Eq. 8)
Mj the mole fraction of the ith residue in the entirepopulation of proteins used in the data base
Mb the mole fraction of the ith residue in the popula-tion of residues that are completely buried insidethe proteinsthe mole fraction of the ith residue in the popula-tion of residues that are completely exposed towater on the surfaces of the proteins
M,(x) the mole fraction of the ith residue in a layer that isa distance x from the surface of the proteins
R(AF) the correlation coefficient between AFa values andpolarity scales calculated from distributions ofresidues in soluble proteins
R(ASE) the correlation coefficient between ASE values andpolarity scales calculated from distributions ofresidues in soluble proteins
Reference layer
ASE1
x
xO
Xr
the layer at which the mole fraction of the ithresidue equals M1solvation energy required to transfer the ith aminoacid side-chain analog from water to the vaporphaserelative distance from the protein surface. It is zeroat the surface and one at the center of the proteinvalue of x at the inflection point of Sig(x) (Eq. 10).The residue can be considered half buried at x0value of x at the reference layer.
RESULTS
Partition and Solvation EnergiesEnergies required to move amino acid side chains fromwater to ethanol (Tanford, 1962; Nozaki and Tanford,1971) and methanol (Gekko, 1981) have been calculatedusing the equation
AF- = RT ln(wbi/v1)- RT ln(flw,Gly/?7s,Gly), (1)
where AFi is the partition energy of the ith side chain, R isthe gas constant, T is temperature, q, i and nv,, are solubili-ties of amino acid i in water and organic solvent respec-tively, and nlw,Gly and fls,Gly are solubilities of Gly in waterand organic solvent. Also, energies required to transferamino acids from water to octanol can be calculated fromresults of two-phase partition experiments (Yunger andCramer, 1981; Fauchere et al. 1980; Klein et al., 1971).Partition energies from these studies are compared inTable I. Data in Table I are for Glu, Lys, and Arg inoctanol when the pH of the water phase is 7.0.
Data for these amino acids in ethanol probably reflectthe noncharged side chains. One might expect the magni-tude of amino acid side-chain partition energies to increaseas solvents become less polar; however, this does not appearto be true. Energies calculated from solubility experimentsusing ethanol and methanol average 1.35 and 1.40 timesthose calculated for octanol. To calculate a single polarityenergy scale, AFaa, data for ethanol and methanol werenormalized to those of octanol by dividing by the factorsabove. Without normalization, data for different aminoacids would be weighted differently because they are notall represented in each study. Units of this scale arearbitrary because the data could have been normalized tovalues for ethanol or methanol rather than octanol (seeDiscussion). Solvation energies, ASE, calculated by Wol-fenden et al. (1981) from side-chain analogs, are also listedin Table I. These values differ substantially from aminoacid side-chain partition energies both in absolute magni-tude and relative values.
Binary ClassificationSeveral attempts have been made to relate solvent acces-siblity of amino acid residues in proteins of known struc-ture to transfer energies of their side chains from water to aless polar environment. These analyses are often an
BIOPHYSICAL JOURNAL VOLUME 47 198562
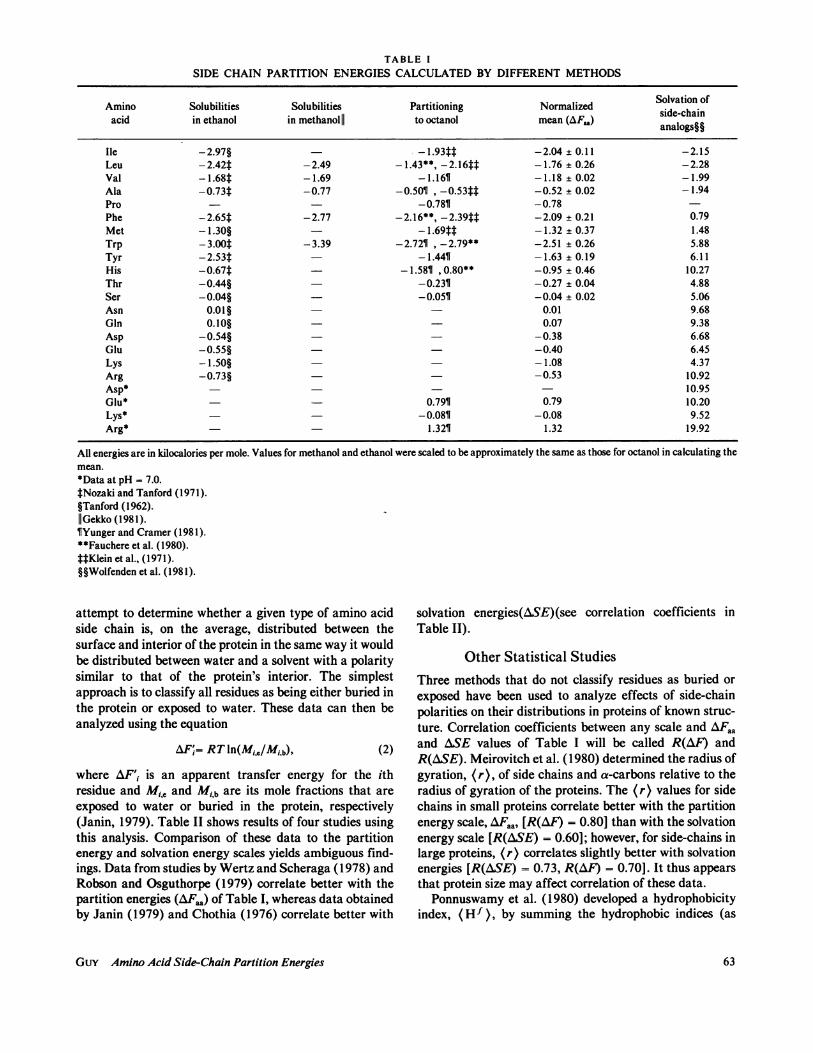
TABLE ISIDE CHAIN PARTITION ENERGIES CALCULATED BY DIFFERENT METHODS
Amino Solubilities Solubilities Partitioning Normalized Solvation ofacid in ethanol in methanol|| to octanol mean (AF.A) side-chain
Ile -2.97§ -1.93tt -2.04 ± 0.11 -2.15Leu -2.42t -2.49 -1.43**, -2.16tt -1.76 ± 0.26 -2.28Val - 1.68t -1.69 - 1.161 -1.18 ± 0.02 -1.99Ala -0.73t -0.77 -0.5011 , -0.53tt -0.52 ± 0.02 -1.94Pro - - -0.781 -0.78Phe -2.65t -2.77 -2.16**, -2.39tt -2.09 ± 0.21 0.79Met - 1.30§ - 1.69tt -1.32 ± 0.37 1.48Trp - 3.00t -3.39 -2.7211 , -2.79** -2.51 ± 0.26 5.88Tyr -2.53t - 1.44T -1.63 ± 0.19 6.11His -0.67t - -1.581 ,0.80** -0.95 ± 0.46 10.27Thr -0.44§ -0.2311 -0.27 ± 0.04 4.88Ser -0.04§ -0.051 -0.04 ± 0.02 5.06Asn 0.01§ 0.01 9.68Gln 0.10§ - 0.07 9.38Asp -0.54§ -0.38 6.68Glu -0.55§ -0.40 6.45Lys -1.50§ -1.08 4.37Arg -0.73§ -0.53 10.92Asp* 10.95Glu* 0.7911 0.79 10.20Lys* -0.0811 -0.08 9.52Arg* - - 1.3211 1.32 19.92
All energies are in kilocalories per mole. Values for methanol and ethanol were scaled to be approximately the same as those for octanol in calculating themean.*Data at pH = 7.0.tNozaki and Tanford (1971).§Tanford (1962).IlGekko (1981).lYunger and Cramer (1981).**Fauchere et al. (1980).t4Klein et al., (1971).§§Wolfenden et al. (1981).
attempt to determine whether a given type of amino acidside chain is, on the average, distributed between thesurface and interior of the protein in the same way it wouldbe distributed between water and a solvent with a polaritysimilar to that of the protein's interior. The simplestapproach is to classify all residues as being either buried inthe protein or exposed to water. These data can then beanalyzed using the equation
AF;= RT In(Mi,J/M,b), (2)
where AF'i is an apparent transfer energy for the ithresidue and M,, and Mi,b are its mole fractions that areexposed to water or buried in the protein, respectively(Janin, 1979). Table II shows results of four studies usingthis analysis. Comparison of these data to the partitionenergy and solvation energy scales yields ambiguous find-ings. Data from studies by Wertz and Scheraga (1978) andRobson and Osguthorpe (1979) correlate better with thepartition energies (AFaa) of Table I, whereas data obtainedby Janin (1979) and Chothia (1976) correlate better with
solvation energies(ASE)(see correlation coefficients inTable II).
Other Statistical Studies
Three methods that do not classify residues as buried or
exposed have been used to analyze effects of side-chainpolarities on their distributions in proteins of known struc-ture. Correlation coefficients between any scale and AFaaand ASE values of Table I will be called R(AF) andR(ASE). Meirovitch et al. (1980) determined the radius ofgyration, (r), of side chains and a-carbons relative to theradius of gyration of the proteins. The (r) values for sidechains in small proteins correlate better with the partitionenergy scale, AFaa, [R(AF) = 0.80] than with the solvationenergy scale [R(.ASE) = 0.60]; however, for side-chains inlarge proteins, (r) correlates slightly better with solvationenergies [R(ASE) = 0.73, R(AF) = 0.70]. It thus appearsthat protein size may affect correlation of these data.Ponnuswamy et al. (1980) developed a hydrophobicity
index, (Hf ), by summing the hydrophobic indices (as
GuY Amino Acid Side-Chain Partition Energies 63
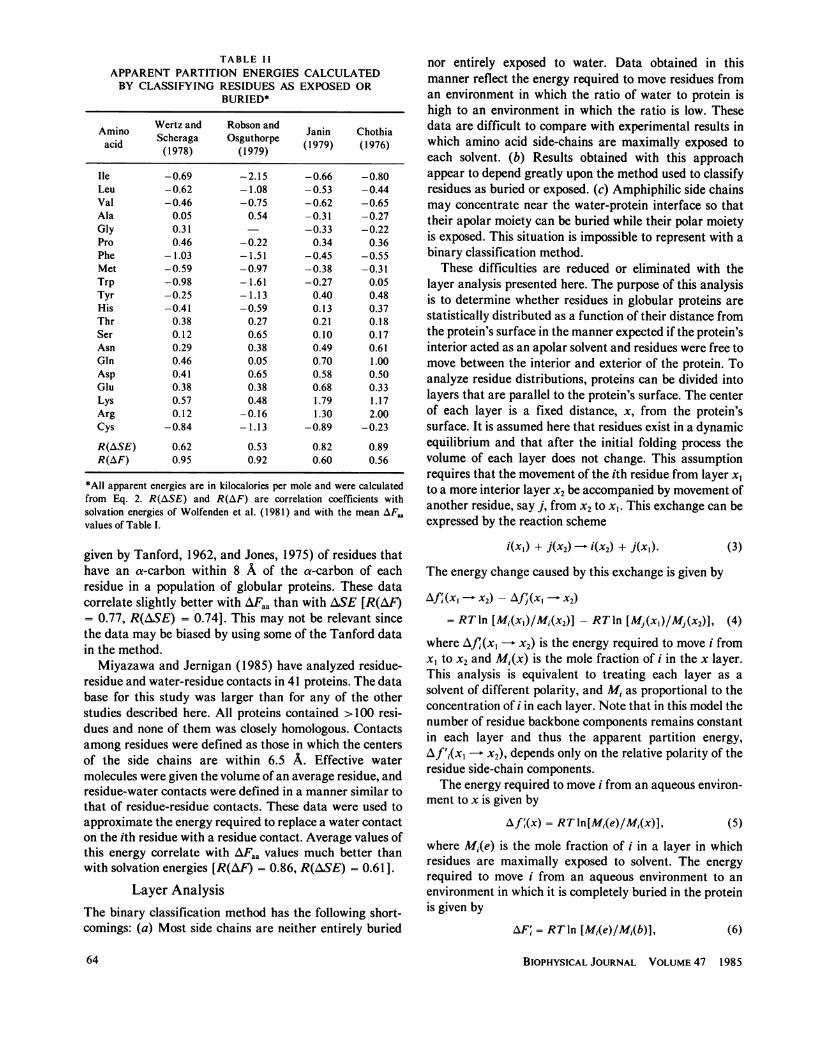
TABLE IIAPPARENT PARTITION ENERGIES CALCULATEDBY CLASSIFYING RESIDUES AS EXPOSED OR
BURIED*
Amino Wertz and Robson and Janin Chothiaacid Scheraga Osguthorpe (1979) (1976)(1978) (1979)
Ile -0.69 -2.15 -0.66 -0.80Leu -0.62 -1.08 -0.53 -0.44Val -0.46 -0.75 -0.62 -0.65Ala 0.05 0.54 -0.31 -0.27Gly 0.31 -0.33 -0.22Pro 0.46 -0.22 0.34 0.36Phe -1.03 -1.51 -0.45 -0.55Met -0.59 -0.97 -0.38 -0.31Trp -0.98 -1.61 -0.27 0.05Tyr -0.25 -1.13 0.40 0.48His -0.41 -0.59 0.13 0.37Thr 0.38 0.27 0.21 0.18Ser 0.12 0.65 0.10 0.17Asn 0.29 0.38 0.49 0.61Gln 0.46 0.05 0.70 1.00Asp 0.41 0.65 0.58 0.50Glu 0.38 0.38 0.68 0.33Lys 0.57 0.48 1.79 1.17Arg 0.12 -0.16 1.30 2.00Cys -0.84 -1.13 -0.89 -0.23
R(ASE) 0.62 0.53 0.82 0.89R(AF) 0.95 0.92 0.60 0.56
*All apparent energies are in kilocalories per mole and were calculatedfrom Eq. 2. R(ASE) and R(AF) are correlation coefficients withsolvation energies of Wolfenden et al. (1981) and with the mean AF.values of Table I.
given by Tanford, 1962, and Jones, 1975) of residues thathave an a-carbon within 8 A of the a-carbon of eachresidue in a population of globular proteins. These datacorrelate slightly better with AFaa than with ASE [R(AF)= 0.77, R(ASE) = 0.74]. This may not be relevant sincethe data may be biased by using some of the Tanford datain the method.
Miyazawa and Jernigan (1985) have analyzed residue-residue and water-residue contacts in 41 proteins. The database for this study was larger than for any of the otherstudies described here. All proteins contained >100 resi-dues and none of them was closely homologous. Contactsamong residues were defined as those in which the centersof the side chains are within 6.5 A. Effective watermolecules were given the volume of an average residue, andresidue-water contacts were defined in a manner similar tothat of residue-residue contacts. These data were used toapproximate the energy required to replace a water contacton the ith residue with a residue contact. Average values ofthis energy correlate with AFaa values much better thanwith solvation energies [R(AF) = 0.86, R(ASE) = 0.61].
Layer AnalysisThe binary classification method has the following short-comings: (a) Most side chains are neither entirely buried
nor entirely exposed to water. Data obtained in thismanner reflect the energy required to move residues froman environment in which the ratio of water to protein ishigh to an environment in which the ratio is low. Thesedata are difficult to compare with experimental results inwhich amino acid side-chains are maximally exposed toeach solvent. (b) Results obtained with this approachappear to depend greatly upon the method used to classifyresidues as buried or exposed. (c) Amphiphilic side chainsmay concentrate near the water-protein interface so thattheir apolar moiety can be buried while their polar moietyis exposed. This situation is impossible to represent with abinary classification method.
These difficulties are reduced or eliminated with thelayer analysis presented here. The purpose of this analysisis to determine whether residues in globular proteins arestatistically distributed as a function of their distance fromthe protein's surface in the manner expected if the protein'sinterior acted as an apolar solvent and residues were free tomove between the interior and exterior of the protein. Toanalyze residue distributions, proteins can be divided intolayers that are parallel to the protein's surface. The centerof each layer is a fixed distance, x, from the protein'ssurface. It is assumed here that residues exist in a dynamicequilibrium and that after the initial folding process thevolume of each layer does not change. This assumptionrequires that the movement of the ith residue from layer x,to a more interior layer x2 be accompanied by movement ofanother residue, say j, from x2 to x,. This exchange can beexpressed by the reaction scheme
i(x1) + (X2)- i(x2) + j(Xl). (3)
The energy change caused by this exchange is given by
Af(I(X2) - Afj(xI- x2)
= RTln [Mi(x,)/Mi(x2)]- RTln [Mj(xl)/Mj(x2)], (4)
where /fi(xl- x2) is the energy required to move i fromxI to x2 and Mi(x) is the mole fraction of i in the x layer.This analysis is equivalent to treating each layer as asolvent of different polarity, and Mi as proportional to theconcentration of i in each layer. Note that in this model thenumber of residue backbone components remains constantin each layer and thus the apparent partition energy,Af'i(x1- x2), depends only on the relative polarity of theresidue side-chain components.The energy required to move i from an aqueous environ-
ment to x is given by
Afi(x) = RTln[Mi(e)/Mi(x)], (5)where Mi(e) is the mole fraction of i in a layer in whichresidues are maximally exposed to solvent. The energyrequired to move i from an aqueous environment to anenvironment in which it is completely buried in the proteinis given by
AF = RTIn [Mi(e)/Mi(b)], (6)
BIOPHYSICAL JOURNAL VOLUME 47 198564
where Mi(b) is the mole fraction of i in completely buriedlayers. AF' is the apparent energy term that is best relatedto energies calculated from partitioning of amino acids ortheir side-chain analogs between water and less polarphases. AF is difficult to determine directly because veryfew residues are maximally exposed to water or completelyburied inside proteins. It can be estimated by making a fewsimple assumptions. Consider the case in which a residue,which is treated as a sphere of finite size and uniformpolarity, is moved from water through each layer to thecenter of the protein. When the residue is far from thesurface, the energy required to move it will be relativelyindependent of x. The environment experienced by theresidue will be less polar in each successive layer until itreaches layers in which residues are never exposed to waterwhere, if the protein is sufficiently large, the energy tomove it will be independent of x again. The transition willbe gradual because of the finite size of the residue, thegradual change in average polarity of side chains in theproteins, and statistical variation introduced by the methodused to approximate protein surfaces. With this rationale,Eq. 5 can be rewritten
Af(x) = AF'Sig(x), (7)
where Sig(x) is a sigmoidal curve that equals the energyrequired to move i from water to x, divided by the energyrequired to completely bury it. Sig(x) may be considered asthe fraction of i that is buried at x. A residue can beconsidered completely exposed when its accessible surfacearea equals its accessible area in a single extended strand,and completely buried when its accessible surface area iszero. To analyze statistical data from proteins with thisequation, apparent energies must be calculated relative tosome point in the proteins. The completely exposed orcompletely buried regions are not good reference pointsbecause the surface is difficult to define and very fewresidues are either completely buried inside the protein orcompletely exposed to water. The proteins should contain alayer in which the mole fraction of i equals its mole fractionin the entire data base, Mi [see Fig. I where f'*(x) = 0].This layer, which will be called the reference layer, is notsubject to the statistical problems of completely exposed orcompletely buried regions. The apparent energy, /f*(x),required to move i from the reference layer to x can beeasily calculated from the equation
Af *(x) = RTln[Mi/Mi(x)]. (8a)
The sum of Af*(x) for all residues in a given proteinshould approximate the energy difference between theactual structure and the mean of all structures with thesame surface-to-volume ratio but in which residues arerandomly distributed. Af*(x) equals the energy requiredto move residue i from water to x minus the energyrequired to move i from water to the reference layer. Thus,
GuY Amino Acid Side-Chain Partition Energies
4--
0E
.-
x*ll
10.5o-0.5 I
10.5 0SERjIo.so. - SR
-o.11 HIS-
0.5 BTKPIo-0.5O1
-05* 0.5<P
0 0.5 1
ASN40. Z
:THR
0 0.5 1x
AIA
PRO5E
m._l I
0 0.5 1
GLY
ASP
GIJ
G.U
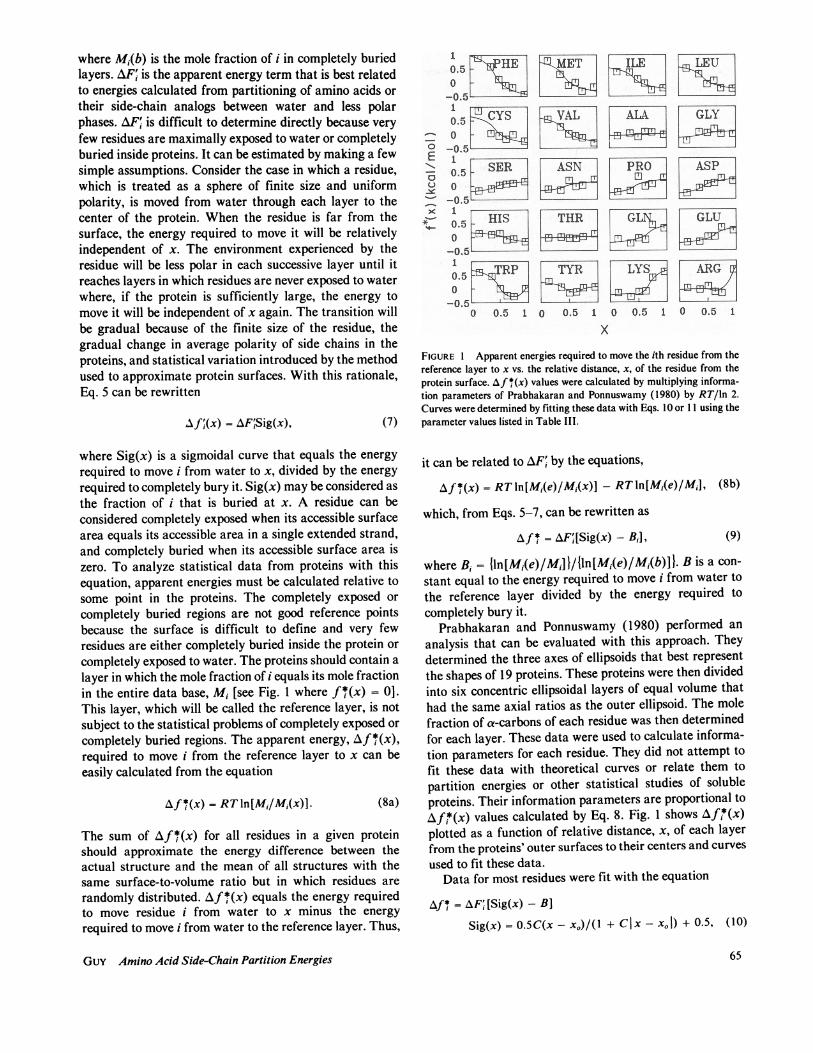
o 0.5 1
FIGURE I Apparent energies required to move the ith residue from thereference layer to x vs. the relative distance, x, of the residue from theprotein surface. Af *(x) values were calculated by multiplying informa-tion parameters of Prabhakaran and Ponnuswamy (1980) by RT/ln 2.Curves were determined by fitting these data with Eqs. 10 or 11 using theparameter values listed in Table III.
it can be related to zYF by the equations,
Af *(x) = RT ln[M,(e)/M,(x)]- RTIn[M,(e)/MjI, (8b)
which, from Eqs. 5-7, can be rewritten as
Af4 = AF[Sig(x) - Bi], (9)
where Bi = {ln[Mi(e)/Mi]}/{ln[Mi(e)/Mi(b)]1. B is a con-
stant equal to the energy required to move i from water to
the reference layer divided by the energy required to
completely bury it.Prabhakaran and Ponnuswamy (1980) performed an
analysis that can be evaluated with this approach. Theydetermined the three axes of ellipsoids that best representthe shapes of 19 proteins. These proteins were then dividedinto six concentric ellipsoidal layers of equal volume thathad the same axial ratios as the outer ellipsoid. The molefraction of a-carbons of each residue was then determinedfor each layer. These data were used to calculate informa-tion parameters for each residue. They did not attempt to
fit these data with theoretical curves or relate them to
partition energies or other statistical studies of solubleproteins. Their information parameters are proportional to
Af*(x) values calculated by Eq. 8. Fig. 1 shows Af*(x)plotted as a function of relative distance, x, of each layerfrom the proteins' outer surfaces to their centers and curves
used to fit these data.Data for most residues were fit with the equation
At* = AF;[Sig(x) - B]
Sig(x) = 0.5C(x - x0)/(1 + Clx - x1) + 0.5, (10)
65
where C and xo are constants. This equation for Sig(x)produces a symmetrical sigmoidal curve that is zero whenx approaches -Xc and one when x approaches . It wasused because it is computationally the simplest equationthat can fit the data in a way that allows all the parametersexcept AF; to be the same for all apolar residues. Other,more complex equations could be used; however, they alterthe absolute values calculated for AF' only slightly andhave almost no effect on the relative values of AF'. Thecurve's inflection point occurs at xo. Changing its valueshifts the curve to the left or right. The portion of theresidue that controls its distribution can be considered halfburied when x = x0; i.e., when Sig(x) = 0.5. C controls thesteepness of the transition between the water and proteinphases. It should be related to the reciprocal of thethickness of the transition region from water to protein andrandomization introduced by treating irregular shapedproteins as ellipsoids. These factors should be the same forall residues. A value of 4 was determined for C by firstfitting all the data with no constraints. The location of thereference layer, Xr, can be determined by solving Eq. 10 forx when f*(x) is zero.
Prabhakaran and Ponnuswamy's data were analyzed infour categories according to their side chains. Those withside chains that have no distinct polar atoms are shown inthe first two rows of Fig. 1. When data for these residueswere fit with Eq. 10 using least-square analysis and noconstraints, values of B, C, and xo were about the same forall residues. This suggests that these parameters are pro-tein dependent and should be the same for all apolarresidues. If so, improved values of AF', which is theparameter of most interest, should be obtained for eachresidue by constraining the other parameters to be thesame for all residues. Values of B = 0.79 and xo = 0.43were calculated by weighting the Af'i(x) values for apolarresidues to reflect their frequency of occurrence in pro-teins, summing all of these values, and then fitting thesedata with Eq. 10 with C = 4. AF values of Table III werethen determined by constraining these parameters. If thisanalysis is correct and Sig(x) approximates the fraction ofthe residue that is buried, then apolar residues in the outerlayer (x = 0.14) are 23% buried and those in the innerlayer (x = 0.95) are 84% buried. These values appearreasonable.
Residues in the second category (Ser, Asn, and Asp)have small apolar side-chain components and polar compo-nents near the a-carbon. Their distributions are shown inthe third row of Fig. 1. These data were fit with the same xoand C values as above; however, a slightly more positivevalue for B yielded better fits and the reference layerappears to be slightly nearer the surface than that forapolar side chains (Table III). Pro and Gly, which distri-bute as if they were polar, were included in this category.
Residues in the third category (Glu, Gln, Thr, and His)have side chains with both polar and apolar components.Alkyl side-chain partition energies are directly propor-
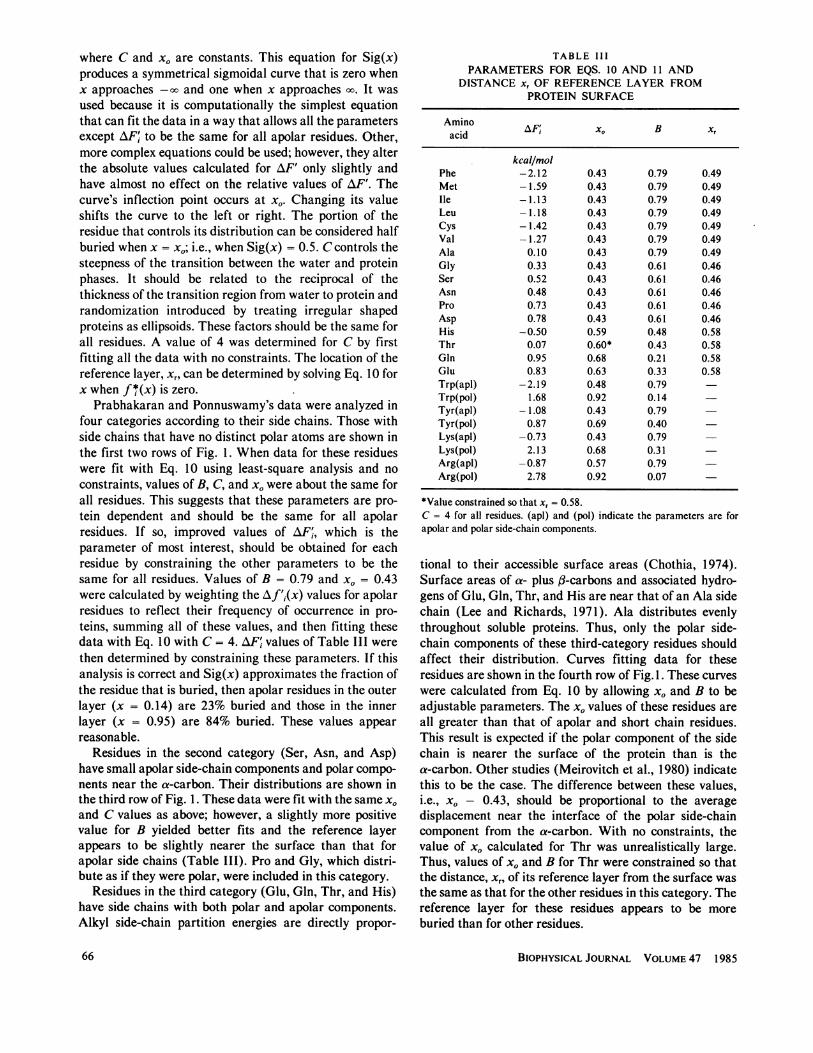
TABLE IIIPARAMETERS FOR EQS. 10 AND 11 AND
DISTANCE xr OF REFERENCE LAYER FROMPROTEIN SURFACE
Amino AF X, B Xracid
keal/molPhe -2.12 0.43 0.79 0.49Met -1.59 0.43 0.79 0.49Ile -1.13 0.43 0.79 0.49Leu -1.18 0.43 0.79 0.49Cys - 1.42 0.43 0.79 0.49Val - 1.27 0.43 0.79 0.49Ala 0.10 0.43 0.79 0.49Gly 0.33 0.43 0.61 0.46Ser 0.52 0.43 0.61 0.46Asn 0.48 0.43 0.61 0.46Pro 0.73 0.43 0.61 0.46Asp 0.78 0.43 0.61 0.46His -0.50 0.59 0.48 0.58Thr 0.07 0.60* 0.43 0.58Gln 0.95 0.68 0.21 0.58Glu 0.83 0.63 0.33 0.58Trp(apl) -2.19 0.48 0.79Trp(pol) 1.68 0.92 0.14Tyr(apl) -1.08 0.43 0.79Tyr(pol) 0.87 0.69 0.40Lys(apl) -0.73 0.43 0.79Lys(pol) 2.13 0.68 0.31Arg(apl) -0.87 0.57 0.79Arg(pol) 2.78 0.92 0.07
*Value constrained so that xr - 0.58.C = 4 for all residues. (apl) and (pol) indicate the parameters are forapolar and polar side-chain components.
tional to their accessible surface areas (Chothia, 1974).Surface areas of a- plus fl-carbons and associated hydro-gens of Glu, Gln, Thr, and His are near that of an Ala sidechain (Lee and Richards, 1971). Ala distributes evenlythroughout soluble proteins. Thus, only the polar side-chain components of these third-category residues shouldaffect their distribution. Curves fitting data for theseresidues are shown in the fourth row of Fig. 1. These curveswere calculated from Eq. 10 by allowing x0 and B to beadjustable parameters. The x0 values of these residues areall greater than that of apolar and short chain residues.This result is expected if the polar component of the sidechain is nearer the surface of the protein than is thea-carbon. Other studies (Meirovitch et al., 1980) indicatethis to be the case. The difference between these values,i.e., xo - 0.43, should be proportional to the averagedisplacement near the interface of the polar side-chaincomponent from the a-carbon. With no constraints, thevalue of xo calculated for Thr was unrealistically large.Thus, values of xo and B for Thr were constrained so thatthe distance, xr, of its reference layer from the surface wasthe same as that for the other residues in this category. Thereference layer for these residues appears to be moreburied than for other residues.
BIOPHYSICAL JOURNAL VOLUME 47 198566
A model that treats residues as single spheres of uniformpolarity is not adequate for some residues. Tyr, Trp, Lys,and Arg side chains have polar components and apolarcomponents with surface areas substantially larger thanthat of an Ala side chain. These residues would be expectedto concentrate near the interface so that their apolarcomponents can be buried while their polar componentsare exposed. Their distribution reflects this expectation(Fig. 1). These residues can be represented by a twocomponent, or two sphere, model in which the polarcomponent is nearer the surface and thus more exposedthan the apolar component. Thus, data for these residueswere fit by the following equation which is the sum of twosigmodial curves with the curve for the apolar componentshifted along the x-axis relative to that for the apolarcomponent
Af*'(x) = {AF,[Sig(x) - B]}a + {AF'[Sig(x) - B]}p, (11)
where a and p subscripts indicate that the parameters arefor apolar and polar side-chain components, respectively.In fitting the data, all parameters for the apolar componentwere constrained: Xoa was constrained to be .0.43 and Bawas held at the value used for apolar residues. Values ofAF'ia were approximated by relating surface areas to AFvalues for alkyl and phenyl side chains. Parameters of thepolar components were given complete freedom, except forC, which was held at 4 (Table III). Note that x,p is alwaysgreater than xoa, indicating that the polar component isnearer than the apolar component to the surface. AF'values of Table III, which represent differences betweenextrapolated values of the curves in Fig. 1, correlatesubstantially better with the partition energy scale, AFaa,[R(AF) = 0.84] than with solvation energies [R(ASE) =0.65].
Comparison of Statistical Data thatCorrelate with Partition Energies
Statistical fluctuation of data is a major difficulty with thekinds of analyses described above. To determine whetherdeviation ofAF' values calculated from the data of Prabha-karan and Ponnuswamy from AFaa values are indicative ofproteins in general, data from the studies described abovethat correlate better with partition energies were convertedto scales that are approximately equivalent to AF' values(Table IV). The scale from the Ponnuswamy et al. (1980)data equals -0.77((Hf) - 12.3), the scale from thestudy of Meirovitch et al. (1980) for small proteins equals6.66(1 - (r)), and the scale from Wertz and Scheraga(1978) is 2.25 times the values in Table II. The conversionswere made to allow easier comparison of the data and donot alter correlation values because the scaled values areproportional to the original values. Although the new scalesshould not be construed to be equal to transfer energies, amean of these scales correlates slightly better with parti-tion energies than the AF' scale does. The correlation
TABLE IVPOLARITY SCALES CALCULATED FROM
DISTRIBUTIONS OF RESIDUES IN PROTEINS
Data AF' A B C Meansource A
Ile -1.13 -1.38 -1.55 -1.16 -1.31 + 0.17Leu -1.18 -0.99 -1.61 -1.04 -1.21 ± 0.24Val -1.27 -1.55 -0.78 -0.77 -1.09 ± 0.33Ala 0.10 0.07 0.00 0.08 0.06 ± 0.04Gly 0.33 0.23 0.54 0.52 0.41 ± 0.13Pro 0.73 0.71 0.60 0.77 0.70 ± 0.06Phe -2.12 -0.60 -2.26 -1.73 -1.68 + 0.65Met -1.59 -1.12 -1.37 -0.99 -1.27 ± 0.23Trp -0.51 -0.32 -1.02 -1.65 -0.88 ± 0.52Tyr -0.21 -0.51 -0.18 -0.42 -0.33 ± 0.14His -0.50 -0.25 -0.54 -0.67 -0.49 ± 0.15Thr 0.07 0.44 -0.06 0.64 0.27 ± 0.28Ser 0.52 0.67 0.60 0.20 0.50 + 0.18Asn 0.48 0.82 0.12 0.48 0.48 + 0.25Gln 0.95 0.66 0.54 0.77 0.73 ± 0.15Asp 0.78 0.84 0.90 0.69 0.80 ± 0.08Glu 0.83 0.71 0.90 0.64 0.77 ± 0.10Lys 1.40 0.93 1.43 0.96 1.18 ± 0.24Arg 1.91 0.53 0.72 0.20 0.84 ± 0.65Cys -1.42 -1.47 -1.13 -1.41 -1.36 ± 0.13R(ASE) 0.65 0.74 0.63 0.62 0.66R(AF) 0.84 0.77 0.86 0.95 0.90R(AF')* - 0.96t 0.97 0.92 -
The sources of data used to calculate the polarity scales are (A)Ponnuswamy et al. (1980), (B) Meirovitch et al. (1980), and (C) Wertzand Scheraga (1978). Methods used to calculate the polarity scales fromthe original data are described in the text. R(ASE) and R(AF) are thesame as in Table II and R(AF') is the correlation coefficient with the AF'values calculated by fitting the Prabhakaran and Ponnuswamy data.*Data for Arg was not included.tData for Phe not included.
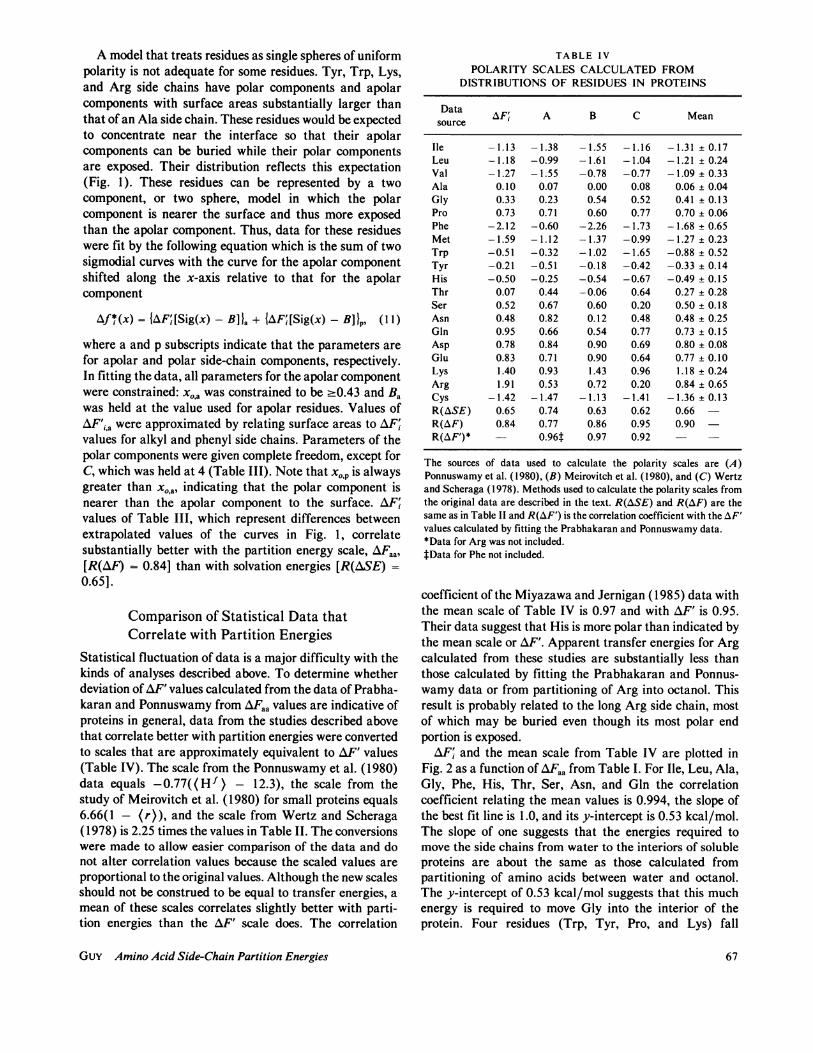
coefficient of the Miyazawa and Jernigan (1985) data withthe mean scale of Table IV is 0.97 and with AF' is 0.95.Their data suggest that His is more polar than indicated bythe mean scale or AF'. Apparent transfer energies for Argcalculated from these studies are substantially less thanthose calculated by fitting the Prabhakaran and Ponnus-wamy data or from partitioning of Arg into octanol. Thisresult is probably related to the long Arg side chain, mostof which may be buried even though its most polar endportion is exposed.AF and the mean scale from Table IV are plotted in
Fig. 2 as a function of AFaa from Table I. For Ile, Leu, Ala,Gly, Phe, His, Thr, Ser, Asn, and Gln the correlationcoefficient relating the mean values is 0.994, the slope ofthe best fit line is 1.0, and its y-intercept is 0.53 kcal/mol.The slope of one suggests that the energies required tomove the side chains from water to the interiors of solubleproteins are about the same as those calculated frompartitioning of amino acids between water and octanol.The y-intercept of 0.53 kcal/mol suggests that this muchenergy is required to move Gly into the interior of theprotein. Four residues (Trp, Tyr, Pro, and Lys) fall
Guy Amino Acid Side-Chain Partition Energies 67
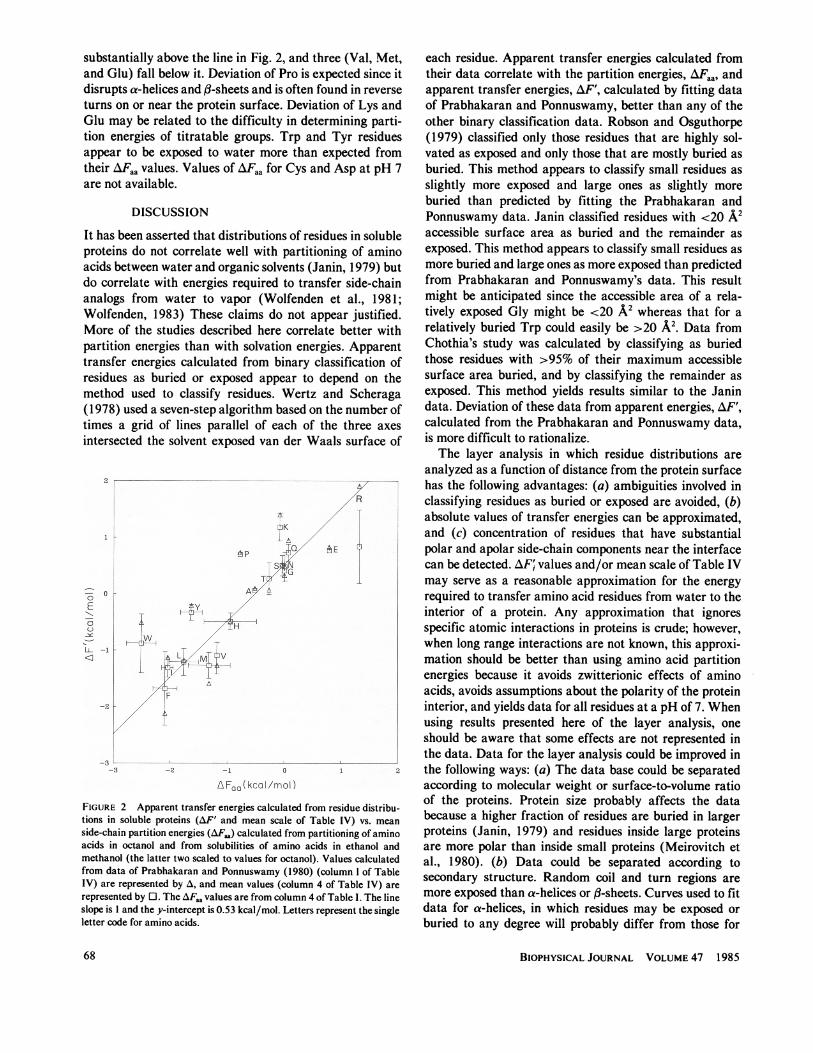
substantially above the line in Fig. 2, and three (Val, Met,and Glu) fall below it. Deviation of Pro is expected since itdisrupts a-helices and A-sheets and is often found in reverseturns on or near the protein surface. Deviation of Lys andGlu may be related to the difficulty in determining parti-tion energies of titratable groups. Trp and Tyr residuesappear to be exposed to water more than expected fromtheir AFaa values. Values of AFaa for Cys and Asp at pH 7are not available.
DISCUSSION
It has been asserted that distributions of residues in solubleproteins do not correlate well with partitioning of aminoacids between water and organic solvents (Janin, 1979) butdo correlate with energies required to transfer side-chainanalogs from water to vapor (Wolfenden et al., 1981;Wolfenden, 1983) These claims do not appear justified.More of the studies described here correlate better withpartition energies than with solvation energies. Apparenttransfer energies calculated from binary classification ofresidues as buried or exposed appear to depend on themethod used to classify residues. Wertz and Scheraga(1978) used a seven-step algorithm based on the number oftimes a grid of lines parallel of each of the three axesintersected the solvent exposed van der Waals surface of
E
U-4.
-a -1 .@ 1 93
AFdO(.kcaI/mol)
FIGURE 2 Apparent transfer energies calculated from residue distribu-tions in soluble proteins (AF' and mean scale of Table IV) vs. meanside-chain partition energies (AFt,) calculated from partitioning of aminoacids in octanol and from solubilities of amino acids in ethanol andmethanol (the latter two scaled to values for octanol). Values calculatedfrom data of Prabhakaran and Ponnuswamy (1980) (column I of TableIV) are represented by A, and mean values (column 4 of Table IV) arerepresented by E. The AFaa values are from column 4 of Table I. The lineslope is 1 and the y-intercept is 0.53 kcal/mol. Letters represent the singleletter code for amino acids.
each residue. Apparent transfer energies calculated fromtheir data correlate with the partition energies, AFaa, andapparent transfer energies, AF', calculated by fitting dataof Prabhakaran and Ponnuswamy, better than any of theother binary classification data. Robson and Osguthorpe(1979) classified only those residues that are highly sol-vated as exposed and only those that are mostly buried asburied. This method appears to classify small residues asslightly more exposed and large ones as slightly moreburied than predicted by fitting the Prabhakaran andPonnuswamy data. Janin classified residues with <20 A2accessible surface area as buried and the remainder asexposed. This method appears to classify small residues asmore buried and large ones as more exposed than predictedfrom Prabhakaran and Ponnuswamy's data. This resultmight be anticipated since the accessible area of a rela-tively exposed Gly might be <20 A2 whereas that for arelatively buried Trp could easily be >20 A2. Data fromChothia's study was calculated by classifying as buriedthose residues with >95% of their maximum accessiblesurface area buried, and by classifying the remainder asexposed. This method yields results similar to the Janindata. Deviation of these data from apparent energies, AF',calculated from the Prabhakaran and Ponnuswamy data,is more difficult to rationalize.The layer analysis in which residue distributions are
analyzed as a function of distance from the protein surfacehas the following advantages: (a) ambiguities involved inclassifying residues as buried or exposed are avoided, (b)absolute values of transfer energies can be approximated,and (c) concentration of residues that have substantialpolar and apolar side-chain components near the interfacecan be detected. AF values and/or mean scale of Table IVmay serve as a reasonable approximation for the energyrequired to transfer amino acid residues from water to theinterior of a protein. Any approximation that ignoresspecific atomic interactions in proteins is crude; however,when long range interactions are not known, this approxi-mation should be better than using amino acid partitionenergies because it avoids zwitterionic effects of aminoacids, avoids assumptions about the polarity of the proteininterior, and yields data for all residues at a pH of 7. Whenusing results presented here of the layer analysis, oneshould be aware that some effects are not represented inthe data. Data for the layer analysis could be improved inthe following ways: (a) The data base could be separatedaccording to molecular weight or surface-to-volume ratioof the proteins. Protein size probably affects the databecause a higher fraction of residues are buried in largerproteins (Janin, 1979) and residues inside large proteinsare more polar than inside small proteins (Meirovitch etal., 1980). (b) Data could be separated according tosecondary structure. Random coil and turn regions aremore exposed than a-helices or fl-sheets. Curves used to fitdata for a-helices, in which residues may be exposed orburied to any degree will probably differ from those for
BIOPHYSICAL JOURNAL VOLUME 47 198568
3-sheets, in which residues may tend to be more completelyburied or exposed. (c) The data base could be increased.This is probably essential for the improvements suggestedabove to yield statistically significant data. (d) Distancescould be analyzed in absolute instead of relative units. (e)A method that simulates the surface better than theellipsoids or that relates layers to the fraction of eachresidue's surface that is exposed to water could be used.The analysis presented here was undertaken to help
develop a method to approximate solvent and long rangeprotein interactions in models of protein structures inwhich precise long range interactions may not be known. Amethod using Eqs. 10 and 1 1, i.e., energy-distance relation-ships similar to those in Fig. 1, has been developed topredict the orientation and degree of solvent exposure ofamphiphilic a-helices at a water-protein or a protein-lipidinterface. In spite of the limitations of the data and analysisdescribed above, this method correctly classifies almost allresidues in hemoglobin as buried, partially buried, orexposed (unpublished observation). It has been used withother factors to predict which segments in acetylcholinereceptor channel (Guy, 1984a) and colicin El (Guy, 1983)and colicin A channel (Guy, 1 984b) sequences are likely tobe transmembrane helices, and to predict which portions ofthese helices should be exposed to water inside the channel,to other helices, and to lipid. The polarity scale presentedhere was not used in these studies to evaluate protein-lipidinteractions because the lipid environment is probablysubstantially less polar than the interior of soluble pro-teins.The analysis presented here indicates that most residues
distribute as a function of the relative distance from thesurface of soluble proteins in a manner consistent withside-chain partition energies calculated from partitioningof amino acids between water and octanol phases. Thisdoes not indicate, however, that octanol is a good model forthe interior of the protein. Yunger and Cramer (1981)noted that side-chain partition energies calculated from thestudies using amino acids are -0.6 times those calculatedfor transfer of side chains only to octanol using the methodof Hansch and Leo (1979). Also, absolute values ofside-chain partition energies to octanol calculated fromstudies using amino acids are less than those calculatedfrom amino acid solubilities in ethanol and methanol eventhough ethanol and methanol are more polar solvents.These anomalous effects may be caused by the zwitterionicnature of amino acids. Thus, the absolute magnitude ofenergies required to transfer amino acid side chains toorganic solvents is subject to uncertainty. In addition,absolute values of AF are dependent upon the sigmoidalcurve used in Eq. 10; e.g., if the same equation had beenmodified so that Sig(x) is 0 when x < x - 0.5 and 1 whenx > x0 + 0.5, then AF' values would be two-thirds thosereported but the relative values would be the same. Abso-lute values are not important for many applications. Infact, the Prabhakaran and Ponnuswamy data were origi-
nally obtained from information theory and no attemptwas made to relate the terms to energies. The advantagesof absolute energies are that they can be better comparedwith experimentally determined energies and can be com-bined with other energy terms. The finding that, in moststudies, residue distributions do not correlate well withsolvation energies does not indicate that solvation energiesdo not have important applications. Terms derived fromsolvation energies may be appropriate when attempting toadd effects of water to other conformation energy termsthat treat proteins as if they exist in a vacuum. Thus,selection of the appropriate energy scale depends uponwhat one is trying to calculate.
Received for publication 10 January 1984 and in finalform 13 August1984.
REFERENCES
Argos, J. K., J. K. M. Rao, and P. A. Hargrave. 1982. Structuralpredictions of membrane proteins. Eur. J. Biochem. 128:565-575.
Chothia, C. 1974. Hydrophobic bonding and accessible surface area inproteins. Nature (Lond. ). 248:338-339.
Chothia, C. 1976. The nature of the accessible and buried surfaces inproteins. J. Mol. Biol. 105:1-14.
Cid, H., M. Bunster, E. Arriagada, and M. Campos. 1982. Prediction ofsecondary structure of proteins by means of hydrophobicity profiles.FEBS (Fed. Eur. Biochem. Soc. ) Lett. 150:247-254.
Eisenberg, D., R. M. Weiss, and T. C. Terwilliger. 1982. The helicalhydrophobic moment: a measure of the amphiphilicity of a helix.Nature (Lond. ). 299:371-374.
Eisenberg, D., R. M. Weiss, and T. C. Terwilliger. 1984. The hydro-phobic moment detects periodicity in protein hydrophobicity. Proc.Natl. Acad. Sci. USA. 81:140-144.
Engelman, D. M., and T. A. Steitz. 1981. The spontaneous insertion ofproteins into and across membranes: the helical hairpin hypothesis.Cell. 23:411-422.
Fauchere, J. L., K. Q. Do, P. Y. C. Jow, and C. Hansch. 1980. Unusuallystrong lipophilicity of "fat" or "super" amino-acids, including a newreference value for glycine. Experientia (Basel). 36:1203-1204.
Finer-Moore, J., and R. M. Stroud. 1984. Amphipathic analysis andpossible formation of the ion channel in an acetylcholine receptor. Proc.Natl. Acad. Sci. USA. 81:155-159.
Gekko, K. 1981. Mechanism of polyol-induced protein stabilization:solubility of amino acids and diglycine in aqueous polyol solutions. J.Biochem. 90:1633-1641.
Guy, H. R. 1983. A model of colicin El membrane channel proteinstructure. Biophys. J. 41(2, Pt. 2):363a. (Abstr.)
Guy, H. R. 1984a. A structural model of the acetylcholine receptorchannel based on partition energy and helix packing calculations.Biophys. J. 45:249-261.
Guy, H. R. 1984b. A model of colicin A membrane channel proteinstructure. Biophys. J. 45(2, Pt. 2):123a. (Abstr.)
Hansch, C., and A. Leo. 1979. Substituent Constants for CorrelationAnalysis in Chemistry and Biology. John Wiley & Sons, Inc., NewYork.
Janin, J. 1979. Surface and inside volumes in globular proteins. Nature(Lond. ). 277:491-492.
Jones, D. 1975. Amino acid properties and side-chain orientation inproteins: a cross correlation approach. J. Theor. Biol. 50:167-183.
Klein, R., M. Moore, and M. Smith. 1971. Selective7diffusion of neutralamino acids across lipid bilayers. Biochim. Biophys. Acta. 233:420-433.
Kyte, J., and R. F. Doolittle. 1982. A simple method for displaying thehydropathic character of proteins. J. Mol. Biol. 157:105-132.
GuY Amino Acid Side-Chain Partition Energies 69
Lee, B., and F. M. Richards. 1971. Interpretation of protein structure:estimation of static accessibility. J. Mol. Biol. 55:379-400.
Meirovitch, H., S. Rackovsky, and H. A. Scheraga. 1980. Empiricalstudies of hydrophobicity. 3. Radial distribution of clusters of hydro-phobic and hydrophilic amino acids. Macromolecules. 13:1398-1405.
Miyazawa, S., and R. Jernigan. 1985. Estimation of effective inter-residue contact energies from protein crystal structures: quasi-chemicalapproximation. Macromolecules. In press.
Nozaki, Y., and C. Tanford. 1971. The solubility of amino acids and twoglycine peptides in aqueous ethanol and dioxane solutions. J. Biol.Chem. 246:2211-2217.
Ponnuswamy, P. K., M. Prabhakaran, and P. Manavalan. 1980. Hydro-phobic packing and spatial arrangement of amino acid residues inglobular proteins. Biochim. Biophys. Acta. 623:301-316.
Prabhakaran, M., and P. K. Ponnuswamy. 1980. Spatial assignment ofamino acid residues in globular proteins: an approach from informationtheory. J. Theor. Biol. 87:623-637.
Robson, B., and D. J. Osguthorpe. 1979. Refined models for computersimulation of protein folding. J. Mol. Biol. 132:19-51.
Rose, G. D., and S. Roy. 1980. Hydrophobic basis of packing in globularproteins. Proc. Natl. Acad. Sci. USA. 77:4643-4647.
Tanford, C. 1962. Contribution of hydrophobic interactions to thestability of the globular conformation of proteins. J. Am. Chem. Soc.84:4240-4247.
Von Heijne, G. 1981a. On the hydrophobic nature of signal sequences.Eur. J. Biochem. 116:419-422.
Von Heijne, G. 1981 b. Membrane proteins: the amino acid composition ofmembrane-penetrating segments. Eur. J. Biochem. 120:275-278.
Wertz, D. H., and H. A. Scheraga. 1978. Influence of water on proteinstructure. An analysis of the preferences of amino acid residues for theinside or outside and for specific conformations in a protein molecule.Macromolecules. 1 1:9-15.
Wolfenden, R. 1983. Waterlogged molecules. Science (Wash. DC).222:1087-1093.
Wolfenden, R., L. Andersson, P. M. Cullis., and C. C. B. Southgate.1981. Affinities of amino acid side-chains for solvent water. Biochemis-try. 20:849-855.
Yunger, L. M., and R. D. Cramer, III. 1981. Measurement andcorrelation of partition coefficients of polar amino acids. Mol. Pharma-col. 20:602-608.
70 BIOPHYSICAL JOURNAL VOLUME 47 1985