Embed Size (px)
Citation preview
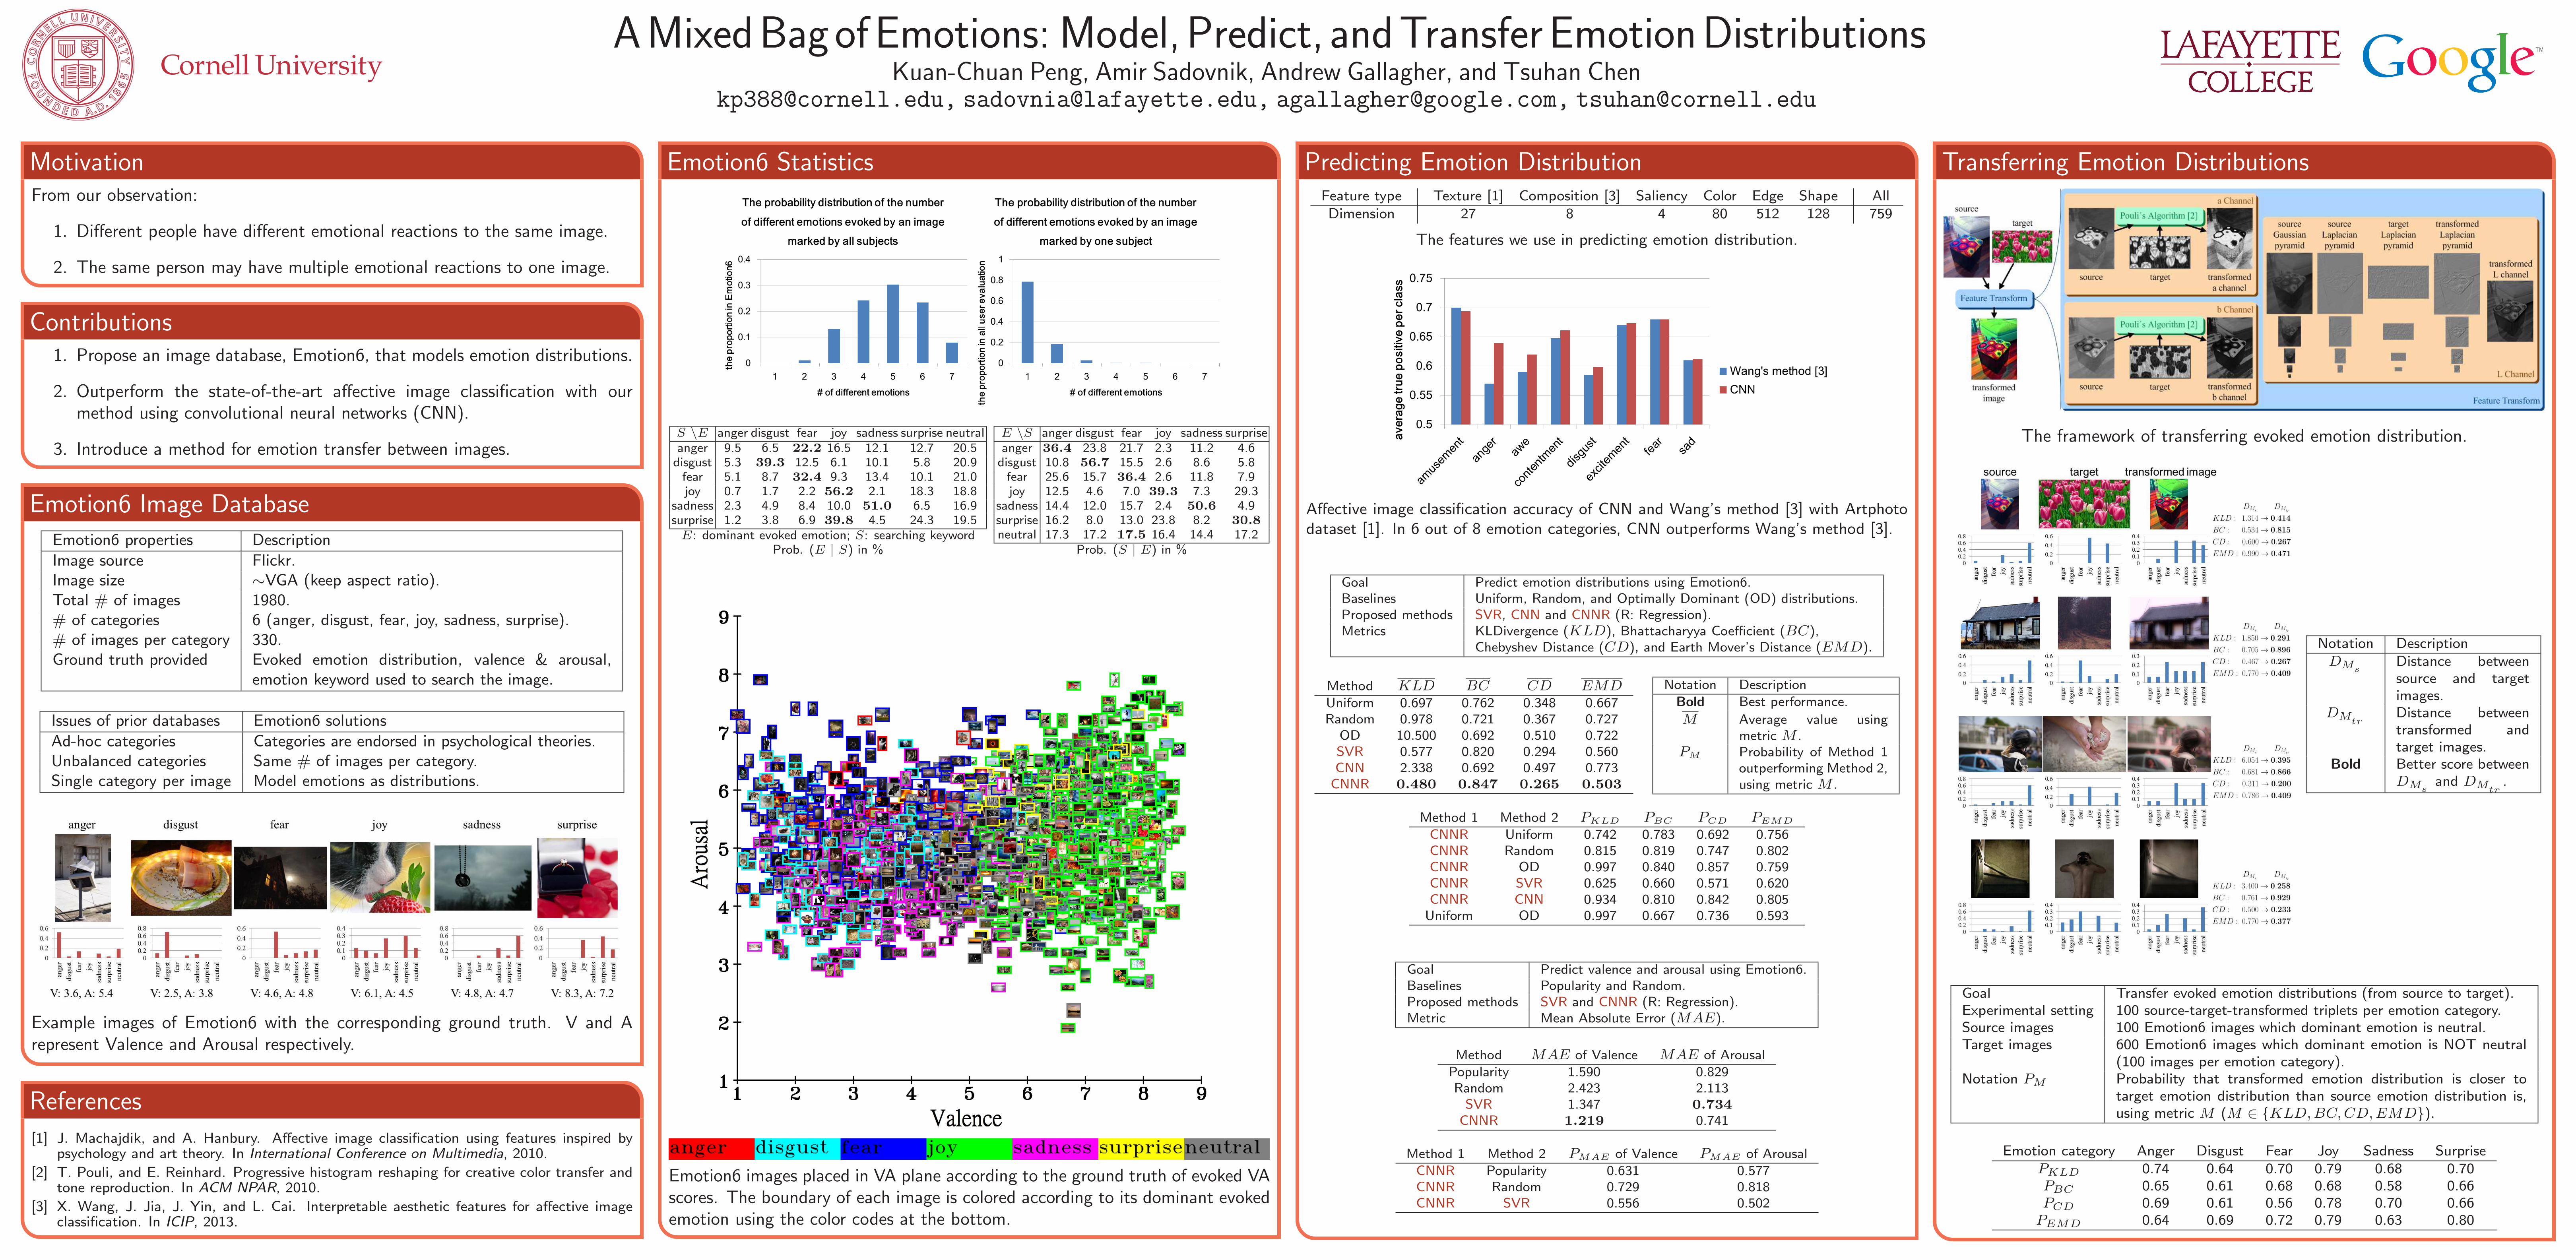
AMixedBagofEmotions: Model,Predict, andTransferEmotionDistributionsKuan-Chuan Peng, Amir Sadovnik, Andrew Gallagher, and Tsuhan Chen
[email protected], [email protected], [email protected], [email protected]
MotivationFrom our observation:
1. Different people have different emotional reactions to the same image.
2. The same person may have multiple emotional reactions to one image.
Contributions1. Propose an image database, Emotion6, that models emotion distributions.
2. Outperform the state-of-the-art affective image classification with ourmethod using convolutional neural networks (CNN).
3. Introduce a method for emotion transfer between images.
Predicting Emotion DistributionFeature type Texture [1] Composition [3] Saliency Color Edge Shape AllDimension 27 8 4 80 512 128 759
The features we use in predicting emotion distribution.
Affective image classification accuracy of CNN and Wang’s method [3] with Artphotodataset [1]. In 6 out of 8 emotion categories, CNN outperforms Wang’s method [3].
Goal Predict emotion distributions using Emotion6.Baselines Uniform, Random, and Optimally Dominant (OD) distributions.Proposed methods SVR, CNN and CNNR (R: Regression).Metrics KLDivergence (KLD), Bhattacharyya Coefficient (BC),
Chebyshev Distance (CD), and Earth Mover’s Distance (EMD).
Method KLD BC CD EMDUniform 0.697 0.762 0.348 0.667Random 0.978 0.721 0.367 0.727
OD 10.500 0.692 0.510 0.722SVR 0.577 0.820 0.294 0.560CNN 2.338 0.692 0.497 0.773
CNNR 0.480 0.847 0.265 0.503
Notation DescriptionBold Best performance.
M Average value usingmetric M .
PM Probability of Method 1outperforming Method 2,using metric M .
Method 1 Method 2 PKLD PBC PCD PEMD
CNNR Uniform 0.742 0.783 0.692 0.756CNNR Random 0.815 0.819 0.747 0.802CNNR OD 0.997 0.840 0.857 0.759CNNR SVR 0.625 0.660 0.571 0.620CNNR CNN 0.934 0.810 0.842 0.805
Uniform OD 0.997 0.667 0.736 0.593
Goal Predict valence and arousal using Emotion6.Baselines Popularity and Random.Proposed methods SVR and CNNR (R: Regression).Metric Mean Absolute Error (MAE).
Method MAE of Valence MAE of ArousalPopularity 1.590 0.829Random 2.423 2.113
SVR 1.347 0.734CNNR 1.219 0.741
Method 1 Method 2 PMAE of Valence PMAE of ArousalCNNR Popularity 0.631 0.577CNNR Random 0.729 0.818CNNR SVR 0.556 0.502
References
[1] J. Machajdik, and A. Hanbury. Affective image classification using features inspired bypsychology and art theory. In International Conference on Multimedia, 2010.
[2] T. Pouli, and E. Reinhard. Progressive histogram reshaping for creative color transfer andtone reproduction. In ACM NPAR, 2010.
[3] X. Wang, J. Jia, J. Yin, and L. Cai. Interpretable aesthetic features for affective imageclassification. In ICIP, 2013.
Emotion6 Image Database
Emotion6 properties Description
Image source Flickr.Image size ∼VGA (keep aspect ratio).Total # of images 1980.# of categories 6 (anger, disgust, fear, joy, sadness, surprise).# of images per category 330.Ground truth provided Evoked emotion distribution, valence & arousal,
emotion keyword used to search the image.
Issues of prior databases Emotion6 solutions
Ad-hoc categories Categories are endorsed in psychological theories.Unbalanced categories Same # of images per category.Single category per image Model emotions as distributions.
Example images of Emotion6 with the corresponding ground truth. V and Arepresent Valence and Arousal respectively.
Transferring Emotion Distributions
The framework of transferring evoked emotion distribution.
Notation DescriptionDMs
Distance betweensource and targetimages.
DMtrDistance betweentransformed andtarget images.
Bold Better score betweenDMs
and DMtr.
Goal Transfer evoked emotion distributions (from source to target).Experimental setting 100 source-target-transformed triplets per emotion category.Source images 100 Emotion6 images which dominant emotion is neutral.Target images 600 Emotion6 images which dominant emotion is NOT neutral
(100 images per emotion category).Notation PM Probability that transformed emotion distribution is closer to
target emotion distribution than source emotion distribution is,using metric M (M ∈ {KLD,BC,CD,EMD}).
Emotion category Anger Disgust Fear Joy Sadness SurprisePKLD 0.74 0.64 0.70 0.79 0.68 0.70PBC 0.65 0.61 0.68 0.68 0.58 0.66PCD 0.69 0.61 0.56 0.78 0.70 0.66PEMD 0.64 0.69 0.72 0.79 0.63 0.80
Emotion6 Statistics
S \E anger disgust fear joy sadness surprise neutralanger 9.5 6.5 22.2 16.5 12.1 12.7 20.5
disgust 5.3 39.3 12.5 6.1 10.1 5.8 20.9fear 5.1 8.7 32.4 9.3 13.4 10.1 21.0joy 0.7 1.7 2.2 56.2 2.1 18.3 18.8
sadness 2.3 4.9 8.4 10.0 51.0 6.5 16.9surprise 1.2 3.8 6.9 39.8 4.5 24.3 19.5E: dominant evoked emotion; S: searching keyword
Prob. (E | S) in %
E \S anger disgust fear joy sadness surpriseanger 36.4 23.8 21.7 2.3 11.2 4.6
disgust 10.8 56.7 15.5 2.6 8.6 5.8fear 25.6 15.7 36.4 2.6 11.8 7.9joy 12.5 4.6 7.0 39.3 7.3 29.3
sadness 14.4 12.0 15.7 2.4 50.6 4.9surprise 16.2 8.0 13.0 23.8 8.2 30.8neutral 17.3 17.2 17.5 16.4 14.4 17.2
Prob. (S | E) in %
Emotion6 images placed in VA plane according to the ground truth of evoked VAscores. The boundary of each image is colored according to its dominant evokedemotion using the color codes at the bottom.


![[chenlab.ece.cornell.edu] - Advanced Multimedia …chenlab.ece.cornell.edu/Publication/Wende/Thesis_Draft...Carnegie Mellon University A Probabilistic Framework for Geometry and Motion](https://img.pdfslide.net/doc/110x75/5b88e92b7f8b9a851a8c59e2/-advanced-multimedia-mellon-university-a-probabilistic-framework-for-geometry.jpg)


![OUTPERFORM [V] INITIATION](https://img.pdfslide.net/doc/110x75/6189e5c61eda5f71d25deb98/outperform-v-initiation.jpg)

