Embed Size (px)
Citation preview

SOCIAL STRUCTURING OF A CENTRAL APPALACHIAN
DEER HERD AND A TEST OF LOCALIZED MANAGEMENT
by
BRADLEY FORREST MILLER
(Under the Direction of Karl V. Miller)
ABSTRACT
Localized management has been proposed as a means of using white-tailed deer
(Odocoileus virginianus) social behaviors in management. The process involves the ―surgical‖
removal of a social group(s) of deer to create an area of low deer density for ≥5 years. However,
this technique has only been tested in a highly philopatric, low-density, and un-hunted deer herd
in New York. I conducted an experimental localized removal in a high-density deer population
in the central Appalachians of West Virginia from 7 January to 27 February 2002. A total of 51
deer was removed within a 1.1 km2 area, encompassing 2 forest regeneration sites. Herbivory
data were collected during the summers of 2001–2004 from forest regeneration sites. Herbivory
rates declined annually in both the removal and control areas, likely due to increased timber
harvesting on the larger study site, suggesting that increasing forage availability may be a viable
alternative management technique for mitigating impacts of overabundant deer populations. To
evaluate spatial genetic structure, I performed a spatial autocorrelation analyses based on pair-
wise Moran’s I values among 229 individual adult (≥1.5 yrs.) females. Results revealed that
genetic relatedness was related inversely to the distances between core areas determined by
telemetry data or trapping location. Additionally, 28 social groups delineated by visual
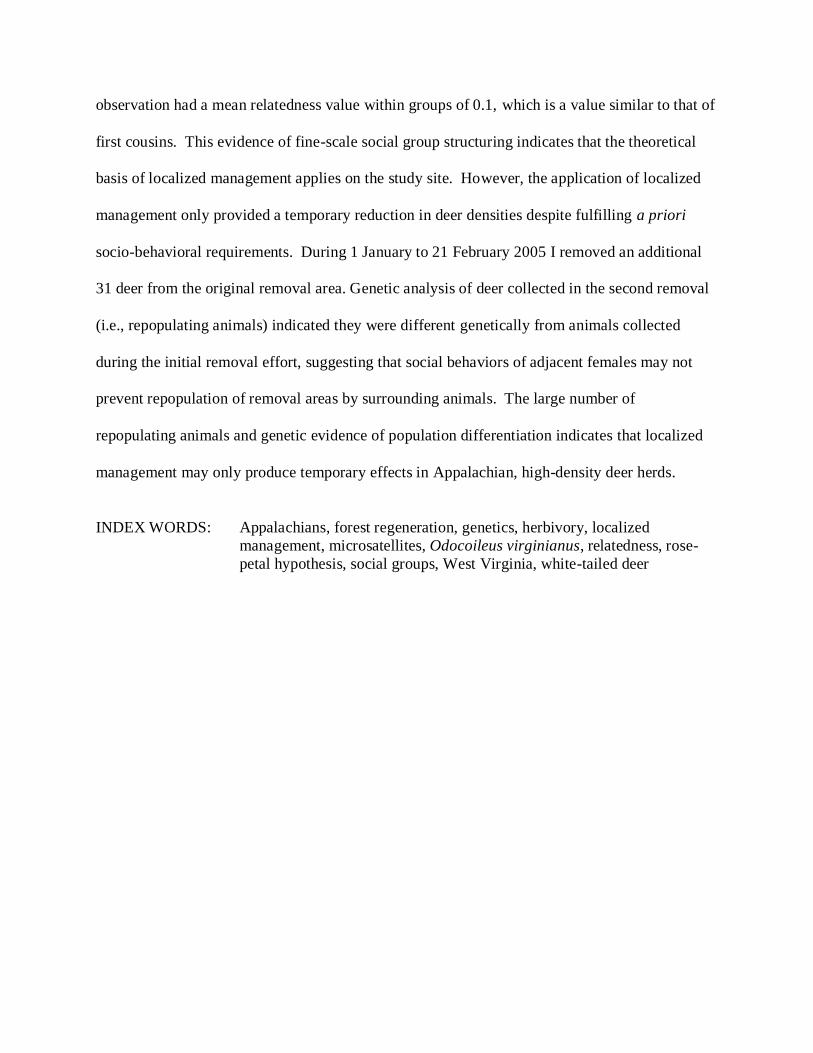
observation had a mean relatedness value within groups of 0.1, which is a value similar to that of
first cousins. This evidence of fine-scale social group structuring indicates that the theoretical
basis of localized management applies on the study site. However, the application of localized
management only provided a temporary reduction in deer densities despite fulfilling a priori
socio-behavioral requirements. During 1 January to 21 February 2005 I removed an additional
31 deer from the original removal area. Genetic analysis of deer collected in the second removal
(i.e., repopulating animals) indicated they were different genetically from animals collected
during the initial removal effort, suggesting that social behaviors of adjacent females may not
prevent repopulation of removal areas by surrounding animals. The large number of
repopulating animals and genetic evidence of population differentiation indicates that localized
management may only produce temporary effects in Appalachian, high-density deer herds.
INDEX WORDS: Appalachians, forest regeneration, genetics, herbivory, localized
management, microsatellites, Odocoileus virginianus, relatedness, rose-
petal hypothesis, social groups, West Virginia, white-tailed deer
SOCIAL STRUCTURING OF A CENTRAL APPALACHIAN DEER HERD
AND A TEST OF LOCALIZED MANAGEMENT
by
BRADLEY FORREST MILLER
B.S., The University of Tennessee, 1999
M.S., The University of Tennessee, 2002
A Dissertation Submitted to the Graduate Faculty of The University of Georgia in Partial
Fulfillment of the Requirements for the Degree
DOCTOR OF PHILOSOPHY
ATHENS, GEORGIA
2008

© 2008
Bradley Forrest Miller
All Rights Reserved

SOCIAL STRUCTURING OF A CENTRAL APPALACHIAN DEER HERD
AND A TEST OF LOCALIZED MANAGEMENT
by
BRADLEY FORREST MILLER
Major Professor: Karl V. Miller
Committee: John P. Carroll
W. Mark Ford
C. Joseph Nairn
Robert J. Warren
Electronic Version Approved:
Maureen Grasso
Dean of the Graduate School
The University of Georgia
May 2008
iv
ACKNOWLEDGEMENTS
The USDA, National Research Initiative Competitive Grants Program (grants 00-35101-
9284 and 03-35101-13719) provided funding for this study. Additionally, MeadWestvaco, The
University of Georgia Daniel B. Warnell School of Forestry and Natural Resources, and the
USDA Forest Service provided additional funding.
The wisdom and insight provided by my major professor, Dr. Karl V. Miller, is
responsible for the success of this research project. I am indebted to Dr. W. Mark Ford for his
extensive expertise and support throughout this study. The West Virginia Department of Natural
Resources personnel and particularly Dr. James L. Crum provided invaluable field and logistical
support. The assistance throughout the project of Dr. Patrick D. Keyser formerly of
MeadWestvaco Corporation is greatly appreciated. Dr. Randy W. DeYoung provided technical
and laboratory assistance with the genetic aspects of this research and demonstrated the
tremendous benefits of collaboration. The efforts of David A. Osborn made conducting research
a long distance from the University possible. The reviews and comments provided by Dr. John
P. Carroll, Dr. C. Joseph Nairn, and Dr. Robert J. Warren substantially improved the manuscripts
within the dissertation.
Dr. Tyler A. Campbell and Dr. Benjamin R. Laseter provided an excellent research
foundation to build upon and without their guidance and example, successfully concluding this
project would not have been possible. Finally, I gratefully acknowledge the 40-50 technicians
who worked long hours in adverse conditions to ensure the success of this research.

v
TABLE OF CONTENTS
Page
ACKNOWLEDGEMENTS ................................................................................................................ iv
LIST OF TABLES.............................................................................................................................viii
LIST OF FIGURES ............................................................................................................................. ix
CHAPTER
1 INTRODUCTION AND LITERATURE REVIEW ....................................................... 1
Introduction ................................................................................................................... 1
Literature Review .......................................................................................................... 2
Objectives and Guide to the Dissertation .................................................................. 10
Literature Cited............................................................................................................ 11
2 DEER HERBIVORY AND TIMBER HARVESTING RATES:
IMPLICATIONS FOR REGENERATION SUCCESS ................................................ 19
Abstract ........................................................................................................................ 20
Introduction ................................................................................................................. 21
Study area .................................................................................................................... 22
Methods ....................................................................................................................... 24
Results and discussion ................................................................................................ 27
Conclusions ................................................................................................................. 33
Acknowledgements ..................................................................................................... 34
References.................................................................................................................... 34

vi
3 MICROGEOGRAPHIC GENETIC AND SOCIAL
STRUCTURING OF A CENTRAL APPALACHIAN DEER HERD ........................ 47
Abstract ........................................................................................................................ 48
Introduction ................................................................................................................. 48
Materials and Methods ................................................................................................ 51
Results .......................................................................................................................... 56
Discussion .................................................................................................................... 58
Acknowledgements ..................................................................................................... 62
Literature Cited............................................................................................................ 62
4 A TEST OF LOCALIZED MANAGEMENT FOR REDUCING
WHITE-TAILED DEER HERBIVORY IN CENTRAL
APPALACHIAN REGENERATION SITES ................................................................ 73
Abstract ........................................................................................................................ 74
Introduction ................................................................................................................. 75
Study Area ................................................................................................................... 77
Methods ....................................................................................................................... 79
Results .......................................................................................................................... 84
Discussion .................................................................................................................... 88
Management Implications .......................................................................................... 92
Acknowledgements ..................................................................................................... 92
Literature Cited............................................................................................................ 93

vii
5 POPULATION DIFFERENTIATION OF WHITE-TAILED DEER
FOLLOWING AN APPLICATION OF LOCALIZED MANAGEMENT ............... 108
Abstract ...................................................................................................................... 109
Introduction ............................................................................................................... 109
Study Area ................................................................................................................. 111
Methods ..................................................................................................................... 112
Results ........................................................................................................................ 114
Discussion .................................................................................................................. 115
Management Implications ........................................................................................ 118
Acknowledgements ................................................................................................... 119
Literature Cited.......................................................................................................... 119
6 CONCLUSIONS ............................................................................................................ 125
Literature Cited.......................................................................................................... 126

viii
LIST OF TABLES
Page
Table 2.1 ……………………………………………...…………………………………………43
Table 3.1…………………………………………………............................................................69
Table 5.1………………………………………………………………………………………..124

ix
LIST OF FIGURES
Page
Figure 2.1 ……………………………………………………………………………………………………...….42
Figure 2.2………………………………………………………………………………………...44
Figure 2.3………………………………………………………………………………………...45
Figure 2.4………………………………………………………………………………………...46
Figure 3.1………………………………………………………………………………………...70
Figure 3.2……………………………………………………………………………………...…71
Figure 3.3………………………………………………………………………………………...72
Figure 4.1……………………………………………………………………………………….100
Figure 4.2……………………………………………………………………………………….101
Figure 4.3 ………………………………………………………………………………………102
Figure 4.4……………………………………………………………………………………….103
Figure 4.5 ………………………………………………………………………………………104
Figure 4.6……………………………………………………………………………………….105
Figure 4.7 ………………………………………………………………………………………106
Figure 4.8…………………………………………………………………………………….....107

1
CHAPTER 1
INTRODUCTION AND LITERATURE REVIEW
Introduction
The recovery of white-tailed deer (Odocoileus virginianus) populations in the eastern
United States from near extinction is one of the most significant success stories in wildlife
conservation. However, abundant habitat and the absence of large predators in much of the
today’s deer range have resulted in elevated deer populations above historic levels in many areas.
Because locallyoverabundant deer populations can negatively affect ecological processes and
increase deer-human conflicts, resource managers must be able to effectively control deer
populations.
Although regulated hunting controls deer populations in many areas, numerous examples
of locally or regionally overabundant deer populations indicate that traditional management
strategies are not always effective. Additionally, hunting is typically not an acceptable
management option in some areas such as public parks or urban areas. As a result, biologists and
forest managers must explore novel approaches for reducing negative ecological impacts of
overabundant deer populations occurring at scales disparate from administrative application
(e.g., county-level).
Recently an alterative management approach utilizing deer social behavior has been
offered as a possible solution to locally overabundant deer populations. Although the single
application of this technique was reportedly successful, its universal applicability in other areas

2
has not been established. This study is an evaluation of this nontraditional management strategy
at a study area in the central Appalachians, which was representative of many overabundant deer
populations in the eastern United States.
Literature Review
Effects of deer overabundance
Overabundant deer populations can create highly conspicuous problems such as deer-
vehicle collisions, depredation of agricultural crops, and damage to ornamental plantings
(Conover 1997). The monetary estimates of these negative impacts were estimated by Conover
(1997) at greater than $2 billion. Although some effects of overabundant deer populations are
obvious, Waller and Alverson (1997) reported that changes to ecosystem processes may develop
slowly and be subtle in appearance. Alteration of ecosystem processes certainly has biological
costs and consequences; however monetary estimates are unknown.
White-tailed deer are considered a ―keystone herbivore‖ because of their numerous direct
and indirect effects on other species (Rooney 2001). Excessive herbivory is the primary
mechanism responsible, although the effects of rubbing trees, trampling, defecation, and
urination also can be severe (Danell et al. 2003). Augustine and Frelich (1998) noted that
overabundant deer populations limited the reproduction and population structure of Trillium
plants. The authors additionally speculated that local extirpation of preferred forbs was possible
thereby reducing overall biodiversity. The future abundance of preferred species may also be
reduced even after reduction of deer densities (Webster et al. 2005). Morphological changes of
understory forbs have also been reported with increasing herbivory rates (Anderson 1994).
Structural changes to forest understories from white-tailed deer herbivory can impact
numerous animal species. A 9 year study in northern Virginia by McShea and Rappole (2000)

3
comparing songbird abundance and vegetation composition between fenced and unfenced sites
determined that high deer densities can reduce populations of ground and intermediate canopy
bird species by reducing the density and diversity of understory vegetation. Using simulated
deer densities ranging from 3.7–24.9 deer/km2, deCalesta (1994) noted that intermediate canopy-
nesting songbird species richness and abundance declined 27% and 37% respectively, between
the lowest and highest deer densities. Additionally, small mammal communities can be altered
by white-tailed deer herbivory (Brooks and Healy 1988).
Numerous studies conducted on the Allegheny Plateau in Pennsylvania documented the
problems of excessive herbivory in regenerating forests. Marquis (1974) observed that
regeneration failures occurred in 25–40% of the areas examined due to deer herbivory.
Additionally, even where regeneration was successful in Allegheny hardwoods, species
composition and rotation lengths were affected (Marquis 1981). Preferential browsing by white-
tailed deer in Allegheny hardwoods can increase the proportion of black cherry (Prunus
serotina) and striped maple (Acer pensylvanicum) regeneration, and reduce abundance of sugar
maple (Acer saccharum), red maple (Acer rubrum), white ash (Fraxinus americana), and birch
(Betula spp.) (Tilghman 1989).
Less palatable or preferred herbaceous vegetation that competes with woody regeneration
may increase in regeneration areas in the presence of moderate to heavy herbivory rates. In a
statewide survey of forest regeneration in Pennsylvania, McWilliams et al. (1995) found levels
of fern and grass able to retard tree-seedling development at 54% of sample sites. A correlation
between deer density and percent fern cover has been reported (Tilghman 1989). Additionally,
Trumbull et al. (1989) noted in a comparison of fenced and unfenced 13 year old regeneration

4
areas on the Allegheny Plateau in Pennsylvania, that grass and sedge cover was higher in
unfenced areas.
Although the number of published investigations of herbivory impacts on central
Appalachian forests is limited, areas with elevated deer densities would likely be impacted
similarly to areas on the Allegheny Plateau in Pennsylvania. An examination of an industrial
forest in the central Appalachians by Campbell et al. (2006) indicated that without management
activities to reduce herbivory, many parts of the region would face regeneration problems. The
estimated deer density on the study site was 12–20 deer/km2 (Langdon 2001), which exceeds the
≤7 deer/km2 level recommended for northern hardwoods by Tilghman (1989). Successful
woody regeneration has been reported in southern Appalachian areas with deer densities of 6–8
deer/km2 (Ford et al. 1993). A study by Collins and Carson (2002) on the same site as Campbell
et al. (2006) indicated that herbivory by deer changed the succession process and masked any
beneficial effects of fire or light availability for establishment of northern red oak seedlings
(Quercus rubra).
White-tailed deer social structure
White-tailed deer social groups are typically composed of either female groups composed
of adult does and their offspring, or male groups composed of adult and yearling males
(Marchinton and Hirth 1984). Male and female social groups do not usually associate during the
non-breeding season (McCullough et al. 1989). However large mixed-sex groups are common
during winter after the breeding season (Lingle 2003), although such associations are temporary
because groups do not travel and bed together as a single unit (Hawkins and Klimstra 1970).
Membership within groups is more fluid for bucks than does (Demarais et al. 2000).
Additionally, buck social groups do not persist during the breeding season; instead males isolate
5
themselves from other males during this period (Hawkins and Klimstra 1970). Interactions
between males and female social groups are common during the breeding season as males
investigate females approaching estrus (Marchinton and Hirth 1984).
Female social group membership is stable with the exception of the fawning season
(Hawkins and Klimstra 1970). During the fawning season females isolate themselves
approximately 2 weeks prior to and 4 weeks after parturition (Ozoga et al. 1982). During this
period, female offspring from the previous summer (now yearlings) do not associate with their
dams and may attempt to temporarily join male social groups (Marchinton and Hirth 1984).
However Hawkins and Klimstra (1970) noted that 90% of yearling females without fawns of
their own rejoined their mothers by early fall.
Social status within groups is a simple dominance hierarchy determined by age, size, and
sex (Townsend and Bailey 1981). Within female social groups, dominance status is typically a
function of age (Hirth 1977). Although male social dominance is influenced by age, research
with captive deer indicates that dominance ranks are not always stable throughout the breeding
season (DeYoung et al. 2006). Additionally, the oldest male in a group may not be the most
dominant individual (Miller et al. 1987). Social dominance not only increases access to potential
mates, it may increase the chance of survival during periods of food scarcity (Robinson 1962).
Dispersal from natal areas has been reported for both male and female white-tailed deer
although dispersal rates are much higher in males (Miller and Marchinton 1995). The
hypotheses for male dispersal have been speculated as either maternal aggression (Holzenbein
and Marchinton 1992) or sexual competition (Shaw et al. 2006). Male dispersal rates may
exceed 70% (Rosenberry et al. 2001, Campbell et al. 2005, Long et al. 2005), whereas female

6
dispersal rates are low (2–20%; Hawkins and Klimstra 1970, Nelson 1993), however high female
dispersal rates (>40%) have been reported in fragmented agricultural areas (Nixon et al. 1991).
Spatial genetic structure of white-tailed deer
Several studies have investigated macrogeographic spatial genetic structuring of white-
tailed deer. Evaluations of the effects of restocking efforts on genetic variability across deer
populations in western Tennessee (Kollars et al. 2004) and Mississippi (DeYoung et al. 2003)
concluded that past restocking efforts contributed to spatial genetic variation. An examination
by Purdue et al. (2000) of 6 deer populations from the Coastal Plain in Georgia and South
Carolina found significant differentiation among populations based on maternally inherited
mitochondrial DNA. Based on 4,749 individuals typed at a single allozyme marker with 3
alleles, Scribner et al. (1997) found evidence for spatial genetic structuring for a deer population
in the Upper Coastal Plain of South Carolina. However the diameters of the ―spatial clusters‖
were several kilometers. Few studies have examined microgeographic spatial genetic structure
(<1 km) in white-tailed deer.
White-tailed deer may be expected to have minimal microgeographic spatial genetic
structure because of their potential for long-distance dispersal (Scribner et al. 1997, Purdue et al.
2000). Dispersal of juvenile males is common (Rosenberry et al. 2001, Campbell et al. 2005),
and dispersal distances range from a few kilometers in heavily forested areas to dozens of
kilometers in open habitats (Long et al. 2005). Additionally, elevated rates of female dispersal
have been reported in some populations (Nixon et al. 1991). Yet despite these confounding
factors to gene flow restriction, evidence of microgeographic spatial genetic structure exists in
some white-tailed deer populations.
7
Using radio-telemetry data from summer and winter ranges, Mathews and Porter (1993)
identified putative female social groups in an unhunted, low density deer population in the
Adirondack Mountains of New York. They reported that based on allozyme characteristics,
genetic structure was present within social groups. The underlying mechanism responsible was
assumed to be female philopatry that allowed formation of matriarchal social groups. However,
they found no evidence for an association between genetic relatedness and spatial distance
among social groups on summer ranges, only on separate winter ranges. They reported that the
overlap of social groups on breeding ranges masked the expected negative relationship between
genetic relatedness and spatial distance.
In contrast, Comer et al. (2005) found only limited evidence for microgeographic spatial
genetic structuring for the same study site as Scribner et al. in South Carolina (1997). A history
of intensive harvests reduced the age structure among does and may have elevated the dispersal
rate of young female deer on their study site. They concluded that microgeographic social
structuring may not exist in exploited deer populations where the formation of persistent
cohesive social groups is limited.
Alternative management: Localized Management
A wide variety of alternative management techniques for controlling deer populations
have been tested, however results have been mixed. Translocation often is proposed as a viable
non-lethal technique for reducing urban deer populations. However an evaluation of the efficacy
of translocation conducted by Beringer et al. (2002) found that annual survival rates of
translocated animals were 0.30, compared to 0.69 for radio-collared resident deer in the release
area. Additionally, costs averaged $387 per translocated deer for that study, and translocation
was considered more costly than alternative methods. Fertility control also has been suggested

8
as a non-lethal technique for reducing deer populations. However fertility control may be
unsuitable for application on large areas (Rudolph et al. 2000), and can require a substantial
amount of time before reductions in population densities occur (Merrill et al. 2006).
Applications of lethal measures such as sharpshooting may be viewed unfavorably by the public
(Messmer et al. 1997); however, sharpshooting has been shown to be safe and effective (Doerr et
al. 2001).
Localized management is an alternative management technique that proposes removing a
social group(s) to create a persistent (10–15 years) small-scale area (<2 km2) of reduced deer
density (Porter et al. 1991). Application sites for localized management would include areas
where traditional population control (i.e., sport hunting) is ineffective or inappropriate.
Specifically, parks and suburban areas appear to be well-suited for localized management (Porter
et al. 1991, Kilpatrick et al. 2001, Porter et al. 2004). Forest regeneration sites located in remote
areas where access to the hunting public is difficult or problematic also may benefit from an
application of localized management prior to timber harvesting to ensure successful regeneration
(Campbell et al. 2004).
The localized management concept is based on a 30-year series of studies conducted on a
population of white-tailed deer in the Adirondack Mountains of New York. An examination of
seasonal movements and home ranges of 105 radio-collared and 266 individually marked deer
identified 9 social groups and determined that range fidelity and group membership was
unchanged across years (Tierson et al. 1985). It was assumed that social groups were composed
of related females and male offspring of pre-dispersal age. Additionally, Tierson et al. (1985)
noted that female offspring formed home ranges adjacent to and usually overlapping the female
parent.
9
Based on the sociobiological characteristics of the deer population in the New York site,
Mathews (1989) determined that female social groups are structured as a series of overlapping
home ranges. Older females produce philopatric female offspring whose home ranges partially
overlap the home range of the central matriarch while radiating outward. The theoretical shape
of these ranges is similar to the petals of a rose, and has been termed the ―rose-petal hypothesis‖.
Thus population expansion occurs slowly as new females are added to the periphery of existing
social group home ranges.
Utilizing the social behaviors suggested by the rose-petal hypothesis, localized
management proposes that when a social group is removed, the site fidelity of adjacent social
groups should prevent rapid recolonization. This theory of population expansion contrasts the
―gas diffusion‖ model where no social structure is present, and deer move from high-density
areas to low density areas (Porter et al. 1991). The persistence of created voids is determined by
female fawn production, juvenile female dispersal rates, the probability a dispersal occupies the
void, and the site fidelity of adjacent social groups.
McNulty et al. (1997) conducted an experimental test of the localized management
technique on the New York study site by. A total of 14 females was removed from a targeted
social group containing 17 deer. They created a 1.4 km2 low-density area (retrospectively
calculated), and no adjacent female deer (n=9) recolonized the area during 2 years of monitoring.
A subsequent examination of the removal area by Oyer and Porter (2004) reported continued
reduced deer densities for a period of 5 years.
Miller (1997) cautioned that the behavioral plasticity of white-tailed deer may limit the
universal applicability of behavior based management techniques. The central requirement of
localized management is the philopatry of juvenile females (McNulty et al. 1997). High rates of
10
female dispersal (>40%) have been reported in fragmented agricultural areas of the Midwest
(Nixon et al. 1991). Additionally, Comer et al. (2005) speculated that areas with heavy annual
harvests and young age structure among does also may have higher dispersal rates. Therefore,
population management recommendations based on the demographics of one population may not
be applicable in all areas.
Objectives and Guide to the Dissertation
My research is the culmination of research investigating white-tailed deer and forest
ecology on the MeadWestvaco Wildlife and Ecosystem Research Forest in Randolph County,
West Virginia. This research was initiated by Drs. Tyler A. Campbell and Benjamin R. Laseter
who investigated the movement ecology (Campbell 2003), and spatial and genetic structure of
the deer population (Laseter 2004). Building on the foundation of their research initiated in
1999, the objectives of my dissertation are to examine the effects of deer herbivory on forest
regeneration, explore alternative techniques to mitigate deer herbivory, and improve the
understanding of white-tailed deer spatial, genetic, and sociobiological characteristics.
My dissertation is organized as a series of manuscript-style chapters addressing the
objectives of this study. Chapter 1 is a review of literature relevant to the various aspects of this
study. It covers the impacts of deer overabundance, the current understanding of white-tailed
deer social structure, the relationship between spatial location and genetic structure in deer
populations, and an alternate management strategy for controlling overabundant deer
populations. Chapter 2 is a report on the impacts of deer herbivory on regenerating forests in the
central Appalachians, and an assessment of the relationship between silvicultural practices and
herbivory rates. Chapter 3 is an investigation of the relationship between spatial location and
genetic relatedness of individual adult female deer. Additionally it evaluates the relatedness of
11
members among adult females within social groups delineated by visual observations, and
examines their spatial location and relatedness among social groups. Chapter 4 presents the
results of the application of localized management and its effectiveness for prevention of forest
regeneration failures. Chapter 5 is a comparison of the genetic relatedness of deer removed
during the application of localized management with animals collected 3 years later from the
same removal area (i.e., repopulating animals). Chapter 6 is a summary of the findings for all of
the manuscript chapters. Manuscripts based on chapters 2–5 will be submitted to Forest Ecology
and Management (chapter 2), the Journal of Mammalogy (chapter 3), and the Journal of Wildlife
Management (chapters 4 and 5).
Literature Cited
Anderson, R. C. 1994. Height of white-flowered trillium (Trillium grandiflorum) as an index of
deer browsing intensity. Ecological Applications 4: 104–109.
Augustine, D. J., and L. E. Frelich. 1998. Effects of white-tailed deer on populations of an
understory forb in fragmented deciduous forests. Conservation Biology 12: 995-1004.
Beringer, J., L. P. Hansen, J. A. Demand, J. Sartwell, M. Wallendorf, and R. Mange. 2002.
Efficacy of translocation to control urban deer in Missouri: costs, efficiency, and
outcome. Wildlife Society Bulletin 30: 767-774.
Brooks, R. T., and W. M. Healy. 1988. Response to small mammal communities to silvicultural
treatments in eastern hardwood forests of West Virginia and Massachusetts. Pages 313–
318 in R. C. Szaro, K. E. Severson, and D. R. Patton, editors. Management of
amphibians, reptiles, and small mammals in North America. U. S. Department of
Agriculture, Forest Service, General Technical Report RM-166.
12
Campbell, T. A. 2003. Movement ecology of white-tailed deer in the central Appalachians of
West Virginia. Dissertation, University of Georgia, Athens, USA.
Campbell, T. A., B. R. Laseter, W. M. Ford, and K. V. Miller. 2004. Feasibility of localized
management to control white-tailed deer in forest regeneration areas. Wildlife Society
Bulletin 32: 1124-1131.
Campbell, T. A., B. R. Laseter, W. M. Ford, and K. V. Miller. 2005. Population characteristics
of a central Appalachian white-tailed deer herd. Wildlife Society Bulletin 33:212-221.
Campbell, T. C., B. R. Laseter, W. M. Ford, R. H. Odom, and K. V. Miller. 2006. Abiotic
factors influencing deer browsing in West Virginia. Northern Journal of Applied
Forestry 23: 20–26.
Collins, R. J., and W. P. Carson. 2002. The fire and oak hypothesis: incorporating the effects
of deer browsing and canopy gaps. Pages 44-63 in J. W. Van Sanbeek, J. O. Dawson, F.
Ponder, E. F. Loewenstein, and J. S. Fralish, editors. Proceedings of the 13th Central
Hardwood Forestry Conference. U. S. Department of Agriculture, Forest Service,
General Technical Report NC-234.
Comer, C. E., J. C. Kilgo, G. J. D’Angelo, T. G. Glenn, and K. V. Miller. 2005. Fine-scale
genetic structure and social organization in female white-tailed deer. Journal of Wildlife
Management 69: 332-344.
Conover, M. R. 1997. Monetary and intangible valuation of deer in the United States. Wildlife
Society Bulletin 25: 298-305.
Danell, K., R. Bergstrom, L. Edenius, and G. Ericsson. 2003. Ungulates as drivers of tree
population dynamics at module and genet levels. Forest Ecology and Management 181:
67–76.
13
deCalesta, D.S. 1994. Effect of white-tailed deer on songbirds within managed forests in
Pennsylvania. Journal of Wildlife Management 58: 711–718.
Demarais, S. K., K. V. Miller, and H. A. Jacobson. 2000. White-tailed deer. Pages 601–628 in
S. Demarais, and P. R. Krausman, editors. Ecology and Management of Large Mammals
in North America. Prentice-Hall, Upper Saddle River, New Jersey, USA.
DeYoung, R. W., S. Demarais, R. L. Honeycutt, A. P. Rooney, R. A. Gonzales, and K. L. Gee.
2003. Genetic consequences of white-tailed deer (Odocoileus virginianus) restoration in
Mississippi. Molecular Ecology 12: 3237–3252.
DeYoung, R. W., S. Demarais, R. L. Honeycutt, K. L. Gee, and R. A. Gonzales. 2006. Social
dominance and male breeding success in captive white-tailed deer. Wildlife Society
Bulletin 34: 131–136.
Doerr, M. L., J. B. McAnich, and E. P. Wiggers. 2001. Comparison of 4 methods to reduce
white-tailed deer abundance in an urban community. Wildlife Society Bulletin 29: 1105–
1113.
Ford, W. M., A. S. Johnson, P. E. Hale, and J. M. Wentworth. 1993. Availability and use of
spring and summer woody browse by deer in clearcut and uncut forests of the southern
Appalachians. Southern Journal of Applied Forestry 17: 116-119.
Hawkins, R. E., and W. D. Klimstra. 1970. A preliminary study of the social organization of
white-tailed deer. Journal of Wildlife Management 34:407-419.
Hirth, D. H. 1977. Social behavior of white-tailed deer in relation to habitat. Wildlife
Monographs 53:1-55.
Holzenbein, S., and R. L. Marchinton. 1992. Spatial integration of maturing male white- tailed
deer into the adult population. Journal of Mammalogy 73: 326–334.
14
Kilpatrick, H. J., S. M. Spohr, and K. K. Lima. 2001. Effects of population reduction on home
ranges of female white-tailed deer at high densities. Canadian Journal of Zoology 79:
949-954.
Kollars, P. G., M. L. Beck, S. G. Mech, P. K. Kennedy, and M. L. Kennedy. 2004. Temporal
and spatial genetic variability in white-tailed deer (Odocoileus virginianus). Genetica
121: 269–276.
Langdon, C. A. 2001. A comparison of white-tailed deer population estimation methods in
West Virginia. Thesis, West Virginia University, Morgantown, West Virginia, USA.
Laseter, B. R. 2004. Sociospatial characteristics and genetic structure of white-tailed deer in the
central Appalachians of West Virginia. Dissertation, University of Georgia, Athens,
USA.
Lingle, S. 2003. Group composition and cohesion in sympatric white-tailed deer and mule deer.
Canadian Journal of Zoology 81: 1119–1130.
Long, E. S., D. D. Diefenbach, C. S. Rosenberry, B. D. Wallingford, and M. D. Grund. 2005.
Forest cover influences dispersal distance of white-tailed deer. Journal of Mammalogy
86: 623–629.
Marchinton, R. L., and D. H. Hirth. 1984. Behavior. Pages 129–168 in L. K. Halls, editor.
White-tailed deer ecology and management. Stackpole Books, Harrisburg, Pennsylvania,
USA.
Marquis, D. A. 1974. The impact of deer browsing on Allegheny hardwood regeneration. U.S.
Department of Agriculture, Forest Service, General Technical Report NE-308.
15
Marquis, D. A. 1981. The effect of deer browsing on timber production in Allegheny hardwood
forests of northwestern Pennsylvania. U.S. Department of Agriculture, Forest Service,
General Technical Report NE-475.
Mathews, N. E. 1989. Social structure, genetic structure, and anti-predator behavior of white-
tailed deer in the Central Adirondacks. Dissertation, State University of New York,
Syracuse, New York, USA.
Mathews, N. E., and W. F. Porter. 1993. Effect of social structure on genetic structure of free-
ranging white-tailed deer in the Adirondack Mountains. Journal of Mammalogy 74: 33-
43.
McCullough, D. R., D. H. Hirth, and S. J. Newhouse. 1989. Resource partitioning between
sexes in white-tailed deer. Journal of Wildlife Management 53: 265–271.
McNulty, S. A., W. F. Porter, N. E. Mathews, and J. A. Hill. 1997. Localized management for
reducing white-tailed deer populations. Wildlife Society Bulletin 25: 265-271.
McShea, W. J., and J. H. Rappole. 2000. Managing the abundance and diversity of breeding
bird populations through manipulation of deer populations. Conservation Biology 14:
1161-1170.
McWilliams, W. H., S. L. Stout, T. W. Bowersox, and L. H. McCormick. 1995. Adequacy of
advance tree-seedling regeneration in Pennsylvania’s forests. Northern Journal of
Applied Forestry 12: 187-191.
Merrill, J. A., E. G. Cooch, and P. D. Curtis. 2006. Managing an overabundant deer population
by sterilization: effects of immigration, stochasticity, and the capture process. Journal of
Wildlife Management 70: 268-277.
16
Messmer, T. A., L. Cornicelli, D. J. Decker, and D. G. Hewitt. 1997. Stakeholder acceptance of
urban deer management techniques. Wildlife Society Bulletin 25: 360–366.
Miller, K. V., R. L. Marchinton, K. J. Forand, and K. L. Johansen. 1987. Dominance,
testosterone levels, and scraping activity in a captive herd of white-tailed deer. Journal of
Mammalogy 68: 812–817.
Miller, K. V., R. L. Marchinton, and J. J. Ozoga. 1995. Deer sociobiology. Pages 118–128 in
K. V. Miller and R. L. Marchinton, editors. Quality whitetails: the why and how of
quality deer management. Stackpole Books, Mechanicsburg, Pennsylvania, USA.
Miller, K. V. 1997. Considering social behavior in the management of overabundant white-
tailed deer populations. Wildlife Society Bulletin 25: 279-281.
Nelson, M. E. 1993. Natal dispersal and gene flow in white-tailed deer in northern Minnesota.
Journal of Mammalogy 74: 316–322.
Nixon, C. M., L. P. Hansen, P. A. Brewer, and J. E. Chelsvig. 1991. Ecology of white-tailed
deer in an intensively farmed region of Illinois. Wildlife Monographs 118: 1-77.
Oyer, A. M., and W. F. Porter. 2004. Localized management of white-tailed deer in the central
Adirondack Mountains, New York. Journal of Wildlife Management 68: 257-265.
Ozoga, J. J., L. J. Verme, and C. S. Bienz. 1982. Parturition behavior and territoriality in white-
tailed deer: impact on neonatal mortality. Journal of Wildlife Management 46: 1–10.
Porter, W. F., N. E. Mathews, H. B. Underwood, R. W. Sage, and D. F. Behrend. 1991. Social
organization in deer: implications for localized management. Environmental
Management 15: 809-814.
17
Porter, W. F., H. B. Underwood, and J. L. Woodard. 2004. Movement behavior, dispersal, and
the potential for localized management of deer in a suburban environment. Journal of
Wildlife Management 68: 247-256.
Purdue, J. R., M. H. Smith, and J. C. Patton. 2000. Female philopatry and extreme spatial
genetic heterogeneity in white-tailed deer. Journal of Mammalogy 81: 179–185.
Rooney, T. P. 2001. Deer impacts on forest ecosystems: a North American perspective.
Forestry 74: 201–208.
Rosenberry, C. S., M. C. Conner, and R. A. Lancia. 2001. Behavior and dispersal of white-
tailed deer during the breeding season. Canadian Journal of Zoology 79: 171–174.
Rudolph, B. A., W. F. Porter, and H. B. Underwood. 2000. Evaluating immunocontraception
for managing white-tailed deer in Irondequoit, New York. Journal of Wildlife
Management 64: 463–473.
Scribner, K. T., M. H. Smith, and R. K. Chesser. 1997. Spatial and temporal variability of
microgeographic genetic structure in white-tailed deer. Journal of Mammalogy 78:744-
755.
Shaw, J. C., R. A. Lancia, M. C. Conner, and C. S. Rosenberry. 2006. Effect of population
demographics and social pressures on white-tailed deer dispersal ecology. Journal of
Wildlife Management 70: 1293–1301.
Tierson, W. C., G. F. Mattfeld, R. W. Sage, Jr., and D. F. Behrend. 1985. Seasonal movements
and home ranges of white-tailed deer in the Adirondacks. Journal of Wildlife
Management 49: 760–769.
Tilghman, N. G. 1989. Impacts of white-tailed deer on forest regeneration in northwestern
Pennsylvania. Journal of Wildlife Management 53: 524-532.

18
Townsend, T. W., and E. D. Bailey. 1981. Effects of age, sex, and weight on social rank in
penned white-tailed deer. American Midland Naturalist 106: 92–101.
Trumbull, V. L., E. J. Zielinski, and E. C. Aharrah. 1989. The impact of deer browsing on the
Allegheny forest type. Northern Journal of Applied Forestry 6: 162–165.
Waller, D. M., and W. S. Alverson. 1997. The white-tailed deer: a keystone herbivore. Wildlife
Society Bulletin 25: 217-225.
Webster, C. R., M. A. Jenkins, and J. H. Rock. 2005. Long-term response of spring flora to
chronic herbivory and deer exclusion in Great Smoky Mountains National Park, USA.
Biological Conservation 125: 297–307.

19
CHAPTER 2
DEER HERBIVORY AND TIMBER HARVESTING RATES:
IMPLICATIONS FOR REGERATION SUCCESS1
1 Miller, B. F., T. A. Campbell, B. R. Laseter, W. M. Ford, and K. V. Miller. To be submitted to Forest Ecology
and Management.
20
Abstract
Herbivory by white-tailed deer (Odocoileus virginianus) can greatly affect forest
regeneration. Typical measures to ensure forest regeneration have included physical barriers or
direct manipulation of deer densities. However altering silvicultural practices to provide
abundant deer forage has not been tested thoroughly. We examined browse species preferences,
changes in herbivory rates, and species establishment in 1–6 year old regeneration areas from
2001–2004 on the MeadWestvaco Wildlife and Ecosystem Research Forest in Randolph County,
West Virginia. Our results indicate that woody vegetation grown in full sunlight reached the
maximum plot coverage by the fourth growing season and was unaffected by competing
herbaceous vegetation. However the establishment of less abundant woody species, such as
northern red oak (Quercus rubra), may be inhibited when browsed greater than or proportionally
to occurrence. Based on relative use, relative abundance, and browse preferences data, we
predict that future forests on our study area will be composed of American beech (Fagus
grandifolia), birch (Betula spp.), maples (Acer spp.), and yellow-poplar (Liriodendron
tulipifera). Herbivory rates declined precipitously as the amount of early successional habitat
increased on our study site. We conclude that providing approximately 14% of an area in well-
distributed, even-aged managed forests can have substantial impacts on reducing herbivory rates.
However, silvicultural practices should consider effects on hard mast production, habitat
requirements of other species, and hardwood lumber marketability.
Keywords: Allegheny hardwood-northern hardwood; browse preferences; herbivory; Odocoileus
virginianus; regeneration; timber harvesting; West Virginia; white-tailed deer
21
Introduction
The recovery of white-tailed deer (Odocoileus virginianus) populations in the eastern
United States from near extinction is one of the most significant success stories for wildlife
conservation (McCabe and McCabe, 1984). Although hunting is used to control deer
populations in most instances, coarsely managing populations at the county level or greater can
lead to overabundant deer populations in localized areas (McShea and Rappole, 2000; Waller
and Alverson, 1997). As a result, biologists and forest managers are challenged by the effects of
overabundant deer on ecological communities at scales disparate from administrative
application.
White-tailed deer primarily alter ecosystem processes by excessive herbivory, although
the effect of rubbing trees, trampling, defecation, and urination also can be severe (Danell et al.,
2003). Overabundant deer populations may reduce the current abundance and morphology of
herbaceous plant species (Augustine and Frelich, 1998; Anderson, 1994) and affect future
abundance of browse sensitive species even after reduction of deer densities (Webster et al.,
2005). Additionally, changes to forest understories from excessive herbivory can alter
abundance and diversity of songbird (McShea and Rappole, 2000; deCalesta, 1994) and small
mammal communities (Brooks and Healy, 1988).
The effects of excessive herbivory are especially problematic for regenerating forests
because long-term successional patterns may be altered (McWilliams et al., 1995; Trumbull et
al., 1989; Alverson et al., 1988; Horsley and Marquis, 1983; Marquis, 1981). These impacts can
include shifts in woody and herbaceous species composition, reduced stocking, extended rotation
lengths, and perhaps entire regeneration failures (Horsley et al., 2003; Tilghman, 1989; Marquis,
1974).
22
Measures to reduce herbivory by white-tailed deer to ensure regeneration success have
involved either manipulating deer densities (Behrend et al., 1970; McNulty et al., 1997),
installing deer-proof fencing (Brenneman, 1982), or providing abundant summer forage by
concentrating silvicultural activities to alleviate browsing pressure within intact forests and
regeneration areas (Stout and Lawrence, 1996; Stout et. al., 1996, 1993; Marquis et al., 1992;
Tilghman and Marquis, 1989). However the interspersion of timber harvests across an area, and
proportion of the area composed of timber harvests necessary to effectively reduce deer
herbivory have not been identified. To date, no scientific studies have empirically documented
the timber harvest regime necessary to mitigate excessive herbivory by white-tailed deer.
A preliminary analysis on our study site investigating the effects of spatial and physical
factors on herbivory pressure determined that forest regeneration and forest health were at risk
from excessive herbivory (Campbell et al., 2006). In this study, we investigated the impacts of
deer herbivory on regenerating forests in the central Appalachians. We also assessed the
relationship between timber harvests and herbivory rates toward developing forest management
guidelines to reduce the impacts of herbivory on regenerating and unharvested forests.
Study area
Our study was conducted on the MeadWestvaco Wildlife and Ecosystem Research Forest
(MWWERF) in southwestern Randolph County, West Virginia. The MWWERF was established
by Westvaco Corp. in 1994 to examine the impacts of modern industrial forestry on the
landscape and its ecological processes in a Central Appalachian environment (Keyser and Ford,
2005). The 3,413-ha MWWERF is located in the Unglaciated Allegheny Mountain and Plateau
physiographic province (38°42’N and 80°3’W). Landscape features consist of broad, plateau -
like ridgetops with steep sides and narrow valleys with small, high-gradient streams. Elevations

23
range from 700 to 1,200 m. The climate is moist and cool with mean annual precipitation in
excess of 155 cm (Strausbaugh and Core, 1977). Soils of the MWWERF are acidic, well-drained
Inceptisols (Schuler et al., 2002).
Forests on the MWWERF are naturally regenerated, second-growth stands established in
the early 1900’s following extensive area-wide railroad logging (Clarkston, 1993) or younger
stands resulting from harvests of those second-growth forests over the past 20 years. Currently
the forests are managed primarily by even-aged harvesting with an 80-100 year rotation length
(Adams, 2005). Harvest areas are well distributed throughout the MWWERF with an average
size of 15 ha. Timber harvests implemented in the early 1990’s failed to regenerate successfully
because of excessive herbivory.
The most common forest type is Allegheny hardwood-northern hardwood forests
composed of American beech (Fagus grandifolia), yellow birch (Betula alleghaniensis), sugar
maple (Acer saccharum), red maple (A. rubrum), black cherry (Prunus serotina), and Fraser
magnolia (Magnolia fraseri). Cove hardwoods and mixed-mesophytic forests composed of
yellow-poplar (Liriodendron tulipifera), basswood (Tilia americana), sweet birch (Betula lenta),
and northern red oak (Quercus rubra) are common at elevations less than 850 m. Elevations
over 1,000 m and sheltered riparian areas contain significant amounts of eastern hemlock (Tsuga
canadensis) and red spruce (Picea rubens). A shrub layer and understory groundcover is absent
in many areas with the exception of rhododendron (Rhododendron maximum) thickets in higher
upland areas and riparian areas, and thick mats of hay-scented fern (Dennstaedtia punctilobula)
in areas where the canopy is interrupted.
Intensive research of the deer population on the MWWERF began in 1999 (Campbell,
2003). Population densities on the MWWERF were estimated as 12-20 deer/km2 at the
24
beginning of our study (Langdon, 2001). Based upon visual observations recorded throughout
the study, deer densities remained constant (B. Miller, unpublished data). The hunting public
was allowed access to the MWWERF, however access to the area by vehicle was restricted.
Bucks on the MWWERF experience high annual mortality from hunting, whereas females
average approximately 85-90% annual survival (Campbell et al., 2005). Abomasal parasite
counts indicated that the deer population was at or near nutritional carrying capacity (Fisher,
1996).
Methods
Study design
Beginning in 2001, we collected vegetation and browse data from 8, 1-3 year old
regeneration sites ranging from 8 to 19 ha in size (Campbell et al., 2006). All regeneration sites
were then resampled in 2002 and 2003. In 2004, 4 of the 8 regeneration sites were omitted from
additional sampling as most woody browse exceeded herbivory height. During the study period
we collected a total of 28 observation-years from regeneration sites ranging in age from 1-6
years old.
Within each regeneration site, we established 90 1-m2 permanent sampling plots. Thirty
plots were distributed systematically along the edge of skidder trails at intervals of
approximately 120 m. We installed 30 additional plots matched to the plots along skidder trails,
but located 5 m into the regeneration area perpendicular to the skidder trail. Additionally, we
established 30 plots in the adjacent unharvested mature forests ≥ 50 m from the edges of
regeneration sites, and distributed systematically in transects parallel to regeneration sites. The
mean distance between mature forest plots was 19 m.
25
We sampled all plots between 15 July and 15August of each study year. Within each
year we sampled plots within ±7 days of their original sampling date in 2001 to prevent temporal
bias resulting from potential changes in vegetation structure, species composition, or herbivory
rates.
Plot coverage estimates
We recorded ocular estimates of plot coverage by ferns, forbs, grasses, woody vegetation,
and non-vegetation (e.g., rocks, woody debris, litter, and bare ground) within each 1 m2 plot
(Higgins et al., 1994). We obtained coverage estimates from 1.5 m above each plot, tota lling
100%. Mean and standard error plot coverage for each category were calculated for each
growing season. Percentages were transformed by log10(x) and tested for normality using the
Shapiro-Wilk test statistic (SAS Institute, 2002). We performed one-way analysis of variance
tests (ANOVA) on each coverage category to test for differences (P<0.05) among years (SAS
Institute, 2002). If significant differences were detected, we used Tukey’s honestly significant
difference tests for multiple comparisons.
Herbivory data collection and analysis
Following Ford et al. (1993), we recorded the total number of browsable units (i.e., twig
tips) available of semi-woody (e.g., Rubus spp.) and woody plants ≤1.5 m from the ground. The
species of each browsable unit was recorded, and each unit was assigned to a browsed or
unbrowsed category. All browsing was assumed to be caused by white-tailed deer because no
herbivory by other vertebrates was identified. Only species averaging more than 4,000
browsable units/ha (>4 units/10 m2) were included in our analyses.
We calculated percent of available twigs browsed (PATB), relative abundance (RA), and
relative use (RU) for each species as follows: PATB = (number of units browsed for a species /
26
total number of units available for a species) * 100; RA = number of units available for a species
/ number of units available for all species) * 100; RU = number of units browsed for a species /
number of units browsed for all species) * 100 (Strole and Anderson, 1992).
To assess preferences of deer for individual plant species, we summed the number of
browsable units and the number browsed for each species across all plots within each
regeneration area and sampling year. We performed a Z-test to determine whether the use of a
species was greater than, proportional to, or used less than its proportion of the total number of
browsable units available. This Z-test was performed on each species in each regeneration area
to determine species preference across a range of sites and stand ages.
Scale and distribution of regeneration areas
We analyzed timber harvest records and stand locations for the MWWERF using
MeadWestvaco’s Forest Research Information System geographical databases. To determine the
proportion of the study area <10 years of age, we summed the number of hectares harvested in
the previous 10 years for each year and then divided by the total property area. To evaluate the
impacts of forest management on browsing rates, we calculated a total browsing rate for each
year for unharvested and regeneration areas. Total browsing rates (±SE) were calculated by
averaging the mean browsing rates of all stands examined in a sampling year
We used Arcview GIS 3.3 (Environmental Systems Research Institute, 1999) to evaluate
the spatial distribution of regeneration sites on the MWWERF. We created a series of buffers
around regeneration sites <10 years of age (in 2004) with 100m distance intervals. The number
of hectares within each distance interval was calculated in Arcview using the Xtools extension
and divided by the total property area to determine what proportion of the study site was
composed of each distance interval.
27
Results and discussion
Plot coverage estimates
Characteristics of regeneration sites changed across a successional gradient (Fig. 2.1).
Coverage estimates of the non-vegetation category (e.g., rocks, woody debris, litter, and bare
ground) differed significantly among stand ages (F5,22 = 83.7, P < 0.001). The non-vegetation
category declined from 79% plot coverage during the first growing season to 41% plot coverage
in the second growing season. Plot coverage estimates of the non-vegetation category did not
differ among the third through the sixth growing seasons.
Plot coverage estimates of woody vegetation differed among stand ages (F5,22 = 13.7, P <
0.001), and increased with stand age. Plot coverage of the woody vegetation category was
lowest in the first growing season (15%). Coverage of woody vegetation in the second and third
growing season was 48% and 67% respectively, but did not differ statistically. The coverage
estimates of both seasons were greater than estimates of woody vegetation in the first growing
season. Woody vegetation coverage was greatest in the fourth growing season in which >74% of
the plot was composed of woody vegetation. After the fourth growing season, some woody
vegetation exceeded the 1.5 m sampling height, therefore subsequent plot coverage estimates of
woody vegetation declined. As a result, plot coverage estimates of woody vegetation for the
fifth and sixth growing season were less than the fourth growing season estimates, and did not
differ from estimates of the second and third growing seasons.
Forb coverage was <1% in five of six growing seasons. The greatest coverage occurred
during the second growing season (2.5%), however no differences (F5,22 = 1.80, P = 0.15) were
detected among growing seasons. American pokeberry (Phytolacca americana) was the most
commonly observed forb species. Pokeberry is a ruderal plant found on disturbed sites such as

28
timber harvests or burned areas, and is commonly consumed by white-tailed deer (Johnson et al.,
1995).
No differences were detected for the grass category among growing seasons (F5,22 = 0.48,
P = 0.79). Percent cover of grasses can be positively related to deer density, and the presence of
grasses can compete with seedlings and reduce regeneration success (Horsley et al., 2003).
However, mean plot coverage by grass was <4% for the six growing seasons examined and it
had little impact on current regeneration success.
Fern coverage primarily consisted of hay-scented fern, with a small proportion (<10%) of
Christmas fern (Polystichum acrostichoides). We detected no differences for the fern category
among growing seasons (F5,22 = 1.33, P = 0.29). Although not statistically significant, mean plot
coverage estimates were highest for the fern category in the fifth and sixth growing seasons. The
increases in the fifth and sixth growing seasons likely are due to the reduction of plot coverage
by woody vegetation as woody species increased in height.
Woody and semi-woody species established rapidly on the regeneration areas despite the
presence of competing herbaceous vegetation. Unless timber harvests provide large amount of
available light, such as clearcuts, seedling growth may not be adequate to outpace the growth of
competing vegetation (e.g., grasses and ferns) (McWilliams et al. 1995). Additionally,
Fredrickson et al. (1998) reported a positive relationship between available light and the
recruitment of seedlings. Our results are consistent with the positive relationship between light
and vegetation performance, however it should be emphasized that some locations with
extremely high deer densities or small acreage timber harvests may not adequately regenerate
even in the presence of abundant light.
29
Species composition
We recorded browsable units from a total of 38 woody, and 4 semi-woody plant species.
However, 12 species (Table 2.1) constituted 85% of the available browsable units (238,571 of
280,764) recorded in our study. Nine of the 12 most common species were overstory
components prior to timber harvesting. Three early successional invaders including fire cherry
(Prunus pensylvanica), striped maple (Acer pensylvanicum), and blackberry (Rubus spp.) also
were common in regeneration areas.
Relative abundance values ranged from 0 to 48.9 across species and growing seasons
(Table 2.1). The relative abundance of blackberry was highest across all growing seasons.
Black cherry, fire cherry, red maple, and birch (primarily B. lenta) were the most common
woody species during the first growing season. However, black cherry and fire cherry
abundance decreased over time, whereas birch abundance increased. American beech was the
ninth most abundant species during the first growing season, but increased to the third most
abundant species by the sixth growing season. Northern red oak and witch-hazel (Hamamelis
virginiana) were limited in abundance throughout the six growing seasons.
Browse preferences
The browse preferences we observed were in general agreement with those reported for
other Allegheny and northern hardwood forests. The browsing rates for American beech, red
maple, birch, sugar maple, black cherry, yellow-poplar, and striped maple were proportionally
less than their occurrence in the population on the MWWERF for over 50% of the examined site-
years (Fig. 2.2). American beech, black cherry, and striped maple are commonly considered non-
preferred species that often increase in abundance or relative to other woody species in areas in
response to high deer densities (Horsley et al., 2003; Tilghman, 1989). Previously reported

30
browse preferences and responses to herbivory pressure are more variable for maples, birch, and
yellow-poplar. Discrepancies of species use between our study and those previously reported
may be attributed to effects of methodologies (Fredericksen et al., 1998), differences in species
composition among sites (Gill, 1992), or non-linear responses to herbivory (Rooney and Waller,
2003).
The low browsing rates and increase in abundance of American beech and birch across
the growing seasons suggests that at least in the short-term, these species will be a substantial
component of the forest overstory. In addition, red maple and yellow-poplar may become
canopy species based on their low proportional use and moderate abundance. Although striped
maple will not become a substantial component of any future overstory, its low RU may allow it
to persist in the under- and mid-story.
Fire cherry, witch-hazel, magnolia, and northern red oak were browsed in proportion to
occurrence in >50% of sites examined (Fig. 2.2). Previous research on this study area by McGill
et al. (2003) investigating the response of fire cherry to prescribed fire, partial canopy removal,
and white-tailed deer herbivory found that the development of unfenced seedlings was reduced
by deer herbivory. Our observed decline in RA over time supports their results and is likely
reflective of the high PATB in the first three growing seasons.
Northern red oak and witch-hazel had low RA values across the growing seasons (Table
2.1). Herbivory impacts may be particularly important to species with lower availability.
Because northern red oak is a commercially important species that is difficult to regenerate
(Gribko et al., 2002; Buckley et al., 1998; Lorimer, 1993), the effects of herbivory are
particularly important for this species. An investigation of the relationship between prescribed
fire, canopy gaps, and deer herbivory on this study site by Collins and Carson (2002) indicated
31
that herbivory by deer changed the succession process and masked any benefits of fire or
increased light availability for establishment of northern red oak seedlings. The low RA value
for northern red oak we observed across all growing seasons raises questions regarding its future
as an important canopy species on the MWWERF.
Blackberry was browsed proportionally greater than its occurrence in >92% of sites
examined (Fig. 2.2). Additionally blackberry had higher average PATB and RU values than all
other species for all growing seasons (Table 2.1). The high preference by deer and availability of
blackberry may enable it to act as a buffer species to reduce pressure on valuable hardwood
species. Moser et al. (2006) reported that Rubus spp. protected tree saplings from heavy
browsing by roe deer (Capreolus capreolus) by providing an attractive forage that reduced
dependence on other species and reduced accessibility to other species. However, the presence
of blackberry in regeneration sites is limited to the first few growing seasons (Harlow and
Downing, 1970), and extensive levels of blackberry in the understory have been implicated in
reducing seedling development in some hardwood stands (Bashant et al., 2005).
Timber harvests and browsing rates
Two past timber harvests implemented in 1993 and 1994 on the MWWERF failed to
adequately regenerate as a result of excessive herbivory (P. Keyser, MeadWestvaco, personal
communication). This occurred because o other even-aged timber management existed within a
4,000 ha matrix of forest at that time, therefore <0.5% of the property was in early successional
habitat. Although no past estimates of deer densities are available, anecdotal accounts suggest
moderate to high deer densities similar to densities observed by Langdon (2001).
The proportion of the study area composed of harvested areas <10 years old increased
from approximately 8% to 14% during the duration of the study (Fig. 2.3). Overall timber

32
harvest rates were approximately 2% per year during the course of this study, however
harvesting rates of smaller (400–700 ha) regions within the property varied between 1–5% per
year. Overall mean browsing rates for sample plots in regeneration sites and in unharvested
areas declined precipitously as the amount of early successional habitat increased (Fig. 2.3).
Deer use of regeneration areas declines when regeneration becomes too dense, and/or
when forage exceeds the reach of deer (Blymyer and Mosby, 1977). However our average stand
age (±SE) for the final sampling year (2004) was only 5.0 ± 0.6 years of age. Additionally, the
decreased browsing rates were observed in adjacent mature forest sites where palatability and
vegetation density likely remained constant.
Instead, the increased proportion of early successional habitat may have greatly increased
the ecological carrying capacity on the study area. In fact, increased harvesting intensity of
forests has been suggested as a means to reduce overall browsing pressure and ensure
regeneration success throughout the central and southern Appalachians (Kalen, 2005; Ford et al.,
1993; Marquis et al., 1992; Tilghman and Marquis, 1989). Stout et al. (1993) reported that a
combination of a 14% complete overstory removal, and a 33% partial cutting was effective for
ensuring stand establishment on a 445- ha forested site in the Allegheny hardwood region of
northern Pennsylvania. Our results confirm these suggestions but also demonstrate that the
addition of partial cuts may not be necessary in all situations. According to our study, when
approximately 14% of the area on our study site was composed of stand ages <10 years old, the
browsing rates dropped to <5% for both regeneration areas and mature forests.
The distribution of regeneration areas also is an important determinant of browsing
pressure. If harvests are concentrated in a specific area, herbivory rates in distant areas may not
be affected. Marquis et al. (1992) suggested that the extent of timber harvesting within a 1,609-

33
m radius of a proposed harvest site will determine the impacts of deer herbivory. Augustine and
Jordan (1998) found that the intensity of herbivory in forests was inversely related to the
availability of agricultural fields within a 1,500-m radius.
By the final year of our study (2004), regeneration sites were well distributed across the
MWWERF (Fig. 2.4). Based on our analysis, 86.5% of the area was within 500 m of a
regeneration site. Previous investigations of summer home ranges of white-tailed deer on our
study site by Campbell et al. (2004) determined that home range size of male and female deer
were 101.2 and 81.5 ha, respectively. Assuming a circular home range, the respective radius for
a male and female summer home range is 567 and 509 m. Therefore, despite only 14% of the
MWWERF area comprised of harvested stands, abundant summer food resources were available
to the majority of deer on our study site because of the spatial distribution of harvests.
Conclusions
Our results based on monitoring of the first six growing seasons indicated that natural
regeneration grown in full sunlight was able to outgrow competing herbaceous vegetation. Our
species preference analysis was similar to published reports. However our approach considered
multiple temporal and spatial levels which incorporate differences in species composition and
palatability. Blackberry forage was consistently the most preferred and available species in
regeneration areas across all examined growing seasons. Its presence may act as a buffer to
other species and reduce use of other woody species (Moser et al., 2006). Based on changes in
relative abundance and relative use, we predict that future forests on the MWWERF will be
composed of American beech, birch, maples, and yellow-poplar.
Since fencing or manipulation of deer densities with regulated hunting is not possible for
some situations (Curtis et al., 1994; Warren, 1991), providing abundant browse by forest
34
management is a viable option for reducing herbivory. Our results suggest that providing
approximately 14% of an area in well-distributed, even-aged managed forests can have
substantial impacts on herbivory rates. However applications of timber harvests should be
implemented with consideration of hard mast retention, habitat requirements of other species,
and hardwood lumber marketability.
Additional research is necessary to investigate the effects of increased forest harvesting
on deer populations. Production of increased summer deer food resources may increase carrying
capacity and stimulate deer population growth potentially exacerbating deer herbivory (Kramer
et al., 2006; Ozoga and Verme, 1982). However, the removal of mature hardwoods reduces hard
mast production and the associated effects on deer populations are not fully known. Therefore,
applications of landscape level forest management must be coupled with sound deer management
strategies.
Acknowledgements
Financial assistance was provided by the West Virginia Department of Natural
Resources, MeadWestvaco, and the USDA National Research Initiative Cooperative Grants
program (grant 00-35101-9284 and 03-35101-13719). The comments of J. P. Carroll, C. J.
Nairn, and R .J. Warren, improved early versions of this manuscript. We additionally thank the
numerous volunteers, technicians, and others who contributed to this research.
References
Adams, J.P., 2005. Home range and behavior of the timber rattlesnake (Crotalus horridus). M.S.
Thesis. Marshall University, Huntington, West Virginia, p. 98.
Alverson, W.S., Waller, D.M., Solheim, S.L., 1988. Forests too deer: edge effects in northern
Wisconsin. Conserv. Biol. 2, 348–358.

35
Anderson, R.C., 1994. Height of white-flowered trillium (Trillium grandiflorum) as an index of
deer browsing intensity. Ecol. Appl. 4, 104–109.
Augustine, D.J., Frelich, L.E., 1998. Effects of white-tailed deer on populations of an understory
forb in fragmented deciduous forests. Cons. Biol. 12, 995-1004.
Augustine, D.J., Jordan, P.A., 1998. Predictors of white-tailed deer grazing intensity in
fragmented deciduous forests. J. Wildl. Manage. 62, 1076–1085.
Bashant, A.L., Nyland, R.D, Engelman, H.M., Bohn, K.K., Verostek, J.M., Donoso, P.J., Nissen
Jr., R.L., 2005. The role of interfering plants in regenerating hardwood stands in
Northeastern North America: An annotated bibliography for American beech (Fagus
grandifolia), striped maple (Acer pensylvanicum L.), hobblebush (Viburnum alnifolium
Marsh.), hayscented fern (Dennstaedtia punctilobula L.), New York fern (Thelypteris
noveborecensis L.), bracken fern (Pteridium aquilinum (L.) Kuhn), raspberries (Rubus
spp.), and pin cherry (Prunus pensylvanica L.f.). University of Maine, Maine
Agricultural and Forest Experiment Station, Misc. Pub. 753, 72pp.
Behrend, D.F., Mattfeld, G.F., Tierson, W.C., Wiley III, J.E., 1970. Deer density control for
comprehensive forest management. J. For. 68, 695–700.
Blymyer, M.J., Mosby, H.S., 1977. Deer utilization of clearcuts in southwestern Virginia. South.
J. Appl. For. August:10–13.
Brenneman, R., 1982. Electric fencing to prevent deer browsing on hardwood clearcuts. J. For.
80, 660–661.
Brooks, R.T., Healy, W.M., 1988. Response to small mammal communities to silvicultural
treatments in eastern hardwood forests of West Virginia and Massachusetts. In: Szaro,
36
R.C., Severson, K.E., Patton, D.R. (Eds.) Management of amphibians, reptiles, and small
mammals in North America, U.S. For. Serv. Gen. Tech. Rep. RM–166, pp. 313–318.
Buckley, D.S., Sharik, T.L., Isebrands, J.G., 1998. Regeneration of northern red oak: positive
and negative effects of competitor removal. Ecology 79, 65–78.
Campbell, T.C., 2003. Movement ecology of white-tailed deer in the central Appalachians of
West Virginia. Ph.D. Diss. University of Georgia, Athens, Georgia, p. 162.
Campbell, T.C., Laseter, B.R., Ford, W.M., Miller, K.V., 2004. Topographic home ranges of
white-tailed deer in the central Appalachians. Southeastern Naturalist 3, 645–652.
Campbell, T.C., Laseter, B.R., Ford, W.M., Miller, K.V., 2005. Population characteristics of a
central Appalachian white-tailed deer herd. Wildl. Soc. Bull. 33, 212–221.
Campbell, T.C., Laseter, B.R., Ford, W.M., Odom, R.H., Miller, K.V., 2006. Abiotic factors
influencing deer browsing in West Virginia. North. J. Appl. For. 23, 20–26.
Clarkston, R.B., 1993. Destruction of the upland forest by lumbering and fire. In: Stephenson,
S.L. (Ed.), Upland forest of West Virginia. McClain Printing Company, Parsons, WV,
pp. 35–46.
Collins, R.J., Carson, W.P., 2002. The fire and oak hypothesis: incorporating the effects of deer
browsing and canopy gaps. In: Van Sanbeek, J.W., Dawson, J.O., Ponder, F.,
Loewenstein, E.F., Fralish, J.S., (Eds.), Proc. 13th
Central Hardwood For. Conf. U.S. For.
Serv. Gen. Tech Rep NC-234, 44-63.
Curtis, P.D., Fargione, M.J., Richmond, M.E., 1994. Preventing deer damage with barrier,
electrical, and behavioral fencing systems. Proc. Sixteenth Vertebrate Pest Conf. 16, 223-
227.

37
Danell, K., Bergstrom, R., Edenius, L., Ericsson, G., 2003. Ungulates as drivers of tree
population dynamics at module and genet levels. For. Ecol. Manage. 181, 67–76.
deCalesta, D.S., 1994. Effect of white-tailed deer on songbirds within managed forests in
Pennsylvania. J. Wildl. Manage. 58, 711–718.
Environmental Systems Research Institute. 1999. ARCVIEW. Version 3.2. Environmental
Systems Research Institute, Redlands, California.
Fisher, J.R., 1996. White-tailed deer herd health check on the Westvaco Wildlife and Ecosystem
Research Forest. Final report to the West Virginia Division of Natural Resources.
Ford, W.M., Johnson, A.S., Hale, P.E., Wentworth, J.M., 1993. Availability and use of spring
and summer woody browse by deer in clearcut and uncut forests of the southern
Appalachians. South. J. Appl. For. 17, 116–119.
Fredrickson, T.S., Ross, B., Hoffman, W., Lester, M., Bayea, J., Morrison, M.L., Johnson, B.N.,
1998. Adequacy of natural hardwood regeneration on forestlands in northeastern
Pennsylvania. North. J. Appl. For. 15, 130–134.
Gill, R.M.A., 1992. A review of damage by mammals in north temperate forests. 1. Deer.
Forestry 65, 145–169.
Gribko, L.S., Schuler, T.M., Ford, W.M., 2002. Biotic and abiotic mechanisms in the
establishment of northern red oak seedlings: a review. U.S. For. Serv. Gen. Tech. Rep.
NE-295, Newton Square, PA. 18 pp.
Harlow, R.F., Downing, R.L., 1970. Deer browsing and hardwood regeneration in the southern
Appalachians. J. For. 68, 298–300.
Higgins, K.F., Oldemeyer, J.L., Jenkins, K.J., Clambley, G.K., Harlow, R.F., 1994. Vegetation
sampling and measurement. In: T.A. Bookhout (Ed.), Research and management
38
techniques for wildlife and habitats. Fifth ed. The Wildl. Soc., Bethesda, Maryland, pp.
567–591.
Horsley, S.B., Marquis, D.A., 1983. Interference by weeds and deer with Allegheny hardwood
reproduction. Can. J. For. Res. 13, 61–69.
Horsley, S.B., Stout, S.L., deCalesta, D.S., 2003. White-tailed deer impact on the vegetation
dynamics in northern hardwood forest. Ecol. Appl. 13, 98–118.
Johnson, A.S., Hale, P.E., Ford, W.M., Wentworth, J.M., French, J.R., Anderson, O.F., Pullen,
G.B., 1995. White-tailed deer foraging in relation to successional stage, overstory type
and management of southern Appalachian forests. Am. Midl. Nat. 133,18–35.
Kalen, C., 2005. Deer browsing and impact on forest development. J. Sustainable For. 21, 51–62.
Keyser, P.D., Ford, W.M., 2005. Ten years of research on the MeadWestvaco Wildlife and
Ecosystem Research Forest: an annotated bibliography. U.S. For. Serv. Gen. Tech. Rep
NE-330, p. 27.
Kramer, K., Groot Bruinderink, G.W.T.A., Prins, H.T.T., 2006. Spatial interactions between
ungulate herbivory and forest management. For. Ecol. Manage. 226, 238–247.
Langdon, C.A., 2001. A comparison of white-tailed deer population estimation methods in West
Virginia. M.S. Thesis. West Virginia University, Morgantown, WV, p. 119.
Lorimer, C.G., 1993. Causes of the oak regeneration problem. In: Loftis, D., McGee, C.E. (Eds.),
Oak regeneration: serious problems, practical recommendations. Symp. Proc. U.S. For.
Serv., Southeast. Forest Exp. Sta., Asheville, NC, pp. 14–39.
Marquis, D.A., 1974. The impact of deer browsing on Allegheny hardwood regeneration. U.S.
For. Serv., Res. Pa NE-308., Upper Darby, PA. 8 pp.

39
Marquis, D.A., 1981. Effect of deer browsing on timber production in Allegheny hardwood
forests of northern Pennsylvania. U.S. For. Serv., Res. Pa NE-475. Broomall, PA. 12 pp.
Marquis, D.A., Ernst, R.L., Stout, S.L., 1992. Prescribing silvicultural treatments in hardwood
stands of the Alleghenies (revised). U.S. For. Serv., Gen. Tech. Rep. NE-96, Broomall,
PA. 101 pp.
McCabe, R.E., McCabe, T.R., 1984. Of slings and arrows: an historical retrospection. In: Halls,
L.K. (Ed.), White-tailed Deer Ecology and Management. Stackpole Books, Harrisburg,
PA, pp. 19–72.
McGill, D.W., Collins, R.J., Carson, W.P., 2003. Response of pin cherry to fire, canopy
disturbance, and deer herbivory on the Westvaco Wildlife and Ecosystem Research
Forest. In: Van Sambeek, J.W., Dawson, J.O., Ponder Jr., F., Loewenstein, E.F., Fralish,
J.S., (Eds.), Proc. 13th
Central Hardwood For. Conf. U.S. For. Serv., Gen. Tech Rep NC-
234, 282–290.
McNulty, S.A., Porter, W.F., Mathews, N.E., Hill, J.A., 1997. Localized management for
reducing white-tailed deer populations. Wildl. Soc. Bull. 25, 265–271.
McShea, W.J., Rappole, J.H., 2000. Managing the abundance and diversity of breeding bird
populations through manipulation of deer populations. Cons. Bio. 14, 1161–1170.
McWilliams, W.H., Stout, S.L., Bowersox, T.W., McCormick, L.H., 1995. Adequacy of advance
tree-seedling regeneration in Pennsylvania’s Forests. North. J. Appl. For. 12, 187–191.
Moser, B., Schutz, M., Hindenlang, K.E., 2006. Importance of alternative food resources for
browsing by roe deer on deciduous trees: the role of food availability and species quality.
For. Ecol. Manage. 226, 248–255.

40
Ozoga, J.J., Verme, L.J., 1982. Physical and reproductive characteristics of a supplementally-fed
white-tailed deer herd. J. Wildl. Manage. 46, 281–301.
Rooney, T.P., Waller, D.M., 2003. Direct and indirect effects of white-tailed deer in forest
ecosystems. For. Ecol. Manage. 181, 165–176.
SAS Institute Inc., 2002. SAS/STAT User’s Guide, Version 9.1. SAS Institute Inc., Cary, NC.
Shuler, T.M., Ford, W.M., Collins, R.J., 2002. Successional dynamics and restoration of a
montane coniferous forest in the central Appalachians, USA. Nat. Areas J. 22, 88–98.
Stout, S.L., Redding, J.A., DeMarco, L., 1993. Technology transfer at the heart of a
research/management partnership. In: Foley, L.H. (Ed.), Silviculture: from the cradle of
forestry to ecosystem management. Proc. National Silviculture Workshop. U.S. For.
Serv., Gen. Tech. Rep SE-88, 188–193.
Stout, S.L., Lawrence, L., 1996. Deer in Allegheny Plateau forests: learning the lessons of scale.
Proc. 1995 Soc. Am. For. Conv., Bethesda, MD. pp. 92–98.
Stout, S.L., deCalesta, D.S., DeMarco, L., 1996. Can silviculture change deer impact? Proc. 1995
Soc. Am. For. Conv., Bethesda, MD. pp. 437–438.
Strausbaugh, P.D., Core, E.L., 1977. Flora of West Virginia. Seneca Books, Gainsville, WV,
1079p.
Strole, T.A., Anderson, R.C., 1992. White-tailed deer browsing: species preferences and
implications for central Illinois forests. Nat. Areas J. 12, 139-144.
Tilghman, N.G., 1989. Impacts of white-tailed deer on forest regeneration in northwestern
Pennslvania. J. Wildl. Manage. 53, 524–532.
41
Tilghman, N.G., Marquis, D.A., 1989. Deer damage in central hardwoods: a potential problem.
In : Clark, F.B. (Tech. Ed.), Hutchinson, J.G. (Ed.), Central hardwood notes. U.S. For.
Serv., North Central Forest Experiment Station, Note 8.01.
Trumbull, V. L., Zielinski, E.J., Aharrah, E.C., 1989. The impact of deer browsing on the
Allegheny forest type. North. J. Appl. For. 6, 162–165.
Waller, D.M., Alverson, W.S., 1997. The white-tailed deer: a keystone herbivore. Wildl. Soc.
Bull. 25, 217–225.
Warren, R.J., 1991. Ecological justification for controlling deer populations in eastern national
parks. In: Trans. 56th
N. A. Wildl. Nat. Res. Conf. pp. 56–66.
Webster, C.R., Jenkins, M.A., Rock, J.H., 2005. Long-term response of spring flora to chronic
herbivory and deer exclusion in Great Smoky Mountains National Park, USA. Biol.
Cons. 125, 297–307.
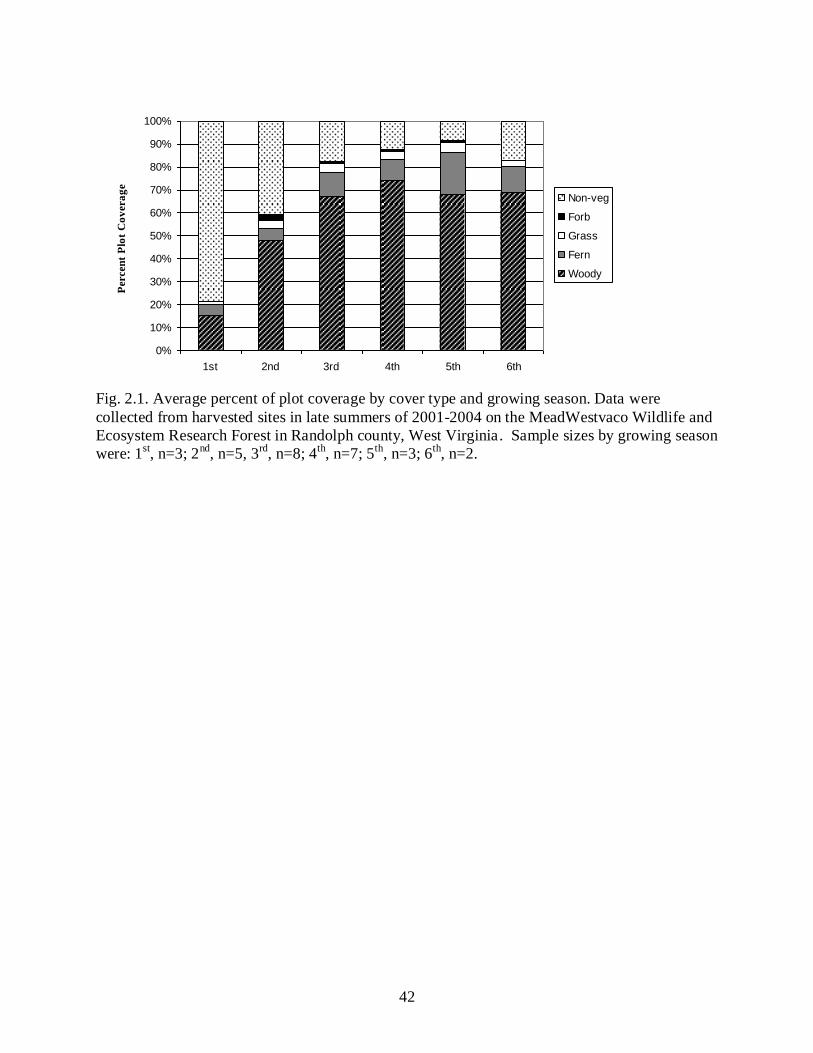
42
Fig. 2.1. Average percent of plot coverage by cover type and growing season. Data were
collected from harvested sites in late summers of 2001-2004 on the MeadWestvaco Wildlife and
Ecosystem Research Forest in Randolph county, West Virginia. Sample sizes by growing season
were: 1st, n=3; 2
nd, n=5, 3
rd, n=8; 4
th, n=7; 5
th, n=3; 6
th, n=2.
0%
10%
20%
30%
40%
50%
60%
70%
80%
90%
100%
1st 2nd 3rd 4th 5th 6th
Percen
t P
lot
Co
vera
ge
Non-veg
Forb
Grass
Fern
Woody
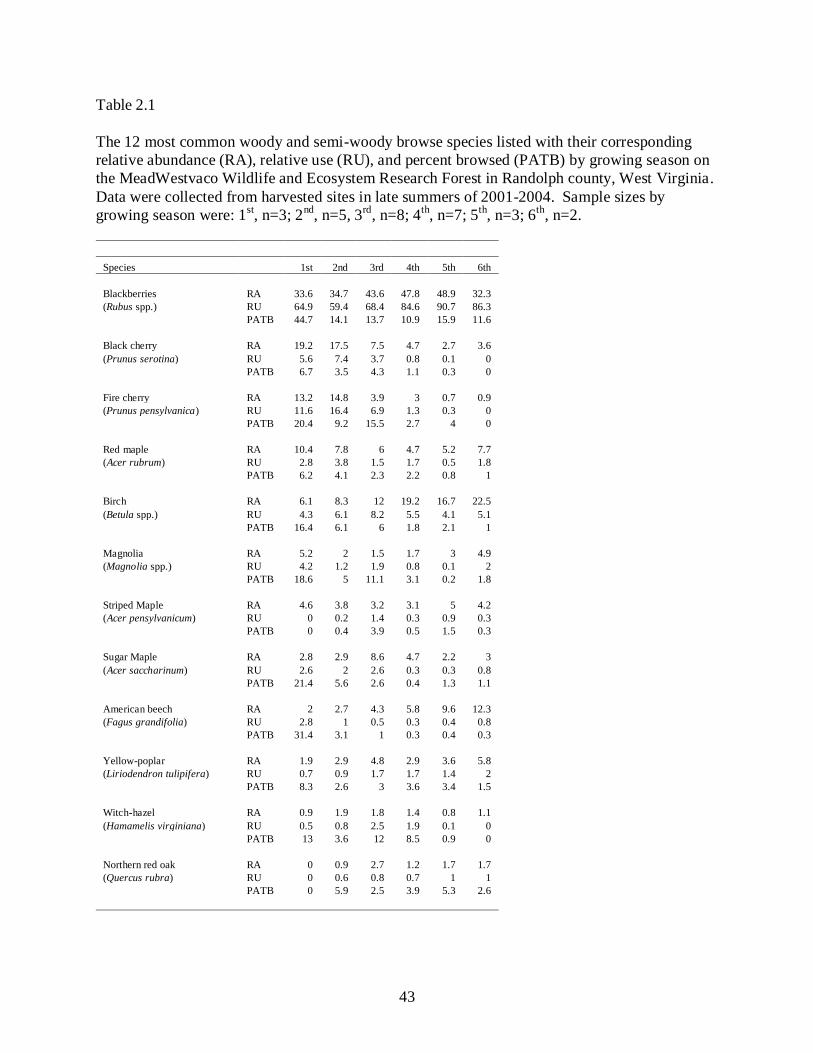
43
Table 2.1
The 12 most common woody and semi-woody browse species listed with their corresponding
relative abundance (RA), relative use (RU), and percent browsed (PATB) by growing season on
the MeadWestvaco Wildlife and Ecosystem Research Forest in Randolph county, West Virginia.
Data were collected from harvested sites in late summers of 2001-2004. Sample sizes by
growing season were: 1st, n=3; 2
nd, n=5, 3
rd, n=8; 4
th, n=7; 5
th, n=3; 6
th, n=2.
Species 1st 2nd 3rd 4th 5th 6th
Blackberries RA 33.6 34.7 43.6 47.8 48.9 32.3
(Rubus spp.) RU 64.9 59.4 68.4 84.6 90.7 86.3
PATB 44.7 14.1 13.7 10.9 15.9 11.6
Black cherry RA 19.2 17.5 7.5 4.7 2.7 3.6
(Prunus serotina) RU 5.6 7.4 3.7 0.8 0.1 0
PATB 6.7 3.5 4.3 1.1 0.3 0
Fire cherry RA 13.2 14.8 3.9 3 0.7 0.9
(Prunus pensylvanica) RU 11.6 16.4 6.9 1.3 0.3 0
PATB 20.4 9.2 15.5 2.7 4 0
Red maple RA 10.4 7.8 6 4.7 5.2 7.7
(Acer rubrum) RU 2.8 3.8 1.5 1.7 0.5 1.8
PATB 6.2 4.1 2.3 2.2 0.8 1
Birch RA 6.1 8.3 12 19.2 16.7 22.5
(Betula spp.) RU 4.3 6.1 8.2 5.5 4.1 5.1
PATB 16.4 6.1 6 1.8 2.1 1
Magnolia RA 5.2 2 1.5 1.7 3 4.9
(Magnolia spp.) RU 4.2 1.2 1.9 0.8 0.1 2
PATB 18.6 5 11.1 3.1 0.2 1.8
Striped Maple RA 4.6 3.8 3.2 3.1 5 4.2
(Acer pensylvanicum) RU 0 0.2 1.4 0.3 0.9 0.3
PATB 0 0.4 3.9 0.5 1.5 0.3
Sugar Maple RA 2.8 2.9 8.6 4.7 2.2 3
(Acer saccharinum) RU 2.6 2 2.6 0.3 0.3 0.8
PATB 21.4 5.6 2.6 0.4 1.3 1.1
American beech RA 2 2.7 4.3 5.8 9.6 12.3
(Fagus grandifolia) RU 2.8 1 0.5 0.3 0.4 0.8
PATB 31.4 3.1 1 0.3 0.4 0.3
Yellow-poplar RA 1.9 2.9 4.8 2.9 3.6 5.8
(Liriodendron tulipifera) RU 0.7 0.9 1.7 1.7 1.4 2
PATB 8.3 2.6 3 3.6 3.4 1.5
Witch-hazel RA 0.9 1.9 1.8 1.4 0.8 1.1
(Hamamelis virginiana) RU 0.5 0.8 2.5 1.9 0.1 0
PATB 13 3.6 12 8.5 0.9 0
Northern red oak RA 0 0.9 2.7 1.2 1.7 1.7
(Quercus rubra) RU 0 0.6 0.8 0.7 1 1
PATB 0 5.9 2.5 3.9 5.3 2.6
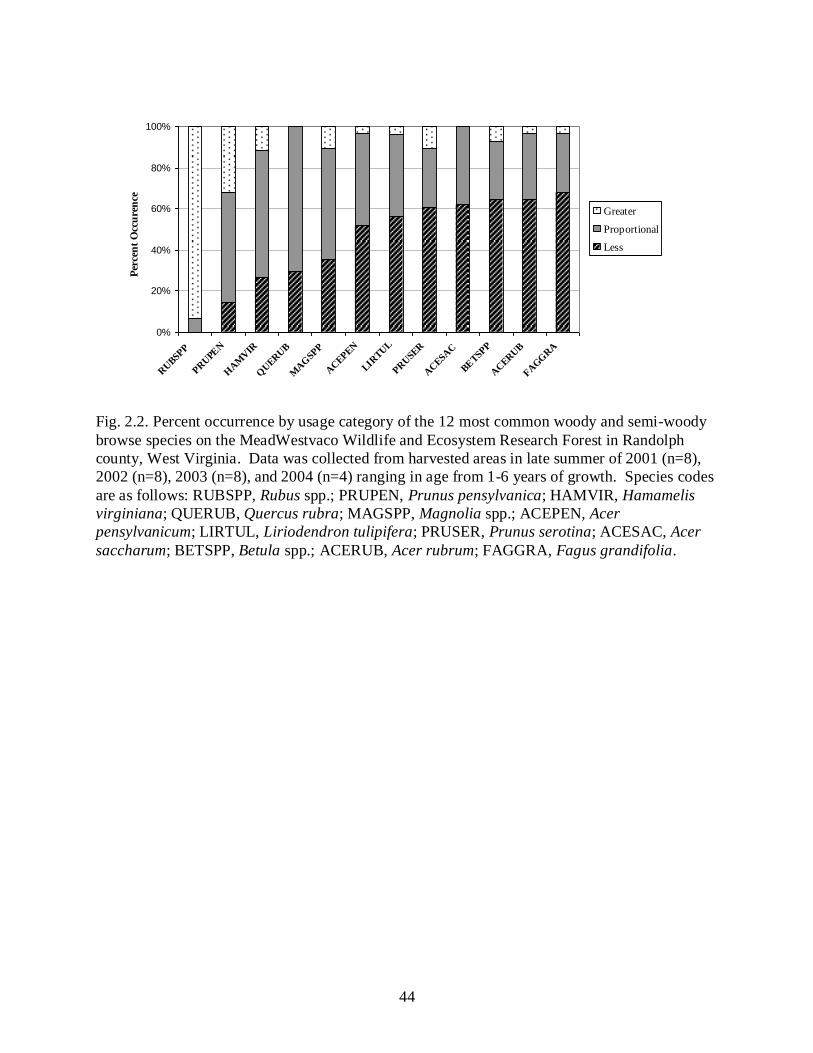
44
Fig. 2.2. Percent occurrence by usage category of the 12 most common woody and semi-woody
browse species on the MeadWestvaco Wildlife and Ecosystem Research Forest in Randolph
county, West Virginia. Data was collected from harvested areas in late summer of 2001 (n=8),
2002 (n=8), 2003 (n=8), and 2004 (n=4) ranging in age from 1-6 years of growth. Species codes
are as follows: RUBSPP, Rubus spp.; PRUPEN, Prunus pensylvanica; HAMVIR, Hamamelis
virginiana; QUERUB, Quercus rubra; MAGSPP, Magnolia spp.; ACEPEN, Acer
pensylvanicum; LIRTUL, Liriodendron tulipifera; PRUSER, Prunus serotina; ACESAC, Acer
saccharum; BETSPP, Betula spp.; ACERUB, Acer rubrum; FAGGRA, Fagus grandifolia.
0%
20%
40%
60%
80%
100%
RU
BSP
P
PR
UPE
N
HA
MV
IR
QU
ER
UB
MA
GSP
P
AC
EPEN
LIR
TU
L
PR
USE
R
AC
ESA
C
BE
TSP
P
AC
ER
UB
FA
GG
RA
Per
cen
t O
ccu
ren
ceg
Greater
Proportional
Less
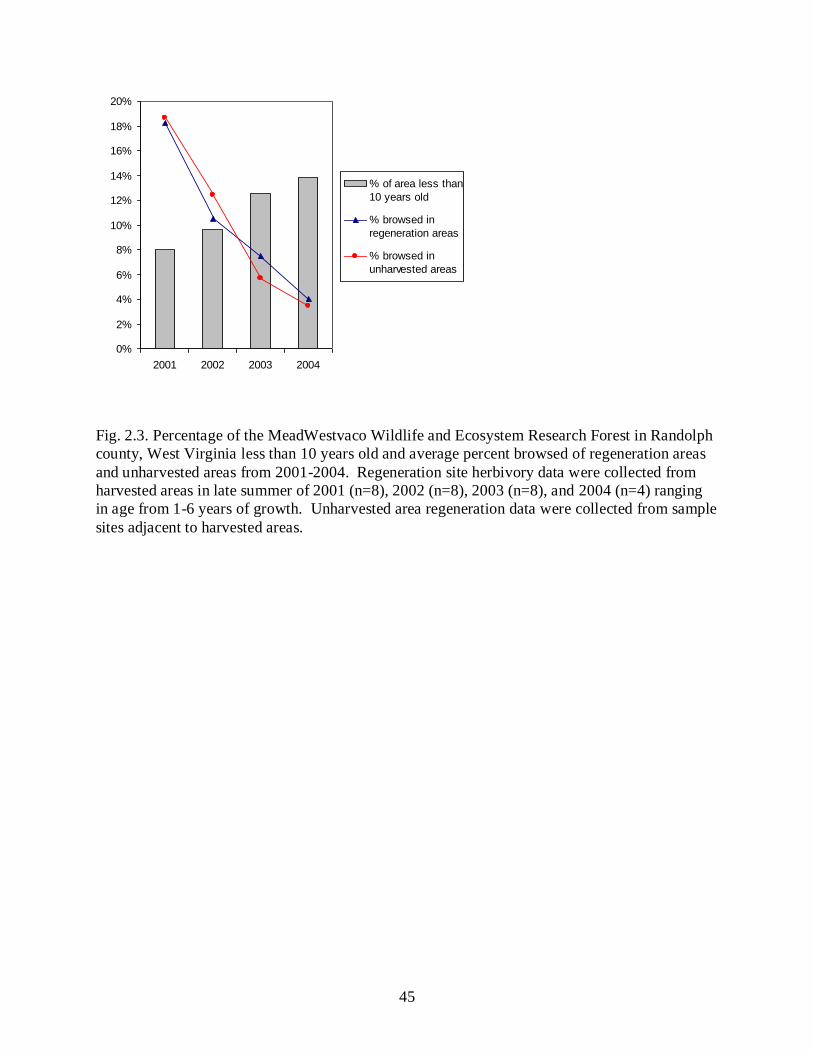
45
Fig. 2.3. Percentage of the MeadWestvaco Wildlife and Ecosystem Research Forest in Randolph
county, West Virginia less than 10 years old and average percent browsed of regeneration areas
and unharvested areas from 2001-2004. Regeneration site herbivory data were collected from
harvested areas in late summer of 2001 (n=8), 2002 (n=8), 2003 (n=8), and 2004 (n=4) ranging
in age from 1-6 years of growth. Unharvested area regeneration data were collected from sample
sites adjacent to harvested areas.
0%
2%
4%
6%
8%
10%
12%
14%
16%
18%
20%
2001 2002 2003 2004
% of area less than
10 years old
% browsed in
regeneration areas
% browsed in
unharvested areas
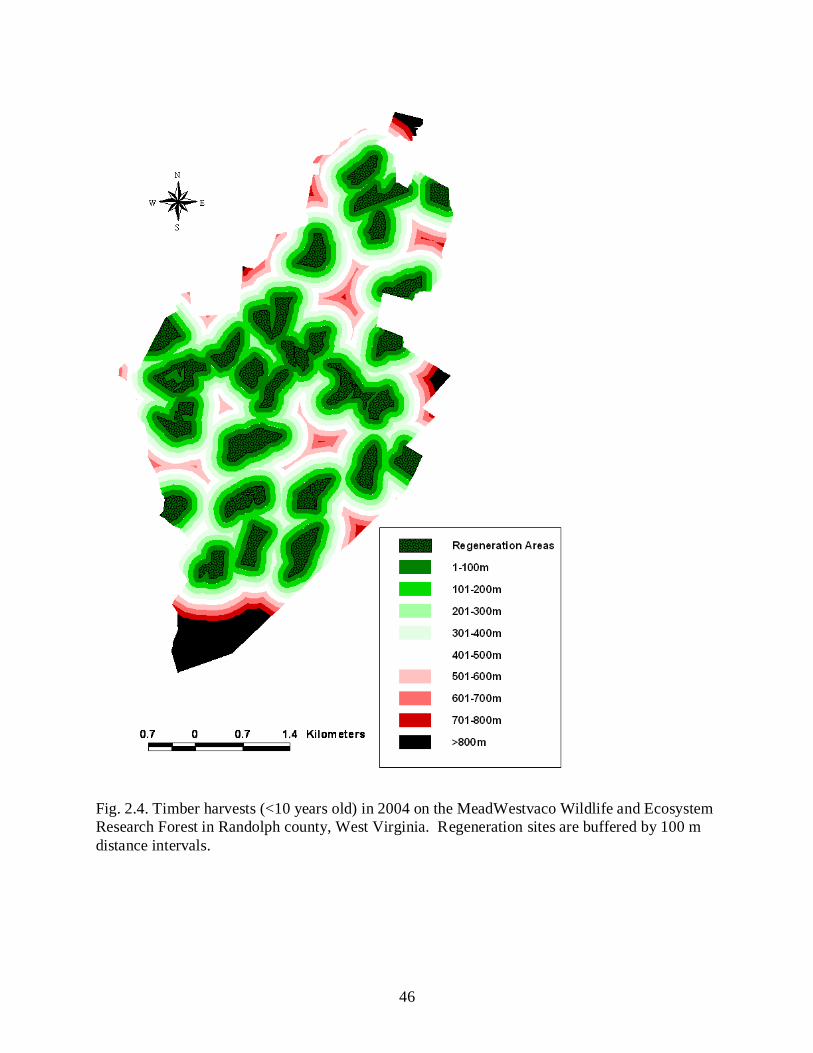
46
Fig. 2.4. Timber harvests (<10 years old) in 2004 on the MeadWestvaco Wildlife and Ecosystem
Research Forest in Randolph county, West Virginia. Regeneration sites are buffered by 100 m
distance intervals.

47
CHAPTER 3
MICROGEOGRAPHIC GENETIC AND SOCIAL
STRUCTURING OF A CENTRAL APPALACHIAN DEER HERD1
1 Miller, B. F., R. W. DeYoung, T. A. Campbell, B. R. Laseter, W. M. Ford, and K. V. Miller. To be submitted to
the Journal of Mammalogy.

48
Abstract- Although spatial genetic structure of white-tailed deer (Odocoileus virginianus)
populations has been examined at coarse scales (>1km), most research has lacked the geographic
and molecular resolution necessary to examine microgeographic patterns. We used 14
polymorphic microsatellite DNA loci to conduct a spatial autocorrelation analysis on 229 adult
females from a 3,413 ha study area in the central Appalachians of West Virginia. Genetic
relatedness was inversely related to geographic distances between individuals. Females with
core areas separated by less than approximately 1,000 m were more related than randomly
permuted values. Resulting correlograms displayed a stabilizing pattern, suggesting spatial
structure at the group level. Using visual observations, we delineated 28 putative female social
groups and found that the mean relatedness value within social groups was similar to that of first
cousins. This suggests a causative mechanism of spatial fidelity of matrilineal social groups
resulting from philopatric female offspring. Our evidence of microgeographic genetic and social
structuring supports the basic premise of deer social dispersion.
Key words: genetics, microsatellites, Odocoileus virginianus, relatedness, social groups, spatial
autocorrelation, white-tailed deer.
Introduction
Many ungulate species demonstrate spatial genetic structuring in contrast to the classical
population genetics theory in which a population is composed of randomly mating individuals
(Wright 1978). A wide variety of environmental and social factors can influence gene flow in
ungulate populations. The effects of landscape features (Coulon et al. 2006; McLoughlin et al.
2004; Perez-Espona et al. 2006), isolation by distance (Balloux et al. 2002; Hardy and Vekemans

49
1999), and human influences (Blanchong et al. 2006) have been documented thoroughly.
However the effects of social organization on gene flow have only recently been explored.
Although ungulate populations may be expected to have minimal spatial genetic structure
due to their potential for long-distance dispersal (Scribner et al. 1997), spatial genetic structure
attributed to social organization has been reported in red deer (Cervus elaphus—Frantz et al.
2008; Nussey et al. 2005), white-tailed deer (Odocoileus virginianus—Mathews and Porter
1993; Scribner et al. 1997), and Soay sheep (Ovis aries—Coltman et al. 2003). Typical social
organization of ungulate populations consists of matriarchal social groups characterized by male-
biased dispersal, high female philopatry, and polygynous breeding systems (DeYoung et al.
2002; van Hooft et al. 2003). These socio-behavioral attributes of ungulate social organization
have the potential to create fine-scale spatial structuring in some populations (Storz 1999).
The social organization of white-tailed deer appears similar to that of other ungulates. In
many areas of their distribution, white-tailed deer form matriarchal social groups containing
adult females and several generations of offspring (Hawkins and Klimstra 1970; Hirth 1977;
Mathews and Porter 1993). Additionally, previous research suggests that members of these
social groups associate throughout the year (Aycrigg and Porter 1997; Nelson and Mech 1984).
Although high female dispersal rates (>40%) have been reported in fragmented agricultural areas
(Nixon et al. 1991), most female dispersal rates are low (2-20%; Hawkins and Klimstra 1970;
Nelson 1993). Dispersal rates of juvenile males may exceed 70% (Campbell et al. 2005;
Rosenberry et al. 2001) and dispersal distances range from a few kilometers in heavily forested
areas to dozens of kilometers in open habitats (Long et al. 2005). Based on these socio-
behavioral attributes, white-tailed deer are well suited for investigations of the effects of social
organization on fine-scale spatial genetic structuring.

50
The preponderance of research investigating the spatial genetic structure of white-tailed
deer populations has been examined at a macrogeographic scale (Blanchong et al. 2006;
DeYoung et al. 2003a; Doerner et al. 2005; Kollars et al. 2004; Purdue et al 2000). Those few
studies conducted at finer geographic scales (Mathews and Porter 1993; Scribner et al. 1997)
were limited severely in inference by the use of protein electrophoresis. Alternatively, the use of
microsatellite DNA markers provides increased precision suitable for examining
microgeographic (<1.0 km) genetic patterns (Anderson et al. 2002; DeYoung and Honeycutt
2005). Comer et al. (2005) conducted the only published microgeographic investigation of
spatial genetic structuring in white-tailed deer employing microsatellite DNA markers. They
observed a low degree of genetic structuring in the population that was attributed to a young
female age structure due to heavy hunting pressure, and a possible elevated dispersal rate of
young female white-tailed deer on their study site. Work utilizing microsatellite DNA markers
to examine microgeographic genetic structure in white-tailed deer populations under more
traditional management regimes that commonly occur throughout the range of white-tailed deer
is lacking. Microgeographic social and genetic structure in female white-tailed deer has
substantial implications for disease transmission, evolutionary processes, and behavior-based
strategies to alleviate human-wildlife conflicts. Therefore, we believe that additional research
utilizing microsatellite DNA markers is warranted.
Our overall study objective was to examine the microgeographic genetic and social
structuring in a free-ranging, non-migratory, and high density white-tailed deer herd in the
central Appalachian Mountains of West Virginia, characteristically representative of many
populations in the eastern United States. We used data from 14 microsatellite DNA loci and
spatial autocorrelation analysis to: 1) examine the relationship between spatial distance and
51
genetic relatedness for adult females on the study site, 2) determine relatedness among adult
females within social groups delineated by visual observations, and 3) examine the relationship
between spatial distance and genetic relatedness among social groups and their members.
Materials and Methods
Study site.—Our research was conducted on the 3,413 ha MeadWestvaco Wildlife and
Ecosystem Research Forest (MWWERF) located in Randolph County, West Virginia (38°42’N,
80°3’W). The MWWERF was established in 1994 to investigate the relationship between
industrial forestry and ecosystem processes. The MWWERF is located in the Unglaciated
Allegheny Mountain and Plateau Physiographic province, and topography consists of plateau-
like ridgetops with steep sides and narrow valleys (Smith 1995). Elevations range from 700–
1,200m. The climate is moist and cool with mean annual precipitation in excess of 155 cm
(Strausbaugh and Core 1977). The most common forest overstory cover is Allegheny hardwood-
northern hardwood type composed mainly of American Beech (Fagus grandifolia), birch (Betula
spp.), black cherry (Prunus serotina), maple (Acer spp.), and yellow-poplar (Liriodendron
tulipifera). The proportion of the study site composed of forest regeneration areas ≤ 10 years of
age increased from 8% to 14% during the study. Deer densities and sex ratios on the MWWERF
during the study were estimated as 12-20 deer/km2 and 6-18 adult males: 100 adult females,
respectively (Langdon 2001). Males experienced high annual mortality from hunting, whereas
females averaged approximately 85–90% annual survival (Campbell et al. 2005). Telemetry data
revealed low levels (<5.0%) of dispersal in juvenile females (Campbell et al. 2004a). Abomasal
parasite counts indicated the deer herd is approaching or has reached nutritional carrying
capacity (Fischer 1996).
52
Deer capture.—To collect biological and movement ecology data, we captured deer from
27 February 1999–19 March 2005 using Clover traps (Clover 1954) baited with whole kernel
corn. Captured animals were physically restrained, blindfolded, and given an intramuscular
injection of xylazine hydrochloride (100 mg/ml, Cervizine®
; Wildlife Laboratories Inc., Fort
Collins, Colorado) at a dosage of 2.2 mg/kg body weight. We collected genetic samples, affixed
large numbered plastic ear-tags (National Band and Tag, Newport, Kentucky), and estimated the
age of immobilized animals via tooth wear and replacement (Severinghaus 1949). We outfitted
captured animals with 3-year radiocollars (Advanced Telemetry Systems, Isanti, Minnesota).
Immobilization was reversed with a 12.0 mg intramuscular injection of yohimbine (5 mg/ml,
Antagonil®
; Wildlife Laboratories, Inc.). All animal handling procedures were approved by The
University of Georgia Institutional Animal Care and Use Committee (Permit No. A2002-10119-
0).
Collection of radiotelemetry and observation data.—From 7 April 1999 through 27 April
2005, we located radiocollared animals ≥2 times per week throughout the 24-hour day from
permanent geo-referenced telemetry stations (n = 591), allowing ≥ 10 hours between telemetry
locations. We used 4-element Yagi antennas and radio receivers (Advanced Telemetry Systems,
Isanti, Minnesota) to estimate deer locations. We collected three to eight preliminary azimuths
to pinpoint deer locations, and recorded two simultaneous azimuths that yielded an angle of 90 ±
40°. The LOCATE function of CALHOME was used to generate UTM coordinates of deer
locations (Kie et al. 1996). To estimate telemetry error, we placed radiocollars at random geo-
referenced sites in areas commonly used by deer (Samuel and Fuller 1996). Each researcher
recorded an azimuth to a radiocollar from five telemetry stations. The resulting mean bearing

53
error of -0.65° (SD = 8.41°) suggests that telemetry errors caused minimal bias in our telemetry
protocol.
From 7 April 1999–27 April 2005, we recorded opportunistic visual observations of
marked and unmarked animals along roadsides using 10x40 binoculars. Our observational data
included date and time of observation, nearest geo-referenced telemetry station, sex, age class
(juvenile or adult), size of group, and ear-tag numbers of marked animals. We considered
individuals separated by ≤ 25 m to be associating (Aycrigg and Porter 1997).
Genetic analysis.—To investigate the genetic diversity of the overall population we
collected whole blood or ear-notch tissue from captured deer and muscle tissue samples from
fetuses obtained from deer euthanized for additional research purposes. Blood samples (2ml)
were collected via jugular venipuncture and combined with 6ml of Longmire’s solution (lysis
buffer; Longmire et al. 1988) in Vacutainer®
tubes (Benton Dickinson, Franklin Lakes, New
Jersey) and stored at room temperature. Ear notch and muscle tissue samples were immediately
placed in Vacutainer®
tubes (Benton Dickinson) containing 8 ml of 95% ethanol, and allowed to
fix at 4°C for ≥ 24 hours, after which they were stored at room temperature.
We extracted total DNA from samples using Qiagen®
DNeasy™ Blood and Tissue Kit
(Qiagen, Inc., Valencia, California). Standard protocols were used except that we allowed 24 hrs
for tissue lysis by proteinase K, and only 100µl of buffer AE was added to the membrane of the
mini spin columns. We stored extracted DNA samples in 1.5 ml microcentrifuge tubes (Fisher
Scientific, Pittsburgh, Pennsylvania) at 4°C.
We selected a panel of 14 microsatellite loci from the 21 identified for use with white-
tailed deer (Anderson et al. 2002, DeYoung et al. 2003b). The BM145, BM203, BovPRL,
ETH152, K, OCAM, and R loci were omitted. We amplified DNA fragments by polymerase
54
chain reaction (PCR) following methods by Anderson et al. (2002). The PCR products
containing fluorescently labeled primers (6-FAM, HEX, or NED; Applied Biosystems, Foster
City, California) and an internal size standard (GeneScan®
-500 [ROX]™, Applied Biosystems)
were subjected to capillary electrophoresis on an ABI PRISM®
3130 Genetic Analyzer (Applied
Biosystems). Alleles were characterized by GeneMapper™ software (Applied Biosystems)
followed by visual inspection and verification.
We used the identity analysis function of CERVUS 2.0 (Marshall et al. 1998) to detect
inadvertent resampling of deer due to the loss of ear-tags. We additionally used the parentage
analysis function of CERVUS 2.0 to estimate the mean genotyping error rate across all loci by
comparing fetal samples to their known dams. Finally, we used CERVUS 2.0 to evaluate the
loci for Hardy-Weinberg equilibrium (HWE), calculate allelic frequencies, expected
heterozygosity, observed heterozygosity, and polymorphism information content (PIC).
Spatial autocorrelation analysis.— We conducted a spatial autocorrelation analysis via
the program SPAGeDI 1.2 (Hardy and Vekemans 2002) to investigate the relationship between
spatial distance (Euclidian distance) and genetic relatedness in adult female white-tailed deer.
Spatial autocorrelation analysis can be applied to samples collected from continuously
distributed populations to summarize the genetic variation in space (Dinez-Filho and Telles
2002). We used the Moran’s I relatedness coefficient as the response variable and geographic
distances (meters) between spatial coordinates was the explanatory variable. The Moran’s I
relatedness statistic was selected because it does not assume adherence to Hardy-Weinberg
equilibrium (often unlikely in highly related populations), and provides high accuracy with
moderate precision (Hardy and Vekemans 2002). We performed a jackknife procedure over loci
to estimate standard errors for distance classes, and analyses were performed using 1,000
55
randomizations of spatial locations. We used one-sided tests for each distance class to determine
if observed relatedness values were significantly greater than relatedness values from randomly
permuted values. We performed three different types of spatial autocorrelation analyses to
examine the social and genetic structuring of the population.
We first performed an autocorrelation analysis at the individual level for independently
associated female deer. Only individuals ≥18 months of age were included in this analysis to
reduce the risk of inflated spatial and genetic correlation from inclusion of juveniles (Coltman et
al. 2003; Comer et al. 2005). We then assessed fine-scale structure for 21 distance classes
ranging from 0–4,000 m at 200 m intervals, resulting in a minimum of 84 pair-wise comparisons
per distance class (mean=1,142.0 m). We calculated distances between home range centers of
individuals determined by the harmonic means of telemetry locations (Animal Movement
extension v. 2.04; Hooge and Eichenlaub 1997) in Arcview GIS 3.3 (Environmental Systems
Research Institute 1999). The coordinates from trap site locations obtained via a sub-meter
global positioning system (GeoExplorer 3, Trimble Navigation Limited, Sunnyvale, California)
were used for individuals lacking telemetry data.
Delineation of social groups.— We performed the final two autocorrelation analyses on
female deer assigned to putative social groups. We considered marked animals members of a
social group if they were visually observed associating together on a minimum of 60% of
occasions, and were observed ≥ 2 times. Juveniles were not considered members of a social
group until ≥18 months of age. We assigned members of a social group matching spatial
coordinates representing the center of a social group’s range based on visual observations.
We first conducted an autocorrelation analysis examining spatial distance and genetic
relatedness between social groups at the individual level for eight distance classes ranging from

56
500-4,000 m at 500 m intervals. A minimum of 194 pair-wise comparisons were available per
distance class (mean=559.1). Deer within social groups had the same spatial coordinates, hence
they were not considered independent. We therefore performed no pair-wise comparisons
between members of the same social group.
Additionally we conducted a spatial autocorrelation analysis at the population level to
investigate the relatedness between entire social groups across six distance classes ranging from
750–4,500m at 750 m intervals. A minimum of 29 pair-wise comparisons were available per
distance class (mean=62.5). We compared observed Fit, Fst, and Fis estimates with permuted
values to examine allelic frequencies within social groups. We also calculated the Rho
relationship coefficient to measure the mean relatedness of individuals within social groups.
Results
A total of 420 unique multilocus genotypes was derived from white-tailed deer on the
MWWERF. Most of these genotypes (346) were obtained from our trapped deer (80 male and
266 female); 74 were obtained from fetal tissue samples. Results from the identity analysis
found two individuals with matching genotypes across all loci examined (n=13), and subsequent
investigation of location and biological information confirmed the incidental resampling of one
individual. Our mean observed genotyping error rate across loci was 0.0269 based on 74 fetal
genotypes from 68 known parents. Of the 29 single locus offspring-parent mismatches, seven
were identified as null alleles.
The 14 microsatellite loci examined in the population were highly polymorphic (Table
3.1). The number of alleles per locus ranged from 4 to 23, with a mean of 13.9. Mean expected
heterozygosity for all loci was 0.786, and the mean polymorphism information content was
0.763. One locus (BM848) deviated from Hardy-Weinberg equilibrium (Χ2, = 41.56, df =6,

57
p<0.001), perhaps due to the inclusion of highly related fetal samples in the overall population
analysis (Anderson et al. 2002).
A total of 229 adult (≥18 months of age) female deer were used in spatial autocorrelation
analysis at the individual level. The spatial coordinates used in the analysis were derived from
telemetry locations for 139 of the individuals, and from capture sites for the 90 other individuals
(Fig. 3.1). Mean (±SE) number of telemetry locations per individual was 219.9±13.3. We used
26,106 pair-wise distance comparisons in the analysis. The mean distance length between
individuals was 2,467.7±13.3 m.
Spatial autocorrelation analysis of adult female deer indicated significant spatial genetic
structuring. Moran’s I relatedness coefficients declined as distance between pair-wise spatial
locations increased (Fig. 3.2). The highest relatedness coefficient (0.088) was observed for
individuals with the same spatial coordinates (e.g., same trap site), however a significant positive
relatedness coefficient was detected for all distance classes ≤901.4 m. No significant difference
was found between the observed relatedness coefficient and the randomly permuted value for the
next distance class having a mean of 1,101.0 m. A negative relatedness coefficient was found in
six of seven distance classes having mean geographical distances between 2,499.7–3,695.0 m.
We recorded total of 17,731 visual observations during our study. Of those, 2,831
observations were of identifiable animals. From these data, we delineated 28 putative social
groups containing a total of 102 marked adult (≥18 months of age) females. Social groups
contained a mean of 3.6±0.5 members, with a range of 2-12.
Our results from spatial autocorrelation analysis of social groups conducted at the
individual level indicate significant genetic relatedness of individuals within social groups
delineated by visual observations. The Moran’s I relatedness coefficient between individuals
58
within social groups was 0.090, which is a value similar to that of first cousins. When individual
deer were not compared to other members of their social group, genetic similarity declined
rapidly and became non-significant at a distance somewhere between 0 and 373.6 m (Fig. 3.3).
A significant positive relatedness coefficient was also detected for two distance classes with
means of 1,783.7 and 3,786.4 m, however the observed Moran’s I relatedness coefficients were
low (≤0.018) indicative of Type I errors. A significant negative relatedness coefficient was
found in the distance classes having a mean distance of 2,776.8 m.
Our analysis of social groups conducted at the population level detected significant
differences (P<0.05) in observed Fit, Fst, and Fis values compared to randomly permuted values.
The positive observed Fit value (0.0297) indicates a deficit of heterozygosity at the population
level, due to combining social groups into a single sample. The positive observed Fst value
(0.0757) indicates significant genetic structure among populations (i.e. social groups). However,
a negative Fis value (-0.0497) indicates greater heterozygosity within groups than would be
expected by Hardy-Weinberg equilibrium. The observed Rho relationship coefficient (0.1470)
between individuals within social groups differed (P<0.01) from mean permuted values
indicating relatedness among members of the same social group.
Discussion
The results from our spatial autocorrelation analysis conducted at the individual level
illustrate the strong relationship between spatial location and genetic relatedness among adult
female white-tailed deer on the MeadWestvaco Wildlife and Ecosystem Research Forest. The
pair-wise comparisons demonstrated that individuals with similar spatial coordinates were much
more likely to be related than individuals with dissimilar spatial coordinates (i.e., greater
59
geographic distance). Moreover, our results indicate spatial clustering of related individuals
consistent with matriarchal social groups.
The graphical representation of our spatial autocorrelation results for individuals (Fig.
3.2) is strikingly similar to the hypothetical correlogram depicting a stabilizing profile proposed
by Dinez-Filho and Telles (2002). This type of correlogram occurs when only short distance
autocorrelation is found, and indicates that spatial genetic variation occurs in patches (Dinez-
Filho et al. 2003). Because our spatial autocorrelation analysis was significant at the mean
spatial distance of 901.4 m but not in the next distance class of 1,101.0 m, we can conclude that
our patches are approximately 1,000 m in size.
Our findings differ from those of Comer et al. (2005). They reported a low degree of
spatial genetic structuring at the individual level among female deer on the Savannah River Site
in South Carolina. The lack of spatial genetic structuring was attributed to a young female age
structure in the population due to heavy hunting pressure, and a possible elevated dispersal rate
of young female white-tailed deer on their study site.
Aycrigg and Porter (1997) hypothesized that sociospatial behavior of white-tailed deer
largely was dependent on the ability of a population to develop a complex age structure. Female
deer on our study site have high annual survival (85–90%; Campbell et al. 2005), which may
result in our low observed rates of female dispersal (<5.0%; Campbell et al. 2004). If herd
management on our study site was altered towards population exploitation, future results may be
similar to those reported by Comer et al. (2005). Similarly if juvenile female dispersal rates were
as elevated as reported by Nixon et al. (1991), patterns of spatial genetic structure perhaps would
not be present.
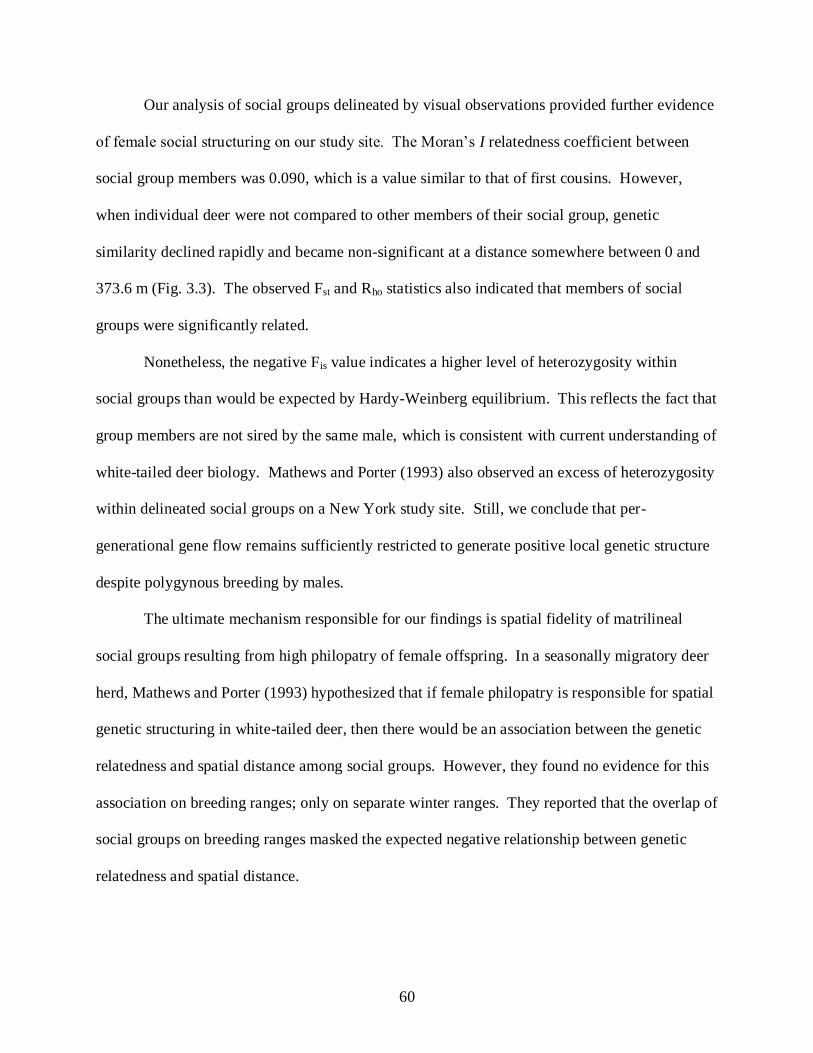
60
Our analysis of social groups delineated by visual observations provided further evidence
of female social structuring on our study site. The Moran’s I relatedness coefficient between
social group members was 0.090, which is a value similar to that of first cousins. However,
when individual deer were not compared to other members of their social group, genetic
similarity declined rapidly and became non-significant at a distance somewhere between 0 and
373.6 m (Fig. 3.3). The observed Fst and Rho statistics also indicated that members of social
groups were significantly related.
Nonetheless, the negative Fis value indicates a higher level of heterozygosity within
social groups than would be expected by Hardy-Weinberg equilibrium. This reflects the fact that
group members are not sired by the same male, which is consistent with current understanding of
white-tailed deer biology. Mathews and Porter (1993) also observed an excess of heterozygosity
within delineated social groups on a New York study site. Still, we conclude that per-
generational gene flow remains sufficiently restricted to generate positive local genetic structure
despite polygynous breeding by males.
The ultimate mechanism responsible for our findings is spatial fidelity of matrilineal
social groups resulting from high philopatry of female offspring. In a seasonally migratory deer
herd, Mathews and Porter (1993) hypothesized that if female philopatry is responsible for spatial
genetic structuring in white-tailed deer, then there would be an association between the genetic
relatedness and spatial distance among social groups. However, they found no evidence for this
association on breeding ranges; only on separate winter ranges. They reported that the overlap of
social groups on breeding ranges masked the expected negative relationship between genetic
relatedness and spatial distance.
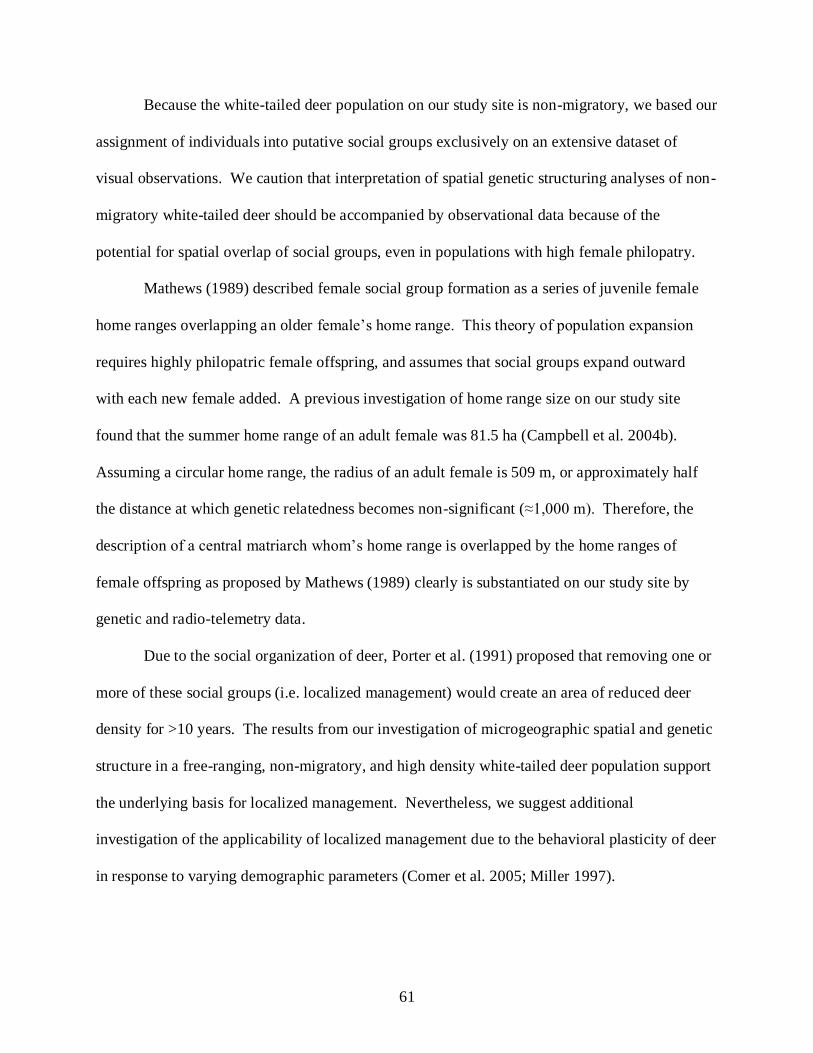
61
Because the white-tailed deer population on our study site is non-migratory, we based our
assignment of individuals into putative social groups exclusively on an extensive dataset of
visual observations. We caution that interpretation of spatial genetic structuring analyses of non-
migratory white-tailed deer should be accompanied by observational data because of the
potential for spatial overlap of social groups, even in populations with high female philopatry.
Mathews (1989) described female social group formation as a series of juvenile female
home ranges overlapping an older female’s home range. This theory of population expansion
requires highly philopatric female offspring, and assumes that social groups expand outward
with each new female added. A previous investigation of home range size on our study site
found that the summer home range of an adult female was 81.5 ha (Campbell et al. 2004b).
Assuming a circular home range, the radius of an adult female is 509 m, or approximately half
the distance at which genetic relatedness becomes non-significant (≈1,000 m). Therefore, the
description of a central matriarch whom’s home range is overlapped by the home ranges of
female offspring as proposed by Mathews (1989) clearly is substantiated on our study site by
genetic and radio-telemetry data.
Due to the social organization of deer, Porter et al. (1991) proposed that removing one or
more of these social groups (i.e. localized management) would create an area of reduced deer
density for >10 years. The results from our investigation of microgeographic spatial and genetic
structure in a free-ranging, non-migratory, and high density white-tailed deer population support
the underlying basis for localized management. Nevertheless, we suggest additional
investigation of the applicability of localized management due to the behavioral plasticity of deer
in response to varying demographic parameters (Comer et al. 2005; Miller 1997).

62
Acknowledgements
Financial assistance was provided by the MeadWestvaco Corporation, the West Virginia
Division of Natural Resources, and the US Department of Agriculture National Research
Initiative Competitive Grants Program (grants 00-35101-9284 and 03-35101-13719). We thank
B. Faircloth for laboratory assistance, and J. L. Crum, P. D. Keyser, and D. A. Osborn for
logistical assistance. We also thank the numerous field technicians and volunteers that helped
with sample collections. The comments of J. P. Carroll, C. J. Nairn, and R. J. Warren improved
early versions of this manuscript. Deer were captured and handled under Scientific Collection
Permits from the West Virginia Division of Natural Resources.
Literature Cited
Anderson, J. D., R. L. Honeycutt, R. A. Gonzales, K. L. Gee, L. C. Skow, R. L. Gallagher, D. A.
Honeycutt, and R. W. DeYoung. 2002. Development of microsatellite DNA markers for
the automated genetic characterization of white-tailed deer populations. Journal of
Wildlife Management 66:67–74.
Aycrigg, J. L., and W. F. Porter. 1997. Sociospatial dynamics of white-tailed deer in the central
Adirondack Mountains, New York. Journal of Mammalogy 78:468–482.
Balloux, F., and N. Lugon-Moulin. 2002. The estimation of population differentiation with
microsatellite markers. Molecular Ecology 11:155–165.
Blanchong, J. A., K. T. Scribner, B. K. Epperson, and S. R. Winterstein. 2006. Changes in
artificial feeding regulations impact white-tailed deer fine-scale spatial genetic structure.
Journal of Wildlife Management 70:1037–1043.

63
Campbell, T. A., B. R. Laseter, W. M. Ford, and K. V. Miller. 2004a. Feasibility of localized
management to control white-tailed deer in forest regeneration areas. Wildlife Society
Bulletin 32:1124–1131.
Campbell, T. A., B. R. Laseter, W. M. Ford, and K. V. Miller. 2004b. Topographic home
ranges of white-tailed deer in the central Appalachians. Southeastern Naturalist 3:645–
652.
Campbell, T. A., B. R. Laseter, W. M. Ford, and K. V. Miller. 2005. Population characteristics
of a central Appalachian white-tailed deer herd. Wildlife Society Bulletin 33:212–221.
Clover, M. R. 1954. A portable deer trap and catch-net. California Fish and Game 40:367–373.
Coltman, D. W., J. G. Pilkington, and J. M. Pemberton. 2003. Fine-scale genetic structure in a
free-living ungulate population. Molecular Ecology 12:733–742.
Comer, C. E., J. C. Kilgo, G. J. D’Angelo, T. G. Glenn, and K. V. Miller. 2005. Fine-scale
genetic structure and social organization in female white-tailed deer. Journal of Wildlife
Management 69:332–344.
Coulon, A., G. Guillot, J. F. Cosson, J. M. A. Angibault, S. Aulagnier, B. Cargnelutti, M. Galan,
and A. J. M. Hewison. 2006. Genetic structure is influenced by landscape features:
empirical evidence from a roe deer population. Molecular Ecology 15:1669–1679.
DeYoung, R. W., S. Demarais, R. A. Gonzales, R. L. Honeycutt, and K. L. Gee. 2002. Multiple
paternity in white-tailed deer (Odocoileus virginianus) revealed by DNA microsatellites.
Journal of Mammalogy 83:884–892.
DeYoung, R. W., S. Demarais, R. L. Honeycutt, A. P. Rooney, R. A. Gonzales, and K. L. Gee.
2003a. Genetic consequences of white-tailed deer (Odocoileus virginianus) restoration in
Mississippi. Molecular Ecology 12:3237–3252.

64
DeYoung, R. W., S. Demarais, R. L. Honeycutt, R. A. Gonzales, K. L. Gee, and J. D. Anderson.
2003b. Evaluation of a DNA microsatellite panel for genetic exclusion studies in white-
tailed deer. Wildlife Society Bulletin 31:220–232.
DeYoung, R. W., and R. L. Honeycutt. 2005. The molecular toolbox: genetic techniques in
wildlife ecology and management. Journal of Wildlife Management 69:1362–1384.
Dinez-Filho, J. A. F., and M. P. C. Telles. 2002. Spatial autocorrelation analysis and the
identification of operational units for conservation in continuous populations.
Conservation Biology 16:924–935.
Dinez-Filho, J. A. F., L. M. Bini, and B. A. Hawkins. 2003. Spatial autocorrelation and red
herrings in geographical ecology. Global Ecology and Biogeography 12:53–64.
Doerner, K. C., W. Braden, J. Cork, T. Cunningham, A. Rice, B. J. Furman, and D. McElroy.
2005. Population genetics of resurgence: white-tailed deer in Kentucky. Journal of
Wildlife Management 69:345–355.
Environmental Systems Research Institute. 1999. ARCVIEW. Version 3.2. Environmetnal
Systems Research Institute, Redlands, California.
Fischer, J. R. 1996. White-tailed deer herd health check on the Westvaco Wildlife and
Ecosystem Research Forest. Final Report to the West Virginia Division of Natural
Resources.
Frantz, A. C., J. L. Hamann, and F. Klein. 2008. Fine-scale genetic structure of red deer
(Cervus elaphus) in a French temperate forest. European Journal of Wildlife Research
54: 44–52.

65
Hardy, O. J., and X. Vekemans. 1999. Isolation by distance in a continuous population:
reconciliation between spatial autocorrelation analysis and population genetics models.
Heredity 83:145–154.
Hardy, O. J., and X. Vekemans. 2002. SPAGeDi: a versatile computer program to analyze
spatial genetic structure at the individual or population levels. Molecular Ecology Notes
2:618–620.
Hawkins, R. E., and W. D. Klimstra. 1970. A preliminary study of the social organization of
white-tailed deer. Journal of Wildlife Management 34:407–419.
Hirth, D. H. 1977. Social behavior of white-tailed deer in relation to habitat. Wildlife
Monographs 53:1–55.
Hooge, P. N., and B. Eichenlaub. 1997. Animal movement extension to arcview. ver. 1.1.
Alaska Biological Science Center, U.S. Geological Survey, Anchorage, Alaska.
Kie, J. G., J. A. Baldwin, and C. J. Evans. 1996. CALHOME: a program for estimating animal
home ranges. Wildlife Society Bulletin 24:342–344.
Kollars, P. G., M. L. Beck, S. G. Mech, P. K. Kennedy, and M. L. Kennedy. 2004. Temporal
and spatial genetic variability in white-tailed deer (Odocoileus virginianus). Genetica
121:269–276.
Long, E. S., D. D. Diefenbach, C. S. Rosenberry, B. D. Wallingford, and M. D. Grund. 2005.
Forest cover influences dispersal distance of white-tailed deer. Journal of Mammalogy
86:623–629.
Longmire, J. L., A. K. Lewis, N. C. Brown, J. M. Buckingham, L. M. Clark, M. D. Jones, L. J.
Meincke, J. Meyne, R. L. Ratliff, F. A. Ray, and others. 1988. Isolation and molecular

66
characterization of a highly polymorphic centromeric tandem repeat in the family
Falconidae. Genomics 2:14–24.
Langdon, C. A. 2001. A comparison of white-tailed deer population estimation methods in
West Virginia. Thesis, West Virginia University, Morgantown, West Virginia.
Marshall T. C., J. Slate, L. E. B. Kruuk, and J. M. Pemberton. 1998. Statistical confidence for
likelihood-based paternity inference in natural populations. Molecular Ecology 7:639–
655.
Mathews, N. E. 1989. Social structure, genetic structure, and anti-predator behavior of white-
tailed deer in the Central Adirondacks. Ph.D. dissertation, State University of New York,
Syracuse, New York.
Mathews, N. E., and W. F. Porter. 1993. Effect of social structure on genetic structure of free-
ranging white-tailed deer in the Adirondack Mountains. Journal of Mammalogy 74:33–
43.
McLoughlin, P. D., D. Paetkau, M. Duda, and S. Boutin. 2004. Genetic diversity and
relatedness of boreal caribou populations in western Canada. Biological Conservation
118:593–598.
Miller, K. V. 1997. Considering social behavior in the management of overabundant white-
tailed deer populations. Wildlife Society Bulletin 25:279–281.
Nelson, M. E. 1993. Natal dispersal and gene flow in white-tailed deer in northeastern
Minnesota. Journal of Mammalogy 74:316–322.
Nelson, M. E., and L. D. Mech. 1984. Home range formation and dispersal of deer in
northeastern Minnesota. Journal of Mammalogy 65:567–575.
67
Nixon, C. M., L. P. Hansen, P. A. Brewer, and J. E. Chelsvig. 1991. Ecology of white-tailed
deer in an intensively farmed region of Illinois. Wildlife Monographs 118:1–77.
Nussey, D. H., D. W. Coltman, T. Coulson, L. E. B. Kruuk, A. Donald, J. Morris, T. H. Clutton-
Brock, and J. Pemberton. 2005. Rapidly declining fine-scale spatial genetic structure in
female red deer. Molecular Ecology 14:3395–3405.
Perez-Espona, S., J. McLeod, F. J. Perez-Barberia, C. G. I. Jiggins, and J. Pemberton. 2006.
Landscape features affect gene flow of Scottish Highland red deer (Cervus elaphus).
Proceedings of the Sixth International Deer Biology Congress, 7–11 August 2006,
Prague, Czech Republic.
Porter, W. F., N. E. Mathews, H. B. Underwood, R. W. Sage, and D. F. Behrend. 1991. Social
organization in deer: implications for localized management. Environmental
Management 15:809–814.
Purdue, J. R., M. H. Smith, and J. C. Patton. 2000. Female philopatry and extreme spatial
genetic heterogeneity in white-tailed deer. Journal of Mammalogy 81:179–185.
Rosenberry, C. S., M. C. Conner, and R. A. Lancia. 2001. Behavior and dispersal of white-
tailed deer during the breeding season. Canadian Journal of Zoology 79:171–174.
Samuel, M. D., and M. R. Fuller. 1996. Radiotelemetry. Pages 370–418 in T. A. Bookhout,
editor. Research and management techniques for wildlife and habitats. Fifth edition,
revised. The Wildlife Society, Bethesda, Maryland, USA.
Severinghaus, C. W. 1949. Tooth development and wear as criteria of age in white-tailed deer.
Journal of Wildlife Management 13:195–216.

68
Scribner, K. T., M. H. Smith, and R. K. Chesser. 1997. Spatial and temporal variability of
microgeographic genetic structure in white-tailed deer. Journal of Mammalogy 78:744–
755.
Storz, J. F. 1999. Genetic consequences of mammalian social structure. Journal of Mammalogy
80:553–569.
Strausbaugh, P. D., and E. L. Core. 1977. Flora of West Virginia. Seneca Books, Gainsville,
West Virginia.
van Hooft, W. F., A. F. Groen, and H. H. T. Prins. 2003. Gentic structure of African buffalo
herds based on variation at the mitochondrial D-loop and autosomal microsatellite loci:
evidence for male-biased gene flow. Conservation Genetics 4:467–477.
Wright, S. 1978. Evolution and the Genetics of Populations. Variability within and among
natural populations. University of Chicago Press, Chicago, Illinois.
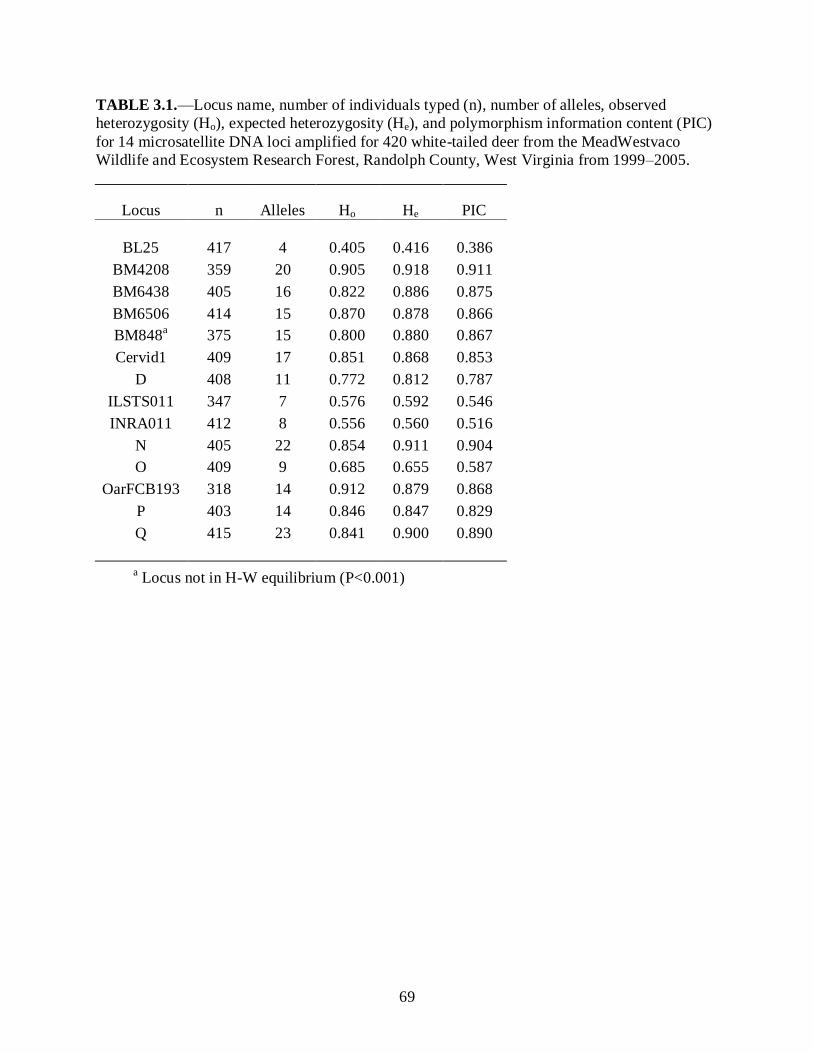
69
TABLE 3.1.—Locus name, number of individuals typed (n), number of alleles, observed
heterozygosity (Ho), expected heterozygosity (He), and polymorphism information content (PIC)
for 14 microsatellite DNA loci amplified for 420 white-tailed deer from the MeadWestvaco
Wildlife and Ecosystem Research Forest, Randolph County, West Virginia from 1999–2005.
Locus n Alleles Ho He PIC
BL25 417 4 0.405 0.416 0.386
BM4208 359 20 0.905 0.918 0.911
BM6438 405 16 0.822 0.886 0.875
BM6506 414 15 0.870 0.878 0.866
BM848a 375 15 0.800 0.880 0.867
Cervid1 409 17 0.851 0.868 0.853
D 408 11 0.772 0.812 0.787
ILSTS011 347 7 0.576 0.592 0.546
INRA011 412 8 0.556 0.560 0.516
N 405 22 0.854 0.911 0.904
O 409 9 0.685 0.655 0.587
OarFCB193 318 14 0.912 0.879 0.868
P 403 14 0.846 0.847 0.829
Q 415 23 0.841 0.900 0.890
a Locus not in H-W equilibrium (P<0.001)
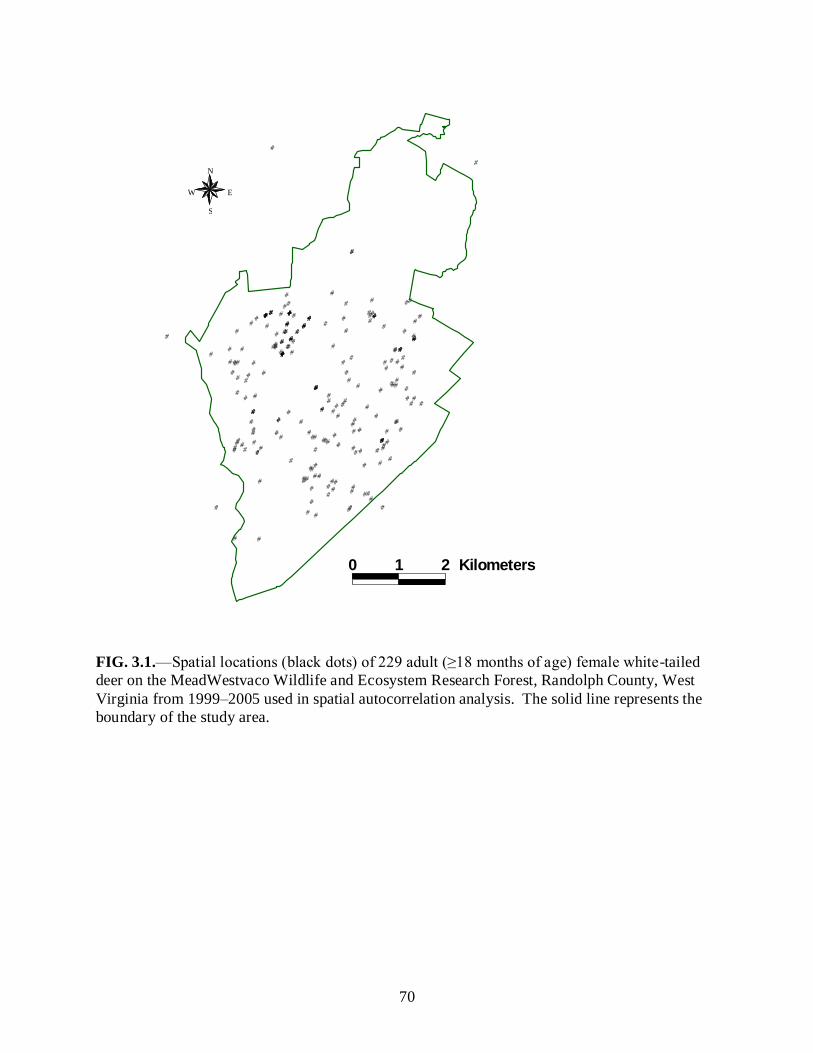
70
FIG. 3.1.—Spatial locations (black dots) of 229 adult (≥18 months of age) female white-tailed
deer on the MeadWestvaco Wildlife and Ecosystem Research Forest, Randolph County, West
Virginia from 1999–2005 used in spatial autocorrelation analysis. The solid line represents the
boundary of the study area.
#
# #
#
#
#
# # #
#
# #
# # # # # # # #
# #
# # # # # # # #
#
# # # # #
#
# # # # # #
#
# # # # # # # # #
# # #
#
# # # #
# #
#
# # #
#
# #
# # # #
# # # # #
#
#
# # #
#
#
# # #
#
# #
#
# # #
#
#
#
#
#
#
# # #
# #
# #
# # #
#
#
#
#
#
#
#
#
#
# # # #
#
#
#
#
#
#
#
#
#
# #
#
#
# # #
#
#
#
#
#
#
#
# # #
#
#
#
#
#
# #
# #
#
#
#
#
#
#
#
#
#
# #
#
#
# #
#
#
#
#
#
# #
#
#
#
# #
#
#
#
# # #
#
#
#
#
#
#
#
#
#
#
# # #
#
#
#
# #
#
#
#
#
#
# #
#
#
# #
#
#
#
# #
#
0 1 2 K i l o m e t e r s
N
E W
S

71
-0.04
-0.02
0
0.02
0.04
0.06
0.08
0.1
0 1000 2000 3000 4000
Distance (m)
Mo
ran
's I
observed
permuted
FIG. 3.2.—Mean (±SE) pair-wise relationship coefficients (Moran’s I) by distance for 229 adult
(≥18 months of age) female white-tailed deer on the MeadWestvaco Wildlife and Ecosystem
Research Forest, Randolph County, West Virginia from 1999–2005.
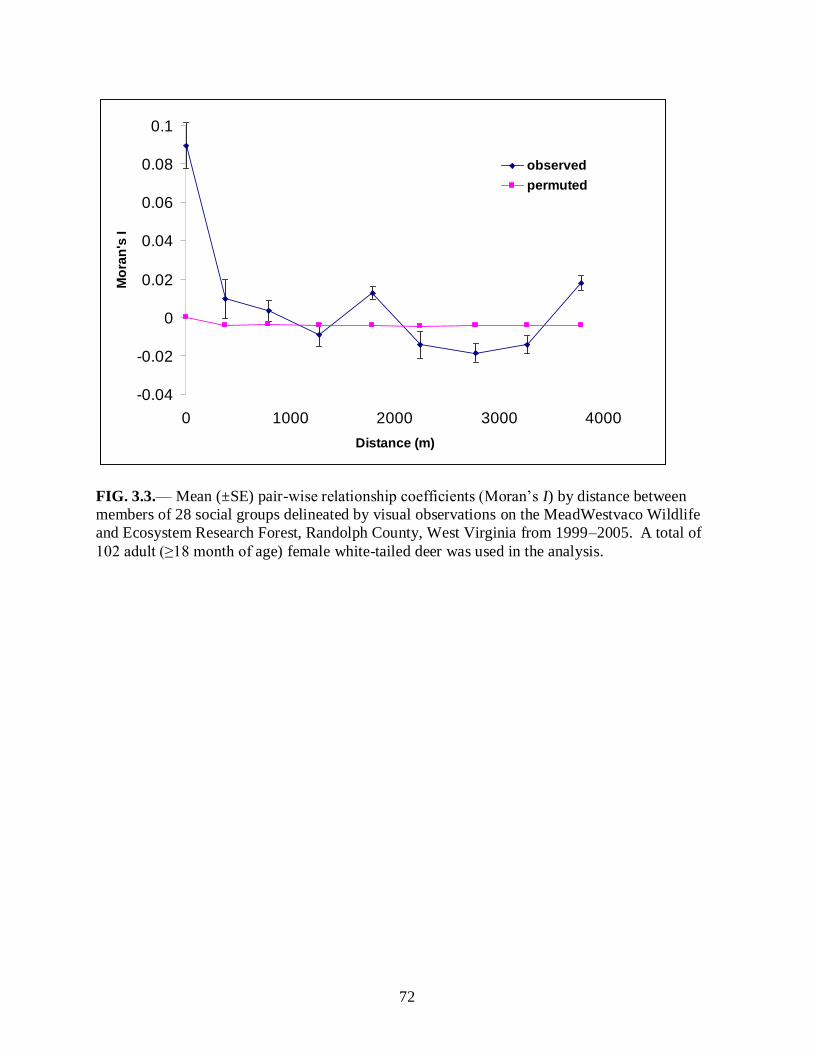
72
-0.04
-0.02
0
0.02
0.04
0.06
0.08
0.1
0 1000 2000 3000 4000
Distance (m)
Mo
ran
's I
observed
permuted
FIG. 3.3.— Mean (±SE) pair-wise relationship coefficients (Moran’s I) by distance between
members of 28 social groups delineated by visual observations on the MeadWestvaco Wildlife
and Ecosystem Research Forest, Randolph County, West Virginia from 1999–2005. A total of
102 adult (≥18 month of age) female white-tailed deer was used in the analysis.
73
CHAPTER 4
A TEST OF LOCALIZED MANAGEMENT FOR REDUCING WHITE-TAILED DEER
HERBIVORY IN CENTRAL APPALACHIAN REGENERATION SITES1
1 Miller, B. F., T. A. Campbell, B. R. Laseter, W. M. Ford, and K. V. Miller. To be submitted to the Journal of
Wildlife Management.
74
Abstract: White-tailed deer (Odocoileus virginianus) herbivory in forest regeneration sites can
have profound impacts on current and future stand structure, species composition, and
biodiversity. Removal of deer social units (localized management) has been proposed as a
strategy to alleviate deer overbrowsing in forest systems. We conducted an experimental
localized removal in a high-density deer population in the central Appalachians of West Virginia
during Winter 2002. We removed 51 deer within a 1.1 km2
area that encompassed 2 forest
regeneration sites (14 ha). During the summer following removal, significant decreases in
distance from the removal area were detected in 8 of 30 (26.7%) adult females having pre-
treatment mean telemetry locations <2.5 km from the center of the removal area. Browse data
were collected during the summers of 2001–2004 from forest regeneration sites to examine the
impacts of localized management. Herbivory rates declined annually in both the removal and
control areas, due in part to increased timber harvesting on the larger study site, suggesting that
increasing forage availability may be more effective at reducing impacts on forest regeneration
than localized reductions in deer populations. Three years after the initial removal, we removed
an additional 31 deer from the original 1.1 km2 removal area. The home range shifts of adjacent
deer coupled with the large number of animals collected in the second removal suggests that
localized management only produces temporary voids within high-density deer herds.
Key words: Appalachians, forest regeneration, herbivory, localized management, Odocoileus
virginianus, rose-petal hypothesis, West Virginia, white-tailed deer.

75
INTRODUCTION
The successful recovery of white-tailed deer (Odocoileus virginianus) populations in the
eastern United States has resulted in a variety of social and ecological conflicts. Overabundant
deer populations can result in deer-vehicle collisions, depredation of agricultural crops, and
damage to ornamental plantings (Conover 1997). Excessive herbivory also can have negative
effects on forested ecosystems (McShea and Rappole 1997a), particularly in regenerating forests
because long-term successional patterns may be altered (Marquis 1981, Horsley and Marquis
1983, McWilliams et al. 1995). Shifts in species composition, reduced stocking, extended
rotation lengths, and entire regeneration failures are possible on some sites (Marquis 1974,
Tilghman 1989, Horsley et al. 2003).
Although regulated hunting can effectively control deer populations in many situations,
managing deer populations at a regional or even county level may not control locally
overabundant populations (Waller and Alverson 1997, McShea and Rappole 2000).
Additionally, using hunting as a management tool may not be applicable in all situations. Hunter
access is often restricted in suburban areas or public parks because of safety concerns or
regulatory constraints (Warren 1991, McShea and Rappole 1997b).
Alternative techniques for controlling deer populations and reducing their negative
effects have been tested but often are cost-prohibitive, (e.g., translocation; Beringer et al. 2002),
require substantial effort and interval of time before population densities are reduced (e.g.,
fertility control; Merrill et al. 2006), or may be viewed unfavorably by the public (e.g.,
sharpshooting; Stout et al. 1997). As a result natural resource managers must explore novel
approaches for reducing the impacts of overabundant deer populations.

76
Recent research investigating the sociobiological characteristics of female deer has
warranted its consideration in management efforts. Mathews (1989) indicated that female social
groups are structured as a series of overlapping home ranges centered on a matriarchial female.
The theoretical shape of these social units is similar to the petals of a rose, and has been termed
the ―rose-petal hypothesis‖. This model of social structuring and population expansion has led
researchers to question traditional concepts for deer management that often emphasize
population reductions on a large geographical area.
Accordingly localized management has been proposed as a management tool that exploits
the social structuring of deer (Porter et al. 1991, Mathews and Porter 1993, McNulty et al. 1997).
This technique involves the ―surgical‖ removal of a matriarchal social group(s) from a limited
geographical area to create a 10–15 year period of reduced deer densities (Porter et al. 1991).
The effectiveness of the technique depends on the suitability of the rose-petal hypothesis as a
model for population expansion. Specifically, deer populations must have low female dispersal,
be highly philopatric, and display high site fidelity for localized management to be applicable.
McNulty et al. (1997) conducted an experimental test of the localized management
technique on a low density (2–6 deer km2), migratory, and unhunted deer population in the
Adirondack Mountains of New York. In that study, 14 deer were removed from a 1.4 km2 area,
and no adjacent female deer (n=9) recolonized the area within 2 years of monitoring. A
subsequent examination of the same removal area by Oyer and Porter (2004) approximately 6
years post-removal reported reduced deer densities for a period of 5 years. These results suggest
that localized management may be a viable technique to prevent overbrowsing by deer in areas
where traditional approaches are unsuitable. Possible sites for applying localized management
include urban/suburban areas (Porter et al. 2004, Kilpatrick et al. 2001) or parks (Porter et al.

77
1991). Forest regeneration sites located in remote areas where access to the hunting public is
difficult or problematic also may benefit from an application of localized management prior to
timber harvesting to ensure successful regeneration (Campbell et al. 2004). However, the
effectiveness of any behavior-based management technique may be limited by the behavioral
plasticity of white-tailed deer (Comer et al. 2005, Miller 1997).
Campbell et al. (2004) assessed the feasibility of implementing localized management on
a hunted, non-migratory, and high-density deer herd in the central Appalachian Mountains of
West Virginia. They reported that the a priori assumptions of localized management were met,
and that a test of localized management on the study site would be possible. Herein we report on
the results of that test of localized management and its effectiveness in reducing herbivory rates
of forest regeneration areas.
STUDY AREA
Our research was conducted on the 3,413 ha MeadWestvaco Wildlife and Ecosystem
Research Forest (MWWERF) located in Randolph County, West Virginia (38°42’N, 80°3’W).
The MWWERF was established in 1994 to investigate the relationship between industrial
forestry and ecosystem processes. The MWWERF is located in the Unglaciated Allegheny
Mountain and Plateau Physiographic province, and topography consists of plateau-like ridgetops
with steep sides and narrow valleys (Smith 1995). Elevations range from 700–1,200m. The
climate is moist and cool with mean annual precipitation in excess of 155 cm, most of which
falls as snow in the winter months (Strausbaugh and Core 1977). Soils of the MWWERF are
acidic, well-drained Inceptisols (Schuler et al. 2002).
Forest types on the MWWERF are naturally regenerated second-growth stands
established in the early 1900’s following extensive area-wide railroad logging (Clarkston 1993).

78
Currently the forests are managed primarily by even-aged harvesting with an 80-100 year
rotation length (Adams 2005). Regeneration sites of approximately 15 ha are well distributed
throughout the MWWERF.
The most common overstory cover is Allegheny hardwood-northern hardwood forest
type composed of American beech (Fagus grandifolia), yellow birch (Betula alleghaniensis),
sugar maple (Acer saccharum), red maple (Acer rubrum), yellow-poplar (Liriodendron
tulipifera), red maple (Acer rubrum), and black cherry (Prunus serotina). Cove hardwoods and
mixed-mesophytic forests composed of yellow-poplar (Liriodendron tulipifera), basswood (Tilia
americana), sweet birch (Betula lenta), and northern red oak (Quercus rubra) are common at
lower elevations. Eastern hemlock (Tsuga canadensis) and red spruce (Picea rubens) comprise a
significant portion of the forest cover on elevations over 1,000 m and along sheltered riparian
zones. A shrub layer and understory groundcover is absent in many areas with the exception of
rhododendron (Rhododendron maximum) thickets in upland an riparian areas, and thick mats of
hay-scented fern (Dennstaedtia punctilobula) in areas where the canopy is interrupted and
sunlight reaches the forest floor.
Intensive research of the deer population on the MWWERF began in 1999 (Campbell
2003). Deer densities and sex ratios on the MWWERF at the time of the study were estimated as
12-20 deer/km2 and 6-18 adult males: 100 adult females, respectively (Langdon 2001). Male
deer experience high annual mortality from hunting, whereas females average 85–90% annual
survival (Campbell et al. 2005). Telemetry data indicates low (<5.0%) dispersal of juvenile
females (Campbell et al. 2004). Abomasal parasite counts indicate the deer herd is approaching
or has reached nutritional carrying capacity (Fischer 1996).

79
METHODS
Deer Capture and Radiotelemetry
To collect preliminary biological and movement data, we captured 224 deer (51 males
and 173 females) from January through April during 1999-2001 using Clover traps (Clover
1954) and rocket nets (Hawkins et al. 1968) baited with whole kernel corn. Captured animals
were physically restrained, blindfolded, and given an intramuscular injection of xylazine
hydrochloride (100 mg/ml, Cervizine®
, Wildlife Laboratories, Inc.) at a dosage of 2.2 mg/kg
body weight. We affixed large numbered plastic ear-tags (National Band and Tag, Newport,
Kentucky), collected genetic samples, and estimated the age of animals via tooth wear and
replacement (Severinghaus 1949). We outfitted 3-year radiocollars (Advanced Telemetry
Systems, Isanti, Minnesota) to 192 captured animals. We reversed immobilization with a 12.0
mg intramuscular injection of yohimbine (5 mg/ml, Antagonil®
, Wildlife Laboratories, Inc.). All
animal handling procedures were approved by The University of Georgia Institutional Animal
Care and Use Committee (Permit No. A2002-10119-0).
We located radiocollared animals ≥2 times per week throughout the 24-hour day from
permanent geo-referenced telemetry stations, allowing ≥ 10 hours between telemetry locations.
We used 4-element Yagi antennas and radio receivers (Advanced Telemetry Systems, Isanti,
Minn.) to estimate deer locations. We collected 3–8 preliminary azimuths to pinpoint deer
locations, and recorded 2 simultaneous azimuths that yielded an angle of 90 ± 40°. We used the
LOCATE function of CALHOME to generate UTM coordinates of estimated deer locations (Kie
et al. 1996). To estimate telemetry error, we placed radiocollars at random geo-referenced sites
in areas commonly used by deer (Samuel and Fuller 1996). Each researcher recorded an azimuth
80
to a radiocollar from 5 telemetry stations. The resulting mean bearing error of -0.65° (SD =
8.41°) suggests that telemetry errors caused minimal bias in our telemetry protocol.
Removal Area Determination
We selected the removal area based upon its feasibility and suitability for an application
of localized management. Laseter (2004) conducted an analysis of telemetry, genetic, and
observation data of deer on our study site prior to the initiation of the removal. Based on home
ranges and activity centers derived from 20,587 telemetry locations for 127 females and genetic
data from 56 of those females, it was determined that the spatial scale of microgeographic
variation was approximately 500 meters. Additionally, putative social groups were identified on
the study site, and verified with genetic and observation data.
We selected one of the social groups identified by Laseter (2004) for removal. We
placed the center of the intended removal area in a location central to the social group based on
telemetry data. A 1.1 km2
circular removal area having a 600 m radius was selected to
encompass the targeted animals, and approximate the spatial scale of genetic variation previously
determined. Additionally, 2 regeneration sites were within the proposed removal area to
evaluate the effects of localized management on herbivory.
Initial Removal
From 7 January to 27 February 2002, we captured deer in modified Clover traps baited
with whole kernel corn (Clover 1954). We distributed 14 traps throughout the removal area (Fig.
4.1). Traps were checked twice daily, and trapped deer were physically restrained and given an
intramuscular injection of 20.0 mg of succinylcholine chloride (20mg/ml, Anectine®
, Burroughs
Wellcome Co., Research Triangle Park, NC). After recumbency, animals were immediately
euthanized by bolt-gun (Cash Special, Accles and Shelvoke Ltd., Birmingham, England).
81
Periodic sharpshooting also was conducted by West Virginia Department of Natural Resources
personnel to remove trap-reluctant individuals after 4 weeks of trapping.
We removed lower mandibles from all animals and ages were estimated by tooth wear
and replacement (Severinghaus 1949). All carcasses were taken to the West Virginia Division of
Natural Resources Captive Animal Facility and Wildlife Park in French Creek, WV and fed to
captive carnivores. We recorded person-hours expended during removal and carcass processing
activities.
We determined when to cease removal efforts by examining trapping data and conducting
deer track count surveys in the snow. We established a transect that originated 1,800 m northeast
of the center of the removal area, crossed through the removal area, and terminated 1,800 m
southwest from the center of the removal area to detect changes in deer density. We recorded
elapsed time since the last snowfall, or elapsed time since the last track count. All tracks were
swept away after each survey. We conducted 6 track counts before initiating the removal, 11
track counts during the removal period, and 4 track counts after the removal period. The
locations of all tracks that crossed the transect were recorded with a sub-meter global positioning
system (GeoExplorer 3, Trimble Navigation Limited, Sunnyvale California), obtaining a
minimum of 30 positions per point. We determined the distance from each track to the center of
the removal area using ArcView 3.3 (ESRI 2002).
Monitoring of Radiocollared Deer
We examined the summer telemetry data (May to September) of 30 female deer (1–8+
years old in 2001) monitored during both pre- and post-removal years (2001 and 2002,
respectively) to identify treatment-related movements. Only those deer having pre-removal
mean distances to the center of the removal area of <2.5 km were included in our analysis. We
82
determined the distance from each telemetry location to the center of the removal area using the
Animal Movement extension v. 2.04 (Hooge and Eichenlaub, 1997) in Arcview GIS 3.3 (ESRI
2002) for deer monitored throughout the summer and having ≥25 locations.
We performed 2 statistical tests to evaluate treatment-related movements. We first
performed Fisher’s distribution-free sign test (Hollander and Wolfe 1973:39–40) to test for
differences in mean pre- and post-removal distances from telemetry locations to the center of the
removal area. The sign test compares the number of animals with smaller post-removal
distances (i.e., moved closer to removal area) with the number of animals with larger post-
removal distances (i.e., moved away from removal area). If there is no treatment effect, then the
number of animals in each category should be similar. We then performed a 2-tailed unequal
variance 2-sample t-tests (Ruxton 2006) on ranked distances for each individual to determine if
the mean location distances in the year after treatment application differed from the distances
prior to treatment application.
To investigate movements without any treatment effects, we compared the distances from
telemetry locations to the proposed center of the removal area from the two summers prior to
application of localized management (2000 and 2001) as previously described for 27 female deer
(1–8+ years old) with mean distances from telemetry locations to the center of the removal area
of <2.5 km. All statistical procedures were performed using SAS (SAS Institute 2004), and
results were considered significant if P < 0.05.
Vegetation Sampling
To examine the effects of the localized removal on herbivory rates, we assessed pre-
treatment deer browsing data in 2001 from 6 regeneration sites each approximately 14 ha in size.
Two regeneration sites were located within the removal area, 2 regeneration sites were located

83
1.1 and 1.3 km, from the center of the removal area to serve as near controls, and 2 other
regeneration sites located 2.6 and 2.7 km from the center of the removal were designated as far
controls (Fig. 4.2). All regeneration sites were resampled in 2002, 2003, and 2004 except the far
control regeneration sites that were not resampled in 2004. The two regeneration sites within the
removal area were in their first and third growing seasons during the first year of vegetation
sampling. The two near control regeneration sites were of identical ages, however the two far
control regeneration sites were both in their second growing seasons during the first year of
vegetation sampling.
We systematically distributed 30 1m2 permanently marked sampling plots along the edge
of skidder trails throughout each regeneration area. Mean distance between each plot was 121
m. We matched an ―interior plot‖ to each trail plot 5 m from the skidder trail in the most
perpendicular cardinal direction. All plots were sampled between 15 July and 15 August of each
study year. Within each year we sampled plots within ± 7 days of the original sampling date in
2001 to prevent temporal bias due to changes in vegetation structure, species composition, or
herbivory rates.
Within each plot, we recorded the total number of browsable units of each species ≤ 1.5
m from the ground (i.e., available), and the total number browsed following Ford et al. (1993).
We determined a browsing rate for each sampling plot by dividing the number of twig tips
browsed by the total number available. All browsing was assumed to be caused by white-tailed
deer because no herbivory by other vertebrates was detected.
We determined the effect of deer removal on changes in browsing rates while accounting
for correlation among years by using a repeated measures multiple analysis of variance
(MANOVA) in SAS using the GLM procedure (SAS Institute 2004). We used a profile analysis

84
procedure to investigate the interaction of time period and treatment by examining parallelism,
levels, and flatness of browsing rates between years (Von Ende 1993).
We used an analysis of variance (ANOVA) where treatment was the main effect to
compare browsing rates among treatments within a time period. Tukey’s honestly significant
difference multiple range test (SAS Institute 2004) was performed if differences among
treatments were detected. A 2-sample t-test was performed on data from the final time period to
compare herbivory rates between the 2 treatments. Trail and interior plots were pooled for
analysis. We transformed browsing percentage data using an arcsine square-root transformation
(Dowdy et al. 2004).
Second Removal
We conducted a second removal between1 January to 21 February 2005, 3 years after the
initial removal. We implemented the second removal to compare the number of animals
captured, and effort required with the initial removal. Additionally we collected genetic samples
for future comparison with the individuals captured in the initial removal. We utilized the same
trapping methods and duration as the initial removal. We also recorded person-hours expended
collecting biological information from carcasses and cleaning of processing facilities.
RESULTS
Initial Removal
We removed 51 deer ranging in age from 0.5-8.5+ years (Fig. 4.3) from the 1.1 km2
targeted area during the 8 week period. The number of individuals removed per week was
negatively related to the duration of trapping (Fig. 4.4). Females comprised the majority of the
animals (39 of 51), with a mean (± SE) age of 3.7 ± 0.4 years. The mean age was lower for
85
males (0.9±0.3 years old) because most males were fawns (9 of 12). Male ages ranged from 0.5–
3.5 years old.
Results from our track counts conducted before, during, and after the removal indicated a
negative relationship between deer density and the duration of trapping. The mean number of
tracks recorded within the removal area was 22.2 ± 7.0 tracks/10 hours during the pre-removal
period. The number decreased to 5.6 ± 1.2 tracks/10 hours during the removal and 2.5 ± 1.5
tracks/10 hours post-removal. Of the 9 radiocollared females with home ranges encompassing a
portion of the removal area, 8 were removed. No radiocollared deer having home ranges outside
of the removal area were captured.
A total of 467 person-hours were required for the initial removal. Preparing trap sites and
pre-baiting required 24.7 person-hours. The majority of the effort was expended checking traps,
removing trapped animals, and sharpshooting efforts. These activities required 442.5 person-
hours, almost 95% of the total person-hours expended. A mean effort of 9.2 person-hours/deer
removed was required.
Monitoring of Radiocollared Deer
Excluding the single radiocollared female that was not removed, we recorded 6,630
telemetry locations from 84 extant radiocollared deer (1 male and 83 female) each having ≥34
locations from 18 February 2002 to 20 December 2002 (Fig. 4.5). The mean distance from all
telemetry locations to the center of the removal area was 2,607.3 ± 10.2 m (range = 96.4–5,433.8
m). There were 11 telemetry locations within the removal area from 10 different deer. The
proportion of each animal’s telemetry points that occurred within the removal area averaged 1.4
± 0.04% (range = 1.1–2.4%) of all telemetry points.

86
The mean number of telemetry locations for deer in the pre-removal and post-removal
periods was 29.3 ± 0.3 (range = 26–32) and 38.5 ± 0.6 (range = 28–44), respectively. Of the 30
female deer having mean distances from telemetry locations to the center of the removal area of
<2.5 km, 19 of them (63.3%) had smaller distances in the summer following the removal
treatment. Results of the sign test comparing deer with smaller post-removal distances to those
with larger post-removal distances approached statistical significance (z = 1.46, P = 0.072).
Differences between pre-removal and post-removal distances to the center of the removal
area were detected by t-tests in 8 of 30 (26.7%) deer (Fig. 4.6). All significant differences in
distances to the removal area were of deer moving closer to the removal area; no significant
movements away from the removal area were detected. The mean difference in pre- and post-
removal distances of the 8 animals was 136.3 ± 13.2 m (range = 57.7–171.1 m) closer to the
center of the removal area.
The mean number of telemetry locations collected from deer in the 2 summers prior to
the application of localized management (2000 and 2001) was 65.0 ± 0.4 (range = 59–69) and
29.4 ± 0.3 (range = 25–32), respectively. The sign test detected no significant differences
between distances from telemetry locations to the center of the proposed removal area for the 2
summers (z = 0.96, P = 0.17). Differences in distances were detected by t-tests in 5 of 27
(18.5%) deer. Of those 5 animals, 4 moved closer to the removal area, and one moved further
away. The mean difference in pre- and post-removal distances of deer moving closer and
moving farther away was 132.6 ± 9.8 m (range = 103.8–148.0 m) and 99.5 m, respectively.
Herbivory Data
We recorded browsable units from a total of 38 woody, and 4 semi-woody plant species.
However, 12 species constituted 85.0% of the available browsable units (187,560 of 220,631)
87
recorded in our study. These included species representative of the woody overstory present
prior to timber harvesting such as black cherry, red maple, sugar maple, birch, magnolia
(Magnolia fraseri and acuminata), American beech, yellow-poplar, northern red oak (Quercus
rubra), and witch-hazel (Hamamelis virginiana). Three early successional invaders such as fire
cherry (Prunus pensylvanica), striped maple (Acer pensylvanicum), and blackberry (Rubus spp.)
increased in abundance following timber harvesting.
Herbivory rates for all woody and semi-woody species combined decreased annually
among the 3 treatments (Fig. 4.7). Herbivory rates in the removal area, near control, and far
control decreased 71.7%, 50.0%, and 43.5% from the pre-removal summer to the first summer
post removal (SPR), respectively. The rate of decrease did not differ among treatments (F2,335 =
2.31, P = 0.10).
During the second summer post removal, the herbivory rate of the far control decreased
an additional 51.4% from a mean herbivory rate of 7.4 ± 1.0% (n=118) to 3.6 ± 0.8% (n=120).
During the same time period the herbivory rates of the near control and removal area decreased
9.9% and 9.3%, respectively. The rate of decrease differed among the 3 treatments (F2,335 = 8.35,
P < 0.001). However, the mean herbivory rate of the far control (3.6 ± 0.8%, n=120) did not
differ from the herbivory rate of the removal area (3.9 ± 0.8%, n=119) in the second SPR (F2,358
= 18.06, P < 0.001).
During the third summer post removal, herbivory rates further decreased 52.7% and 5.1%
for the near control and removal area, respectively. The rate of decrease differed between the
two treatments (F1,236 = 14.60, P < 0.001). The mean herbivory rate did not differ between the
near control (4.3 ± 0.9%, n=120) and the removal area (3.7 ± 1.0%, n=118) in the third summer
post treatment (T236 = 1.35, P = 0.18).
88
Second Removal
Three years after the initial treatment, we removed an additional 31 deer from the original
removal area (Fig. 4.8) using the same techniques as the initial removal. The number of deer
removed per week declined as the duration of trapping increased (Fig. 4.4). Females comprised
the majority of the animals removed (26 of 31). The mean age females was 4.5 ± 0.5 years
(range = 0.5–8.5+). Eighteen of the females were ≥ 3.5 years of age.
All 5 males removed were fawns (0.5 years). One of the fawns had been captured by
hand as a neonate in June 2004 and outfitted with an expandable radiocollar (Advanced
Telemetry Systems, Isanti, Minnesota). His initial capture site and subsequent summer (n = 32)
and fall (n = 18) telemetry locations occurred on the southwestern periphery of the removal area.
A total of 372.4 person-hours were expended during the second removal period.
Preparing trap sites and pre-baiting required 6.9 man-hours. Checking traps, removing trapped
animals, and sharpshooting efforts required a total of 365.5 person-hours. A mean effort of 12.0
person-hours/deer removed was required. Collecting biological data from carcasses and cleaning
of processing facilities and equipment required an additional 2.4 person-hours per deer.
DISCUSSION
For localized management to be effective, a removal area must be sufficiently large to
provide an opportunity for removal of an entire social unit. McNulty et al. (1997) reported that
14 of 17 animals from a known social group were successfully removed from a 1.4 km2 area in
the Adirondacks of New York. Their removal area size was calculated retrospectively based on
home range analysis of the targeted deer. Prior knowledge of social structuring and movement
data typically are not available, although this may not be necessary if deer exhibit high site
fidelity and minimal female dispersal (McNulty et al. 1997). Therefore, management could
89
hypothetically remove ≥ 1 social group if the area is large enough to encompass at least a portion
of the home ranges of social group members.
Based on trapping success, track count data, and removal of radio-collared individuals,
we estimate that >80% of the resident animals were removed within the 8-week removal period.
Campbell et al. (2006) found that 89.5% (34 of 38) radio-collared deer utilized a bait site
occurring within their home range during a 14–16 day observation period on the same area. We
distributed Clover traps in our removal area at a density of 1 trap/ 8.1 ha. Although the visitation
of bait sites may not be equivocal to deer use of Clover traps, we believe that placing multiple
traps within the home range of each target animal greatly increased our removal success. Thus,
our results demonstrate that a large proportion of deer in a high-density population can be
removed from a 1.1 km2 removal area by the combination of trapping and sharpshooting.
In the years following the application of localized management in the Adirondack
Mountains, deer density declined to an area-wide estimate of 2 deer/km2 because of severe
winter weather (Oyer and Porter 2004). They reported that the reduced deer density persisted in
the 1.4 km2 treatment area persisted for approximately 5 years. Furthermore, Oyer and Porter
(2004) concluded that all deer captured in their removal area were individuals missed during the
removal efforts, or descendants of those deer.
The low initial deer density, and subsequent additional decrease in deer density of the
Adirondack study are important differences between our study and that of Oyer an Porter (2004).
The population density in the Adirondack study was estimated to be 6 deer/km2
at the time of the
removal (McNulty et al. 1997), whereas the density we observed was 12–20 deer/km2 (Langdon
2001). Our removal of 51 deer from the 1.1 km2 treatment area compared to the removal of 14
90
deer from a 1.4 km2 treatment area in the Adirondack site is consistent with density estimates on
our area being ≥3 times that of the New York study site.
The high densities we observed have substantial implications for the persistence of a
population void. If initial deer densities in an area are low prior to an application of localized
management, then only a small number of missed individuals will be left as population founders.
However, in sites with high deer densities where human-deer conflicts often occur, and herd
management is needed, even the most intense removal efforts may leave a sizable founding
population.
Dispersal rates of juvenile females are critical to the effectiveness of the localized
management technique (Porter et al. 2004). Localized management assumes that population
density has little effect on female dispersal rates (Porter et al. 1991, McNulty et al. 1997).
However, because of the high population density on our study area, there may be an increased
chance of colonizing voids by female dispersal based on the high number of deer surrounding the
removal area. Furthermore low female dispersal should not be assumed for all areas. High
female dispersal rates have been reported in areas with heavy annual harvests and a young
female age structure (Comer et al. 2005), as well as in fragmented agricultural landscapes (Nixon
et al. 1991).
Site fidelity of adjacent adult females also is a critical component to the persistence of a
population void. In the Adirondacks, no movements of adjacent animals were detected (Oyer
and Porter 2004). We detected no immigration of adjacent animals in our study. However, no
radiocollared animals with pre-treatment mean telemetry locations <1km from the center of the
removal area survived removal efforts, with the exception of one missed adult female.
Unboubtably our lack of immediately adjacent radiocollared deer is responsible for not detecting

91
immigration of surviving individuals. Based on our telemetry data, 8 of 30 (26.7%) adult
females having pre-treatment mean telemetry locations <2.5 km from the center of the removal
area female deer were significantly closer to the removal area and none of the 30 animals had
mean telemetry locations significantly further away from the removal area after the application
of localized management. Therefore, we conclude that some shift of home-ranges occurred in
response to the population void.
Our results suggest that encroachment from adjacent animals may reduce the persistence
of removal effects in high density deer herds. Except for the single radiocollared adult female
missed during the initial application of localized management, it is unknown how many deer
were left as founding individuals. Of the 31 deer we removed 3 years later, 18 of them were
alive at the time of the initial removal based on their estimated age. Their presence in the
removal area is likely the result of some combination of dispersal into the area or shift from
adjacent areas.
Based on the large number of deer removed three years after the initial removal, localized
management provided, at best, only a short term reduction in deer densities. Although we
removed 31 individuals within an 8-week trapping period, there were additional deer in the
removal area after the conclusion of the second application of localized management.
Approximately 3-weeks after the cessation of removal efforts, West Virginia Department of
Natural Resources personnel observed at least 4 deer within the removal area, and collected an
additional 2.5 year old female. Therefore a minimum of 35 animals resided in the removal area
three years after the initial removal of 51 animals.
In the first summer after treatment application the greatest decline in herbivory rates was
observed for the removal area, although the rate of decline was not statistically different from the
92
other areas. This indicates that the deer removal may have reduced herbivory pressure in the
removal area. However, the herbivory rates of the far control and near control areas also
declined in the following summers until their herbivory rates did not differ from those within the
removal area. Over the study period, the proportion of the study area composed of harvested
areas <10 years old increased from 8% to 14%. Theoretically, increasing ecological carrying
capacity by providing abundant forage across a landscape can reduce overall browsing pressure
(Tilghman and Marquis 1989, Marquis et al. 1992, Ford et al. 1993, Kalen 2005). We believe
this increase in natural forage was responsible for the declines in herbivory rates observed for all
of the removal and control areas.
We conclude that although localized management may have provided a temporary
reduction in herbivory rates, increasing forage availability may be a more effective means of
minimizing the impact of deer herbivory on forest regeneration areas.
MANAGEMENT IMPLICATIONS
We found that the combination of trapping and periodic sharpshooting was effective for
removing deer from a heavily forested remote area. However, our data suggest that a single
application of localized management in high-density deer herds may only provide temporary
reductions of deer-densities despite appearing to fulfill all a priori requirements for localized
management. Repeated removals (every 2 years) or substantially increasing the sizes of removal
areas may be necessary to counter the impacts of encroachment, dispersal, and reproduction of
unharvested individuals in high-density deer populations.
ACKNOWLEDGEMENTS
Financial assistance was provided by the MeadWestvaco Corporation, the West Virginia
Division of Natural Resources, and the USA Department of Agriculture National Research
93
Initiative Competitive Grants Program (grants 00-35101-9284 and 03-35101-13719). We thank
D. A. Osborn, J. L. Crum, and P. D. Keyser for logistical assistance. We also thank the
numerous technicians and volunteers who provided valuable field assistance. The comments of
J. P. Carroll, C. J. Nairn, and R .J. Warren, improved early versions of this manuscript. Deer
were captured and handled under Scientific Collection Permits 43-1999, 16-2000, 2001.008, and
2002.009 from the West Virginia Division of Natural Resources.
LITERATURE CITED
Adams, J. P. 2005. Home range and behavior of the timber rattlesnake (Crotalus horridus).
Thesis, Marshall University, Huntington, West Virginia, USA.
Beringer, J., L. P. Hansen, J. A. Demand, J. Sartwell, M. Wallendorf, and R. Mange. 2002.
Efficacy of translocation to control urban deer in Missouri: costs, efficiency, and
outcome. Wildlife Society Bulletin 30: 767-774.
Campbell, T. A. 2003. Movement ecology of white-tailed deer in the central Appalachians of
West Virginia. Dissertation, University of Georgia, Athens, USA.
Campbell, T. A., B. R. Laseter, W. M. Ford, and K. V. Miller. 2004. Feasibility of localized
management to control white-tailed deer in forest regeneration areas. Wildlife Society
Bulletin 32: 1124-1131.
Campbell, T. A., B. R. Laseter, W. M. Ford, and K. V. Miller. 2005. Population characteristics
of a central Appalachian white-tailed deer herd. Wildlife Society Bulletin 33: 212-221.
Campbell, T. A., C. A. Langdon, B. R. Laseter, W. M. Ford, J. W. Edwards, and K. V. Miller.
2006. Movements of female white-tailed deer to bait sites in West Virginia, USA.
Wildlife Research 33:1-4.

94
Cheatum E.L., and C.W. Severinghaus. 1950. Variations in fertility of white-tailed deer related
to range conditions. Transactions of the North American Wildlife and Natural Resources
Conference. 15:170–190.
Clarkston, R. B. 1993. Destruction of the upland forest by lumbering and fire. Pages 35-46 in
S. L. Stephenson, editor. Upland forest of West Virginia. McClain Printing Company,
Parsons, West Virginia, USA.
Clover, M. R. 1954. A portable deer trap and catch-net. California Fish and Game 40: 367-373.
Comer, C. E., J. C. Kilgo, G. J. D’Angelo, T. G. Glenn, and K. V. Miller. 2005. Fine-scale
genetic structure and social organization in female white-tailed deer. Journal of Wildlife
Management 69: 332-344.
Conover, M. R. 1997. Monetary and intangible valuation of deer in the United States. Wildlife
Society Bulletin 25: 298-305.
Dowdy, S., S. Weardon, and D. Chilko. 2004. Statistics for research. Third edition. John
Wiley and Sons, Inc., Hoboken, New Jersey, USA.
ESRI. 2002. ArcView GIS version 3.3. Environmental Systems Research Institute, Redlands,
California, USA.
Ford, W. M., A. S. Johnson, P. E. Hale, and J. M. Wentworth. 1993. Availability and use of
spring and summer woody browse by deer in clearcut and uncut forests of the southern
Appalachians. Southern Journal of Applied Forestry 17: 116-119.
Fischer, J. R. 1996. White-tailed deer herd health check on the Westvaco Wildlife and
Ecosystem Research Forest. Final Report to the West Virginia Division of Natural
Resources.
95
Hawkins, R. E., L. D. Martoglio, and G. G. Montgomery. 1968. Cannon-netting deer. Journal of
Wildlife Management 32: 191-195.
Hollander, J., and D. A. Wolfe. 1973. Non-parametric statistical methods. John Wiley and
Sons, New York, New York, USA.
Hooge, P. N., and B. Eichenlaub. 1997. Animal movement extension to ARCVIEW. Version
1.1. U.S. Geological Survey, Anchorage, Alaska, USA.
Horsley, S. B, S. L. Stout, and D. S. deCalesta. 2003. White-tailed deer impact on the
vegetation dynamics in northern hardwood forest. Ecological Applications 13: 98-118.
Horsley, S. B., and D. A. Marquis. 1983. Interference by weeds and deer with Allegheny
hardwood reproduction. Canadian Journal of Forest Resources 13: 61-69.
Kalen, C. 2005. Deer browsing and impact on forest development. Journal of Sustainable
Forestry 21: 51-62.
Kie, J. G., J. A. Baldwin, and C. J. Evans. 1996. CALHOME: a program for estimating animal
home ranges. Wildlife Society Bulletin 24: 342-344.
Kilpatrick, H. J., S. M. Spohr, and K. K. Lima. 2001. Effects of population reduction on home
ranges of female white-tailed deer at high densities. Canadian Journal of Zoology 79:
949-954.
Langdon, C. A. 2001. A comparison of white-tailed deer population estimation methods in
West Virginia. Thesis, West Virginia University, Morgantown, West Virginia, USA.
Laseter, B. R. 2004. Sociospatial characteristics and genetic structure of white-tailed deer in the
central Appalachians of West Virginia. Dissertation, University of Georgia, Athens,
USA.

96
Marquis, D. A. 1974. The impact of deer browsing on Allegheny hardwood regeneration. U.S.
Department of Agriculture, Forest Service, General Technical Report NE-308.
Marquis, D. A. 1981. The effect of deer browsing on timber production in Allegheny hardwood
forests of northwestern Pennsylvania. U.S. Department of Agriculture, Forest Service,
General Technical Report NE-475.
Marquis, D. A., R. L. Ernst, and S. L. Stout. 1992. Prescribing silvicultural treatments in
hardwood stands of the Alleghenies (revised). U.S. Department of Agriculture, Forest
Service, General Technical Report NE-96.
Mathews, N. E. 1989. Social structure, genetic structure, and anti-predator behavior of white-
tailed deer in the Central Adirondacks. Dissertation, State University of New York,
Syracuse, New York, USA.
Mathews, N. E., and W. F. Porter. 1993. Effect of social structure on genetic structure of free-
ranging white-tailed deer in the Adirondack Mountains. Journal of Mammalogy 74: 33-
43.
McCullough, D. R. 1979. The George Reserve deer herd: population ecology of a K-selected
species. University of Michigan Press, Ann Arbor, Michigan, USA.
McNulty, S. A., W. F. Porter, N. E. Mathews, and J. A. Hill. 1997. Localized management for
reducing white-tailed deer populations. Wildlife Society Bulletin 25: 265-271.
McShea, W. J., and J. H. Rappole. 1997a. Herbivores and the ecology of forest understory
birds. Pages 298-309 in W. J. McShea, H. B. Underwood, and J. H. Rappole, editors.
The science of overabundance: deer ecology and population management. Smithsonian
Institution, Washington D. C., USA.
97
McShea, W. J., and J. H. Rappole. 1997b. The science and politics of managing deer within a
protected area. Wildlife Society Bulletin 25: 443-446.
McShea, W. J., and J. H. Rappole. 2000. Managing the abundance and diversity of breeding
bird populations through manipulation of deer populations. Conservation Biology 14:
1161-1170.
McWilliams, W. H., S. L. Stout, T. W. Bowersox, and L. H. McCormick. 1995. Adequacy of
advance tree-seedling regeneration in Pennsylvania’s forests. Northern Journal of
Applied Forestry 12: 187-191.
Merrill, J. A., E. G. Cooch, and P. D. Curtis. 2006. Managing an overabundant deer population
by sterilization: effects of immigration, stochasticity, and the capture process. Journal of
Wildlife Management 70: 268-277.
Miller, K. V. 1997. Considering social behavior in the management of overabundant white-
tailed deer populations. Wildlife Society Bulletin 25: 279-281.
Nixon, C. M., L. P. Hansen, P. A. Brewer, and J. E. Chelsvig. 1991. Ecology of white-tailed
deer in an intensively farmed region of Illinois. Wildlife Monographs 118: 1-77.
Oyer, A. M., and W. F. Porter. 2004. Localized management of white-tailed deer in the central
Adirondack Mountains, New York. Journal of Wildlife Management 68: 257-265.
Porter, W. F., N. E. Mathews, H. B. Underwood, R. W. Sage, and D. F. Behrend. 1991. Social
organization in deer: implications for localized management. Environmental
Management 15: 809-814.
Porter, W. F., H. B. Underwood, and J. L. Woodard. 2004. Movement behavior, dispersal, and
the potential for localized management of deer in a suburban environment. Journal of
Wildlife Management 68: 247-256.
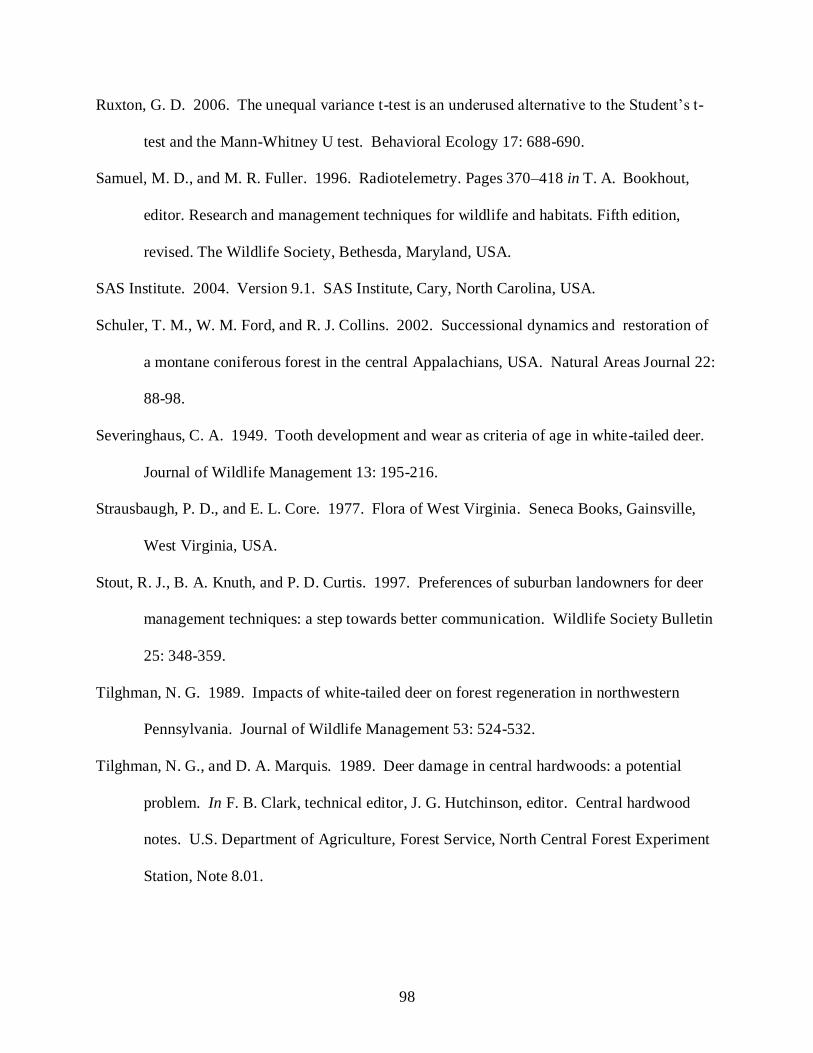
98
Ruxton, G. D. 2006. The unequal variance t-test is an underused alternative to the Student’s t-
test and the Mann-Whitney U test. Behavioral Ecology 17: 688-690.
Samuel, M. D., and M. R. Fuller. 1996. Radiotelemetry. Pages 370–418 in T. A. Bookhout,
editor. Research and management techniques for wildlife and habitats. Fifth edition,
revised. The Wildlife Society, Bethesda, Maryland, USA.
SAS Institute. 2004. Version 9.1. SAS Institute, Cary, North Carolina, USA.
Schuler, T. M., W. M. Ford, and R. J. Collins. 2002. Successional dynamics and restoration of
a montane coniferous forest in the central Appalachians, USA. Natural Areas Journal 22:
88-98.
Severinghaus, C. A. 1949. Tooth development and wear as criteria of age in white-tailed deer.
Journal of Wildlife Management 13: 195-216.
Strausbaugh, P. D., and E. L. Core. 1977. Flora of West Virginia. Seneca Books, Gainsville,
West Virginia, USA.
Stout, R. J., B. A. Knuth, and P. D. Curtis. 1997. Preferences of suburban landowners for deer
management techniques: a step towards better communication. Wildlife Society Bulletin
25: 348-359.
Tilghman, N. G. 1989. Impacts of white-tailed deer on forest regeneration in northwestern
Pennsylvania. Journal of Wildlife Management 53: 524-532.
Tilghman, N. G., and D. A. Marquis. 1989. Deer damage in central hardwoods: a potential
problem. In F. B. Clark, technical editor, J. G. Hutchinson, editor. Central hardwood
notes. U.S. Department of Agriculture, Forest Service, North Central Forest Experiment
Station, Note 8.01.

99
von Ende, C. N. 1993. Repeated-measures analysis: growth and other time dependent measures.
Pages 113–137 in S. M. Scheiner and J. Gurevitch, editors. Design and analysis of
ecological experiments. Chapman and Hall, New York, New York, USA.
Waller, D. M., and W. S. Alverson. 1997. The white-tailed deer: a keystone herbivore. Wildlife
Society Bulletin 25: 217-225.
Warren, R .J. 1991. Ecological justification for controlling deer populations in eastern national
parks. In: Transactions of the 56th
North American Wildlife and Natural Resources
Conference, pp. 56–66.
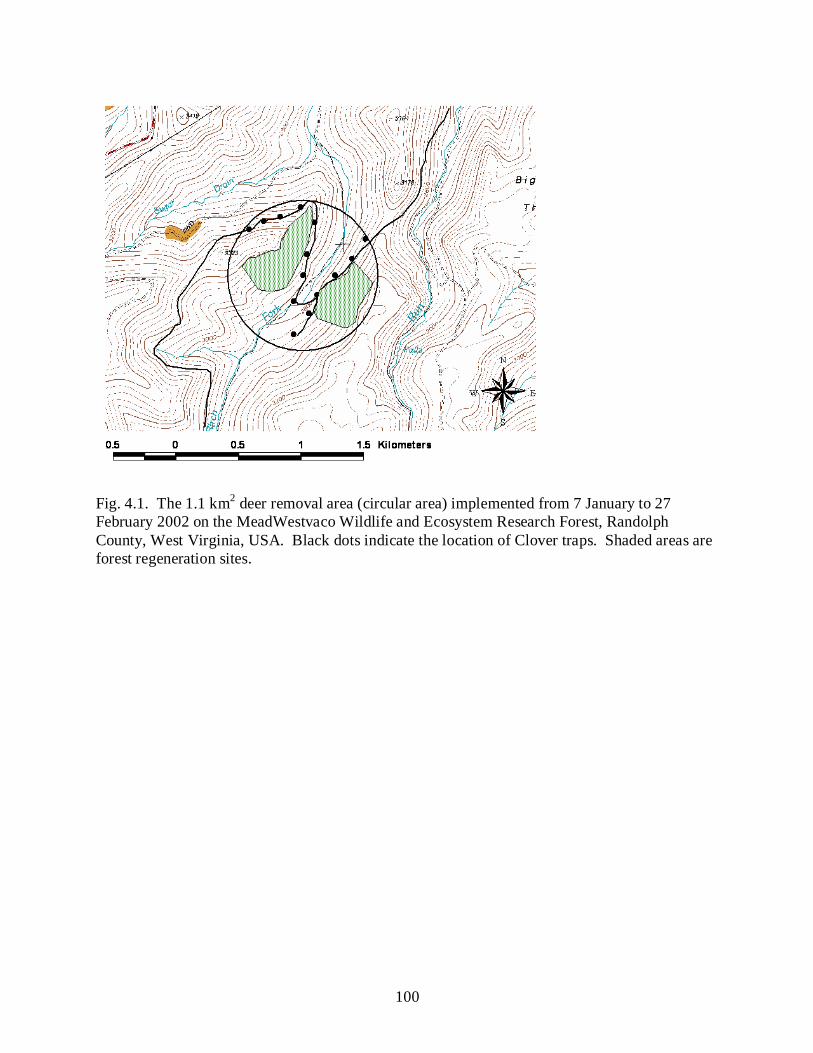
100
Fig. 4.1. The 1.1 km2 deer removal area (circular area) implemented from 7 January to 27
February 2002 on the MeadWestvaco Wildlife and Ecosystem Research Forest, Randolph
County, West Virginia, USA. Black dots indicate the location of Clover traps. Shaded areas are
forest regeneration sites.
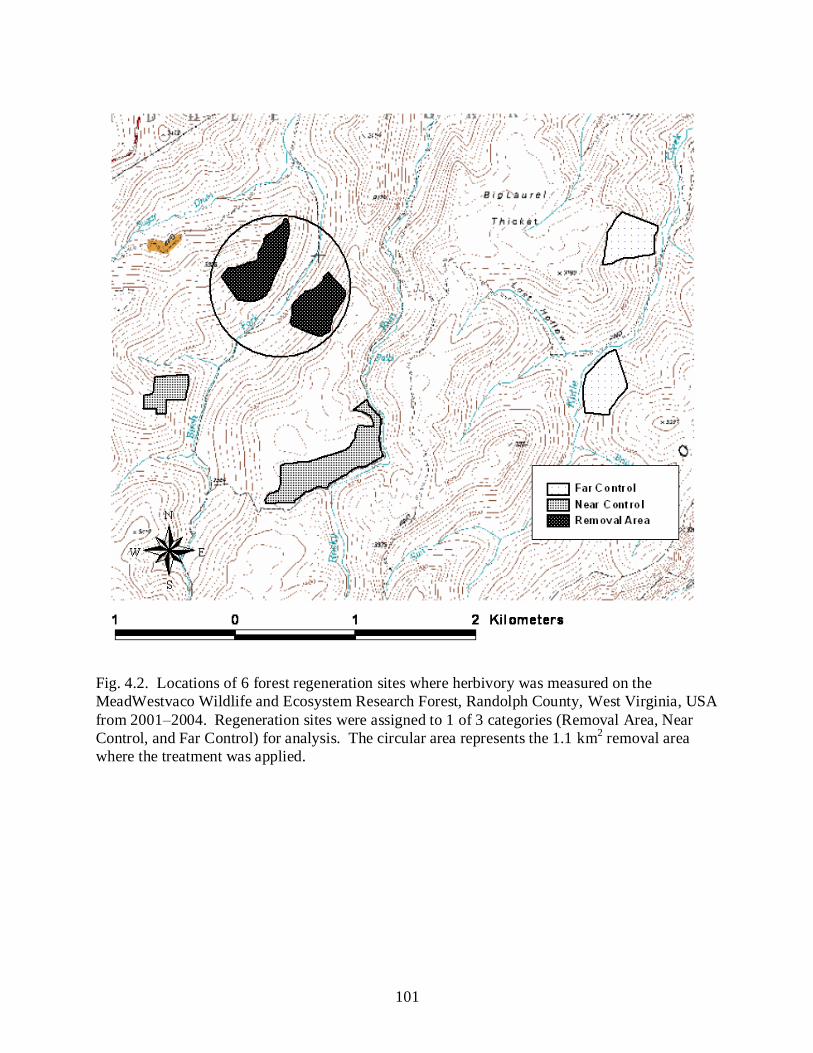
101
Fig. 4.2. Locations of 6 forest regeneration sites where herbivory was measured on the
MeadWestvaco Wildlife and Ecosystem Research Forest, Randolph County, West Virginia, USA
from 2001–2004. Regeneration sites were assigned to 1 of 3 categories (Removal Area, Near
Control, and Far Control) for analysis. The circular area represents the 1.1 km2 removal area
where the treatment was applied.
102
0
2
4
6
8
10
12
14
16
18
0.5 1.5 2.5 3.5 4.5 5.5 6.5+
Age
Nu
mb
er
of
Ind
ivid
uals
female
male
Fig. 4.3. Estimated ages of male and female white-tailed deer removed from a 1.1 km
2
experimental removal area from 7 January to 27 February 2002 on the MeadWestvaco Wildlife
and Ecosystem Research Forest, Randolph County, West Virginia, USA.
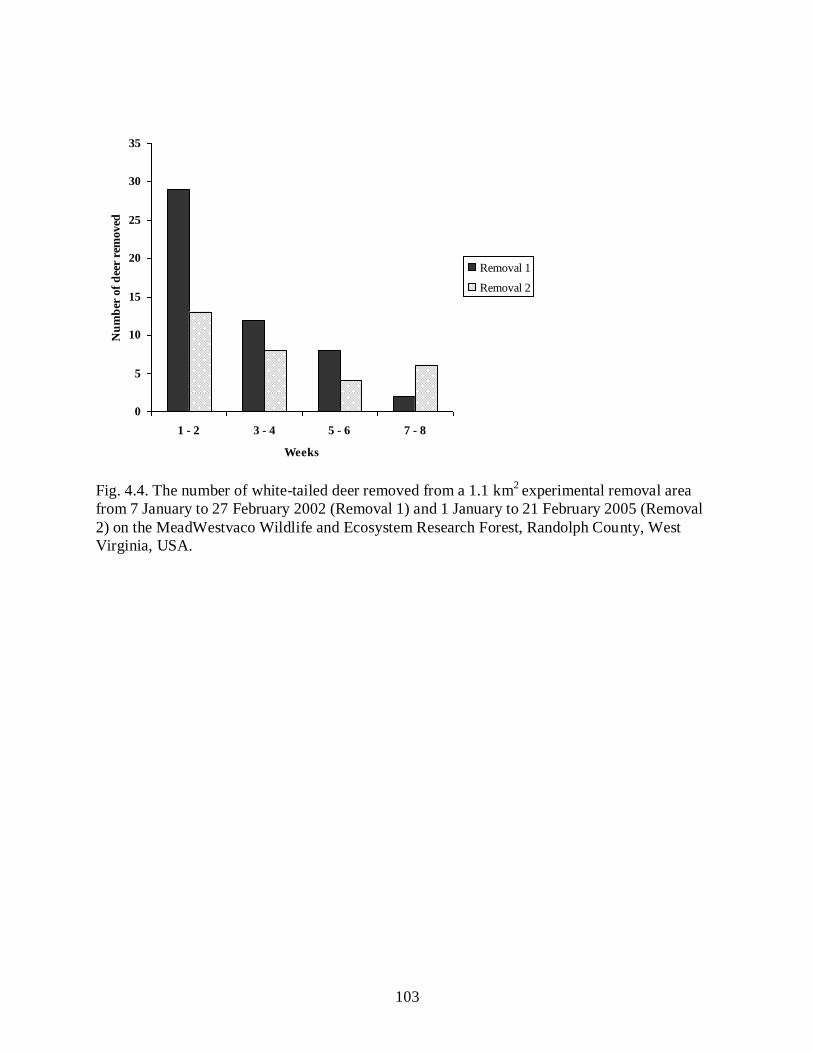
103
Fig. 4.4. The number of white-tailed deer removed from a 1.1 km2
experimental removal area
from 7 January to 27 February 2002 (Removal 1) and 1 January to 21 February 2005 (Removal
2) on the MeadWestvaco Wildlife and Ecosystem Research Forest, Randolph County, West
Virginia, USA.
0
5
10
15
20
25
30
35
1 - 2 3 - 4 5 - 6 7 - 8
Weeks
Nu
mb
er o
f d
eer
rem
oved
Removal 1
Removal 2
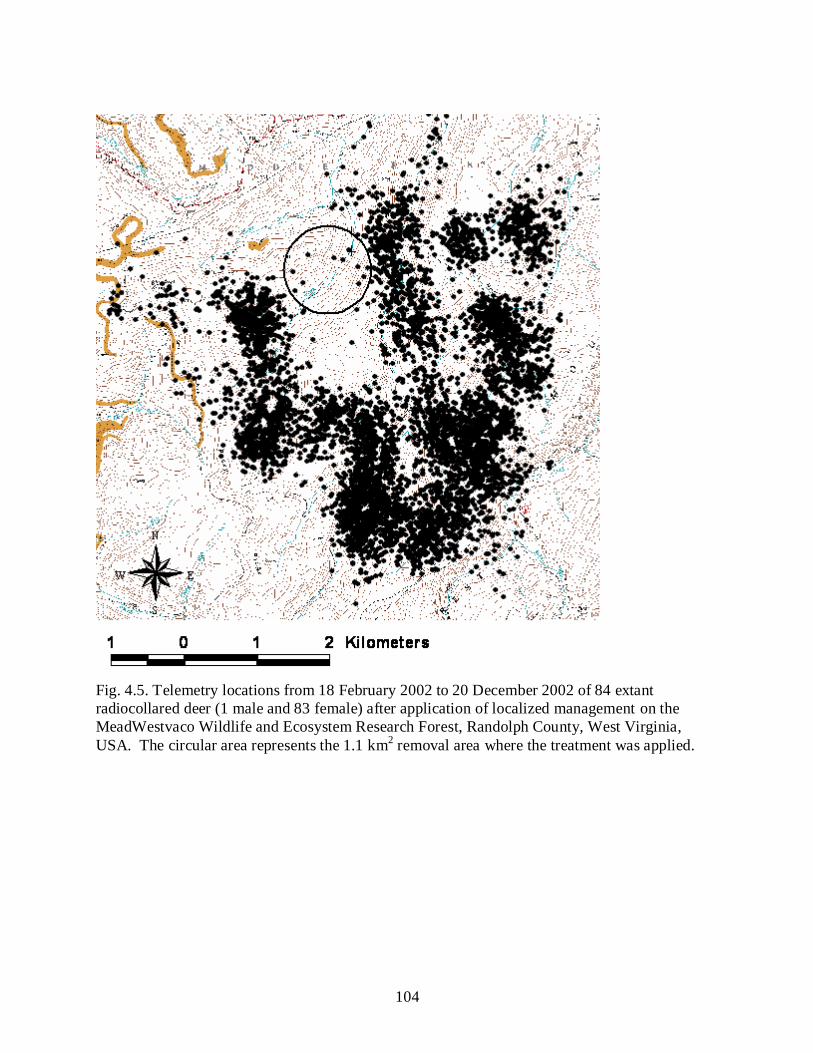
104
Fig. 4.5. Telemetry locations from 18 February 2002 to 20 December 2002 of 84 extant
radiocollared deer (1 male and 83 female) after application of localized management on the
MeadWestvaco Wildlife and Ecosystem Research Forest, Randolph County, West Virginia,
USA. The circular area represents the 1.1 km2 removal area where the treatment was applied.
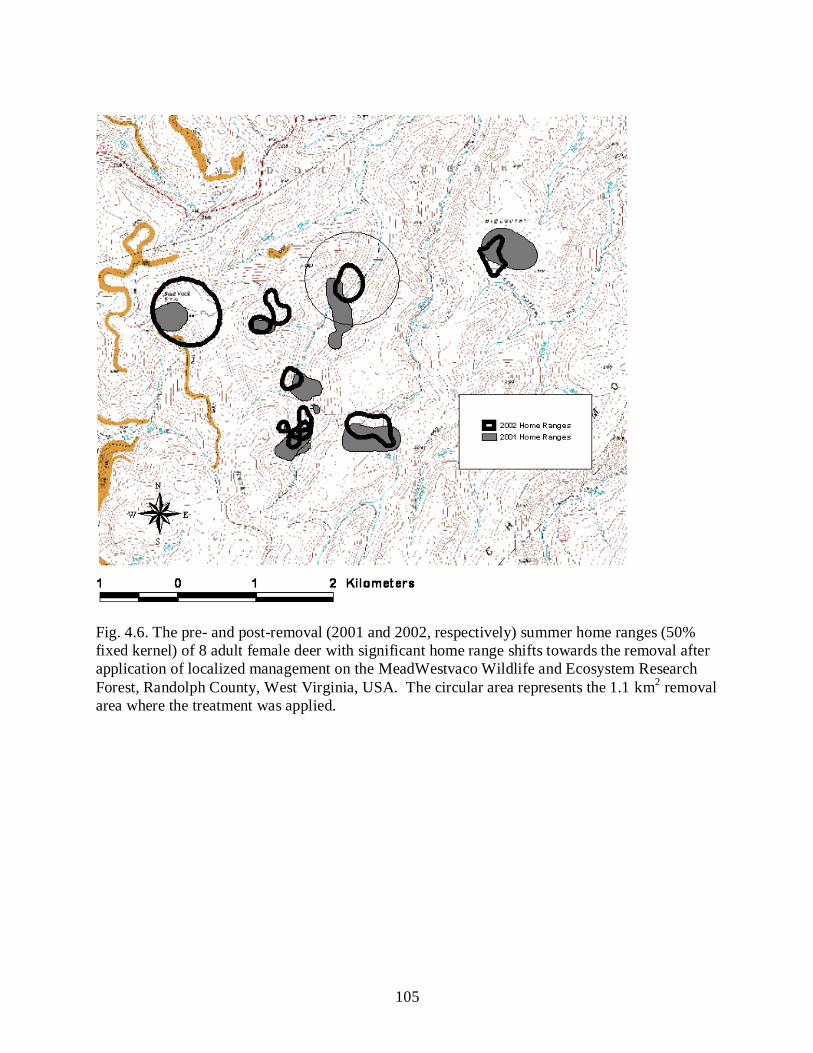
105
Fig. 4.6. The pre- and post-removal (2001 and 2002, respectively) summer home ranges (50%
fixed kernel) of 8 adult female deer with significant home range shifts towards the removal after
application of localized management on the MeadWestvaco Wildlife and Ecosystem Research
Forest, Randolph County, West Virginia, USA. The circular area represents the 1.1 km2 removal
area where the treatment was applied.
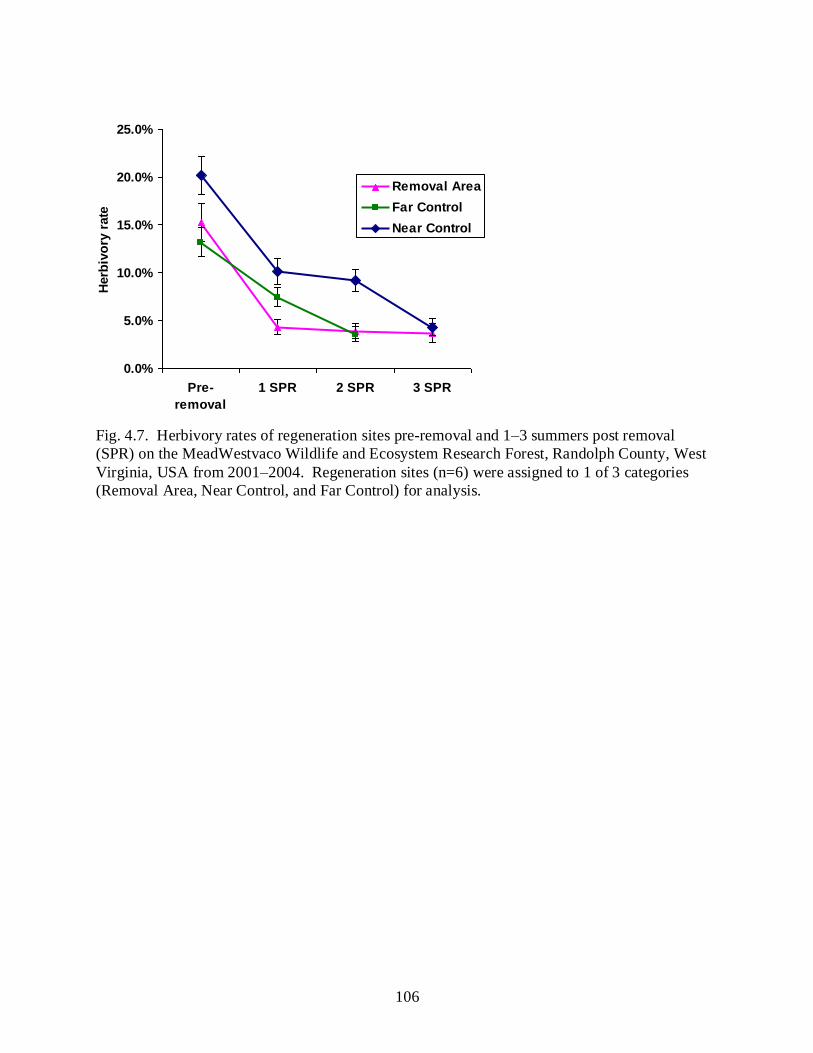
106
Fig. 4.7. Herbivory rates of regeneration sites pre-removal and 1–3 summers post removal
(SPR) on the MeadWestvaco Wildlife and Ecosystem Research Forest, Randolph County, West
Virginia, USA from 2001–2004. Regeneration sites (n=6) were assigned to 1 of 3 categories
(Removal Area, Near Control, and Far Control) for analysis.
0.0%
5.0%
10.0%
15.0%
20.0%
25.0%
Pre-
removal
1 SPR 2 SPR 3 SPR
Herb
ivo
ry r
ate
Removal Area
Far Control
Near Control
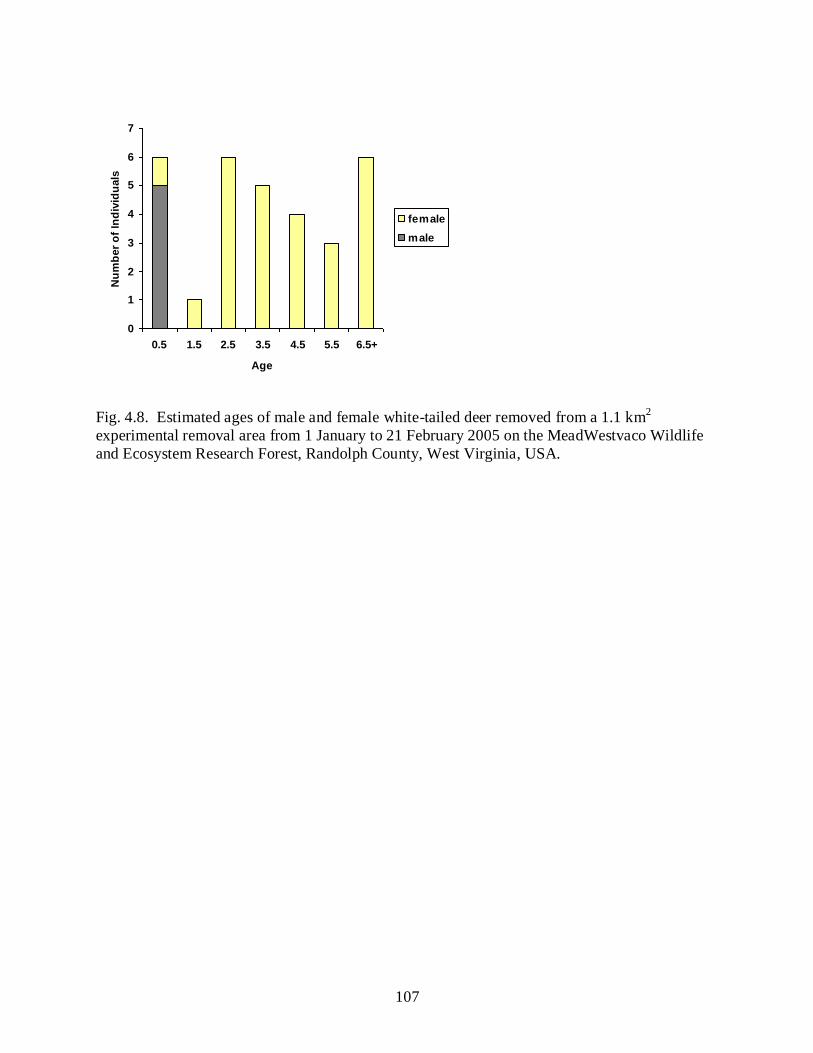
107
Fig. 4.8. Estimated ages of male and female white-tailed deer removed from a 1.1 km2
experimental removal area from 1 January to 21 February 2005 on the MeadWestvaco Wildlife
and Ecosystem Research Forest, Randolph County, West Virginia, USA.
0
1
2
3
4
5
6
7
0.5 1.5 2.5 3.5 4.5 5.5 6.5+
Age
Nu
mb
er
of
Ind
ivid
uals
female
male
108
CHAPTER 5
POPULATION DIFFERENTIATION OF WHITE-TAILED DEER
FOLLOWING AN APPLICATION OF LOCALIZED MANAGEMENT1
1 Miller, B. F., R. W. DeYoung, T. A. Campbell, B. R. Laseter, W. M. Ford, and K. V. Miller. To be submitted to
the Journal of Wildlife Management.

109
Abstract: Localized management has been proposed as an alternative management technique
for reducing conflicts of overabundant deer populations. The effectiveness of this technique
depends on site fidelity and philopatry of adjacent females. To assess this, we compared the
genetic relatedness of deer removed from a 1.1 km2 removal area with deer collected three years
later from the same removal area (i.e., repopulating animals). We found evidence of population
differentiation based on significant Wright’s Fst, Wright’s Fis, and Hardy-Weinberg
disequilibrium tests. Our evidence of repopulation by immigrant deer suggests that social
behaviors of females in high density herds may not prevent repopulation of removal areas by
surrounding animals.
Key words: genetics, F-statistics, localized management, microsatellites, Odocoileus virginianus,
West Virginia, white-tailed deer.
INTRODUCTION
Localized management has been proposed as an alternative deer management technique
that relies on the social organization of female white-tailed deer (Odocoileus virginianus) to
reduce the negative social and ecological effects of overabundant deer populations. White-tailed
deer social organization is structured as matriarchal social groups containing adult females and
several generations of offspring inhabiting overlapping home ranges (Hawkins and Klimstra
1970, Hirth 1977, Mathews and Porter 1993). These social groups are formed as a result of
infrequent (2-20%) dispersal of juvenile females, and philopatric home range formation of
juvenile females (Mathews 1989, Tierson et al. 1995, Campbell et al. 2005). Social groups

110
persist due to association of members throughout the year with the exception of the fawning
season (Hawkins and Klimstra 1970).
Localized management proposes the ―surgical‖ removal of a matriarchal social group(s)
from a limited geographical area to create a 10–15 year period of reduced deer density (Porter et
al. 1991). The persistence of the void depends on the encroachment of adjacent social groups,
colonization by immigrant deer, and the number of animals surviving the removal efforts (Porter
et al. 1991, McNulty et al. 1997, Oyer and Porter 2004, Miller 2008). This technique is intended
to alleviate negative impacts of overabundant deer populations in specific areas rather than a
more traditional widespread reduction in deer population density.
The first experimental application of the localized management was performed by
McNulty et al. (1997) in the Adirondack Mountains on an unhunted, seasonally migratory, and
low-density population. A subsequent investigation of the removal area indicated deer densities
were reduced for a period of 5 years (Oyer and Porter 2004). Repopulating animals were
offspring of animals surviving the removal efforts or immigrants from adjacent social groups
(Oyer and Porter 2004). The results of that study suggest that localized management may be a
viable alternative management technique where traditional approaches are unsuitable.
Still, it has been cautioned that behavioral plasticity may limit the universal applicability
of behavior-based management techniques (Miller 1997, Comer et al. 2005). To investigate the
utility of localized management in a situation representative of where deer-human conflicts
occur, Miller (2008) conducted a test of this technique on a high-density deer population in the
central Appalachian Mountains of West Virginia. That investigation reported that localized
management provided only temporary, localized density reductions in high-density deer
111
populations. However, the origin of repopulating animals within the removal area was not fully
understood using traditional research techniques (e.g., radio-telemetry, visual observations, etc.).
The development of microsatellite DNA markers (Anderson et al. 2002) has allowed the
generation of new information about the social behavior of white-tailed deer. Previous
examinations of white-tailed deer ecology using molecular techniques have relied on allozyme
markers (e.g., Mathews and Porter 1993, Scribner et al. 1997). However, use of microsatellite
DNA loci allows increased precision for examining fine-scale genetic patterns (Anderson et al.
2002, DeYoung and Honeycutt 2005). Microsatellite data from white-tailed deer has been used
successfully in paternity testing (DeYoung et al. 2002), investigations of spatial genetic
structuring (Comer et al. 2005, Miller 2008), and assignment of individuals to specific
populations (DeYoung et al. 2003). In this study, we used genetic markers to examine the origin
of repopulating animals following Miller’s (2008) application of localized management. Our
objective was to compare the genetic relatedness of white-tailed deer removed during an
application of localized management with animals collected three years later from the same
removal area (i.e., repopulating animals) to help determine the origin of recolonizers.
Secondarily, we sough to use these data to identify the possible limitations of the localized
management technique.
STUDY AREA
Our study was conducted on the 3,413 ha MeadWestvaco Wildlife and Ecosystem
Research Forest (MWWERF) located in Randolph County, West Virginia (38°42’N, 80°3’W).
The MWWERF was located within the Unglaciated Alleghany Mountain and Plateau
Physiographic province characterized by steep slopes and narrow valleys. Elevations ranged
from 700 to 1,200 m and precipitation averaged between 170 and 190 cm/year primarily as snow
112
fall. The forest cover type was predominantly an Allegheny hardwood-northern hardwood type
(Keyser and Ford 2005). An investigation of the white-tailed deer population initiated in 1999
on the MWWERF indicated that the herd was characterized as a moderate to high density
population with low female dispersal, high female survival, and male-biased hunting harvests.
An extensive review of the study site and deer population is provided in Campbell (2003).
METHODS
We removed deer from a circular 1.1 km2 area selected to encompass a targeted social
group delineated from radio-telemetry, encompass two forest regeneration sites, and approximate
the spatial scale of genetic variation previously determined (Laseter 2004). We captured deer via
modified Clover traps (Clover 1954) baited with whole kernel corn from 7 January to 27
February 2002 (Removal 1). Intramuscular injections of succinylcholine chloride were
administered to captured animals prior to euthanasia via a captive bolt gun upon recumbency.
Periodic sharpshooting was conducted by West Virginia Department of Natural Resources
personnel to remove trap-reluctant individuals after 4 weeks of trapping. Trapping data and
observation of deer tracks in the snow were used to determine when to cease removal efforts. We
conducted a second removal (Removal 2) from 1 January to 21 February 2005 utilizing the same
trapping methods and duration as the initial removal. A detailed description of removal methods
is available in Miller (2008).
Ear-notch tissue was collected from euthanized animals and placed in sterile glass tubes
containing 8 ml of 95% ethanol, and allowed to fix at 4°C for ≥24 hours then stored at room
temperature. Total DNA was extracted from tissue samples using Qiagen®
DNeasy™ Blood and
Tissue Kit (Qiagen, Inc., Valencia, California). Standard protocols were used except that we

113
allowed 24 hrs for tissue lysis by proteinase K, and only 100µl of buffer AE was added to the
membrane of the mini spin columns.
We selected a panel of 14 microsatellite loci from the 21 identified for use in white-tailed
deer (Anderson et al. 2002). The BM145, BM203, BovPRL, ETH152, K, OCAM, and R loci
were omitted. DNA fragments were amplified by polymerase chain reaction (PCR) following
methods by Anderson et al. (2002) and subjected to capillary electrophoresis on an ABI PRISM®
3130 Genetic Analyzer (Applied Biosystems, Foster City, California). Alleles were
characterized by GeneMapper™ software (Applied Biosystems) followed by visual inspection
and verification.
To compare genetic characteristics of the Removal 1 population with the Removal 2
population we calculated gene diversity (Nei 1987), allelic richness (El Mousadik and Petit
1996), and number of alleles. We tested for deviations from Hardy-Weinberg equilibrium for
each population at each locus and overall by permuting alleles among individuals 280 times
within samples. Significance testing was corrected for multiple comparisons using the sequential
Bonferroni technique (Rice 1989). An overall Wright’s Fis value was calculated for each
population after 560 randomizations of alleles. Population differentiation was examined using
Wright’s (1951, 1969) Fst according to the methods of Weir and Cockerham (1984). Standard
errors were estimated by jackknifing across loci, and significance was confirmed by permuting
genotypes across samples 20 times. To assess if the differentiation between the 2 populations
was biologically based and not an artifact of sample size disparity, we arbitrarily divided the
Removal 1 population into 2 samples and estimated Fst as before. All analyses were conducted
using the computer program FSTAT ver. 2.9.3 (Goudet 1995).
114
RESULTS
During Removal 1, we removed 51 deer ranging in ages from 0.5-8.5+ years. Females
comprised the majority of the animals (39 of 51), with a mean (± SE) age of 3.7±0.4 years (range
= 0.5–8.5+ years old). The mean age was lower for males (0.9±0.3 years old) because most
males were fawns (9 of 12). Male ages ranged from 0.5–3.5 years old. Genetic samples were
not obtained from 3 females collected during the removal efforts resulting in a final sample of 48
individual genotypes. Based on track counts in the snow and radio-monitored animals (n=9),
>80% of the deer population was removed.
During Removal 2 we collected 31 deer ranging in ages from 0.5–8.5+ years using the
same techniques and trapping duration as Removal 1. Females again comprised the majority of
the animals removed (26 of 31). The mean age of females was 4.5 ± 0.5 years (range = 0.5–
8.5+). Eighteen of the females were ≥3.5 years of age. All 5 males removed were fawns (0.5
years). The genetic data of 1 additional 2.5 year old female collected approximately 3 weeks
after the cessation of the Removal 2 trapping period by West Virginia Department of Natural
Resources personnel was included in the analysis resulting in a final sample size of 32 individual
genotypes.
Estimates of within-population genetic diversity indicated that the 14 microsatellite loci
examined were highly polymorphic (Table 5.1). A total of 162 unique alleles were observed
between the Removal 1 and Removal 2 populations. The number of alleles per locus ranged
from 3–18 for the two populations. Allelic richness per locus ranged from 3.0–14.7 and 3.7–15.5
for the Removal 1 and Removal 2 populations, respectively. Gene diversity ranged from 0.39–
0.92 and 0.43–0.92 for the Removal 1 and Removal 2 populations, respectively.
115
Locus specific Hardy-Weinberg equilibrium tests detected deviation in 1 locus (BM848)
for the Removal 1 population. No locus specific departures from Hardy-Weinberg were detected
in the Removal 2 population. A slight overall departure (P=0.05) from Hardy-Weinberg
equilibrium was detected for the Removal 1 population, however no overall departure (P=0.318)
was detected for the Removal 2 population.
The overall Wright’s Fis value was statistically significant in the Removal 1 population
(Fis=0.031, P=0.037), but not in the Removal 2 population (Fis=0.009, P=0.339). A low but
statistically significant (P<0.05) Wright’s Fst value was detected between the 2 populations
(Fst=0.011, SE=0.005). Subsequent Fst analysis of the Removal 1 population after arbitrary
division detected no difference from 0.0 (Fst=0.005, SE=0.004). The test for differentiation also
detected no difference between the populations (P=0.25) and discounts sample size disparity as a
source of statistical significance.
DISCUSSION
Mathews (1989) reported that female social groups in the central Adirondack Mountains
of New York were composed of an older female whose home range was overlapped by several
generations of female offspring forming a social unit similar in shape to the petals of a rose. A
subsequent genetic examination of social groups on that study site (Mathews and Porter 1993)
confirmed the presence of genetic structure at the level of a social group attributed to female
philopatry.
In contrast, Comer et al. (2005) found only limited evidence for spatial genetic
structuring in a population of white-tailed deer in the Upper Coastal Plain of South Carolina. A
history of intensive harvests and young age structure among does may have limited the formation
of persistent, cohesive social groups. They concluded that exploited populations do not expand
116
by the addition of outwardly radiating home ranges of new offspring as predicted by the rose
petal hypothesis. Rather, some populations may expand similarly to the ―gas diffusion‖
population expansion model, where deer move from high-density areas to lower-density areas
(Porter et al. 1991).
The preliminary examination of the spatial genetic structure of the white-tailed deer on
our study site confirmed that genetic relatedness was inversely related to the geographic
distances between individuals (Miller 2008). We also attributed those findings to spatial fidelity
of matrilineal social groups resulting from philopatric female offspring in accordance with the
rose petal hypothesis. Therefore, the study site met the requirement of localized management
that assumes spatial genetic structure of female white-tailed deer due to philopatry and low
dispersal.
The results from our current investigation of the genetic relatedness within the Removal
1 population provide additional evidence of spatial genetic structuring. The Hardy-Weinberg
equilibrium test performed detected a slight heterozygote deficiency in the Removal 1
populations. Anderson et al. (2002) reported that deviations from Hardy-Weinberg equilibrium
can be attributed sampling of related individuals. Furthermore the Wright’s Fis test was
significant in the Removal 1 population indicating some degree of inbreeding due to philopatric
behaviors of related females. Therefore, we expected that population expansion after the
application of localized management would occur in accordance with the predictions of the rose-
petal hypothesis. Oyer and Porter (2004) reported that none of the repopulating animals in a
1.4km2 removal area implemented by McNulty et al. (1997) were likely dispersers from distant
areas. Rather, they concluded that the repopulating animals originated from the removal area or
areas immediately adjacent to it.
117
In contrast, the genetic evaluation of our Removal 2 population detected no evidence to
support the prediction that repopulating animals originated from within the removal area. No
single locus or population-wide deviations from Hardy Weinberg equilibrium were detected, and
no inbreeding was detected by Fis testing. The decrease in Fis of the Removal 2 population is
consistent with immigration of unrelated deer into the removal area. Additionally, Wright’s Fst
test of the Removal 1 and Removal 2 populations was significant, indicating differences in allele
frequencies. Thus, repopulating deer were not individuals that survived removal efforts, but
rather were unrelated animals with dissimilar genetic characteristics. Of the 32 deer in the
Removal 2 population, 18 of them were alive at the time of the initial removal based on age
estimations (Severinghaus 1949). It is unlikely that all of these animals survived the initial
removal efforts, which provides further evidence of immigration into the area by unrelated
animals. Therefore, we conclude that repopulation of the removal area did not occur by
reproduction of missed animals as in the Adirondack studies (Oyer and Porter 2004). Instead the
rapid colonization of the removal area suggests an influx of females from the surrounding
landscape.
Site fidelity of female offspring is initially advantageous to both the mother and her
young. The maternal investment increases the chance of survival of offspring and its future
reproductive potential (Trivers 1974). However, mothers would be expected to decrease their
investment as offspring mature, and expending resources on additional young becomes
ultimately more beneficial. Hawkins and Klimstra (1970) reported that 82% of doe pairs have
separated socially by the time the younger member reaches 3 years of age. Furthermore Nelson
and Mech (1984) found that after 3 years of age, social interactions and paired migration ceased
between a mother and daughter.
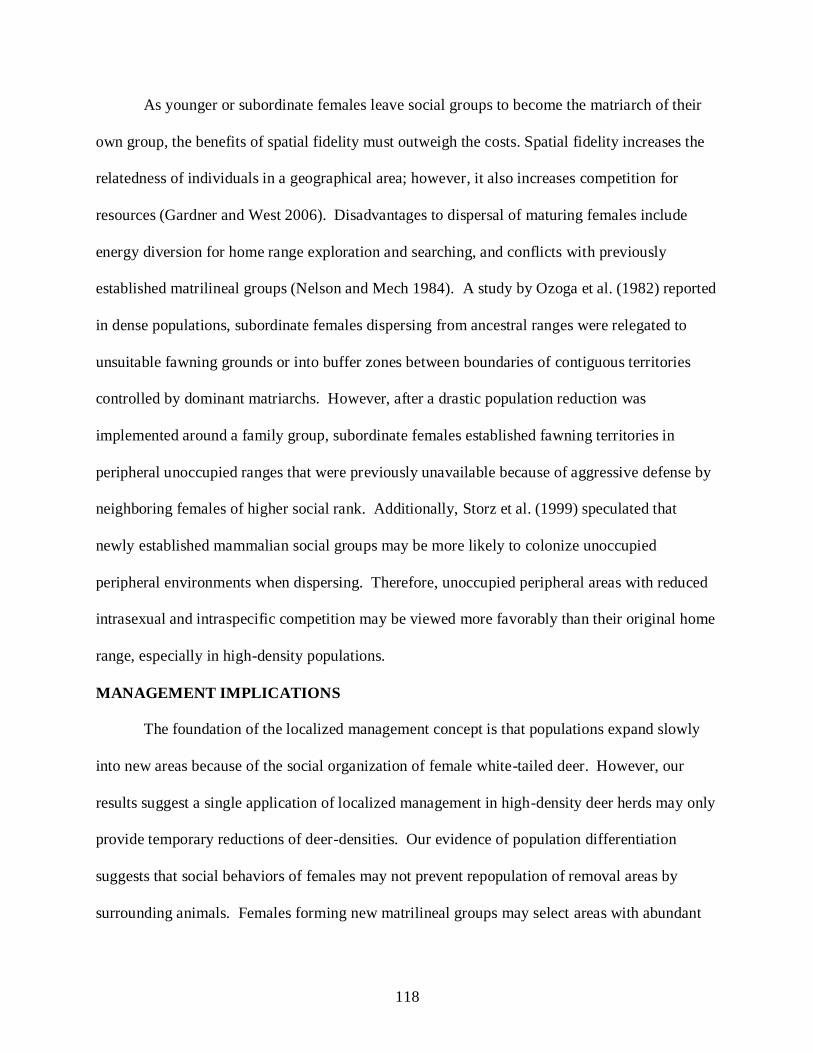
118
As younger or subordinate females leave social groups to become the matriarch of their
own group, the benefits of spatial fidelity must outweigh the costs. Spatial fidelity increases the
relatedness of individuals in a geographical area; however, it also increases competition for
resources (Gardner and West 2006). Disadvantages to dispersal of maturing females include
energy diversion for home range exploration and searching, and conflicts with previously
established matrilineal groups (Nelson and Mech 1984). A study by Ozoga et al. (1982) reported
in dense populations, subordinate females dispersing from ancestral ranges were relegated to
unsuitable fawning grounds or into buffer zones between boundaries of contiguous territories
controlled by dominant matriarchs. However, after a drastic population reduction was
implemented around a family group, subordinate females established fawning territories in
peripheral unoccupied ranges that were previously unavailable because of aggressive defense by
neighboring females of higher social rank. Additionally, Storz et al. (1999) speculated that
newly established mammalian social groups may be more likely to colonize unoccupied
peripheral environments when dispersing. Therefore, unoccupied peripheral areas with reduced
intrasexual and intraspecific competition may be viewed more favorably than their original home
range, especially in high-density populations.
MANAGEMENT IMPLICATIONS
The foundation of the localized management concept is that populations expand slowly
into new areas because of the social organization of female white-tailed deer. However, our
results suggest a single application of localized management in high-density deer herds may only
provide temporary reductions of deer-densities. Our evidence of population differentiation
suggests that social behaviors of females may not prevent repopulation of removal areas by
surrounding animals. Females forming new matrilineal groups may select areas with abundant
119
resources (e.g., timber harvests) and reduced competition, thus limiting the persistence of the
void. In high-density deer populations we recommend either repeated deer removals of every 2–
3 years on localized sites, or larger landscape-level decreases of deer density to prevent the
negative effects of overabundant deer.
ACKNOWLEDGMENTS
Financial assistance was provided by the MeadWestvaco Corporation, the West Virginia
Division of Natural Resources, and the US Department of Agriculture National Research
Initiative Competitive Grants Program (grants 00-35101-9284 and 03-35101-13719). We thank
B. Faircloth for laboratory assistance, and J. L. Crum, P. D. Keyser, and D. A. Osborn for
logistical assistance. We also thank the numerous field technicians and volunteers that helped
with sample collections. The comments of J. P. Carroll, C. J. Nairn, and R. J. Warren improved
early versions of this manuscript. Deer were captured and handled under Scientific Collection
Permits from the West Virginia Division of Natural Resources.
LITERATURE CITED
Anderson, J. D., R. L. Honeycutt, R. A. Gonzales, K. L. Gee, L. C. Skow, R. L. Gallagher, D. A.
Honeycutt, and R. W. DeYoung. 2002. Development of microsatellite DNA markers for
the automated genetic characterization of white-tailed deer populations. Journal of
Wildlife Management 66:67-74.
Campbell, T. A. 2003. Movement ecology of white-tailed deer in the central Appalachians of
West Virginia. Dissertation, University of Georgia, Athens, USA.
Campbell, T. A., B. R. Laseter, W. M. Ford, and K. V. Miller. 2005. Population characteristics
of a central Appalachian white-tailed deer herd. Wildlife Society Bulletin 33:212-221.
Clover, M. R. 1954. A portable deer trap and catch-net. California Fish and Game 40:367-373.
120
Comer, C. E., J. C. Kilgo, G. J. D’Angelo, T. G. Glenn, and K. V. Miller. 2005. Fine-scale
genetic structure and social organization in female white-tailed deer. Journal of Wildlife
Management 69:332-344.
DeYoung, R. W., S. Demarais, R. A. Gonzales, R. L. Honeycutt, and K. L. Gee. 2002. Multiple
paternity in white-tailed deer (Odocoileus virginianus) revealed by DNA microsatellites.
Journal of Mammalogy 83:884-892.
DeYoung, R. W., S. Demarais, R. L. Honeycutt, R. A. Gonzales, K. L. Gee, and J. D. Anderson.
2003. Evaluation of a DNA microsatellite panel for genetic exclusion studies in white-
tailed deer. Wildlife Society Bulletin 31:220-232.
DeYoung, R. W., and R. L. Honeycutt. 2005. The molecular toolbox: genetic techniques in
wildlife ecology and management. Journal of Wildlife Management 69:1362-1384.
El Mousadik, A., and R. J. Petit. 1996. High level of genetic differentiation for allelic richness
among populations of the argan tree [Argania spinos (L.) Skeels] endemic to Morocco.
Theoretical and Applied Genetics 92:832-839.
Gardner, A., and S. A. West. 2006. Demography, altruism, and the benefits of budding. Journal
of Evolutionary Biology 19:1707-1716.
Hawkins, R. E., and W. D. Klimstra. 1970. A preliminary study of the social organization of
white-tailed deer. Journal of Wildlife Management 34:407-419.
Hirth, D. H. 1977. Social behavior of white-tailed deer in relation to habitat. Wildlife
Monographs 53:1-55.
Keyser, P.D., and W. M. Ford. 2005. Ten years of research on the MeadWestvaco Wildlife and
Ecosystem Research Forest: an annotated bibliography. U.S. For. Serv. Gen. Tech. Rep
NE-330, p. 27.

121
Laseter, B. R. 2004. Sociospatial characteristics and genetic structure of white-tailed deer in the
central Appalachians of West Virginia. Dissertation, University of Georgia, Athens,
USA.
Mathews, N. E. 1989. Social structure, genetic structure, and anti-predator behavior of white-
tailed deer in the Central Adirondacks. Dissertation, State University of New York,
Syracuse, USA.
Mathews, N. E., and W. F. Porter. 1993. Effect of social structure on genetic structure of free-
ranging white-tailed deer in the Adirondack Mountains. Journal of Mammalogy 74:33-
43.
McNulty, S. A., W. F. Porter, N. E. Mathews, and J. A. Hill. 1997. Localized management for
reducing white-tailed deer populations. Wildlife Society Bulletin 25:265-271.
Miller, B. F. 2008. Social structuring of a central Appalachian deer herd and a test of localized
management. Dissertation, University of Georgia, Athens, USA.
Miller, K. V. 1997. Considering social behavior in the management of overabundant white-
tailed deer populations. Wildlife Society Bulletin 25:279-281.
Nei, M. 1987. Molecular evolutionary genetics. Columbia University Press, New York, USA.
Nelson, M. E., and L. D. Mech. 1984. Home range formation and dispersal of deer in
northeastern Minnesota. Journal of Mammalogy 65:567-575.
Oyer, A. M., and W. F. Porter. 2004. Localized management of white-tailed deer in the central
Adirondack Mountains, New York. Journal of Wildlife Management 68:257-265.
Ozoga, J. J., L. J. Verme, and C. S. Bienz. 1982. Parturition behavior and territoriality in white-
tailed deer: impact on neonatal mortality. Journal of Wildlife Management 46:1–11.

122
Porter, W. F., N. E. Mathews, H. B. Underwood, R. W. Sage, and D. F. Behrend. 1991. Social
organization in deer: implications for localized management. Environmental
Management 15:809-814.
Rice, W. R. 1989. Analyzing tables of statistical tests. Evolution 43:223-225.
Scribner, K. T., M. H. Smith, and R. K. Chesser. 1997. Spatial and temporal variability of
microgeographic genetic structure in white-tailed deer. Journal of Mammalogy 78:744-
755.
Severinghaus, C. A. 1949. Tooth development and wear as criteria of age in white-tailed deer.
Journal of Wildlife Management 13:195-216.
Storz, J. F. 1999. Genetic consequences of mammalian social structure. Journal of Mammalogy
80:553-569.
Tierson, W. C., G. F. Mattfield, R. W. Sage, Jr., and D. F. Behrend. 1985. Seasonal movements
and home ranges of white-tailed deer in the Adirondacks. Journal of Wildlife
Management 49:760-769.
Trivers, R. L. 1974. Parent-offspring conflict. American Zoologist 14:249-264.
van Hooft, W. F., A. F. Groen, and H. H. T. Prins. 2003. Genetic structure of African buffalo
herds based on variation at the mitochondrial D-loop and autosomal microsatellite loci:
evidence for male-biased gene flow. Conservation Genetics 4:467-477.
Weir, B. S., and C. C. Cockerham. 1984. Estimating F-statistics for the analysis of population
structure. Evolution 38:1358-1370.
Wright, S. 1951. The genetical structure of populations. Ann Eugen 15:323–354.
Wright, S. 1969. Evolution and the genetics of populations. Vol. 2 The theory of gene
frequencies. University of Chicago Press, Chicago, USA.

123
Wright, S. 1978. Evolution and the Genetics of Populations. Variability within and among
natural populations. University of Chicago Press, Chicago, USA.
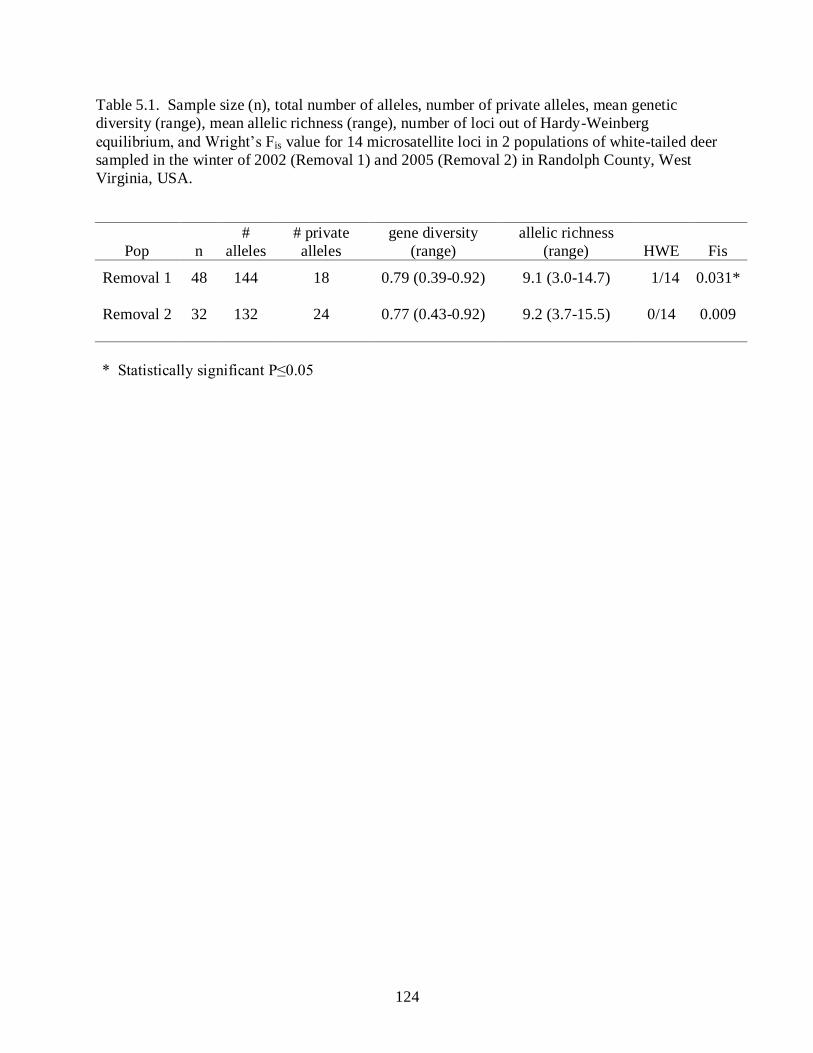
124
Table 5.1. Sample size (n), total number of alleles, number of private alleles, mean genetic
diversity (range), mean allelic richness (range), number of loci out of Hardy-Weinberg
equilibrium, and Wright’s Fis value for 14 microsatellite loci in 2 populations of white-tailed deer
sampled in the winter of 2002 (Removal 1) and 2005 (Removal 2) in Randolph County, West
Virginia, USA.
Pop n
#
alleles
# private
alleles
gene diversity
(range)
allelic richness
(range) HWE Fis
Removal 1 48 144 18 0.79 (0.39-0.92) 9.1 (3.0-14.7) 1/14 0.031*
Removal 2 32 132 24 0.77 (0.43-0.92) 9.2 (3.7-15.5)
0/14 0.009
* Statistically significant P≤0.05
125
CHAPTER 6
CONCLUSIONS
My results represent the culmination of research investigating white-tailed deer and forest
ecology on the MeadWestvaco Wildlife and Ecosystem Research Forest (MWWERF) in
Randolph County, West Virginia. Research efforts investigating the ecology of white-tailed deer
on the MWWERF began in 1999. Results indicated that the deer population was at a high-
density (Langdon 2001) and characterized by moderate fawn recruitment, excessive harvest of
yearling males, and conservative harvest of females (Campbell 2003). Additionally, Campbell
(2003) concluded that female philopatry was high and dispersal rates were low. Subsequent
examination of spatial and genetic structure of the deer population by Laseter (2004) confirmed
the presence of spatial and genetic structure in the population consistent with matrilineal
groupings of white-tailed deer. It was concluded by both Laseter (2004) and Campbell (2003)
that the rose-petal model of population expansion proposed by Mathews (1989) applied to the
deer population on the MWWERF and that a test of localized management would be prudent.
However, Laseter (2004) cautioned that the high population density forced overlap among
matriarchal groups, and that the effectiveness of behavior-based management strategies may be
affected.
Utilizing information obtained in the previous research efforts, my investigation focused
on the effects of deer herbivory on forest regeneration, alternative techniques to mitigate deer
herbivory, and white-tailed deer spatial genetic and sociobiological characteristics. My results
126
indicate that the high deer-densities on the MWWERF may be impacting forest regeneration and
ecosystem processes. Although natural woody vegetation was able to outgrow competing
herbaceous vegetation, preferential herbivory by white-tailed deer can affect woody species of
limited availability. The declines in herbivory rates after increased timber harvesting on the
study site suggests that providing abundant browse through forest management may be a viable
alternate management technique for mitigating impacts of overabundant deer populations.
My analysis of genetic and social structuring documented strong evidence of
microgeographic (<1 km) spatial structuring in the population, which was attributable to spatial
fidelity of matriarchal social groups. However, the application of localized management only
provided a temporary reduction in deer densities despite fulfilling a priori socio-behavioral
requirements. Genetic analysis of repopulating animals indicated they were genetically different
from animals removed during the initial removal effort, suggesting that social behaviors of
adjacent females may not prevent repopulation of removal areas by surrounding animals. It
appears that in high-density deer populations, larger landscape-level deer removals or repeated
deer removals (e.g., 2–3 years) may be more effective than localized management in preventing
the negative effects of overabundant deer.
LITERATURE CITED
Campbell, T. A. 2003. Movement ecology of white-tailed deer in the central Appalachians of
West Virginia. Dissertation, University of Georgia, Athens, Georgia, USA.
Langdon, C. A. 2001. A comparison of white-tailed deer population estimation methods in
West Virginia. Thesis, West Virginia University, Morgantown, West Virginia, USA.
127
Laseter, B. R. 2004. Sociospatial characteristics and genetic structure of white-tailed deer in the
central Appalachians of West Virginia. Dissertation, University of Georgia, Athens,
Georgia, USA.
Mathews, N. E. 1989. Social structure, genetic structure, and anti-predator behavior of white-
tailed deer in the Central Adirondacks. Dissertation, State University of New York,
Syracuse, New York, USA.