Embed Size (px)
Citation preview
VARIATION AMONG NORTHERN RED OAK PROVENANCES IN BARK TH1CKNESS:DBH RATIOS
Matthew S. Russell and Jeffrey 0. Dawsonl
Abstract: Differences in bark thickness in relation to diameter at breast height were observed in a 30-32 year old Illinois planting of 32 provenances of northern red oak (Quercus ncbra) from throughout its natural range. Bark thickness by itself is often a good indication of relative cambial insulation from fire. Fire resistance in trees can largely be attributed to thickness and low thermal conductivity of bark. Western and southern provenances tended to have greater average bark thickness to dbh ratios than northern or eastern provenances because we tested latitude and longitude separately. One possible explanation is that provenances located in the western or southern areas of the range may have developed greater fire resistance through natural selection of genotypes that produce thicker bark at a given dbh.
In mesic deciduous forests of Eastern North America, fires have historically been thought of as detrimental to the quality of standing timber. However, exclusion of fire from these forests has been implicated in the gradual post- settlement replacement of dominant early to mid-successional Quercus species with late-successional more shade tolerant Acer species (Wuenscher and Valiunas 1967; Abrams 1992). Pallardy and others (1991) noted significant changes in species composition over a 22 year period for three distinct forest types in Missouri. Increases in the prevalence of sugar h p l e (Acer saccharm) and decreases in Quercus spp. were attributed to exclusion of fne and succession towards more mesic environments. The continuing trend towards late successional stages has led many resource managers to reconsider fire as a management tool to manipulate natural processes of succession and to control forest species composition.
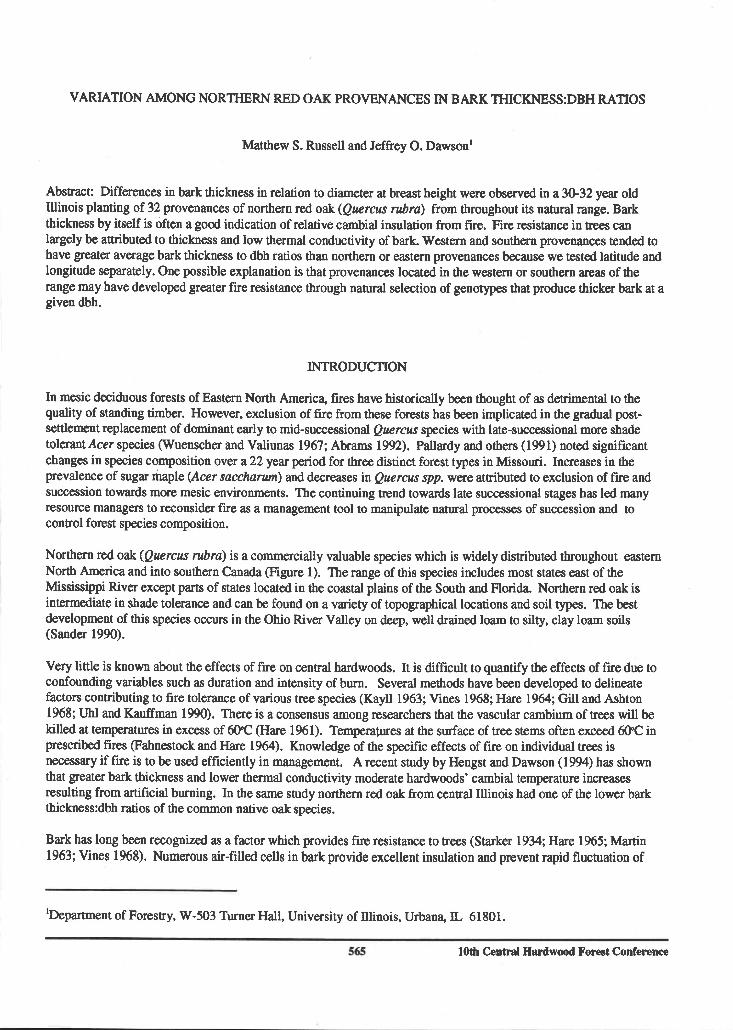
Northern red oak (Quercus ncbra) is a commercially valuable species which is widely distributed throughout eastern North America and into southern Canada (Figure 1). The range of this species includes most states east of the Mississippi River except parts of states located in the coastal plains of the South and Florida. Northern red oak is intermediate in shade tolerance and can be found on a variety of topographical locations and soil types. The best development of this species occurs in the Ohio River Valley on deep, well drained loam to silty, clay loam soils (Sander 1990).
Very little is known about the effects of fire on central hardwoods. It is difficult to quantify the effects of fire due to confounding variables such as duration and intensity of bum. Several methods have been developed to delineate factors contributing to fire tolerance of various tree species (Kay11 1963; Vines 1968; Hare 1%4, Gill and Ashton 1968; Uhl and Kauffman 1990). There is a consensus among researchers that the vascular cambium of trees will be killed at temperatures in excess of 60°C (Hare 1961). Temperatures at the surface of tree sterns often exceed 60°C in prescribed fm (Fahnestock and Hare 1964). Knowledge of the specific effects of fire on individual trees is necessary if fire is to be used efficiently in management. A recent study by Hengst and Dawson (1994) has shown that greater bark thickness and lower thermal conductivity moderate hardwoods' cambial temperature increases resulting from artificial burning. In the same study northern red oak from central Illinois had one of the lower bark thickness:dbh ratios of the common native oak species.
Bark has long been recognized as a factor which provides fire resistance to trees (Starker 1934, Hare 1965; Martin 1963; Vines 1968). Numerous air-filled cells in bark provide excellent insulation and prevent rapid fluctuation of
'~epartment of Forestry, W-503 Turner Hall, University of Illinois, Urbana, IL 61801.
565 loth Central Hardwood Forest Conference
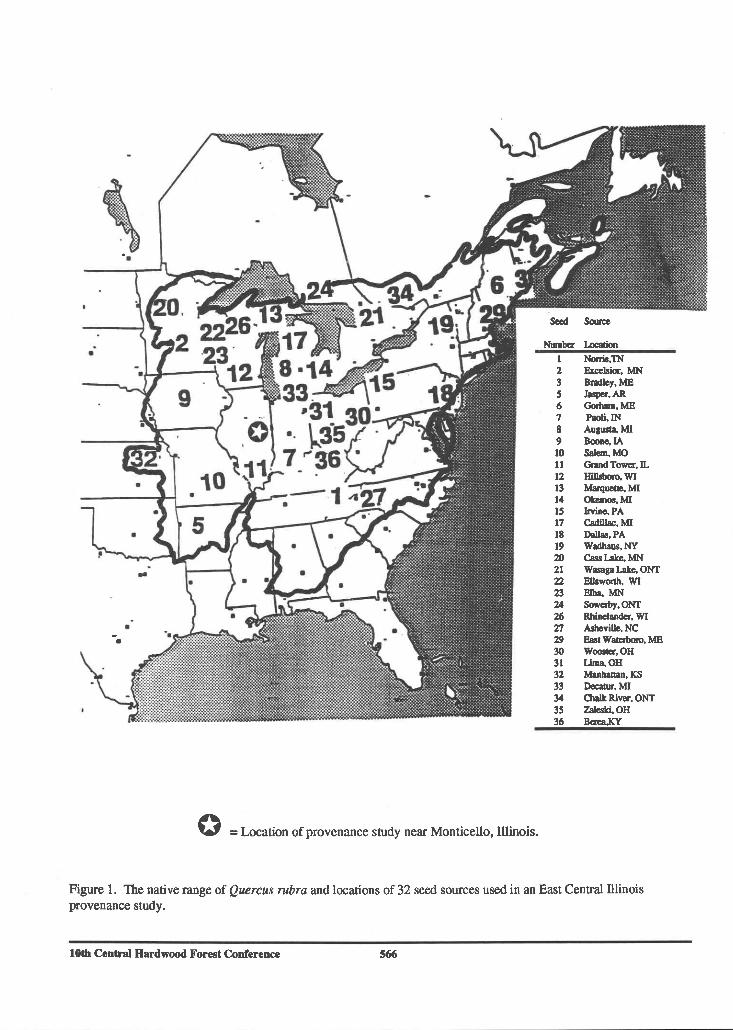
0 = Location of provenance study near Monticello. Illinois
Figure 1. The native range of Quercus rubra and locations of 32 seed sources used in an East Central Illinois provenance study.
10th Central Hardwood Forest Conference 566
temperatures at the vascular cambium. Martin (1963) conducted a laboratory experiment examining the thermal conductivity of the bark of several species. His results demonstrated the good insulating qualities of bark and identified some factors contributing to variation in heat conductance between and within the bark of different species.
Northern red oak has been observed to exhibit considerable geographic genetic variation for a variety of traits in past observations of provenance vials (Kriebel and others 1976). McMahon (1988) conducted a study examining the performance of different provenances of Northern red oak in the same plots used in this study. He observed variation and significant differences among provenances for a variety of characteristics such as survival, growth rate, forking, and phenology. The purpose of our study was to determine whether northern red oak provenances differ in bark thickness:dbh ratios.
METHODS
Study Design
Variation in bark thickness was determined in the summer of 1993 in a northern red oak provenance study near Monticello, Illinois (40.1' N latitude; 88.5' w longitude). The planting was one of several established as the U.S.D.A. North Central Cooperative Regional Project (NC-51) entitled "Tree Improvement through Selection and Breeding of Trees of Known Origin." The 1-0 stock was planted during spring of the years 1962-1964. Individual tree seed sources were not separated into families for this study. Bulked seedlots were the source of planting stock The experimental design encompassed 32 seed sources within 7 replicates of a randomized complete block experimental design. Each replicate contained at least 16 trees from each source upon establishment with a spacing of 3.0 x 2.4m. A double border row of common seed source trees surrounded the plots.
Six trees were measured from 4 x 4 plots in each of 3 replications of each source. Bark thickness measurements were made to the nearest millimeter using a metric bark gauge. Diameter at breast height was measured to the nearest millimeter 1.4m above the ground. Trees that were measured were randomly selected from the total number of surviving trees present. The trees were consecutively assigned a number. and a random number table was then used to select 6 trees. Two bark thickness measurements were made on the north and south sides of each randomly selected tree at a height of 1.4m.
Data Analysis
In a previous study, bark thickness of northern red oak and 15 other hardwood species from a single locale was positively linearly correlated with dbh for each species (Hengst and Dawson 1994). The ratio of bark thickness to dbh was used in analysis rather than bark thickness alone to eliminate the confounding influence that tree size has on bark thickness. The rationale for using the ratio of bark thickness to dbh as opposed to some other function of the two variables is geometrically motivated and is supported by a simple linear regression (Figure 2). Here we see that apart from some residual variance, attributable to seed sources, bark thickness is essentially a multiple of dbh offset by a small intercept very near the origin. Also, in order to avoid the consequences that outliers and violations of the usual assumptions of the standard linear regression model may have on statistical inference, a nonparametric index was used to measure the association of the variables of interest. The mean bark thickness:dbh ratio was associated with latitude and longitude using this ordinal method. Specifically Kendall's tau, a nonparametric index of ordinal association that can be interpreted much like the usual correlation coefficient, was used along with its corresponding test of statistical significance. It should be noted that the usual adjustment to Kendall's tau for data containing ties was used, because there were some ties in the bark thickness:dbh ratio. Though standard linear regression was not used for statistical inference, it was used to provide graphical summaries of the data. Statistical analyses were conducted using S+ (Statistical Science Inc. 1994) and SAS version 6.0 (SAS Institute Inc. 1989). Variation among bark thickness:dbh ratios was also examined for all provenances using ANOVA. The ANOVA was followed by a t-test to examine geographic variation among disjunct seed sources (Table 1).
567 10th Central Hardwood Forest Conference
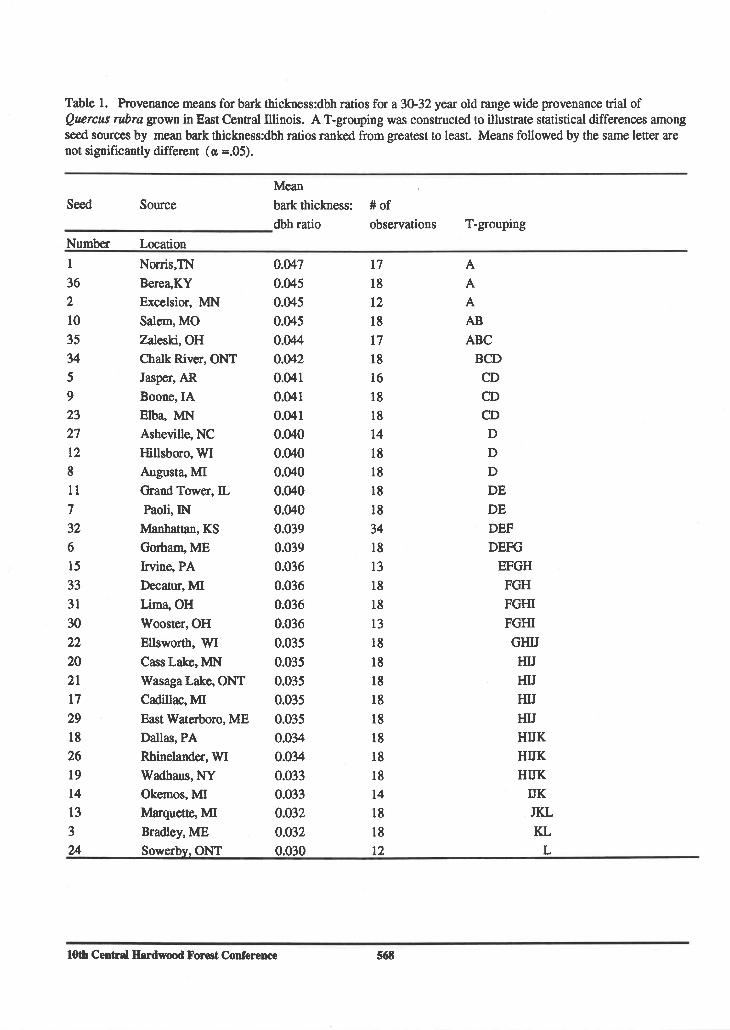
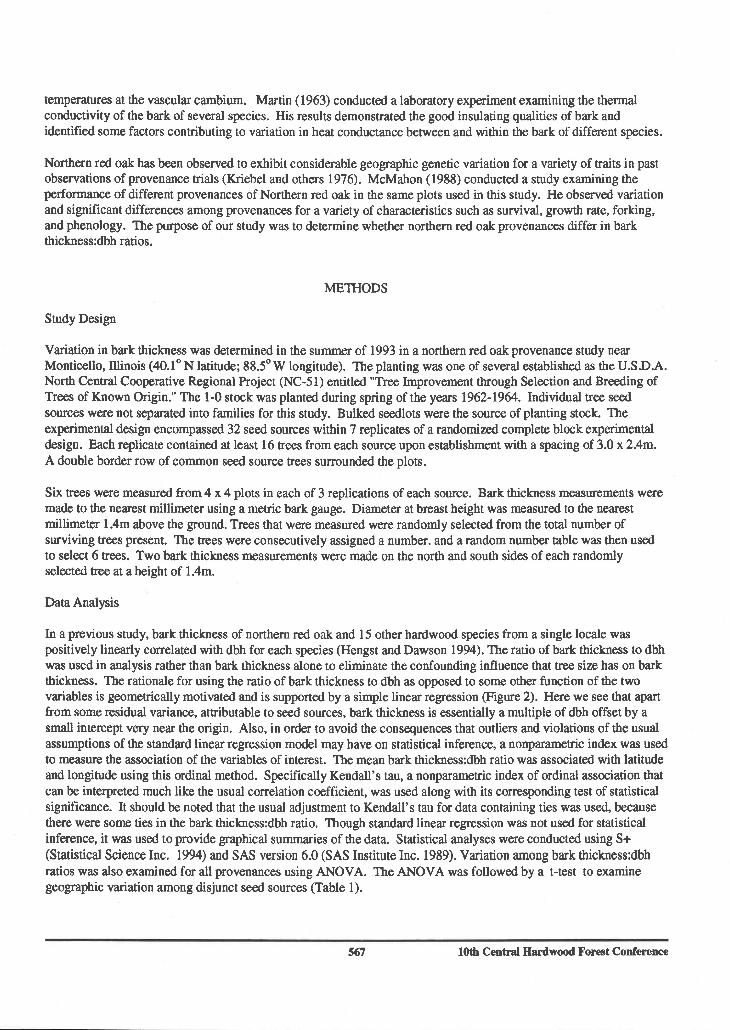
Table 1. Provenance means for bark thickness:dbh ratios for a 30-32 year old range wide provenance trial of Quercw ncbra grown in East Central Illinois. A T-grouping was constructed to illustrate statistical differences among seed sources by mean bark thickness:dbh ratios ranked from greatest to least. Means followed by the same letter are not significantly different (a =.05).
Mean Seed Source bark thickness: # of
dbh ratio observations T-grouping Number Location 1 Noms,TN 0.047 17 A 36 Berea,KY 0.045 18 A 2 Excelsior, MN 0.045 12 A 10 Salem, MO 0.045 18 AB 35 Zaleski, OH 0.044 17 ABC 34 Chalk River, ONT 0.042 18 BCD 5 Jasper, AR 0.04 1 16 CD 9 Boone, IA 0.04 1 18 CD 23 Elba, MN 0.04 1 18 CD 27 Asheville, NC 0.040 14 D 12 Hillsbmo, WI 0.040 18 D 8 Augusta, MI 0.040 18 D 11 Grand Tower, IL 0.040 18 DE 7 Paoli, IN 0.040 18 DE 32 Manhattan, KS 0.039 34 DEF 6 Gorham, ME 0.039 18 DEFG 15 Irvine, PA 0.036 13 EFGH 33 Decatur, MI 0.036 18 FGH 31 Lima, OH 0.036 18 FGHI 30 Wooster, OH 0.036 13 FGHI 22 Ellsworth, WI 0.035 18 GHU 20 Cass Lake, MN 0.035 18 HU 2 1 Wasaga Lake, ONT 0.035 18 HU 17 Cadillac, MI 0.035 18 HIJ 29 East Waterboro, ME 0.035 18 HIJ 18 Dallas, PA 0.034 18 HIJK 26 Rhinelander, WI 0.034 18 HIJK 19 Wadhaus, NY 0.033 18 HUK 14 Okemos, MI 0.033 14 UK 13 Marquette, MI 0.032 18 JKL 3 Bradley, ME 0.032 18 KL 24 Sowerbv, ONT 0.030 12 L
16th Centnd Hardwood Forest Conference 568
Among the 32 seed sources in the provenance study, the Kendall's tau index of correlation between latitude and the mean provenance ratio of bark thickness to dbh was equal to -0.438, revealing that a negative association exists between bark thickness:dbh ratio and latitude. In other words, trees with seed sources in the south tend to have higher relative bark thickness for a given dbh, a finding consistent with our hypothesis. A central limit theorum based test of the statistical significance of the observed value of Kendall's tau had an association probability value of 0.0002. The mean values of the ratio of bark thickness:dbh are plotted against latitude (Figure 3) along with the least squares regression line. The negative slope of the regression line illustrates the trend.
0.40
0.20
0.00 0.0 5.0 10.0 15.0 20.0 25.0 30.0 35.0 40.0 45.0
dbh (cm) Fig- 2 Dbh vs. barkthickness for 32 seed sources planted in a central Illinois provenance
trial of Quercus mbra. Individual uee data %re used to plot the regression (n=589).
Mean bark thicknessdbh ratio
Figure 3. Mean provenance bark thickness:dbh ratios by seed source vs. latitude.
569 10th Central Hardwood Forest Conference
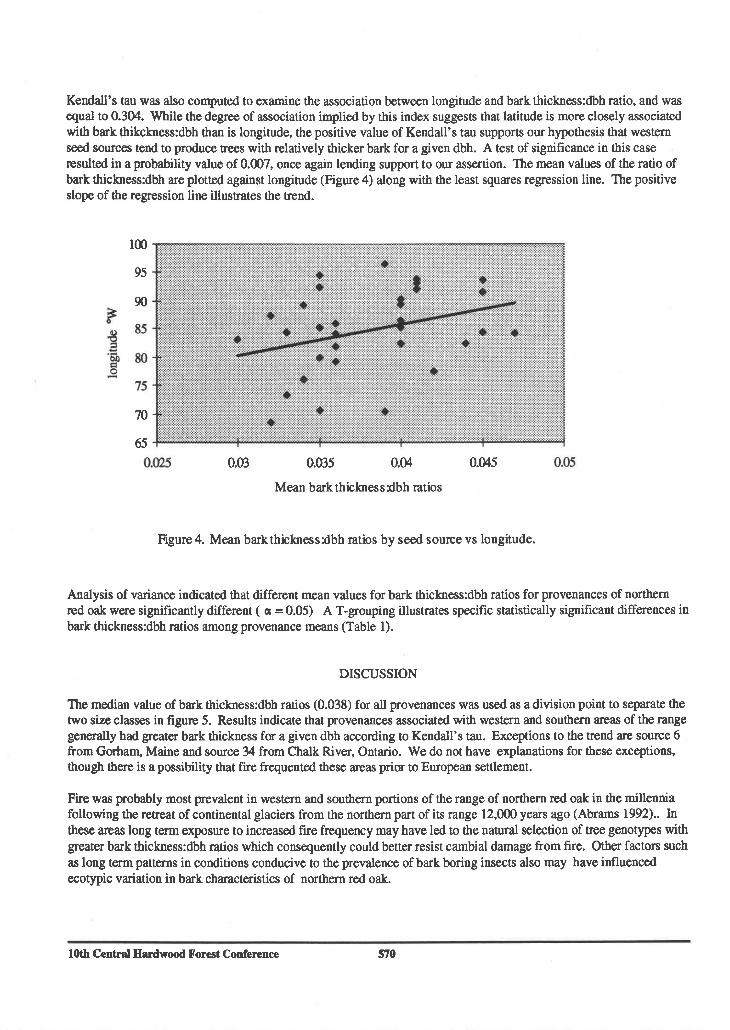
Kendall's tau was also computed to examine the association between longitude and bark thickness:dbh ratio, and was equal to 0.304. Wile the degree of association implied by this index suggests that latitude is more closely associated with bark thikckness:dbh than is longitude, the positive value of Kendall's tau supports our hypothesis that western seed sources tend to produce trees with relatively thicker bark for a given dbh. A test of significance in this case resulted in a probability value of 0.007, once again lending support to our assertion. The mean values of the ratio of bark thickness:dbh are plotted against longitude (Figure 4) along with the least squares regression line. The positive slope of the regression line illustrates the trend.
0.025 0.03 0.035 0.04 0.045 0.05
Mean bark thickness:dbh ratios
Figure 4. Mean bark thickness:dbh ratios by seed source vs longitude.
Analysis of variance indicated that different mean values for bark thickness:dbh ratios for provenances of northern red oak were significantly different ( a = 0.05) A T-grouping illustrates specific statistically significant differences in bark thickness:dbh ratios among provenance means (Table 1).
DISCUSSION
The median value of bark thickness:dbh ratios (0.038) for all provenances was used as a division point to separate the two size classes in figure 5. Results indicate that provenances associated with western and southern areas of the range generally had greater bark thickness for a given dbh according to Kendall's tau. Exceptions to the trend are source 6 from Gorham, Maine and source 34 from Chalk River, Ontario. We do not have explanations for these exceptions, though there is a possibility that fire frequented these areas prior to European settlement.
Fire was probably most prevalent in western and southern portions of the range of northern red oak in the millennia following the retreat of continental glaciers from the northern part of its range 12,000 years ago (Abrams 1992).. In these areas long term exposure to increased fire frequency may have led to the natural selection of tree genotypes with greater bark thickness:dbh ratios which consequently could better resist cambial damage from fire. Other factors such as long term patterns in conditions conducive to the prevalence of bark boring insects also may have influenced ecotypic variation in bark characteristics of northern red oak.
10th Central Hardwood Forest Conference 570
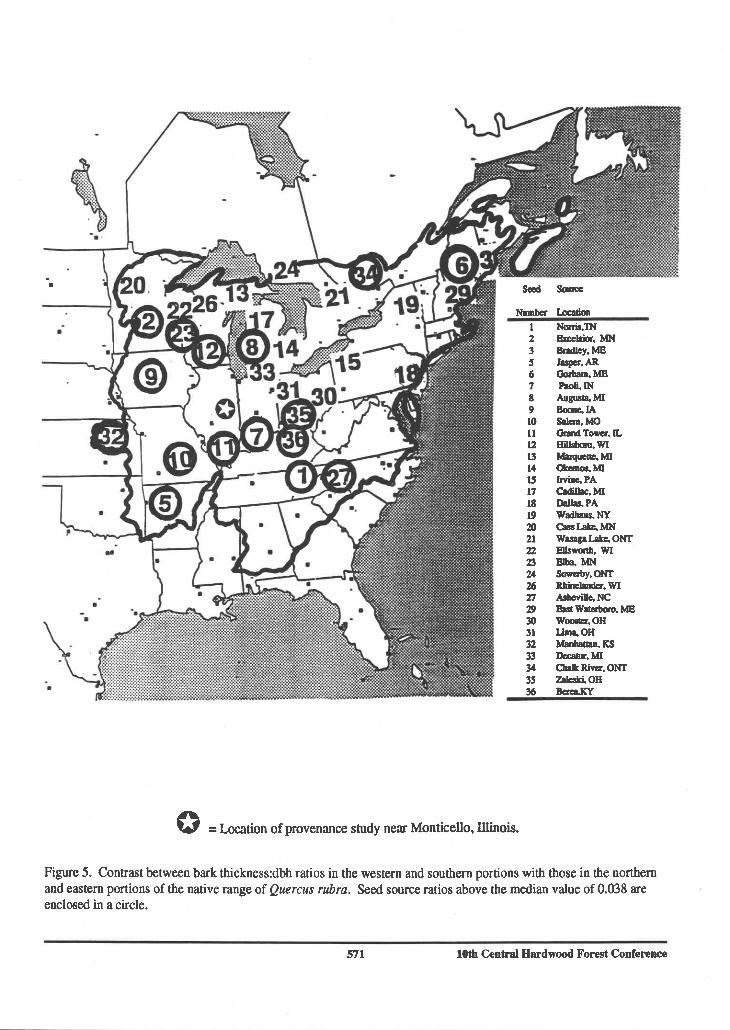
0 = Location of provenance study near Monticello. Illinois
Figure 5. Contrast between bark thickness:dbh ratios in the western and southern portions with those in the northern and eastern portions of the native range of Quercus rubra. Seed source ratios above the median value of 0.038 are enclosed in a circle.
571 10th Central Hardwood Forest Conference

LlTERATURE CITED
Abrams, M.D. 1992. Fire and the development of oak forests. Bioscience. 42(5):346-352.
Fahnestock, G.R. and R.C. Hare 1964. Heating of tree trunks in surface fires. J. For. 62:799-805.
Gill, AM. and D.H. Ashton. 1968. The role of bark in relative tolerance to fire of three central victorian Eucalypts. Aust. J. Bot. 16:49 1498.
Hare, R.C. 1961. Heat effects on living plants. U.S.D.A. For. Serv. So. For. Expt. Sta. Occas. Pap. 183.32~.
,1964. Bark surface and cambium temperatures in simulated forest fires. J. For. 62437439.
,1965. Contribution of bark to fire resistance of southern trees. J. For. 63:248-251.
Hengst G. and J.O. Dawson. 1994. Bark properties and fire resistance of selected tree species from the central hardwood region of North America. Can. J. For. Res. 24:688-696.
Kayll, A.J. 1963. A technique for studying the fire tolerance of living tree trunks. Publ. Can. Dept. For. No. 1012.
Kriebel, H.B., W.T. Baigley, FJ. Deneke, R.W. Funsch, P. Roth, JJ. Jokela, C. Merrit, J.W. Wright, and R.D. Williams 1976. Geographic variation in Quercus rubra in North Central United States plantations. Silvae Genetica 25: 118-122.
Martin, R.E. 1%3. A basic approach to fire injury of tree stems. Proc. 2nd Ann. Tall Timbers F ie Ecol. Conf. 2: 151- 162.
McMahon, B.G. 1988. Range wide performance of Quercus rubra in an East Cenaal Illinois provenance study. M.S, Thesis. University of Illinois. Champaign-Urbana.
Pallardy, S.G., T.A. Nigh, and E.Garrett. 1991. Sugar maple invasion in oak forests of Missouri. In Proc. Oak Woods Mgmt. Workshop. G.V. Burger, J.E. Ebinger and G.S. Wihelm, Eds. Eastern Illinois University, Charleston. pp. 21-30.
Sander, I.L. 1990. Quercus rubra. In Silvics of North America. Volume 2. Hardwoods. U.S.D.A. Forest Service Agriculture Handbook 654. 2:727-733.
SAS Institute Inc. 1989. SAWSTAT User's Guide, Version 6, Fourth ed., Vol. 2, Cary, NC. 846p.
Starker, T.J. 1934. F ie resistance in the forest. J. For. 32462467.
Uhl, C. and J.B. Kauffman. 1990. Deforestation, fire susceptibility, and potential tree responses to fire in the eastern Amazon. Ecology. 7 1:437-449.
Vines, R.G. 1968. Heat transfer through bark, and the resistance of trees to fire. Aust. J. Bot. 16:499-514.
Wuenscher, JB. and AJ. Valiunas. 1967. Presettlement forest composition of the River Hills Region of Missouri. Am. Mid. Nat. 78:487495.
loth Central Hardwood Foreat Conference 572