Embed Size (px)
Citation preview
Amorphous and nanocrystalline materials forapplications as soft magnets
Michael E. McHenry*, Matthew A. Willard,David E. Laughlin
Department of Materials Science and Engineering, Carnegie Mellon University, Pittsburgh,
Pennsylvania 15213, USA
Received 30 November 1998
Abstract
This review seeks to summarize the recent developments in the synthesis, structuralcharacterization, properties, and applications in the ®elds of amorphous, bulk amorphous,and nanocrystalline soft magnetic materials. Conventional physical metallurgical
approaches to improving soft ferromagnetic properties have relied on the optimization ofchemical and microstructural features. Within the last decade, the development and rapidincrease in research of nanocrystalline materials has shown that through propermodi®cations, revolutionary contributions can be made to better materials' properties. A
wide range of materials' properties are examined in this review, including: kinetics andthermodynamics, structure, microstructure, and intrinsic and extrinsic magneticproperties. # 1999 Elsevier Science Ltd. All rights reserved.
Contents
1. Introduction and historical perspective . . . . . . . . . . . . . . . . . . . . . . . . . . . . . . . 3001.1. Technical considerations . . . . . . . . . . . . . . . . . . . . . . . . . . . . . . . . . . . . 302
2. Alloy design issues. . . . . . . . . . . . . . . . . . . . . . . . . . . . . . . . . . . . . . . . . . . . . . 3062.1. Magnetic dipole moments and magnetization. . . . . . . . . . . . . . . . . . . . . . 307
0079-6425/99/$ - see front matter # 1999 Elsevier Science Ltd. All rights reserved.
PII: S0079 -6425 (99)00002 -X
Progress in Materials Science 44 (1999) 291±433
* Corresponding author. Tel.: +1-412-268-2703; fax: +1-412-268-3113.
E-mail address: [email protected] (M.E. McHenry).
2.2. Ferromagnetic ordering (Curie) temperatures. . . . . . . . . . . . . . . . . . . . . . 3102.3. Magnetocrystalline anisotropy and magnetostriction . . . . . . . . . . . . . . . . 313
2.4. Magnetic domains and domain wall mobility. . . . . . . . . . . . . . . . . . . . . . 3152.5. AC magnetic response . . . . . . . . . . . . . . . . . . . . . . . . . . . . . . . . . . . . . . 3172.6. Considerations of glass forming ability and crystallization . . . . . . . . . . . . 318
3. Synthesis of nanoparticles, amorphous, bulk amorphous and nanocrystallinealloys . . . . . . . . . . . . . . . . . . . . . . . . . . . . . . . . . . . . . . . . . . . . . . . . . . . . . . . 321
3.1. Powder synthesis of nanoparticles and nanoencapsulates . . . . . . . . . . . . . 3223.1.1. Carbon arc synthesis . . . . . . . . . . . . . . . . . . . . . . . . . . . . . . . . . 3223.1.2. Plasma torch synthesis. . . . . . . . . . . . . . . . . . . . . . . . . . . . . . . . 312
3.1.3. Mechanical milling techniques . . . . . . . . . . . . . . . . . . . . . . . . . . 3273.1.4. Powder consolidation . . . . . . . . . . . . . . . . . . . . . . . . . . . . . . . . 330
3.2. Rapid solidi®cation processing . . . . . . . . . . . . . . . . . . . . . . . . . . . . . . . . 3313.3. Solidi®cation processing of bulk amorphous alloys. . . . . . . . . . . . . . . . . . 333
3.4. Primary nanocrystallization of amorphous precursors. . . . . . . . . . . . . . . . 333
4. Thermodynamic and transformation kinetic considerations for amorphous and
nanocrystalline materials . . . . . . . . . . . . . . . . . . . . . . . . . . . . . . . . . . . . . . . . . 3354.1. Calorimetry and stability of bulk amorphous materials. . . . . . . . . . . . . . . 3374.2. Primary and secondary crystallization events in nanocrystalline alloys . . . . 340
4.2.1. FINEMET alloys . . . . . . . . . . . . . . . . . . . . . . . . . . . . . . . . . . . 3404.2.2. NANOPERM alloys . . . . . . . . . . . . . . . . . . . . . . . . . . . . . . . . . 3424.2.3. HITPERM alloys . . . . . . . . . . . . . . . . . . . . . . . . . . . . . . . . . . . 343
4.2.4. Other alloys . . . . . . . . . . . . . . . . . . . . . . . . . . . . . . . . . . . . . . . 3434.3. Surface crystallization kinetics . . . . . . . . . . . . . . . . . . . . . . . . . . . . . . . . 3434.4. Crystallization kinetics . . . . . . . . . . . . . . . . . . . . . . . . . . . . . . . . . . . . . . 344
4.4.1. FINEMET alloys . . . . . . . . . . . . . . . . . . . . . . . . . . . . . . . . . . . 344
4.4.2. NANOPERM alloys . . . . . . . . . . . . . . . . . . . . . . . . . . . . . . . . . 3464.4.3. HITPERM alloys . . . . . . . . . . . . . . . . . . . . . . . . . . . . . . . . . . . 3464.4.4. Other alloys . . . . . . . . . . . . . . . . . . . . . . . . . . . . . . . . . . . . . . . 346
4.5. Ordering and structural phase transitions in nanocrystalline alloys . . . . . . 3474.5.1. Nanoparticles and nanoencapsulates. . . . . . . . . . . . . . . . . . . . . . 3474.5.2. FINEMET alloys . . . . . . . . . . . . . . . . . . . . . . . . . . . . . . . . . . . 349
4.5.3. NANOPERM alloys . . . . . . . . . . . . . . . . . . . . . . . . . . . . . . . . . 3504.5.4. HITPERM alloys . . . . . . . . . . . . . . . . . . . . . . . . . . . . . . . . . . . 350
5. Structure and microstructure of amorphous and nanocrystalline alloys . . . . . . . . 352
5.1. Background information . . . . . . . . . . . . . . . . . . . . . . . . . . . . . . . . . . . . 3525.1.1. Amorphous alloys . . . . . . . . . . . . . . . . . . . . . . . . . . . . . . . . . . . 3525.1.2. Nanocrystalline phases . . . . . . . . . . . . . . . . . . . . . . . . . . . . . . . 354
5.1.3. Microstructural characterization and spectroscopic analysis(amorphous and nanocrystalline alloys). . . . . . . . . . . . . . . . . . . . 355
5.2. Experimental observations: X-ray scattering and EXAFS . . . . . . . . . . . . . 358
5.2.1. FINEMET alloys . . . . . . . . . . . . . . . . . . . . . . . . . . . . . . . . . . . 3625.2.2. NANOPERM alloys . . . . . . . . . . . . . . . . . . . . . . . . . . . . . . . . . 3635.2.3. HITPERM alloys . . . . . . . . . . . . . . . . . . . . . . . . . . . . . . . . . . . 363
5.3. Experimental observations: neutron scattering . . . . . . . . . . . . . . . . . . . . . 3645.3.1. Nanoparticle powders . . . . . . . . . . . . . . . . . . . . . . . . . . . . . . . . 364
M.E. McHenry et al. / Progress in Materials Science 44 (1999) 291±433292
5.3.2. Nanocrystalline materials. . . . . . . . . . . . . . . . . . . . . . . . . . . . . . 3655.4. Experimental observations: microscopy . . . . . . . . . . . . . . . . . . . . . . . . . . 365
5.4.1. Nanoparticle powders . . . . . . . . . . . . . . . . . . . . . . . . . . . . . . . . 3655.4.2. FINEMET alloys . . . . . . . . . . . . . . . . . . . . . . . . . . . . . . . . . . . 3675.4.3. NANOPERM alloys . . . . . . . . . . . . . . . . . . . . . . . . . . . . . . . . . 370
5.4.4. HITPERM alloys . . . . . . . . . . . . . . . . . . . . . . . . . . . . . . . . . . . 3745.4.5. Other alloys . . . . . . . . . . . . . . . . . . . . . . . . . . . . . . . . . . . . . . . 376
5.5. Experimental observations: MoÈ ssbauer spectcroscopy. . . . . . . . . . . . . . . . 377
5.5.1. FINEMET alloys . . . . . . . . . . . . . . . . . . . . . . . . . . . . . . . . . . . 3775.5.2. NANOPERM alloys . . . . . . . . . . . . . . . . . . . . . . . . . . . . . . . . . 3775.5.3. HITPERM alloys . . . . . . . . . . . . . . . . . . . . . . . . . . . . . . . . . . . 382
6. Intrinsic magnetic properties . . . . . . . . . . . . . . . . . . . . . . . . . . . . . . . . . . . . . . 3826.1. Magnetic dipole moments . . . . . . . . . . . . . . . . . . . . . . . . . . . . . . . . . . . 382
6.1.1. Amorphous alloys . . . . . . . . . . . . . . . . . . . . . . . . . . . . . . . . . . . 382
6.1.2. Nanocrystalline alloys . . . . . . . . . . . . . . . . . . . . . . . . . . . . . . . . 3856.2. Magnetic exchange interactions and T-Dependent ferromagnetic response . 387
6.2.1. Amorphous alloys . . . . . . . . . . . . . . . . . . . . . . . . . . . . . . . . . . . 387
6.2.2. Nanocrystalline alloys . . . . . . . . . . . . . . . . . . . . . . . . . . . . . . . . 391
7. Extrinsic magnetic properties . . . . . . . . . . . . . . . . . . . . . . . . . . . . . . . . . . . . . . 395
7.1. Magnetic anisotropy and magnetostriction . . . . . . . . . . . . . . . . . . . . . . . 3957.1.1. Amorphous alloys . . . . . . . . . . . . . . . . . . . . . . . . . . . . . . . . . . . 3957.1.2. Weakly exchange coupled nanocrystalline alloys . . . . . . . . . . . . . 396
7.1.3. Strongly exchange coupled nanocrystalline alloys. . . . . . . . . . . . . 3967.2. Induced anisotropies . . . . . . . . . . . . . . . . . . . . . . . . . . . . . . . . . . . . . . . 4027.3. Magnetic coupling in two phase microstructures . . . . . . . . . . . . . . . . . . . 4037.4. Experimental observations in bulk amorphous alloys . . . . . . . . . . . . . . . . 410
7.5. Experimental observations in nanocrystalline alloys . . . . . . . . . . . . . . . . . 4127.5.1. FINEMET alloys . . . . . . . . . . . . . . . . . . . . . . . . . . . . . . . . . . . 4127.5.2. NANOPERM alloys . . . . . . . . . . . . . . . . . . . . . . . . . . . . . . . . . 417
7.5.3. HITPERM alloys . . . . . . . . . . . . . . . . . . . . . . . . . . . . . . . . . . . 419
8. Applications of amorphous and nanocrystalline materials . . . . . . . . . . . . . . . . . . 420
8.1. Amorphous materials . . . . . . . . . . . . . . . . . . . . . . . . . . . . . . . . . . . . . . 4208.2. Nanocrystalline materials . . . . . . . . . . . . . . . . . . . . . . . . . . . . . . . . . . . . 422
8.2.1. FINEMET alloys . . . . . . . . . . . . . . . . . . . . . . . . . . . . . . . . . . . 4228.2.2. NANOPERM alloys . . . . . . . . . . . . . . . . . . . . . . . . . . . . . . . . . 422
8.2.3. HITPERM alloys . . . . . . . . . . . . . . . . . . . . . . . . . . . . . . . . . . . 423
9. Conclusions . . . . . . . . . . . . . . . . . . . . . . . . . . . . . . . . . . . . . . . . . . . . . . . . . . 425
Acknowledgements . . . . . . . . . . . . . . . . . . . . . . . . . . . . . . . . . . . . . . . . . . . . . . . . . . 426
References . . . . . . . . . . . . . . . . . . . . . . . . . . . . . . . . . . . . . . . . . . . . . . . . . . . . . . . . 426
M.E. McHenry et al. / Progress in Materials Science 44 (1999) 291±433 293
Nomenclature
a Lattice parameterA Exchange sti�nessAam Exchange sti�ness amorphous phaseAcx Exchange sti�ness, crystalline phaseAW Domain wall areaA(r) Local exchange sti�nessB, B Induction, ¯ux densityBY Breadth of an X-ray peakBhf Hyper®ne ®eldBmax (AC) induction amplitudeBr Remanent inductionBs Saturation inductionBJ�x� Brillouin functionBS�x� Spin-only Brillouin functionc Speed of lightC Speci®c heatCV,CP Speci®c heat, constant V, PCM,CH Speci®c heat, constant M, HCh,Ce Power loss coe�cientsd Skin depthdp Atomic plane spacingdl DisplacementD Di�usivityDA A-atom di�usivityDB B-atom di�usivityD, Dg Grain sizeE Activation energyEF Fermi energyEp Potential energyEg Energy of gamma radiationf FrequencyFm Helmholtz free energyg�r� Pair correlation functiong�E � Density of statesg��E � Spin up density of statesgÿ�E � Spin down density of statesh Planck's constantH Magnetic ®eldHa Applied magnetic ®eld vectorHc Coercive ®eldHINT Internal magnetic ®eld
M.E. McHenry et al. / Progress in Materials Science 44 (1999) 291±433294
HK Anisotropy ®eldHm Field amplitude (AC)Hmix Heat of mixingHN Domain nucleation ®eldH0 Hyper®ne splittingHW Domain wall pinning ®eldI CurrentI IntensityJ, Jex Exchange energy densitykB Boltzmann constantk Equilibrium constantK Magnetic anisotropyKe� E�ective magnetic anisotropyKl Magnetic anisotropy lead termKl(r) Local anisotropy lead termKu Uniaxial magnetic anisotropyk� `Structural' anisotropyk0 Macroscopic anisotropyl Length` Angular momentum quantum number`s Structural ¯uctuation lengthl(R ) Dipolar magnetic anisotropyL Latent heatLex Exchange correlation lengthLam Lex-amorphous phaseL� Modi®ed Lex
Ln LanthanideM, M Magnetization (avg), magnitudeM MetalloidMs Saturation magnetizationMam
s Ms-amorphous phasem, m Reduced magnetization, magnituden Power law exponentne Number of electronsn� Number of spin-up electronsnÿ Number of spin-down electronsNv Number of atoms/unit volumeNp Number of atomic planesN Number of grainsNd Number of d-electronsNeq Equilibrium number of atomic planes in a domain wallNm Dipoles per unit volumeNs Number of s-electrons
M.E. McHenry et al. / Progress in Materials Science 44 (1999) 291±433 295
N* Number of spin-up electronsN+ Number of spin-down electronsp Momentumpe Nucleation rate exponentP(Bhf) Hyper®ne ®eld distributionPh Hysteresis power lossPe Eddy current power lossPTOT Total power lossqe Growth rate exponentq Momentum (X-ray scattering)q(R ) Quadrupolar anisotropy coe�cientr RadiusR, R(t ) Resistance, time dependent RRc Cooling rateS Spin angular momentum vectorS Ho�mann ripple parametert Timeteq ThicknessT TemperatureTa Annealing temperatureTC Curie temperatureT am
C Curie temperature, amorphous phaseT cr
C Curie temperature, crystalline phaseTE Eutectic temperatureTE Early transition metalTg Glass transition temperatureTL Liquidus temperatureTL Late transition metalTrg Reduced glass transition TTx Crystallization temperatureTx1 Primary crystallization TTx2 Secondary crystallization TX Volume fractionXam Volume fraction amorphous phasexE Eutectic temperaturev VelocityV Voltagewi Ne el pair anisotropy energyW Band-widthWh Hysteresis lossZn Coordination numberZ Chemical valenceZM Magnetic valence
M.E. McHenry et al. / Progress in Materials Science 44 (1999) 291±433296
a Power law exponentb Critical exponenty AngleyB Bragg angleD Quadrupole splittingd MoÈ ssbauer line positiondex Reduced exchange ¯uctuationd0 ex Reduced exchange ¯uctuation (0 K)d�,dÿ Asymmetric reduced exchange ¯uctuationdW Domain (Bloch) wall widthd� Critical crystallite sized0 Maximum crystallite sizeDD�, DDÿ Near neighbor distance ¯uctuationDTx Width of supercooled regionDHf Heat of formationDHmix Enthalpy of mixingDHx Heat of crystallizationDJ Exchange ¯uctuationDZ Valence di�erencef FluxG MoÈ ssbauer line widthg Gamma radiationgex Exchange interaction parametergam g parameter amorphous phasegs g parameter crystalline phasegwall Domain wall interfacial energyg�x� gwall, localgexc Exchange contribution to gwall
gK Anisotropy contribution to gwall
k Magnetic hardness parameterL Intergranular spacing parameterl X-ray wavelengthlW Weiss molecular ®eld constantl111 Magnetostriction-111 directionl100 Magnetostriction-100 directionlS Saturation magnetostrictionlam Magnetostriction coe�cient, amorphous phaselcr Magnetostriction coe�cient, crystalline phasemX X-ray absorption coe�cientm Permeabilitym 0 Real permeabilitym 00 Imaginary permeabilitymm Magnetic dipole moment
M.E. McHenry et al. / Progress in Materials Science 44 (1999) 291±433 297
mav Average dipole momentmmatrix Matrix atom dipole momentmB Bohr magnetonmi Initial permeabilitymatomM Atomic dipole moment
m0 Permeability of free spacep Pis Electrical conductivityt Lifetime, Time constanttr Reduced temperaturew Magnetic susceptibilityw�k� EXAFS oscillationsre Resistivityr Densityr�r� Atom densityO Atomic volumeAÊ Angstromnm nanometerNANOPERM Fe±M±B±Cu alloysFINEMET Fe±M±Si±B±Cu alloysHITPERM Fe±Co±M±B±Cu alloysAC Alternating currentAFM Atomic force microscopyAPFIM Atom probe ®eld ion microscopyBCC Body centered cubicDC Direct currentDRPHS Dense random packing of hard spheresDSC Di�erential scanning calorimetryDTA Di�erential thermal analysisCEMS CoConversion electron MoÈ ssbauer spectroscopyDSP Dislocation solute pumpingED Electron di�ractionEDS Energy dispersive X-ray spectroscopyEDX Energy dispersive X-ray analysisEELS Electron energy loss spectroscopyEFM Energy ®ltered microscopyEFTEM Energy ®ltered TEMEXAFS Extended X-ray absorption ®ne structureFCC Face centered cubicFIM Field ion microscopyFWHM Full width at half maximumGFA Glass forming abilityGW Gao±Wang kinetics
M.E. McHenry et al. / Progress in Materials Science 44 (1999) 291±433298
HCP Hexagonal close packedHRTEM High resolution TEMHV Vickers hardnessIPU Integrated power unitJMA Johnson±Mehl±Avrami kineticsKP Kissinger plotLKKR Layer Korringa±Kohn±RostokerLRO Long range orderMA Mechanical alloyingMAE Magnetic after e�ectMEA More electric aircraftMFM Magnetic force microscopyMOKE Magneto-optic Kerr e�ectMRO Medium range orderNM Noble metalNN Nearest neighborsRDF Radial distribution functionPEELS Parallel EELSPPM Parts per millionRF Radio frequencyRMS Root mean squareRPM Revolutions per minuteRXN ReactionSANS Small angle neutrons scatteringSAXS Small angle X-ray scatteringSQUID Superconducting quantum interference deviceSP Slater±PaulingSRO Short range orderSTEM Scanning transmission electron microscopySTM Scanning tunneling microscopyTEM Transmission electron microscopyTEP Thermoelectric powerTMA Thermomagnetic analysisTMG Thermomagnetic gravimetryTTT Time temperature transformationVSM Vibrating sample magnetometerVBS Virtual bound stateXRD X-ray di�raction
M.E. McHenry et al. / Progress in Materials Science 44 (1999) 291±433 299
1. Introduction and historical perspective
Over the past several decades, amorphous and more recently nanocrystallinematerials have been investigated for applications in magnetic devices requiringmagnetically soft materials such as transformers, inductive devices, etc. Mostrecently, research interest in nanocrystalline soft magnetic alloys has dramaticallyincreased. This is due, in part, to the properties common to both amorphous andcrystalline materials and the ability of these alloys to compete with theiramorphous and crystalline counterparts. The bene®ts found in the nanocrystallinealloys stem from their chemical and structural variations on a nanoscale which areimportant for developing optimal magnetic properties.
This review is intended to summarize recent developments in the synthesis,structural characterization, properties and applications of nanocrystalline andamorphous magnets. The term `nanocrystalline alloy' will be used for those alloysthat have a majority of grain diameters in the typical range from 01±50 nm. Thisterm will include alloys made by rapid solidi®cation, deposition techniques andsolid state reactions where the initial material may be in the amorphous state andsubsequently crystallized. We consider processing routes and methods to controlchemistry and microstructural morphology on increasingly smaller length scales,and various developing experimental techniques which allow more accurate andquantitative probes of structure (including magnetic domain structure) on smallerlength scales. We review the impact of microstructural control on the developmentof state of the art soft magnetic materials.
The demands on bulk soft magnetic materials include (1) higher combinedinduction and permeabilities and for some applications (2) magnets capable ofoperating at higher temperatures, as well as many non-magnetic issues such asmechanical properties, corrosion resistance, etc. In achieving such goals, key issuesinclude alloy chemistry, structure and importantly the ability to tailormicrostructural features. It is clear that the magnets used in soft magneticapplications must be optimized in terms of their intrinsic and extrinsic magneticproperties as well as their morphology. The key intrinsic magnetic properties, thesaturation magnetic induction, BS, and Curie temperatures, TC, are determined byalloy composition and crystal structure.
Premiere high induction bulk materials include body centered cubic (BCC) Fe,Fe±Si, face centered cubic (FCC) a-Co and FeCo alloys (for reviews see forexample Refs. [24,32]). FeCo bulk alloys [225,230] are particularly attractivebecause of their high inductions, but their permeabilities are smaller than those ofamorphous and nanocrystalline alloys and Si steels. The extrinsic property ofinterest is the magnetic permeability, m, the magnetic response function in anapplied ®eld, which usually is inversely related to the material's coercivity, Hc. Themagnetic permeability, m, is determined by chemistry, crystal structure,microstructure and morphology (shape). In particular, alloys with smallmagnetocrystalline anisotropies and magnetostrictive coe�cients give rise toparticularly soft magnetic materials.
Choice of soft magnetic materials for applications has been guided by recent
M.E. McHenry et al. / Progress in Materials Science 44 (1999) 291±433300
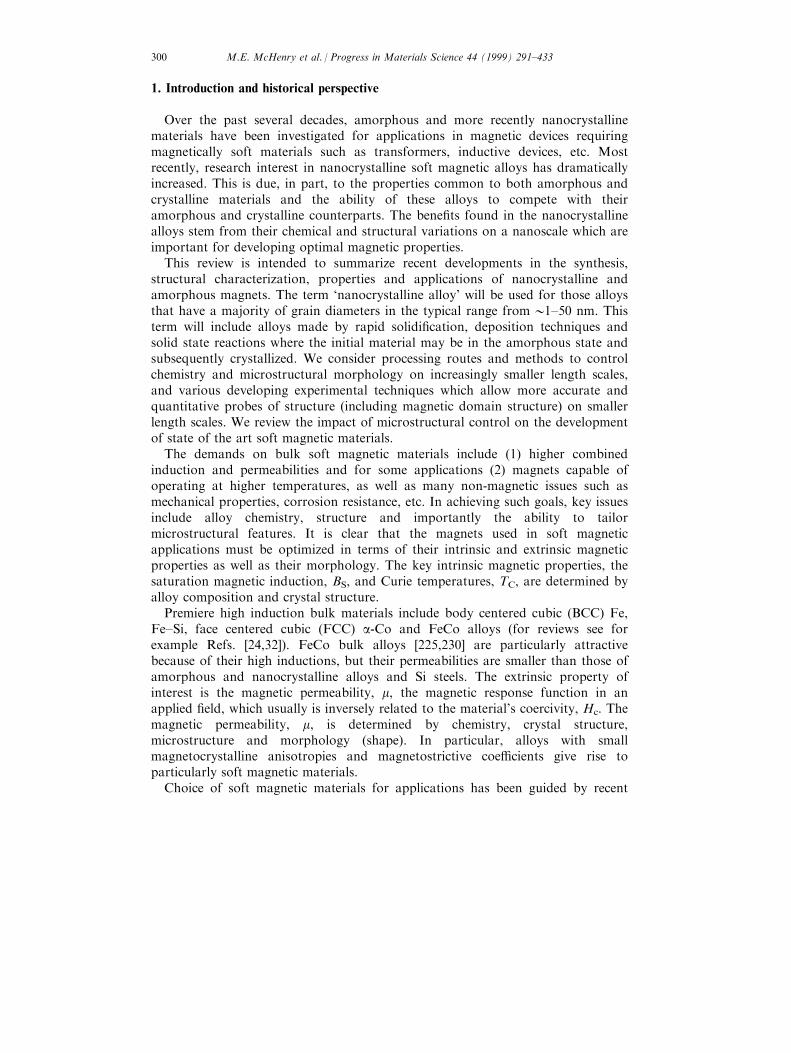
developments in the ®eld of soft magnetic materials. Amorphous and
nanocrystalline magnetic materials, in terms of combined induction and
permeabilities are now competitive with SiFe bulk alloys, and the above
mentioned Fe±Co alloys. In Fig. 1 (see Ref. [193]), ®gures of merit for Co-based
amorphous alloys, Fe-based amorphous alloys, and nanocrystalline alloys are
summarized. Co-based amorphous alloys, Fe-based amorphous alloys, and
nanocrystalline alloys have evolved over the past decades with soft magnetic
properties which now exceed those of the bulk alloys based on Fe, Co and Fe±Co.
Nanocrystalline alloys can be described in general as TL1ÿx�TE,M,NM�x where
TL denotes a late (ferromagnetic) transition metal element, TE is an early
transition metal element, M is a metalloid, and NM is a noble metal. This
composition usually has x < 0:20 i.e. with as much late ferromagnetic transition
metals (TL of Co, Ni, or Fe) as possible. The remaining early transition metals
(TE = Zr, Nb, Hf, Ta, etc.) and metalloids (M = B, P, Si, etc.) are added to
promote glass formation in the precursor. The noble metal elements (TN = Cu,
Ag, Au, etc.) serve as nucleating agents for the ferromagnetic nanocrystalline
phase. The compositions are limited by where glass formation can occur prior to
the nanocrystallization route. These alloys may be single phase (Type I) but are
generally two phase materials with a nanocrystalline ferromagnetic phase and a
Fig. 1. Relationship between permeability, me (at 1 kHz) and saturation polarization for soft magnetic
materials (adapted from Ref. [193]).
M.E. McHenry et al. / Progress in Materials Science 44 (1999) 291±433 301
residual amorphous phase at the grain boundaries (Type II). The Type IInanocryatalline alloys might have general properties (1) relatively high resistivity(50±80 mO cm) (2) low magnetocrystalline anisotropy (3) increased mechanicalstrength. With properties such as these, nanocrystalline alloys have great potentialas soft magnetic materials.
Nanocrystalline Fe±Si±B±Nb±Cu alloys have been patented under the tradename FINEMET@TM) [282,283]. Soft materials, based on Fe±M±B±Cu, havebeen patented by Kojima et al. [157] under the trade name [email protected] Fe±M±B±Cu (M = Zr, Nb, Hf, . . . ) nanocrystalline alloys have all beenoptimized to achieve small magnetostrictive coe�cients and concomitant largepermeabilities. More recently (Fe,Co)±M±B±Cu (M = Nb, Hf, or Zr)nanocrystalline alloys, called HITPERM have been shown to have attractiveinductions (1.6±2.1 T) combined with high permeabilities and high Curietemperatures. In FINEMETS a-FeSi nanoparticles with a DO3 structure areobserved, in NANOPERM a-Fe particles with a BCC structure are formed. InHITPERM alloys [134,276,277] nanocrystalline a-and a' BCC and B2±FeSi (B2)-FeCo are formed with signi®cantly improved high temperature magneticproperties than in the former two. HITPERM materials have been developed forapplications with smaller permeability requirements but required large inductionsat high temperatures.
NANOPERM (the original composition was Fe±Zr±B) was developed in Prof.Masumoto's laboratory at IMR Tohoku University in 1989. K. Suzuki joined thegroup at IMR to carry out a mechanical alloying project (development of bulkhigh-B materials from Fe-early-transition-metal nanocrystalline mechanicallyalloyed (MA) powders as originally proposed by A. Makino from ALPS Electricand Prof. A. Inoue. Contamination and oxidation e�ects in the MA process ledSuzuki and Dr. Kataoka to the idea of using melt-spinning. They ®rst expected tohave a nanoscale a-Fe/ZrB material, but were pleased to discover that their Fe±Zr±B melt-spun amorphous alloy crystallized to two-phase a-Fe/amorphousmaterials similar to the microstructure previously observed in FINEMET [299].HITPERM alloys were recently discovered by our group at CMU in 1997 whileinvestigating materials for high temperature soft magnetic applications. This storyis still unfolding, but we summarize some of the important and exciting initialresults of studies of this material as part of this review.
1.1. Technical considerations
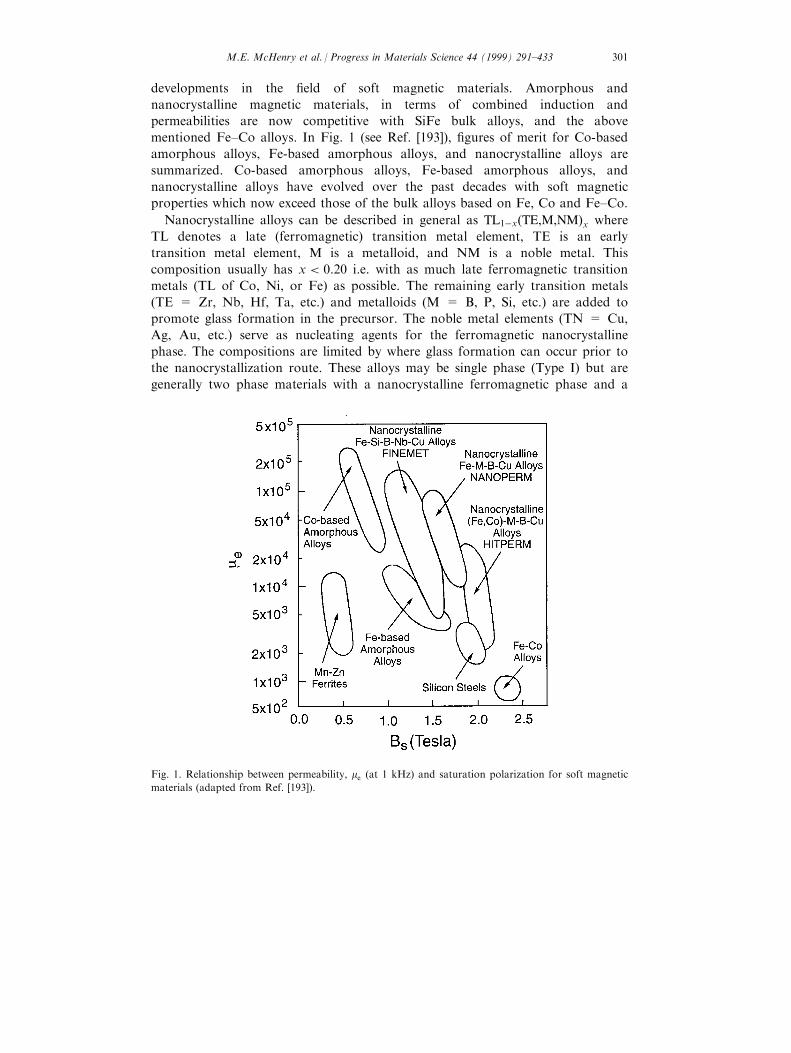
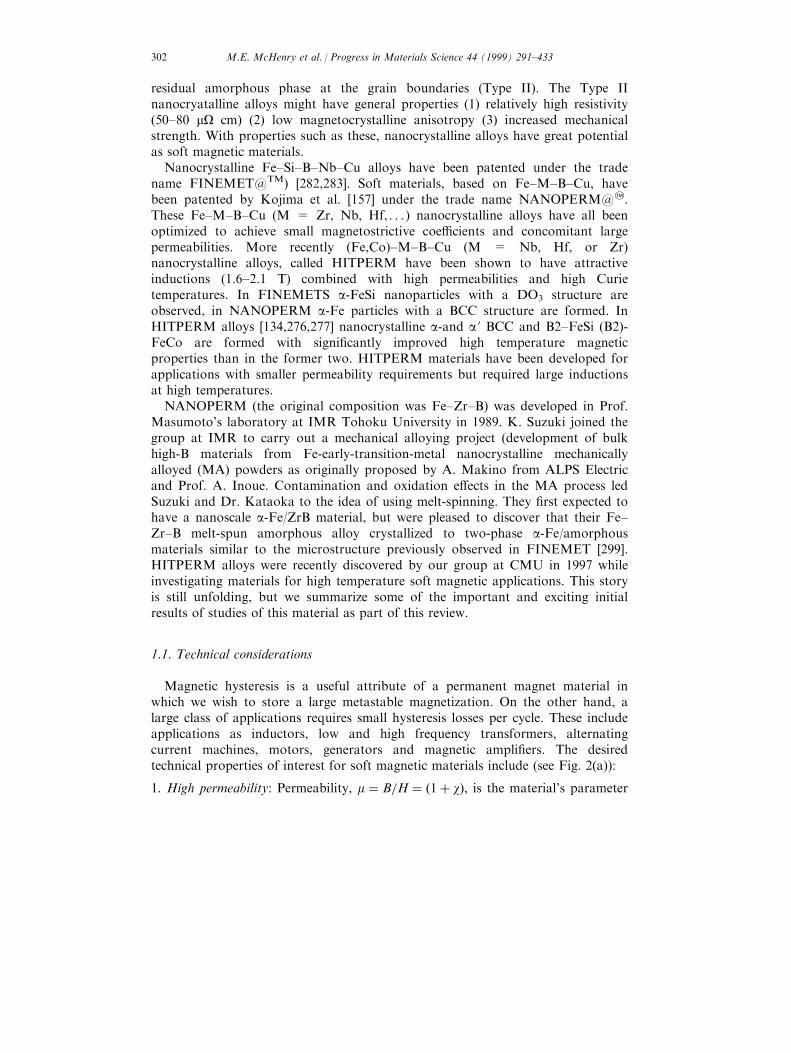
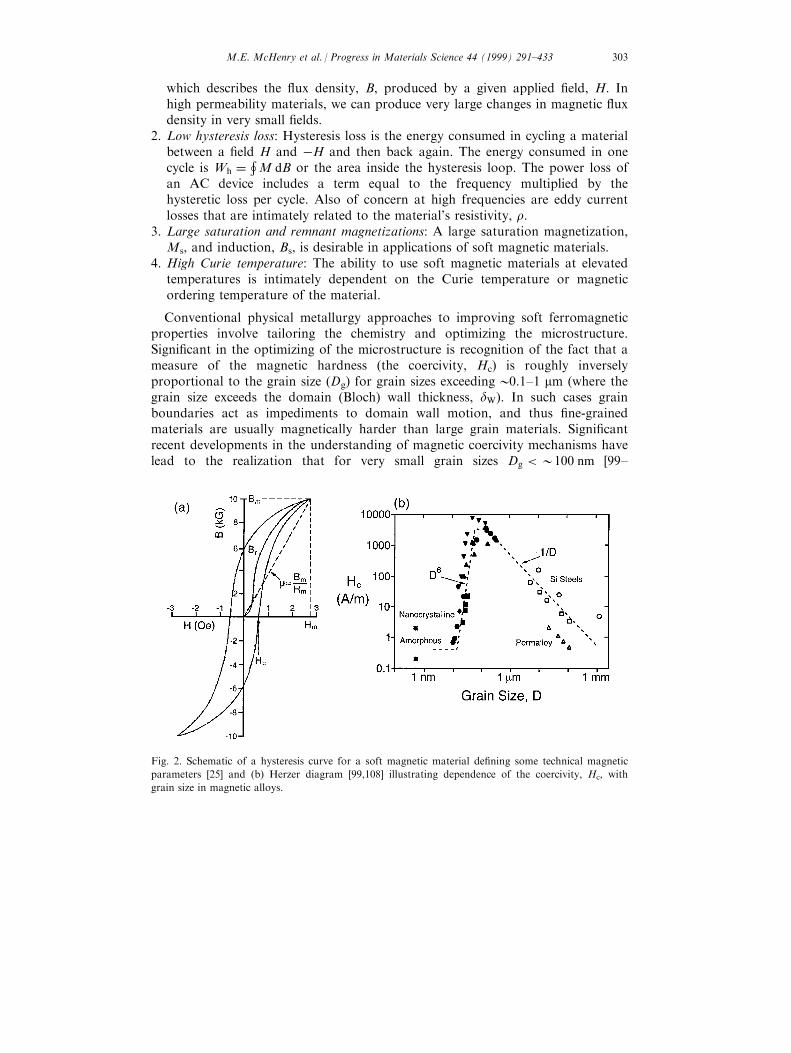
Magnetic hysteresis is a useful attribute of a permanent magnet material inwhich we wish to store a large metastable magnetization. On the other hand, alarge class of applications requires small hysteresis losses per cycle. These includeapplications as inductors, low and high frequency transformers, alternatingcurrent machines, motors, generators and magnetic ampli®ers. The desiredtechnical properties of interest for soft magnetic materials include (see Fig. 2(a)):
1. High permeability: Permeability, m � B=H � �1� w�, is the material's parameter
M.E. McHenry et al. / Progress in Materials Science 44 (1999) 291±433302
which describes the ¯ux density, B, produced by a given applied ®eld, H. Inhigh permeability materials, we can produce very large changes in magnetic ¯uxdensity in very small ®elds.
2. Low hysteresis loss: Hysteresis loss is the energy consumed in cycling a materialbetween a ®eld H and ÿH and then back again. The energy consumed in onecycle is Wh �
�M dB or the area inside the hysteresis loop. The power loss of
an AC device includes a term equal to the frequency multiplied by thehysteretic loss per cycle. Also of concern at high frequencies are eddy currentlosses that are intimately related to the material's resistivity, r.
3. Large saturation and remnant magnetizations: A large saturation magnetization,Ms, and induction, Bs, is desirable in applications of soft magnetic materials.
4. High Curie temperature: The ability to use soft magnetic materials at elevatedtemperatures is intimately dependent on the Curie temperature or magneticordering temperature of the material.
Conventional physical metallurgy approaches to improving soft ferromagneticproperties involve tailoring the chemistry and optimizing the microstructure.Signi®cant in the optimizing of the microstructure is recognition of the fact that ameasure of the magnetic hardness (the coercivity, Hc) is roughly inverselyproportional to the grain size (Dg) for grain sizes exceeding 00.1±1 mm (where thegrain size exceeds the domain (Bloch) wall thickness, dW). In such cases grainboundaries act as impediments to domain wall motion, and thus ®ne-grainedmaterials are usually magnetically harder than large grain materials. Signi®cantrecent developments in the understanding of magnetic coercivity mechanisms havelead to the realization that for very small grain sizes Dg < 0100 nm [99±
Fig. 2. Schematic of a hysteresis curve for a soft magnetic material de®ning some technical magnetic
parameters [25] and (b) Herzer diagram [99,108] illustrating dependence of the coercivity, Hc, with
grain size in magnetic alloys.
M.E. McHenry et al. / Progress in Materials Science 44 (1999) 291±433 303
102,104,105] Hc decreases rapidly with decreasing grain size (see Fig. 2b). This canbe understood by the fact that the domain wall, whose thickness, dW, exceeds thegrain size, now samples several (or many) grains so that ¯uctuations in magneticanisotropy on the grain size length scale are irrelevant to domain wall pinning.This important concept suggests that nanocrystalline and amorphous alloys havesigni®cant potential as soft magnetic materials. Soft magnetic properties requirethat nanocrystalline grains be exchange coupled and therefore any of theprocessing routes yielding free standing nanoparticles must include a compactionmethod in which the magnetic nanoparticles end up exchange coupled. Similarideas have been stated for so called spring exchange hard magnetic materials[37,150, 244].
In this review, we will explore issues which are pertinent to the generalunderstanding of the magnetic properties of amorphous and nanocrystallinematerials. As the state of the art for amorphous magnetic materials is welldeveloped and much of which has been thoroughly reviewed (see Refs.[92,93,183,219]), we will concentrate on highlights and recent developments. Thedevelopment of nanocrystalline materials for soft magnetic applications is anemerging ®eld for which we will try to o�er a current perspective that may wellevolve further with time.
The development of soft magnetic materials for applications requires attentionto a variety of intrinsic magnetic properties (some of them ancillary) as well asdevelopment of extrinsic magnetic properties through an appropriate optimizationof the microstructure. As intrinsic properties we take to mean microstructureinsensitive properties. Among the fundamental intrinsic properties (which dependon alloy chemistry and crystal structure) the saturation magnetization, Curietemperature, magnetocrystalline anisotropy and the magnetostrictive coe�cientsare all important. In a broader sense, magnetic anisotropy and magnetostrictioncan be considered as extrinsic in that for a two-phase material (in aggregate) theydepend on the microstructure. The desire for large magnetic inductions typicallylimits choices to alloys of Fe and Co (the elemental transition metal magnets withthe largest atomic dipole moments). Curie temperatures are also largest forelemental Fe (7708C) and Co (11008C), suggesting the use of Fe or Co (or Fe±Co)alloys especially in high temperature applications. It is these alloys which arediscussed in most detail here. Magnetocrystalline anisotropy and magnetostrictionwhich are determining factors in the ease in which the magnetization vector canbe rotated into the direction of the applied ®eld are also sensitively dependent onalloy chemistry. Many important soft magnetic alloy systems have zero crossingsof the magnetocrystalline anisotropy, or magnetostriction coe�cients which can beexploited in the development of premiere soft magnet materials.
A vast literature exists on the variation of intrinsic magnetic properties withalloy chemistry. Though new discoveries continue to be made in this area, it canbe safely stated that a more wide open area in the development of magneticmaterials for applications is the fundamental understanding and exploitation ofmicrostructure's in¯uence on the extrinsic magnetic properties. Importantmicrostructural features include grain size, shape and orientation, defect
M.E. McHenry et al. / Progress in Materials Science 44 (1999) 291±433304
concentrations, compositional inhomogeneities, magnetic domains and domainwalls. The interaction of magnetic domain walls with microstructural impedimentsto their motion is of particular importance to the understanding of soft magneticproperties. Extrinsic magnetic properties important in soft magnetic materialsinclude the magnetic permeability and the coercivity, which typically have aninverse relationship. Remnant magnetization, squareness of the hysteresis loopand magnetic anisotropy (crystalline, shape or stress related) are also important indetermining magnetic softness. Thorough discussions of soft magnetic materialsare developed in texts such as in Refs. [28,32,35,43] and review articles as in Ref.[25].
This article is organized as follows. Section 1 gives introduction and historicalperspective. Section 2 describes issues important to the design of soft magneticalloys. This section introduces the topics: magnetic dipole moments andmagnetization, ferromagnetic ordering (Curie) temperatures, magnetocrystallineanisotropy and magnetostriction, magnetic domains and magnetic domain wallmobility, AC magnetic response and considerations of glass forming ability.Section 3 discusses selected techniques used in the synthesis of amorphous andnanocrystalline magnetic materials. These include: powder synthesis ofnanoparticles and nanoencapsulates (carbon arc synthesis, plasma torch synthesis,mechanical milling and powder consolidation), rapid solidi®cation processing,solidi®cation processing of bulk amorphous alloys and primary nanocrystallizationof amorphous precursors. This is a selected and not exhaustive list of techniquesthat are ®nding or have the potential to ®nd commercial relevance for producingmaterials. Section 4 describes thermodynamics, crystallization of amorphousmaterials, crystallization reactions, surface crystallization, kinetics ofcrystallization, and ordering and structural phase transitions in nanocrystallinematerials. This includes summaries of experimental observations of the same.Section 5 discusses the structural observations of amorphous and nanocrystallinemagnetic materials. These include X-ray scattering experiments; observation ofmicrostructure and domain structure by transmission electron microscopy (TEM),high resolution TEM (HRTEM), Lorentz microscopy, optical microscopy andtunneling microscopy and spectroscopic observations by MoÈ ssbauer spectroscopy.Section 6 discusses models for magnetic dipole moments, magnetic valence, spinpolarized energy bands, and random exchange. It also describes intrinsic(microstructure insensitive) magnetic properties including magnetic dipolemoments, exchange interactions and Curie temperatures and observations inamorphous, bulk amorphous and nanocrystalline alloys. Exchange in disorderedsystems is discussed. Section 7 discusses models for random anisotropy, couplingin two-phase microstructures, induced anisotropies, etc. This includes much of therecent theoretical impetus behind the developments of nanocrystalline softmaterials. Key issues connecting fundamental magnetic properties andmicrostructure are developed. Here we describe extrinsic (microstructure sensitive)magnetic properties including magnetic anisotropy, magnetostriction, inducedmagnetic anisotropy and magnetic coupling mediated through amorphous phasesand observations in amorphous, bulk amorphous and nanocrystalline alloys.
M.E. McHenry et al. / Progress in Materials Science 44 (1999) 291±433 305
Section 8 summarizes applications of amorphous and nanocrystalline softmagnetic materials putting the recent developments in a historical perspective andintroducing some possible new applications for these materials. Section 9summarizes conclusions.
2. Alloy design issues
Alloy design issues include issues of chemistry and processing designed to (1)optimize one of a number of important intrinsic and/or extrinsic magneticproperties as well as to (2) optimize structural or microstructural features whichpromote important (usually extrinsic) magnetic properties. The ®rst of these issuesconcerns the choice of chemistry so as to impact the intrinsic magnetization of thematerial. The second issue pertinent to further discussions here are alloy additionsdesigned at aiding formation of an amorphous or bulk amorphous phase, as ameans to an end or as a precursor to producing a nanocrystalline material.
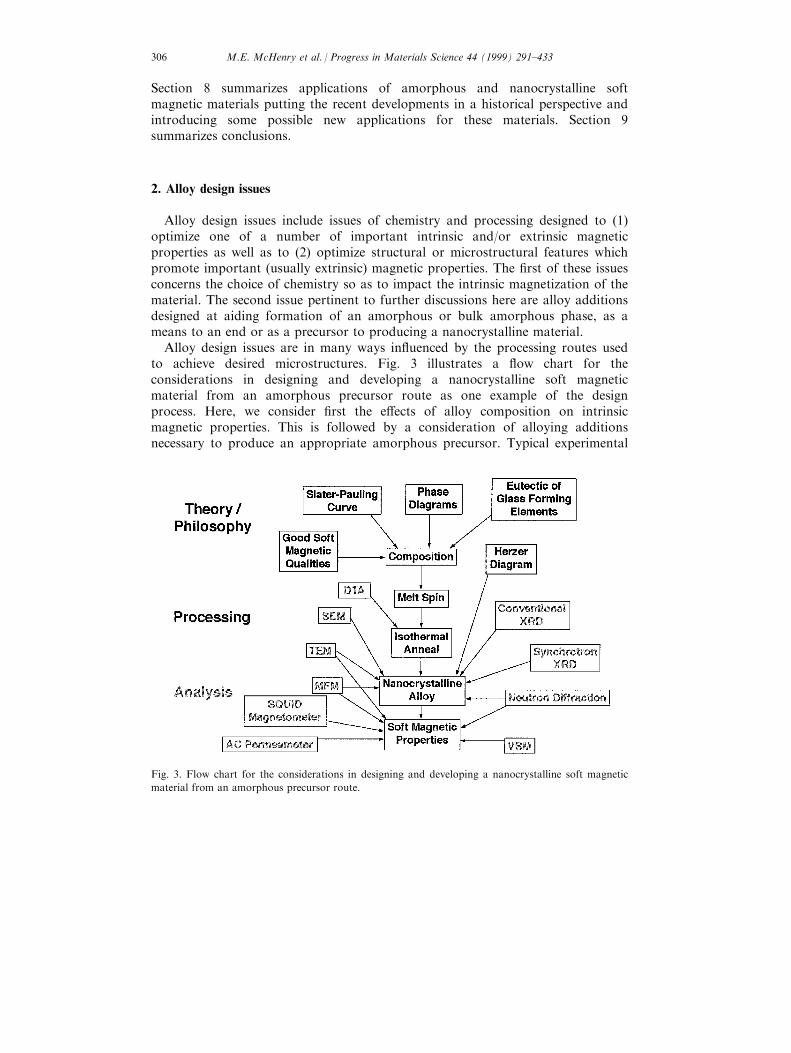
Alloy design issues are in many ways in¯uenced by the processing routes usedto achieve desired microstructures. Fig. 3 illustrates a ¯ow chart for theconsiderations in designing and developing a nanocrystalline soft magneticmaterial from an amorphous precursor route as one example of the designprocess. Here, we consider ®rst the e�ects of alloy composition on intrinsicmagnetic properties. This is followed by a consideration of alloying additionsnecessary to produce an appropriate amorphous precursor. Typical experimental
Fig. 3. Flow chart for the considerations in designing and developing a nanocrystalline soft magnetic
material from an amorphous precursor route.
M.E. McHenry et al. / Progress in Materials Science 44 (1999) 291±433306
steps used to identify the structure and properties of the resulting materials arealso illustrated. In the following we o�er an introductory discussion of the issuesin soft magnetic materials alloy design. Many of the issues introduced here will bediscussed in further detail, in the context of recent developments in later sections.
2.1. Magnetic dipole moments and magnetization
The vast majority of soft magnetic materials have one or more of theferromagnetic transition metal elements, Fe, Co or Ni, or the rare earth metal Gdas a majority component. The magnetic dipole moments of elemental and alloymagnets are most completely understood through the band theory of solids [170].The band theory of solids considers the broadening of localized atomic states withdiscrete eigenvalues into a continuum of states for more itinerant electrons over arange of energies. The theory allows for calculation of energy dispersion (i.e.energy as a function of wave vector) and orbital angular momentum speci®c andspin-resolved densities of states. The calculation of spin-resolved energy bands anddensities of states allows for the description of atom resolved magnetic dipolemoments and, therefore, spontaneous magnetization of elemental and alloymagnetic solids. Among the successes of the band theory descriptions of magneticproperties are:
1. The prediction of non-integral or half integral atomic dipole moments andresulting ground state magnetizations in metals and alloys.
2. The prediction that band widths and exchange splitting (energy di�erencesbetween spin up and spin down bands) are intimately dependent on magneticcoordination number and atomic volume.
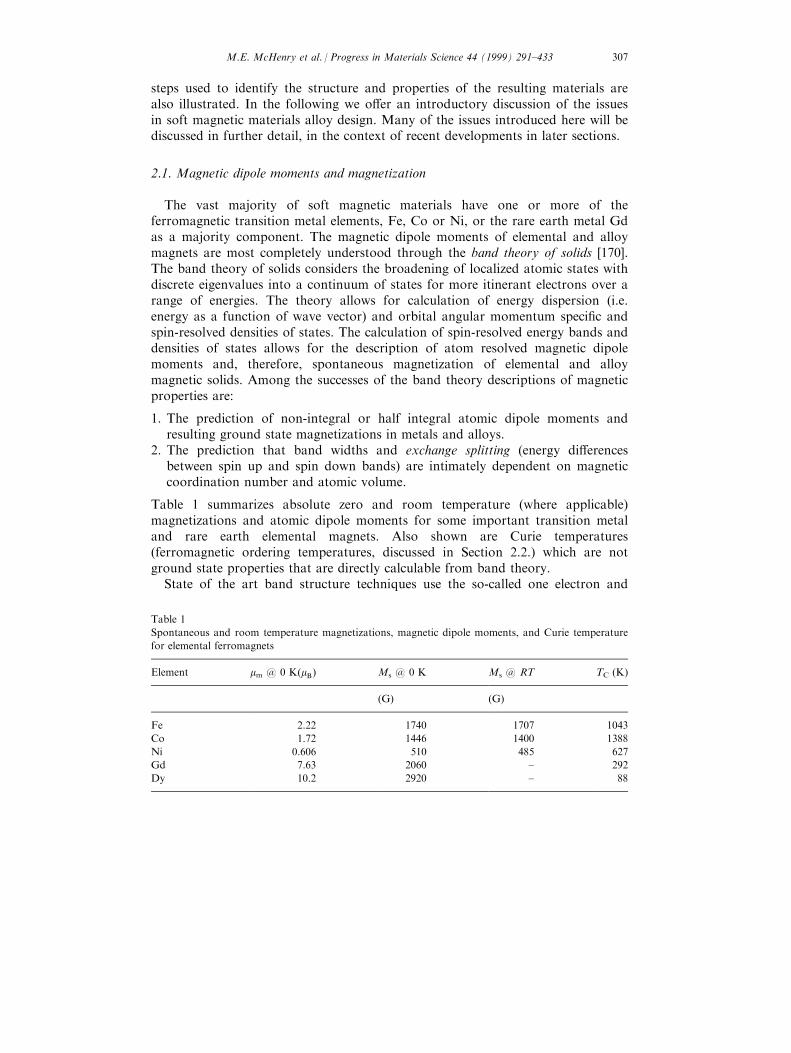
Table 1 summarizes absolute zero and room temperature (where applicable)magnetizations and atomic dipole moments for some important transition metaland rare earth elemental magnets. Also shown are Curie temperatures(ferromagnetic ordering temperatures, discussed in Section 2.2.) which are notground state properties that are directly calculable from band theory.
State of the art band structure techniques use the so-called one electron and
Table 1
Spontaneous and room temperature magnetizations, magnetic dipole moments, and Curie temperature
for elemental ferromagnets
Element mm @ 0 K(mB) Ms @ 0 K Ms @ RT TC (K)
(G) (G)
Fe 2.22 1740 1707 1043
Co 1.72 1446 1400 1388
Ni 0.606 510 485 627
Gd 7.63 2060 ± 292
Dy 10.2 2920 ± 88
M.E. McHenry et al. / Progress in Materials Science 44 (1999) 291±433 307
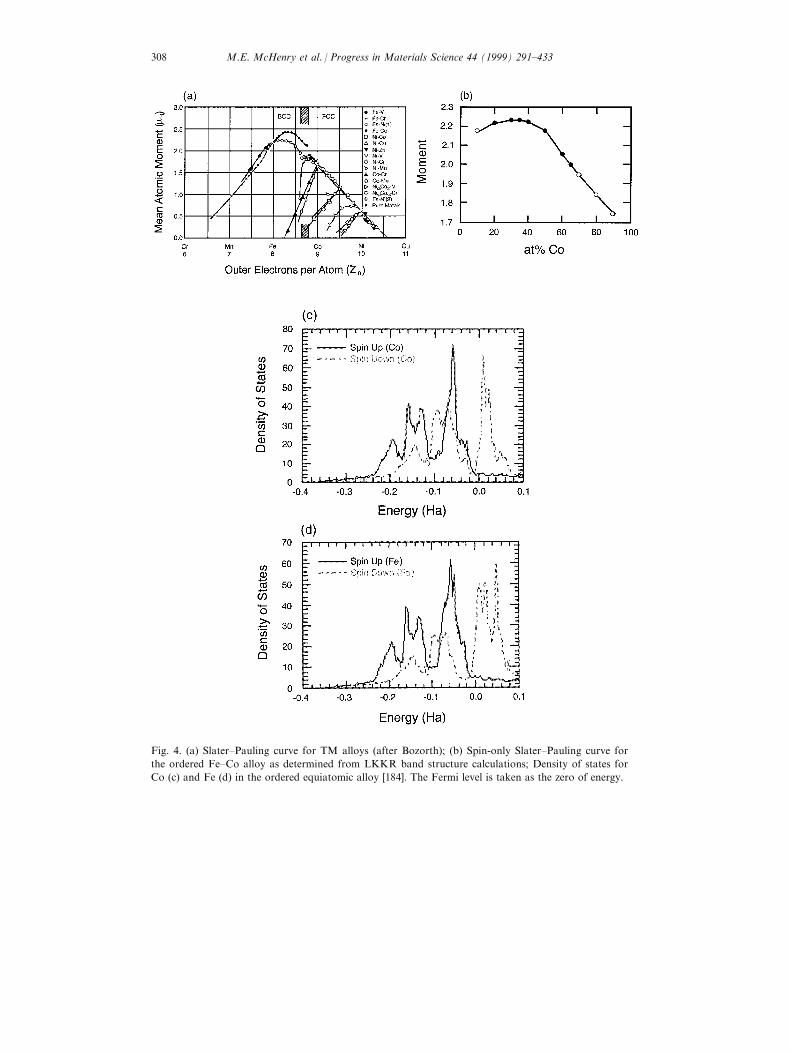
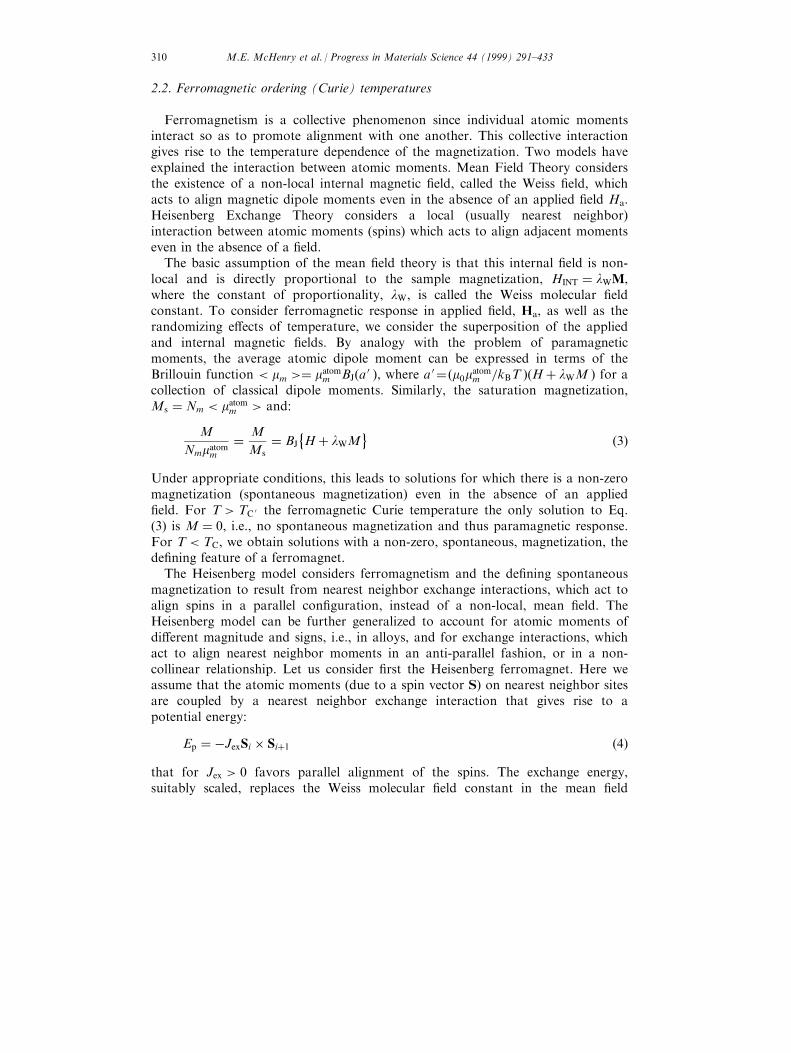
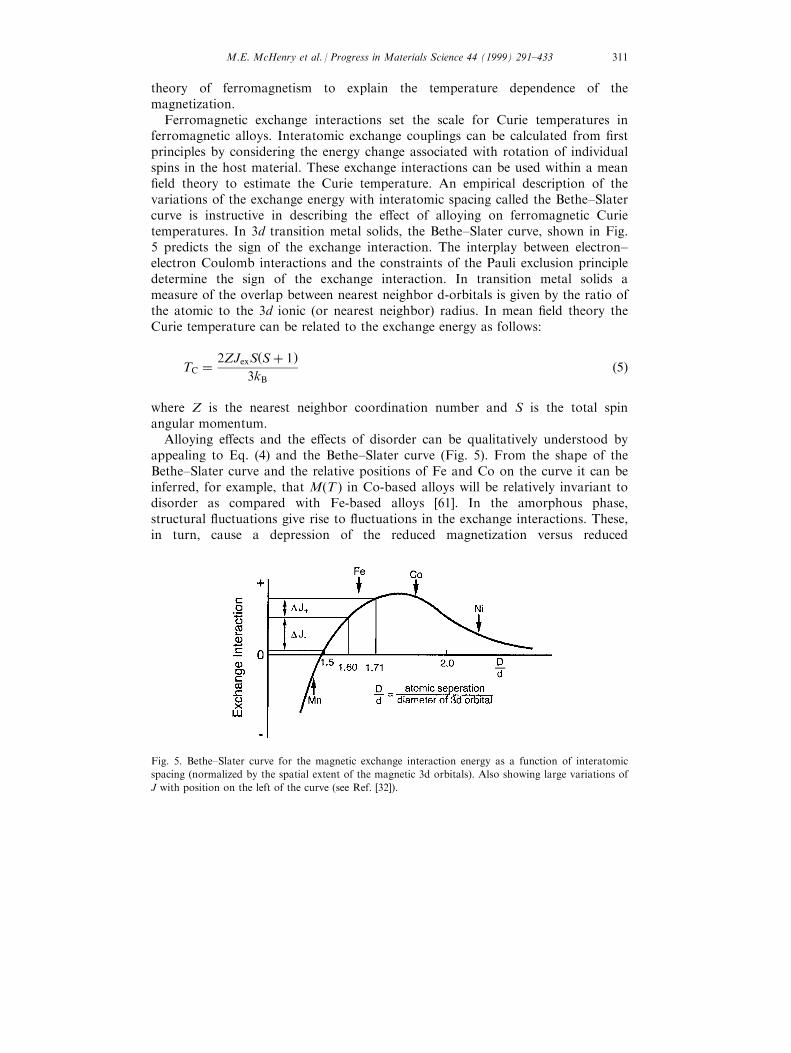
Fig. 4. (a) Slater±Pauling curve for TM alloys (after Bozorth); (b) Spin-only Slater±Pauling curve for
the ordered Fe±Co alloy as determined from LKKR band structure calculations; Density of states for
Co (c) and Fe (d) in the ordered equiatomic alloy [184]. The Fermi level is taken as the zero of energy.
M.E. McHenry et al. / Progress in Materials Science 44 (1999) 291±433308
local density approximations (for example the LKKR technique [185] whoseresults are consider in Table 1). These treat the electronic potential moreaccurately, but still not at the level of consideration of all individual electron±electron interactions. These result, for example, in densities of states with morestructure than in the simple free electron model and in more accurate descriptionof the magnetic states in solids. A detailed discussion of band structure techniquesis beyond the scope of this article. However, we do wish to illustrate someexample of the results of band theory in describing alloying e�ects on magneticdipole moments in solids.
Fig. 4(a) shows the Slater±Pauling curve that illustrates the variation of themean atomic magnetic dipole moment as a function of composition in transitionmetal alloy systems. Fig. 4(c) and (d) shows spin resolved densities of states g��E �and gÿ�E � for Co and Fe atoms, in an equiatomic FeCo alloy, as a function ofenergy (where the Fermi energy, EF, is taken as the zero of energy). The numberof spin up, n� and spin down, nÿ electrons in each band can again be calculatedby integrating these densities of state:
n� ��E �
F
0
g��E� dE and nÿ ��E ÿ
F
0
gÿ�E� dE �1�
(here the Fermi energies, EF, are the same and the zero's of energy are di�erentfor the two spin bands) and the atom resolved (i.e. Fe on Co) magnetic dipolemoments can be calculated as:
mm � �n� ÿ nÿ�mB �2�
Knowledge of atomic volumes or alloy density, then allows for the directcalculation of the alloy magnetization. Fig. 4(b) shows the band theory predictionof the average (spin only) dipole moment in a Fe1ÿxCox alloys as a function ofcomposition to be in good quantitative agreement with the experimentally derivedSlater±Pauling curve.
For magnetic alloy design the Slater±Pauling curve is an important startingpoint. The desire for large induction limits choices of alloys to those rich in Fe orCo and therefore near the top of the Slater±Pauling curve. As described in theSlater±Pauling curve Fe±Co alloys exhibit the largest magnetic inductions of anymaterial, and also have Curie temperatures which are desirable for hightemperature applications. Alloys near the equiatomic composition are particularlysoft and exhibit large permeabilities, but this magnetic softness is rooted in smallvalues of the ®rst-order magnetic anisotropy constant, Kl, which will be discussedfurther in Section 2.3. Fe-rich alloys typically have smaller inductions and lowerCurie temperatures than Fe±Co alloys. Fe±Si is another premiere crystalline softmaterial whose signi®cant application includes transformer laminate. Co alloyscan also be soft but only if the FCC phase of Co is present. Co-rich alloystypically have smaller inductions and larger TC's.
M.E. McHenry et al. / Progress in Materials Science 44 (1999) 291±433 309
2.2. Ferromagnetic ordering (Curie) temperatures
Ferromagnetism is a collective phenomenon since individual atomic momentsinteract so as to promote alignment with one another. This collective interactiongives rise to the temperature dependence of the magnetization. Two models haveexplained the interaction between atomic moments. Mean Field Theory considersthe existence of a non-local internal magnetic ®eld, called the Weiss ®eld, whichacts to align magnetic dipole moments even in the absence of an applied ®eld Ha.Heisenberg Exchange Theory considers a local (usually nearest neighbor)interaction between atomic moments (spins) which acts to align adjacent momentseven in the absence of a ®eld.
The basic assumption of the mean ®eld theory is that this internal ®eld is non-local and is directly proportional to the sample magnetization, HINT � lWM,where the constant of proportionality, lW, is called the Weiss molecular ®eldconstant. To consider ferromagnetic response in applied ®eld, Ha, as well as therandomizing e�ects of temperature, we consider the superposition of the appliedand internal magnetic ®elds. By analogy with the problem of paramagneticmoments, the average atomic dipole moment can be expressed in terms of theBrillouin function < mm >� matom
m BJ�a 0 �, where a 0 ��m0matomm =kBT ��H� lWM � for a
collection of classical dipole moments. Similarly, the saturation magnetization,Ms � Nm < matom
m > and:
M
Nmmatomm
� M
Ms� BJ
�H� lWM
�3�
Under appropriate conditions, this leads to solutions for which there is a non-zeromagnetization (spontaneous magnetization) even in the absence of an applied®eld. For T > TC 0 the ferromagnetic Curie temperature the only solution to Eq.(3) is M � 0, i.e., no spontaneous magnetization and thus paramagnetic response.For T < TC, we obtain solutions with a non-zero, spontaneous, magnetization, thede®ning feature of a ferromagnet.
The Heisenberg model considers ferromagnetism and the de®ning spontaneousmagnetization to result from nearest neighbor exchange interactions, which act toalign spins in a parallel con®guration, instead of a non-local, mean ®eld. TheHeisenberg model can be further generalized to account for atomic moments ofdi�erent magnitude and signs, i.e., in alloys, and for exchange interactions, whichact to align nearest neighbor moments in an anti-parallel fashion, or in a non-collinear relationship. Let us consider ®rst the Heisenberg ferromagnet. Here weassume that the atomic moments (due to a spin vector S) on nearest neighbor sitesare coupled by a nearest neighbor exchange interaction that gives rise to apotential energy:
Ep � ÿJexSi � Si�1 �4�
that for Jex > 0 favors parallel alignment of the spins. The exchange energy,suitably scaled, replaces the Weiss molecular ®eld constant in the mean ®eld
M.E. McHenry et al. / Progress in Materials Science 44 (1999) 291±433310
theory of ferromagnetism to explain the temperature dependence of themagnetization.
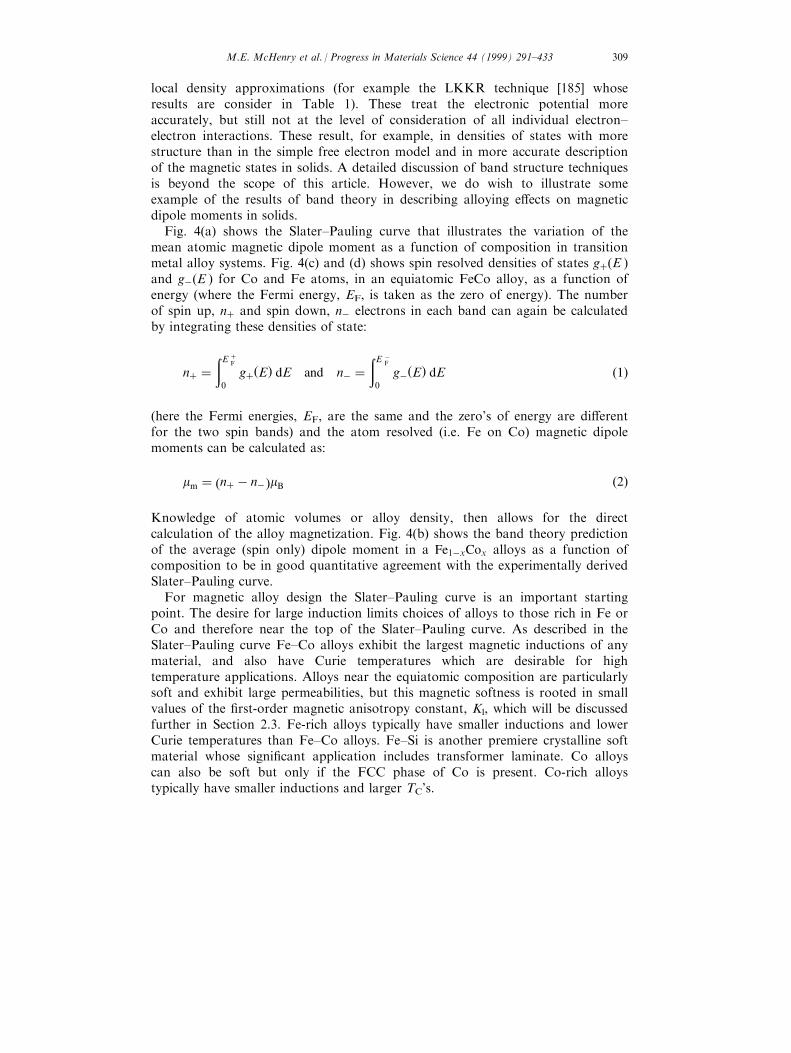
Ferromagnetic exchange interactions set the scale for Curie temperatures inferromagnetic alloys. Interatomic exchange couplings can be calculated from ®rstprinciples by considering the energy change associated with rotation of individualspins in the host material. These exchange interactions can be used within a mean®eld theory to estimate the Curie temperature. An empirical description of thevariations of the exchange energy with interatomic spacing called the Bethe±Slatercurve is instructive in describing the e�ect of alloying on ferromagnetic Curietemperatures. In 3d transition metal solids, the Bethe±Slater curve, shown in Fig.5 predicts the sign of the exchange interaction. The interplay between electron±electron Coulomb interactions and the constraints of the Pauli exclusion principledetermine the sign of the exchange interaction. In transition metal solids ameasure of the overlap between nearest neighbor d-orbitals is given by the ratio ofthe atomic to the 3d ionic (or nearest neighbor) radius. In mean ®eld theory theCurie temperature can be related to the exchange energy as follows:
TC � 2ZJexS�S� 1�3kB
�5�
where Z is the nearest neighbor coordination number and S is the total spinangular momentum.
Alloying e�ects and the e�ects of disorder can be qualitatively understood byappealing to Eq. (4) and the Bethe±Slater curve (Fig. 5). From the shape of theBethe±Slater curve and the relative positions of Fe and Co on the curve it can beinferred, for example, that M(T ) in Co-based alloys will be relatively invariant todisorder as compared with Fe-based alloys [61]. In the amorphous phase,structural ¯uctuations give rise to ¯uctuations in the exchange interactions. These,in turn, cause a depression of the reduced magnetization versus reduced
Fig. 5. Bethe±Slater curve for the magnetic exchange interaction energy as a function of interatomic
spacing (normalized by the spatial extent of the magnetic 3d orbitals). Also showing large variations of
J with position on the left of the curve (see Ref. [32]).
M.E. McHenry et al. / Progress in Materials Science 44 (1999) 291±433 311
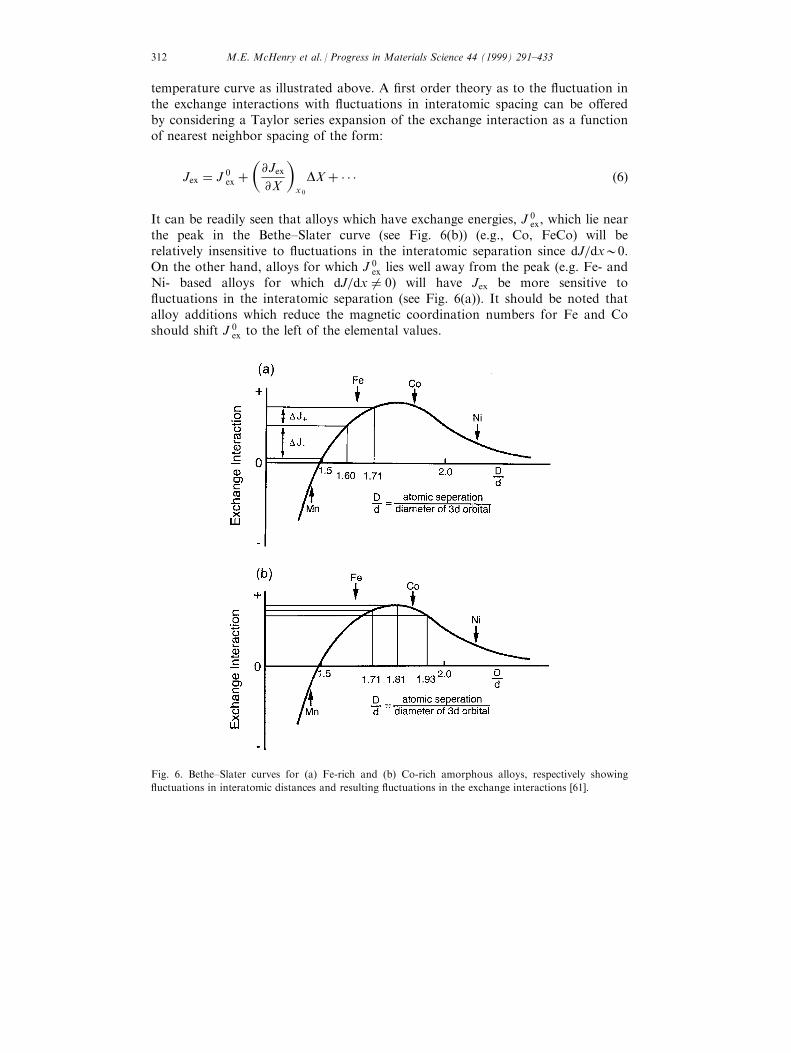
temperature curve as illustrated above. A ®rst order theory as to the ¯uctuation inthe exchange interactions with ¯uctuations in interatomic spacing can be o�eredby considering a Taylor series expansion of the exchange interaction as a functionof nearest neighbor spacing of the form:
Jex � J 0ex �
�@Jex
@X
�x 0
DX� � � � �6�
It can be readily seen that alloys which have exchange energies, J 0ex, which lie near
the peak in the Bethe±Slater curve (see Fig. 6(b)) (e.g., Co, FeCo) will berelatively insensitive to ¯uctuations in the interatomic separation since dJ=dx00.On the other hand, alloys for which J 0
ex lies well away from the peak (e.g. Fe- andNi- based alloys for which dJ=dx 6� 0) will have Jex be more sensitive to¯uctuations in the interatomic separation (see Fig. 6(a)). It should be noted thatalloy additions which reduce the magnetic coordination numbers for Fe and Coshould shift J 0
ex to the left of the elemental values.
Fig. 6. Bethe±Slater curves for (a) Fe-rich and (b) Co-rich amorphous alloys, respectively showing
¯uctuations in interatomic distances and resulting ¯uctuations in the exchange interactions [61].
M.E. McHenry et al. / Progress in Materials Science 44 (1999) 291±433312
2.3. Magnetocrystalline anisotropy and magnetostriction
The magnetization curve (Fig. 2(a)) illustrates the technical magnetic propertiesof a ferromagnetic material. Its shape is determined by minimizing the material'smagnetic free energy. The magnetic free energy consists of terms associated withthe ®eld energy (Zeeman energy), self-®eld (demagnetization energy), wall energy,and magnetic anisotropy energy. The magnetic Helmholtz free energy [37] can bedetermined by integrating a magnetic energy density as follows:
FM ��"
A�r��rM
Ms
�2ÿKl�r�
�M� n
Ms
�2ÿm0M�H
#dr �7�
where A(r) is the local exchange sti�ness (A � CJS 2=a at 0 K, with C01depending on crystal structure and a is the interatomic spacing), K1�r� is the(leading term) local magnetic anisotropy energy density, M is the magnetizationvector, n is a unit vector parallel to the easy direction of magnetization and H isthe sum of the applied ®eld and demagnetization ®eld vectors. The magneticanisotropy energy describes the angular dependence of the magnetic energy, i.e. itsdependence on angles y and f between the magnetization and an easy axis ofmagnetization [37,244]. The anisotropy energy can be further subdivided intomagnetocrystalline, shape and stress anisotropies, etc.
Since the magnetic anisotropy represents a barrier to switching themagnetization for soft magnetic materials, a small magnetic anisotropy is desiredso as to minimize the hysteretic losses and maximize the permeability. The desirefor small magnetocrystalline anisotropy necessitates the choice of cubic crystallinephases of Fe, Co, Ni or alloys such as FeCo, FeNi, etc. (with small values of K1).In crystalline alloys, such as permalloy or FeCo, the alloy chemistry is varied sothat the ®rst order magnetocrystalline anisotropy energy density, K1, is minimized.Similarly, stress anisotropy is reduced in alloys with nearly zero magnetostriction.Shape anisotropy results from demagnetization e�ects and is minimized byproducing materials with magnetic grains with large aspects ratios. Amorphousalloys are a special class of soft materials where (in some notable cases) lowmagnetic anisotropies result from the lack of crystalline periodicity.
Magnetostriction is the process by which the shape of a ferromagnetic materialschanges in the process of magnetization as a result of magnetoelastic interactions.It is included as a magnetic anisotropy e�ect because of its angular dependence,but in reality it represents a higher order e�ect in that it involves the coupling ofthe magnetic anisotropy and elastic properties of the material. Magnetostrictionresults in the ferromagnetic material being strained during the process ofmagnetization. The average strain dl=l for a typical transition metal ferromagnet isin the order of 10ÿ5±10ÿ6. Magnetostriction is a deleterious property for softmagnetic applications (i.e. it is the source of loss in transformers which isaccompanied by transformer hum). The strain in a magnetostrictive materialincreases with increasing ®eld until such point that it saturates having a value, ls.
The physical origin of magnetostrictive response lies in spin-orbit interactions as
M.E. McHenry et al. / Progress in Materials Science 44 (1999) 291±433 313
is also the case for magnetocrystalline anisotropy. Where magnetocrystallineanisotropy results from coupling of the magnetization and easy crystalline axes,the magnetostrictive component involves magnetoelastic coupling and the dilationor expansion of the lattice as a consequence of rotation of the magnetization inthe magnetization process. Magnetostrictive coe�cients are also dependent onchemical composition and can be optimized (subject to other constraints) byvarying the chemistry [110].
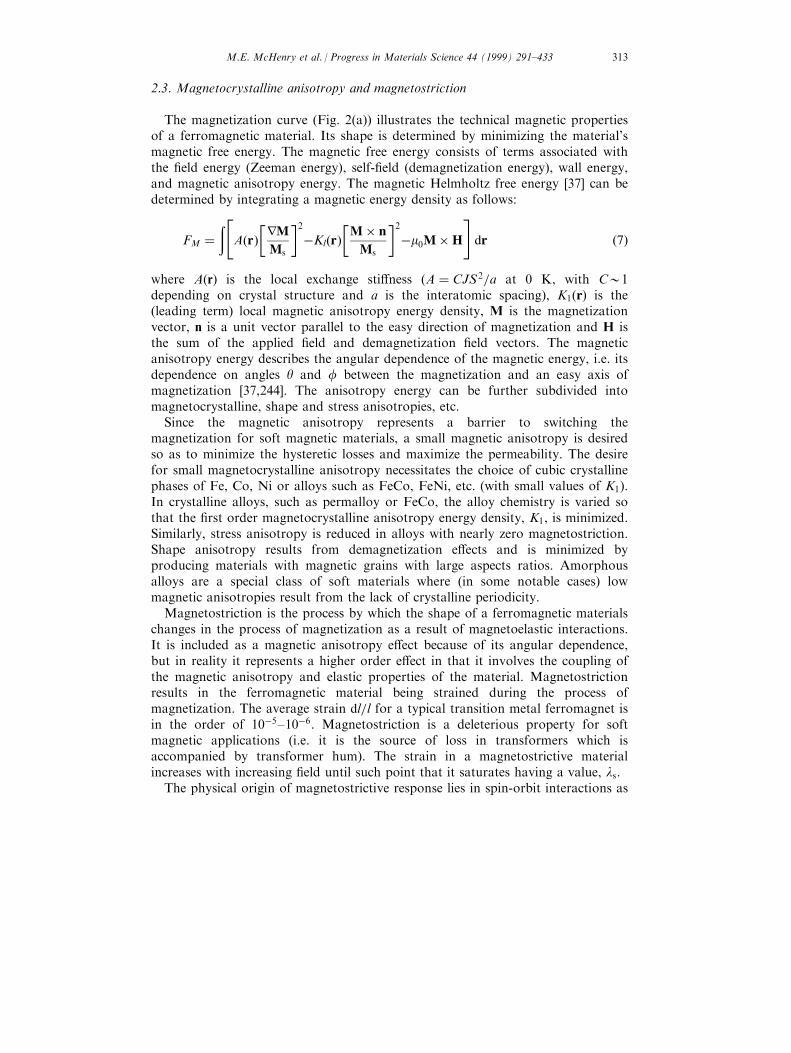
As an example of the dependence of magnetic anisotropy and magnetostriction(as well as magnetization) on alloy chemistry, Fig. 7 illustrates the variation ofsaturation induction, Curie temperature, magnetocrystalline anisotropy, Kl, andmagnetostriction, l, in FeCo alloys. In choosing a binary alloy composition in thebinary Fe1ÿxCox system it is important to consider the maximum induction whichoccurs near x � 0:3, the minimum magnetocrystalline anisotropy which occursnear x � 0:5, and ®nally compositions which minimize magnetostrictive
Fig. 7. (a) Saturation magnetization and Curie temperature, (b) magnetocrystalline anisotropy, Kl and
magnetostriction. l, in the FeCo system (reproduced from P®efer and Radelo� [225]).
M.E. McHenry et al. / Progress in Materials Science 44 (1999) 291±433314
coe�cients. In the FeCo alloys magnetostriction coe�cients, l111 and l100 areboth substantial near the equiatomic composition where the magnetocrystallineanisotropy vanishes. Across this alloy system, Curie temperatures are large enoughto cause no problems in high temperature magnetization (i.e. 5008C). Theseconsiderations have been coupled with consideration of alloy resistivity (importantfor determining eddy current losses) and alloy additions which in¯uencemechanical properties to design an alloy for rotor applications in electric aircraftengines. Magnetostriction considerations are also known to be quite important inthe design of soft magnetic materials for inductive devices, transformers and ahost of other applications.
2.4. Magnetic domains and domain wall mobility
In a ferromagnet there are macroscopic volumes, called magnetic domains, overwhich atomic magnetic moments are aligned due to the internal (Weiss) ®eld oralternatively the ferromagnetic exchange interaction. In a typical magneticmaterial a macroscopic volume of the material contains many domains. Each ofthese domains has a spontaneous magnetization of magnitude, Ms. In the absenceof an aligning ®eld the magnetization vectors are aligned di�erently from domainto domain. Thus if we take the vector average of the magnetization over manydomains we arrive at zero sample magnetization, hMi � 0, because of vectorcancellation of the random domain moments. The magnetization process involvesthe growth of domains that are favorably oriented with the applied magnetic ®eldat the expense of those that are not.
Having more than one domain requires an interfacial region between domainscalled a domain wall. Associated with this interface is a positive domain wallenergy. The ultimate number and size, of magnetic domains in a sample isdetermined by a balance between the volume, magnetostatic, and interfacialdomain wall energies. In soft materials, which have been optimized to have verylow rotational energy barriers, the major determinant of the shape of themagnetization curve is domain wall motion.
In future discussions, we will ®nd it useful to describe several length scales thatare associated with domains and domain walls. These are expressed throughconsideration of domain wall energetics. The energy per unit area in the wall canbe expressed as a sum of exchange and anisotropy energy terms:
gWall � gexc � gK �8�where the anisotropy energy per unit volume, K, is multiplied by volumecontained in a domain wall, AWdW, and divided by cross-sectional area to arriveat an anisotropy energy per unit area:
gK � K
�AWdW
AW
�� KdW � K�Na� �9�
where dW � Npa (a is the lattice constant in the direction of rotation and N is the
M.E. McHenry et al. / Progress in Materials Science 44 (1999) 291±433 315
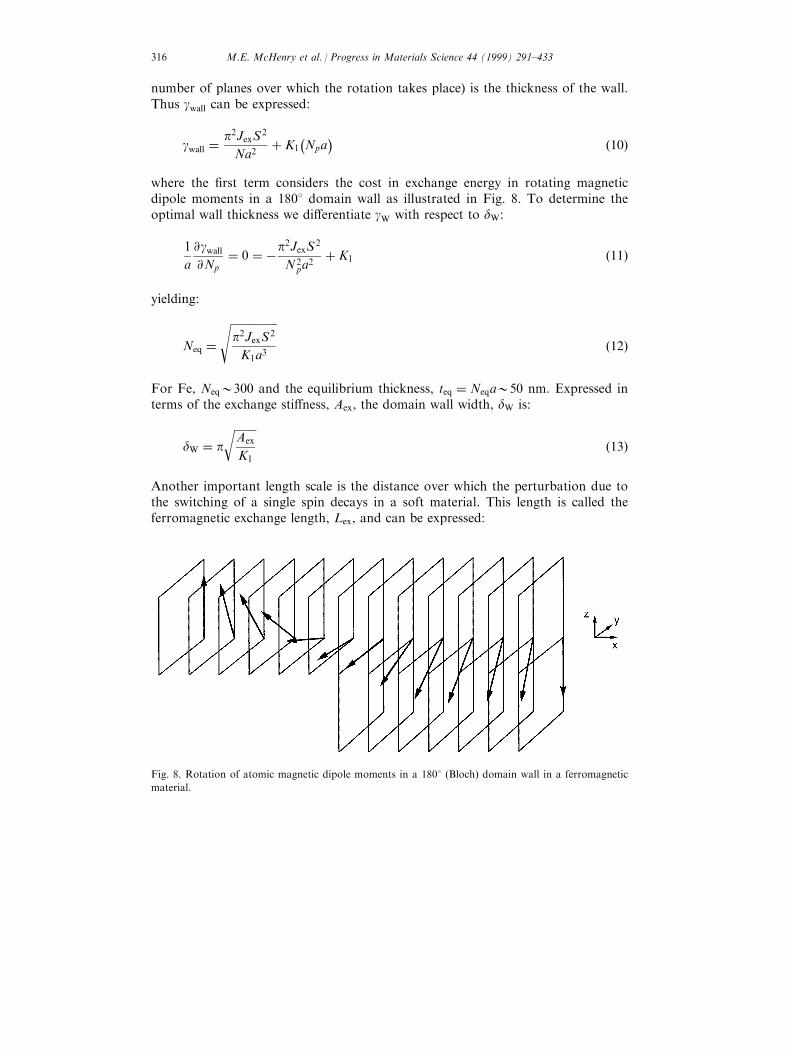
number of planes over which the rotation takes place) is the thickness of the wall.Thus gwall can be expressed:
gwall �p2JexS
2
Na2� K1
ÿNpa
� �10�
where the ®rst term considers the cost in exchange energy in rotating magneticdipole moments in a 1808 domain wall as illustrated in Fig. 8. To determine theoptimal wall thickness we di�erentiate gW with respect to dW:
1
a
@gwall
@Np� 0 � ÿp
2JexS2
N2pa
2� K1 �11�
yielding:
Neq ������������������p2JexS
2
K1a3
s�12�
For Fe, Neq0300 and the equilibrium thickness, teq � Neqa050 nm. Expressed interms of the exchange sti�ness, Aex, the domain wall width, dW is:
dW � p
��������Aex
K1
r�13�
Another important length scale is the distance over which the perturbation due tothe switching of a single spin decays in a soft material. This length is called theferromagnetic exchange length, Lex, and can be expressed:
Fig. 8. Rotation of atomic magnetic dipole moments in a 1808 (Bloch) domain wall in a ferromagnetic
material.
M.E. McHenry et al. / Progress in Materials Science 44 (1999) 291±433316
Lex ��������������Aex
m0M2s
s�14�
The ferromagnetic exchange length is 03 nm. for ferromagnetic iron- or cobalt-based alloys. The ratio of the exchange length to dW=p is a dimensionlessparameter, k, called the magnetic hardness parameter:
k � pLex
dW
��������������K1
m0M2s
s�15�
For hard magnetic materials k is in the order of unity and thus there is littledi�erence between the ferromagnetic exchange length and the domain wall width.On the other hand, for good soft magnetic materials, where K1 approaches zero,can deviate substantially from unity.
Structure sensitive magnetic properties may depend on defect concentration(point, line and planar defects), atomic order, impurities, second phases, thermalhistory, etc. In multi-domain materials, the domain wall energy density,g � 4�AK1�1=2 � g�x�, is spatially varying as a result of local variations inproperties due to chemical variation, defects, etc. A domain wall will prefer tolocate itself in regions where the magnetic order parameter is suppressed, i. e.pinning sites. Since changes in induction in high-permeability materials occur bydomain wall motion, it is desirable to limit variation of g�x� (pinning). This is oneof the key design issues in developing soft magnetic materials, i.e. that of processcontrol of the microstructure so as to optimize the soft magnetic properties.
2.5. AC magnetic response
Soft magnetic material's magnetic loss mechanisms include: (1) hysteresis lossdue to irreversible domain wall motion and rotational out of easy axes lossmechanism, (2) eddy current losses and (3) anomalous losses. The energy loss percycle is given by
�B dH and for linear response the power loss is f� B2=2m, where
f is the frequency. In real materials (which are nonlinear) we express the hysteresispower loss as:
Ph0Ch f Bnmax �16�
where Ch may vary with the material, and a typical exponent n is01.6. Eddycurrent loss results from the fact that df=dt induces voltages in the core materialwith consequent V 2=R power loss appearing as heat. This power loss can bereduced by decreasing V and increasing R. Since V0f Bmax then the power lossdue to eddy currents is proportional to f 2B2
max, i.e.:
Pe � Cef2B2
max �17�To reduce the eddy current loss in sheet transformers, they are often laminated soas to reduce the length scale of eddy current loops. In designing transformers the
M.E. McHenry et al. / Progress in Materials Science 44 (1999) 291±433 317
total power loss:
PTOT � Ph � Pe � Ch f Bnmax � Ce f
2 B2max �18�
must be minimized.The important physical parameters which can be altered to minimize alternating
current (AC) losses are those in¯uencing the hysteresis loss as described above andthose which in¯uence the eddy current losses. By and large the most importantphysical parameter which in¯uence the eddy current losses and therefore the highfrequency losses is the electrical resistivity, r. Large electrical resistivities areessential for reducing AC losses. Electrical resistivities in amorphous alloys can beseveral hundred mO cm and for nanocrystalline alloys 050 mO cm, which in bothcases o�er signi®cant advantage over crystalline metallic magnetic materials (01±10 mO cm).
2.6. Considerations of glass forming ability and crystallization
The considerations for synthesizing amorphous metallic alloys are often at oddswith the considerations for optimizing magnetic properties. This is because theaddition of typical glass forming agents has a deleterious e�ect on such intrinsicmagnetic properties as the saturation induction and the Curie temperature.Considerations for glass forming ability in binary systems include the temperatureand composition of the eutectic, the terminal phases to the right and left of theeutectic composition, the slope of the liquidus as a function of composition, etc. Ifthe amorphous alloy is to be used as a precursor for the production of ananocrystalline material the primary and secondary crystallization temperaturesare of importance as is the structure of the ferromagnetic nanocrystalline phasethat is the product of primary crystallization. Table 2 summarizes theseparameters for selected binary Co- and Fe- with early transition metals (TE) andmetalloids (M).
The alloy chemistry considerations for synthesizing amorphous metallic alloys,bulk amorphous alloys and amorphous precursors for nanocrystallization routescan all be di�erent and will be discussed in more detail in Section 3. Some generalobservations can be made, however, which o�er useful insights in magnetic alloydesign. First, alloying additions with non-magnetic species will reduce averagemagnetic dipole moments at the least by dilution and more if the solute potentialis strongly perturbing or if strong chemical bonding between the magnetictransition metal and second component occurs (as is the case in TL±M systems).It is, therefore, desirable to have the eutectic composition as close to pure TL aspossible, so as to keep the magnetization high.
Typical phase diagrams for a TL±TE (Fe±Zr) and TL±M (Fe±B) are illustratedin Fig. 9. TL±TE systems typically have much lower eutectic compositions thanTL±M. In typical metallic glasses the TL±M eutectic occurs near 20 at% M andinductions exceeding 01.3 T are generally not possible. In synthesizing bulkamorphous materials the considerations are di�erent and the so-called `confusion
M.E. McHenry et al. / Progress in Materials Science 44 (1999) 291±433318
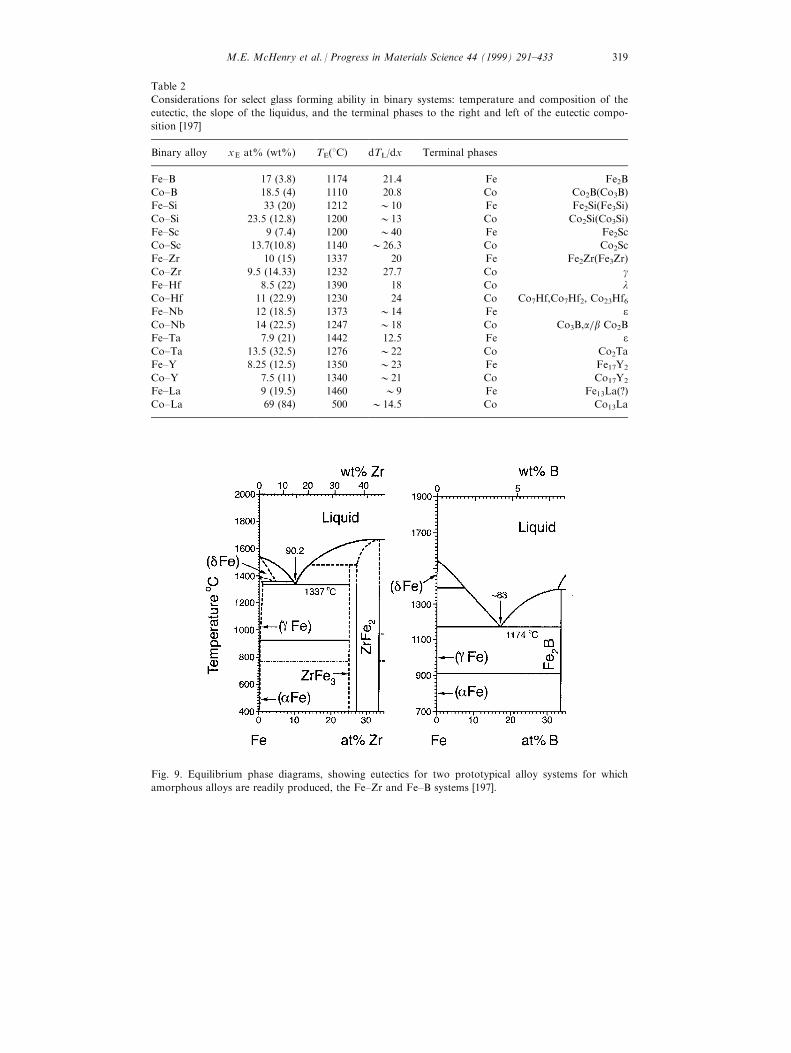
Table 2
Considerations for select glass forming ability in binary systems: temperature and composition of the
eutectic, the slope of the liquidus, and the terminal phases to the right and left of the eutectic compo-
sition [197]
Binary alloy xE at% (wt%) TE(8C) dTL/dx Terminal phases
Fe±B 17 (3.8) 1174 21.4 Fe Fe2B
Co±B 18.5 (4) 1110 20.8 Co Co2B(Co3B)
Fe±Si 33 (20) 1212 010 Fe Fe2Si(Fe3Si)
Co±Si 23.5 (12.8) 1200 013 Co Co2Si(Co3Si)
Fe±Sc 9 (7.4) 1200 040 Fe Fe2Sc
Co±Sc 13.7(10.8) 1140 026.3 Co Co2Sc
Fe±Zr 10 (15) 1337 20 Fe Fe2Zr(Fe3Zr)
Co±Zr 9.5 (14.33) 1232 27.7 Co gFe±Hf 8.5 (22) 1390 18 Co lCo±Hf 11 (22.9) 1230 24 Co Co7Hf,Co7Hf2, Co23Hf6Fe±Nb 12 (18.5) 1373 014 Fe eCo±Nb 14 (22.5) 1247 018 Co Co3B,a=b Co2B
Fe±Ta 7.9 (21) 1442 12.5 Fe eCo±Ta 13.5 (32.5) 1276 022 Co Co2Ta
Fe±Y 8.25 (12.5) 1350 023 Fe Fe17Y2
Co±Y 7.5 (11) 1340 021 Co Co17Y2
Fe±La 9 (19.5) 1460 09 Fe Fe13La(?)
Co±La 69 (84) 500 014.5 Co Co13La
Fig. 9. Equilibrium phase diagrams, showing eutectics for two prototypical alloy systems for which
amorphous alloys are readily produced, the Fe±Zr and Fe±B systems [197].
M.E. McHenry et al. / Progress in Materials Science 44 (1999) 291±433 319
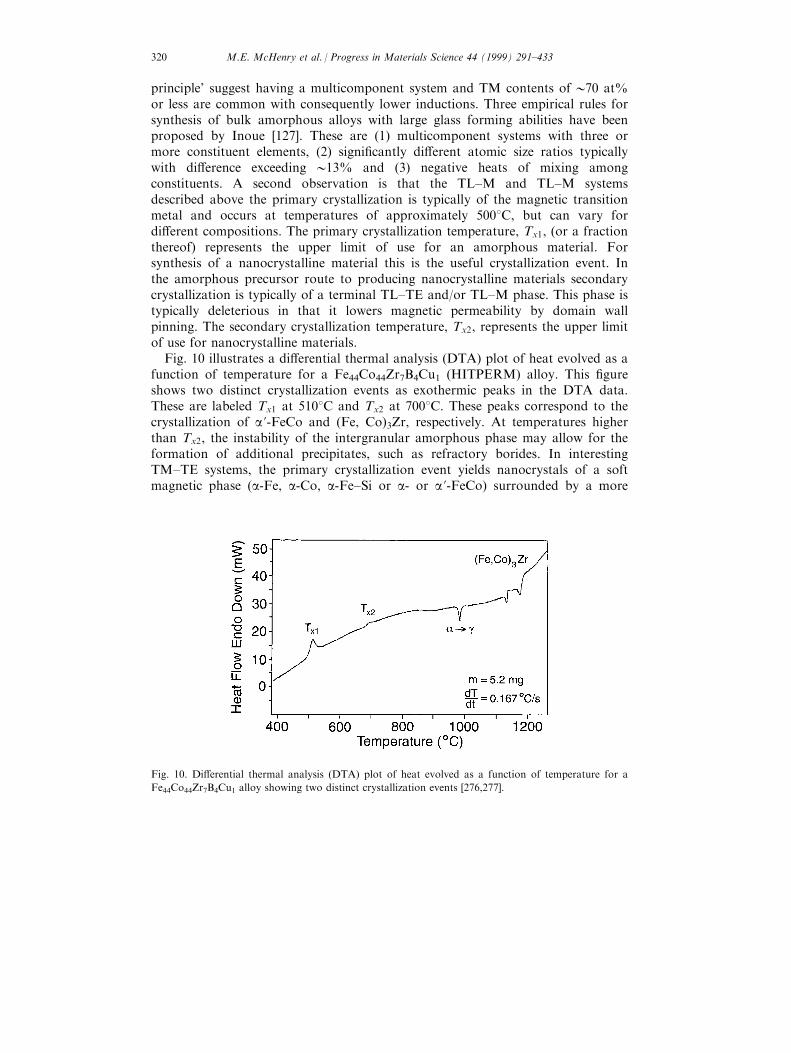
principle' suggest having a multicomponent system and TM contents of 070 at%or less are common with consequently lower inductions. Three empirical rules forsynthesis of bulk amorphous alloys with large glass forming abilities have beenproposed by Inoue [127]. These are (1) multicomponent systems with three ormore constituent elements, (2) signi®cantly di�erent atomic size ratios typicallywith di�erence exceeding 013% and (3) negative heats of mixing amongconstituents. A second observation is that the TL±M and TL±M systemsdescribed above the primary crystallization is typically of the magnetic transitionmetal and occurs at temperatures of approximately 5008C, but can vary fordi�erent compositions. The primary crystallization temperature, Tx1, (or a fractionthereof) represents the upper limit of use for an amorphous material. Forsynthesis of a nanocrystalline material this is the useful crystallization event. Inthe amorphous precursor route to producing nanocrystalline materials secondarycrystallization is typically of a terminal TL±TE and/or TL±M phase. This phase istypically deleterious in that it lowers magnetic permeability by domain wallpinning. The secondary crystallization temperature, Tx2, represents the upper limitof use for nanocrystalline materials.
Fig. 10 illustrates a di�erential thermal analysis (DTA) plot of heat evolved as afunction of temperature for a Fe44Co44Zr7B4Cu1 (HITPERM) alloy. This ®gureshows two distinct crystallization events as exothermic peaks in the DTA data.These are labeled Tx1 at 5108C and Tx2 at 7008C. These peaks correspond to thecrystallization of a'-FeCo and (Fe, Co)3Zr, respectively. At temperatures higherthan Tx2, the instability of the intergranular amorphous phase may allow for theformation of additional precipitates, such as refractory borides. In interestingTM±TE systems, the primary crystallization event yields nanocrystals of a softmagnetic phase (a-Fe, a-Co, a-Fe±Si or a- or a'-FeCo) surrounded by a more
Fig. 10. Di�erential thermal analysis (DTA) plot of heat evolved as a function of temperature for a
Fe44Co44Zr7B4Cu1 alloy showing two distinct crystallization events [276,277].
M.E. McHenry et al. / Progress in Materials Science 44 (1999) 291±433320
stable intergranular amorphous phase. The composition of this intergranularamorphous phase is also important in determining its ultimate stability and itsmagnetic properties as will be discussed further in subsequent sections.
Further alloy considerations in the amorphous precursor route are the additionsof other components (e.g. Cu) which come out of solution early and provide manynucleation sites for the primary crystallization events [10,118]. The addition ofsmall amounts of Cu to alloys is also commonly thought to depress Tx. Of course,the above mentioned considerations based on the in¯uence of alloy compositionand its e�ects on intrinsic and extrinsic magnetic properties must be consideredalong with the considerations of microstructural control to optimize the magneticproperties of the ®nal material.
3. Synthesis of nanoparticles, amorphous, bulk amorphous and nanocrystalline alloys
The synthesis of amorphous and nanocrystalline alloys requires consideration ofthe alloy design issues as discussed in the previous section. However, judiciouschoice of the processing method is necessary to produce alloys in the amorphousstate. Circumventing the crystallization process is also necessary for alloyformation in the amorphous state, either as an end product or as precursor tonanocrystallization. The kinetics of crystallization will be discussed in the nextsection. In this section, synthesis routes that have proven successful for producingamorphous and nanocrystalline alloys will be discussed.
We will limit our discussion to the following four synthesis routes (thoughothers certainly exist) which are viable for producing alloys for larger scaleapplications, as opposed to thin ®lm synthesis for microelectronic applications, forexample. These synthesis routes are:
1. Powder synthesis techniques: Magnetic nanocrystals may be synthesized as freestanding powders or nanoencapsulates which must then be compacted to forma bulk alloy with nanocrystalline grains. Examples of these techniques includeCarbon-arc synthesis, plasma torch synthesis and gas atomization techniques,among others. We discuss selected powder synthesis techniques that include C-arc synthesis, plasma torch synthesis and mechanical milling techniques.
2. Rapid solidi®cation processing: Amorphous alloys can be produced by a varietyof rapid solidi®cation processing routes. These typically require cooling rates of> 104 K/s for typical alloys at a eutectic composition. Examples of thesetechniques include splat quenching, melt spinning, etc. Slower cooling rate arepossible for bulk amorphous alloys as described next.
3. Solidi®cation processing of bulk amorphous alloys: Bulk amorphous alloys areformed by more conventional solidi®cation routes with slower cooling rates.The so-called large glass forming abilities of these alloys allows for productionof amorphous materials with much larger dimensions, thus the name bulkamorphous alloys.
4. Crystallization of amorphous precursors: Bulk alloys with nanocrystalline grains
M.E. McHenry et al. / Progress in Materials Science 44 (1999) 291±433 321
can also be produced by solid state reaction (crystallization) of an amorphousprecursor.
3.1. Powder synthesis of nanoparticles and nanoencapsulates
Nanometer-sized atomic clusters have demonstrated remarkable magneticproperties that di�er both from the properties of the individual atoms and fromthe properties of bulk crystalline solids. Nanoencapsulated materials refer to suchparticles which are passivated by encapsulation with a protective chemicallydistinct coating. The utility of nanoencapsulated materials depends on the abilityto tailor magnetic properties by controlling the size distribution, morphology, andchemical composition on a nanoscale. A variety of synthesis techniques have beenused to produce nanoparticles at the research level including gas condensation,mechanical attrition, chemical or physical vapor deposition, chemicalprecipitation, aerosol reactions, atomization, biological templating,electrodeposition, and rapid solidi®cation. Synthesis routes capable of scaling toindustrial production levels and accomplishing nanoencapsulation include C-arcand plasma technology and mechanical milling techniques that will be discussedbelow. The former are two techniques which have been employed by the CarnegieMellon University group in the synthesis of magnetic nanoparticles andencapsulated magnetic nanoparticles which are discussed as examples of currentprocessing routes for the production of magnetic nanoparticles andnanoencapsulates. The latter has been used commonly as a synthesis route fornanoparticles.
3.1.1. Carbon arc synthesisThe KraÈ tschmer±Hu�man carbon arc process [171] has been a primary method
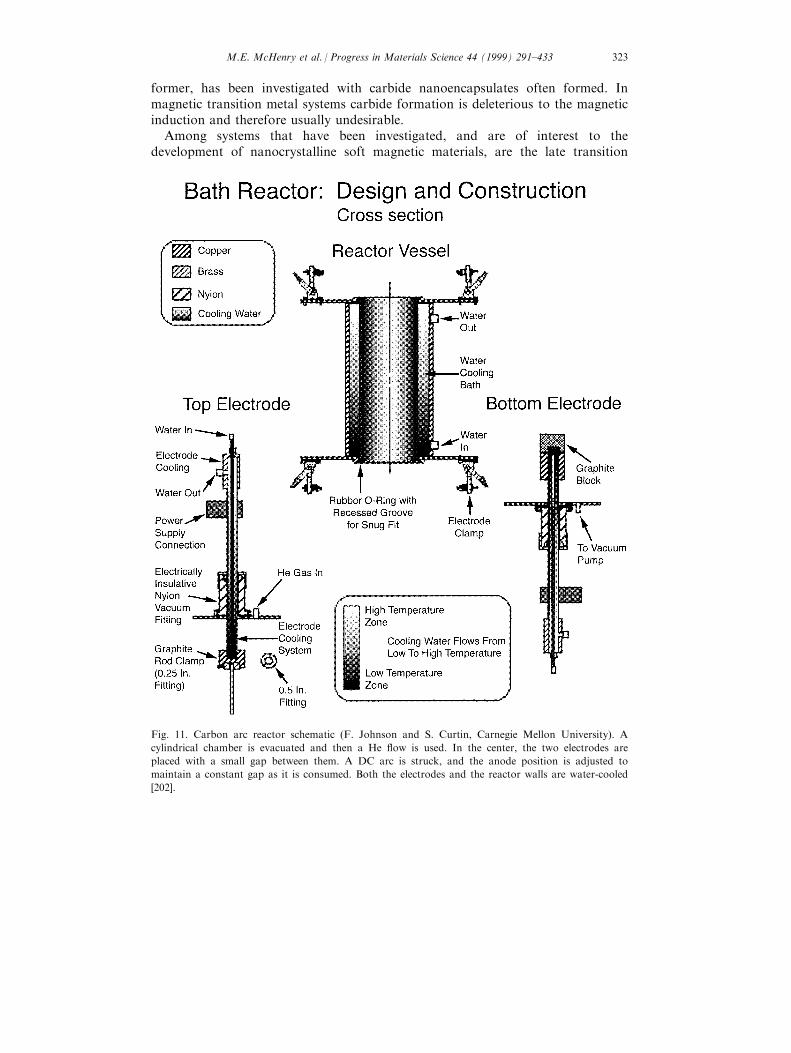
employed to synthesize nanoencapsulates, nanotubes and endohedral fullerenes[18]. Carbon electrodes, with metal or metal oxide, graphite, and an organicbinder have been commonly employed. The technique allows for production ofmetal or metal carbide nanoparticles with protective carbon coatings. An exampleof a C-arc reactor is illustrated in Fig. 11. A water-cooled bath reactor is shownthat has been employed by the group at Carnegie Mellon University to synthesizenanoencapsulates of a variety of materials.
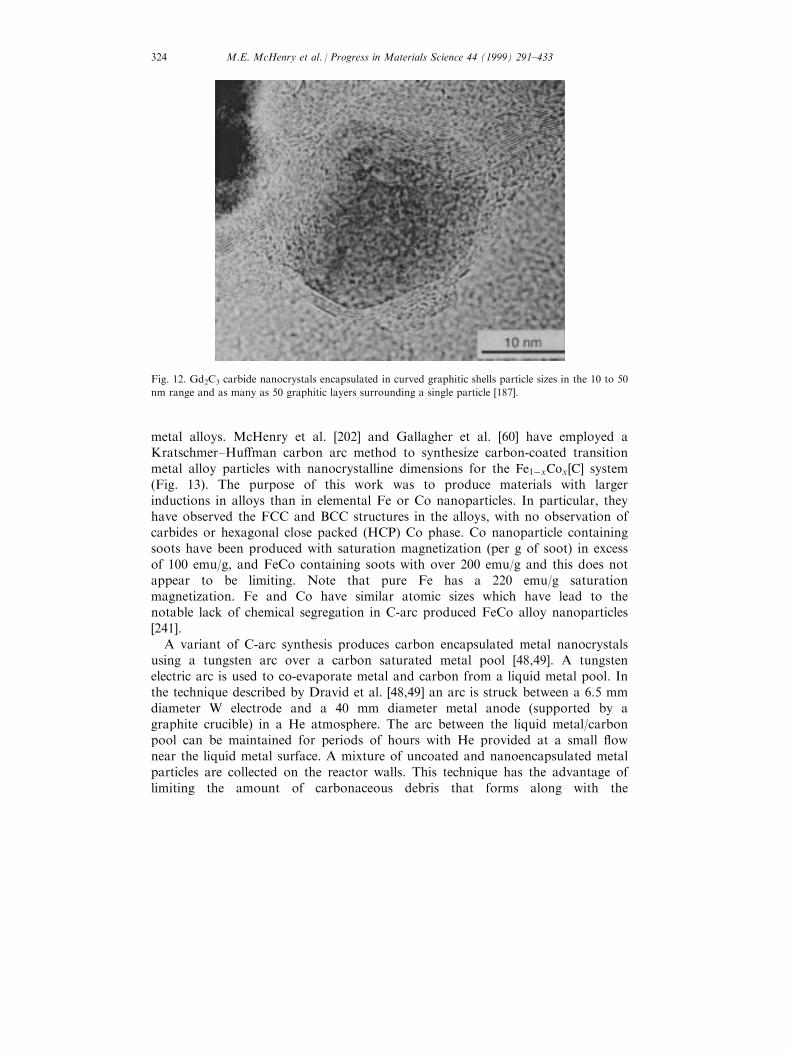
As an illustrative example of the morphology of these particles, Fig. 12 shows ahigh resolution transmission electron microscopy (HRTEM) image of Gd2C3
carbide nanocrystals encapsulated in curved graphitic shells particle sizes in the 10to 50 nm range and as many as 50 graphitic layers surrounding a single particle.Carbide formation depends on the metal/carbon phase diagram, e.g. Co and Niare poor carbide formers. C-encapsulated transition metals free of carbide phaseshave been synthesized by several groups [201,234]. These are particularlyinteresting because of their magnetic properties and the ability to formmonodomain magnetic particles. Encapsulation of Fe, which is a good carbide
M.E. McHenry et al. / Progress in Materials Science 44 (1999) 291±433322
former, has been investigated with carbide nanoencapsulates often formed. Inmagnetic transition metal systems carbide formation is deleterious to the magneticinduction and therefore usually undesirable.
Among systems that have been investigated, and are of interest to thedevelopment of nanocrystalline soft magnetic materials, are the late transition
Fig. 11. Carbon arc reactor schematic (F. Johnson and S. Curtin, Carnegie Mellon University). A
cylindrical chamber is evacuated and then a He ¯ow is used. In the center, the two electrodes are
placed with a small gap between them. A DC arc is struck, and the anode position is adjusted to
maintain a constant gap as it is consumed. Both the electrodes and the reactor walls are water-cooled
[202].
M.E. McHenry et al. / Progress in Materials Science 44 (1999) 291±433 323
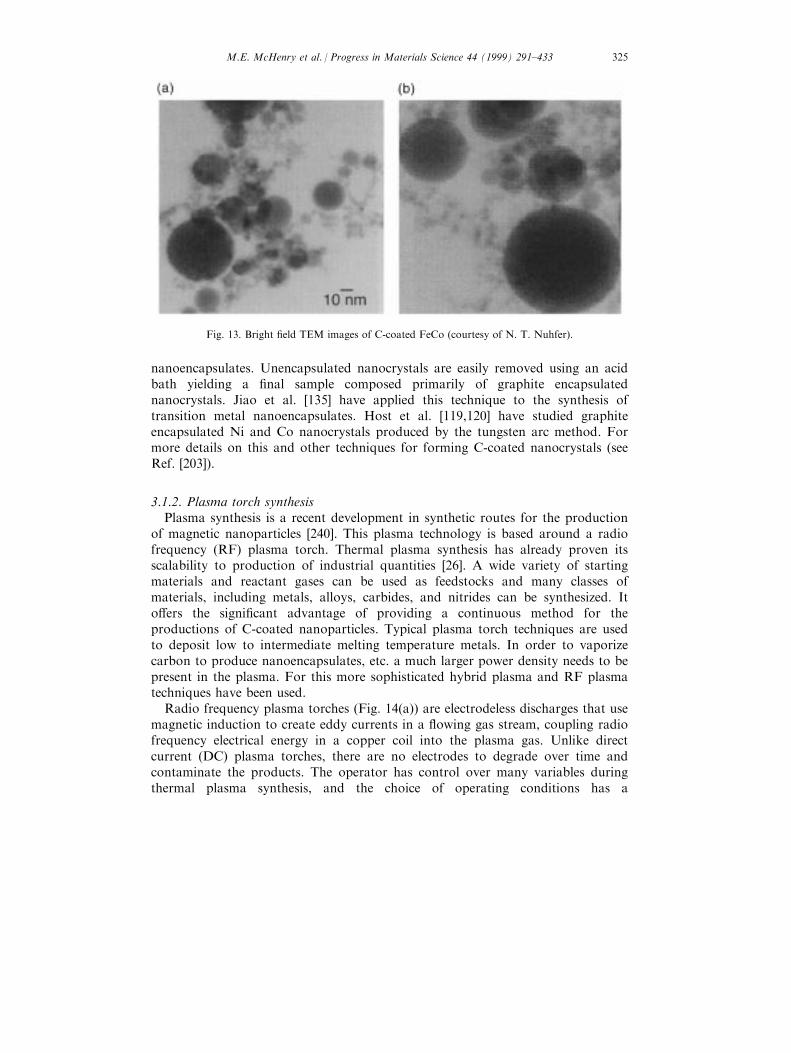
metal alloys. McHenry et al. [202] and Gallagher et al. [60] have employed aKratschmer±Hu�man carbon arc method to synthesize carbon-coated transitionmetal alloy particles with nanocrystalline dimensions for the Fe1ÿxCox�C� system(Fig. 13). The purpose of this work was to produce materials with largerinductions in alloys than in elemental Fe or Co nanoparticles. In particular, theyhave observed the FCC and BCC structures in the alloys, with no observation ofcarbides or hexagonal close packed (HCP) Co phase. Co nanoparticle containingsoots have been produced with saturation magnetization (per g of soot) in excessof 100 emu/g, and FeCo containing soots with over 200 emu/g and this does notappear to be limiting. Note that pure Fe has a 220 emu/g saturationmagnetization. Fe and Co have similar atomic sizes which have lead to thenotable lack of chemical segregation in C-arc produced FeCo alloy nanoparticles[241].
A variant of C-arc synthesis produces carbon encapsulated metal nanocrystalsusing a tungsten arc over a carbon saturated metal pool [48,49]. A tungstenelectric arc is used to co-evaporate metal and carbon from a liquid metal pool. Inthe technique described by Dravid et al. [48,49] an arc is struck between a 6.5 mmdiameter W electrode and a 40 mm diameter metal anode (supported by agraphite crucible) in a He atmosphere. The arc between the liquid metal/carbonpool can be maintained for periods of hours with He provided at a small ¯ownear the liquid metal surface. A mixture of uncoated and nanoencapsulated metalparticles are collected on the reactor walls. This technique has the advantage oflimiting the amount of carbonaceous debris that forms along with the
Fig. 12. Gd2C3 carbide nanocrystals encapsulated in curved graphitic shells particle sizes in the 10 to 50
nm range and as many as 50 graphitic layers surrounding a single particle [187].
M.E. McHenry et al. / Progress in Materials Science 44 (1999) 291±433324
nanoencapsulates. Unencapsulated nanocrystals are easily removed using an acidbath yielding a ®nal sample composed primarily of graphite encapsulatednanocrystals. Jiao et al. [135] have applied this technique to the synthesis oftransition metal nanoencapsulates. Host et al. [119,120] have studied graphiteencapsulated Ni and Co nanocrystals produced by the tungsten arc method. Formore details on this and other techniques for forming C-coated nanocrystals (seeRef. [203]).
3.1.2. Plasma torch synthesisPlasma synthesis is a recent development in synthetic routes for the production
of magnetic nanoparticles [240]. This plasma technology is based around a radiofrequency (RF) plasma torch. Thermal plasma synthesis has already proven itsscalability to production of industrial quantities [26]. A wide variety of startingmaterials and reactant gases can be used as feedstocks and many classes ofmaterials, including metals, alloys, carbides, and nitrides can be synthesized. Ito�ers the signi®cant advantage of providing a continuous method for theproductions of C-coated nanoparticles. Typical plasma torch techniques are usedto deposit low to intermediate melting temperature metals. In order to vaporizecarbon to produce nanoencapsulates, etc. a much larger power density needs to bepresent in the plasma. For this more sophisticated hybrid plasma and RF plasmatechniques have been used.
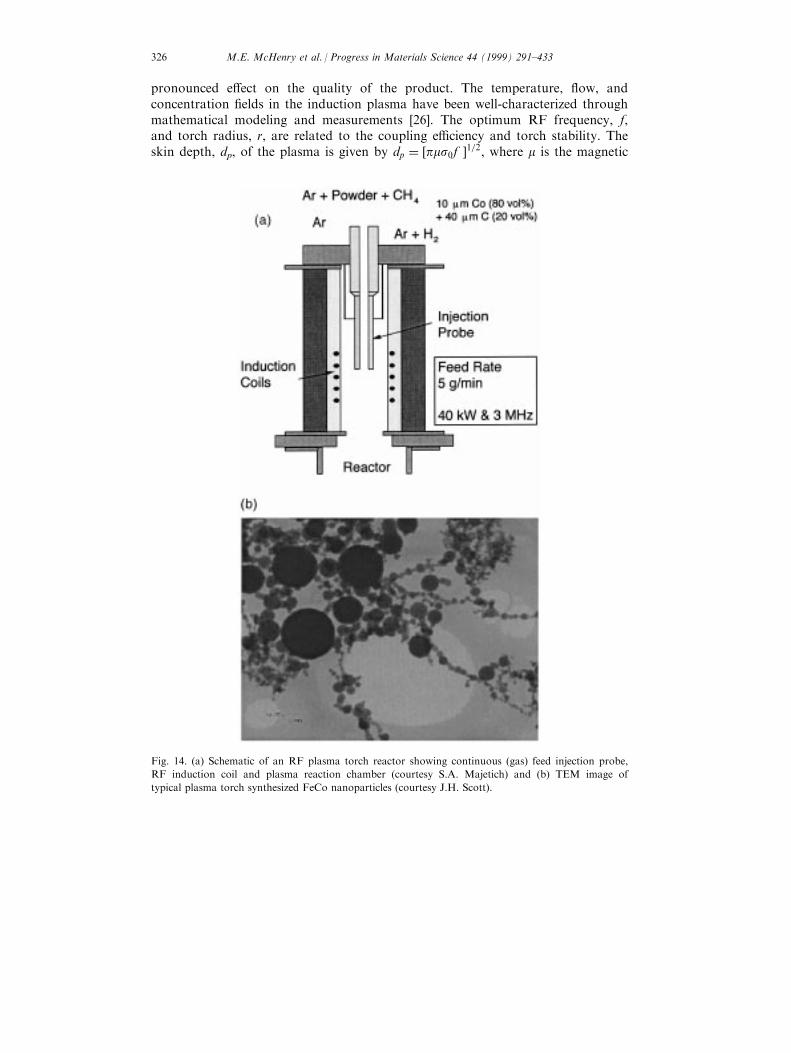
Radio frequency plasma torches (Fig. 14(a)) are electrodeless discharges that usemagnetic induction to create eddy currents in a ¯owing gas stream, coupling radiofrequency electrical energy in a copper coil into the plasma gas. Unlike directcurrent (DC) plasma torches, there are no electrodes to degrade over time andcontaminate the products. The operator has control over many variables duringthermal plasma synthesis, and the choice of operating conditions has a
Fig. 13. Bright ®eld TEM images of C-coated FeCo (courtesy of N. T. Nuhfer).
M.E. McHenry et al. / Progress in Materials Science 44 (1999) 291±433 325
pronounced e�ect on the quality of the product. The temperature, ¯ow, andconcentration ®elds in the induction plasma have been well-characterized throughmathematical modeling and measurements [26]. The optimum RF frequency, f,and torch radius, r, are related to the coupling e�ciency and torch stability. Theskin depth, dp, of the plasma is given by dp � �pms0f �1=2, where m is the magnetic
Fig. 14. (a) Schematic of an RF plasma torch reactor showing continuous (gas) feed injection probe,
RF induction coil and plasma reaction chamber (courtesy S.A. Majetich) and (b) TEM image of
typical plasma torch synthesized FeCo nanoparticles (courtesy J.H. Scott).
M.E. McHenry et al. / Progress in Materials Science 44 (1999) 291±433326
permeability of the plasma (approximately equal to m0), and s is the electricalconductivity of the plasma. For an argon plasma at one atmosphere and anaverage temperature of 8000 K, s � 103 Wÿ1mÿ1. With a frequency of 3 MHz theskin depth is 09 mm. The optimum coupling of electrical energy into the plasmaoccurs when the ratio of the plasma radius to the skin depth, r=dp, is between 1.5and 2.5 [26,27]. Most of the energy is dissipated in the cylindrical outer shell ofthe plasma de®ned by the skin depth.
Turgut et al. [264,265] have employed plasma torch synthesis techniques toproduce a variety of encapsulated and unencapsulated magnetic nanoparticles. C-coated FexCo1ÿx (x � 0:50, 0.45, 0.40, 0.35, 0.30, 0.25) nanoparticles wereproduced using an RF plasma torch where the only C source was acetylene usedas a carrier gas. Structural determination by X-ray di�raction (XRD) indicated asingle BCC a-FeCo phase along with graphitic C for all compositions. A Scherreranalysis of the peak widths revealed particles to have an average diameter of 50nm. TEM indicated a log-normal size distribution. Energy dispersive X-rayanalysis (EDX) indicated compositional ¯uctuations of a few atomic percent forindividual particles of a nominal composition attributed to starting with elementalrather than alloy precursors.
Magnetic properties of nanoparticles with alloy compositions Fe50Co50,Fe55Co45, Fe60Co40, Fe65Co35, Fe70Co30 and Fe75Co25 have been measured withinthe temperature range 4±300 K. Temperature dependent magnetizationmeasurements have revealed the e�ects of atomic ordering in the nanoparticles.The variation of the saturation magnetization discussed below with temperatureshowed variation near the bulk order±disorder (a4a 0) transformationtemperature, as well as loss of magnetization at the a4g structural phasetransition temperature. Other features of M(T ) near 500±5508C are consistentwith prior observations of a `5508C structural anomaly' which has been observedin bulk alloys with less than perfect order.
Scott et al. [240,241] have examined the issue of chemical homogeneity inplasma torch synthesized FeCo alloy powders. To distinguish between inherent¯uctuations and inhomogeneity introduced by poorly mixed starting material,Fe50Co50 nanoparticles were prepared using mixtures of elemental powders and apre-alloyed Fe50Co50 starting material produced by ultrasonic gas atomization.The resulting thermal plasma product was examined with energy dispersive X-rayspectrometry, the nanoparticles produced from alloy precursor showed a smallerspread in Fe/Co ratio than nanoparticles produced from mixed elementalpowders. An increased Fe/Co dispersion for the mixed element powders suggeststhat precursor homogeneity can persist through the plasma processing to impactthe quality of the ®nal nanoparticle powder.
3.1.3. Mechanical milling techniquesMechanical alloying techniques [13] have been utilized to produce amorphous
and nanocrystalline alloys as well as metal/non-metal composite materials. Toproduce amorphous or nanocrystalline alloy particles, elemental or compoundpowders are milled in an inert atmosphere as shown in Fig. 15. If the mechanical
M.E. McHenry et al. / Progress in Materials Science 44 (1999) 291±433 327
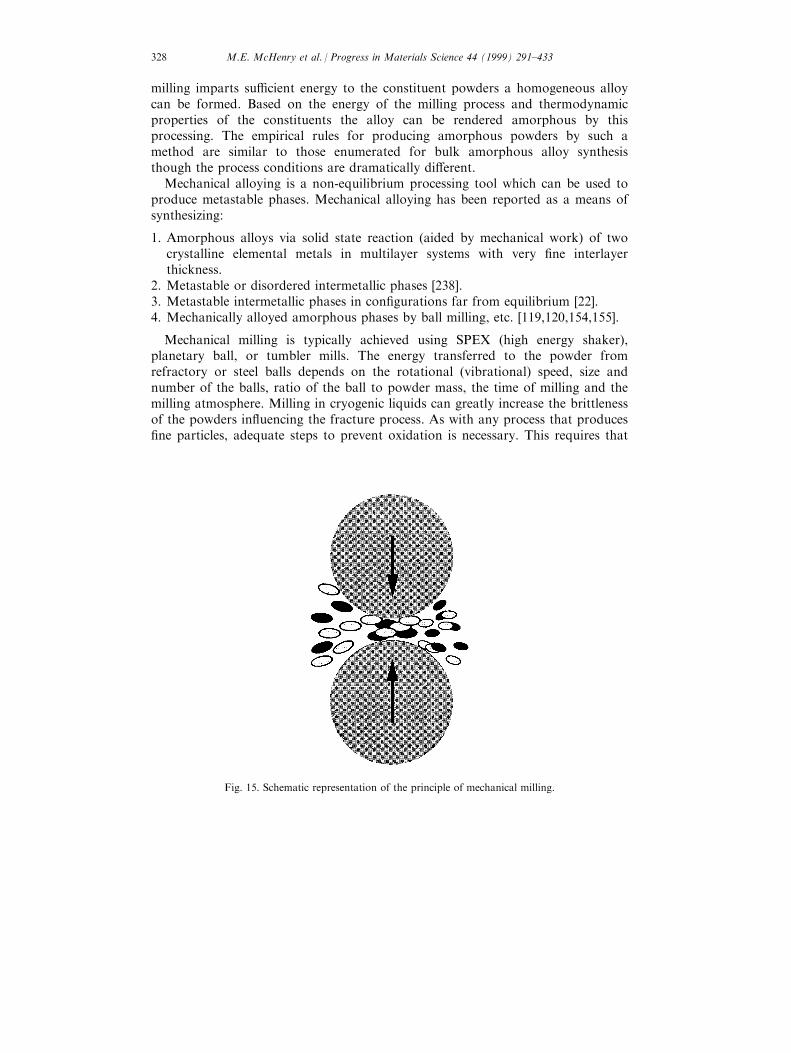
milling imparts su�cient energy to the constituent powders a homogeneous alloycan be formed. Based on the energy of the milling process and thermodynamicproperties of the constituents the alloy can be rendered amorphous by thisprocessing. The empirical rules for producing amorphous powders by such amethod are similar to those enumerated for bulk amorphous alloy synthesisthough the process conditions are dramatically di�erent.
Mechanical alloying is a non-equilibrium processing tool which can be used toproduce metastable phases. Mechanical alloying has been reported as a means ofsynthesizing:
1. Amorphous alloys via solid state reaction (aided by mechanical work) of twocrystalline elemental metals in multilayer systems with very ®ne interlayerthickness.
2. Metastable or disordered intermetallic phases [238].3. Metastable intermetallic phases in con®gurations far from equilibrium [22].4. Mechanically alloyed amorphous phases by ball milling, etc. [119,120,154,155].
Mechanical milling is typically achieved using SPEX (high energy shaker),planetary ball, or tumbler mills. The energy transferred to the powder fromrefractory or steel balls depends on the rotational (vibrational) speed, size andnumber of the balls, ratio of the ball to powder mass, the time of milling and themilling atmosphere. Milling in cryogenic liquids can greatly increase the brittlenessof the powders in¯uencing the fracture process. As with any process that produces®ne particles, adequate steps to prevent oxidation is necessary. This requires that
Fig. 15. Schematic representation of the principle of mechanical milling.
M.E. McHenry et al. / Progress in Materials Science 44 (1999) 291±433328
the milling take place in an inert atmosphere and that the powder particles behandled in an appropriate vacuum system or glove box.
A typical progression of microstructure during the milling process (for ametallic material) begins with (1) plastic deformation of the constituent particles,(2) followed by fracture and (3) then by a stage of particle welding. The eventualinterplay between fracture and re-welding leads to homogenization of thechemistry, re®nement of the particle size and disorder in the atomic structure(with eventual amorphization in alloys of appropriate chemistry). The particle sizecan be observed to reach steady state quite quickly while structural and phaseevolution can continue over prolonged time periods.
The thermodynamic and kinetic principles for amorphization through solid statesynthesis or mechanical alloying have been enumerated by Schwarz and Johnson[237] and Johnson [135]. Schwarz and Johnson [237] ®rst demonstrated theformation of amorphous alloys by solid state reaction synthesis starting withmultilayers of A and B constituents. For producing an amorphous A±B alloyfrom its constituents:
1. A large negative heat of mixing, DHmix, between A an B is desired.2. A large disparity (asymmetry) in the di�usion coe�cients of one in the other is
also desired (i.e. DB � DA).
These principles have been used to explain the elegant solid state amorphizationreactions of Schwarz and Johnson [237]. Modi®cations of the theory behind solidstate amorphization to include mechanical working terms have been made toexplain the amorphization process which occurs in mechanical alloying.
Yavari and Desre [279] have discussed the thermodynamic and kineticrequirements for amorphization during mechanical alloying. Because of theadditional in¯uence of mechanical working the requirements are not as restrictiveas with solid state reaction synthesis. Again considering A±B alloys (made from Aand B starting constituents) they conclude that the requirement of a large negativeheat of mixing, DHmix, between A and B does in fact allow for amorphizationover wider compositional ranges. On the other hand, for DHmix00 amorphizationcan in fact occur if the interlayers are kept below a critical thickness. Thisdistinction is attributed to the fact that the amorphous phase undergoes worksoftening and the crystalline phase work hardening during the course ofmechanical alloying. This, in turn, leads to an evolution of the free energy whichfavors the amorphous phase even when DHmix00 and DB0DA. Further, mixingkinetics are accelerated by the formation of volume defects and internal surfacesassociated with the heavy deformation which occurs during mechanical alloying.
Schwarz [239] has modeled the amorphization process during mechanicalalloying using a solid-state interdi�usion model in which disclocation pipedi�usion plays a signi®cant role. Mechanical alloying is viewed as continuouslyproducing fresh metal/metal surfaces with a high density of dislocations. In themechanical alloying process, powder particles are subjected to stresses whichexceed their mechanical strength for short times (on the order of a fewmicroseconds). On the other hand, for times on the order of seconds the particles
M.E. McHenry et al. / Progress in Materials Science 44 (1999) 291±433 329
are unstressed. During this longer time period solute atoms di�use along the coreof dislocations left behind from the short time deformation. The dislocations actas short-circuit di�usion paths which allow for large solute supersaturation. Thisso called `dislocation solute pumping (DSP)' mechanism could in fact be operativefor alloys in which DHmix > 0 as long as the solute-dislocation core interactionexceeds the chemical barrier.
In the following we cite some examples of mechanical alloying as applied tointeresting soft magnetic alloys:
Haruyama and Asahi [81] have prepared amorphous Ni±Zr alloys bymechanical alloying of elemental crystal powders. They used a high-speedvibratory ball mill in an argon atmosphere with WC and steel milling tools.Amorphous NixZr100ÿx (x � 20±70) alloy powders were obtained after 32 h usinga 54 : 1 ball to powder mass ratio. Longer times for amorphization are requiredfor the end compositions. This is explained in terms of the variation of the heat ofmixing with x. The heat of mixing is negative and most negative for intermediatecompositions. This trend is also apparent in the crystallization temperatures, Tx1
with peaks at0830 K for x � 60 at%.Lee et al. [177] have studied phase transformations induced by ball milling in
the Fe±Zr system. Structural changes and magnetic properties have been examinedin mechanically alloyed Fe1ÿxZrx alloys with (x � 0:1, 0.25, 0.3 and 0.5). Thealloys were prepared by mechanically alloying in a conventional ball mill startingwith elemental powders. Stainless steel balls and a 20 : 1 ball to powder chargewere employed. Mixed 10 nm a-Fe nanocrystals and an amorphous phase wereobserved during the early stages of crystallization. Further processing resulted incrystallization of the amorphous phase into a-Fe and Zr2Fe crystalline phases.The solid state amorphization was attributed to interdi�usion between layers.TEM selected area di�raction (SAD) indicated two di�use halo's suggesting phaseseparation into Fe-rich and Zr-rich amorphous regions.
Zhang et al. [292] have prepared Fe80Zr8B11Cu1 alloy powders by ball millingmixtures of Fe±Zr, Fe±B and elemental Fe and Cu powders. The ball milledpowders in a planetary ball mill using a 40:1 ball to powder charge and arotational speed of 160 rpm. Methanol was used to prevent excessive particlewelding. They monitored crystallization using XRD, electron microscopy andMoÈ ssbauer spectroscopy. Annealing temperatures of 673±1173 K were employed.At 873 K a 61% volume of a-Fe was observed. At 1173 K the amorphous phaseis completely converted to a-Fe + ZrB2 suggesting a two or more stepcrystallization process.
3.1.4. Powder consolidationIt should be noted that many of the materials produced by the amorphous
precursor nanocrystallization route described below have also been ground intopowders. It is these materials that the most extensive powder consolidation hasbeen performed. Kojima et al. [157,158] have described warm extrusion ofFe84Nb7B9 and Fe90Zr7B3 alloys, respectively. The ®rst alloys (Fe84Nb7B9) [157]were extruded at temperatures between 290 and 4508C using pressures between
M.E. McHenry et al. / Progress in Materials Science 44 (1999) 291±433330
824 and 1208 MPa. A second report in 1995 described extrusion of Fe90Zr7B3 attemperatures between 400 and 4258C using pressures between 920 and 940 MPa.These consolidation routes took advantage of the fact that amorphous powderssoften in the vicinity of the crystallization temperature. The consolidated materialsachieved densities greater than 99% of those of the melt-spun ribbons. Grain sizesof 9±11 nm were observed for the Fe84Nb7B9 alloy and 20±30 nm for theFe90Zr7B3 alloy after extrusion.
3.2. Rapid solidi®cation processing
Amorphous alloys are of interest because they do not have any long-rangeatomic order. As a result these materials have high resistivities, lowmagnetocrystalline anisotropy and no microstructural inhomogeneities. As aresult, these materials are observed to have small hysteretic and eddy currentlosses. Amorphous alloys are typically formed by rapid solidi®cation processingroutes, though more conventional solidi®cation routes are possible for bulkamorphous alloys as discussed below.
The study of metallic glasses dates back to the pioneering work of Pol Duwezat Caltech in the 1950s. Duwez employed atomization [51] and gun techniques [52]prior to splat quenching (for a review, see Refs. [53,54]). Ferromagneticamorphous alloys were ®rst reported by Mader and Nowik [186]. Soon after,Tsuei and Duwez [263] reported splatquenched amorphous ferromagnets withinteresting soft magnetic properties. Rapid solidi®cation processing is reviewedonly in a cursory manner here, citing techniques which have been employed toproduce materials which are discussed in this article. The subject of rapidsolidi®cation processing is much broader and the subject of many good reviews[23,46,224].
Amorphous metallic alloys are synthesized by rapid solidi®cation processingtechniques in alloy systems where the liquid phase remains stable to lowtemperature and there are competing crystalline phases below the liquidus, i.e.systems with deep eutectics. These are typically metastable phases. Amorphousalloys can be produced by a variety of rapid solidi®cation processing routesincluding splat quenching, melt spinning, gas atomization and condensation fromthe gas phase. These typically require cooling rates of greater than 104 K/s forbinary alloys at a eutectic composition. Among the most common rapidsolidi®cation processing technique is melt spinning which yields amorphousmetallic ribbons typically 20 mm in thickness and gas atomization techniques thatyield several mm to submicron powders the smallest of which can be madeamorphous. Fig. 16 shows a schematic of a melt-spinning apparatus used toproduce amorphous metallic ribbons. Here a molten alloy is pushed through theori®ce of a pressurized crucible onto a rotating copper wheel. Lim et al. [187,179]have examined the in¯uence of melt temperature on the ®nal magnetic propertiesof FINEMET alloys. The melt temperature in¯uences the ribbon thickness andtherefore the ®nal nanocrystal size distribution throughout the transformed ribbonafter nanocrystallization.
M.E. McHenry et al. / Progress in Materials Science 44 (1999) 291±433 331
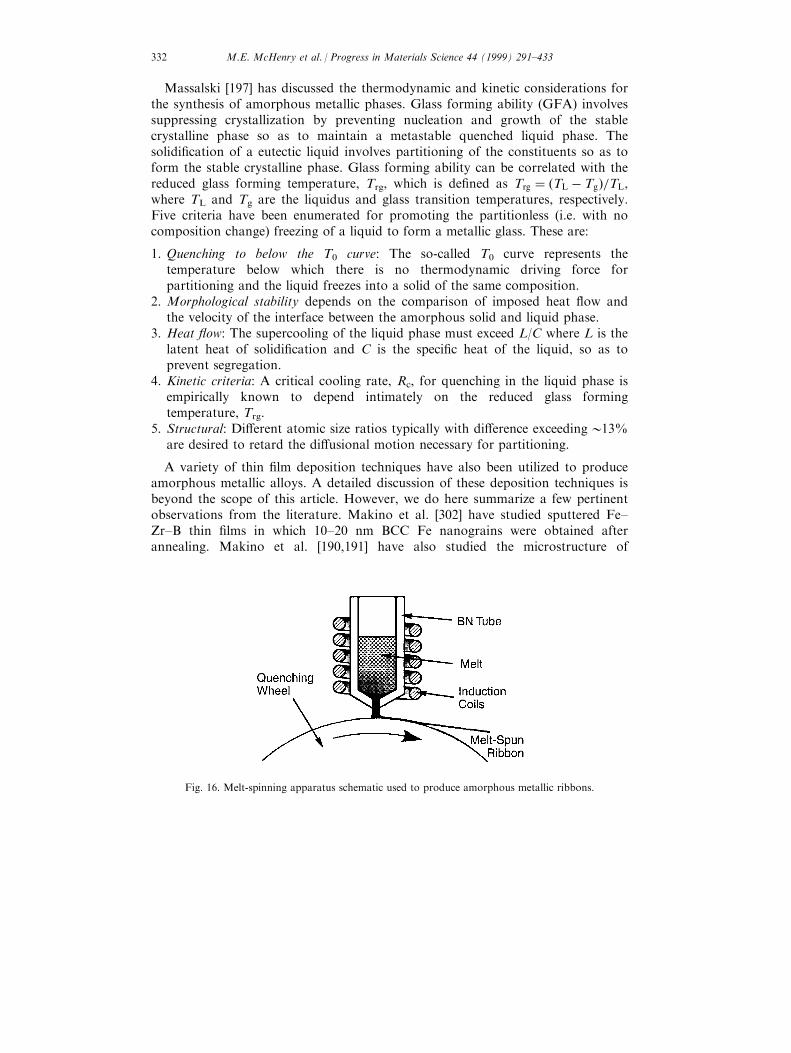
Massalski [197] has discussed the thermodynamic and kinetic considerations forthe synthesis of amorphous metallic phases. Glass forming ability (GFA) involvessuppressing crystallization by preventing nucleation and growth of the stablecrystalline phase so as to maintain a metastable quenched liquid phase. Thesolidi®cation of a eutectic liquid involves partitioning of the constituents so as toform the stable crystalline phase. Glass forming ability can be correlated with thereduced glass forming temperature, Trg, which is de®ned as Trg � �TL ÿ Tg�=TL,where TL and Tg are the liquidus and glass transition temperatures, respectively.Five criteria have been enumerated for promoting the partitionless (i.e. with nocomposition change) freezing of a liquid to form a metallic glass. These are:
1. Quenching to below the T0 curve: The so-called T0 curve represents thetemperature below which there is no thermodynamic driving force forpartitioning and the liquid freezes into a solid of the same composition.
2. Morphological stability depends on the comparison of imposed heat ¯ow andthe velocity of the interface between the amorphous solid and liquid phase.
3. Heat ¯ow: The supercooling of the liquid phase must exceed L/C where L is thelatent heat of solidi®cation and C is the speci®c heat of the liquid, so as toprevent segregation.
4. Kinetic criteria: A critical cooling rate, Rc, for quenching in the liquid phase isempirically known to depend intimately on the reduced glass formingtemperature, Trg.
5. Structural: Di�erent atomic size ratios typically with di�erence exceeding013%are desired to retard the di�usional motion necessary for partitioning.
A variety of thin ®lm deposition techniques have also been utilized to produceamorphous metallic alloys. A detailed discussion of these deposition techniques isbeyond the scope of this article. However, we do here summarize a few pertinentobservations from the literature. Makino et al. [302] have studied sputtered Fe±Zr±B thin ®lms in which 10±20 nm BCC Fe nanograins were obtained afterannealing. Makino et al. [190,191] have also studied the microstructure of
Fig. 16. Melt-spinning apparatus schematic used to produce amorphous metallic ribbons.
M.E. McHenry et al. / Progress in Materials Science 44 (1999) 291±433332
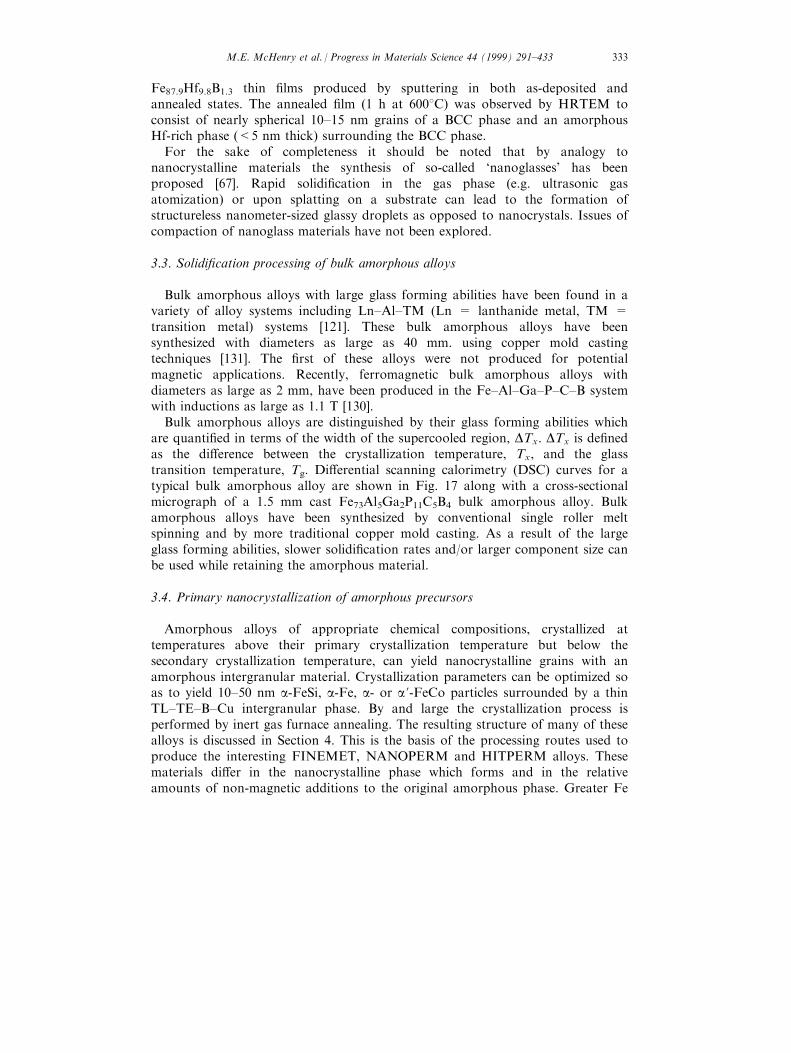
Fe87.9Hf9.8B1.3 thin ®lms produced by sputtering in both as-deposited andannealed states. The annealed ®lm (1 h at 6008C) was observed by HRTEM toconsist of nearly spherical 10±15 nm grains of a BCC phase and an amorphousHf-rich phase (<5 nm thick) surrounding the BCC phase.
For the sake of completeness it should be noted that by analogy tonanocrystalline materials the synthesis of so-called `nanoglasses' has beenproposed [67]. Rapid solidi®cation in the gas phase (e.g. ultrasonic gasatomization) or upon splatting on a substrate can lead to the formation ofstructureless nanometer-sized glassy droplets as opposed to nanocrystals. Issues ofcompaction of nanoglass materials have not been explored.
3.3. Solidi®cation processing of bulk amorphous alloys
Bulk amorphous alloys with large glass forming abilities have been found in avariety of alloy systems including Ln±Al±TM (Ln = lanthanide metal, TM =transition metal) systems [121]. These bulk amorphous alloys have beensynthesized with diameters as large as 40 mm. using copper mold castingtechniques [131]. The ®rst of these alloys were not produced for potentialmagnetic applications. Recently, ferromagnetic bulk amorphous alloys withdiameters as large as 2 mm, have been produced in the Fe±Al±Ga±P±C±B systemwith inductions as large as 1.1 T [130].
Bulk amorphous alloys are distinguished by their glass forming abilities whichare quanti®ed in terms of the width of the supercooled region, DTx. DTx is de®nedas the di�erence between the crystallization temperature, Tx, and the glasstransition temperature, Tg. Di�erential scanning calorimetry (DSC) curves for atypical bulk amorphous alloy are shown in Fig. 17 along with a cross-sectionalmicrograph of a 1.5 mm cast Fe73Al5Ga2P11C5B4 bulk amorphous alloy. Bulkamorphous alloys have been synthesized by conventional single roller meltspinning and by more traditional copper mold casting. As a result of the largeglass forming abilities, slower solidi®cation rates and/or larger component size canbe used while retaining the amorphous material.
3.4. Primary nanocrystallization of amorphous precursors
Amorphous alloys of appropriate chemical compositions, crystallized attemperatures above their primary crystallization temperature but below thesecondary crystallization temperature, can yield nanocrystalline grains with anamorphous intergranular material. Crystallization parameters can be optimized soas to yield 10±50 nm a-FeSi, a-Fe, a- or a'-FeCo particles surrounded by a thinTL±TE±B±Cu intergranular phase. By and large the crystallization process isperformed by inert gas furnace annealing. The resulting structure of many of thesealloys is discussed in Section 4. This is the basis of the processing routes used toproduce the interesting FINEMET, NANOPERM and HITPERM alloys. Thesematerials di�er in the nanocrystalline phase which forms and in the relativeamounts of non-magnetic additions to the original amorphous phase. Greater Fe
M.E. McHenry et al. / Progress in Materials Science 44 (1999) 291±433 333
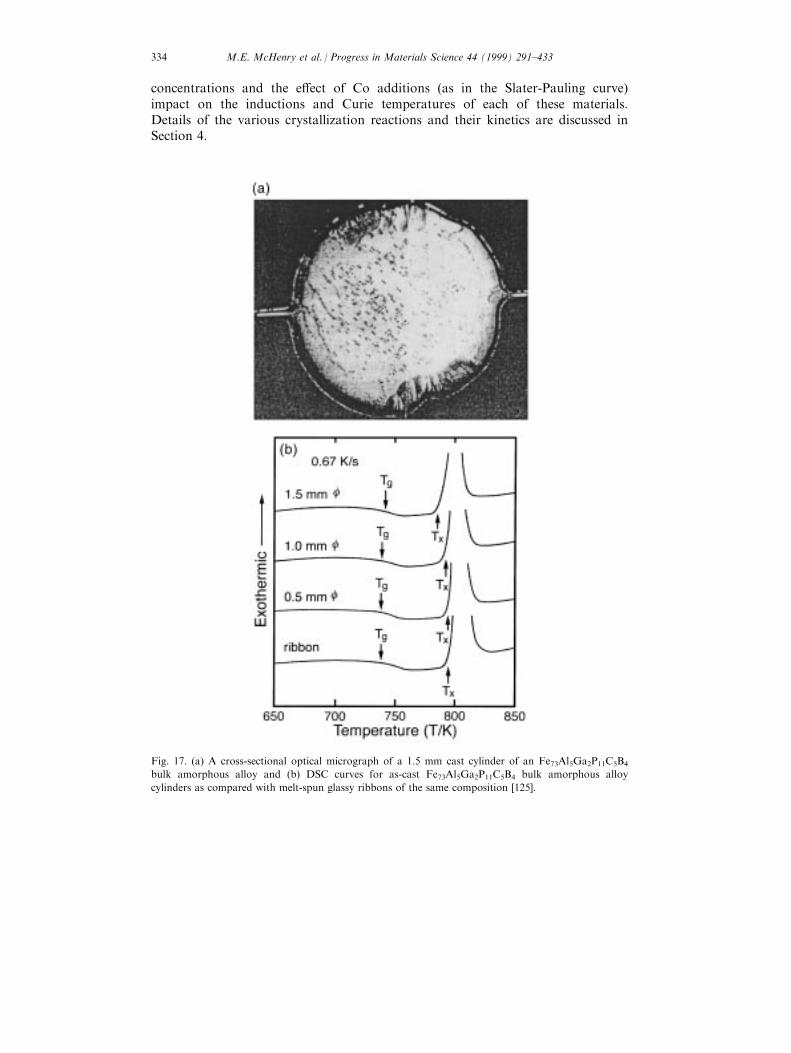
concentrations and the e�ect of Co additions (as in the Slater-Pauling curve)impact on the inductions and Curie temperatures of each of these materials.Details of the various crystallization reactions and their kinetics are discussed inSection 4.
Fig. 17. (a) A cross-sectional optical micrograph of a 1.5 mm cast cylinder of an Fe73Al5Ga2P11C5B4
bulk amorphous alloy and (b) DSC curves for as-cast Fe73Al5Ga2P11C5B4 bulk amorphous alloy
cylinders as compared with melt-spun glassy ribbons of the same composition [125].
M.E. McHenry et al. / Progress in Materials Science 44 (1999) 291±433334
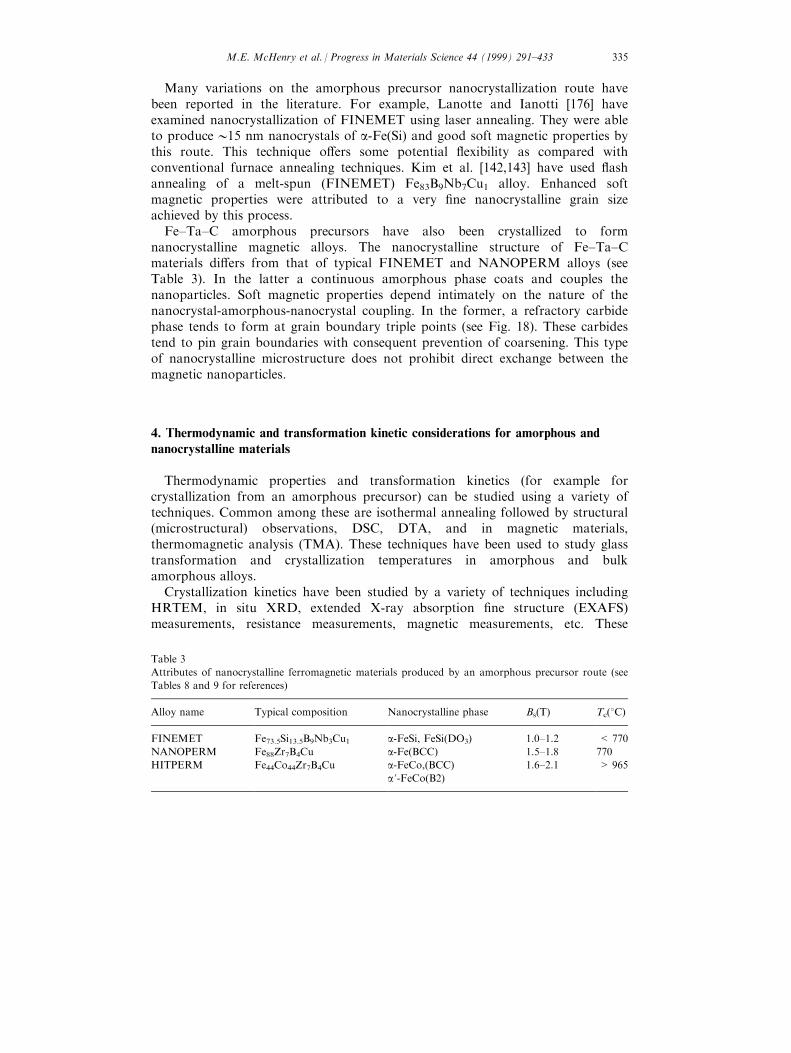
Many variations on the amorphous precursor nanocrystallization route havebeen reported in the literature. For example, Lanotte and Ianotti [176] haveexamined nanocrystallization of FINEMET using laser annealing. They were ableto produce015 nm nanocrystals of a-Fe(Si) and good soft magnetic properties bythis route. This technique o�ers some potential ¯exibility as compared withconventional furnace annealing techniques. Kim et al. [142,143] have used ¯ashannealing of a melt-spun (FINEMET) Fe83B9Nb7Cu1 alloy. Enhanced softmagnetic properties were attributed to a very ®ne nanocrystalline grain sizeachieved by this process.
Fe±Ta±C amorphous precursors have also been crystallized to formnanocrystalline magnetic alloys. The nanocrystalline structure of Fe±Ta±Cmaterials di�ers from that of typical FINEMET and NANOPERM alloys (seeTable 3). In the latter a continuous amorphous phase coats and couples thenanoparticles. Soft magnetic properties depend intimately on the nature of thenanocrystal-amorphous-nanocrystal coupling. In the former, a refractory carbidephase tends to form at grain boundary triple points (see Fig. 18). These carbidestend to pin grain boundaries with consequent prevention of coarsening. This typeof nanocrystalline microstructure does not prohibit direct exchange between themagnetic nanoparticles.
4. Thermodynamic and transformation kinetic considerations for amorphous andnanocrystalline materials
Thermodynamic properties and transformation kinetics (for example forcrystallization from an amorphous precursor) can be studied using a variety oftechniques. Common among these are isothermal annealing followed by structural(microstructural) observations, DSC, DTA, and in magnetic materials,thermomagnetic analysis (TMA). These techniques have been used to study glasstransformation and crystallization temperatures in amorphous and bulkamorphous alloys.
Crystallization kinetics have been studied by a variety of techniques includingHRTEM, in situ XRD, extended X-ray absorption ®ne structure (EXAFS)measurements, resistance measurements, magnetic measurements, etc. These
Table 3
Attributes of nanocrystalline ferromagnetic materials produced by an amorphous precursor route (see
Tables 8 and 9 for references)
Alloy name Typical composition Nanocrystalline phase Bs(T) Tc(8C)
FINEMET Fe73.5Si13.5B9Nb3Cu1 a-FeSi, FeSi(DO3) 1.0±1.2 < 770
NANOPERM Fe88Zr7B4Cu a-Fe(BCC) 1.5±1.8 770
HITPERM Fe44Co44Zr7B4Cu a-FeCo,(BCC) 1.6±2.1 > 965
a'-FeCo(B2)
M.E. McHenry et al. / Progress in Materials Science 44 (1999) 291±433 335
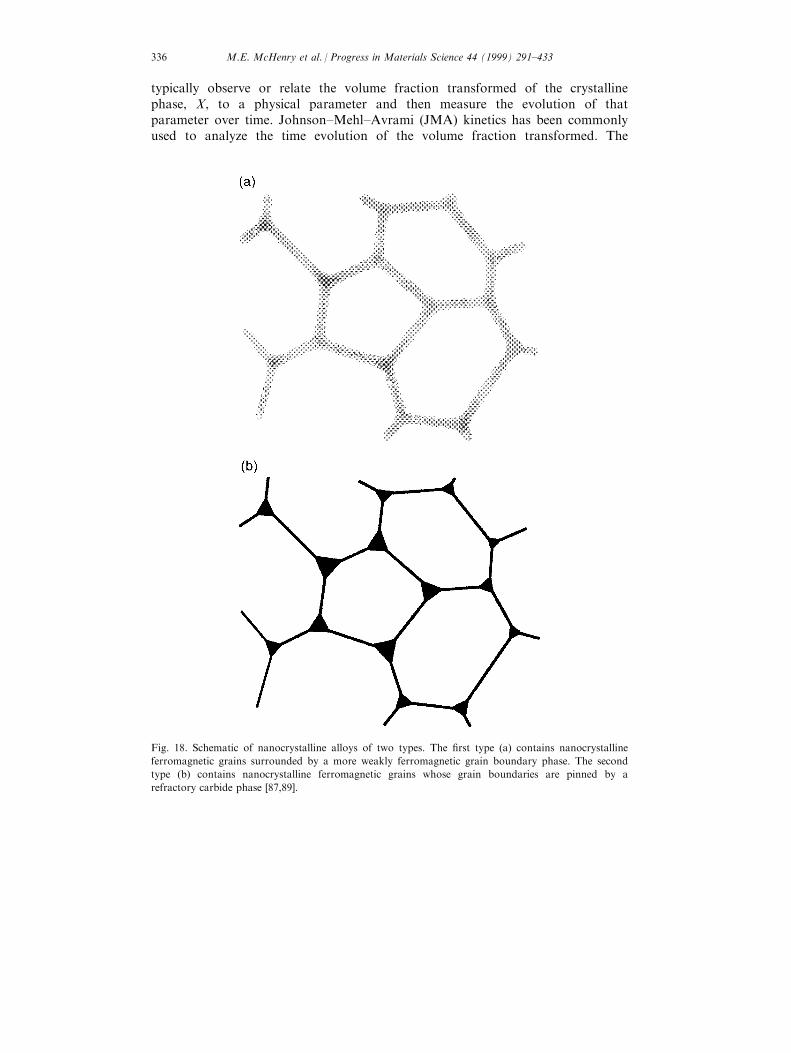
typically observe or relate the volume fraction transformed of the crystallinephase, X, to a physical parameter and then measure the evolution of thatparameter over time. Johnson±Mehl±Avrami (JMA) kinetics has been commonlyused to analyze the time evolution of the volume fraction transformed. The
Fig. 18. Schematic of nanocrystalline alloys of two types. The ®rst type (a) contains nanocrystalline
ferromagnetic grains surrounded by a more weakly ferromagnetic grain boundary phase. The second
type (b) contains nanocrystalline ferromagnetic grains whose grain boundaries are pinned by a
refractory carbide phase [87,89].
M.E. McHenry et al. / Progress in Materials Science 44 (1999) 291±433336
fraction transformed in the JMA kinetics formalism exhibits a time dependence ofthe form:
X � 1ÿ exp�ÿ �kt�n
��19�
where n is a power law exponent that can be used to distinguish thedimensionality of the growth process, X is the volume fraction transformed, t istime, k is a thermally activated rate constant, which obeys an Arrheniusrelationship of the form:
k � k0exp�ÿ E=kBT
� �20�
where E represents the activation energy barrier to crystallization. At small timesthe general Eq. (19) reduces to:
X � �kt�n �21�and dlnX/dlnt gives the exponent n. Also from the early stage approximation itcan be determined that: dX=dt � nkntnÿ1 and for n > 1, dX=dt � 0, at t � 0. Forn � 1, dX=dt � k, a non-zero constant at t � 0.
The fundamental importance of these empirical transformation kinetics lies incoupling them with a model for nucleation and growth, where the exponent n canbe compared with model speci®c predictions of nucleation and growth kinetics (inwhich the particle geometry intimately determines the time exponent). Forexample, Avrami's analysis of the nucleation and growth process leads to a timeexponent, n � 3 if all nuclei are present at t � 0 and the particles are spherical andgrow at a constant rate. On the other hand, if all nuclei are present at t � 0 butthe subsequent growth of spherical particles is parabolic (i.e. growth rate isproportional to tÿ1=2), then a time exponent n � 3=2 is predicted. Johnson andMehl treated the problem of growth of spherical particles after constant randomnucleation in untransformed regions. With a constant growth rate, G, a timeexponent n � 4 is arrived at. If growth is parabolic after constant randomnucleation then a growth exponent of n � 5=2 is predicted. In general, the growthexponent for spherical particles can be expressed:
n � pe � qe �22�Where pe � 0 for immediate nucleation, pe � 1 for constant nucleation with time,qe � 3 for linear growth and qe � 3=2 for parabolic growth of spherical particles.Other values of n are possible, for example, if the growth is not of sphericalparticles. Fitting of these exponents is fraught with many experimentaluncertainties and observations must be viewed cautiously.
4.1. Calorimetry and stability of bulk amorphous materials
A measure of the stability of bulk amorphous alloys is the width of thesupercooled region, DTx. DTx is the di�erence between the crystallization
M.E. McHenry et al. / Progress in Materials Science 44 (1999) 291±433 337
temperature, Tx, and the glass transition temperature, Tg. Alloys with large
supercooled regions can be made amorphous with slower cooling rates or larger
thickness than conventional glass forming alloys. The discovery of bulk
amorphous alloys has evolved from the studies of ternary, quaternary, quinternary
and larger multi-component glass forming systems. The state of a�airs for stability
in conventional amorphous alloys with up to ternary additions has been reviewed
by Chen [33]. Chen has reported on the formation of amorphous phases in Fe±P±
C, Fe±P±B, F±B±C, and Fe±Al±B systems. More recently, Inoue et al. [122] have
investigated ternary alloy systems such as Fe±P±C and Fe±P±B where he
considered the glass forming ability. In these ternary alloys they typically observed
DTx < 25 K.
Studies of ternary alloys paved the way for studies of quaternary and larger
multicomponent sytems. These alloys systems are guided by the so-called
confusion principle and the three empirical rules (previously discussed in Section
2.6.):
1. multicomponent systems with three or more constituent elements,
2. di�erent atomic size ratios typically with di�erence exceeding013% and
3. negative heats of mixing among the constituent alloying elements.
A variety of observations, for di�erent bulk amorphous alloy systems with 4, 5
and 6 non-magnetic components added to ferromagnetic Fe, are summarized in
Table 4. These include crystallization, Tx, and glass transition temperatures, Tg,
the glass forming range, DTx, the sample dimension, D, the heat of crystallization,
DHx, and the crystallization reaction. These alloys are of considerable interest
because of their large glass-forming region coupled with ferromagnetism at room
temperature.
Inoue et al. [125] have observed that the high thermal stability of the bulk
amorphous alloys has been attributed to three separate contributions. These are:
1. More e�cient dense random packing of constituents with signi®cantly di�erent
atomic sizes, especially among P, C, and B.
2. Higher energy barriers for the precipitation of Fe±M compounds due to strong
interactions between P, C, and/or B and Al.
3. Higher barriers to formation of Fe±B and Fe±C compounds due to Ga
additions which are soluble in Fe but immiscible with B or C.
For Ge containing alloys they have also promoted the possible importance of Ge±
B and Ge±C pairing [125].
Inoue and Gook [124] have investigated the e�ects of Nb, Mo, Cr and Co
substitutions in Fe72ÿxAl5Ga2P11C6B4Mx bulk amorphous alloys [M � Nb, x � 2;
M � Mo, x � 5; M � Cr, x � 4; and M � Co, x � 6. All of these substitutions
were found to extend the supercooled liquid region, DTx. DTx was determined to
be 60 K for the parent alloy and increase to 66 K for M = Nb, 62 K for M =
Mo, 61 K for M = Cr and M = Co. For these alloys a single crystallization
reaction was observed of the form:
M.E. McHenry et al. / Progress in Materials Science 44 (1999) 291±433338
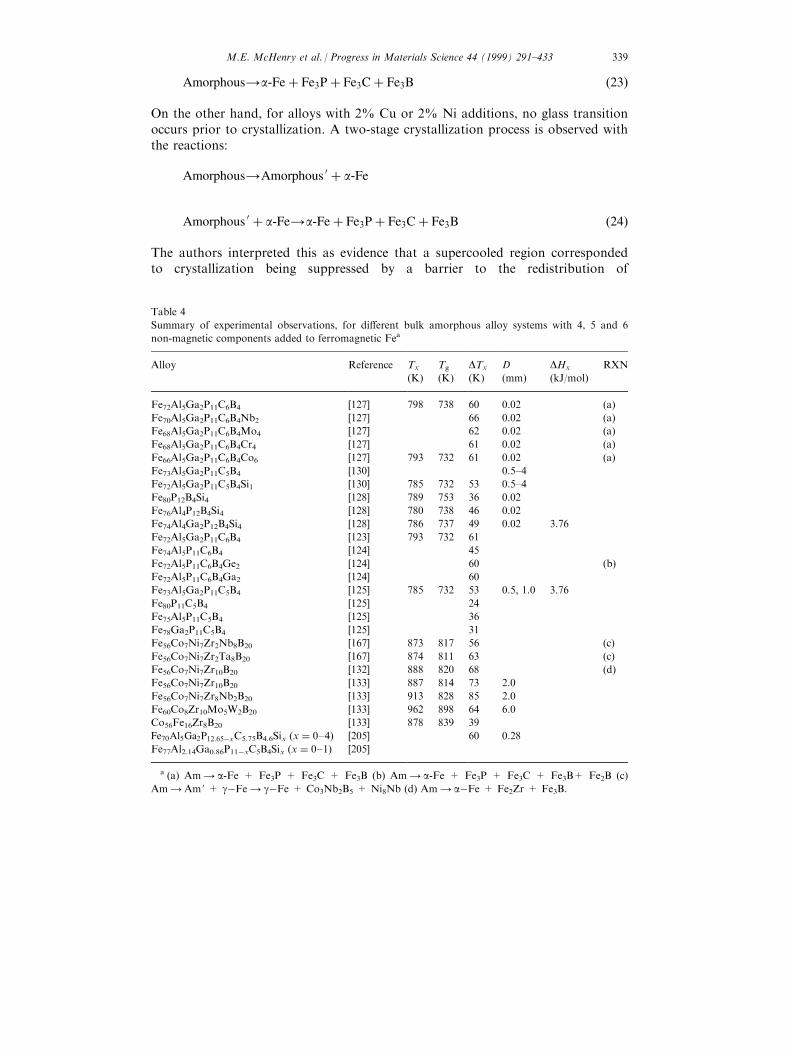
Amorphous4a-Fe� Fe3P� Fe3C� Fe3B �23�
On the other hand, for alloys with 2% Cu or 2% Ni additions, no glass transitionoccurs prior to crystallization. A two-stage crystallization process is observed withthe reactions:
Amorphous4Amorphous 0 � a-Fe
Amorphous 0 � a-Fe4a-Fe� Fe3P� Fe3C� Fe3B �24�
The authors interpreted this as evidence that a supercooled region correspondedto crystallization being suppressed by a barrier to the redistribution of
Table 4
Summary of experimental observations, for di�erent bulk amorphous alloy systems with 4, 5 and 6
non-magnetic components added to ferromagnetic Fea
Alloy Reference Tx
(K)
Tg
(K)
DTx
(K)
D
(mm)
DHx
(kJ/mol)
RXN
Fe72Al5Ga2P11C6B4 [127] 798 738 60 0.02 (a)
Fe70Al5Ga2P11C6B4Nb2 [127] 66 0.02 (a)
Fe68Al5Ga2P11C6B4Mo4 [127] 62 0.02 (a)
Fe68Al5Ga2P11C6B4Cr4 [127] 61 0.02 (a)
Fe66Al5Ga2P11C6B4Co6 [127] 793 732 61 0.02 (a)
Fe73Al5Ga2P11C5B4 [130] 0.5±4
Fe72Al5Ga2P11C5B4Si1 [130] 785 732 53 0.5±4
Fe80P12B4Si4 [128] 789 753 36 0.02
Fe76Al4P12B4Si4 [128] 780 738 46 0.02
Fe74Al4Ga2P12B4Si4 [128] 786 737 49 0.02 3.76
Fe72Al5Ga2P11C6B4 [123] 793 732 61
Fe74Al5P11C6B4 [124] 45
Fe72Al5P11C6B4Ge2 [124] 60 (b)
Fe72Al5P11C6B4Ga2 [124] 60
Fe73Al5Ga2P11C5B4 [125] 785 732 53 0.5, 1.0 3.76
Fe80P11C5B4 [125] 24
Fe75Al5P11C5B4 [125] 36
Fe78Ga2P11C5B4 [125] 31
Fe56Co7Ni7Zr2Nb8B20 [167] 873 817 56 (c)
Fe56Co7Ni7Zr2Ta8B20 [167] 874 811 63 (c)
Fe56Co7Ni7Zr10B20 [132] 888 820 68 (d)
Fe56Co7Ni7Zr10B20 [133] 887 814 73 2.0
Fe56Co7Ni7Zr8Nb2B20 [133] 913 828 85 2.0
Fe60Co8Zr10Mo5W2B20 [133] 962 898 64 6.0
Co56Fe16Zr8B20 [133] 878 839 39
Fe70Al5Ga2P12:65ÿxC5.75B4.6Six �x � 0±4� [205] 60 0.28
Fe77Al2.14Ga0.86P11ÿxC5B4Six �x � 0±1� [205]
a (a) Am4 a-Fe + Fe3P + Fe3C + Fe3B (b) Am 4 a-Fe + Fe3P + Fe3C + Fe3B+ Fe2B (c)
Am 4 Am ' + gÿFe4 gÿFe + Co3Nb2B5 + Ni8Nb (d) Am 4 aÿFe + Fe2Zr + Fe3B.
M.E. McHenry et al. / Progress in Materials Science 44 (1999) 291±433 339
constituents on a long-range scale, as would be necessary for the simultaneouscrystallization of four components as described in Section 4.1.
In an exciting recent development, Koshiba et al. [167] have observed a widesupercooled region DTx � 60 K in the melt-spun alloys Fe56Co7Ni7Zr2Nb8B20 andFe56Co7Ni7Zr2Ta8B20. These alloys have a single metalloid component with threemagnetic TM and two TE species. In these alloys a two-stage crystallization isobserved:
Amorphous4Amorphous 0 � a-Fe
Amorphous 0 � aFe4a-Fe� Co3Nb2B5 � Ni8Nb �25�Mizushima et al. [205] have investigated the e�ects of Si additions on thermalstability and soft magnetic properties of Fe±Al±Gr±P±C±B bulk amorphousalloys. They examined two alloy systems: Fe70Al5Ga2P12:65ÿxC5:75B4:6Six�x � 0ÿ 4�and Fe77Al2.14Ga0.86P11ÿxC5B4Six (x � 0±1) alloys. In all cases Tx, DTx ande�ective permeabilities are increased by Si substitution for P. DTx reached 60 Kand the maximum amorphous thickness, 280 mm for the ®rst of these alloysystems. Even more recently, Inoue et al. [133] have reported DTx � 85 K in themelt-spun alloy Fe56Co7Ni7Zr8Nb2B20! This large DTx is signi®cant for itsimplications for glass forming ability and for the potential dimensions possible forthe amorphous phase.
4.2. Primary and secondary crystallization events in nanocrystalline alloys
4.2.1. FINEMET alloysNoh et al. [215] have studied microstructural changes and crystallization
processes in Fe±Si±B, Fe±Cu±Si±B, Fe±Nb±Si±B and Fe±Cu±Nb±Si±Bamorphous alloys in order to elucidate the roles of combined additions of Cu andNb to Fe±Si±B alloys. This in turn was aimed at furthering the understanding ofcrystallization of FINEMET alloys. They annealed amorphous ribbons at varioustemperatures for 1 h and observed structure by XRD and crystallization by DTAand magnetic permeability. Noh et al. [216] have studied the in¯uence of Bsubstitutions for Si in FINEMET alloys, of composition Fe73.5Cu1Nb3(SixB1ÿx)22.5(x � 0:5±0:8). The B additions led to the development of two di�erentferromagnetic phases in the nanocrystalline alloys. The ®rst was an a-Fe(Si)material with a high Curie temperature and the second an interfacial B-rich phasewith a lower Curie temperature. In Si-rich alloys the second (intergranular) phasewas not observed to develop. Efthimiadis [55] has examined the e�ect of Cuadditions on crysallisation rates in Fe(Cu)SiB alloys.
Koster and Meinhardt [169] have studied primary crystallization of FINEMETand shown that a size dependent growth rate can be observed to the changingchemistry of the amorphous phase during the evolution of the microstructure.Microstructural control is achieved through the additions of slow di�using speciessuch as Nb while small Cu or Au additions increase the nucleation rate. Kulik et
M.E. McHenry et al. / Progress in Materials Science 44 (1999) 291±433340
al. [175] have also investigated B substitutions for Si in FINEMET-type (Fe73.5Cu,
Nb3Si22:5ÿxBx with 5RxR10) alloys. The softest magnets corresponded to those in
which primary crystallization of a-Fe(Si) and Fe3Si occurred. Secondary
crystallization of Fe2B caused magnetic hardening of the nanocrystalline alloy.
Mechanical hardening of the amorphous precursor was also observed in incipient
primary crystallization and attributed to Cu nucleation (clustering).
Gonzalez et al. [69] have studied the in¯uence of heating rate, up to the primary
crystallization temperature, Tx, on the e�ective magnetic anisotropy in
nanocrystalline FINEMET materials. They observed smaller Ke� and coercivities
in samples that were slowly heated. This slow heating led to a larger extent of
crystallization and enhancement of the intergranular coupling.
Zbroszcyk et al. [287±289] have examined the in¯uence of small Co additions to
a FINEMET alloy on microstructure and magnetic properties. They compared
Fe73.5Cu1Nb3Si13.5B9 and Fe66.5Co7Cu1Nb3Si13.5B9 alloys. It was found that Co
enhanced the e�ective nuclear hyper®ne ®eld at the 57Fe nucleus. Co additions are
observed to lower the volume fraction of the amorphous phase for heat
treatments at comparable times and temperatures. It was concluded that Co
accelerated the crystallization process, though the nanocrystalline phase remains
as the a-FeSi structure type. Generally improved magnetic properties were noted
with Co additions.
Moya et al. [207] have also investigated structural evolution and properties of
devitri®ed and crystallized Fe73:5Si22:5ÿxBxNb3Cu, FINEMET alloys, with x � 6, 8,
9, 10, and 12. Amorphous precursors were produced by melt-spinning. One hour
heat treatments were performed between temperatures Ta � 400±5408C. Structuralevolution was examined by X-ray di�raction and Mossbauer spectroscopy. They
observed structural relaxation in the amorphous material at Ta 04408C and it's
e�ect on magnetic softening and increasing of the elastic constants of the glass.
These e�ects are reversed at Ta � 4808C where it is proposed that Cu clustering
occurs in the ®rst stages of crystallization. At Ta � 5408C the nanocrystalline
phase is observed by XRD. B substitutions for Si, in general, are observed to
degrade the soft magnetic properties.
Wang et al. [273] have also examined the in¯uence of heating rate on the
magnetic properties of FINEMET-related alloys, Fe72.7Cu1Nb2V1.8Si13.5B9 and
Fe73.5Cu1Nb3Si13.5B9 with contrary observations. They observed smaller
nanocrystalline grains corresponding to faster heating rates, and consequently
larger permeabilities. Hajko et al. [78] have studied the e�ects of 0±15 at% Cr
additions for Fe in FINEMET alloys of composition �FexCr1ÿx�73:5Cu1Nb3Si13:5B9
(x � 0:85±1:0). Amorphous precursors were produced in the form of melt-spun
ribbons. These were then nanocrystallized and studied by DTA and TEM. Cr
additions were observed to increase the temperature of the ®rst crystallization
peak, Tx1 while narrowing the interval between Tx1 and Tx2. A third exothermic
peak was observed and suggested to be due to crystallization of a chromium-
boride. Cr additions were also observed to reduce the primary nanocrystallite
grain size and to decrease the Curie temperature.
M.E. McHenry et al. / Progress in Materials Science 44 (1999) 291±433 341
4.2.2. NANOPERM alloysSuzuki et al. [253±255] have examined microstructure and magnetic properties
after crystallization of an Fe86Zr7B6Cu1 amorphous alloy. The resultingnanocrystalline (NANOPERM) microstructure was characterized by a 10 nm BCCFe phase. They observed the crystallization process to follow the sequence:
Amorphous4a-Fe� amorphous �6878C�4a-Fe� Fe3Zr�
X �7478C�4a-Fe� Fe3Zr � Fe2Zr � ZrB2 �8778C� �26�
Primary crystallization of BCC Fe at 6878C was followed by secondarycrystallization of the Fe3Zr phase and an unidenti®ed phase, X, at 7478C. Therefractory boride ZrB2 phase crystallized at a higher (1150 K) temperature. Suzukiet al. [256] have investigated the e�ects of B additions on crystallization in Fe92Zr8and Fe91Zr7B2 amorphous alloys. Primary crystallization temperatures of 804 and7908C, respectively were observed. B additions in the second alloy led tore®nement of the a-Fe nanocrystal grain size due to suppression of coarsening.
Inoue et al. [126±130] have studied the possibility of addition of small amountsof Al and/or Si to Fe91Zr7B2 and Fe90Zr7B3 alloys. Amorphous single phases wereformed over the entire composition range for Fe91ÿxZr7B2Alx, Fe90ÿxZr7B3Alx,Fe91ÿxZr7B2Six and Fe90ÿxZr7B3Six (x �0±15) alloys. Al additions increase theonset temperature for primary crystallization from 780 K for Fe90Zr7B3 to 820 Kfor Fe75Zr7B3Al15 and 814 K for Fe75Zr7B3Si15. A two step crystallization processwas observed for these alloys at all compositions. Importantly, with 2% Si and1% Al additions, a zero crossing in the saturation magnetostriction of the a-Fenanocrystalline phase is observed.
Zhang et al. [292] have studied crystallization in ball-milled Fe80Zr8B11Cu1 alloycrystallization using XRD, electron microscopy and MoÈ ssbauer spectroscopy. At aheat treating temperature of 1173 K the amorphous phase is completely convertedto a-Fe + ZrB2 suggesting a two or more step crystallization process. Slawska-Wanienska et al. [247] have studied the crystallization behavior of an as-quenchedand heat treated Fe89Zr7B4 alloy. The observed dendritic growth during lowtemperature heat treating and nucleation of regular nanocrystals at higher heattreating temperatures. The low temperature dendritic growth is postulated ascontributing to larger shape and/or surface anisotropy in those materials. Zhanget al. [291] have studied the structural evolution in an Fe90Zr7B3 and concludedthat the initial crystallization step reported by Suzuki et al. [253±255] Eq. (26),proceeded by the expulsion of Zr from the a-Fe nanocrystals to a Zr and B richintergranular amorphous phase.
Grabias and Kopcewicz [73] have studied the crystallization process in anFe81Zr7B12 alloy using conversion electron MoÈ ssbauer spectrocopy (CEMS). Theyhave performed short time (15±120 s) heat treatment at 6008C and compared thestructure with materials which were heat treated for one hour. Their resultsindicate that crystallization occurs ®rst at metallic glass ribbon surfaces and thenproceeds into the bulk. Issues of surface crystallization are discussed further in
M.E. McHenry et al. / Progress in Materials Science 44 (1999) 291±433342
Section 4.3. Bitoh et al. [21] have investigated the additions of Ti, V, Cr, and Mn,substituted for Fe in NANOPERM alloys. These additions were observed toincrease the primary crystallization temperature in the order Mn, Cr, V and Ti,respectively.
4.2.3. HITPERM alloysWillard et al. [284,285] have used DSC to determine the temperatures of
crystallization for an Fe44Co44Zr7B4Cu1 alloy, as shown previously in Fig. 10. Atwo-stage crystallization was observed:
Amorphous4Amorphous 0 � a 0-FeCo
Amorphous 0 � a 0-FeCo4a 0-FeCo� �Fe,Co�3Zr �27�The primary and secondary crystallization temperatures occur at Tx1 � 5108C andTx2 � 7008C, for a'-FeCo and (Fe,Co)3Zr, respectively. By having two distinctcrystallization temperatures, the ferromagnetic a'-FeCo phase is allowed to formwithout the crystallization of non-ferromagnetic phases which can be deleteriousto the soft magnetic properties.
Iwanabe et al. [134], have used DSC and TEM observations to determine thecrystallization events in an (Fe,Co)88Hf7B4Cu alloy to be:
Amorphous4Amorphous 0 � a 0-FeCo
Amorphous 0 � a 0-FeCo4a 0-FeCo� �Fe,Co�2Hf
a 0-FeCo� �Fe,Co�2Hf � �Fe,Co�23Hf6 �28�This represents the ®rst such observation of the 23:6 phase as ananocrystallization product.
4.2.4. Other alloysAl-Haj et al. [4] have studied crystallization of Fe83.5Nb7B8.5Al1 and
Fe83.5Nb4B8.5Al1 amorphous alloys by DTA, XRD and TEM. For the ®rst ofthese alloys, the formation of an a-Fe amorphous nanophase was preceded by acrystallization event in which an a-NbB2 intermetallic was observed. The secondalloy underwent primary crystallization to a-Fe and amorphous phase followed bysecondary crystallization of an intermetallic phase.
4.3. Surface crystallization kinetics
Surface crystallization of metallic glasses have been the subject of many studies(see, for example, [99,100]). Ayers et al. [8] have studied the morphology ofsurface crystallites on Fe87Zr7B5Cu1 alloys. These surface crystallites exhibit (200)texture. Annealing at temperatures between 623 and 773 K result in
M.E. McHenry et al. / Progress in Materials Science 44 (1999) 291±433 343
nanocrystallization of randomly oriented BCC a-Fe and coarsening of the surfacecrystallites. Random orientations of the nanocrystallites which grew after surfacecrystallization was inferred from a more rapid growth of the (110) di�ractionpeaks as compared with the (200) peaks characteristic of the surface texture.Growth of the surface crystallites was accompanied by pronounced faceting thatwas observed by atomic force microscopy (AFM). The rapid coarsening of thesurface crystallites suggested depletion of the amorphous phase at the surface.Scanning Auger microprobe analysis gave evidence of surface oxidation that mayhave in¯uenced the surface crystallization kinetics.
Kopewicz and Grabias [161] Kopcewicz et al. [162] have used conversionelectron emmission and g-transmission MoÈ ssbauer spectroscopy to study thedi�erences in bulk and surface crystallization of amorphous Fe81Zr7B12 alloyprecursors after 430, 500, 550, 600 and 7808C anneals. Surface crystallization wasobserved to begin at lower annealing temperatures and was attributed to borondepletion at the surface. Crystallites of phases not observed in the bulk wereobserved in the surface MoÈ ssbauer spectra. Kopcewicz et al. [161,162] havestudied surface and bulk crystallization of amorphous Fe81Zr7B12 andFe79Zr7B12Cu2 alloys, using conversion electron emmission (CEMS) and g-transmission MoÈ ssbauer spectroscopy. Again enhanced surface crystallization wasattributed to boron depletion at the surface.
4.4. Crystallization kinetics
Table 5 summarizes the results of several experiments aimed at elucidating thecrystallization kinetics in a variety of precursors to nanocrystalline alloys. Thedetails of these experiments are discussed in the sections below. These experimentsinvolve following the time dependence of a physical parameter, such as resistance,thermoelectric power, magnetization, etc. and relating these parameters to thevolume fraction transformed of the crystalline phase. These data are then analyzedwithin the framework of a JMA or other kinetic rate law and an activation energyfor crystallization is extracted.
4.4.1. FINEMET alloysAllia et al. [5] have followed the kinetics of the nanocrystallization process in
FINEMET using isothermal measurements of the time-dependence of theresistance, R(t ). The volume fraction transformed, X, of the nanocrystallinematerial was shown to be proportional to the change in electrical resistance. Xwas shown to obey JMA kinetics with an exponent n04 during the early stages ofnanocrystallization. This was taken as suggesting homogeneous nucleation and 3Dgrain growth. At longer times, however power law kinetics with X0Ata (where awas independent of T ) were observed. This is taken as a signature of reduction inthe grain growth velocity at longer times.
Bigot et al. [19] have studied nanocrystallization of FINEMET alloys andobserved a two step crystallization process. A JMA exponent of 1.5±2.0 and anactivation energy of 4.3 eV was determined for the primary crystallization process.
M.E. McHenry et al. / Progress in Materials Science 44 (1999) 291±433344
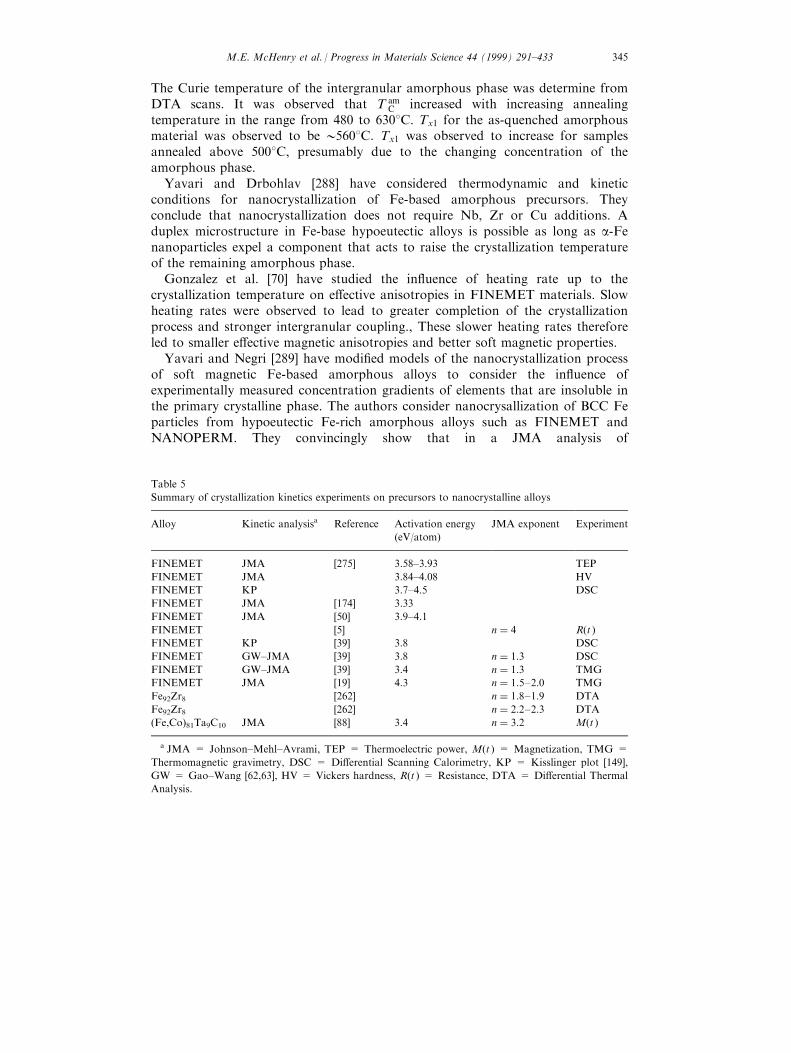
The Curie temperature of the intergranular amorphous phase was determine fromDTA scans. It was observed that T am
C increased with increasing annealingtemperature in the range from 480 to 6308C. Tx1 for the as-quenched amorphousmaterial was observed to be 05608C. Tx1 was observed to increase for samplesannealed above 5008C, presumably due to the changing concentration of theamorphous phase.
Yavari and Drbohlav [288] have considered thermodynamic and kineticconditions for nanocrystallization of Fe-based amorphous precursors. Theyconclude that nanocrystallization does not require Nb, Zr or Cu additions. Aduplex microstructure in Fe-base hypoeutectic alloys is possible as long as a-Fenanoparticles expel a component that acts to raise the crystallization temperatureof the remaining amorphous phase.
Gonzalez et al. [70] have studied the in¯uence of heating rate up to thecrystallization temperature on e�ective anisotropies in FINEMET materials. Slowheating rates were observed to lead to greater completion of the crystallizationprocess and stronger intergranular coupling., These slower heating rates thereforeled to smaller e�ective magnetic anisotropies and better soft magnetic properties.
Yavari and Negri [289] have modi®ed models of the nanocrystallization processof soft magnetic Fe-based amorphous alloys to consider the in¯uence ofexperimentally measured concentration gradients of elements that are insoluble inthe primary crystalline phase. The authors consider nanocrysallization of BCC Feparticles from hypoeutectic Fe-rich amorphous alloys such as FINEMET andNANOPERM. They convincingly show that in a JMA analysis of
Table 5
Summary of crystallization kinetics experiments on precursors to nanocrystalline alloys
Alloy Kinetic analysisa Reference Activation energy
(eV/atom)
JMA exponent Experiment
FINEMET JMA [275] 3.58±3.93 TEP
FINEMET JMA 3.84±4.08 HV
FINEMET KP 3.7±4.5 DSC
FINEMET JMA [174] 3.33
FINEMET JMA [50] 3.9±4.1
FINEMET [5] n � 4 R(t )
FINEMET KP [39] 3.8 DSC
FINEMET GW±JMA [39] 3.8 n � 1:3 DSC
FINEMET GW±JMA [39] 3.4 n � 1:3 TMG
FINEMET JMA [19] 4.3 n � 1:5±2:0 TMG
Fe92Zr8 [262] n � 1:8±1:9 DTA
Fe92Zr8 [262] n � 2:2±2:3 DTA
(Fe,Co)81Ta9C10 JMA [88] 3.4 n � 3:2 M(t )
a JMA = Johnson±Mehl±Avrami, TEP = Thermoelectric power, M(t ) = Magnetization, TMG =
Thermomagnetic gravimetry, DSC = Di�erential Scanning Calorimetry, KP = Kisslinger plot [149],
GW = Gao±Wang [62,63], HV = Vickers hardness, R(t ) = Resistance, DTA = Di�erential Thermal
Analysis.
M.E. McHenry et al. / Progress in Materials Science 44 (1999) 291±433 345
nanocrystallization transformed volume fractions need to be corrected for thedependence of the enthalpy of primary crystallization on the concentration of theremaining amorphous phase as the transformation proceeds. They argue that thenucleation rate of the primary phase decreases quickly with time due to areduction in driving force due to concentration variations in the amorphousmatrix. The concentration gradients used in their model are based on ®eld ionmicroscopy (FIM)-atom probe chemistry pro®led as determined by Hono [118]and discussed in Section 6.
4.4.2. NANOPERM alloysSuzuki et al. [262] have investigated crystallization kinetics in Fe92Zr8 and
Fe91Zr7B2 amorphous alloys. JMA analysis of DTA data revealed a JMAexponent n � 1:8±9 for Fe92Zr8 and n � 2:2±2:3 for Fe91Zr7B2. Exponents greaterthan those expected for di�usion controlled growth after immediate nucleation(viz. n � 3=2) were explained by a size and morphology dependent growth rate.
Dahlgren et al. [45] have observed that in an Fe86Zr7Cu1B6 alloy, the volumefraction crystallized after 1 h increased from 70 to 75% to 90 to 95% forannealing temperatures of 550, 600, 650, and 7008C, respectively. These volumefractions were inferred from MoÈ ssbauer spectra. These results were compared withresults of Joule heating experiments of di�erent durations performed (5±100 s)and at di�erent current levels (2.0±4.0 A). The temperature dependence of thecoercivity, Hc(T ), was signi®cantly larger for annealed as compared to Jouleheated samples.
Hsiao and Turgut (Hsiao and Turgut, [205]) have examined crystallizationkinetics in an Fe88Zr7Cu1B4 NANOPERM alloy using time-dependentmagnetization measurements at the crystallization temperature. Since thecrystallization temperature of this alloy exceeded the Curie temperature of theamorphous phase, these alloys initially have zero magnetization when they areheated to their crystallization temperature. As the alloy crystallizes, themagnetization is directly proportional to the volume fraction of the BCC a-Fenanocrystallites. Thus the time dependence of the magnetization is a direct probeof the crystallization kinetics. Fig. 19 shows M(t ) normalized by the value ofmagnetization after one hour for crystallization of an Fe88Zr7Cu1B4
NANOPERM alloy at temperatures of 490, 500, 520 and 5508C, respectively[205]. An analysis of the time exponent and activation energy for crystallizationhas yet to be reported in the literature.
4.4.3. HITPERM alloysNo observations of crystallization kinetics in HITPERM alloys have yet been
reported in the literature.
4.4.4. Other alloysCrystallization kinetics in (Fe, Co)81Ta9C10 thin ®lms have been measured by
monitoring the magnetization as a function of time during the crystallizationprocess. As the moment reducing Ta and C elements are expelled to a grain
M.E. McHenry et al. / Progress in Materials Science 44 (1999) 291±433346
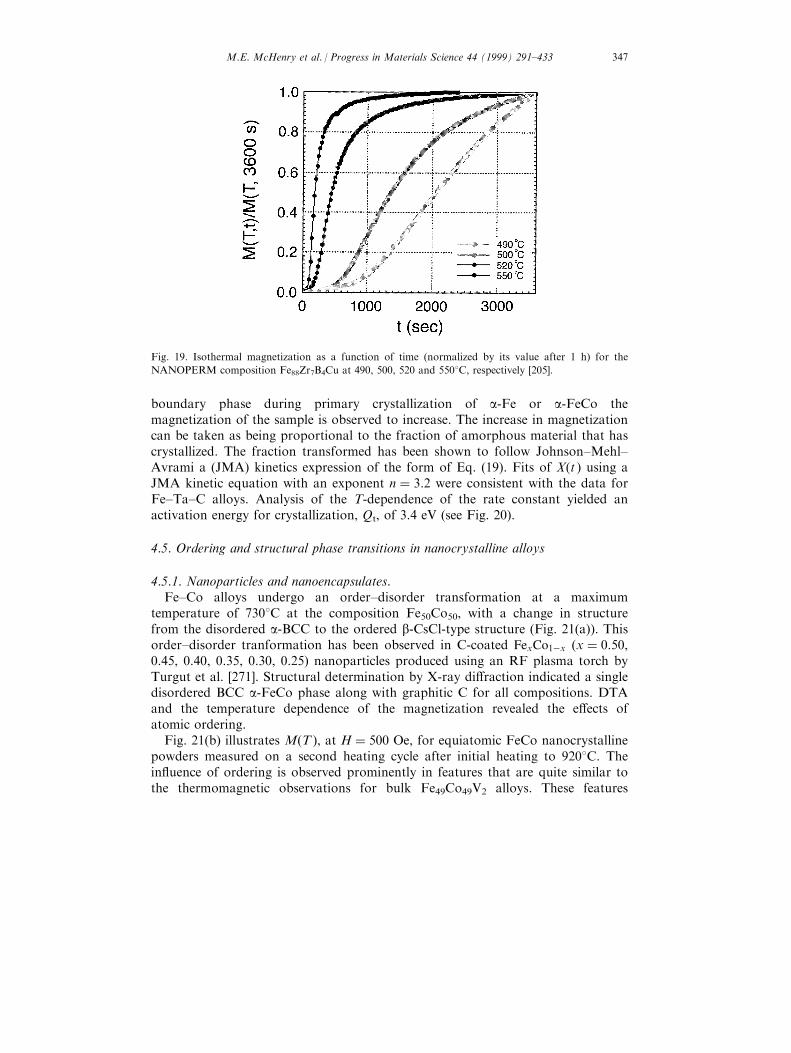
boundary phase during primary crystallization of a-Fe or a-FeCo themagnetization of the sample is observed to increase. The increase in magnetizationcan be taken as being proportional to the fraction of amorphous material that hascrystallized. The fraction transformed has been shown to follow Johnson±Mehl±Avrami a (JMA) kinetics expression of the form of Eq. (19). Fits of X(t ) using aJMA kinetic equation with an exponent n � 3:2 were consistent with the data forFe±Ta±C alloys. Analysis of the T-dependence of the rate constant yielded anactivation energy for crystallization, Qt, of 3.4 eV (see Fig. 20).
4.5. Ordering and structural phase transitions in nanocrystalline alloys
4.5.1. Nanoparticles and nanoencapsulates.Fe±Co alloys undergo an order±disorder transformation at a maximum
temperature of 7308C at the composition Fe50Co50, with a change in structurefrom the disordered a-BCC to the ordered b-CsCl-type structure (Fig. 21(a)). Thisorder±disorder tranformation has been observed in C-coated FexCo1ÿx (x � 0:50,0.45, 0.40, 0.35, 0.30, 0.25) nanoparticles produced using an RF plasma torch byTurgut et al. [271]. Structural determination by X-ray di�raction indicated a singledisordered BCC a-FeCo phase along with graphitic C for all compositions. DTAand the temperature dependence of the magnetization revealed the e�ects ofatomic ordering.
Fig. 21(b) illustrates M(T ), at H � 500 Oe, for equiatomic FeCo nanocrystallinepowders measured on a second heating cycle after initial heating to 9208C. Thein¯uence of ordering is observed prominently in features that are quite similar tothe thermomagnetic observations for bulk Fe49Co49V2 alloys. These features
Fig. 19. Isothermal magnetization as a function of time (normalized by its value after 1 h) for the
NANOPERM composition Fe88Zr7B4Cu at 490, 500, 520 and 5508C, respectively [205].
M.E. McHenry et al. / Progress in Materials Science 44 (1999) 291±433 347
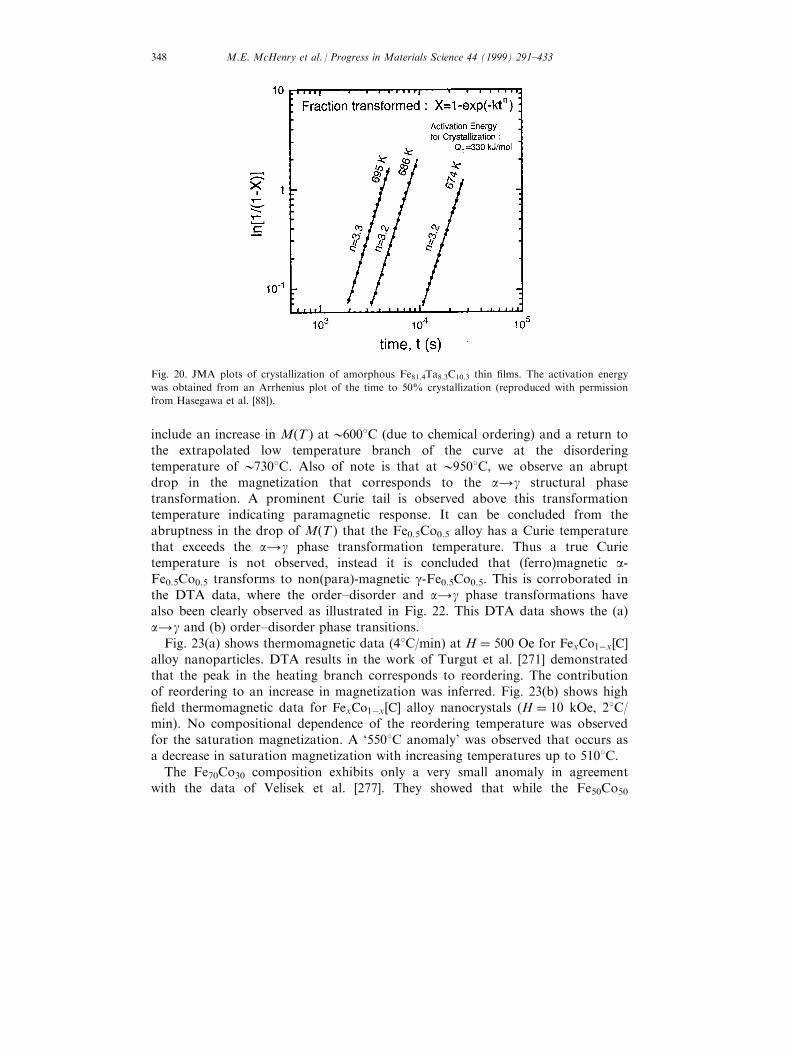
include an increase in M(T ) at06008C (due to chemical ordering) and a return tothe extrapolated low temperature branch of the curve at the disorderingtemperature of 07308C. Also of note is that at 09508C, we observe an abruptdrop in the magnetization that corresponds to the a4g structural phasetransformation. A prominent Curie tail is observed above this transformationtemperature indicating paramagnetic response. It can be concluded from theabruptness in the drop of M(T ) that the Fe0.5Co0.5 alloy has a Curie temperaturethat exceeds the a4g phase transformation temperature. Thus a true Curietemperature is not observed, instead it is concluded that (ferro)magnetic a-Fe0.5Co0.5 transforms to non(para)-magnetic g-Fe0.5Co0.5. This is corroborated inthe DTA data, where the order±disorder and a4g phase transformations havealso been clearly observed as illustrated in Fig. 22. This DTA data shows the (a)a4g and (b) order±disorder phase transitions.
Fig. 23(a) shows thermomagnetic data (48C/min) at H � 500 Oe for FexCo1ÿx�C�alloy nanoparticles. DTA results in the work of Turgut et al. [271] demonstratedthat the peak in the heating branch corresponds to reordering. The contributionof reordering to an increase in magnetization was inferred. Fig. 23(b) shows high®eld thermomagnetic data for FexCo1ÿx�C� alloy nanocrystals (H � 10 kOe, 28C/min). No compositional dependence of the reordering temperature was observedfor the saturation magnetization. A `5508C anomaly' was observed that occurs asa decrease in saturation magnetization with increasing temperatures up to 5108C.
The Fe70Co30 composition exhibits only a very small anomaly in agreementwith the data of Velisek et al. [277]. They showed that while the Fe50Co50
Fig. 20. JMA plots of crystallization of amorphous Fe81.4Ta8.3C10.3 thin ®lms. The activation energy
was obtained from an Arrhenius plot of the time to 50% crystallization (reproduced with permission
from Hasegawa et al. [88]).
M.E. McHenry et al. / Progress in Materials Science 44 (1999) 291±433348
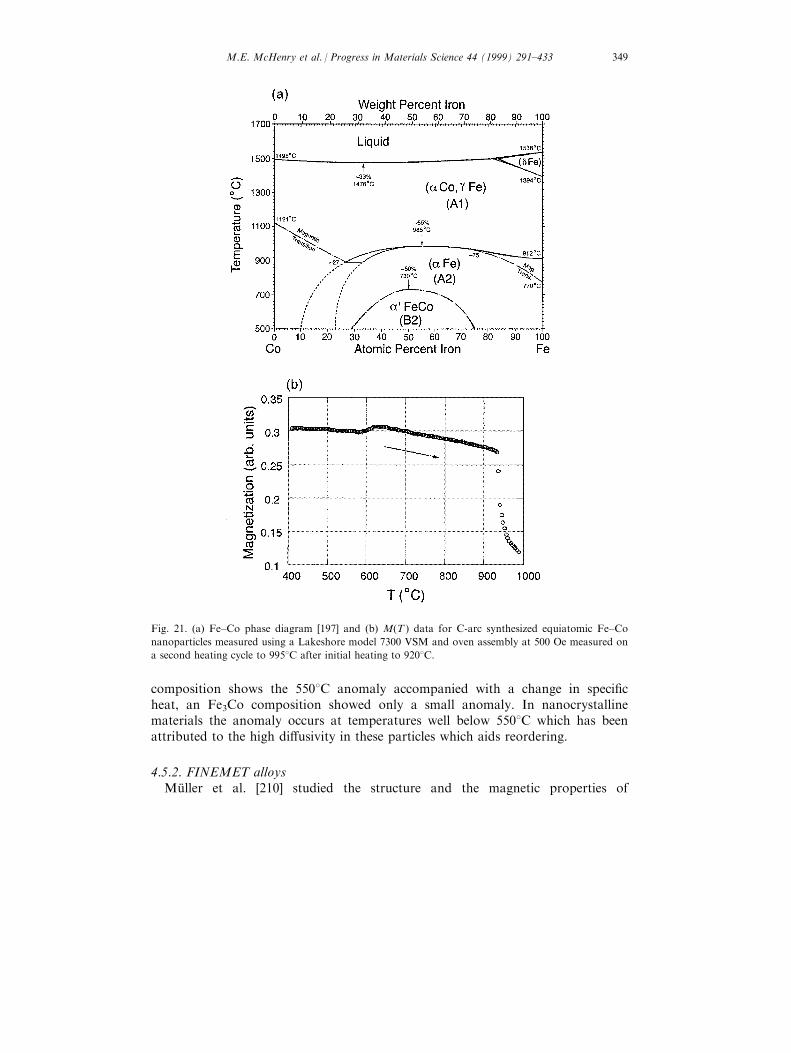
composition shows the 5508C anomaly accompanied with a change in speci®cheat, an Fe3Co composition showed only a small anomaly. In nanocrystallinematerials the anomaly occurs at temperatures well below 5508C which has beenattributed to the high di�usivity in these particles which aids reordering.
4.5.2. FINEMET alloysMuÈ ller et al. [210] studied the structure and the magnetic properties of
Fig. 21. (a) Fe±Co phase diagram [197] and (b) M(T ) data for C-arc synthesized equiatomic Fe±Co
nanoparticles measured using a Lakeshore model 7300 VSM and oven assembly at 500 Oe measured on
a second heating cycle to 9958C after initial heating to 9208C.
M.E. McHenry et al. / Progress in Materials Science 44 (1999) 291±433 349
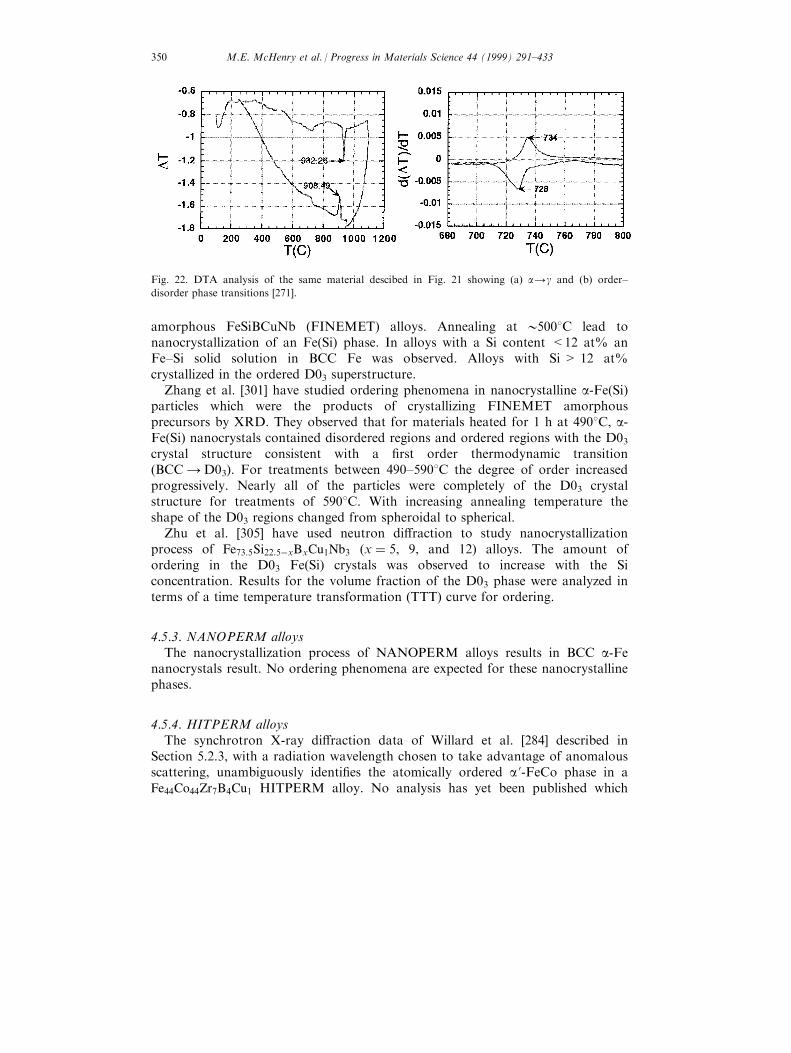
amorphous FeSiBCuNb (FINEMET) alloys. Annealing at 05008C lead tonanocrystallization of an Fe(Si) phase. In alloys with a Si content <12 at% anFe±Si solid solution in BCC Fe was observed. Alloys with Si > 12 at%crystallized in the ordered D03 superstructure.
Zhang et al. [301] have studied ordering phenomena in nanocrystalline a-Fe(Si)particles which were the products of crystallizing FINEMET amorphousprecursors by XRD. They observed that for materials heated for 1 h at 4908C, a-Fe(Si) nanocrystals contained disordered regions and ordered regions with the D03crystal structure consistent with a ®rst order thermodynamic transition(BCC 4 D03). For treatments between 490±5908C the degree of order increasedprogressively. Nearly all of the particles were completely of the D03 crystalstructure for treatments of 5908C. With increasing annealing temperature theshape of the D03 regions changed from spheroidal to spherical.
Zhu et al. [305] have used neutron di�raction to study nanocrystallizationprocess of Fe73:5Si22:5ÿxBxCu1Nb3 (x � 5, 9, and 12) alloys. The amount ofordering in the D03 Fe(Si) crystals was observed to increase with the Siconcentration. Results for the volume fraction of the D03 phase were analyzed interms of a time temperature transformation (TTT) curve for ordering.
4.5.3. NANOPERM alloysThe nanocrystallization process of NANOPERM alloys results in BCC a-Fe
nanocrystals result. No ordering phenomena are expected for these nanocrystallinephases.
4.5.4. HITPERM alloysThe synchrotron X-ray di�raction data of Willard et al. [284] described in
Section 5.2.3, with a radiation wavelength chosen to take advantage of anomalousscattering, unambiguously identi®es the atomically ordered a'-FeCo phase in aFe44Co44Zr7B4Cu1 HITPERM alloy. No analysis has yet been published which
Fig. 22. DTA analysis of the same material descibed in Fig. 21 showing (a) a4g and (b) order±
disorder phase transitions [271].
M.E. McHenry et al. / Progress in Materials Science 44 (1999) 291±433350
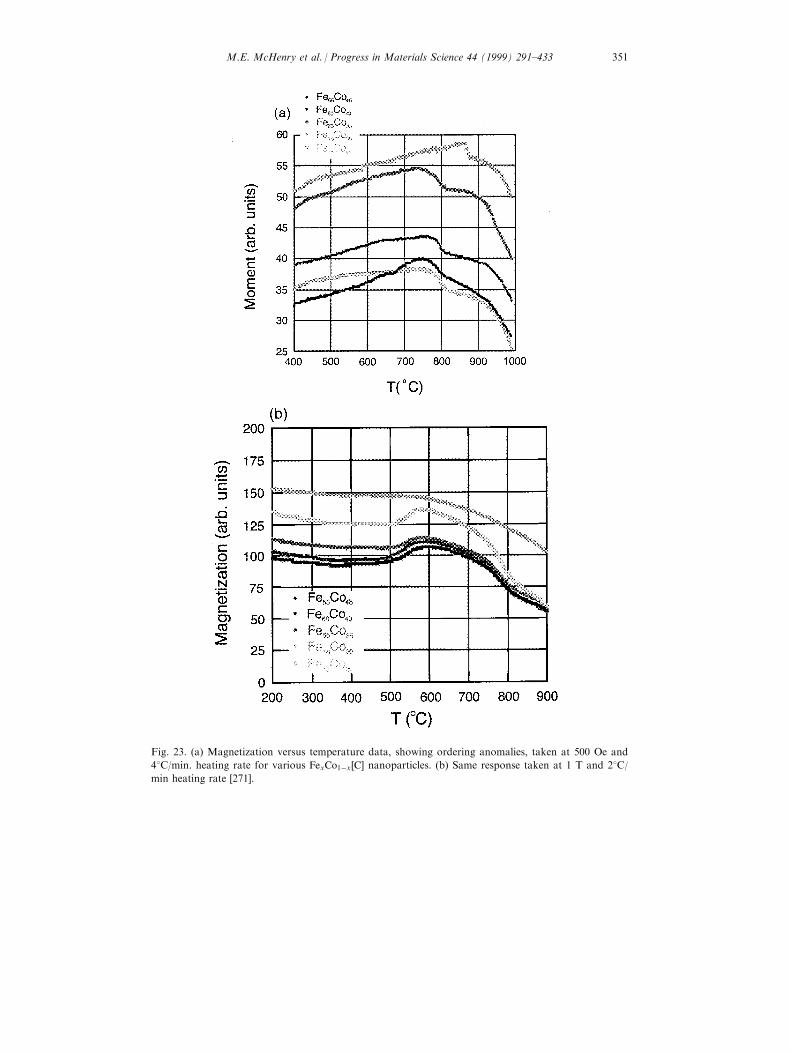
Fig. 23. (a) Magnetization versus temperature data, showing ordering anomalies, taken at 500 Oe and
48C/min. heating rate for various FexCo1ÿx�C� nanoparticles. (b) Same response taken at 1 T and 28C/min heating rate [271].
M.E. McHenry et al. / Progress in Materials Science 44 (1999) 291±433 351
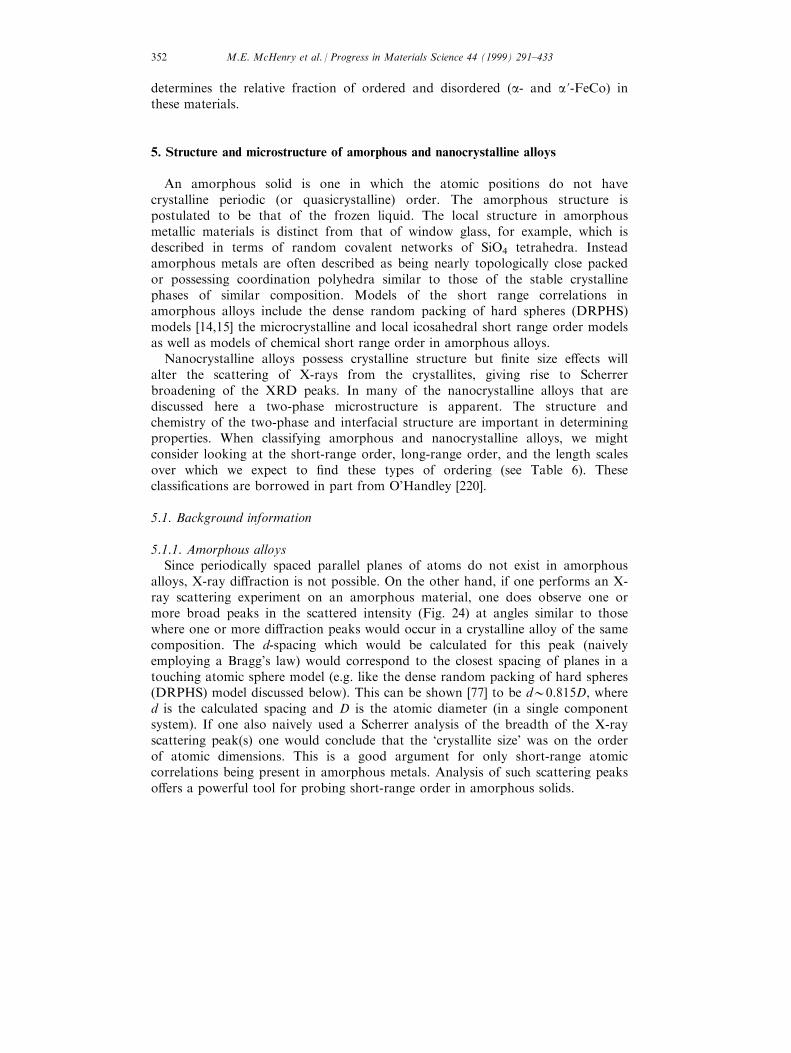
determines the relative fraction of ordered and disordered (a- and a'-FeCo) inthese materials.
5. Structure and microstructure of amorphous and nanocrystalline alloys
An amorphous solid is one in which the atomic positions do not havecrystalline periodic (or quasicrystalline) order. The amorphous structure ispostulated to be that of the frozen liquid. The local structure in amorphousmetallic materials is distinct from that of window glass, for example, which isdescribed in terms of random covalent networks of SiO4 tetrahedra. Insteadamorphous metals are often described as being nearly topologically close packedor possessing coordination polyhedra similar to those of the stable crystallinephases of similar composition. Models of the short range correlations inamorphous alloys include the dense random packing of hard spheres (DRPHS)models [14,15] the microcrystalline and local icosahedral short range order modelsas well as models of chemical short range order in amorphous alloys.
Nanocrystalline alloys possess crystalline structure but ®nite size e�ects willalter the scattering of X-rays from the crystallites, giving rise to Scherrerbroadening of the XRD peaks. In many of the nanocrystalline alloys that arediscussed here a two-phase microstructure is apparent. The structure andchemistry of the two-phase and interfacial structure are important in determiningproperties. When classifying amorphous and nanocrystalline alloys, we mightconsider looking at the short-range order, long-range order, and the length scalesover which we expect to ®nd these types of ordering (see Table 6). Theseclassi®cations are borrowed in part from O'Handley [220].
5.1. Background information
5.1.1. Amorphous alloysSince periodically spaced parallel planes of atoms do not exist in amorphous
alloys, X-ray di�raction is not possible. On the other hand, if one performs an X-ray scattering experiment on an amorphous material, one does observe one ormore broad peaks in the scattered intensity (Fig. 24) at angles similar to thosewhere one or more di�raction peaks would occur in a crystalline alloy of the samecomposition. The d-spacing which would be calculated for this peak (naivelyemploying a Bragg's law) would correspond to the closest spacing of planes in atouching atomic sphere model (e.g. like the dense random packing of hard spheres(DRPHS) model discussed below). This can be shown [77] to be d00:815D, whered is the calculated spacing and D is the atomic diameter (in a single componentsystem). If one also naively used a Scherrer analysis of the breadth of the X-rayscattering peak(s) one would conclude that the `crystallite size' was on the orderof atomic dimensions. This is a good argument for only short-range atomiccorrelations being present in amorphous metals. Analysis of such scattering peakso�ers a powerful tool for probing short-range order in amorphous solids.
M.E. McHenry et al. / Progress in Materials Science 44 (1999) 291±433352
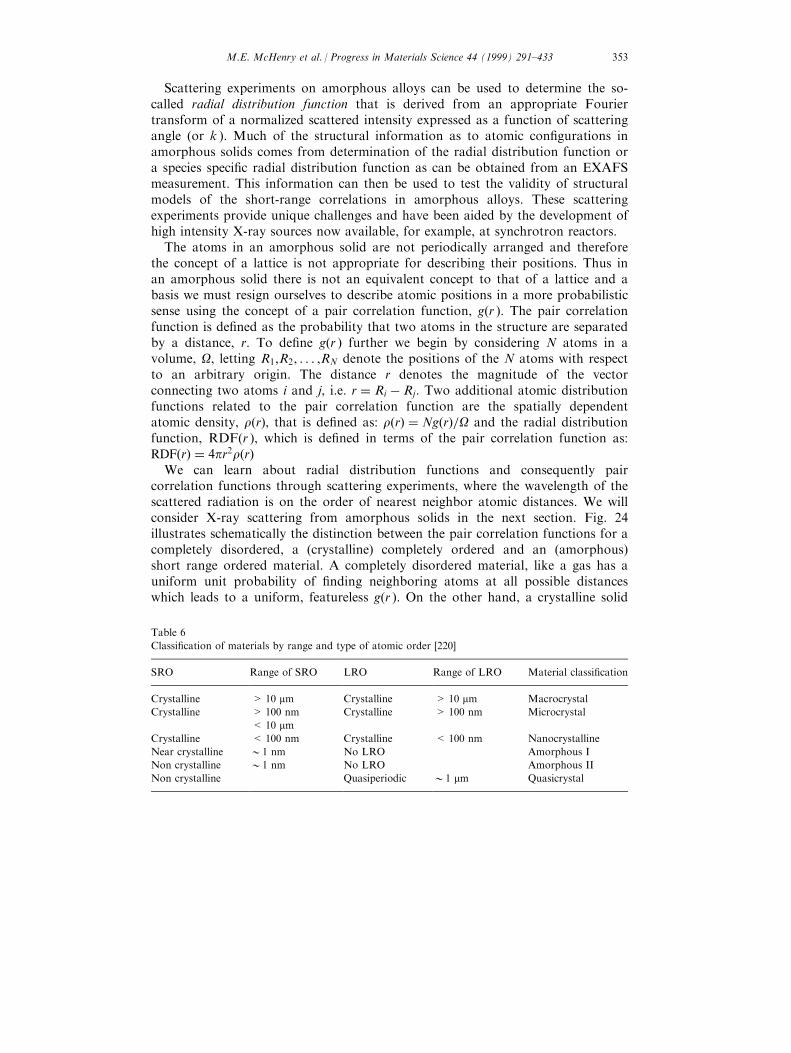
Scattering experiments on amorphous alloys can be used to determine the so-called radial distribution function that is derived from an appropriate Fouriertransform of a normalized scattered intensity expressed as a function of scatteringangle (or k ). Much of the structural information as to atomic con®gurations inamorphous solids comes from determination of the radial distribution function ora species speci®c radial distribution function as can be obtained from an EXAFSmeasurement. This information can then be used to test the validity of structuralmodels of the short-range correlations in amorphous alloys. These scatteringexperiments provide unique challenges and have been aided by the development ofhigh intensity X-ray sources now available, for example, at synchrotron reactors.
The atoms in an amorphous solid are not periodically arranged and thereforethe concept of a lattice is not appropriate for describing their positions. Thus inan amorphous solid there is not an equivalent concept to that of a lattice and abasis we must resign ourselves to describe atomic positions in a more probabilisticsense using the concept of a pair correlation function, g(r ). The pair correlationfunction is de®ned as the probability that two atoms in the structure are separatedby a distance, r. To de®ne g(r ) further we begin by considering N atoms in avolume, O, letting R1,R2, . . . ,RN denote the positions of the N atoms with respectto an arbitrary origin. The distance r denotes the magnitude of the vectorconnecting two atoms i and j, i.e. r � Ri ÿ Rj. Two additional atomic distributionfunctions related to the pair correlation function are the spatially dependentatomic density, r�r�, that is de®ned as: r�r� � Ng�r�=O and the radial distributionfunction, RDF(r ), which is de®ned in terms of the pair correlation function as:RDF�r� � 4pr2r�r�
We can learn about radial distribution functions and consequently paircorrelation functions through scattering experiments, where the wavelength of thescattered radiation is on the order of nearest neighbor atomic distances. We willconsider X-ray scattering from amorphous solids in the next section. Fig. 24illustrates schematically the distinction between the pair correlation functions for acompletely disordered, a (crystalline) completely ordered and an (amorphous)short range ordered material. A completely disordered material, like a gas has auniform unit probability of ®nding neighboring atoms at all possible distanceswhich leads to a uniform, featureless g(r ). On the other hand, a crystalline solid
Table 6
Classi®cation of materials by range and type of atomic order [220]
SRO Range of SRO LRO Range of LRO Material classi®cation
Crystalline > 10 mm Crystalline > 10 mm Macrocrystal
Crystalline > 100 nm Crystalline > 100 nm Microcrystal
< 10 mmCrystalline < 100 nm Crystalline < 100 nm Nanocrystalline
Near crystalline 01 nm No LRO Amorphous I
Non crystalline 01 nm No LRO Amorphous II
Non crystalline Quasiperiodic 01 mm Quasicrystal
M.E. McHenry et al. / Progress in Materials Science 44 (1999) 291±433 353
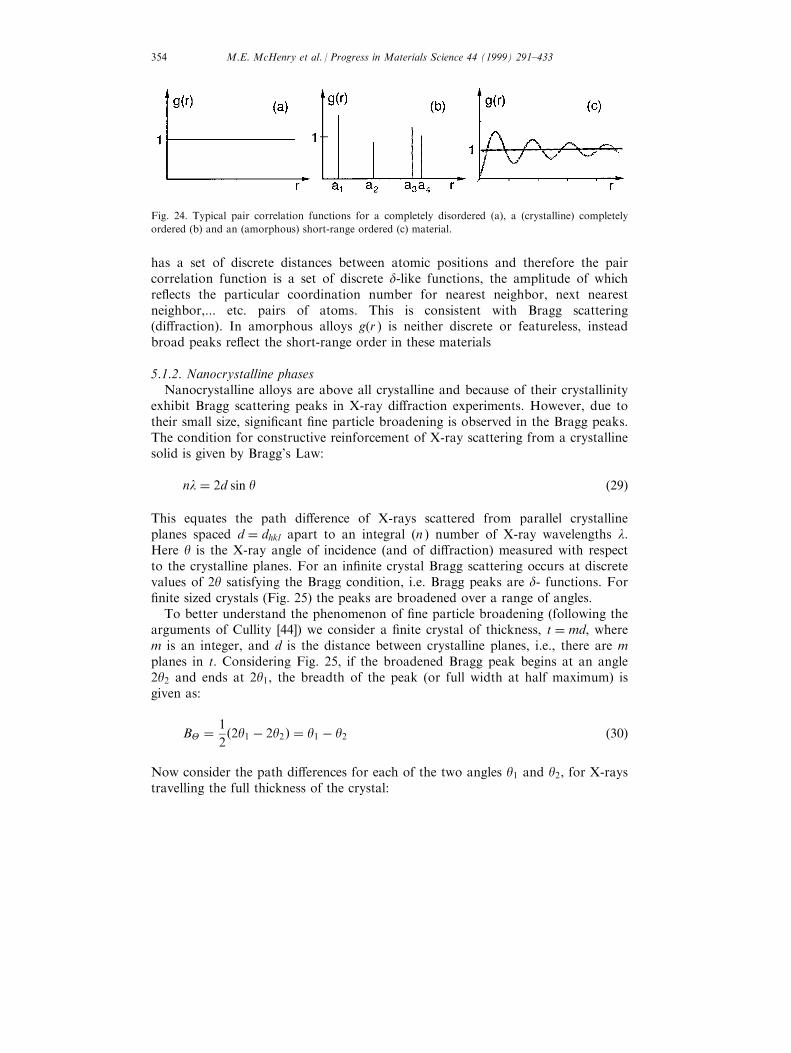
has a set of discrete distances between atomic positions and therefore the paircorrelation function is a set of discrete d-like functions, the amplitude of whichre¯ects the particular coordination number for nearest neighbor, next nearestneighbor,... etc. pairs of atoms. This is consistent with Bragg scattering(di�raction). In amorphous alloys g(r ) is neither discrete or featureless, insteadbroad peaks re¯ect the short-range order in these materials
5.1.2. Nanocrystalline phasesNanocrystalline alloys are above all crystalline and because of their crystallinity
exhibit Bragg scattering peaks in X-ray di�raction experiments. However, due totheir small size, signi®cant ®ne particle broadening is observed in the Bragg peaks.The condition for constructive reinforcement of X-ray scattering from a crystallinesolid is given by Bragg's Law:
nl � 2d sin y �29�
This equates the path di�erence of X-rays scattered from parallel crystallineplanes spaced d � dhkl apart to an integral (n ) number of X-ray wavelengths l.Here y is the X-ray angle of incidence (and of di�raction) measured with respectto the crystalline planes. For an in®nite crystal Bragg scattering occurs at discretevalues of 2y satisfying the Bragg condition, i.e. Bragg peaks are d- functions. For®nite sized crystals (Fig. 25) the peaks are broadened over a range of angles.
To better understand the phenomenon of ®ne particle broadening (following thearguments of Cullity [44]) we consider a ®nite crystal of thickness, t � md, wherem is an integer, and d is the distance between crystalline planes, i.e., there are mplanes in t. Considering Fig. 25, if the broadened Bragg peak begins at an angle2y2 and ends at 2y1, the breadth of the peak (or full width at half maximum) isgiven as:
BY � 1
2�2y1 ÿ 2y2� � y1 ÿ y2 �30�
Now consider the path di�erences for each of the two angles y1 and y2, for X-raystravelling the full thickness of the crystal:
Fig. 24. Typical pair correlation functions for a completely disordered (a), a (crystalline) completely
ordered (b) and an (amorphous) short-range ordered (c) material.
M.E. McHenry et al. / Progress in Materials Science 44 (1999) 291±433354
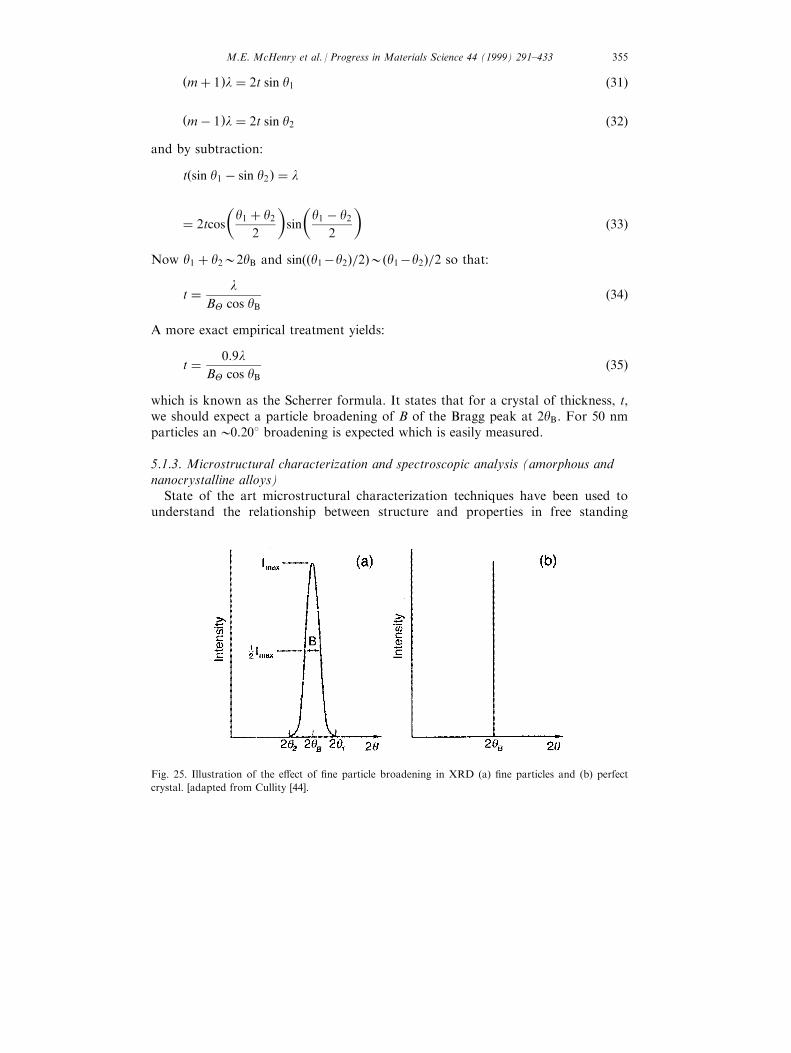
�m� 1�l � 2t sin y1 �31�
�mÿ 1�l � 2t sin y2 �32�and by subtraction:
t�sin y1 ÿ sin y2� � l
� 2tcos
�y1 � y2
2
�sin
�y1 ÿ y2
2
��33�
Now y1 � y202yB and sin��y1ÿy2�=2�0�y1ÿy2�=2 so that:
t � lBY cos yB
�34�
A more exact empirical treatment yields:
t � 0:9lBY cos yB
�35�
which is known as the Scherrer formula. It states that for a crystal of thickness, t,we should expect a particle broadening of B of the Bragg peak at 2yB. For 50 nmparticles an00.208 broadening is expected which is easily measured.
5.1.3. Microstructural characterization and spectroscopic analysis (amorphous andnanocrystalline alloys)
State of the art microstructural characterization techniques have been used tounderstand the relationship between structure and properties in free standing
Fig. 25. Illustration of the e�ect of ®ne particle broadening in XRD (a) ®ne particles and (b) perfect
crystal. [adapted from Cullity [44].
M.E. McHenry et al. / Progress in Materials Science 44 (1999) 291±433 355
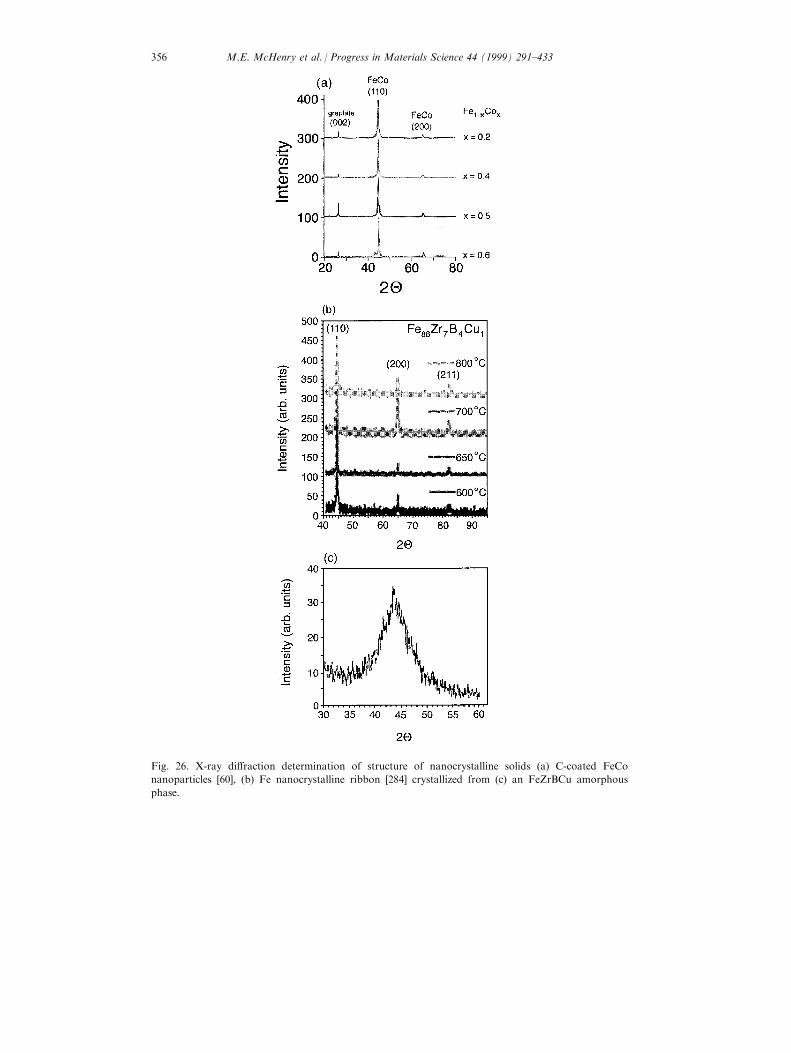
Fig. 26. X-ray di�raction determination of structure of nanocrystalline solids (a) C-coated FeCo
nanoparticles [60], (b) Fe nanocrystalline ribbon [284] crystallized from (c) an FeZrBCu amorphous
phase.
M.E. McHenry et al. / Progress in Materials Science 44 (1999) 291±433356
(powder) magnetic nanocrystals and nanocrystalline compacts. In particular, TEMis used to characterize the coating, size, and size distribution, and electrondi�raction (ED) to determine the phases present in the powder sample. EnergyDispersive X-ray Fluorescence Spectroscopy (EDS) can be used to ascertain thedistribution of elements.
Of particular importance is the issue of chemical homogeneity in alloynanoparticles. Here energy ®ltered microscopy (EFM), scanning transmissionelectron microscopy (STEM), and parallel electron energy loss spectroscopy(PEELS) enable probes of chemistry on a nanometer size scale. PEELScomplements the elemental mapping capability of EFM. PEELS enablesquantitative analysis on a 1±2 nm scale that is critical to phase identi®cation incomplex alloy systems. Energy resolution of STEM based PEELS is superior tothe EFM (0.1 vs. 5 eV energy resolution, respectively). The ®ne structure of thecore shell transitions can reveal the type of bonding of Fe atoms at the grainboundaries, for example. Combination of high brightness with a ®eld emissionsource and reduced sample drift improves signal to noise ratios and make itpossible to study the spatial distribution of low abundance and light masselements (e.g. B). Lorentz microscopy is a particularly useful technique inmagnetic domain imaging. Atom probe ®eld ion microscopy (APFIM) has beenused, primarily by Hono, in the study of the chemistry of nanocrystallinematerials with high spatial resolution [116±118].
Scanning tunneling (STM) and atomic force (AFM) microscopies are used toprobe microstructure with atomic resolution. Magnetic force microscopy (MFM)allows for the study of magnetic domains with similar resolution. A variety ofother optical techniques are useful in domain imaging. These include Nomarski®ltered microscopy, light microscopy of ferro¯uid decorated samples, magneto-optic Kerr e�ect (MOKE), etc.
The MoÈ ssbauer e�ect refers to the recoil free gamma ray resonance absorption.This is the basis for MoÈ ssbauer spectroscopy which is commonly used as a probeof local environments and magnetic structure in solids. The MoÈ ssbauer e�ectinvolves the decay of a nucleus from an excited state to its ground state with theemission of a g-ray. In a solid the whole lattice takes up the recoil energy requiredfor momentum conservation. The large mass of the lattice means that the recoilenergy ( p 2/2m ) is negligible and the g-ray energy is precisely the di�erence inenergy between the excited and ground states of the emitting nuclei. An emitted g-ray can in turn be absorbed to pump a nuclei into it's exited state; where after amean lifetime t it will fall back into the ground state re-emitting the g-rayisotropically. This g-ray resonance ¯uorescence is used as a spectroscopic toolwhen the emitted g-ray energy is modulated by a Doppler shift associated with theharmonic motion (relative velocity) of the g-ray source and the emitting nuclei.This Doppler energy shift is given by E � �v=c�Eg , where v is the source velocity,c is the speed of light and Eg is the g-ray energy.
A MoÈ ssbauer spectra [91] consists of the g-ray intensity measured at a g-raydetector and collected as a function of the source/absorber relative velocity (andtherefore modulation energy, E ). A resonance occurs for E � G � h=2pt, where t
M.E. McHenry et al. / Progress in Materials Science 44 (1999) 291±433 357
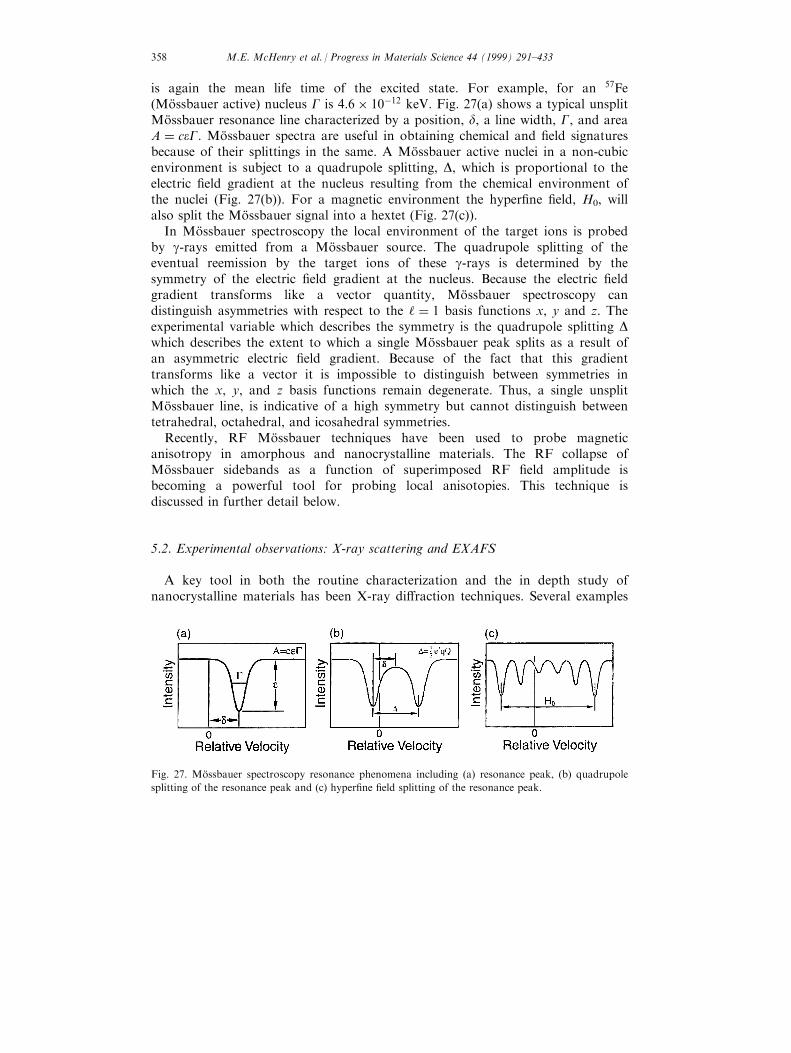
is again the mean life time of the excited state. For example, for an 57Fe
(MoÈ ssbauer active) nucleus G is 4:6� 10ÿ12 keV. Fig. 27(a) shows a typical unsplitMoÈ ssbauer resonance line characterized by a position, d, a line width, G, and areaA � ceG. MoÈ ssbauer spectra are useful in obtaining chemical and ®eld signaturesbecause of their splittings in the same. A MoÈ ssbauer active nuclei in a non-cubicenvironment is subject to a quadrupole splitting, D, which is proportional to theelectric ®eld gradient at the nucleus resulting from the chemical environment ofthe nuclei (Fig. 27(b)). For a magnetic environment the hyper®ne ®eld, H0, willalso split the MoÈ ssbauer signal into a hextet (Fig. 27(c)).
In MoÈ ssbauer spectroscopy the local environment of the target ions is probedby g-rays emitted from a MoÈ ssbauer source. The quadrupole splitting of theeventual reemission by the target ions of these g-rays is determined by thesymmetry of the electric ®eld gradient at the nucleus. Because the electric ®eldgradient transforms like a vector quantity, MoÈ ssbauer spectroscopy candistinguish asymmetries with respect to the ` � 1 basis functions x, y and z. Theexperimental variable which describes the symmetry is the quadrupole splitting Dwhich describes the extent to which a single MoÈ ssbauer peak splits as a result ofan asymmetric electric ®eld gradient. Because of the fact that this gradienttransforms like a vector it is impossible to distinguish between symmetries inwhich the x, y, and z basis functions remain degenerate. Thus, a single unsplitMoÈ ssbauer line, is indicative of a high symmetry but cannot distinguish betweentetrahedral, octahedral, and icosahedral symmetries.
Recently, RF MoÈ ssbauer techniques have been used to probe magneticanisotropy in amorphous and nanocrystalline materials. The RF collapse ofMoÈ ssbauer sidebands as a function of superimposed RF ®eld amplitude isbecoming a powerful tool for probing local anisotopies. This technique isdiscussed in further detail below.
5.2. Experimental observations: X-ray scattering and EXAFS
A key tool in both the routine characterization and the in depth study ofnanocrystalline materials has been X-ray di�raction techniques. Several examples
Fig. 27. MoÈ ssbauer spectroscopy resonance phenomena including (a) resonance peak, (b) quadrupole
splitting of the resonance peak and (c) hyper®ne ®eld splitting of the resonance peak.
M.E. McHenry et al. / Progress in Materials Science 44 (1999) 291±433358
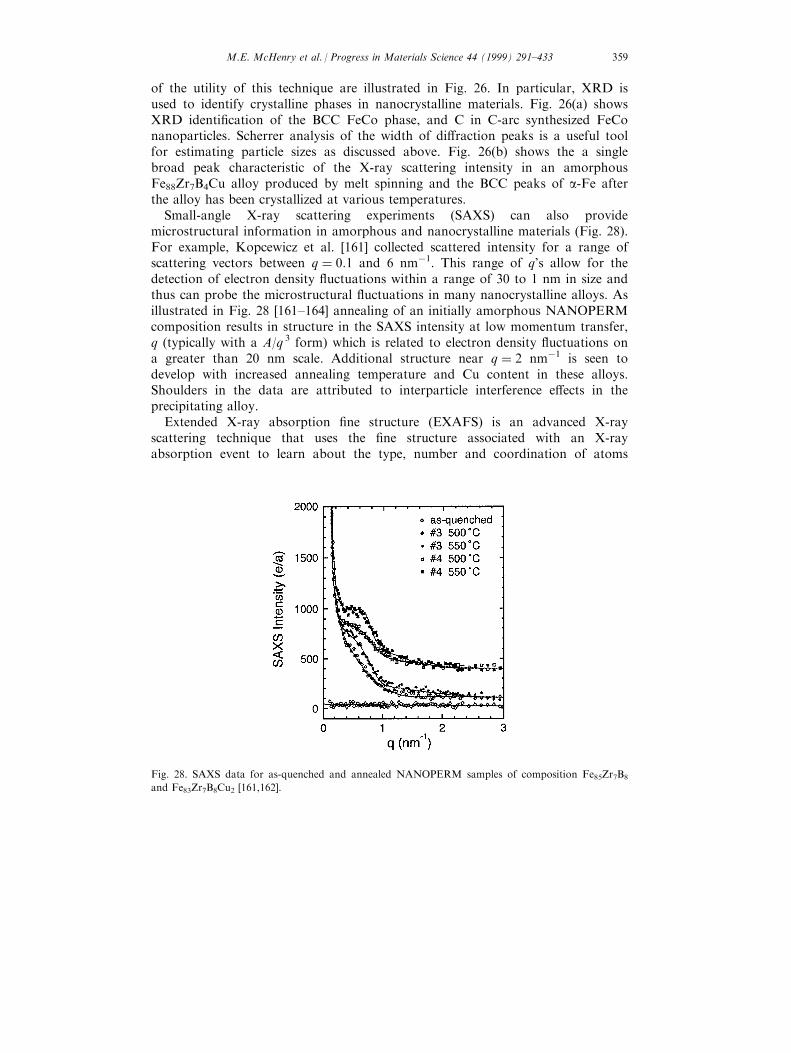
of the utility of this technique are illustrated in Fig. 26. In particular, XRD isused to identify crystalline phases in nanocrystalline materials. Fig. 26(a) showsXRD identi®cation of the BCC FeCo phase, and C in C-arc synthesized FeConanoparticles. Scherrer analysis of the width of di�raction peaks is a useful toolfor estimating particle sizes as discussed above. Fig. 26(b) shows the a singlebroad peak characteristic of the X-ray scattering intensity in an amorphousFe88Zr7B4Cu alloy produced by melt spinning and the BCC peaks of a-Fe afterthe alloy has been crystallized at various temperatures.
Small-angle X-ray scattering experiments (SAXS) can also providemicrostructural information in amorphous and nanocrystalline materials (Fig. 28).For example, Kopcewicz et al. [161] collected scattered intensity for a range ofscattering vectors between q � 0:1 and 6 nmÿ1. This range of q's allow for thedetection of electron density ¯uctuations within a range of 30 to 1 nm in size andthus can probe the microstructural ¯uctuations in many nanocrystalline alloys. Asillustrated in Fig. 28 [161±164] annealing of an initially amorphous NANOPERMcomposition results in structure in the SAXS intensity at low momentum transfer,q (typically with a A/q 3 form) which is related to electron density ¯uctuations ona greater than 20 nm scale. Additional structure near q � 2 nmÿ1 is seen todevelop with increased annealing temperature and Cu content in these alloys.Shoulders in the data are attributed to interparticle interference e�ects in theprecipitating alloy.
Extended X-ray absorption ®ne structure (EXAFS) is an advanced X-rayscattering technique that uses the ®ne structure associated with an X-rayabsorption event to learn about the type, number and coordination of atoms
Fig. 28. SAXS data for as-quenched and annealed NANOPERM samples of composition Fe85Zr7B8
and Fe83Zr7B8Cu2 [161,162].
M.E. McHenry et al. / Progress in Materials Science 44 (1999) 291±433 359
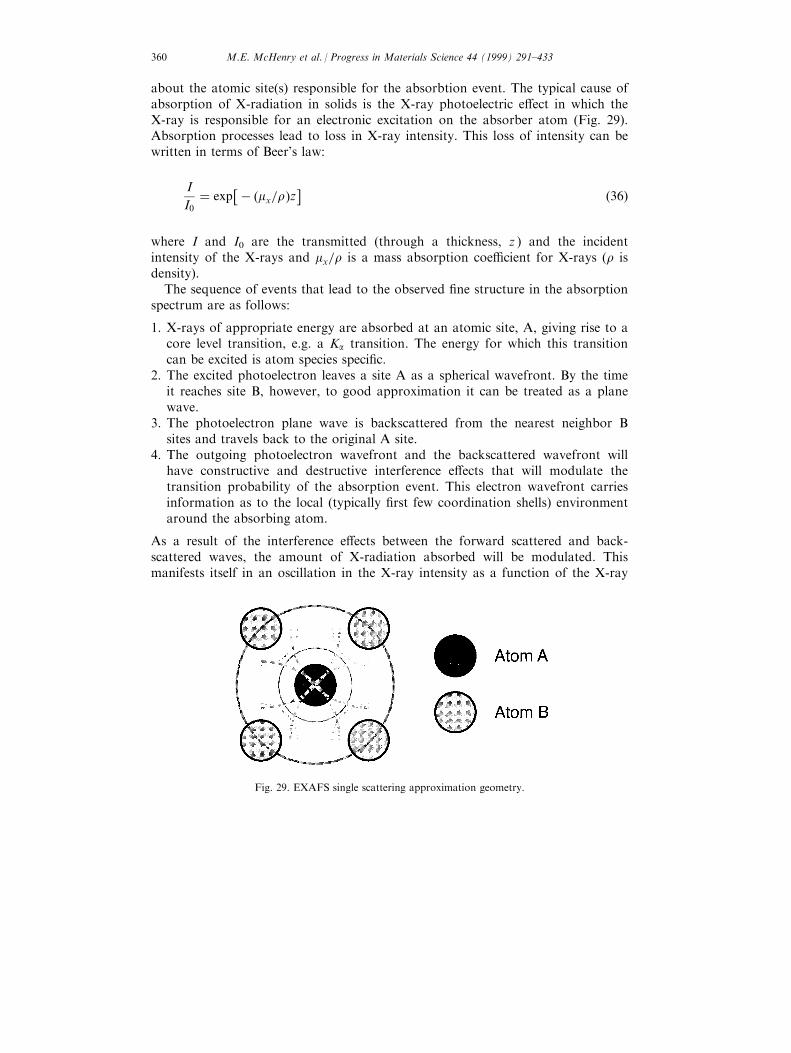
about the atomic site(s) responsible for the absorbtion event. The typical cause ofabsorption of X-radiation in solids is the X-ray photoelectric e�ect in which theX-ray is responsible for an electronic excitation on the absorber atom (Fig. 29).Absorption processes lead to loss in X-ray intensity. This loss of intensity can bewritten in terms of Beer's law:
I
I0� exp
�ÿ �mx=r�z� �36�
where I and I0 are the transmitted (through a thickness, z ) and the incidentintensity of the X-rays and mx=r is a mass absorption coe�cient for X-rays (r isdensity).
The sequence of events that lead to the observed ®ne structure in the absorptionspectrum are as follows:
1. X-rays of appropriate energy are absorbed at an atomic site, A, giving rise to acore level transition, e.g. a Ka transition. The energy for which this transitioncan be excited is atom species speci®c.
2. The excited photoelectron leaves a site A as a spherical wavefront. By the timeit reaches site B, however, to good approximation it can be treated as a planewave.
3. The photoelectron plane wave is backscattered from the nearest neighbor Bsites and travels back to the original A site.
4. The outgoing photoelectron wavefront and the backscattered wavefront willhave constructive and destructive interference e�ects that will modulate thetransition probability of the absorption event. This electron wavefront carriesinformation as to the local (typically ®rst few coordination shells) environmentaround the absorbing atom.
As a result of the interference e�ects between the forward scattered and back-scattered waves, the amount of X-radiation absorbed will be modulated. Thismanifests itself in an oscillation in the X-ray intensity as a function of the X-ray
Fig. 29. EXAFS single scattering approximation geometry.
M.E. McHenry et al. / Progress in Materials Science 44 (1999) 291±433360
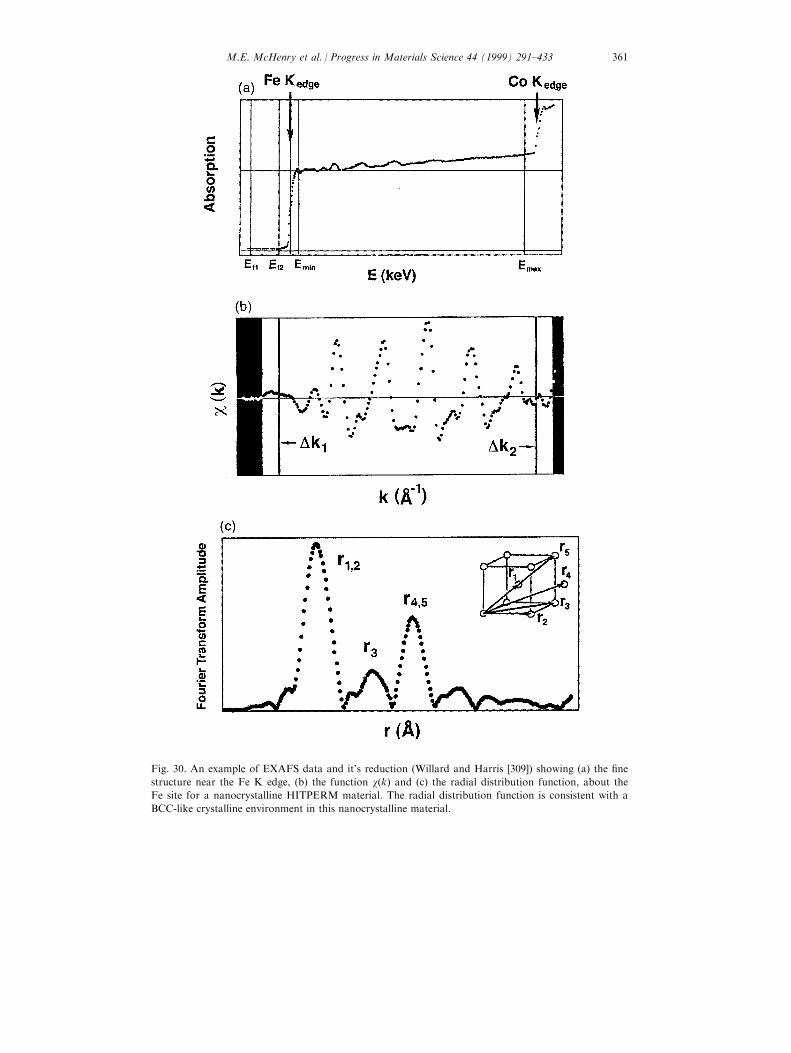
Fig. 30. An example of EXAFS data and it's reduction (Willard and Harris [309]) showing (a) the ®ne
structure near the Fe K edge, (b) the function w�k� and (c) the radial distribution function, about the
Fe site for a nanocrystalline HITPERM material. The radial distribution function is consistent with a
BCC-like crystalline environment in this nanocrystalline material.
M.E. McHenry et al. / Progress in Materials Science 44 (1999) 291±433 361
energy for energies exceeding the absorption threshold. Analysis of the ®nestructure to reveal structural information is accomplished in several steps:
1. The absorption coe�cient, m�k�, is determined as a function of the magnitudeof the wavevector, k.
2. The monotonically decreasing absorption coe�cient background is subtractedto yield only the oscillatory part that carries the information as to the type,number and distance of nearest neighbor scatterers. The functionw�k� � �m�k� ÿ m0�k��, is constructed where m0�k� is the non-oscillatory part ofthe absorption coe�cient.
3. The Fourier transform of the function kw�k� results in a (site-speci®c) radialdistribution function about the absorbing atom site.
This RDF is used within the EXAFS single scattering approximation to determinestructural information. An example of EXAFS data and its reduction are shownin Fig. 30 (Willard et al., [309]) showing the ®ne structure near the Fe K edge fornanocrystalline HITPERM material. A radial distribution function, about the Fesite, is consistent with a BCC-like crystalline environment in this nanocrystallinematerial.
5.2.1. FINEMET alloysThe EXAFS technique has been successfully used to support the role of Cu as
nucleation sites in the nanocrystallization process in FINEMET alloys. Earlypapers by Yoshizawa et al. [290,291,294] cited the reduction of the crystallizationtemperature of the a-FeSi phase due to the Cu addition, but failed to show directevidence of their hypothesis that the Cu provided heterogeneous nucleation sites.Later, Hono et al. [116] showed by atom probe ®eld ion microscopy that Cuclusters formed in these alloys at very short annealing times (as discussed below),and concluded that the Fe-based nanocrystals formed in the regions away fromthe Cu-rich clusters. Although this technique started to show the earlydevelopment of the nanocrystalline microstructure, the probe of the local short-range order of the Cu-rich nanoparticles was only possible with the EXAFStechnique.
EXAFS was ®rst used by Kim et al. [145] to discover that the Cu-rich particleswere FCC and formed at temperatures much lower than the crystallization of thea-FeSi phase. Another e�ort by Ayers et al. [9] showed the formation of the Cu-rich phase during the early stages of the heat treatment and evidence of FCC Cuformation in the as spun alloy. These studies were followed by a set ofexperiments performed by Ayers et al. [10] that led to the development of a modelfor the formation of the nanocrystalline microstructure in the FINEMET alloys.
This work by Ayers showed that even in the as cast material, the formation ofCu clusters of the size of a single FCC unit cell formed. As the samples wereannealed, the growth of the Cu clusters and the formation of new clustershappened in the early stages of annealing (less than 8 min). When compared to analloy without Nb (Fe76.5Si13.5B9Cu1), the FINEMET alloy formed considerably
M.E. McHenry et al. / Progress in Materials Science 44 (1999) 291±433362
smaller clusters. The Fe76.5Si13.5B9Cu1 alloy was seen to have no FCC Cuformation in the as cast state, but rapid formation of large Cu clusters.
These EXAFS data were used to form a model of the crystallization reactionfor formation of the optimum FINEMET microstructure. From the melt spinningprocess, an amorphous alloy with tiny copper clustering is produced. In the earlystages of annealing at an optimum temperature, new Cu-rich clusters are formed,as well as the growth of existing copper clusters, and the growth of a-FeSi usingthe FCC Cu-rich nanograins as heterogeneous nucleation sites. The concept ofheterogeneous nucleation of a-FeSi on the Cu-rich clusters is based on theminimization of the interfacial energy [234]. Finally, the growth of a-FeSicontinues and Cu clusters not used as nucleation sites grow to larger sizes (05nm).
Matsuura et al. [200] have used EXAFS at the Ga and Nb K-edges to examinethe structure of Fe73Ga4Nb3Si11B9 alloys after annealing to investigate the roles ofNb and Ga in the nanocrystallization process. Unlike Cu, in theFe73.5Cu1NB3Si13.5B9 FINEMET alloy, preferential Ga segregation could beinferred. EXAFS for alloys heat treated above the primary crystallizationtemperature, Tx1 revealed Ga substitution on BCC Fe sites.
5.2.2. NANOPERM alloysKopcewicz et al. [163,164] have determined a-Fe nanocrystal sizes in
Fe93ÿxÿyZr7BxCuy (x � 4, 6, 8, 12, and y � 0 or 2) alloys nanocrystalized between500 and 6508C, using conventional XRD and SAXS. Conventional XRD revealeda nanocrystal size of 5±14 nm as determined by Scherrer analysis. SAXS analysisrevealed grain sizes of 3±7 nm, consistently a factor of 2 smaller than thatdetermined by XRD. Since SAXS probes the entire sample volume and XRD thenear surface regions it was inferred that the surface grains are signi®cantly largerthan the bulk. Features of the SAXS data are described above.
5.2.3. HITPERM alloysThe ambiguity in the determination of the a-FeCo or a'-FeCo phases above Tx1
in conventional X-ray analysis, is due to the similarity of the atomic scatteringfactors of Fe and Co. This makes the observation of superlattice re¯ections inconventional XRD di�cult, since the structure factor for superlattice re¯ections isrelated to the di�erences of the two atomic scattering factors. However, by usingthe intense beam of the synchrotron X-ray source and choosing the radiationwavelength to take advantage of anomalous scattering, Willard et al. [265,266]increased the di�erence in atomic scattering factors allowing for observation ofsuperlattice re¯ections.
Synchrotron X-ray di�raction experiments, performed at the NationalSynchrotron Light Source on a nanocrystalline (HITPERM) Fe44Co44Zr7B4Cu1alloy by Willard et al. [284] have been used to identify the superlattice re¯ectionswhich are signatures of the ordered a'-FeCo phase. X-rays with energies of 7112eV or equivalently a wavelength of 1.748 AÊ were chosen to take advantage of theanomalous scattering between the Co and Fe Ka edges. Synchrotron X-ray
M.E. McHenry et al. / Progress in Materials Science 44 (1999) 291±433 363
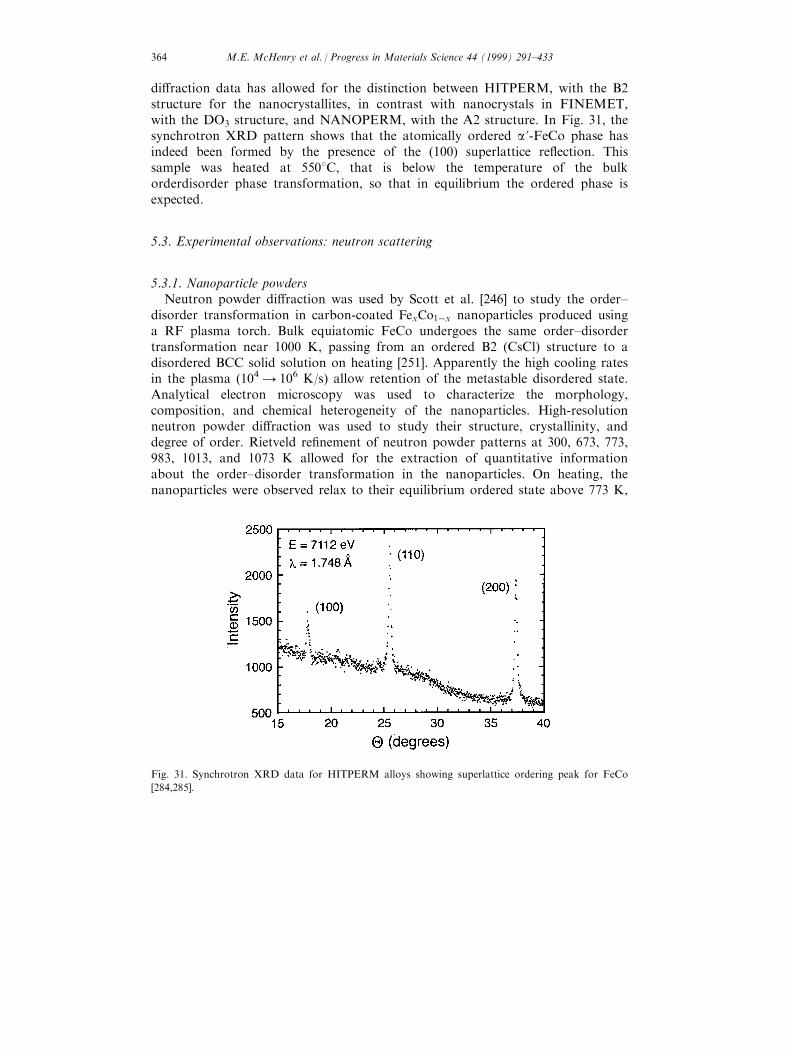
di�raction data has allowed for the distinction between HITPERM, with the B2structure for the nanocrystallites, in contrast with nanocrystals in FINEMET,with the DO3 structure, and NANOPERM, with the A2 structure. In Fig. 31, thesynchrotron XRD pattern shows that the atomically ordered a'-FeCo phase hasindeed been formed by the presence of the (100) superlattice re¯ection. Thissample was heated at 5508C, that is below the temperature of the bulkorderdisorder phase transformation, so that in equilibrium the ordered phase isexpected.
5.3. Experimental observations: neutron scattering
5.3.1. Nanoparticle powdersNeutron powder di�raction was used by Scott et al. [246] to study the order±
disorder transformation in carbon-coated FexCo1ÿx nanoparticles produced usinga RF plasma torch. Bulk equiatomic FeCo undergoes the same order±disordertransformation near 1000 K, passing from an ordered B2 (CsCl) structure to adisordered BCC solid solution on heating [251]. Apparently the high cooling ratesin the plasma (104 4 106 K/s) allow retention of the metastable disordered state.Analytical electron microscopy was used to characterize the morphology,composition, and chemical heterogeneity of the nanoparticles. High-resolutionneutron powder di�raction was used to study their structure, crystallinity, anddegree of order. Rietveld re®nement of neutron powder patterns at 300, 673, 773,983, 1013, and 1073 K allowed for the extraction of quantitative informationabout the order±disorder transformation in the nanoparticles. On heating, thenanoparticles were observed relax to their equilibrium ordered state above 773 K,
Fig. 31. Synchrotron XRD data for HITPERM alloys showing superlattice ordering peak for FeCo
[284,285].
M.E. McHenry et al. / Progress in Materials Science 44 (1999) 291±433364
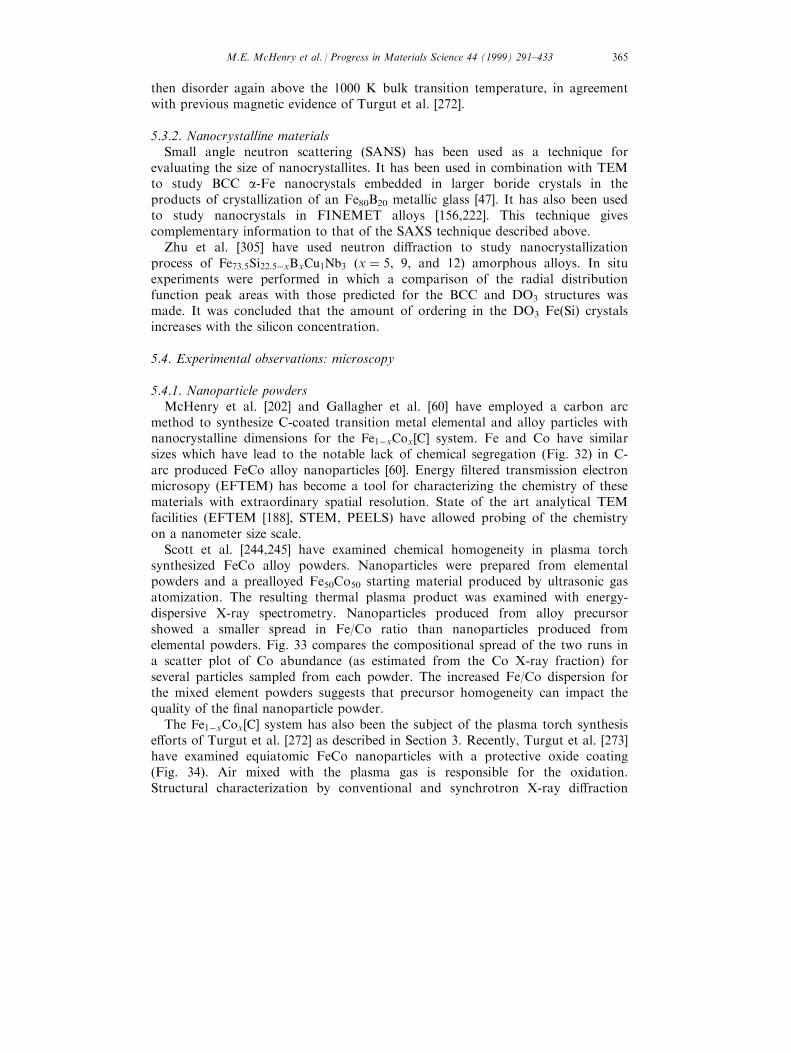
then disorder again above the 1000 K bulk transition temperature, in agreementwith previous magnetic evidence of Turgut et al. [272].
5.3.2. Nanocrystalline materialsSmall angle neutron scattering (SANS) has been used as a technique for
evaluating the size of nanocrystallites. It has been used in combination with TEMto study BCC a-Fe nanocrystals embedded in larger boride crystals in theproducts of crystallization of an Fe80B20 metallic glass [47]. It has also been usedto study nanocrystals in FINEMET alloys [156,222]. This technique givescomplementary information to that of the SAXS technique described above.
Zhu et al. [305] have used neutron di�raction to study nanocrystallizationprocess of Fe73:5Si22:5ÿxBxCu1Nb3 (x � 5, 9, and 12) amorphous alloys. In situexperiments were performed in which a comparison of the radial distributionfunction peak areas with those predicted for the BCC and DO3 structures wasmade. It was concluded that the amount of ordering in the DO3 Fe(Si) crystalsincreases with the silicon concentration.
5.4. Experimental observations: microscopy
5.4.1. Nanoparticle powdersMcHenry et al. [202] and Gallagher et al. [60] have employed a carbon arc
method to synthesize C-coated transition metal elemental and alloy particles withnanocrystalline dimensions for the Fe1ÿxCox�C� system. Fe and Co have similarsizes which have lead to the notable lack of chemical segregation (Fig. 32) in C-arc produced FeCo alloy nanoparticles [60]. Energy ®ltered transmission electronmicrosopy (EFTEM) has become a tool for characterizing the chemistry of thesematerials with extraordinary spatial resolution. State of the art analytical TEMfacilities (EFTEM [188], STEM, PEELS) have allowed probing of the chemistryon a nanometer size scale.
Scott et al. [244,245] have examined chemical homogeneity in plasma torchsynthesized FeCo alloy powders. Nanoparticles were prepared from elementalpowders and a prealloyed Fe50Co50 starting material produced by ultrasonic gasatomization. The resulting thermal plasma product was examined with energy-dispersive X-ray spectrometry. Nanoparticles produced from alloy precursorshowed a smaller spread in Fe/Co ratio than nanoparticles produced fromelemental powders. Fig. 33 compares the compositional spread of the two runs ina scatter plot of Co abundance (as estimated from the Co X-ray fraction) forseveral particles sampled from each powder. The increased Fe/Co dispersion forthe mixed element powders suggests that precursor homogeneity can impact thequality of the ®nal nanoparticle powder.
The Fe1ÿxCox�C� system has also been the subject of the plasma torch synthesise�orts of Turgut et al. [272] as described in Section 3. Recently, Turgut et al. [273]have examined equiatomic FeCo nanoparticles with a protective oxide coating(Fig. 34). Air mixed with the plasma gas is responsible for the oxidation.Structural characterization by conventional and synchrotron X-ray di�raction
M.E. McHenry et al. / Progress in Materials Science 44 (1999) 291±433 365
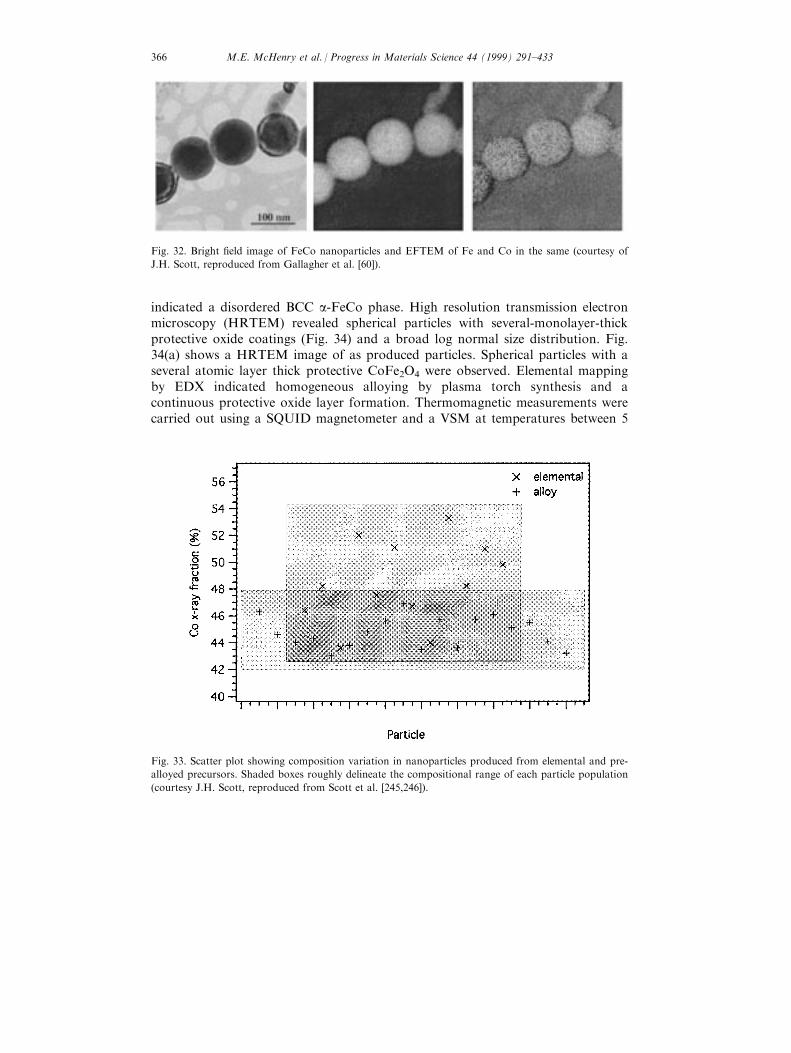
indicated a disordered BCC a-FeCo phase. High resolution transmission electronmicroscopy (HRTEM) revealed spherical particles with several-monolayer-thickprotective oxide coatings (Fig. 34) and a broad log normal size distribution. Fig.34(a) shows a HRTEM image of as produced particles. Spherical particles with aseveral atomic layer thick protective CoFe2O4 were observed. Elemental mappingby EDX indicated homogeneous alloying by plasma torch synthesis and acontinuous protective oxide layer formation. Thermomagnetic measurements werecarried out using a SQUID magnetometer and a VSM at temperatures between 5
Fig. 33. Scatter plot showing composition variation in nanoparticles produced from elemental and pre-
alloyed precursors. Shaded boxes roughly delineate the compositional range of each particle population
(courtesy J.H. Scott, reproduced from Scott et al. [245,246]).
Fig. 32. Bright ®eld image of FeCo nanoparticles and EFTEM of Fe and Co in the same (courtesy of
J.H. Scott, reproduced from Gallagher et al. [60]).
M.E. McHenry et al. / Progress in Materials Science 44 (1999) 291±433366
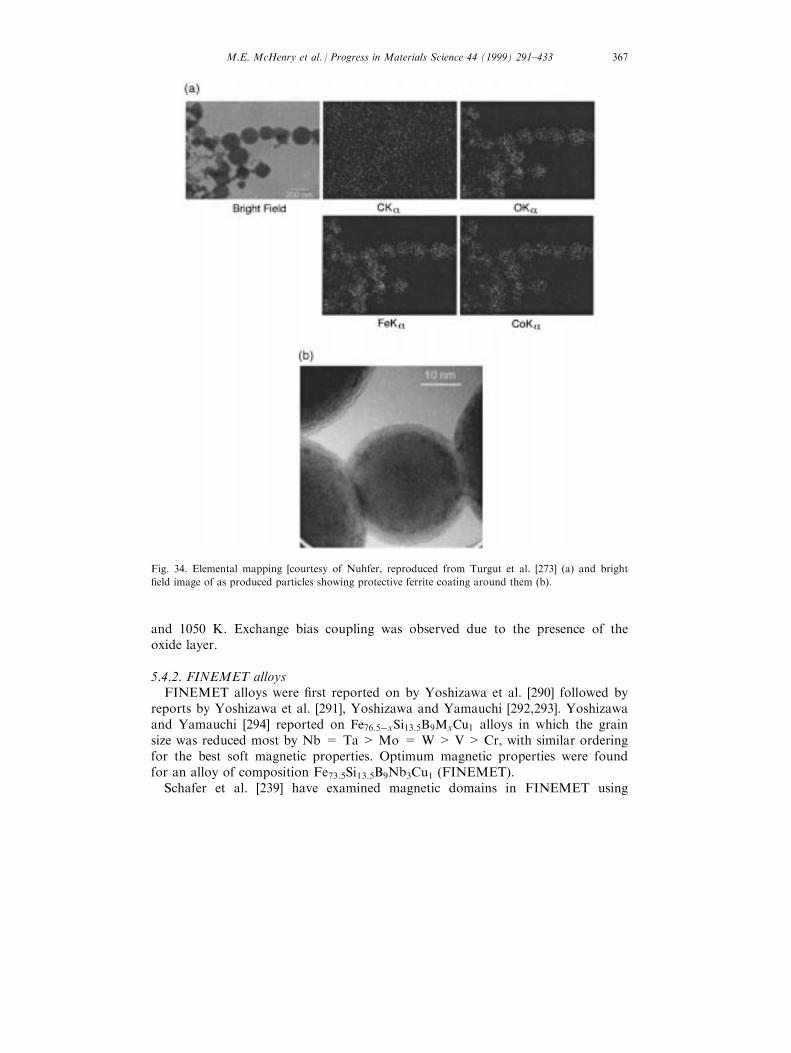
and 1050 K. Exchange bias coupling was observed due to the presence of theoxide layer.
5.4.2. FINEMET alloysFINEMET alloys were ®rst reported on by Yoshizawa et al. [290] followed by
reports by Yoshizawa et al. [291], Yoshizawa and Yamauchi [292,293]. Yoshizawaand Yamauchi [294] reported on Fe76:5ÿxSi13:5B9MxCu1 alloys in which the grainsize was reduced most by Nb = Ta > Mo = W > V> Cr, with similar orderingfor the best soft magnetic properties. Optimum magnetic properties were foundfor an alloy of composition Fe73.5Si13.5B9Nb3Cu1 (FINEMET).
Schafer et al. [239] have examined magnetic domains in FINEMET using
Fig. 34. Elemental mapping [courtesy of Nuhfer, reproduced from Turgut et al. [273] (a) and bright
®eld image of as produced particles showing protective ferrite coating around them (b).
M.E. McHenry et al. / Progress in Materials Science 44 (1999) 291±433 367
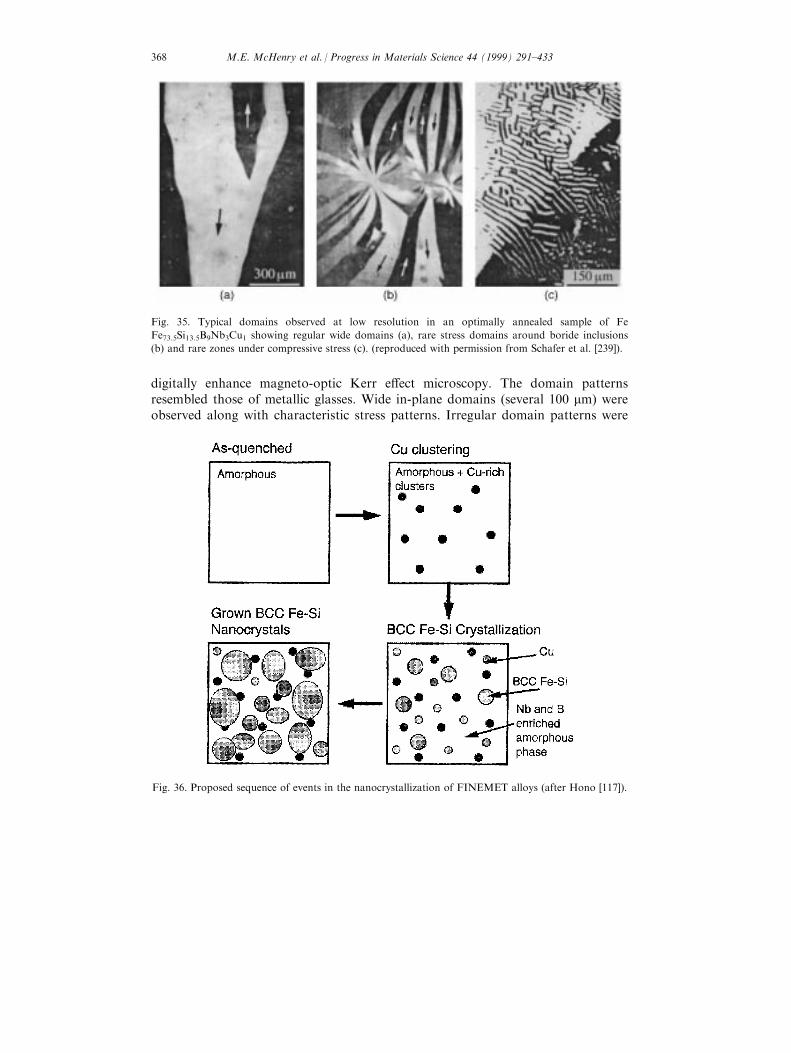
digitally enhance magneto-optic Kerr e�ect microscopy. The domain patternsresembled those of metallic glasses. Wide in-plane domains (several 100 mm) wereobserved along with characteristic stress patterns. Irregular domain patterns were
Fig. 35. Typical domains observed at low resolution in an optimally annealed sample of Fe
Fe73.5Si13.5B9Nb3Cu1 showing regular wide domains (a), rare stress domains around boride inclusions
(b) and rare zones under compressive stress (c). (reproduced with permission from Schafer et al. [239]).
Fig. 36. Proposed sequence of events in the nanocrystallization of FINEMET alloys (after Hono [117]).
M.E. McHenry et al. / Progress in Materials Science 44 (1999) 291±433368
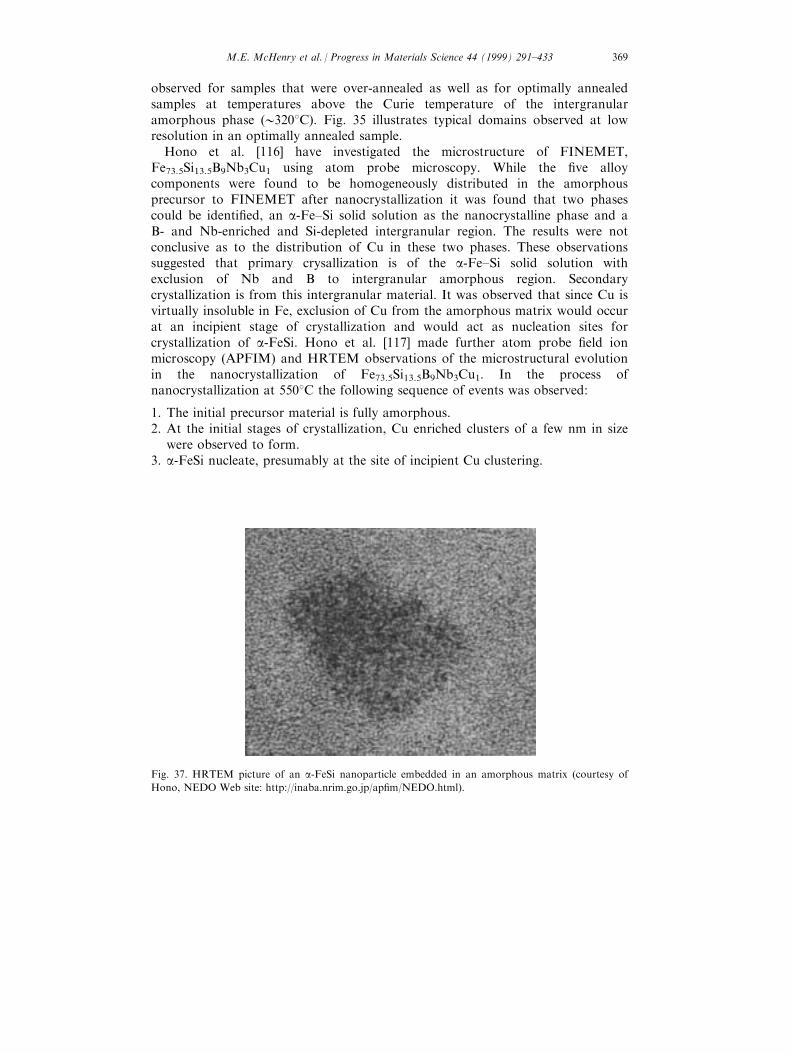
observed for samples that were over-annealed as well as for optimally annealedsamples at temperatures above the Curie temperature of the intergranularamorphous phase (03208C). Fig. 35 illustrates typical domains observed at lowresolution in an optimally annealed sample.
Hono et al. [116] have investigated the microstructure of FINEMET,Fe73.5Si13.5B9Nb3Cu1 using atom probe microscopy. While the ®ve alloycomponents were found to be homogeneously distributed in the amorphousprecursor to FINEMET after nanocrystallization it was found that two phasescould be identi®ed, an a-Fe±Si solid solution as the nanocrystalline phase and aB- and Nb-enriched and Si-depleted intergranular region. The results were notconclusive as to the distribution of Cu in these two phases. These observationssuggested that primary crysallization is of the a-Fe±Si solid solution withexclusion of Nb and B to intergranular amorphous region. Secondarycrystallization is from this intergranular material. It was observed that since Cu isvirtually insoluble in Fe, exclusion of Cu from the amorphous matrix would occurat an incipient stage of crystallization and would act as nucleation sites forcrystallization of a-FeSi. Hono et al. [117] made further atom probe ®eld ionmicroscopy (APFIM) and HRTEM observations of the microstructural evolutionin the nanocrystallization of Fe73.5Si13.5B9Nb3Cu1. In the process ofnanocrystallization at 5508C the following sequence of events was observed:
1. The initial precursor material is fully amorphous.2. At the initial stages of crystallization, Cu enriched clusters of a few nm in size
were observed to form.3. a-FeSi nucleate, presumably at the site of incipient Cu clustering.
Fig. 37. HRTEM picture of an a-FeSi nanoparticle embedded in an amorphous matrix (courtesy of
Hono, NEDO Web site: http://inaba.nrim.go.jp/ap®m/NEDO.html).
M.E. McHenry et al. / Progress in Materials Science 44 (1999) 291±433 369
4. a-FeSi nanocrystals grow while expelling Nb and B to the intergranularamorphous phase.
After nanocrystallization to the point of optimal microstructure there were threephases present. These were a (020 at% Si) BCC solid solution, a residualamorphous phase with 05 at% Si and 10±15 at% Nb and B and a third phasewith 060% Cu, <5 at% of Si, B and Nb and 030 at% Fe. These observationssuggest that Cu cluster formation promotes chemical segregation and nucleationof the primary phase. Nb and B, which have low solubility in Fe, are expelledfrom the BCC Fe±Si crystals. A Nb- and B-rich residual amorphous phasesurround the nanocrystals. The sequences illustrated in Fig. 36. Fig. 37 showsHRTEM picture of an a-FeSi nanoparticle embedded in an amorphous matrix ofa crystallized FINEMET alloy (courtesy of K. Hono, NEDO Web site: http://inaba.nrim.go.jp/ap®m/NEDO.html).
Koster et al. [168] studied nanocrystallization of metal±metalloid glasses, byelectron microscopy and in situ time-resolved X-ray di�raction. In a Fe66Ni10B24
glass the ®nest microstructure was obtained by annealing at temperaturessigni®cantly below the nose in a time temperature transformation (TTT) curve.This microstructure consisted of 0100 nm grains. For FINEMET materials, thesigni®cantly smaller 010 nm grains were attributed to a reduced growth of Fe±Sirate as a result of dissolved Nb and with progressive expulsion of Cu an increasednucleation rate of primary crystallites. The fast nucleation, but slow growth givesrise to the extremely ®ne microstructure.
MuÈ ller et al. [209] studied the structure and the magnetic properties ofamorphous FeSiBCuNb (FINEMET) alloys. Annealing at 05008C lead tonanocrystallization of an Fe(Si) phase. In alloys with a Si content <12 at% anFe±Si solid solution in BCC Fe was observed. Alloys with Si > 12 at%crystallized in the ordered DO3 superstructure. A mean grain size between 5 and12 nm was observed depending on annealing temperature and composition.MuÈ ller et al. [210] studied the in¯uence of Cu/Nb content and annealingconditions on the microstructure and the magnetic properties of FINEMETalloys. Grain size, phase composition and transition temperatures were observedto depend on the Cu/Nb content. The magnetic properties are strongly correlatedto the microstructural features.
5.4.3. NANOPERM alloysTEM observations [293] and and XRD [215] on NANOPERM materials have
shown that the nanocrystalline magnetic phase was a BCC Fe solid solution.HRTEM, Mossbauer and atom probe microscopy [116] have all provided evidencefor materials with optimum magnetic properties having two phases, amorphousand the BCC phases. Kim et al. [146] investigated the operative microstructuralmechanism behind increased e�ective permeabilities in Fe93ÿxZ7B4 (x � 2, 4, 6, 8)alloys with B additions. Here nanocrystalline a-Fe were responsible for the highpermeabilities. For x � 2, 4 and an intergranular boride phase was said to developfrom a spinodal-type decomposition. For higher B contents (x � 6, 8)
M.E. McHenry et al. / Progress in Materials Science 44 (1999) 291±433370
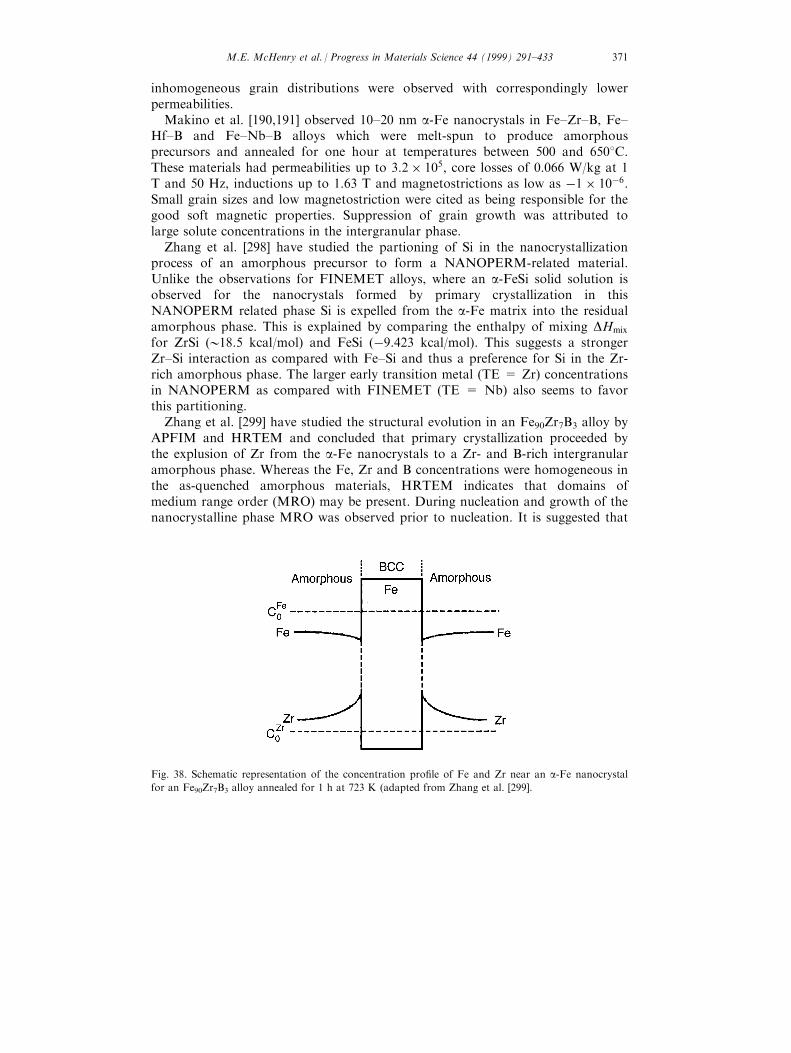
inhomogeneous grain distributions were observed with correspondingly lowerpermeabilities.
Makino et al. [190,191] observed 10±20 nm a-Fe nanocrystals in Fe±Zr±B, Fe±Hf±B and Fe±Nb±B alloys which were melt-spun to produce amorphousprecursors and annealed for one hour at temperatures between 500 and 6508C.These materials had permeabilities up to 3:2� 105, core losses of 0.066 W/kg at 1T and 50 Hz, inductions up to 1.63 T and magnetostrictions as low as ÿ1� 10ÿ6.Small grain sizes and low magnetostriction were cited as being responsible for thegood soft magnetic properties. Suppression of grain growth was attributed tolarge solute concentrations in the intergranular phase.
Zhang et al. [298] have studied the partioning of Si in the nanocrystallizationprocess of an amorphous precursor to form a NANOPERM-related material.Unlike the observations for FINEMET alloys, where an a-FeSi solid solution isobserved for the nanocrystals formed by primary crystallization in thisNANOPERM related phase Si is expelled from the a-Fe matrix into the residualamorphous phase. This is explained by comparing the enthalpy of mixing DHmix
for ZrSi (018.5 kcal/mol) and FeSi (ÿ9.423 kcal/mol). This suggests a strongerZr±Si interaction as compared with Fe±Si and thus a preference for Si in the Zr-rich amorphous phase. The larger early transition metal (TE = Zr) concentrationsin NANOPERM as compared with FINEMET (TE = Nb) also seems to favorthis partitioning.
Zhang et al. [299] have studied the structural evolution in an Fe90Zr7B3 alloy byAPFIM and HRTEM and concluded that primary crystallization proceeded bythe explusion of Zr from the a-Fe nanocrystals to a Zr- and B-rich intergranularamorphous phase. Whereas the Fe, Zr and B concentrations were homogeneous inthe as-quenched amorphous materials, HRTEM indicates that domains ofmedium range order (MRO) may be present. During nucleation and growth of thenanocrystalline phase MRO was observed prior to nucleation. It is suggested that
Fig. 38. Schematic representation of the concentration pro®le of Fe and Zr near an a-Fe nanocrystal
for an Fe90Zr7B3 alloy annealed for 1 h at 723 K (adapted from Zhang et al. [299].
M.E. McHenry et al. / Progress in Materials Science 44 (1999) 291±433 371
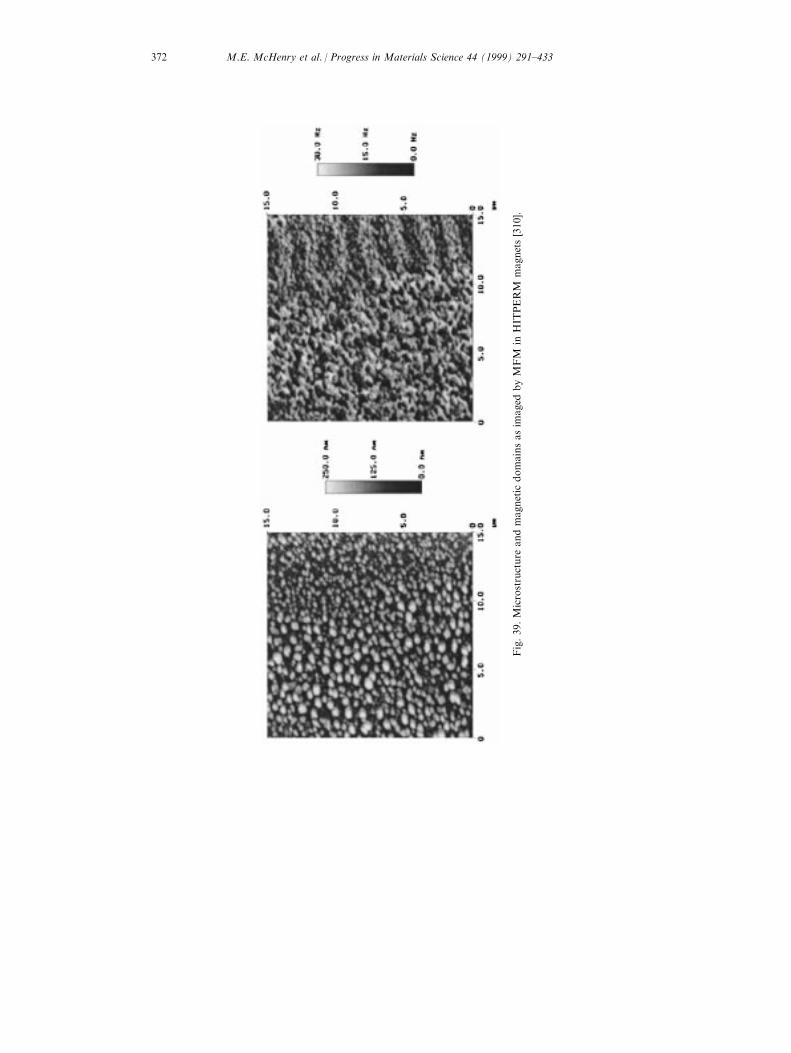
Fig.39.Microstructure
andmagnetic
domainsasim
aged
byMFM
inHIT
PERM
magnets[310].
M.E. McHenry et al. / Progress in Materials Science 44 (1999) 291±433372
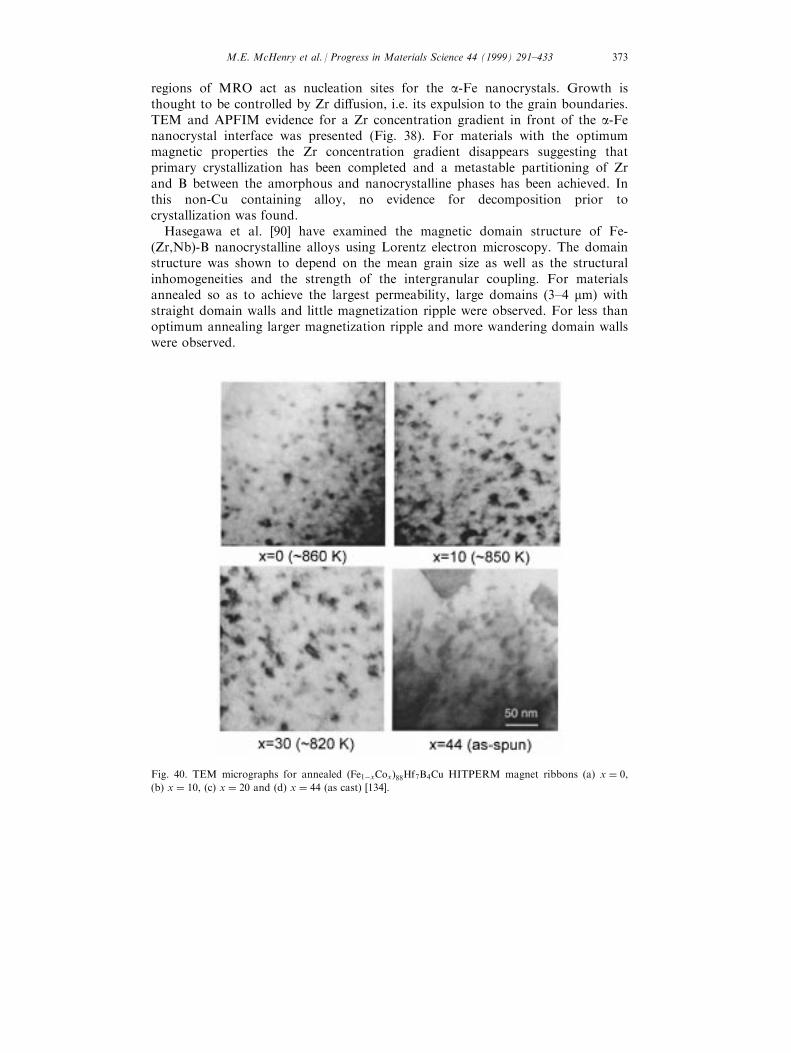
regions of MRO act as nucleation sites for the a-Fe nanocrystals. Growth isthought to be controlled by Zr di�usion, i.e. its expulsion to the grain boundaries.TEM and APFIM evidence for a Zr concentration gradient in front of the a-Fenanocrystal interface was presented (Fig. 38). For materials with the optimummagnetic properties the Zr concentration gradient disappears suggesting thatprimary crystallization has been completed and a metastable partitioning of Zrand B between the amorphous and nanocrystalline phases has been achieved. Inthis non-Cu containing alloy, no evidence for decomposition prior tocrystallization was found.
Hasegawa et al. [90] have examined the magnetic domain structure of Fe-(Zr,Nb)-B nanocrystalline alloys using Lorentz electron microscopy. The domainstructure was shown to depend on the mean grain size as well as the structuralinhomogeneities and the strength of the intergranular coupling. For materialsannealed so as to achieve the largest permeability, large domains (3±4 mm) withstraight domain walls and little magnetization ripple were observed. For less thanoptimum annealing larger magnetization ripple and more wandering domain wallswere observed.
Fig. 40. TEM micrographs for annealed �Fe1ÿxCox�88Hf7B4Cu HITPERM magnet ribbons (a) x � 0,
(b) x � 10, (c) x � 20 and (d) x � 44 (as cast) [134].
M.E. McHenry et al. / Progress in Materials Science 44 (1999) 291±433 373
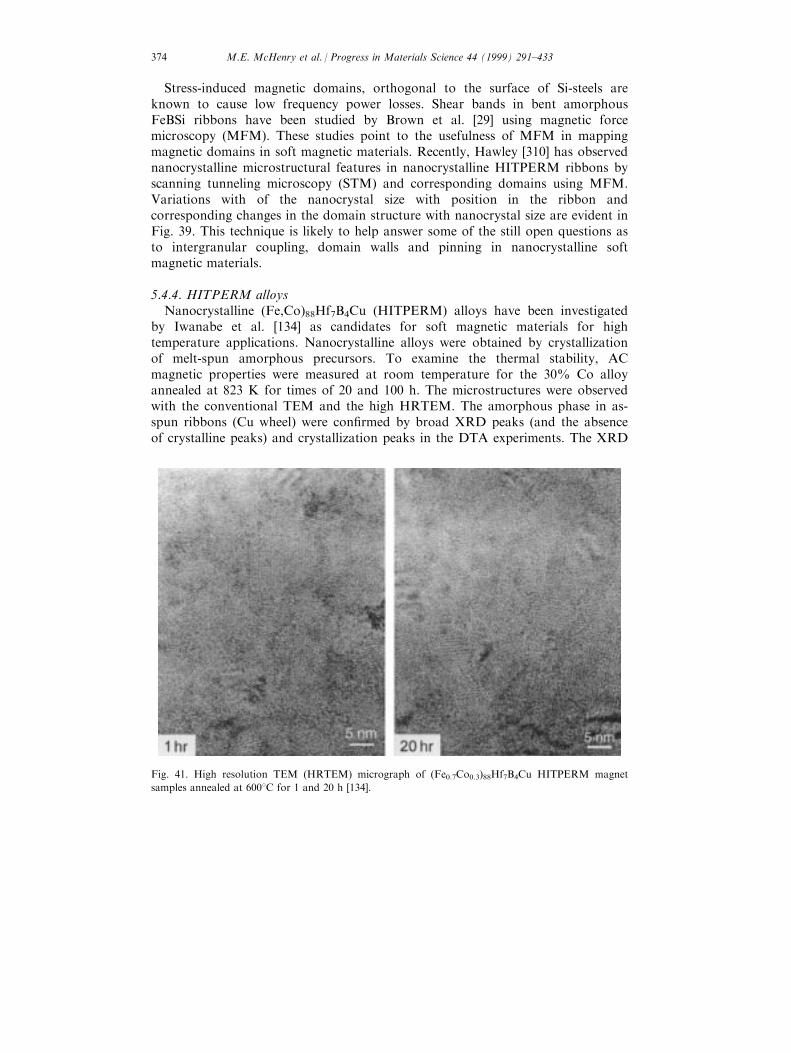
Stress-induced magnetic domains, orthogonal to the surface of Si-steels areknown to cause low frequency power losses. Shear bands in bent amorphousFeBSi ribbons have been studied by Brown et al. [29] using magnetic forcemicroscopy (MFM). These studies point to the usefulness of MFM in mappingmagnetic domains in soft magnetic materials. Recently, Hawley [310] has observednanocrystalline microstructural features in nanocrystalline HITPERM ribbons byscanning tunneling microscopy (STM) and corresponding domains using MFM.Variations with of the nanocrystal size with position in the ribbon andcorresponding changes in the domain structure with nanocrystal size are evident inFig. 39. This technique is likely to help answer some of the still open questions asto intergranular coupling, domain walls and pinning in nanocrystalline softmagnetic materials.
5.4.4. HITPERM alloysNanocrystalline (Fe,Co)88Hf7B4Cu (HITPERM) alloys have been investigated
by Iwanabe et al. [134] as candidates for soft magnetic materials for hightemperature applications. Nanocrystalline alloys were obtained by crystallizationof melt-spun amorphous precursors. To examine the thermal stability, ACmagnetic properties were measured at room temperature for the 30% Co alloyannealed at 823 K for times of 20 and 100 h. The microstructures were observedwith the conventional TEM and the high HRTEM. The amorphous phase in as-spun ribbons (Cu wheel) were con®rmed by broad XRD peaks (and the absenceof crystalline peaks) and crystallization peaks in the DTA experiments. The XRD
Fig. 41. High resolution TEM (HRTEM) micrograph of (Fe0.7Co0.3)88Hf7B4Cu HITPERM magnet
samples annealed at 6008C for 1 and 20 h [134].
M.E. McHenry et al. / Progress in Materials Science 44 (1999) 291±433374
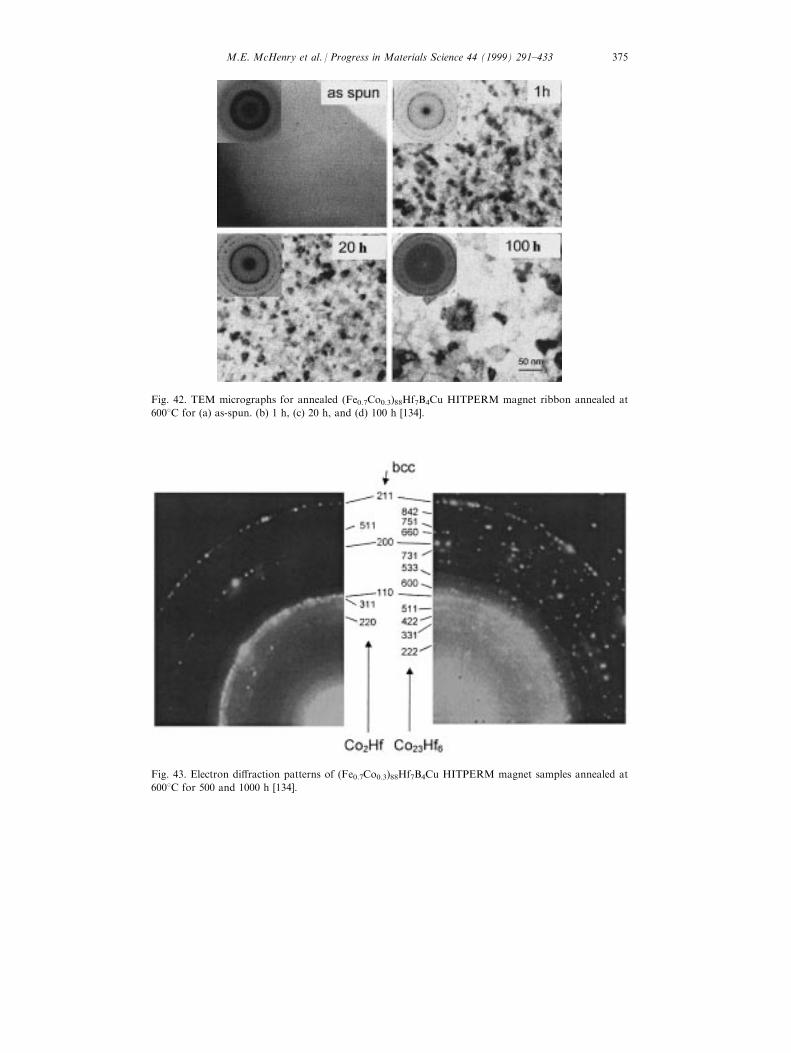
Fig. 42. TEM micrographs for annealed (Fe0.7Co0.3)88Hf7B4Cu HITPERM magnet ribbon annealed at
6008C for (a) as-spun. (b) 1 h, (c) 20 h, and (d) 100 h [134].
Fig. 43. Electron di�raction patterns of (Fe0.7Co0.3)88Hf7B4Cu HITPERM magnet samples annealed at
6008C for 500 and 1000 h [134].
M.E. McHenry et al. / Progress in Materials Science 44 (1999) 291±433 375
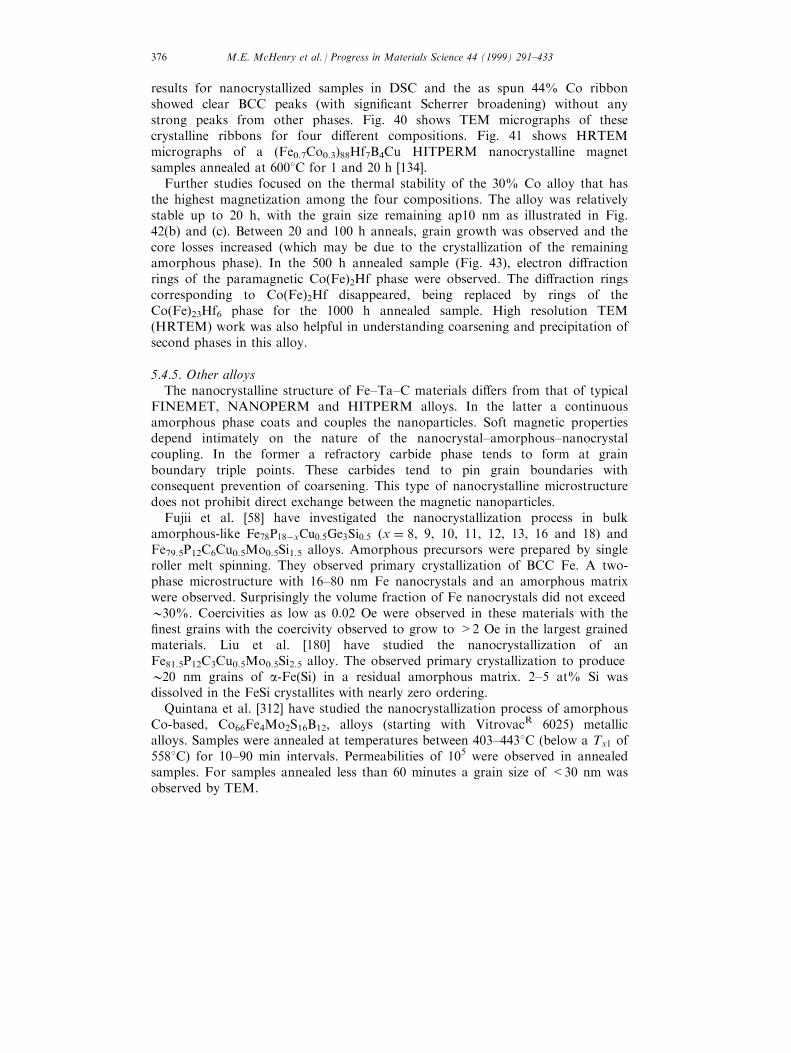
results for nanocrystallized samples in DSC and the as spun 44% Co ribbonshowed clear BCC peaks (with signi®cant Scherrer broadening) without anystrong peaks from other phases. Fig. 40 shows TEM micrographs of thesecrystalline ribbons for four di�erent compositions. Fig. 41 shows HRTEMmicrographs of a (Fe0.7Co0.3)88Hf7B4Cu HITPERM nanocrystalline magnetsamples annealed at 6008C for 1 and 20 h [134].
Further studies focused on the thermal stability of the 30% Co alloy that hasthe highest magnetization among the four compositions. The alloy was relativelystable up to 20 h, with the grain size remaining ap10 nm as illustrated in Fig.42(b) and (c). Between 20 and 100 h anneals, grain growth was observed and thecore losses increased (which may be due to the crystallization of the remainingamorphous phase). In the 500 h annealed sample (Fig. 43), electron di�ractionrings of the paramagnetic Co(Fe)2Hf phase were observed. The di�raction ringscorresponding to Co(Fe)2Hf disappeared, being replaced by rings of theCo(Fe)23Hf6 phase for the 1000 h annealed sample. High resolution TEM(HRTEM) work was also helpful in understanding coarsening and precipitation ofsecond phases in this alloy.
5.4.5. Other alloysThe nanocrystalline structure of Fe±Ta±C materials di�ers from that of typical
FINEMET, NANOPERM and HITPERM alloys. In the latter a continuousamorphous phase coats and couples the nanoparticles. Soft magnetic propertiesdepend intimately on the nature of the nanocrystal±amorphous±nanocrystalcoupling. In the former a refractory carbide phase tends to form at grainboundary triple points. These carbides tend to pin grain boundaries withconsequent prevention of coarsening. This type of nanocrystalline microstructuredoes not prohibit direct exchange between the magnetic nanoparticles.
Fujii et al. [58] have investigated the nanocrystallization process in bulkamorphous-like Fe78P18ÿxCu0:5Ge3Si0:5 (x � 8, 9, 10, 11, 12, 13, 16 and 18) andFe79.5P12C6Cu0.5Mo0.5Si1.5 alloys. Amorphous precursors were prepared by singleroller melt spinning. They observed primary crystallization of BCC Fe. A two-phase microstructure with 16±80 nm Fe nanocrystals and an amorphous matrixwere observed. Surprisingly the volume fraction of Fe nanocrystals did not exceed030%. Coercivities as low as 0.02 Oe were observed in these materials with the®nest grains with the coercivity observed to grow to >2 Oe in the largest grainedmaterials. Liu et al. [180] have studied the nanocrystallization of anFe81.5P12C3Cu0.5Mo0.5Si2.5 alloy. The observed primary crystallization to produce020 nm grains of a-Fe(Si) in a residual amorphous matrix. 2±5 at% Si wasdissolved in the FeSi crystallites with nearly zero ordering.
Quintana et al. [312] have studied the nanocrystallization process of amorphousCo-based, Co66Fe4Mo2S16B12, alloys (starting with VitrovacR 6025) metallicalloys. Samples were annealed at temperatures between 403±4438C (below a Tx1 of5588C) for 10±90 min intervals. Permeabilities of 105 were observed in annealedsamples. For samples annealed less than 60 minutes a grain size of <30 nm wasobserved by TEM.
M.E. McHenry et al. / Progress in Materials Science 44 (1999) 291±433376
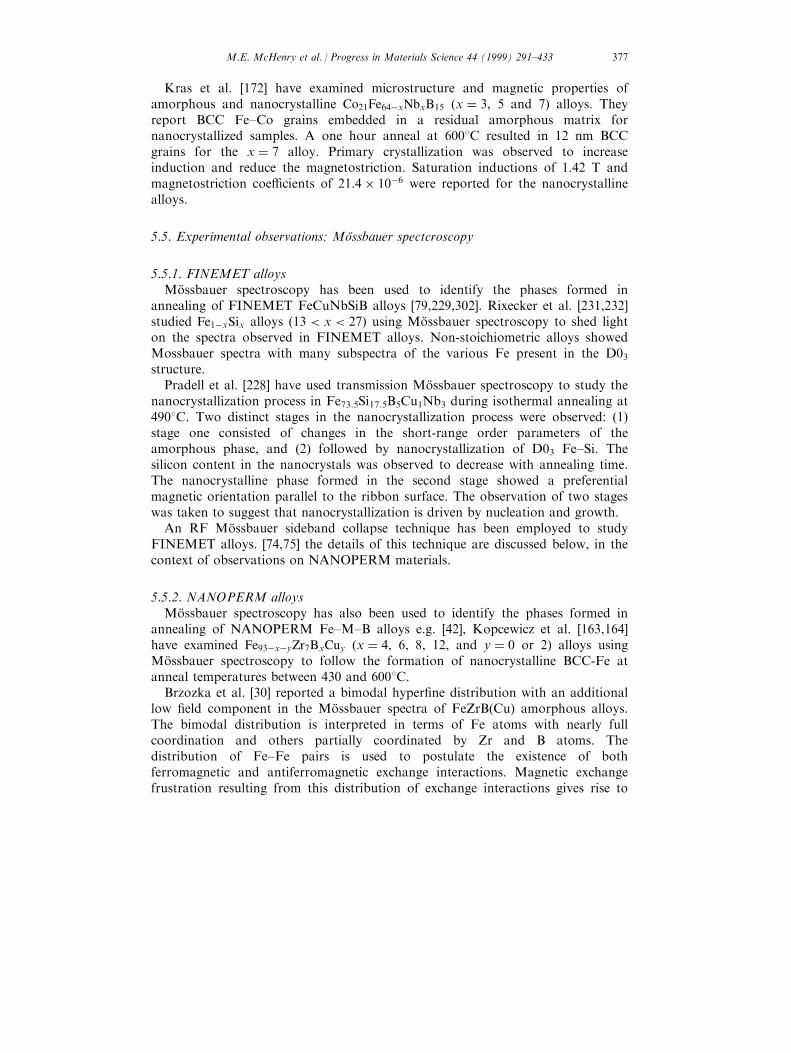
Kras et al. [172] have examined microstructure and magnetic properties ofamorphous and nanocrystalline Co21Fe64ÿxNbxB15 (x � 3, 5 and 7) alloys. Theyreport BCC Fe±Co grains embedded in a residual amorphous matrix fornanocrystallized samples. A one hour anneal at 6008C resulted in 12 nm BCCgrains for the x � 7 alloy. Primary crystallization was observed to increaseinduction and reduce the magnetostriction. Saturation inductions of 1.42 T andmagnetostriction coe�cients of 21:4� 10ÿ6 were reported for the nanocrystallinealloys.
5.5. Experimental observations: MoÈssbauer spectcroscopy
5.5.1. FINEMET alloysMoÈ ssbauer spectroscopy has been used to identify the phases formed in
annealing of FINEMET FeCuNbSiB alloys [79,229,302]. Rixecker et al. [231,232]studied Fe1ÿxSix alloys �13 < x < 27� using MoÈ ssbauer spectroscopy to shed lighton the spectra observed in FINEMET alloys. Non-stoichiometric alloys showedMossbauer spectra with many subspectra of the various Fe present in the D03structure.
Pradell et al. [228] have used transmission MoÈ ssbauer spectroscopy to study thenanocrystallization process in Fe73.5Si17.5B5Cu1Nb3 during isothermal annealing at4908C. Two distinct stages in the nanocrystallization process were observed: (1)stage one consisted of changes in the short-range order parameters of theamorphous phase, and (2) followed by nanocrystallization of D03 Fe±Si. Thesilicon content in the nanocrystals was observed to decrease with annealing time.The nanocrystalline phase formed in the second stage showed a preferentialmagnetic orientation parallel to the ribbon surface. The observation of two stageswas taken to suggest that nanocrystallization is driven by nucleation and growth.
An RF MoÈ ssbauer sideband collapse technique has been employed to studyFINEMET alloys. [74,75] the details of this technique are discussed below, in thecontext of observations on NANOPERM materials.
5.5.2. NANOPERM alloysMoÈ ssbauer spectroscopy has also been used to identify the phases formed in
annealing of NANOPERM Fe±M±B alloys e.g. [42], Kopcewicz et al. [163,164]have examined Fe93ÿxÿyZr7BxCuy (x � 4, 6, 8, 12, and y � 0 or 2) alloys usingMoÈ ssbauer spectroscopy to follow the formation of nanocrystalline BCC-Fe atanneal temperatures between 430 and 6008C.
Brzozka et al. [30] reported a bimodal hyper®ne distribution with an additionallow ®eld component in the MoÈ ssbauer spectra of FeZrB(Cu) amorphous alloys.The bimodal distribution is interpreted in terms of Fe atoms with nearly fullcoordination and others partially coordinated by Zr and B atoms. Thedistribution of Fe±Fe pairs is used to postulate the existence of bothferromagnetic and antiferromagnetic exchange interactions. Magnetic exchangefrustration resulting from this distribution of exchange interactions gives rise to
M.E. McHenry et al. / Progress in Materials Science 44 (1999) 291±433 377
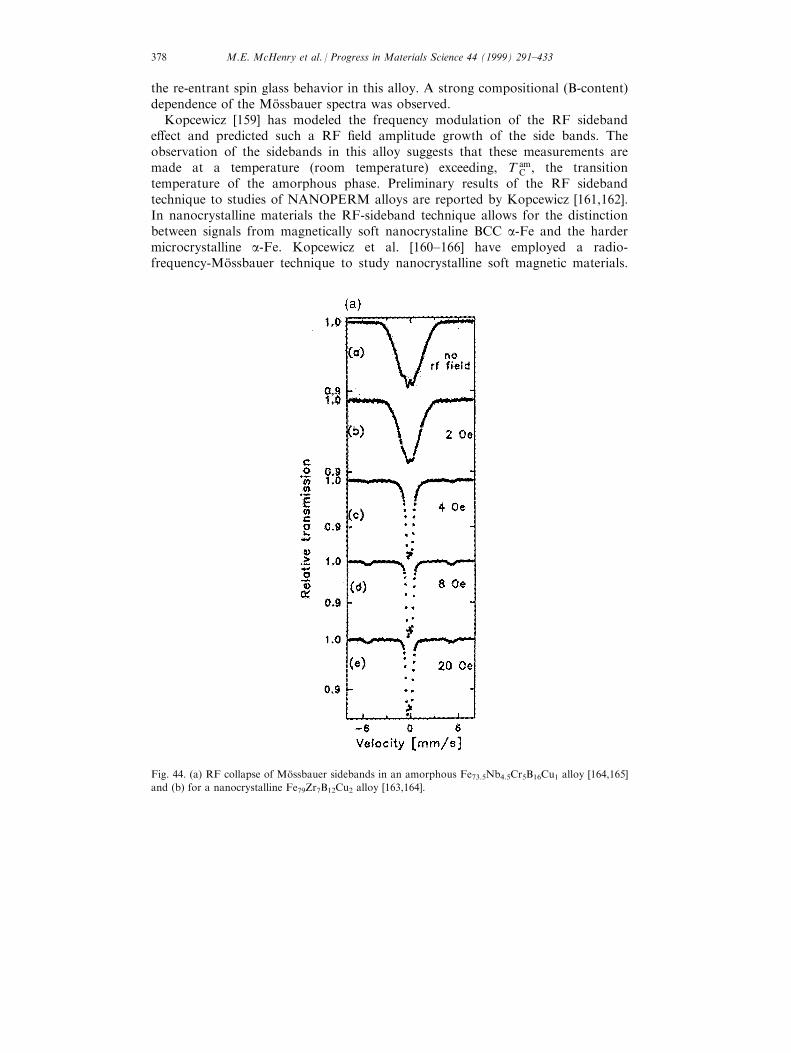
the re-entrant spin glass behavior in this alloy. A strong compositional (B-content)dependence of the MoÈ ssbauer spectra was observed.
Kopcewicz [159] has modeled the frequency modulation of the RF sidebande�ect and predicted such a RF ®eld amplitude growth of the side bands. Theobservation of the sidebands in this alloy suggests that these measurements aremade at a temperature (room temperature) exceeding, T am
C , the transitiontemperature of the amorphous phase. Preliminary results of the RF sidebandtechnique to studies of NANOPERM alloys are reported by Kopcewicz [161,162].In nanocrystalline materials the RF-sideband technique allows for the distinctionbetween signals from magnetically soft nanocrystaline BCC a-Fe and the hardermicrocrystalline a-Fe. Kopcewicz et al. [160±166] have employed a radio-frequency-MoÈ ssbauer technique to study nanocrystalline soft magnetic materials.
Fig. 44. (a) RF collapse of MoÈ ssbauer sidebands in an amorphous Fe73.5Nb4.5Cr5B16Cu1 alloy [164,165]
and (b) for a nanocrystalline Fe79Zr7B12Cu2 alloy [163,164].
M.E. McHenry et al. / Progress in Materials Science 44 (1999) 291±433378
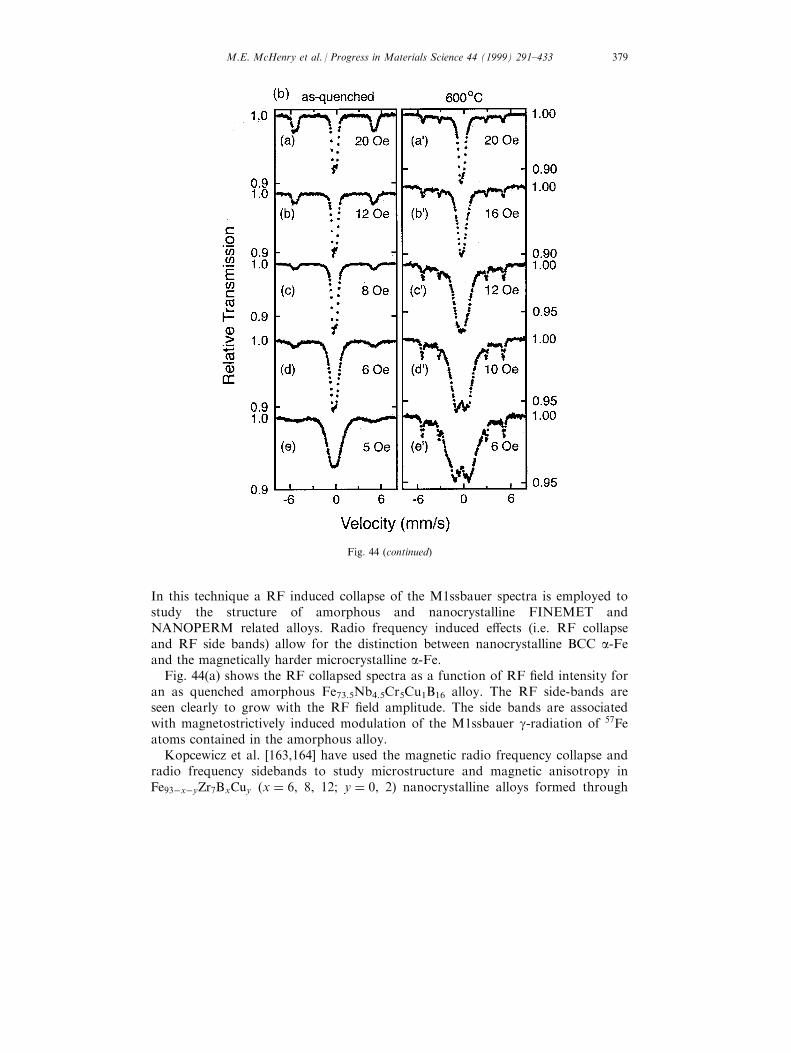
In this technique a RF induced collapse of the M1ssbauer spectra is employed tostudy the structure of amorphous and nanocrystalline FINEMET andNANOPERM related alloys. Radio frequency induced e�ects (i.e. RF collapseand RF side bands) allow for the distinction between nanocrystalline BCC a-Feand the magnetically harder microcrystalline a-Fe.
Fig. 44(a) shows the RF collapsed spectra as a function of RF ®eld intensity foran as quenched amorphous Fe73.5Nb4.5Cr5Cu1B16 alloy. The RF side-bands areseen clearly to grow with the RF ®eld amplitude. The side bands are associatedwith magnetostrictively induced modulation of the M1ssbauer g-radiation of 57Fe
atoms contained in the amorphous alloy.Kopcewicz et al. [163,164] have used the magnetic radio frequency collapse and
radio frequency sidebands to study microstructure and magnetic anisotropy inFe93ÿxÿyZr7BxCuy (x � 6, 8, 12; y � 0, 2) nanocrystalline alloys formed through
Fig. 44 (continued)
M.E. McHenry et al. / Progress in Materials Science 44 (1999) 291±433 379
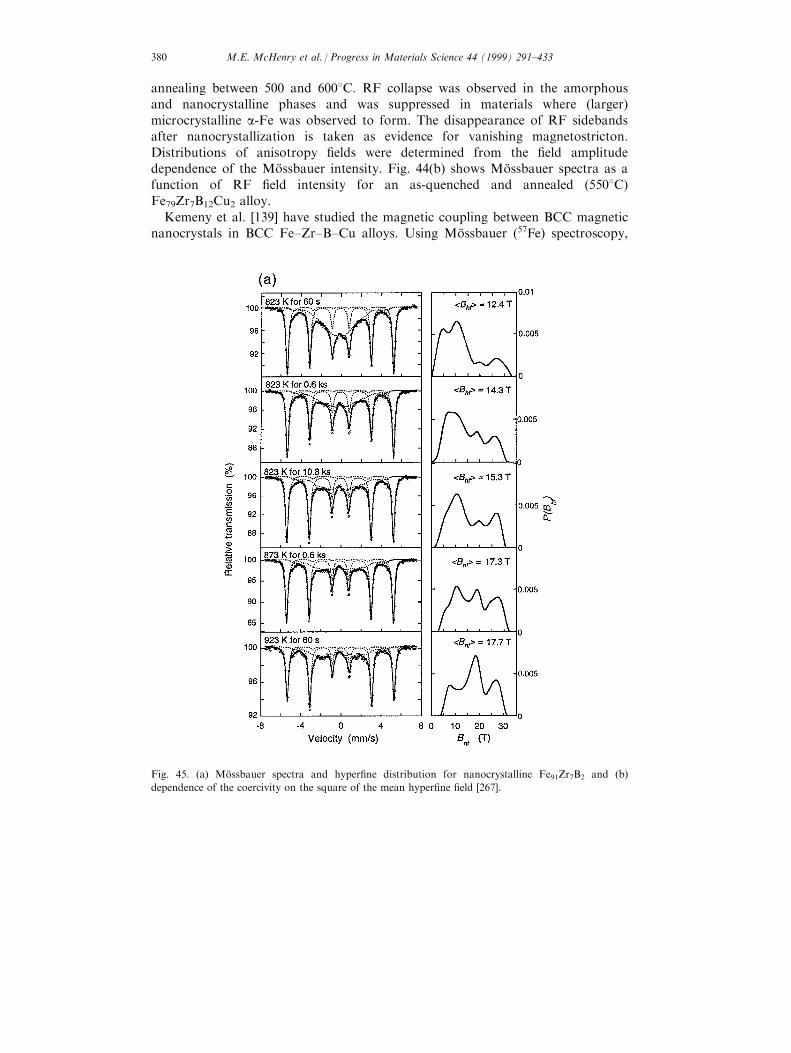
annealing between 500 and 6008C. RF collapse was observed in the amorphousand nanocrystalline phases and was suppressed in materials where (larger)microcrystalline a-Fe was observed to form. The disappearance of RF sidebandsafter nanocrystallization is taken as evidence for vanishing magnetostricton.Distributions of anisotropy ®elds were determined from the ®eld amplitudedependence of the MoÈ ssbauer intensity. Fig. 44(b) shows MoÈ ssbauer spectra as afunction of RF ®eld intensity for an as-quenched and annealed (5508C)Fe79Zr7B12Cu2 alloy.
Kemeny et al. [139] have studied the magnetic coupling between BCC magneticnanocrystals in BCC Fe±Zr±B±Cu alloys. Using MoÈ ssbauer (57Fe) spectroscopy,
Fig. 45. (a) MoÈ ssbauer spectra and hyper®ne distribution for nanocrystalline Fe91Zr7B2 and (b)
dependence of the coercivity on the square of the mean hyper®ne ®eld [267].
M.E. McHenry et al. / Progress in Materials Science 44 (1999) 291±433380
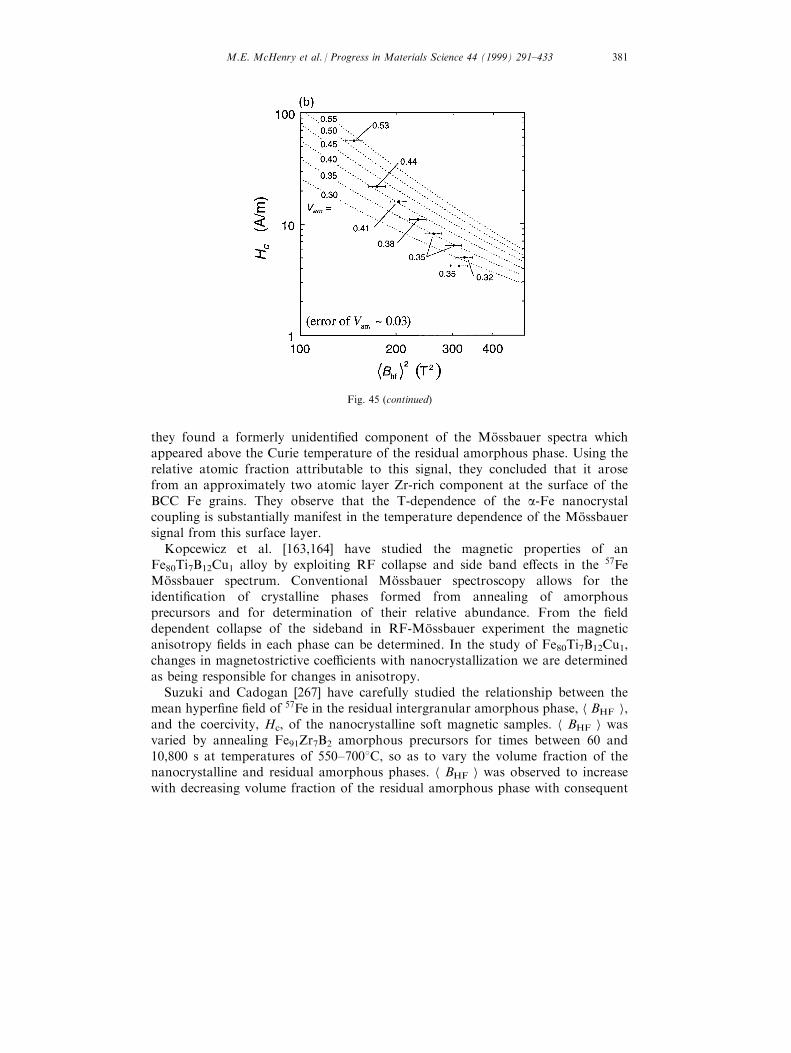
they found a formerly unidenti®ed component of the MoÈ ssbauer spectra whichappeared above the Curie temperature of the residual amorphous phase. Using therelative atomic fraction attributable to this signal, they concluded that it arosefrom an approximately two atomic layer Zr-rich component at the surface of theBCC Fe grains. They observe that the T-dependence of the a-Fe nanocrystalcoupling is substantially manifest in the temperature dependence of the MoÈ ssbauersignal from this surface layer.
Kopcewicz et al. [163,164] have studied the magnetic properties of anFe80Ti7B12Cu1 alloy by exploiting RF collapse and side band e�ects in the 57Fe
MoÈ ssbauer spectrum. Conventional MoÈ ssbauer spectroscopy allows for theidenti®cation of crystalline phases formed from annealing of amorphousprecursors and for determination of their relative abundance. From the ®elddependent collapse of the sideband in RF-MoÈ ssbauer experiment the magneticanisotropy ®elds in each phase can be determined. In the study of Fe80Ti7B12Cu1,changes in magnetostrictive coe�cients with nanocrystallization we are determinedas being responsible for changes in anisotropy.
Suzuki and Cadogan [267] have carefully studied the relationship between themean hyper®ne ®eld of 57Fe in the residual intergranular amorphous phase, h BHF i,and the coercivity, Hc, of the nanocrystalline soft magnetic samples. h BHF i wasvaried by annealing Fe91Zr7B2 amorphous precursors for times between 60 and10,800 s at temperatures of 550±7008C, so as to vary the volume fraction of thenanocrystalline and residual amorphous phases. h BHF i was observed to increasewith decreasing volume fraction of the residual amorphous phase with consequent
Fig. 45 (continued)
M.E. McHenry et al. / Progress in Materials Science 44 (1999) 291±433 381
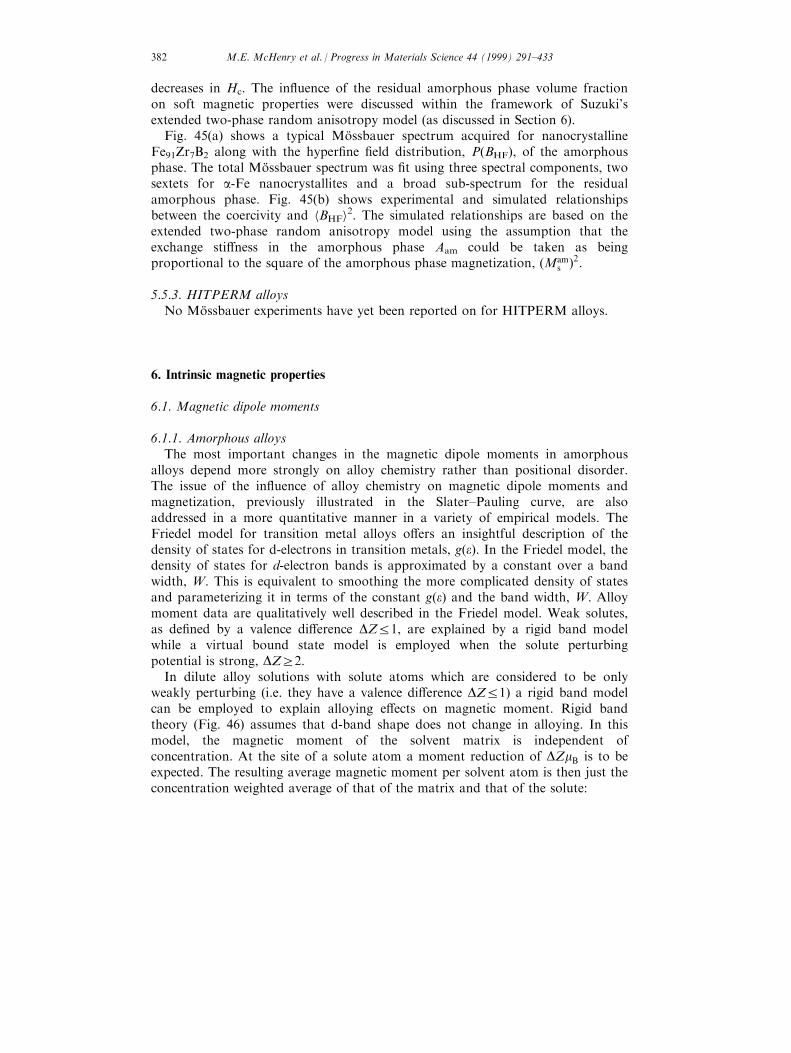
decreases in Hc. The in¯uence of the residual amorphous phase volume fractionon soft magnetic properties were discussed within the framework of Suzuki'sextended two-phase random anisotropy model (as discussed in Section 6).
Fig. 45(a) shows a typical MoÈ ssbauer spectrum acquired for nanocrystallineFe91Zr7B2 along with the hyper®ne ®eld distribution, P(BHF), of the amorphousphase. The total MoÈ ssbauer spectrum was ®t using three spectral components, twosextets for a-Fe nanocrystallites and a broad sub-spectrum for the residualamorphous phase. Fig. 45(b) shows experimental and simulated relationshipsbetween the coercivity and hBHFi2. The simulated relationships are based on theextended two-phase random anisotropy model using the assumption that theexchange sti�ness in the amorphous phase Aam could be taken as beingproportional to the square of the amorphous phase magnetization, �Mam
s �2.
5.5.3. HITPERM alloysNo MoÈ ssbauer experiments have yet been reported on for HITPERM alloys.
6. Intrinsic magnetic properties
6.1. Magnetic dipole moments
6.1.1. Amorphous alloysThe most important changes in the magnetic dipole moments in amorphous
alloys depend more strongly on alloy chemistry rather than positional disorder.The issue of the in¯uence of alloy chemistry on magnetic dipole moments andmagnetization, previously illustrated in the Slater±Pauling curve, are alsoaddressed in a more quantitative manner in a variety of empirical models. TheFriedel model for transition metal alloys o�ers an insightful description of thedensity of states for d-electrons in transition metals, g�e�. In the Friedel model, thedensity of states for d-electron bands is approximated by a constant over a bandwidth, W. This is equivalent to smoothing the more complicated density of statesand parameterizing it in terms of the constant g�e� and the band width, W. Alloymoment data are qualitatively well described in the Friedel model. Weak solutes,as de®ned by a valence di�erence DZR1, are explained by a rigid band modelwhile a virtual bound state model is employed when the solute perturbingpotential is strong, DZr2.
In dilute alloy solutions with solute atoms which are considered to be onlyweakly perturbing (i.e. they have a valence di�erence DZR1) a rigid band modelcan be employed to explain alloying e�ects on magnetic moment. Rigid bandtheory (Fig. 46) assumes that d-band shape does not change in alloying. In thismodel, the magnetic moment of the solvent matrix is independent ofconcentration. At the site of a solute atom a moment reduction of DZmB is to beexpected. The resulting average magnetic moment per solvent atom is then just theconcentration weighted average of that of the matrix and that of the solute:
M.E. McHenry et al. / Progress in Materials Science 44 (1999) 291±433382
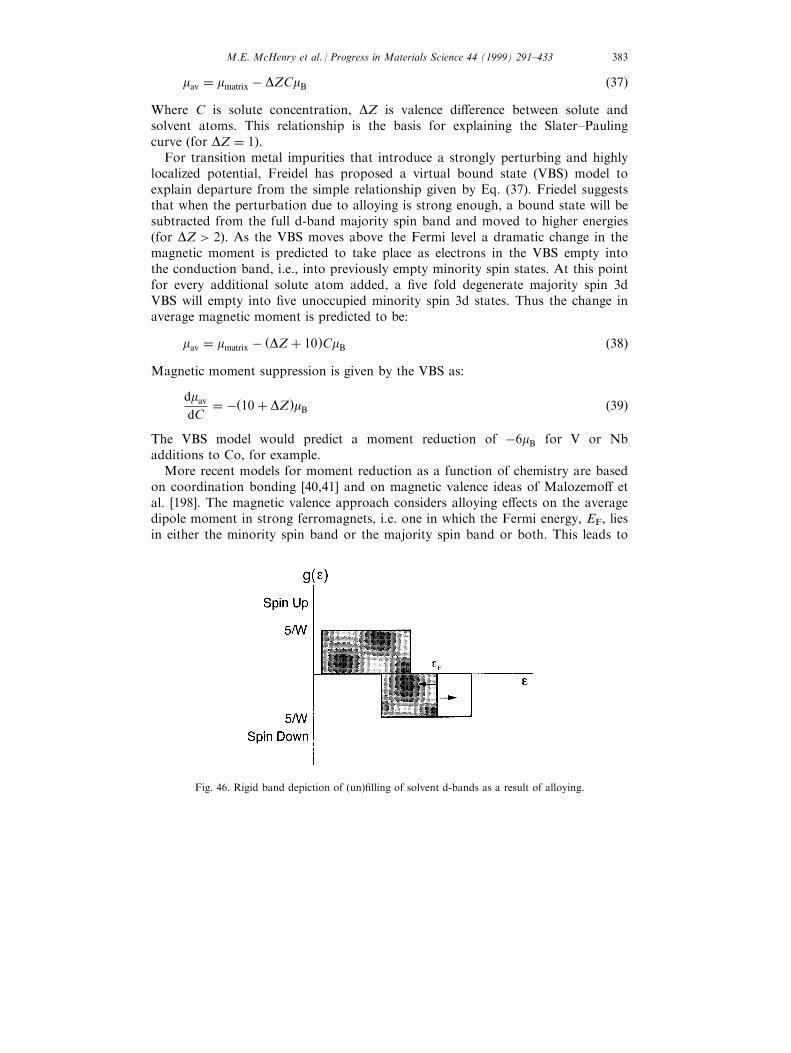
mav � mmatrix ÿ DZCmB �37�Where C is solute concentration, DZ is valence di�erence between solute andsolvent atoms. This relationship is the basis for explaining the Slater±Paulingcurve (for DZ � 1).
For transition metal impurities that introduce a strongly perturbing and highlylocalized potential, Freidel has proposed a virtual bound state (VBS) model toexplain departure from the simple relationship given by Eq. (37). Friedel suggeststhat when the perturbation due to alloying is strong enough, a bound state will besubtracted from the full d-band majority spin band and moved to higher energies(for DZ > 2). As the VBS moves above the Fermi level a dramatic change in themagnetic moment is predicted to take place as electrons in the VBS empty intothe conduction band, i.e., into previously empty minority spin states. At this pointfor every additional solute atom added, a ®ve fold degenerate majority spin 3dVBS will empty into ®ve unoccupied minority spin 3d states. Thus the change inaverage magnetic moment is predicted to be:
mav � mmatrix ÿ �DZ� 10�CmB �38�Magnetic moment suppression is given by the VBS as:
dmav
dC� ÿ�10� DZ�mB �39�
The VBS model would predict a moment reduction of ÿ6mB for V or Nbadditions to Co, for example.
More recent models for moment reduction as a function of chemistry are basedon coordination bonding [40,41] and on magnetic valence ideas of Malozemo� etal. [198]. The magnetic valence approach considers alloying e�ects on the averagedipole moment in strong ferromagnets, i.e. one in which the Fermi energy, EF, liesin either the minority spin band or the majority spin band or both. This leads to
Fig. 46. Rigid band depiction of (un)®lling of solvent d-bands as a result of alloying.
M.E. McHenry et al. / Progress in Materials Science 44 (1999) 291±433 383
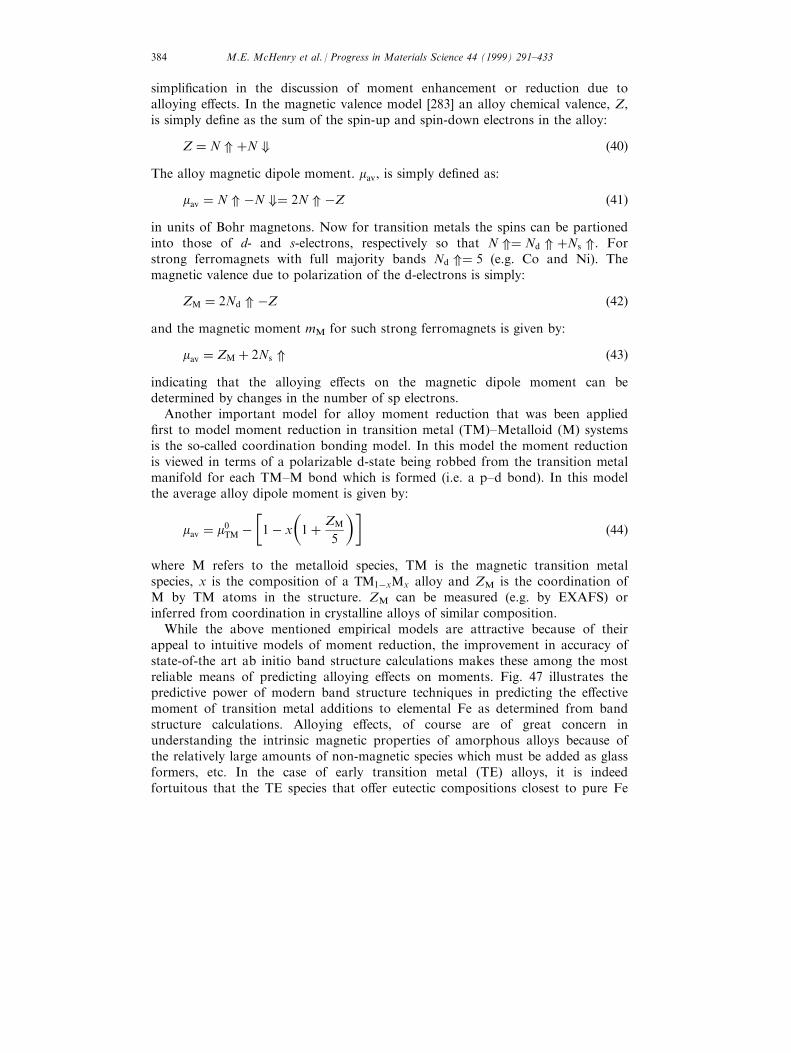
simpli®cation in the discussion of moment enhancement or reduction due toalloying e�ects. In the magnetic valence model [283] an alloy chemical valence, Z,is simply de®ne as the sum of the spin-up and spin-down electrons in the alloy:
Z � N * �N + �40�The alloy magnetic dipole moment. mav, is simply de®ned as:
mav � N * ÿN +� 2N * ÿZ �41�in units of Bohr magnetons. Now for transition metals the spins can be partionedinto those of d- and s-electrons, respectively so that N *� Nd * �Ns *. Forstrong ferromagnets with full majority bands Nd *� 5 (e.g. Co and Ni). Themagnetic valence due to polarization of the d-electrons is simply:
ZM � 2Nd * ÿZ �42�and the magnetic moment mM for such strong ferromagnets is given by:
mav � ZM � 2Ns * �43�indicating that the alloying e�ects on the magnetic dipole moment can bedetermined by changes in the number of sp electrons.
Another important model for alloy moment reduction that was been applied®rst to model moment reduction in transition metal (TM)±Metalloid (M) systemsis the so-called coordination bonding model. In this model the moment reductionis viewed in terms of a polarizable d-state being robbed from the transition metalmanifold for each TM±M bond which is formed (i.e. a p±d bond). In this modelthe average alloy dipole moment is given by:
mav � m0TM ÿ�1ÿ x
�1� ZM
5
���44�
where M refers to the metalloid species, TM is the magnetic transition metalspecies, x is the composition of a TM1ÿxMx alloy and ZM is the coordination ofM by TM atoms in the structure. ZM can be measured (e.g. by EXAFS) orinferred from coordination in crystalline alloys of similar composition.
While the above mentioned empirical models are attractive because of theirappeal to intuitive models of moment reduction, the improvement in accuracy ofstate-of-the art ab initio band structure calculations makes these among the mostreliable means of predicting alloying e�ects on moments. Fig. 47 illustrates thepredictive power of modern band structure techniques in predicting the e�ectivemoment of transition metal additions to elemental Fe as determined from bandstructure calculations. Alloying e�ects, of course are of great concern inunderstanding the intrinsic magnetic properties of amorphous alloys because ofthe relatively large amounts of non-magnetic species which must be added as glassformers, etc. In the case of early transition metal (TE) alloys, it is indeedfortuitous that the TE species that o�er eutectic compositions closest to pure Fe
M.E. McHenry et al. / Progress in Materials Science 44 (1999) 291±433384
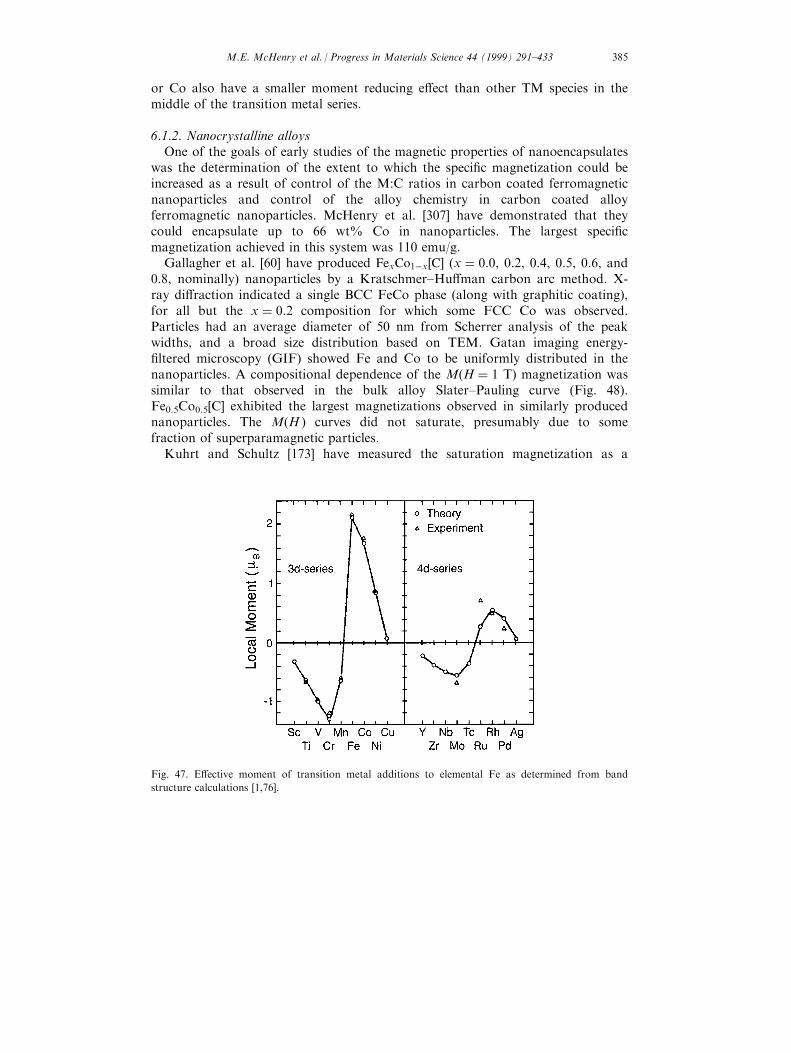
or Co also have a smaller moment reducing e�ect than other TM species in themiddle of the transition metal series.
6.1.2. Nanocrystalline alloysOne of the goals of early studies of the magnetic properties of nanoencapsulates
was the determination of the extent to which the speci®c magnetization could beincreased as a result of control of the M:C ratios in carbon coated ferromagneticnanoparticles and control of the alloy chemistry in carbon coated alloyferromagnetic nanoparticles. McHenry et al. [307] have demonstrated that theycould encapsulate up to 66 wt% Co in nanoparticles. The largest speci®cmagnetization achieved in this system was 110 emu/g.
Gallagher et al. [60] have produced FexCo1ÿx�C� (x � 0:0, 0.2, 0.4, 0.5, 0.6, and0.8, nominally) nanoparticles by a Kratschmer±Hu�man carbon arc method. X-ray di�raction indicated a single BCC FeCo phase (along with graphitic coating),for all but the x � 0:2 composition for which some FCC Co was observed.Particles had an average diameter of 50 nm from Scherrer analysis of the peakwidths, and a broad size distribution based on TEM. Gatan imaging energy-®ltered microscopy (GIF) showed Fe and Co to be uniformly distributed in thenanoparticles. A compositional dependence of the M(H � 1 T) magnetization wassimilar to that observed in the bulk alloy Slater±Pauling curve (Fig. 48).Fe0.5Co0.5[C] exhibited the largest magnetizations observed in similarly producednanoparticles. The M(H ) curves did not saturate, presumably due to somefraction of superparamagnetic particles.
Kuhrt and Schultz [173] have measured the saturation magnetization as a
Fig. 47. E�ective moment of transition metal additions to elemental Fe as determined from band
structure calculations [1,76].
M.E. McHenry et al. / Progress in Materials Science 44 (1999) 291±433 385
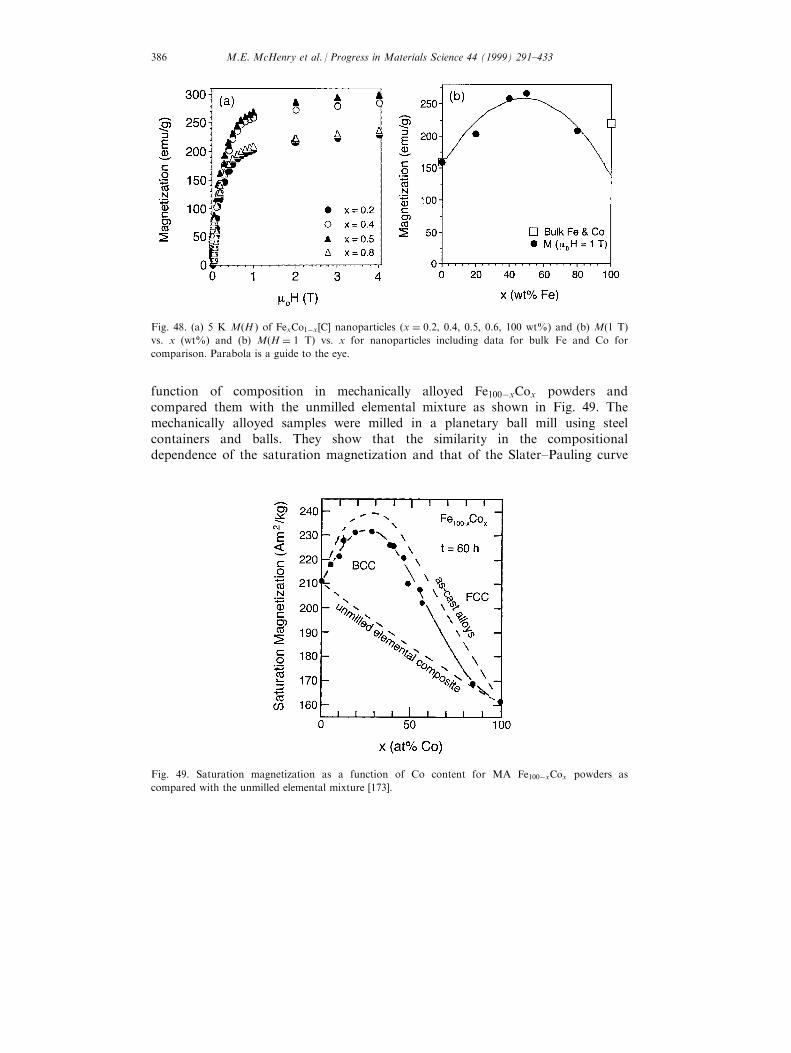
function of composition in mechanically alloyed Fe100ÿxCox powders andcompared them with the unmilled elemental mixture as shown in Fig. 49. Themechanically alloyed samples were milled in a planetary ball mill using steelcontainers and balls. They show that the similarity in the compositionaldependence of the saturation magnetization and that of the Slater±Pauling curve
Fig. 48. (a) 5 K M(H ) of FexCo1ÿx�C� nanoparticles (x � 0:2, 0.4, 0.5, 0.6, 100 wt%) and (b) M(1 T)
vs. x (wt%) and (b) M�H � 1 T) vs. x for nanoparticles including data for bulk Fe and Co for
comparison. Parabola is a guide to the eye.
Fig. 49. Saturation magnetization as a function of Co content for MA Fe100ÿxCox powders as
compared with the unmilled elemental mixture [173].
M.E. McHenry et al. / Progress in Materials Science 44 (1999) 291±433386
o�ers convincing evidence of alloy phase formation by mechanical alloying of theelemental powders. Their bulk magnetizations are observed to be several percentsmaller than those of bulk as-cast alloys and attributed to incomplete reaction andto small amounts of non-magnetic wear debris. The peak moment occurredbetween 20 and 30 at% Co, again in excellent agreement with the bulk Slater±Pauling curve.
Vojtanik et al. [278,279] have investigated the in¯uence of Ni substitution for Feon the intrinsic magnetic properties in FINEMET alloys.Fe73:5ÿxNixNb3Cu1Si13:5B9 (x � 0, 5, 10, 15, 20 and 25 at%) amorphous andnanocrystalline alloys were studied by X-ray di�raction, MoÈ ssbauer spectroscopyand thermomagnetic analysis. Small additions of Ni were shown to increase theCurie temperature and the room temperature saturation magnetization ofamorphous samples. Ni caused a suppression of the secondary crystallizationtemperature, Tx2. A nanocrystalline structure was observed after crystallizing thex � 0, 5, 10 and 15 alloys but not for the x � 20 and 25 at% alloys. The 5 at%Ni addition increases the room temperature Bs from 1.19 to 1.39 T and TC of theamorphous phase from 332 to 3378C. Both quantities decrease for higher Niconcentrations.
6.2. Magnetic exchange interactions and T-Dependent ferromagnetic response
6.2.1. Amorphous alloysBecause of large deviations in interatomic spacings in amorphous alloys as
compared with bulk crystalline materials amorphous alloys typically have reducedCurie temperatures (due to alloying with glass forming elements [231] as well asdistributed exchange interactions which alter the mean ®eld description of thetemperature dependence of the magnetization, M(T )). A mean ®eld theory for thetemperature dependence of the magnetization in amorphous alloys has beenproposed by Handrich and Kobe [80,152,153]. In this Handrich±Kobe theory wasproposed an expression for the reduced magnetization m�T � �M�T �=M (0 K)which consisted of a modi®ed Brillouin function where a single exchangeparameter was replaced by an exchange parameter re¯ecting the distribution ofnearest neighbor positions in the amorphous phase [136]. This reducedmagnetization is expressed as:
m�T� � 1
2
ÿBs
��1� dex �x�� Bs
��1ÿ dex �x�� �45�
where
x � 3S
S� 1
m
tand t � T
TC
�46�
are the arguments of a conventional (spin-only) Brillouin function Bs. Further theexchange ¯uctuation parameter [34] is de®ned:
M.E. McHenry et al. / Progress in Materials Science 44 (1999) 291±433 387
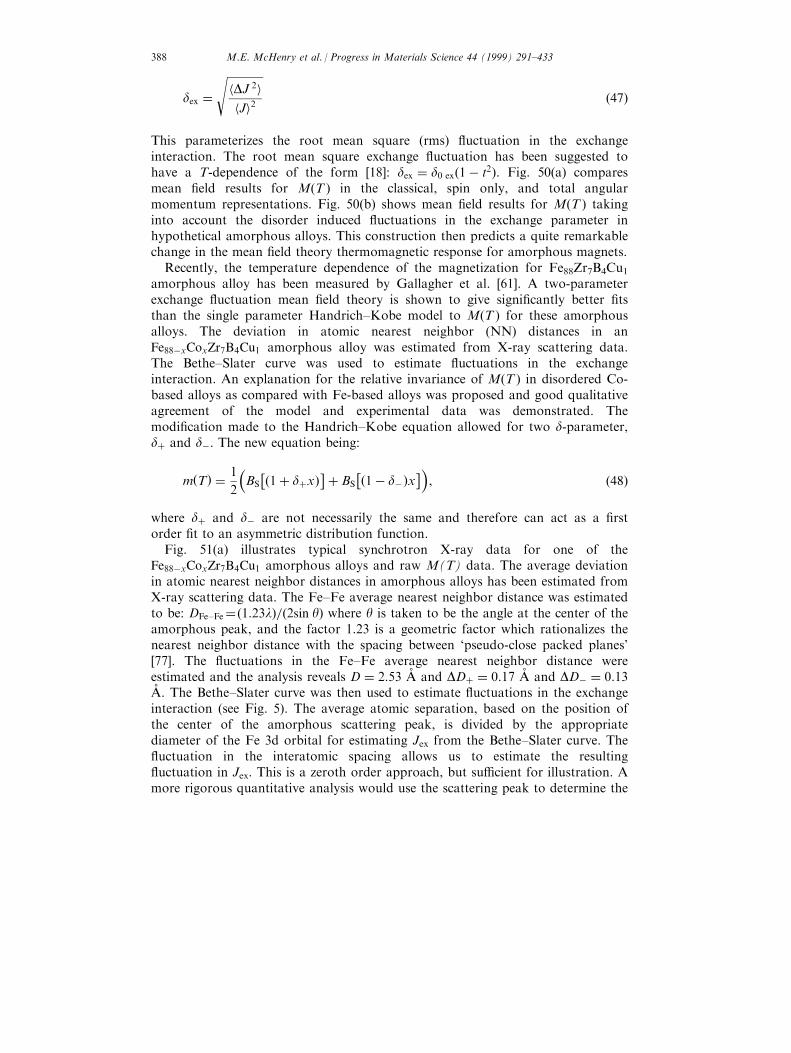
dex ��������������hDJ 2ihJi2
s�47�
This parameterizes the root mean square (rms) ¯uctuation in the exchangeinteraction. The root mean square exchange ¯uctuation has been suggested tohave a T-dependence of the form [18]: dex � d0 ex�1ÿ t2�. Fig. 50(a) comparesmean ®eld results for M(T ) in the classical, spin only, and total angularmomentum representations. Fig. 50(b) shows mean ®eld results for M(T ) takinginto account the disorder induced ¯uctuations in the exchange parameter inhypothetical amorphous alloys. This construction then predicts a quite remarkablechange in the mean ®eld theory thermomagnetic response for amorphous magnets.
Recently, the temperature dependence of the magnetization for Fe88Zr7B4Cu1amorphous alloy has been measured by Gallagher et al. [61]. A two-parameterexchange ¯uctuation mean ®eld theory is shown to give signi®cantly better ®tsthan the single parameter Handrich±Kobe model to M(T ) for these amorphousalloys. The deviation in atomic nearest neighbor (NN) distances in anFe88ÿxCoxZr7B4Cu1 amorphous alloy was estimated from X-ray scattering data.The Bethe±Slater curve was used to estimate ¯uctuations in the exchangeinteraction. An explanation for the relative invariance of M(T ) in disordered Co-based alloys as compared with Fe-based alloys was proposed and good qualitativeagreement of the model and experimental data was demonstrated. Themodi®cation made to the Handrich±Kobe equation allowed for two d-parameter,d� and dÿ. The new equation being:
m�T� � 1
2
�BS
��1� d�x��� BS
��1ÿ dÿ�x��, �48�
where d� and dÿ are not necessarily the same and therefore can act as a ®rstorder ®t to an asymmetric distribution function.
Fig. 51(a) illustrates typical synchrotron X-ray data for one of theFe88ÿxCoxZr7B4Cu1 amorphous alloys and raw M(T) data. The average deviationin atomic nearest neighbor distances in amorphous alloys has been estimated fromX-ray scattering data. The Fe±Fe average nearest neighbor distance was estimatedto be: DFe±Fe��1:23l�=�2sin y� where y is taken to be the angle at the center of theamorphous peak, and the factor 1.23 is a geometric factor which rationalizes thenearest neighbor distance with the spacing between `pseudo-close packed planes'[77]. The ¯uctuations in the Fe±Fe average nearest neighbor distance wereestimated and the analysis reveals D � 2:53 AÊ and DD� � 0:17 AÊ and DDÿ � 0:13AÊ . The Bethe±Slater curve was then used to estimate ¯uctuations in the exchangeinteraction (see Fig. 5). The average atomic separation, based on the position ofthe center of the amorphous scattering peak, is divided by the appropriatediameter of the Fe 3d orbital for estimating Jex from the Bethe±Slater curve. The¯uctuation in the interatomic spacing allows us to estimate the resulting¯uctuation in Jex. This is a zeroth order approach, but su�cient for illustration. Amore rigorous quantitative analysis would use the scattering peak to determine the
M.E. McHenry et al. / Progress in Materials Science 44 (1999) 291±433388
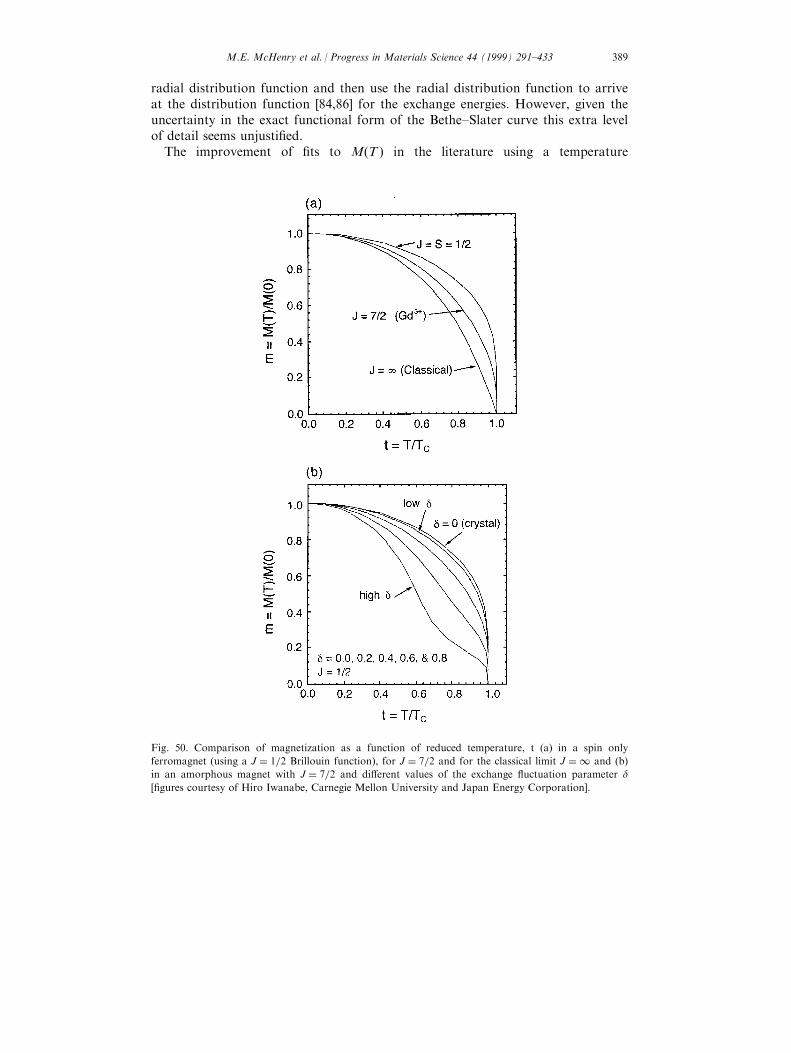
radial distribution function and then use the radial distribution function to arriveat the distribution function [84,86] for the exchange energies. However, given theuncertainty in the exact functional form of the Bethe±Slater curve this extra levelof detail seems unjusti®ed.
The improvement of ®ts to M(T ) in the literature using a temperature
Fig. 50. Comparison of magnetization as a function of reduced temperature, t (a) in a spin only
ferromagnet (using a J � 1=2 Brillouin function), for J � 7=2 and for the classical limit J � 1 and (b)
in an amorphous magnet with J � 7=2 and di�erent values of the exchange ¯uctuation parameter d[®gures courtesy of Hiro Iwanabe, Carnegie Mellon University and Japan Energy Corporation].
M.E. McHenry et al. / Progress in Materials Science 44 (1999) 291±433 389
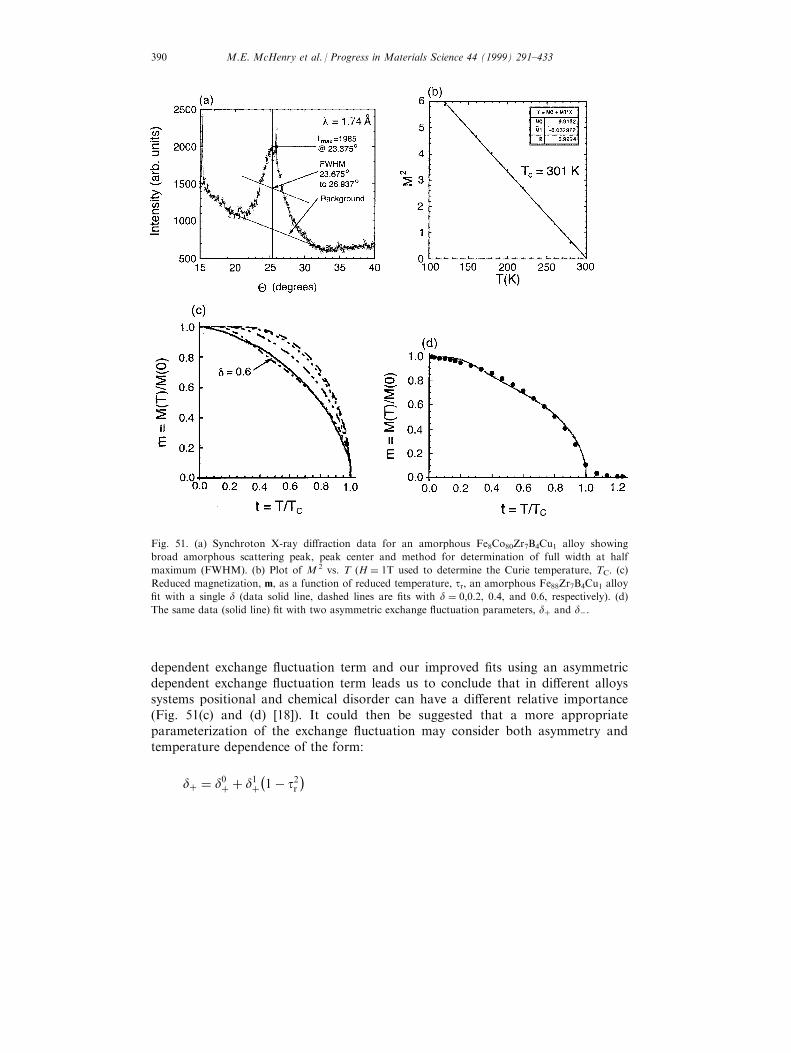
dependent exchange ¯uctuation term and our improved ®ts using an asymmetricdependent exchange ¯uctuation term leads us to conclude that in di�erent alloyssystems positional and chemical disorder can have a di�erent relative importance(Fig. 51(c) and (d) [18]). It could then be suggested that a more appropriateparameterization of the exchange ¯uctuation may consider both asymmetry andtemperature dependence of the form:
d� � d0� � d1�ÿ1ÿ t2r
�
Fig. 51. (a) Synchroton X-ray di�raction data for an amorphous Fe8Co80Zr7B4Cu1 alloy showing
broad amorphous scattering peak, peak center and method for determination of full width at half
maximum (FWHM). (b) Plot of M 2 vs. T (H � 1T used to determine the Curie temperature, TC. (c)
Reduced magnetization, m, as a function of reduced temperature, tr, an amorphous Fe88Zr7B4Cu1 alloy
®t with a single d (data solid line, dashed lines are ®ts with d � 0,0:2, 0.4, and 0.6, respectively). (d)
The same data (solid line) ®t with two asymmetric exchange ¯uctuation parameters, d� and dÿ.
M.E. McHenry et al. / Progress in Materials Science 44 (1999) 291±433390
dÿ � d0ÿ � d1ÿÿ1ÿ t2r
�, �49�
where the ®rst term re¯ects chemical and positional disorder and the secondthermal disorder. This hypothesis remains to be tested on a variety of amorphousalloys. A more rigorous quantitative analysis would use the scattering peak todetermine the radial distribution function and then use the radial distributionfunction to arrive at the distribution function for the exchange energies. A morequantative analysis of the low temperature magnetization in amorphous Fe-basedalloys, based on spin-wave theory, has been reported by Hasegawa [84]. Theexchange interactions in amorphous alloys have been determined to be quiteshort-range so that an analysis of using the radial distribution function should bepossible [20,21,85].
6.2.2. Nanocrystalline alloysIn general, the mean ®eld theory used to describe Curie temperatures for
nanoparticles is not thought to strongly deviate from that of the bulk materials.This may not be the case in very small nanoparticles where the fraction of surfaceatomic sites is large. Here the reduced coordination of surface atoms should infact alter the Curie temperature. For most observations in the literature, however,the TC does not deviate strongly from that of the bulk materials. An example ofM(T ) for C-arc produced nanocrystalline Ni is shown in Fig. 52. The TC of3608C, for Ni[C] nanocrystals is in excellent agreement with that of bulk Ni [202].M(T ) for Fe nanoencapsulates has also been reported by Hihara et al. [109].Here, M(T ) is complicated by the existence of iron carbides (notably cementite,Fe3C) and small amounts typically a very small amount of the g-phase. The g-phase is non-magnetic and the a-phase and Fe3C phases have Curie temperaturesof 1040 K and 0480 K, respectively. Host et al. [119] have inferred a TC of 1366K for Co[C] nanoparticles, from ®ts of M(T ) data, in good agreement with the1388 K value for bulk Co.
It is noted that in nanocrystalline materials with two phase microstructures theCurie temperature of the nanocrystalline phase and that of the intergranular phaseare both important parameters in describing the magnetic response. Theintergranular phase which is typically richer in non-magnetic species can have asuppressed magnetic order parameter and lower Curie of g-Fe. It is typical for a-Fe to be the prominent phase, along with second phase carbides and temperaturethan the nanocrystals. This is especially important in describing the temperaturedependence of a variety of extrinsic magnetic properties as will be discussed inSection 7.
Yoshizawa [290,291] original work on FINEMET alloys reported Bs values of1.0±1.2 T, which increased with respect to the parent amorphous phase. Thisincrease in induction can be understood in terms of the segregation of momentsuppressing early transition metal (e.g. Nb) and some Si to the grain boundariesduring the primary crystallization of the a-FeSi phase. This preferentialsegregation of non-magnetic species to the grain boundary phase can also havedeleterious e�ects if not optimized. As discussed below the nature of the coupling
M.E. McHenry et al. / Progress in Materials Science 44 (1999) 291±433 391
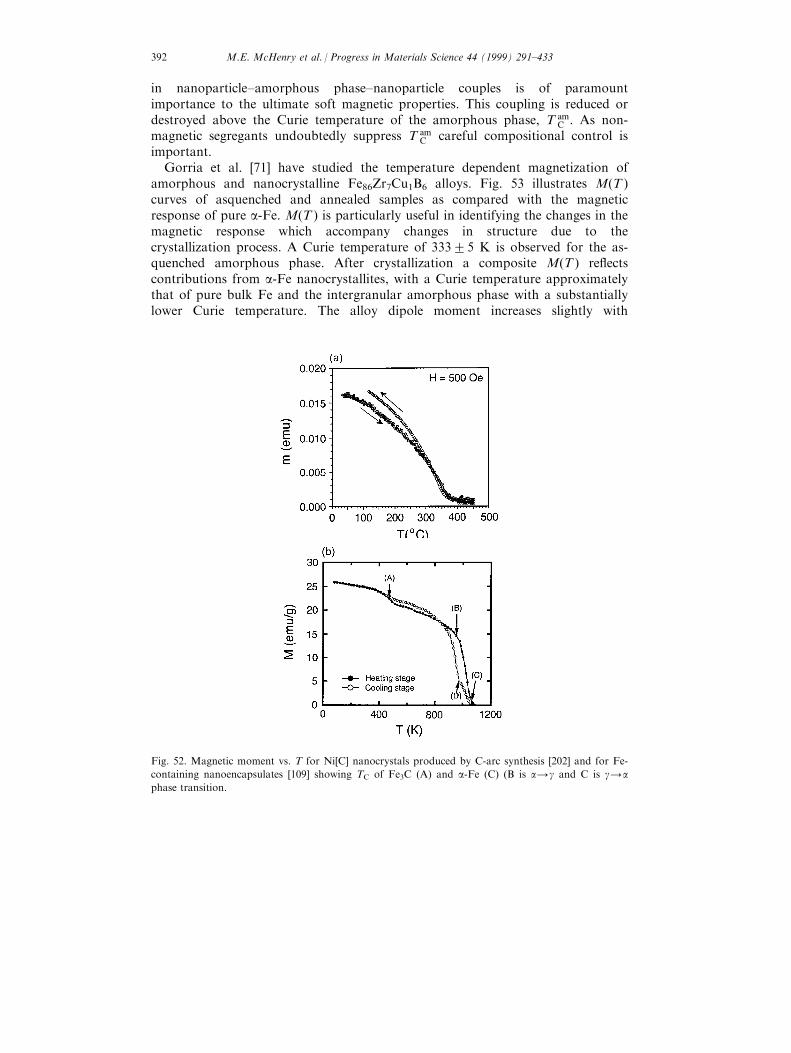
in nanoparticle±amorphous phase±nanoparticle couples is of paramountimportance to the ultimate soft magnetic properties. This coupling is reduced ordestroyed above the Curie temperature of the amorphous phase, T am
C . As non-magnetic segregants undoubtedly suppress T am
C careful compositional control isimportant.
Gorria et al. [71] have studied the temperature dependent magnetization ofamorphous and nanocrystalline Fe86Zr7Cu1B6 alloys. Fig. 53 illustrates M(T )curves of asquenched and annealed samples as compared with the magneticresponse of pure a-Fe. M(T ) is particularly useful in identifying the changes in themagnetic response which accompany changes in structure due to thecrystallization process. A Curie temperature of 33325 K is observed for the as-quenched amorphous phase. After crystallization a composite M(T ) re¯ectscontributions from a-Fe nanocrystallites, with a Curie temperature approximatelythat of pure bulk Fe and the intergranular amorphous phase with a substantiallylower Curie temperature. The alloy dipole moment increases slightly with
Fig. 52. Magnetic moment vs. T for Ni[C] nanocrystals produced by C-arc synthesis [202] and for Fe-
containing nanoencapsulates [109] showing TC of Fe3C (A) and a-Fe (C) (B is a4g and C is g4aphase transition.
M.E. McHenry et al. / Progress in Materials Science 44 (1999) 291±433392
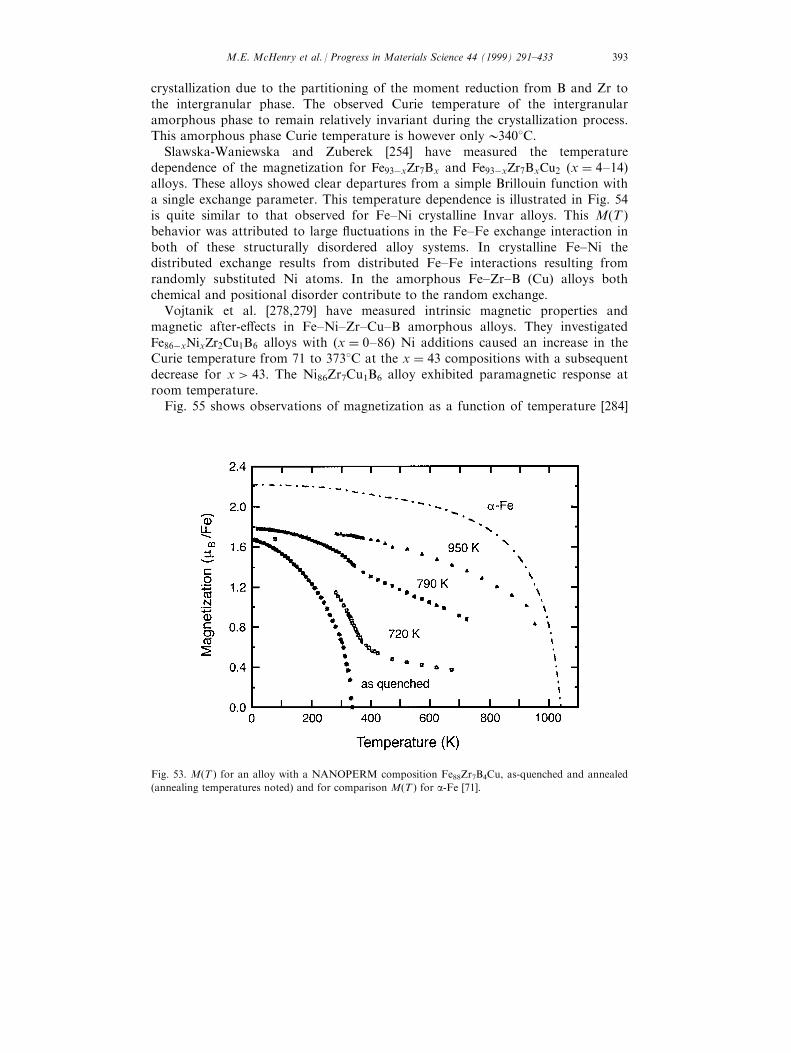
crystallization due to the partitioning of the moment reduction from B and Zr tothe intergranular phase. The observed Curie temperature of the intergranularamorphous phase to remain relatively invariant during the crystallization process.This amorphous phase Curie temperature is however only03408C.
Slawska-Waniewska and Zuberek [254] have measured the temperaturedependence of the magnetization for Fe93ÿxZr7Bx and Fe93ÿxZr7BxCu2 (x � 4±14)alloys. These alloys showed clear departures from a simple Brillouin function witha single exchange parameter. This temperature dependence is illustrated in Fig. 54is quite similar to that observed for Fe±Ni crystalline Invar alloys. This M(T )behavior was attributed to large ¯uctuations in the Fe±Fe exchange interaction inboth of these structurally disordered alloy systems. In crystalline Fe±Ni thedistributed exchange results from distributed Fe±Fe interactions resulting fromrandomly substituted Ni atoms. In the amorphous Fe±Zr±B (Cu) alloys bothchemical and positional disorder contribute to the random exchange.
Vojtanik et al. [278,279] have measured intrinsic magnetic properties andmagnetic after-e�ects in Fe±Ni±Zr±Cu±B amorphous alloys. They investigatedFe86ÿxNixZr2Cu1B6 alloys with (x � 0±86) Ni additions caused an increase in theCurie temperature from 71 to 3738C at the x � 43 compositions with a subsequentdecrease for x > 43. The Ni86Zr7Cu1B6 alloy exhibited paramagnetic response atroom temperature.
Fig. 55 shows observations of magnetization as a function of temperature [284]
Fig. 53. M(T ) for an alloy with a NANOPERM composition Fe88Zr7B4Cu, as-quenched and annealed
(annealing temperatures noted) and for comparison M(T ) for a-Fe [71].
M.E. McHenry et al. / Progress in Materials Science 44 (1999) 291±433 393
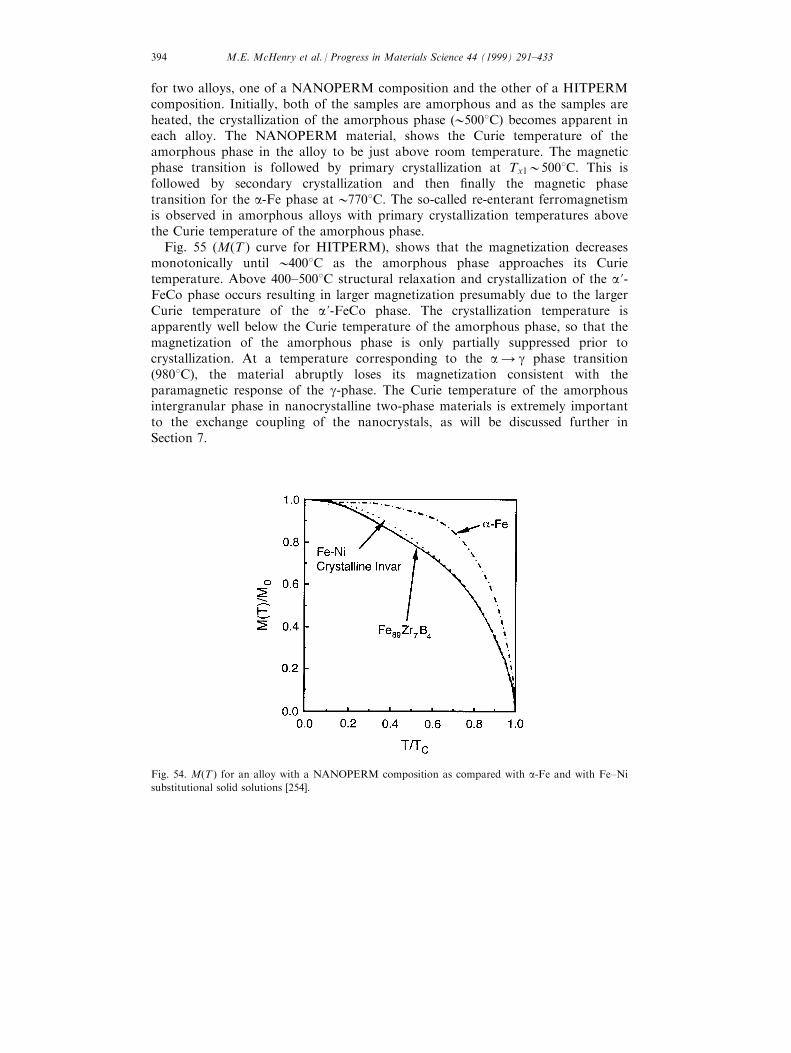
for two alloys, one of a NANOPERM composition and the other of a HITPERMcomposition. Initially, both of the samples are amorphous and as the samples areheated, the crystallization of the amorphous phase (05008C) becomes apparent ineach alloy. The NANOPERM material, shows the Curie temperature of theamorphous phase in the alloy to be just above room temperature. The magneticphase transition is followed by primary crystallization at Tx105008C. This isfollowed by secondary crystallization and then ®nally the magnetic phasetransition for the a-Fe phase at 07708C. The so-called re-enterant ferromagnetismis observed in amorphous alloys with primary crystallization temperatures abovethe Curie temperature of the amorphous phase.
Fig. 55 (M(T ) curve for HITPERM), shows that the magnetization decreasesmonotonically until 04008C as the amorphous phase approaches its Curietemperature. Above 400±5008C structural relaxation and crystallization of the a'-FeCo phase occurs resulting in larger magnetization presumably due to the largerCurie temperature of the a'-FeCo phase. The crystallization temperature isapparently well below the Curie temperature of the amorphous phase, so that themagnetization of the amorphous phase is only partially suppressed prior tocrystallization. At a temperature corresponding to the a 4 g phase transition(9808C), the material abruptly loses its magnetization consistent with theparamagnetic response of the g-phase. The Curie temperature of the amorphousintergranular phase in nanocrystalline two-phase materials is extremely importantto the exchange coupling of the nanocrystals, as will be discussed further inSection 7.
Fig. 54. M(T ) for an alloy with a NANOPERM composition as compared with a-Fe and with Fe±Ni
substitutional solid solutions [254].
M.E. McHenry et al. / Progress in Materials Science 44 (1999) 291±433394
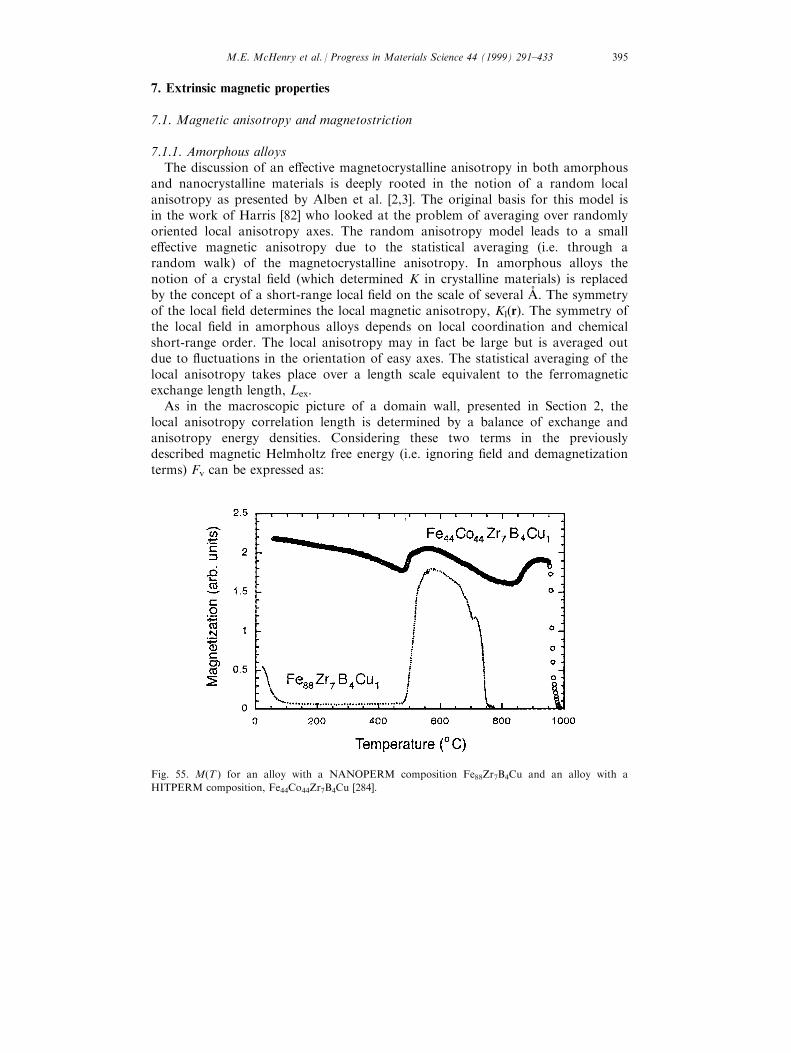
7. Extrinsic magnetic properties
7.1. Magnetic anisotropy and magnetostriction
7.1.1. Amorphous alloysThe discussion of an e�ective magnetocrystalline anisotropy in both amorphous
and nanocrystalline materials is deeply rooted in the notion of a random localanisotropy as presented by Alben et al. [2,3]. The original basis for this model isin the work of Harris [82] who looked at the problem of averaging over randomlyoriented local anisotropy axes. The random anisotropy model leads to a smalle�ective magnetic anisotropy due to the statistical averaging (i.e. through arandom walk) of the magnetocrystalline anisotropy. In amorphous alloys thenotion of a crystal ®eld (which determined K in crystalline materials) is replacedby the concept of a short-range local ®eld on the scale of several AÊ . The symmetryof the local ®eld determines the local magnetic anisotropy, Kl(r). The symmetry ofthe local ®eld in amorphous alloys depends on local coordination and chemicalshort-range order. The local anisotropy may in fact be large but is averaged outdue to ¯uctuations in the orientation of easy axes. The statistical averaging of thelocal anisotropy takes place over a length scale equivalent to the ferromagneticexchange length length, Lex.
As in the macroscopic picture of a domain wall, presented in Section 2, thelocal anisotropy correlation length is determined by a balance of exchange andanisotropy energy densities. Considering these two terms in the previouslydescribed magnetic Helmholtz free energy (i.e. ignoring ®eld and demagnetizationterms) Fv can be expressed as:
Fig. 55. M(T ) for an alloy with a NANOPERM composition Fe88Zr7B4Cu and an alloy with a
HITPERM composition, Fe44Co44Zr7B4Cu [284].
M.E. McHenry et al. / Progress in Materials Science 44 (1999) 291±433 395
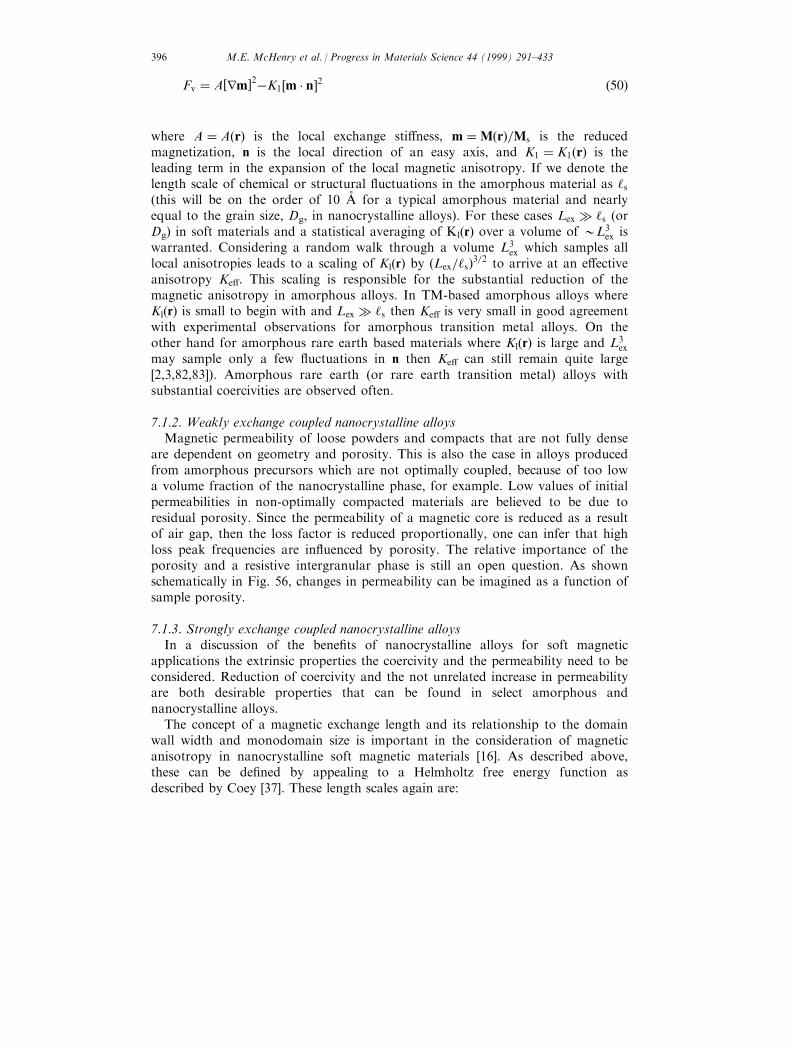
Fv � A�rm�2ÿK1�m � n�2 �50�
where A � A�r� is the local exchange sti�ness, m �M�r�=Ms is the reducedmagnetization, n is the local direction of an easy axis, and K1 � K1�r� is theleading term in the expansion of the local magnetic anisotropy. If we denote thelength scale of chemical or structural ¯uctuations in the amorphous material as `s
(this will be on the order of 10 AÊ for a typical amorphous material and nearlyequal to the grain size, Dg, in nanocrystalline alloys). For these cases Lex � `s (orDg) in soft materials and a statistical averaging of Kl(r) over a volume of 0L3
ex iswarranted. Considering a random walk through a volume L3
ex which samples alllocal anisotropies leads to a scaling of Kl(r) by �Lex=`s�3=2 to arrive at an e�ectiveanisotropy Ke�. This scaling is responsible for the substantial reduction of themagnetic anisotropy in amorphous alloys. In TM-based amorphous alloys whereKl(r) is small to begin with and Lex � `s then Ke� is very small in good agreementwith experimental observations for amorphous transition metal alloys. On theother hand for amorphous rare earth based materials where Kl(r) is large and L3
ex
may sample only a few ¯uctuations in n then Ke� can still remain quite large[2,3,82,83]). Amorphous rare earth (or rare earth transition metal) alloys withsubstantial coercivities are observed often.
7.1.2. Weakly exchange coupled nanocrystalline alloysMagnetic permeability of loose powders and compacts that are not fully dense
are dependent on geometry and porosity. This is also the case in alloys producedfrom amorphous precursors which are not optimally coupled, because of too lowa volume fraction of the nanocrystalline phase, for example. Low values of initialpermeabilities in non-optimally compacted materials are believed to be due toresidual porosity. Since the permeability of a magnetic core is reduced as a resultof air gap, then the loss factor is reduced proportionally, one can infer that highloss peak frequencies are in¯uenced by porosity. The relative importance of theporosity and a resistive intergranular phase is still an open question. As shownschematically in Fig. 56, changes in permeability can be imagined as a function ofsample porosity.
7.1.3. Strongly exchange coupled nanocrystalline alloysIn a discussion of the bene®ts of nanocrystalline alloys for soft magnetic
applications the extrinsic properties the coercivity and the permeability need to beconsidered. Reduction of coercivity and the not unrelated increase in permeabilityare both desirable properties that can be found in select amorphous andnanocrystalline alloys.
The concept of a magnetic exchange length and its relationship to the domainwall width and monodomain size is important in the consideration of magneticanisotropy in nanocrystalline soft magnetic materials [16]. As described above,these can be de®ned by appealing to a Helmholtz free energy function asdescribed by Coey [37]. These length scales again are:
M.E. McHenry et al. / Progress in Materials Science 44 (1999) 291±433396
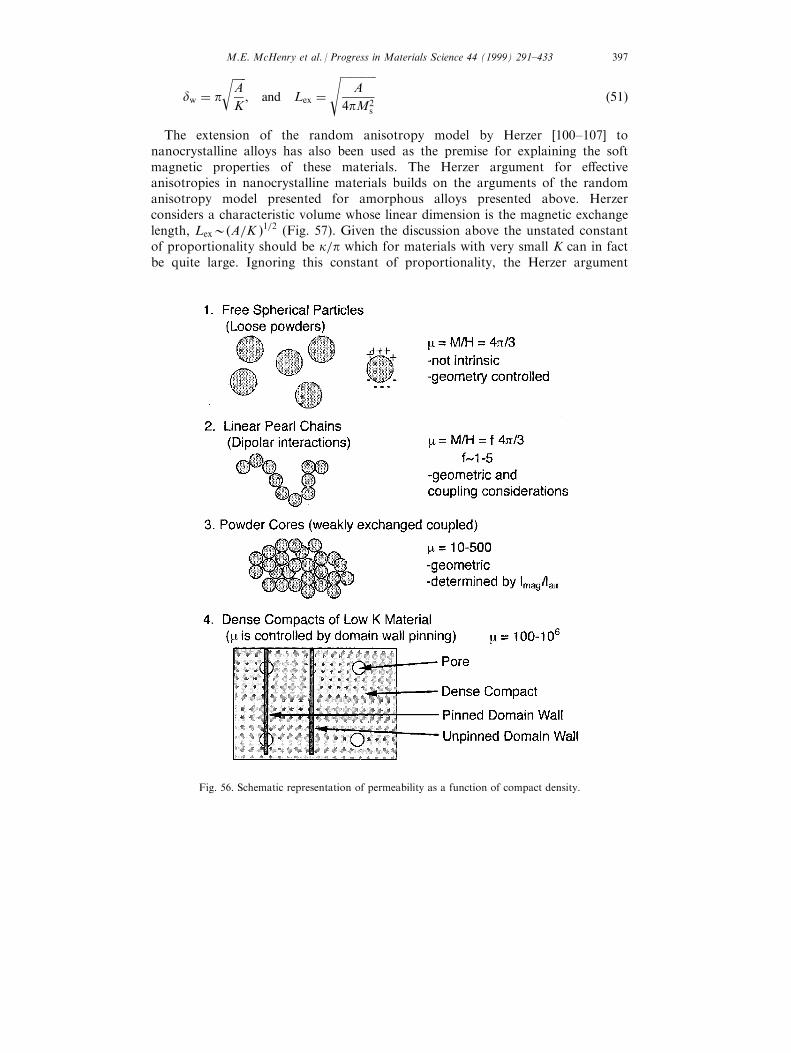
dw � p
�����A
K
r, and Lex �
�������������A
4pM2s
s�51�
The extension of the random anisotropy model by Herzer [100±107] tonanocrystalline alloys has also been used as the premise for explaining the softmagnetic properties of these materials. The Herzer argument for e�ectiveanisotropies in nanocrystalline materials builds on the arguments of the randomanisotropy model presented for amorphous alloys presented above. Herzerconsiders a characteristic volume whose linear dimension is the magnetic exchangelength, Lex0�A=K �1=2 (Fig. 57). Given the discussion above the unstated constantof proportionality should be k=p which for materials with very small K can in factbe quite large. Ignoring this constant of proportionality, the Herzer argument
Fig. 56. Schematic representation of permeability as a function of compact density.
M.E. McHenry et al. / Progress in Materials Science 44 (1999) 291±433 397
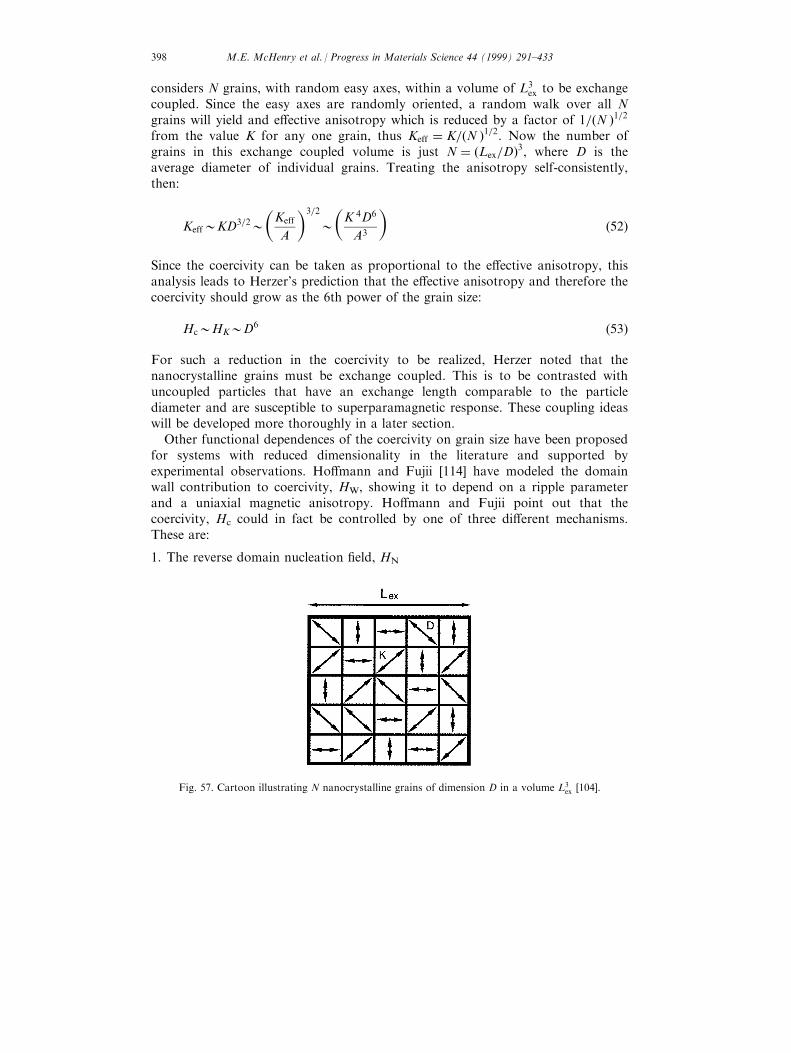
considers N grains, with random easy axes, within a volume of L3ex to be exchange
coupled. Since the easy axes are randomly oriented, a random walk over all Ngrains will yield and e�ective anisotropy which is reduced by a factor of 1=�N �1=2from the value K for any one grain, thus Keff � K=�N �1=2. Now the number ofgrains in this exchange coupled volume is just N � �Lex=D�3, where D is theaverage diameter of individual grains. Treating the anisotropy self-consistently,then:
Keff0KD3=20�Keff
A
�3=2
0�K 4D6
A3
��52�
Since the coercivity can be taken as proportional to the e�ective anisotropy, thisanalysis leads to Herzer's prediction that the e�ective anisotropy and therefore thecoercivity should grow as the 6th power of the grain size:
Hc0HK0D6 �53�
For such a reduction in the coercivity to be realized, Herzer noted that thenanocrystalline grains must be exchange coupled. This is to be contrasted withuncoupled particles that have an exchange length comparable to the particlediameter and are susceptible to superparamagnetic response. These coupling ideaswill be developed more thoroughly in a later section.
Other functional dependences of the coercivity on grain size have been proposedfor systems with reduced dimensionality in the literature and supported byexperimental observations. Ho�mann and Fujii [114] have modeled the domainwall contribution to coercivity, HW, showing it to depend on a ripple parameterand a uniaxial magnetic anisotropy. Ho�mann and Fujii point out that thecoercivity, Hc could in fact be controlled by one of three di�erent mechanisms.These are:
1. The reverse domain nucleation ®eld, HN
Fig. 57. Cartoon illustrating N nanocrystalline grains of dimension D in a volume L3ex [104].
M.E. McHenry et al. / Progress in Materials Science 44 (1999) 291±433398
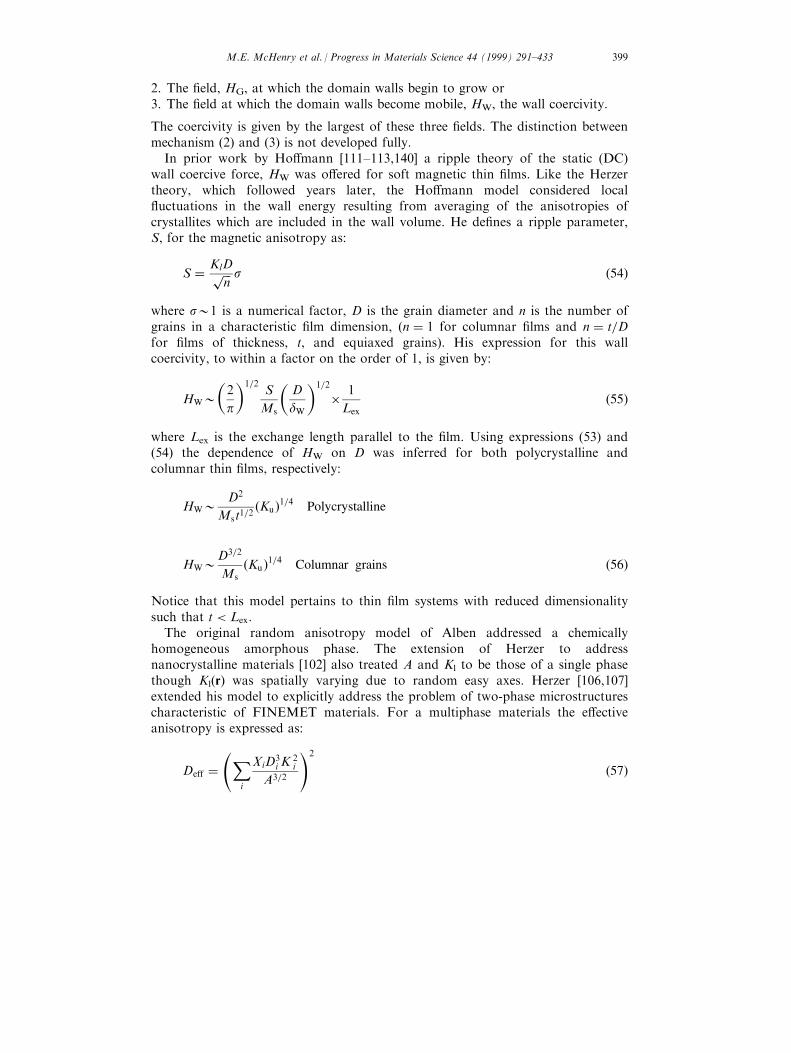
2. The ®eld, HG, at which the domain walls begin to grow or3. The ®eld at which the domain walls become mobile, HW, the wall coercivity.
The coercivity is given by the largest of these three ®elds. The distinction betweenmechanism (2) and (3) is not developed fully.
In prior work by Ho�mann [111±113,140] a ripple theory of the static (DC)wall coercive force, HW was o�ered for soft magnetic thin ®lms. Like the Herzertheory, which followed years later, the Ho�mann model considered local¯uctuations in the wall energy resulting from averaging of the anisotropies ofcrystallites which are included in the wall volume. He de®nes a ripple parameter,S, for the magnetic anisotropy as:
S � KlD���np s �54�
where s01 is a numerical factor, D is the grain diameter and n is the number ofgrains in a characteristic ®lm dimension, (n � 1 for columnar ®lms and n � t=Dfor ®lms of thickness, t, and equiaxed grains). His expression for this wallcoercivity, to within a factor on the order of 1, is given by:
HW0�2
p
�1=2S
Ms
�D
dW
�1=2
� 1
Lex
�55�
where Lex is the exchange length parallel to the ®lm. Using expressions (53) and(54) the dependence of HW on D was inferred for both polycrystalline andcolumnar thin ®lms, respectively:
HW0 D2
Mst1=2�Ku�1=4 Polycrystalline
HW0D3=2
Ms
�Ku�1=4 Columnar grains �56�
Notice that this model pertains to thin ®lm systems with reduced dimensionalitysuch that t < Lex.
The original random anisotropy model of Alben addressed a chemicallyhomogeneous amorphous phase. The extension of Herzer to addressnanocrystalline materials [102] also treated A and Kl to be those of a single phasethough Kl(r) was spatially varying due to random easy axes. Herzer [106,107]extended his model to explicitly address the problem of two-phase microstructurescharacteristic of FINEMET materials. For a multiphase materials the e�ectiveanisotropy is expressed as:
Deff � X
i
XiD3i K
2i
A3=2
!2
�57�
M.E. McHenry et al. / Progress in Materials Science 44 (1999) 291±433 399
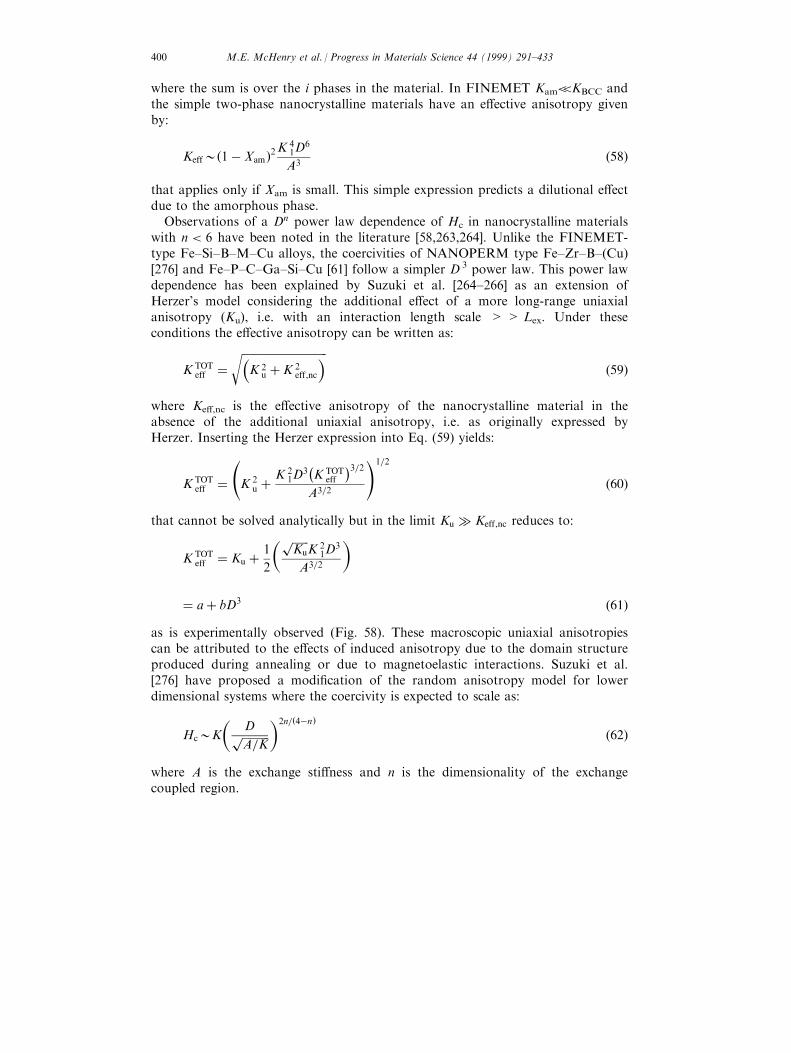
where the sum is over the i phases in the material. In FINEMET Kam<<KBCC andthe simple two-phase nanocrystalline materials have an e�ective anisotropy givenby:
Keff0�1ÿ Xam�2K41D
6
A3�58�
that applies only if Xam is small. This simple expression predicts a dilutional e�ectdue to the amorphous phase.
Observations of a Dn power law dependence of Hc in nanocrystalline materialswith n < 6 have been noted in the literature [58,263,264]. Unlike the FINEMET-type Fe±Si±B±M±Cu alloys, the coercivities of NANOPERM type Fe±Zr±B±(Cu)[276] and Fe±P±C±Ga±Si±Cu [61] follow a simpler D 3 power law. This power lawdependence has been explained by Suzuki et al. [264±266] as an extension ofHerzer's model considering the additional e�ect of a more long-range uniaxialanisotropy (Ku), i.e. with an interaction length scale > > Lex. Under theseconditions the e�ective anisotropy can be written as:
K TOTeff �
��������������������������������K 2
u � K 2eff,nc
�r�59�
where Ke�,nc is the e�ective anisotropy of the nanocrystalline material in theabsence of the additional uniaxial anisotropy, i.e. as originally expressed byHerzer. Inserting the Herzer expression into Eq. (59) yields:
K TOTeff �
K 2
u �K 2
1D3ÿK TOT
eff
�3=2A3=2
!1=2
�60�
that cannot be solved analytically but in the limit Ku � Keff,nc reduces to:
K TOTeff � Ku � 1
2
� ������Ku
pK 2
1D3
A3=2
�
� a� bD3 �61�as is experimentally observed (Fig. 58). These macroscopic uniaxial anisotropiescan be attributed to the e�ects of induced anisotropy due to the domain structureproduced during annealing or due to magnetoelastic interactions. Suzuki et al.[276] have proposed a modi®cation of the random anisotropy model for lowerdimensional systems where the coercivity is expected to scale as:
Hc0K
�D����������A=Kp
�2n=�4ÿn��62�
where A is the exchange sti�ness and n is the dimensionality of the exchangecoupled region.
M.E. McHenry et al. / Progress in Materials Science 44 (1999) 291±433400
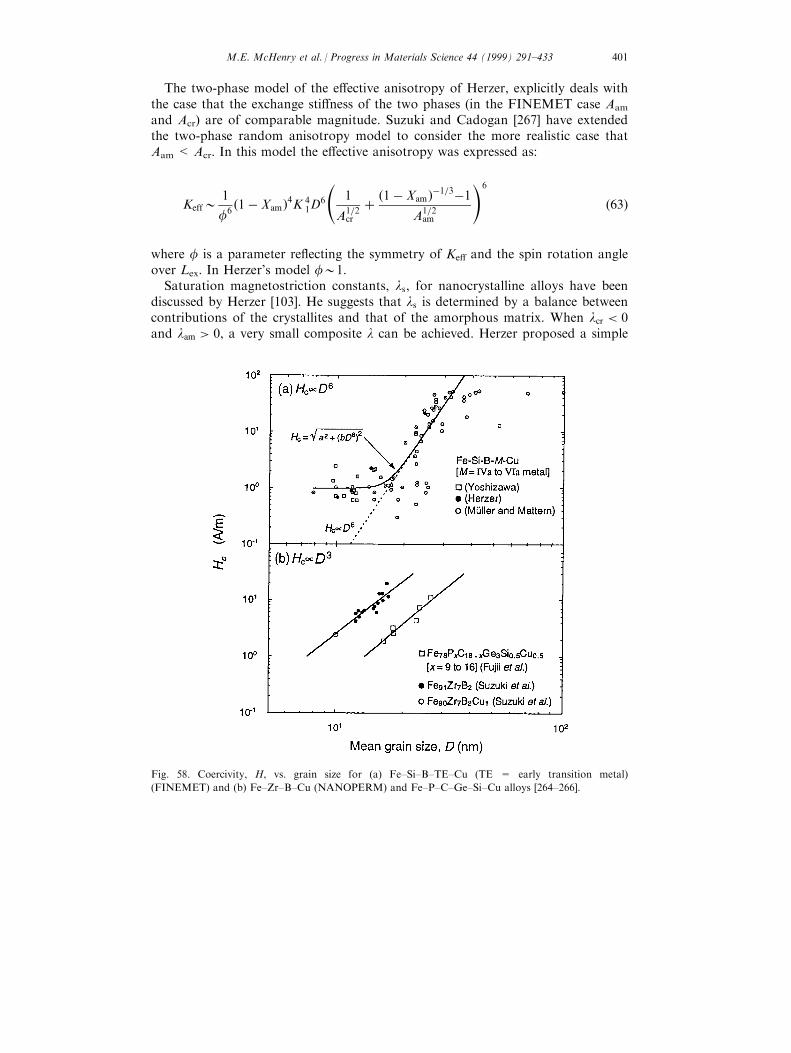
The two-phase model of the e�ective anisotropy of Herzer, explicitly deals withthe case that the exchange sti�ness of the two phases (in the FINEMET case Aam
and Acr) are of comparable magnitude. Suzuki and Cadogan [267] have extendedthe two-phase random anisotropy model to consider the more realistic case thatAam < Acr. In this model the e�ective anisotropy was expressed as:
Keff01
f6�1ÿ Xam�4K 4
1D6
1
A1=2cr
� �1ÿ Xam �ÿ1=3ÿ1A1=2
am
!6
�63�
where f is a parameter re¯ecting the symmetry of Ke� and the spin rotation angleover Lex. In Herzer's model f01.
Saturation magnetostriction constants, ls, for nanocrystalline alloys have beendiscussed by Herzer [103]. He suggests that ls is determined by a balance betweencontributions of the crystallites and that of the amorphous matrix. When lcr < 0and lam > 0, a very small composite l can be achieved. Herzer proposed a simple
Fig. 58. Coercivity, H, vs. grain size for (a) Fe±Si±B±TE±Cu (TE = early transition metal)
(FINEMET) and (b) Fe±Zr±B±Cu (NANOPERM) and Fe±P±C±Ge±Si±Cu alloys [264±266].
M.E. McHenry et al. / Progress in Materials Science 44 (1999) 291±433 401
two-phase model for the saturation induction and the saturation magnetostriction,which are predicted from a simple rule of mixtures [100,101].
7.2. Induced anisotropies
Induced magnetic anisotropy is observed after annealing in a magnetic or stress®eld or in the presence of an electrical current for example. There are severalproposed mechanisms for this induced anisotropy which include:
1. atomic pair ordering resulting in directional order in the sample [59];2. induced texturing which line up easy axes;3. structural relaxation and rearrangement of free volume in amorphous materials;4. in¯uence over the shape anisotropy of crystallites due to mechanical alignment.
Perhaps the most famous of these is the pair ordering which is thought to beoperative in Si±Fe. The remarkable e�ects of ®eld annealing on the shapes ofmagnetic hysteresis loops in Si±Fe and many amorphous materials can be relatedto directional ordering of bond axes and consequently their contributions to themagnetocrystalline anisotropy.
Directional ordering was ®rst addressed in the important work of Ne el [215]. Inthe Ne el model of magnetocrystalline anisotropy, the anisotropy for a given bondis expanded in polynomials of the cos y where y is the angle between the bondaxis and the direction of the magnetization:
wi � g�R� � l�R��
cos2yÿ 1
3
�� q�R�
�cos4yÿ 6
7cos2y� 3
35
�� � � � �64�
where w is the anisotropy energy density contribution of a pair of atoms separatedby R, l is a dipolar and q a quadrupolar term in the energy expansion. Todetermine the magnetocrystalline energy density K, this pairwise interaction energyis summed over all pairs. This summation is typically limited to nearest neighborpairs since the interactions are short range. This summation will be di�erent forordered, disordered and directionally ordered materials that are illustrated in Fig.59.
Fig. 60 shows dramatically the in¯uence of ®eld annealing and consequentdirectional ordering on the magnetic properties of FINEMET ribbons. Hysteresisloops for FINEMET alloys without and with ®eld annealing in either thelongitudinal or transverse directions with respect to the ribbon axis are shown. Asquarer hysteresis loop is observed for longitudinally ®eld annealed materials.
Gonzalez et al. [69] have examined the in¯uence of Joule heating anneals withsimultaneous application of mechanical stress on the e�ective anisotropy andmagnetostriction of Fe73.5Cu1Ta3Si13.5B9 amorphous alloys (a FINEMETcomposition). A maximum in the uniaxial magnetic anisotropy Ku occurred at anannealing temperature of 4508C and was correlated with initial crystallization. Atlarger temperatures K decreases as the nanocrystal spacing decreases and themagnetic coupling increases. The stress dependence of the magnetization work
M.E. McHenry et al. / Progress in Materials Science 44 (1999) 291±433402
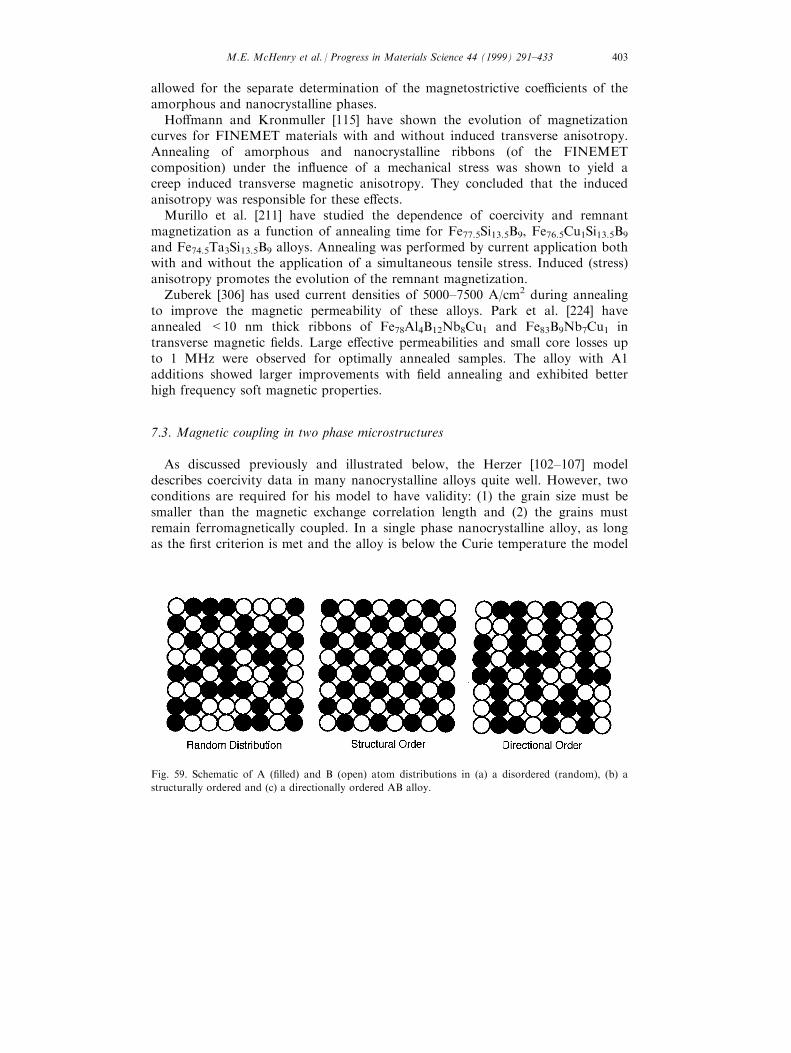
allowed for the separate determination of the magnetostrictive coe�cients of theamorphous and nanocrystalline phases.
Ho�mann and Kronmuller [115] have shown the evolution of magnetizationcurves for FINEMET materials with and without induced transverse anisotropy.Annealing of amorphous and nanocrystalline ribbons (of the FINEMETcomposition) under the in¯uence of a mechanical stress was shown to yield acreep induced transverse magnetic anisotropy. They concluded that the inducedanisotropy was responsible for these e�ects.
Murillo et al. [211] have studied the dependence of coercivity and remnantmagnetization as a function of annealing time for Fe77.5Si13.5B9, Fe76.5Cu1Si13.5B9
and Fe74.5Ta3Si13.5B9 alloys. Annealing was performed by current application bothwith and without the application of a simultaneous tensile stress. Induced (stress)anisotropy promotes the evolution of the remnant magnetization.
Zuberek [306] has used current densities of 5000±7500 A/cm2 during annealingto improve the magnetic permeability of these alloys. Park et al. [224] haveannealed <10 nm thick ribbons of Fe78Al4B12Nb8Cu1 and Fe83B9Nb7Cu1 intransverse magnetic ®elds. Large e�ective permeabilities and small core losses upto 1 MHz were observed for optimally annealed samples. The alloy with A1additions showed larger improvements with ®eld annealing and exhibited betterhigh frequency soft magnetic properties.
7.3. Magnetic coupling in two phase microstructures
As discussed previously and illustrated below, the Herzer [102±107] modeldescribes coercivity data in many nanocrystalline alloys quite well. However, twoconditions are required for his model to have validity: (1) the grain size must besmaller than the magnetic exchange correlation length and (2) the grains mustremain ferromagnetically coupled. In a single phase nanocrystalline alloy, as longas the ®rst criterion is met and the alloy is below the Curie temperature the model
Fig. 59. Schematic of A (®lled) and B (open) atom distributions in (a) a disordered (random), (b) a
structurally ordered and (c) a directionally ordered AB alloy.
M.E. McHenry et al. / Progress in Materials Science 44 (1999) 291±433 403
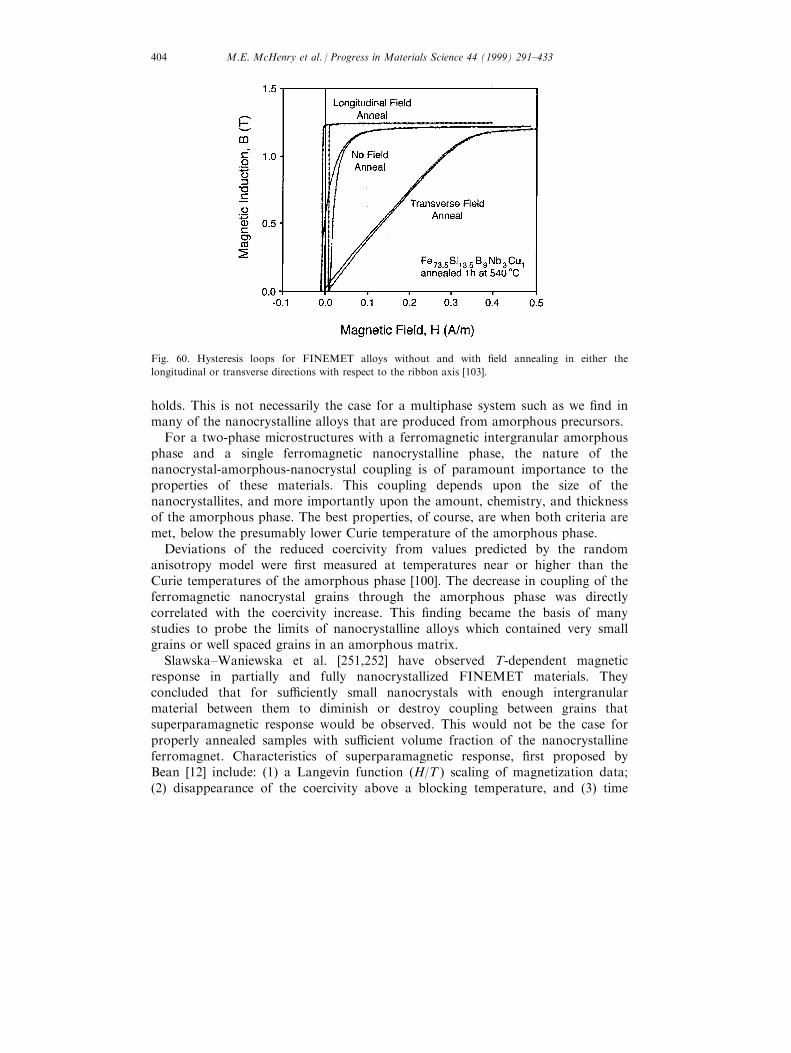
holds. This is not necessarily the case for a multiphase system such as we ®nd inmany of the nanocrystalline alloys that are produced from amorphous precursors.
For a two-phase microstructures with a ferromagnetic intergranular amorphousphase and a single ferromagnetic nanocrystalline phase, the nature of thenanocrystal-amorphous-nanocrystal coupling is of paramount importance to theproperties of these materials. This coupling depends upon the size of thenanocrystallites, and more importantly upon the amount, chemistry, and thicknessof the amorphous phase. The best properties, of course, are when both criteria aremet, below the presumably lower Curie temperature of the amorphous phase.
Deviations of the reduced coercivity from values predicted by the randomanisotropy model were ®rst measured at temperatures near or higher than theCurie temperatures of the amorphous phase [100]. The decrease in coupling of theferromagnetic nanocrystal grains through the amorphous phase was directlycorrelated with the coercivity increase. This ®nding became the basis of manystudies to probe the limits of nanocrystalline alloys which contained very smallgrains or well spaced grains in an amorphous matrix.
Slawska±Waniewska et al. [251,252] have observed T-dependent magneticresponse in partially and fully nanocrystallized FINEMET materials. Theyconcluded that for su�ciently small nanocrystals with enough intergranularmaterial between them to diminish or destroy coupling between grains thatsuperparamagnetic response would be observed. This would not be the case forproperly annealed samples with su�cient volume fraction of the nanocrystallineferromagnet. Characteristics of superparamagnetic response, ®rst proposed byBean [12] include: (1) a Langevin function (H/T ) scaling of magnetization data;(2) disappearance of the coercivity above a blocking temperature, and (3) time
Fig. 60. Hysteresis loops for FINEMET alloys without and with ®eld annealing in either the
longitudinal or transverse directions with respect to the ribbon axis [103].
M.E. McHenry et al. / Progress in Materials Science 44 (1999) 291±433404
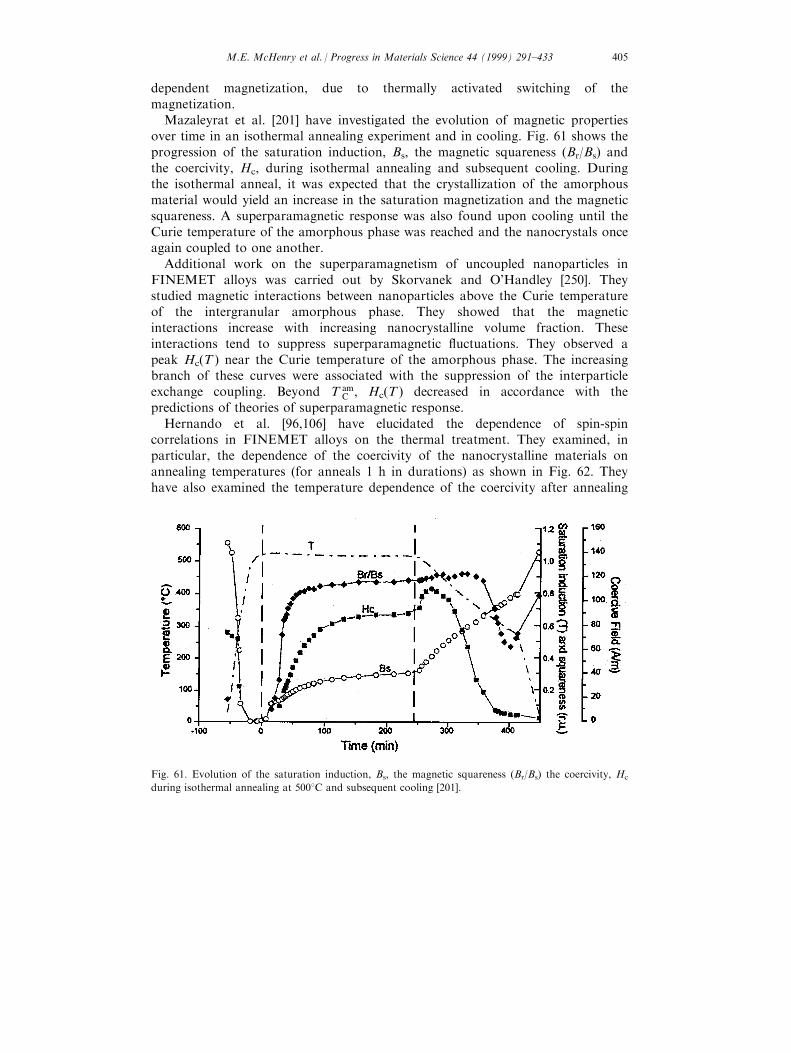
dependent magnetization, due to thermally activated switching of themagnetization.
Mazaleyrat et al. [201] have investigated the evolution of magnetic propertiesover time in an isothermal annealing experiment and in cooling. Fig. 61 shows theprogression of the saturation induction, Bs, the magnetic squareness (Br/Bs) andthe coercivity, Hc, during isothermal annealing and subsequent cooling. Duringthe isothermal anneal, it was expected that the crystallization of the amorphousmaterial would yield an increase in the saturation magnetization and the magneticsquareness. A superparamagnetic response was also found upon cooling until theCurie temperature of the amorphous phase was reached and the nanocrystals onceagain coupled to one another.
Additional work on the superparamagnetism of uncoupled nanoparticles inFINEMET alloys was carried out by Skorvanek and O'Handley [250]. Theystudied magnetic interactions between nanoparticles above the Curie temperatureof the intergranular amorphous phase. They showed that the magneticinteractions increase with increasing nanocrystalline volume fraction. Theseinteractions tend to suppress superparamagnetic ¯uctuations. They observed apeak Hc(T ) near the Curie temperature of the amorphous phase. The increasingbranch of these curves were associated with the suppression of the interparticleexchange coupling. Beyond T am
C , Hc(T ) decreased in accordance with thepredictions of theories of superparamagnetic response.
Hernando et al. [96,106] have elucidated the dependence of spin-spincorrelations in FINEMET alloys on the thermal treatment. They examined, inparticular, the dependence of the coercivity of the nanocrystalline materials onannealing temperatures (for anneals 1 h in durations) as shown in Fig. 62. Theyhave also examined the temperature dependence of the coercivity after annealing
Fig. 61. Evolution of the saturation induction, Bs, the magnetic squareness (Br/Bs) the coercivity, Hc
during isothermal annealing at 5008C and subsequent cooling [201].
M.E. McHenry et al. / Progress in Materials Science 44 (1999) 291±433 405
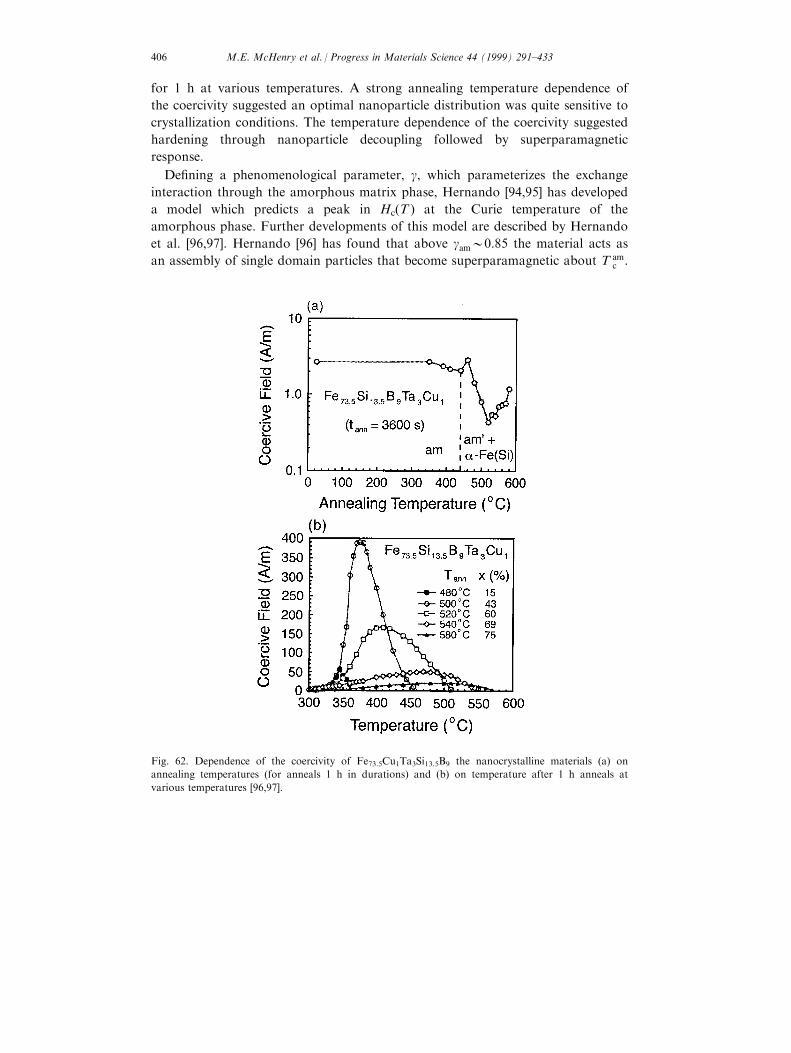
for 1 h at various temperatures. A strong annealing temperature dependence of
the coercivity suggested an optimal nanoparticle distribution was quite sensitive to
crystallization conditions. The temperature dependence of the coercivity suggested
hardening through nanoparticle decoupling followed by superparamagnetic
response.
De®ning a phenomenological parameter, g, which parameterizes the exchange
interaction through the amorphous matrix phase, Hernando [94,95] has developed
a model which predicts a peak in Hc(T ) at the Curie temperature of the
amorphous phase. Further developments of this model are described by Hernando
et al. [96,97]. Hernando [96] has found that above gam00:85 the material acts as
an assembly of single domain particles that become superparamagnetic about T amc .
Fig. 62. Dependence of the coercivity of Fe73.5Cu1Ta3Si13.5B9 the nanocrystalline materials (a) on
annealing temperatures (for anneals 1 h in durations) and (b) on temperature after 1 h anneals at
various temperatures [96,97].
M.E. McHenry et al. / Progress in Materials Science 44 (1999) 291±433406
Interestingly, the observed Curie temperature, T amC is nearly 100 K higher than
T am�C , that expected for the amorphous matrix of the same composition in an as
cast ribbon. A parameterization of the intergranular spacing, A, is used in adescription of the enhancement of T am
C to T am�C . This intergranular spacing is:
L � d
"�1
X
�1=3
ÿ1#
�65�
where d is the average grain size and X is the volume fraction of a-Fenanocrystals. With this parameter de®ned, a linear dependence has beenpostulated of the form:
T amC ÿ T am�
C � 2L
L
ÿT xtal
C ÿ T am�C
� �66�
with Lex is the exchange correlation length. This result has been attributed toexchange coupling enhancement in the amorphous phase near the interface withthe ferromagnetic nanocrystals. This enhancement will only be observable inmaterials with large surface area/volume ratios.
As mentioned earlier, Hernando [97] has o�ered a parameterization thatdescribes decoupling of ferromagnetic nanocrystals above the Curie temperatureof the amorphous phase. The details of this model involve de®nition of anexchange correlation length coe�cient, gex, which has values ranging between zero(decoupled) and one (fully coupled-Herzer model). He has developed relationshipsfor multiphase systems beginning by de®ning:
gex � exp
�ÿLLam
��67�
where Lam is the exchange length of the amorphous phase. Three notablerelationships arise:
1. The ®rst of these is a modi®ed exchange correlation length, L�, expressed as afunction of the exchange correlation length coe�cient:
L� � Lexg2ex
X�68�
where Lex is the single phase exchange correlation length originally proposed byHerzer. The dependence of L� on X profoundly modi®es the D 6 dependence ofHc.
2. The second of these is a new parameterization of the magnetocrystallineanisotropy that is also a strong function of the exchange correlation lengthcoe�cient:
k� � K0X2
g3ex
�69�
M.E. McHenry et al. / Progress in Materials Science 44 (1999) 291±433 407
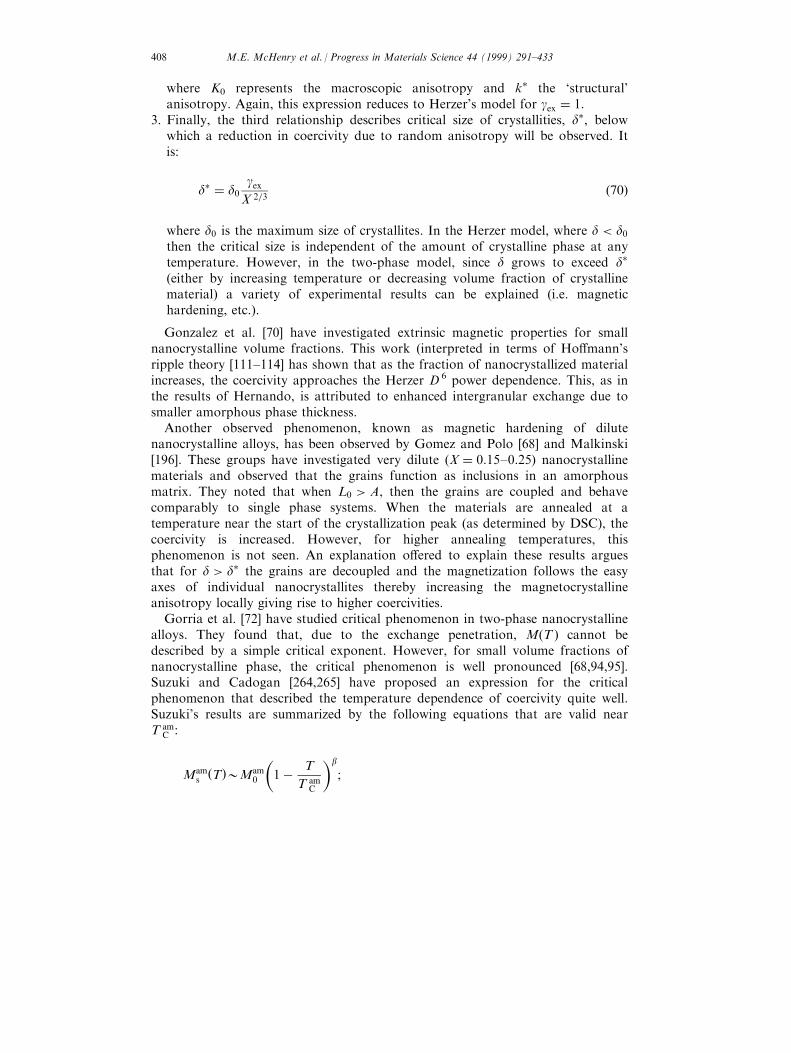
where K0 represents the macroscopic anisotropy and k� the `structural'anisotropy. Again, this expression reduces to Herzer's model for gex � 1.
3. Finally, the third relationship describes critical size of crystallities, d�, belowwhich a reduction in coercivity due to random anisotropy will be observed. Itis:
d� � d0gex
X 2=3�70�
where d0 is the maximum size of crystallites. In the Herzer model, where d < d0then the critical size is independent of the amount of crystalline phase at anytemperature. However, in the two-phase model, since d grows to exceed d�
(either by increasing temperature or decreasing volume fraction of crystallinematerial) a variety of experimental results can be explained (i.e. magnetichardening, etc.).
Gonzalez et al. [70] have investigated extrinsic magnetic properties for smallnanocrystalline volume fractions. This work (interpreted in terms of Ho�mann'sripple theory [111±114] has shown that as the fraction of nanocrystallized materialincreases, the coercivity approaches the Herzer D 6 power dependence. This, as inthe results of Hernando, is attributed to enhanced intergranular exchange due tosmaller amorphous phase thickness.
Another observed phenomenon, known as magnetic hardening of dilutenanocrystalline alloys, has been observed by Gomez and Polo [68] and Malkinski[196]. These groups have investigated very dilute (X � 0:15±0:25) nanocrystallinematerials and observed that the grains function as inclusions in an amorphousmatrix. They noted that when L0 > A, then the grains are coupled and behavecomparably to single phase systems. When the materials are annealed at atemperature near the start of the crystallization peak (as determined by DSC), thecoercivity is increased. However, for higher annealing temperatures, thisphenomenon is not seen. An explanation o�ered to explain these results arguesthat for d > d� the grains are decoupled and the magnetization follows the easyaxes of individual nanocrystallites thereby increasing the magnetocrystallineanisotropy locally giving rise to higher coercivities.
Gorria et al. [72] have studied critical phenomenon in two-phase nanocrystallinealloys. They found that, due to the exchange penetration, M(T ) cannot bedescribed by a simple critical exponent. However, for small volume fractions ofnanocrystalline phase, the critical phenomenon is well pronounced [68,94,95].Suzuki and Cadogan [264,265] have proposed an expression for the criticalphenomenon that described the temperature dependence of coercivity quite well.Suzuki's results are summarized by the following equations that are valid nearT am
C :
Mams�T�0Mam
0
�1ÿ T
T amC
�b
;
M.E. McHenry et al. / Progress in Materials Science 44 (1999) 291±433408
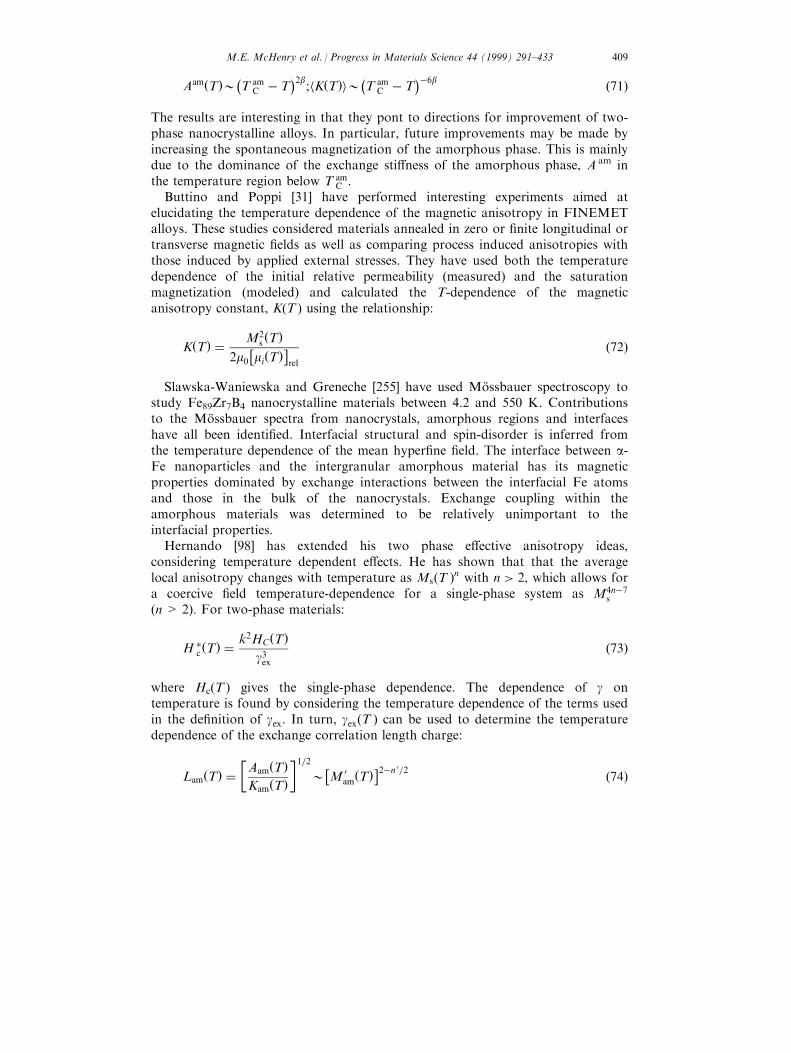
Aam�T�0ÿT am
C ÿ T�2b
;hK�T�i0ÿT am
C ÿ T�ÿ6b �71�
The results are interesting in that they pont to directions for improvement of two-phase nanocrystalline alloys. In particular, future improvements may be made byincreasing the spontaneous magnetization of the amorphous phase. This is mainlydue to the dominance of the exchange sti�ness of the amorphous phase, A am inthe temperature region below T am
C .Buttino and Poppi [31] have performed interesting experiments aimed at
elucidating the temperature dependence of the magnetic anisotropy in FINEMETalloys. These studies considered materials annealed in zero or ®nite longitudinal ortransverse magnetic ®elds as well as comparing process induced anisotropies withthose induced by applied external stresses. They have used both the temperaturedependence of the initial relative permeability (measured) and the saturationmagnetization (modeled) and calculated the T-dependence of the magneticanisotropy constant, K(T ) using the relationship:
K�T� � M2s�T�
2m0�mi�T�
�rel
�72�
Slawska-Waniewska and Greneche [255] have used MoÈ ssbauer spectroscopy tostudy Fe89Zr7B4 nanocrystalline materials between 4.2 and 550 K. Contributionsto the MoÈ ssbauer spectra from nanocrystals, amorphous regions and interfaceshave all been identi®ed. Interfacial structural and spin-disorder is inferred fromthe temperature dependence of the mean hyper®ne ®eld. The interface between a-Fe nanoparticles and the intergranular amorphous material has its magneticproperties dominated by exchange interactions between the interfacial Fe atomsand those in the bulk of the nanocrystals. Exchange coupling within theamorphous materials was determined to be relatively unimportant to theinterfacial properties.
Hernando [98] has extended his two phase e�ective anisotropy ideas,considering temperature dependent e�ects. He has shown that that the averagelocal anisotropy changes with temperature as Ms�T �n with n > 2, which allows fora coercive ®eld temperature-dependence for a single-phase system as M4nÿ7
s
(n > 2). For two-phase materials:
H �c �T� �k2HC�T�
g3ex
�73�
where Hc(T ) gives the single-phase dependence. The dependence of g ontemperature is found by considering the temperature dependence of the terms usedin the de®nition of gex. In turn, gex�T � can be used to determine the temperaturedependence of the exchange correlation length charge:
Lam�T� ��Aam�T�Kam�T�
�1=20�M 0
am�T��2ÿn 0=2 �74�
M.E. McHenry et al. / Progress in Materials Science 44 (1999) 291±433 409
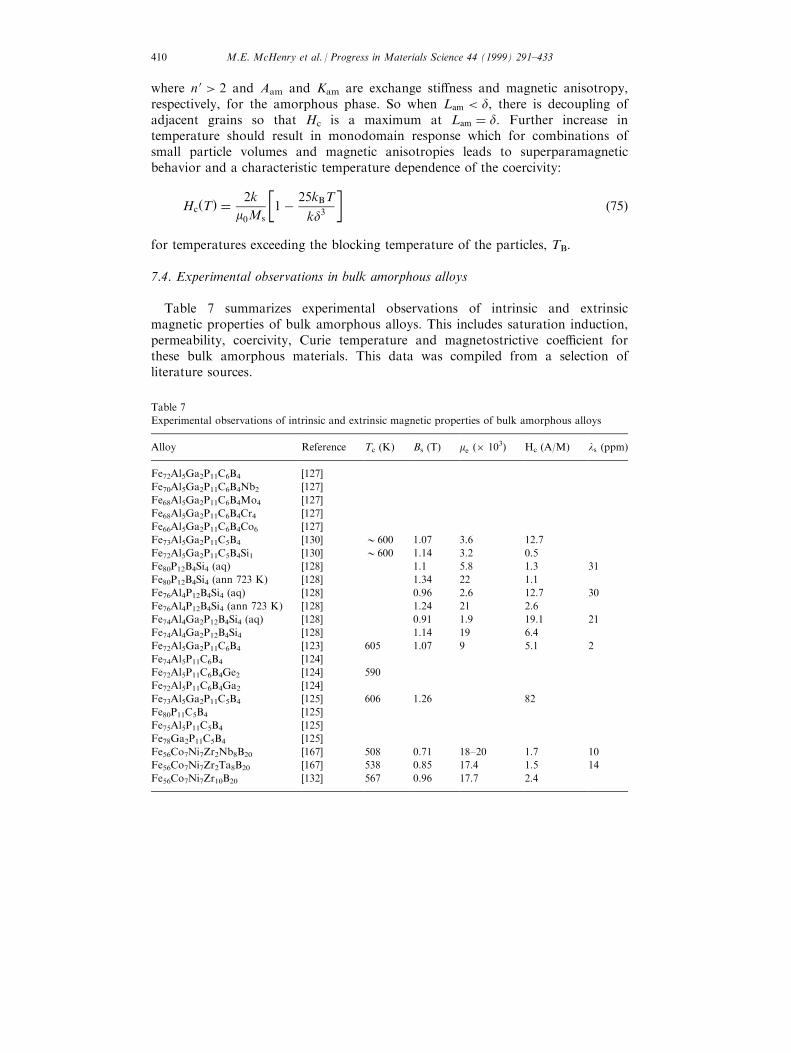
where n 0 > 2 and Aam and Kam are exchange sti�ness and magnetic anisotropy,respectively, for the amorphous phase. So when Lam < d, there is decoupling ofadjacent grains so that Hc is a maximum at Lam � d. Further increase intemperature should result in monodomain response which for combinations ofsmall particle volumes and magnetic anisotropies leads to superparamagneticbehavior and a characteristic temperature dependence of the coercivity:
Hc�T� � 2k
m0Ms
�1ÿ 25kBT
kd3
��75�
for temperatures exceeding the blocking temperature of the particles, TB.
7.4. Experimental observations in bulk amorphous alloys
Table 7 summarizes experimental observations of intrinsic and extrinsicmagnetic properties of bulk amorphous alloys. This includes saturation induction,permeability, coercivity, Curie temperature and magnetostrictive coe�cient forthese bulk amorphous materials. This data was compiled from a selection ofliterature sources.
Table 7
Experimental observations of intrinsic and extrinsic magnetic properties of bulk amorphous alloys
Alloy Reference Tc (K) Bs (T) me (� 103) Hc (A/M) ls (ppm)
Fe72Al5Ga2P11C6B4 [127]
Fe70Al5Ga2P11C6B4Nb2 [127]
Fe68Al5Ga2P11C6B4Mo4 [127]
Fe68Al5Ga2P11C6B4Cr4 [127]
Fe66Al5Ga2P11C6B4Co6 [127]
Fe73Al5Ga2P11C5B4 [130] 0600 1.07 3.6 12.7
Fe72Al5Ga2P11C5B4Si1 [130] 0600 1.14 3.2 0.5
Fe80P12B4Si4 (aq) [128] 1.1 5.8 1.3 31
Fe80P12B4Si4 (ann 723 K) [128] 1.34 22 1.1
Fe76Al4P12B4Si4 (aq) [128] 0.96 2.6 12.7 30
Fe76Al4P12B4Si4 (ann 723 K) [128] 1.24 21 2.6
Fe74Al4Ga2P12B4Si4 (aq) [128] 0.91 1.9 19.1 21
Fe74Al4Ga2P12B4Si4 [128] 1.14 19 6.4
Fe72Al5Ga2P11C6B4 [123] 605 1.07 9 5.1 2
Fe74Al5P11C6B4 [124]
Fe72Al5P11C6B4Ge2 [124] 590
Fe72Al5P11C6B4Ga2 [124]
Fe73Al5Ga2P11C5B4 [125] 606 1.26 82
Fe80P11C5B4 [125]
Fe75Al5P11C5B4 [125]
Fe78Ga2P11C5B4 [125]
Fe56Co7Ni7Zr2Nb8B20 [167] 508 0.71 18±20 1.7 10
Fe56Co7Ni7Zr2Ta8B20 [167] 538 0.85 17.4 1.5 14
Fe56Co7Ni7Zr10B20 [132] 567 0.96 17.7 2.4
M.E. McHenry et al. / Progress in Materials Science 44 (1999) 291±433410
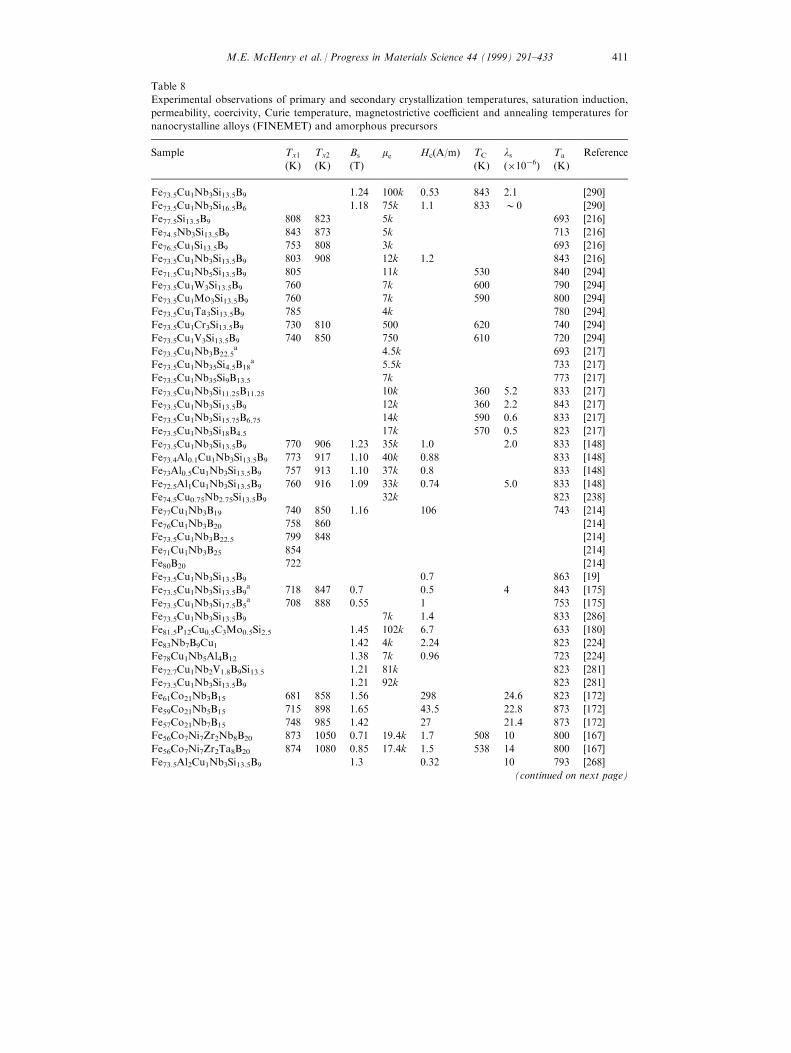
Table 8
Experimental observations of primary and secondary crystallization temperatures, saturation induction,
permeability, coercivity, Curie temperature, magnetostrictive coe�cient and annealing temperatures for
nanocrystalline alloys (FINEMET) and amorphous precursors
Sample Tx1
(K)
Tx2
(K)
Bs
(T)
me Hc(A/m) TC
(K)
ls
(�10ÿ6)Ta
(K)
Reference
Fe73.5Cu1Nb3Si13.5B9 1.24 100k 0.53 843 2.1 [290]
Fe73.5Cu1Nb3Si16.5B6 1.18 75k 1.1 833 00 [290]
Fe77.5Si13.5B9 808 823 5k 693 [216]
Fe74.5Nb3Si13.5B9 843 873 5k 713 [216]
Fe76.5Cu1Si13.5B9 753 808 3k 693 [216]
Fe73.5Cu1Nb3Si13.5B9 803 908 12k 1.2 843 [216]
Fe71.5Cu1Nb5Si13.5B9 805 11k 530 840 [294]
Fe73.5Cu1W3Si13.5B9 760 7k 600 790 [294]
Fe73.5Cu1Mo3Si13.5B9 760 7k 590 800 [294]
Fe73.5Cu1Ta3Si13.5B9 785 4k 780 [294]
Fe73.5Cu1Cr3Si13.5B9 730 810 500 620 740 [294]
Fe73.5Cu1V3Si13.5B9 740 850 750 610 720 [294]
Fe73.5Cu1Nb3B22.5a 4.5k 693 [217]
Fe73.5Cu1Nb35Si4.5B18a 5.5k 733 [217]
Fe73.5Cu1Nb35Si9B13.5 7k 773 [217]
Fe73.5Cu1Nb3Si11.25B11.25 10k 360 5.2 833 [217]
Fe73.5Cu1Nb3Si13.5B9 12k 360 2.2 843 [217]
Fe73.5Cu1Nb3Si15.75B6.75 14k 590 0.6 833 [217]
Fe73.5Cu1Nb3Si18B4.5 17k 570 0.5 823 [217]
Fe73.5Cu1Nb3Si13.5B9 770 906 1.23 35k 1.0 2.0 833 [148]
Fe73.4Al0.1Cu1Nb3Si13.5B9 773 917 1.10 40k 0.88 833 [148]
Fe73Al0.5Cu1Nb3Si13.5B9 757 913 1.10 37k 0.8 833 [148]
Fe72.5Al1Cu1Nb3Si13.5B9 760 916 1.09 33k 0.74 5.0 833 [148]
Fe74.5Cu0.75Nb2.75Si13.5B9 32k 823 [238]
Fe77Cu1Nb3B19 740 850 1.16 106 743 [214]
Fe76Cu1Nb3B20 758 860 [214]
Fe73.5Cu1Nb3B22.5 799 848 [214]
Fe71Cu1Nb3B25 854 [214]
Fe80B20 722 [214]
Fe73.5Cu1Nb3Si13.5B9 0.7 863 [19]
Fe73.5Cu1Nb3Si13.5B9a 718 847 0.7 0.5 4 843 [175]
Fe73.5Cu1Nb3Si17.5B5a 708 888 0.55 1 753 [175]
Fe73.5Cu1Nb3Si13.5B9 7k 1.4 833 [286]
Fe81.5P12Cu0.5C3Mo0.5Si2.5 1.45 102k 6.7 633 [180]
Fe83Nb7B9Cu1 1.42 4k 2.24 823 [224]
Fe78Cu1Nb5Al4B12 1.38 7k 0.96 723 [224]
Fe72.7Cu1Nb2V1.8B9Si13.5 1.21 81k 823 [281]
Fe73.5Cu1Nb3Si13.5B9 1.21 92k 823 [281]
Fe61Co21Nb3B15 681 858 1.56 298 24.6 823 [172]
Fe59Co21Nb5B15 715 898 1.65 43.5 22.8 873 [172]
Fe57Co21Nb7B15 748 985 1.42 27 21.4 873 [172]
Fe56Co7Ni7Zr2Nb8B20 873 1050 0.71 19.4k 1.7 508 10 800 [167]
Fe56Co7Ni7Zr2Ta8B20 874 1080 0.85 17.4k 1.5 538 14 800 [167]
Fe73.5Al2Cu1Nb3Si13.5B9 1.3 0.32 10 793 [268]
(continued on next page)
M.E. McHenry et al. / Progress in Materials Science 44 (1999) 291±433 411
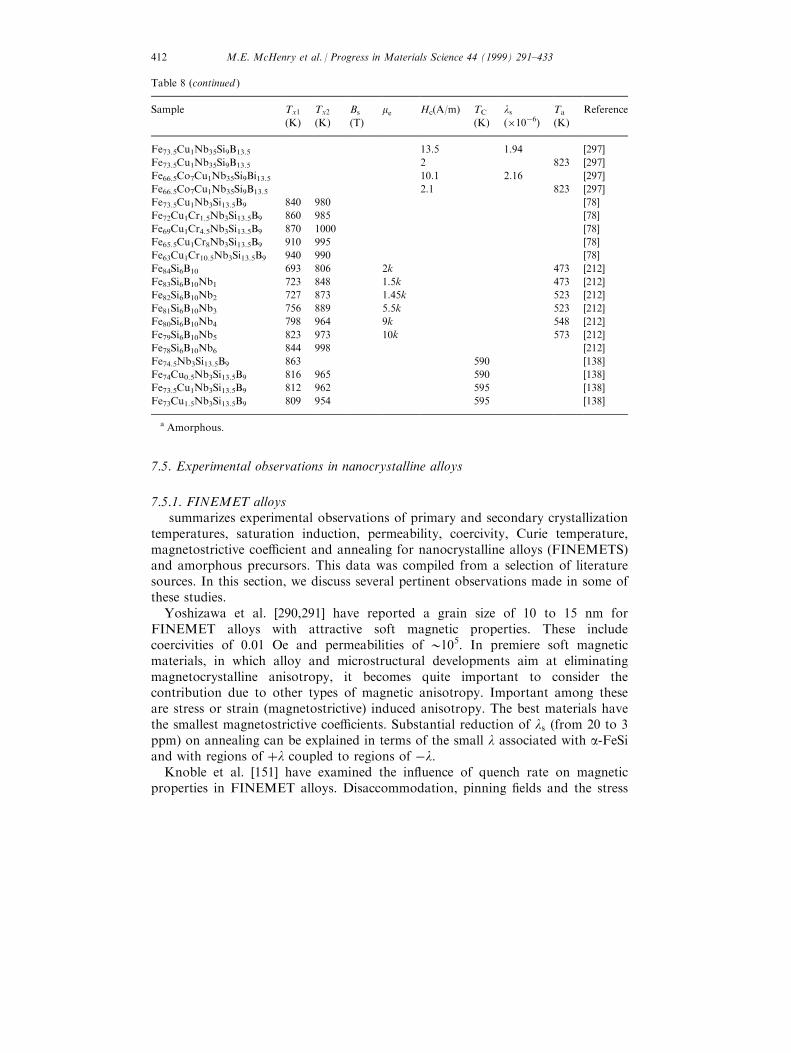
7.5. Experimental observations in nanocrystalline alloys
7.5.1. FINEMET alloyssummarizes experimental observations of primary and secondary crystallization
temperatures, saturation induction, permeability, coercivity, Curie temperature,magnetostrictive coe�cient and annealing for nanocrystalline alloys (FINEMETS)and amorphous precursors. This data was compiled from a selection of literaturesources. In this section, we discuss several pertinent observations made in some ofthese studies.
Yoshizawa et al. [290,291] have reported a grain size of 10 to 15 nm forFINEMET alloys with attractive soft magnetic properties. These includecoercivities of 0.01 Oe and permeabilities of 0105. In premiere soft magneticmaterials, in which alloy and microstructural developments aim at eliminatingmagnetocrystalline anisotropy, it becomes quite important to consider thecontribution due to other types of magnetic anisotropy. Important among theseare stress or strain (magnetostrictive) induced anisotropy. The best materials havethe smallest magnetostrictive coe�cients. Substantial reduction of ls (from 20 to 3ppm) on annealing can be explained in terms of the small l associated with a-FeSiand with regions of �l coupled to regions of ÿl.
Knoble et al. [151] have examined the in¯uence of quench rate on magneticproperties in FINEMET alloys. Disaccommodation, pinning ®elds and the stress
Table 8 (continued )
Sample Tx1
(K)
Tx2
(K)
Bs
(T)
me Hc(A/m) TC
(K)
ls
(�10ÿ6)Ta
(K)
Reference
Fe73.5Cu1Nb35Si9B13.5 13.5 1.94 [297]
Fe73.5Cu1Nb35Si9B13.5 2 823 [297]
Fe66.5Co7Cu1Nb35Si9Bi13.5 10.1 2.16 [297]
Fe66.5Co7Cu1Nb35Si9B13.5 2.1 823 [297]
Fe73.5Cu1Nb3Si13.5B9 840 980 [78]
Fe72Cu1Cr1.5Nb3Si13.5B9 860 985 [78]
Fe69Cu1Cr4.5Nb3Si13.5B9 870 1000 [78]
Fe65.5Cu1Cr8Nb3Si13.5B9 910 995 [78]
Fe63Cu1Cr10.5Nb3Si13.5B9 940 990 [78]
Fe84Si6B10 693 806 2k 473 [212]
Fe83Si6B10Nb1 723 848 1.5k 473 [212]
Fe82Si6B10Nb2 727 873 1.45k 523 [212]
Fe81Si6B10Nb3 756 889 5.5k 523 [212]
Fe80Si6B10Nb4 798 964 9k 548 [212]
Fe79Si6B10Nb5 823 973 10k 573 [212]
Fe78Si6B10Nb6 844 998 [212]
Fe74.5Nb3Si13.5B9 863 590 [138]
Fe74Cu0.5Nb3Si13.5B9 816 965 590 [138]
Fe73.5Cu1Nb3Si13.5B9 812 962 595 [138]
Fe73Cu1.5Nb3Si13.5B9 809 954 595 [138]
a Amorphous.
M.E. McHenry et al. / Progress in Materials Science 44 (1999) 291±433412
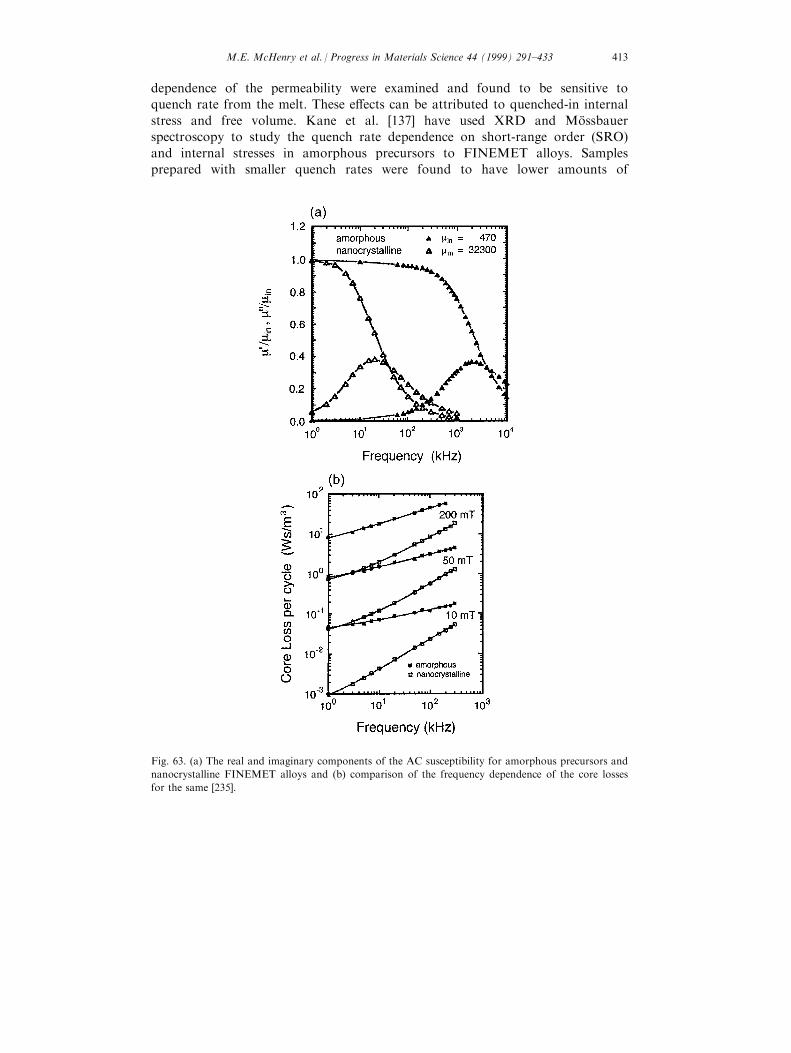
dependence of the permeability were examined and found to be sensitive to
quench rate from the melt. These e�ects can be attributed to quenched-in internal
stress and free volume. Kane et al. [137] have used XRD and MoÈ ssbauer
spectroscopy to study the quench rate dependence on short-range order (SRO)
and internal stresses in amorphous precursors to FINEMET alloys. Samples
prepared with smaller quench rates were found to have lower amounts of
Fig. 63. (a) The real and imaginary components of the AC susceptibility for amorphous precursors and
nanocrystalline FINEMET alloys and (b) comparison of the frequency dependence of the core losses
for the same [235].
M.E. McHenry et al. / Progress in Materials Science 44 (1999) 291±433 413
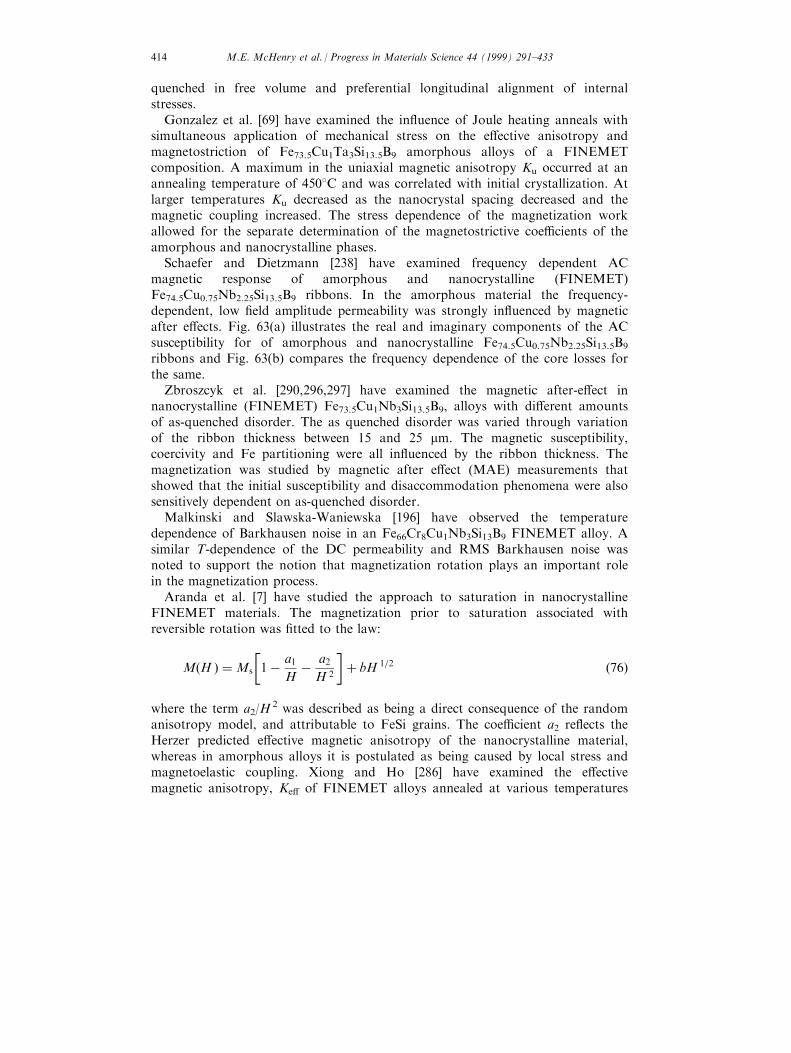
quenched in free volume and preferential longitudinal alignment of internalstresses.
Gonzalez et al. [69] have examined the in¯uence of Joule heating anneals withsimultaneous application of mechanical stress on the e�ective anisotropy andmagnetostriction of Fe73.5Cu1Ta3Si13.5B9 amorphous alloys of a FINEMETcomposition. A maximum in the uniaxial magnetic anisotropy Ku occurred at anannealing temperature of 4508C and was correlated with initial crystallization. Atlarger temperatures Ku decreased as the nanocrystal spacing decreased and themagnetic coupling increased. The stress dependence of the magnetization workallowed for the separate determination of the magnetostrictive coe�cients of theamorphous and nanocrystalline phases.
Schaefer and Dietzmann [238] have examined frequency dependent ACmagnetic response of amorphous and nanocrystalline (FINEMET)Fe74.5Cu0.75Nb2.25Si13.5B9 ribbons. In the amorphous material the frequency-dependent, low ®eld amplitude permeability was strongly in¯uenced by magneticafter e�ects. Fig. 63(a) illustrates the real and imaginary components of the ACsusceptibility for of amorphous and nanocrystalline Fe74.5Cu0.75Nb2.25Si13.5B9
ribbons and Fig. 63(b) compares the frequency dependence of the core losses forthe same.
Zbroszcyk et al. [290,296,297] have examined the magnetic after-e�ect innanocrystalline (FINEMET) Fe73.5Cu1Nb3Si13.5B9, alloys with di�erent amountsof as-quenched disorder. The as quenched disorder was varied through variationof the ribbon thickness between 15 and 25 mm. The magnetic susceptibility,coercivity and Fe partitioning were all in¯uenced by the ribbon thickness. Themagnetization was studied by magnetic after e�ect (MAE) measurements thatshowed that the initial susceptibility and disaccommodation phenomena were alsosensitively dependent on as-quenched disorder.
Malkinski and Slawska-Waniewska [196] have observed the temperaturedependence of Barkhausen noise in an Fe66Cr8Cu1Nb3Si13B9 FINEMET alloy. Asimilar T-dependence of the DC permeability and RMS Barkhausen noise wasnoted to support the notion that magnetization rotation plays an important rolein the magnetization process.
Aranda et al. [7] have studied the approach to saturation in nanocrystallineFINEMET materials. The magnetization prior to saturation associated withreversible rotation was ®tted to the law:
M�H � �Ms
�1ÿ a1
Hÿ a2
H 2
�� bH 1=2 �76�
where the term a2/H2 was described as being a direct consequence of the random
anisotropy model, and attributable to FeSi grains. The coe�cient a2 re¯ects theHerzer predicted e�ective magnetic anisotropy of the nanocrystalline material,whereas in amorphous alloys it is postulated as being caused by local stress andmagnetoelastic coupling. Xiong and Ho [286] have examined the e�ectivemagnetic anisotropy, Ke� of FINEMET alloys annealed at various temperatures
M.E. McHenry et al. / Progress in Materials Science 44 (1999) 291±433414
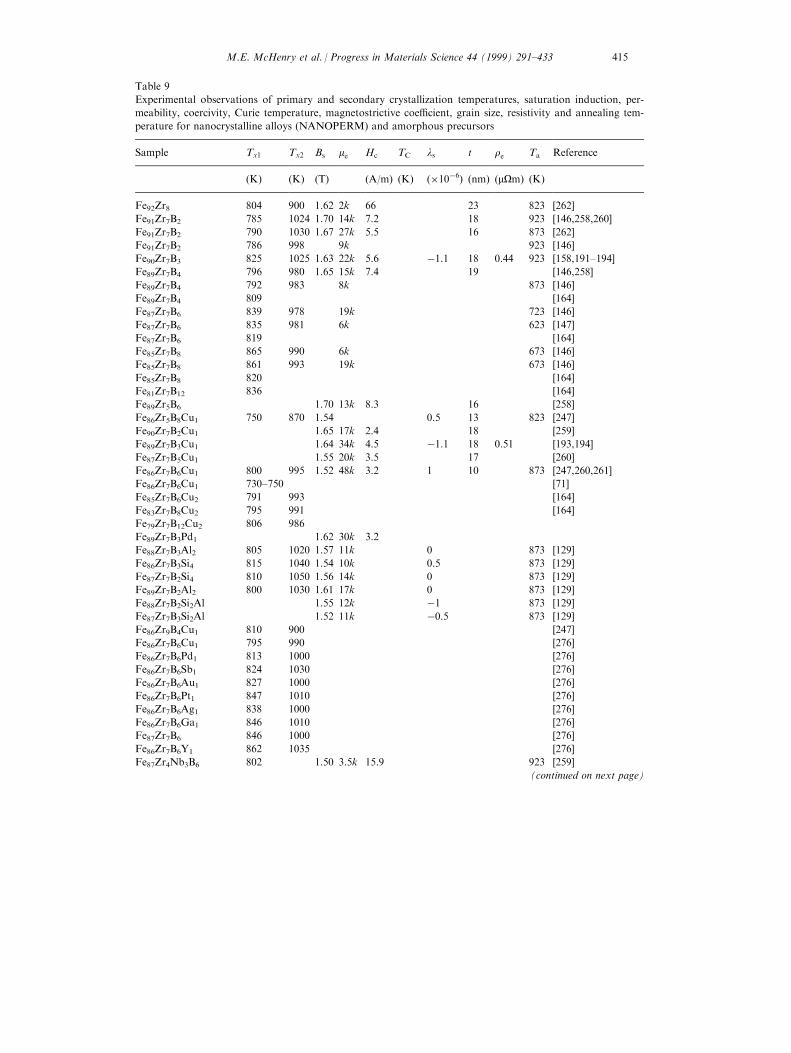
Table 9
Experimental observations of primary and secondary crystallization temperatures, saturation induction, per-
meability, coercivity, Curie temperature, magnetostrictive coe�cient, grain size, resistivity and annealing tem-
perature for nanocrystalline alloys (NANOPERM) and amorphous precursors
Sample Tx1 Tx2 Bs me Hc TC ls t re Ta Reference
(K) (K) (T) (A/m) (K) (�10ÿ6) (nm) (mOm) (K)
Fe92Zr8 804 900 1.62 2k 66 23 823 [262]
Fe91Zr7B2 785 1024 1.70 14k 7.2 18 923 [146,258,260]
Fe91Zr7B2 790 1030 1.67 27k 5.5 16 873 [262]
Fe91Zr7B2 786 998 9k 923 [146]
Fe90Zr7B3 825 1025 1.63 22k 5.6 ÿ1.1 18 0.44 923 [158,191±194]
Fe89Zr7B4 796 980 1.65 15k 7.4 19 [146,258]
Fe89Zr7B4 792 983 8k 873 [146]
Fe89Zr7B4 809 [164]
Fe87Zr7B6 839 978 19k 723 [146]
Fe87Zr7B6 835 981 6k 623 [147]
Fe87Zr7B6 819 [164]
Fe85Zr7B8 865 990 6k 673 [146]
Fe85Zr7B8 861 993 19k 673 [146]
Fe85Zr7B8 820 [164]
Fe81Zr7B12 836 [164]
Fe89Zr5B6 1.70 13k 8.3 16 [258]
Fe86Zr5B8Cu1 750 870 1.54 0.5 13 823 [247]
Fe90Zr7B2Cu1 1.65 17k 2.4 18 [259]
Fe89Zr7B3Cu1 1.64 34k 4.5 ÿ1.1 18 0.51 [193,194]
Fe87Zr7B5Cu1 1.55 20k 3.5 17 [260]
Fe86Zr7B6Cu1 800 995 1.52 48k 3.2 1 10 873 [247,260,261]
Fe86Zr7B6Cu1 730±750 [71]
Fe85Zr7B6Cu2 791 993 [164]
Fe83Zr7B8Cu2 795 991 [164]
Fe79Zr7B12Cu2 806 986
Fe89Zr7B3Pd1 1.62 30k 3.2
Fe88Zr7B3Al2 805 1020 1.57 11k 0 873 [129]
Fe86Zr7B3Si4 815 1040 1.54 10k 0.5 873 [129]
Fe87Zr7B2Si4 810 1050 1.56 14k 0 873 [129]
Fe89Zr7B2Al2 800 1030 1.61 17k 0 873 [129]
Fe88Zr7B2Si2Al 1.55 12k ÿ1 873 [129]
Fe87Zr7B3Si2Al 1.52 11k ÿ0.5 873 [129]
Fe86Zr9B4Cu1 810 900 [247]
Fe86Zr7B6Cu1 795 990 [276]
Fe86Zr7B6Pd1 813 1000 [276]
Fe86Zr7B6Sb1 824 1030 [276]
Fe86Zr7B6Au1 827 1000 [276]
Fe86Zr7B6Pt1 847 1010 [276]
Fe86Zr7B6Ag1 838 1000 [276]
Fe86Zr7B6Ga1 846 1010 [276]
Fe87Zr7B6 846 1000 [276]
Fe86Zr7B6Y1 862 1035 [276]
Fe87Zr4Nb3B6 802 1.50 3.5k 15.9 923 [259]
(continued on next page)
M.E. McHenry et al. / Progress in Materials Science 44 (1999) 291±433 415
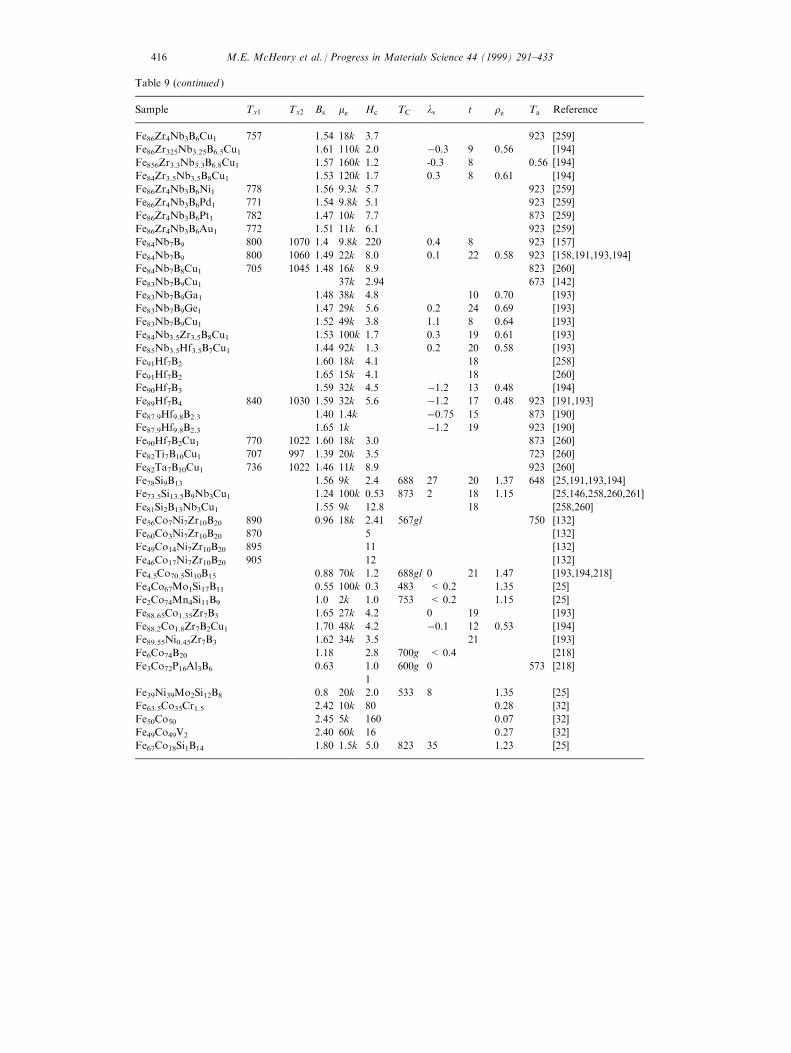
Table 9 (continued )
Sample Tx1 Tx2 Bs me Hc TC ls t re Ta Reference
Fe86Zr4Nb3B6Cu1 757 1.54 18k 3.7 923 [259]
Fe86Zr325Nb3.25B6.5Cu1 1.61 110k 2.0 ÿ0.3 9 0.56 [194]
Fe856Zr3.3Nb3.3B6.8Cu1 1.57 160k 1.2 -0.3 8 0.56 [194]
Fe84Zr3.5Nb3.5B8Cu1 1.53 120k 1.7 0.3 8 0.61 [194]
Fe86Zr4Nb3B6Ni1 778 1.56 9.3k 5.7 923 [259]
Fe86Zr4Nb3B6Pd1 771 1.54 9.8k 5.1 923 [259]
Fe86Zr4Nb3B6Pt1 782 1.47 10k 7.7 873 [259]
Fe86Zr4Nb3B6Au1 772 1.51 11k 6.1 923 [259]
Fe84Nb7B9 800 1070 1.4 9.8k 220 0.4 8 923 [157]
Fe84Nb7B9 800 1060 1.49 22k 8.0 0.1 22 0.58 923 [158,191,193,194]
Fe84Nb7B8Cu1 705 1045 1.48 16k 8.9 823 [260]
Fe83Nb7B9Cu1 37k 2.94 673 [142]
Fe83Nb7B9Ga1 1.48 38k 4.8 10 0.70 [193]
Fe83Nb7B9Ge1 1.47 29k 5.6 0.2 24 0.69 [193]
Fe83Nb7B9Cu1 1.52 49k 3.8 1.1 8 0.64 [193]
Fe84Nb3.5Zr3.5B8Cu1 1.53 100k 1.7 0.3 19 0.61 [193]
Fe85Nb3.5Hf3.5B7Cu1 1.44 92k 1.3 0.2 20 0.58 [193]
Fe91Hf7B2 1.60 18k 4.1 18 [258]
Fe91Hf7B2 1.65 15k 4.1 18 [260]
Fe90Hf7B3 1.59 32k 4.5 ÿ1.2 13 0.48 [194]
Fe89Hf7B4 840 1030 1.59 32k 5.6 ÿ1.2 17 0.48 923 [191,193]
Fe87.9Hf9.8B2.3 1.40 1.4k ÿ0.75 15 873 [190]
Fe87.9Hf9.8B2.3 1.65 1k ÿ1.2 19 923 [190]
Fe90Hf7B2Cu1 770 1022 1.60 18k 3.0 873 [260]
Fe82Ti7B10Cu1 707 997 1.39 20k 3.5 723 [260]
Fe82Ta7B10Cu1 736 1022 1.46 11k 8.9 923 [260]
Fe78Si9B13 1.56 9k 2.4 688 27 20 1.37 648 [25,191,193,194]
Fe73.5Si13.5B9Nb3Cu1 1.24 100k 0.53 873 2 18 1.15 [25,146,258,260,261]
Fe81Si2B13Nb3Cu1 1.55 9k 12.8 18 [258,260]
Fe56Co7Ni7Zr10B20 890 0.96 18k 2.41 567gl 750 [132]
Fe60Co3Ni7Zr10B20 870 5 [132]
Fe49Co14Ni7Zr10B20 895 11 [132]
Fe46Co17Ni7Zr10B20 905 12 [132]
Fe4.5Co70.5Si10B15 0.88 70k 1.2 688gl 0 21 1.47 [193,194,218]
Fe4Co67Mo1Si17B11 0.55 100k 0.3 483 < 0.2 1.35 [25]
Fe2Co74Mn4Si11B9 1.0 2k 1.0 753 < 0.2 1.15 [25]
Fe88.65Co1.35Zr7B3 1.65 27k 4.2 0 19 [193]
Fe88.2Co1.8Zr7B2Cu1 1.70 48k 4.2 ÿ0.1 12 0.53 [194]
Fe89.55Ni0.45Zr7B3 1.62 34k 3.5 21 [193]
Fe6Co74B20 1.18 2.8 700g < 0.4 [218]
Fe3Co72P16Al3B6 0.63 1.0 600g 0 573 [218]
1
Fe39Ni39Mo2Si12B8 0.8 20k 2.0 533 8 1.35 [25]
Fe63.5Co35Cr1.5 2.42 10k 80 0.28 [32]
Fe50Co50 2.45 5k 160 0.07 [32]
Fe49Co49V2 2.40 60k 16 0.27 [32]
Fe67Co18Si1B14 1.80 1.5k 5.0 823 35 1.23 [25]
M.E. McHenry et al. / Progress in Materials Science 44 (1999) 291±433416
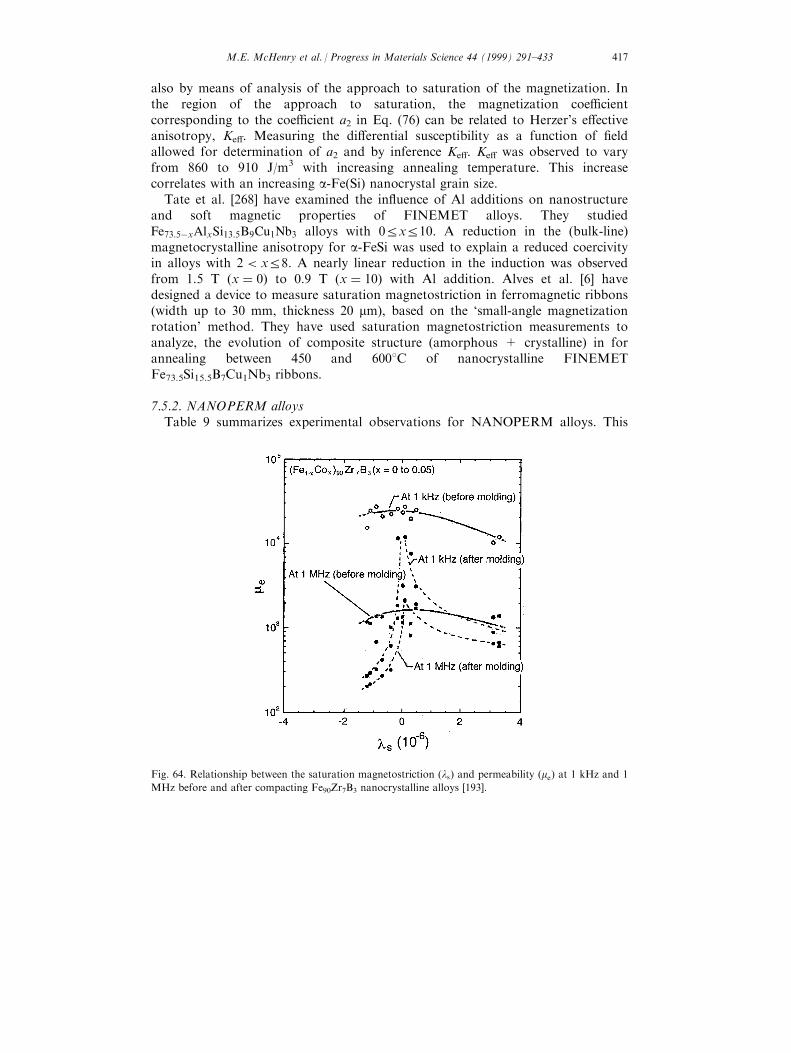
also by means of analysis of the approach to saturation of the magnetization. Inthe region of the approach to saturation, the magnetization coe�cientcorresponding to the coe�cient a2 in Eq. (76) can be related to Herzer's e�ectiveanisotropy, Ke�. Measuring the di�erential susceptibility as a function of ®eldallowed for determination of a2 and by inference Ke�. Ke� was observed to varyfrom 860 to 910 J/m3 with increasing annealing temperature. This increasecorrelates with an increasing a-Fe(Si) nanocrystal grain size.
Tate et al. [268] have examined the in¯uence of Al additions on nanostructureand soft magnetic properties of FINEMET alloys. They studiedFe73:5ÿxAlxSi13:5B9Cu1Nb3 alloys with 0RxR10. A reduction in the (bulk-line)magnetocrystalline anisotropy for a-FeSi was used to explain a reduced coercivityin alloys with 2 < xR8. A nearly linear reduction in the induction was observedfrom 1.5 T (x � 0) to 0.9 T (x � 10) with Al addition. Alves et al. [6] havedesigned a device to measure saturation magnetostriction in ferromagnetic ribbons(width up to 30 mm, thickness 20 mm), based on the `small-angle magnetizationrotation' method. They have used saturation magnetostriction measurements toanalyze, the evolution of composite structure (amorphous + crystalline) in forannealing between 450 and 6008C of nanocrystalline FINEMETFe73.5Si15.5B7Cu1Nb3 ribbons.
7.5.2. NANOPERM alloysTable 9 summarizes experimental observations for NANOPERM alloys. This
Fig. 64. Relationship between the saturation magnetostriction (ls) and permeability (me) at 1 kHz and 1
MHz before and after compacting Fe90Zr7B3 nanocrystalline alloys [193].
M.E. McHenry et al. / Progress in Materials Science 44 (1999) 291±433 417
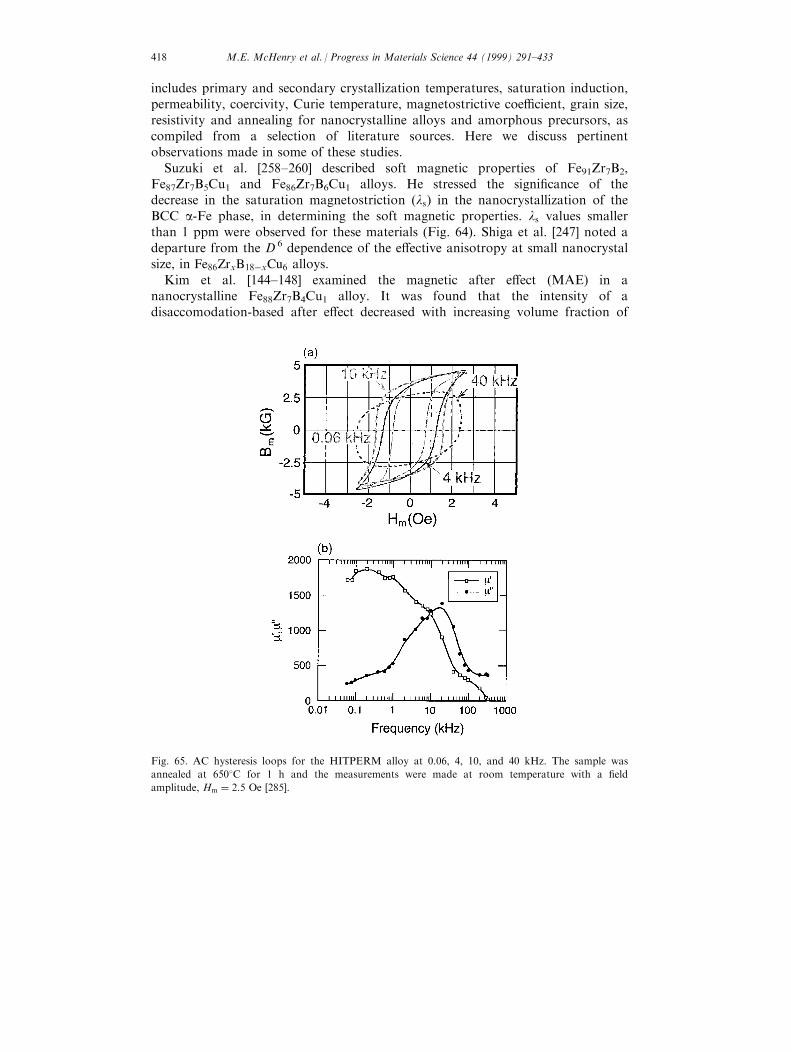
includes primary and secondary crystallization temperatures, saturation induction,permeability, coercivity, Curie temperature, magnetostrictive coe�cient, grain size,resistivity and annealing for nanocrystalline alloys and amorphous precursors, ascompiled from a selection of literature sources. Here we discuss pertinentobservations made in some of these studies.
Suzuki et al. [258±260] described soft magnetic properties of Fe91Zr7B2,Fe87Zr7B5Cu1 and Fe86Zr7B6Cu1 alloys. He stressed the signi®cance of thedecrease in the saturation magnetostriction (ls) in the nanocrystallization of theBCC a-Fe phase, in determining the soft magnetic properties. ls values smallerthan 1 ppm were observed for these materials (Fig. 64). Shiga et al. [247] noted adeparture from the D 6 dependence of the e�ective anisotropy at small nanocrystalsize, in Fe86ZrxB18ÿxCu6 alloys.
Kim et al. [144±148] examined the magnetic after e�ect (MAE) in ananocrystalline Fe88Zr7B4Cu1 alloy. It was found that the intensity of adisaccomodation-based after e�ect decreased with increasing volume fraction of
Fig. 65. AC hysteresis loops for the HITPERM alloy at 0.06, 4, 10, and 40 kHz. The sample was
annealed at 6508C for 1 h and the measurements were made at room temperature with a ®eld
amplitude, Hm � 2:5 Oe [285].
M.E. McHenry et al. / Progress in Materials Science 44 (1999) 291±433418
the nanocrystalline a-Fe phase. The after-e�ect was therefore attributed to theresidual amorphous phase.
Zhou and He [303] measured the e�ective magnetic anisotropy constant, Ke�,using ®ts of the law of approach to saturation of the magnetization for Fe89Zr7B4
nanocrystalline soft magnetic alloys. Ke� between 879 and 1038 J/m3 werereported for materials having 14-20 nm grains. A D 6 law was not observed forthese materials. Suzuki et al. [263] have studied the structure, grain size andvolume fraction of the residual amorphous phase for an amorphous Fe91Zr7B2
alloy annealed for 60±105 s at temperatures between 823 and 973 K. He has usedhis data to construct time±temperature-transformation curves for the coercivityand permeability of these nanocrystalline alloys. The highest permeability (31,000)and lowest coercivity (4.2 A/m) was observed for an alloy annealed at 923 K for60 s having a nanocrystalline grain size and 035% volume fraction of the residualamorphous phase. These alloys showed Ke� to scale like D 3. This deviation fromthe D 6 dependence was explained in terms of a reduced dimensionality (i.e.between 2 and 3) within Ho�mann's ripple theory of the magnetic anisotropy.This reduced d is attributed to in-plane magnetic alignment.
Garcia-Tello et al. [64,65] have examined the compositional dependence of thee�ective magnetic anisotropy in Fe93ÿxZr7BxCuy (x � 6±8 and y � 0±2)nanocrystalline alloys. They conclude that an enhancement in soft magneticproperties occurs due to two factors: (1) low values of e�ective anisotropyassociated with the onset of nanocrystallization and (2) decrease in the saturationmagnetostriction. Cu additions are postulated as increasing the intergranularcoupling due to a larger number of a-Fe nanocrystals in a coupled unit. Thispresumably re¯ects the role of Cu in the a-Fe nucleation process.
7.5.3. HITPERM alloysWillard et al. [284] have measured permeability in an Fe44Co44Zr7B4Cu1
HITPERM sample. The sample was prepared as a laminate in a toroidalgeometry, and then annealed at 6008C to promote primary crystallization. ACpermeability measurements were performed with a ®eld amplitude of 2.5 Oe. Fig.65(a) illustrates low ®eld amplitude (Hm � 2:5 Oe) hysteresis loops measured atAC frequencies of 0.06, 4, 10, and 40 kHz, respectively. These are reasonably well®t by using a Raleigh loop model for maximum ®elds less than the AC coercivity.In the phenomenological Raleigh loop model, the hysteretic magnetic response canbe modeled as:
B2Bm � mi�H2Hm�2n�H2Hm �2 �77�
where Hm is the AC ®eld amplitude, Bm is the induction at Hm, mi is the initialpermeability and n � @mi=dH. The hysteretic contribution to the core loss increasesas H 3
m until saturation. Field annealing during primary crystallization, shouldpromote square loops and increase the low ®eld induction of the material. Withthe low coercivity up to high frequencies, these materials show great promise ifproperly optimized for many of the applications being pursued with FINEMET
M.E. McHenry et al. / Progress in Materials Science 44 (1999) 291±433 419
and NANOPERM. More signi®cantly, many of the high temperature applicationsdiscussed in Section 8 do not have as stringent requirements for permeabilities.Finally, it is well know that permeability, magnetostrictive coe�cents, etc.decrease as a function of temperature, further buoying the possibility ofHITPERM as a high temperature material.
Fig. 65(b) illustrates the frequency dependence of the real and imaginarycomponents of the complex permeability, m 0 and m 00, respectively. m 00 re¯ects thepower loss due to eddy currents and hysteretic response. The maximumpermeability for this material was determined to be 1800. m 00�T � peaks at afrequency of 020 kHz. The high peak frequency is thought to be re¯ective of thehigher resistivity in the nanocrystalline materials than that of the conventionalalloys and the AC losses re¯ect domain wall in a viscous medium. The largerresistivity (re � 50 mO cm at 300 K) extends the large permeability to higherfrequencies where eddy currents (classical and those due to domain wall motion)dominate the losses. The resistivity of the nanocrystalline materials is intermediatebetween the amorphous precursor and crystalline materials of similar composition.The resistivity is a signi®cant term in eddy current related damping of domainwall motion.
Iwanabe et al. [134] have studied nanocrystalline �Fe1ÿxCox�88Hf7B4Cu1 alloys ascandidates of soft magnetic materials for internal generators in a MORE electricaircraft. The materials are to be used in a high temperature atmosphere (500±6008C) and are expected to have (a) a 2 T or higher induction at the workingtemperature, 5008C; (b) thermal stability at 6008C for 5000 h; (c) core losses lessthan 480 W/kg at 5 kHz and 5008C. The ferromagnetic exchange length of anequiatomic ordered Fe±Co alloy was estimated as 46 nm by assuming A �1:7� 10ÿ11 J/m and K = 8 kJ/m3. If a larger anisotropy is assumed (for a 30%Co alloy, i. e. K025 kJ/m3), but all other parameters are equivalent to theequiatomic alloy, an exchange length of 26 nm is predicted. The two numbersbracket Herzer's estimate of 35 nm for Fe±Si alloy. For grain smaller than theexchange length a random anisotropy model should be considered. Here theanisotropy is replaced with the e�ective anisotropy that is a statistical (randomwalk) average over grains coupled within an exchange length. The Herzer analysispredicts that a material with a 030 nm grain size should be expected to have an0100 A/m coercivity, which is comparable with Iwanabe's data. Coercivities onthe order of 10ÿ2 A/m are predicted for 10 nm particles suggesting that furtherre®nement of grain size could result in even softer magnets.
8. Applications of amorphous and nanocrystalline materials
8.1. Amorphous materials
Luborsky [181,182] surveyed potential magnetic application of amorphousalloys. The key bene®cial feature of amorphous alloys lied in their low losses butthis was at the price of lower inductions (see also Refs.[66,221,227]). The standard
M.E. McHenry et al. / Progress in Materials Science 44 (1999) 291±433420
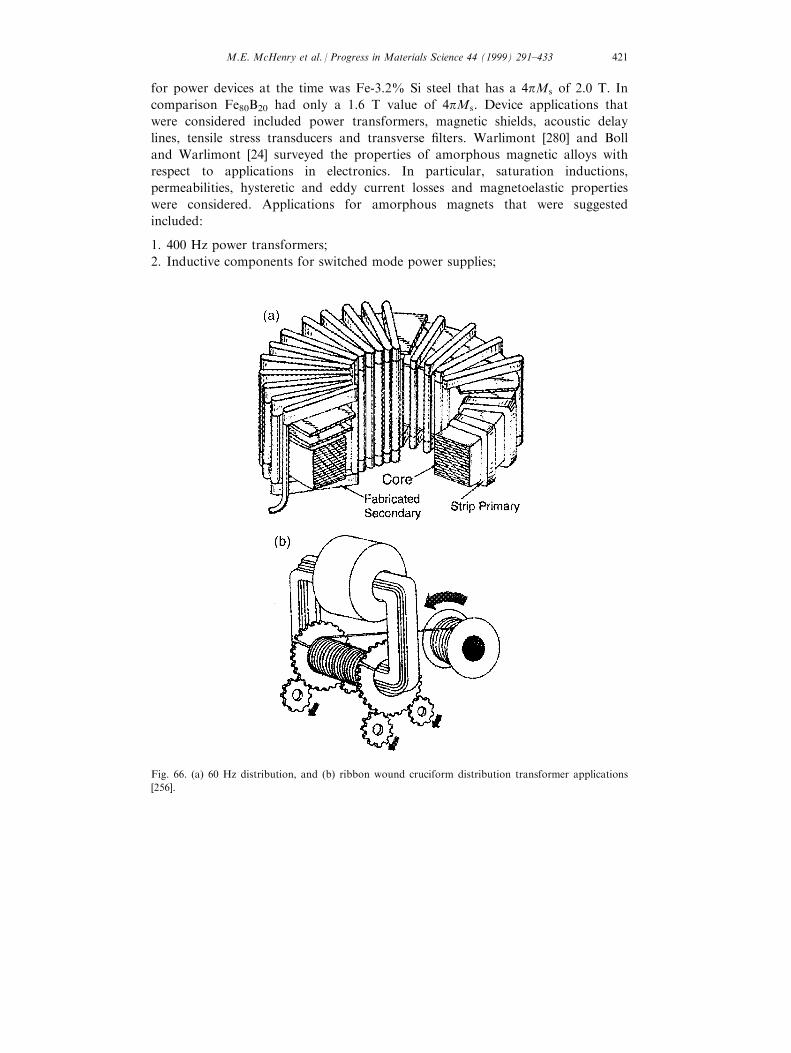
for power devices at the time was Fe-3.2% Si steel that has a 4pMs of 2.0 T. In
comparison Fe80B20 had only a 1.6 T value of 4pMs. Device applications that
were considered included power transformers, magnetic shields, acoustic delay
lines, tensile stress transducers and transverse ®lters. Warlimont [280] and Boll
and Warlimont [24] surveyed the properties of amorphous magnetic alloys with
respect to applications in electronics. In particular, saturation inductions,
permeabilities, hysteretic and eddy current losses and magnetoelastic properties
were considered. Applications for amorphous magnets that were suggested
included:
1. 400 Hz power transformers;
2. Inductive components for switched mode power supplies;
Fig. 66. (a) 60 Hz distribution, and (b) ribbon wound cruciform distribution transformer applications
[256].
M.E. McHenry et al. / Progress in Materials Science 44 (1999) 291±433 421
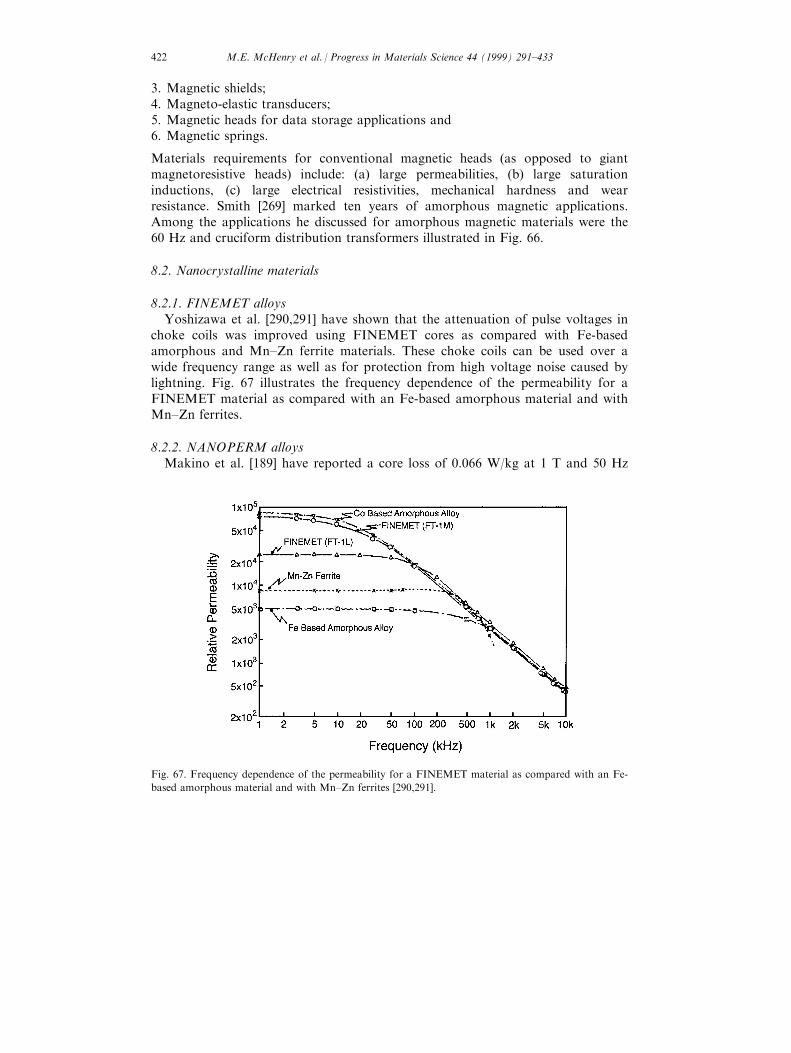
3. Magnetic shields;4. Magneto-elastic transducers;5. Magnetic heads for data storage applications and6. Magnetic springs.
Materials requirements for conventional magnetic heads (as opposed to giantmagnetoresistive heads) include: (a) large permeabilities, (b) large saturationinductions, (c) large electrical resistivities, mechanical hardness and wearresistance. Smith [269] marked ten years of amorphous magnetic applications.Among the applications he discussed for amorphous magnetic materials were the60 Hz and cruciform distribution transformers illustrated in Fig. 66.
8.2. Nanocrystalline materials
8.2.1. FINEMET alloysYoshizawa et al. [290,291] have shown that the attenuation of pulse voltages in
choke coils was improved using FINEMET cores as compared with Fe-basedamorphous and Mn±Zn ferrite materials. These choke coils can be used over awide frequency range as well as for protection from high voltage noise caused bylightning. Fig. 67 illustrates the frequency dependence of the permeability for aFINEMET material as compared with an Fe-based amorphous material and withMn±Zn ferrites.
8.2.2. NANOPERM alloysMakino et al. [189] have reported a core loss of 0.066 W/kg at 1 T and 50 Hz
Fig. 67. Frequency dependence of the permeability for a FINEMET material as compared with an Fe-
based amorphous material and with Mn±Zn ferrites [290,291].
M.E. McHenry et al. / Progress in Materials Science 44 (1999) 291±433422
for nanocrystalline Fe86Zr7B6Cu1. These values were shown to compare favorablywith amorphous Fe78Si9B13 and crystalline Fe-3.5% Si steels used as transformercore materials, as were the saturation inductions and permeabilities. Theysuggested these materials for applications as transformer core materials, includinghigh frequency transformers, in which amorphous Fe±Si±B alloys have found aniche.
Makino et al. [193] have discussed the advantages of thermal stability andhigher inductions of NANOPERM materials for magnetic device applications.Nanocrystalline alloys ®lms have been proposed as core materials for thin-®lmmagnetic heads as well as high frequency transformers and inductors. Makino etal. [194,195] have enumerated applications for NANOPERM alloys as including:
1. power transformers;2. common-mode choke coils;3. pulse-transformers; and4. ¯ux gate magnetometers.
NANOPERM has permeabilities of 1:6� 105 which are comparable toFINEMET alloys and zero magnetostrictive Co-based amorphous alloys.Saturation inductions of more than 1.57 T are comparable or exceedingamorphous Fe-based alloys.
Naitoh et al. [213] have described the application of NANOPERM alloys tochoke coils. A choke coil is an active ®lter used to prevent signal distortion in thereactor elements of phase modifying equipment. They provide line currentcorrections in all current signals. The core material of a choke coil needs largesaturation induction, Bs and low core losses as well as small magnetostrictivecoe�cients. NANOPERM having Bs values comparable to amorphous Fe±Si±B[89] and lower losses allows for signi®cant reduction of the core volume andconsequently the choke coil dimensions. Fig. 68 shows a schematic of a laminatedtransformer core and (b) toroidal choke coil core.
8.2.3. HITPERM alloysFeCo alloys have ®gured prominently in high temperature magnetic applications
in space power systems [11,36]. Keuser et al. [141] reviewed magnetic alloys forapplications in high temperature space power systems. More recently, Weichold etal. [223,283] have surveyed materials (bulk materials) for 300±5008C applicationsas magnetic components. Applications included core materials and winding wiresfor audio and radio frequency transformers. Alloys based on Fe±Co (Permendurand Supermendur) ®gured prominently in their analysis. The development of hightemperature soft magnetic materials for jet engine applications is at the forefrontof current development needs. The goal of developing a more electric plane [242]is driven by the strong impetus for weight reduction and performanceenhancement associated with replacement of ¯uid systems used for cooling withelectronic systems and air cooling. These electronic systems have components inwhich magnetic materials ®gure prominently. This necessitates the development ofmagnets capable of operating at signi®cantly higher temperatures.
M.E. McHenry et al. / Progress in Materials Science 44 (1999) 291±433 423
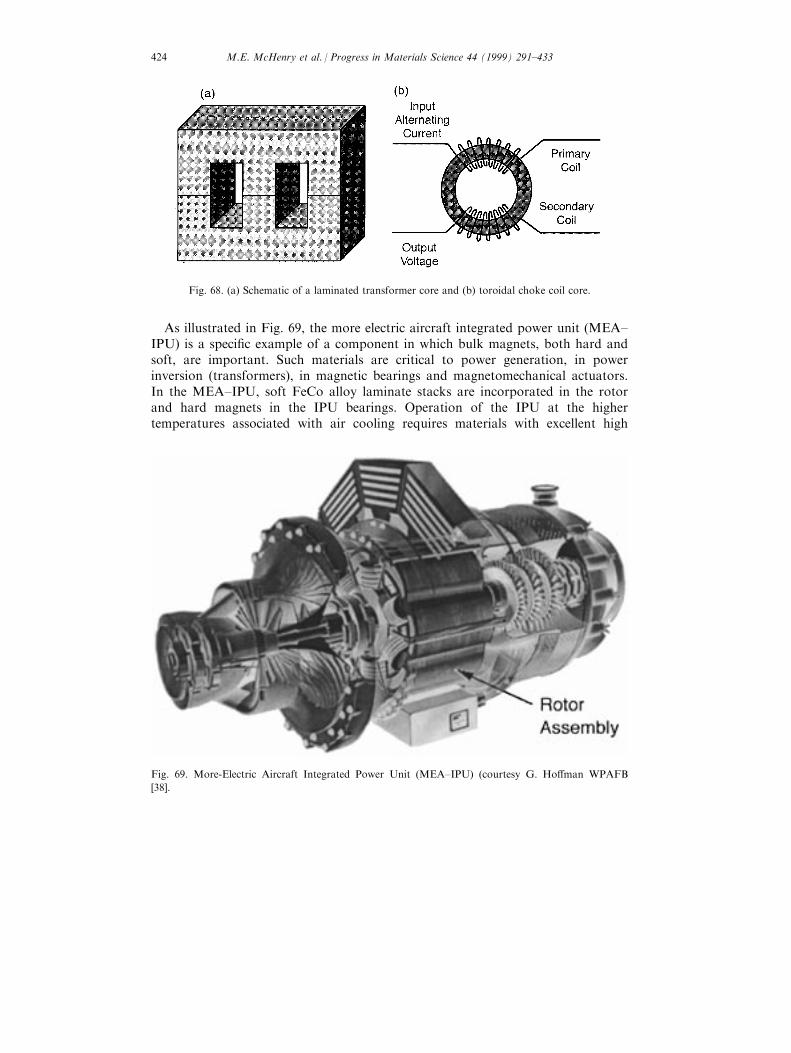
As illustrated in Fig. 69, the more electric aircraft integrated power unit (MEA±IPU) is a speci®c example of a component in which bulk magnets, both hard andsoft, are important. Such materials are critical to power generation, in powerinversion (transformers), in magnetic bearings and magnetomechanical actuators.In the MEA±IPU, soft FeCo alloy laminate stacks are incorporated in the rotorand hard magnets in the IPU bearings. Operation of the IPU at the highertemperatures associated with air cooling requires materials with excellent high
Fig. 68. (a) Schematic of a laminated transformer core and (b) toroidal choke coil core.
Fig. 69. More-Electric Aircraft Integrated Power Unit (MEA±IPU) (courtesy G. Ho�man WPAFB
[38].
M.E. McHenry et al. / Progress in Materials Science 44 (1999) 291±433424
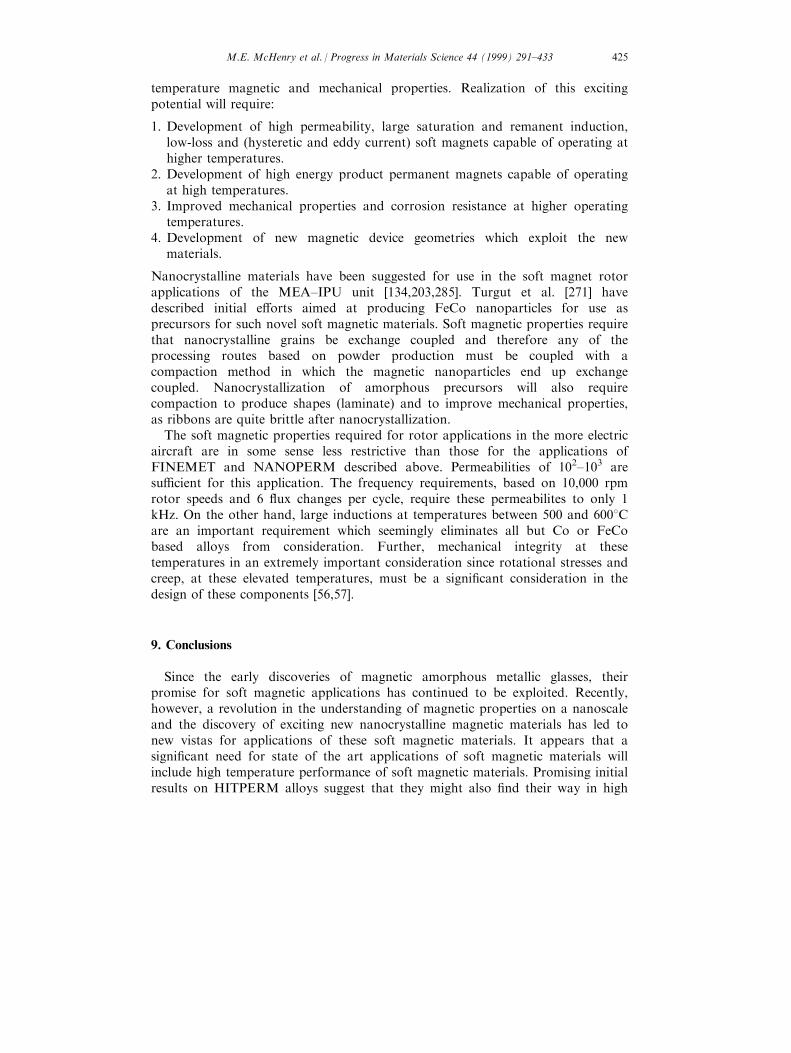
temperature magnetic and mechanical properties. Realization of this excitingpotential will require:
1. Development of high permeability, large saturation and remanent induction,low-loss and (hysteretic and eddy current) soft magnets capable of operating athigher temperatures.
2. Development of high energy product permanent magnets capable of operatingat high temperatures.
3. Improved mechanical properties and corrosion resistance at higher operatingtemperatures.
4. Development of new magnetic device geometries which exploit the newmaterials.
Nanocrystalline materials have been suggested for use in the soft magnet rotorapplications of the MEA±IPU unit [134,203,285]. Turgut et al. [271] havedescribed initial e�orts aimed at producing FeCo nanoparticles for use asprecursors for such novel soft magnetic materials. Soft magnetic properties requirethat nanocrystalline grains be exchange coupled and therefore any of theprocessing routes based on powder production must be coupled with acompaction method in which the magnetic nanoparticles end up exchangecoupled. Nanocrystallization of amorphous precursors will also requirecompaction to produce shapes (laminate) and to improve mechanical properties,as ribbons are quite brittle after nanocrystallization.
The soft magnetic properties required for rotor applications in the more electricaircraft are in some sense less restrictive than those for the applications ofFINEMET and NANOPERM described above. Permeabilities of 102±103 aresu�cient for this application. The frequency requirements, based on 10,000 rpmrotor speeds and 6 ¯ux changes per cycle, require these permeabilites to only 1kHz. On the other hand, large inductions at temperatures between 500 and 6008Care an important requirement which seemingly eliminates all but Co or FeCobased alloys from consideration. Further, mechanical integrity at thesetemperatures in an extremely important consideration since rotational stresses andcreep, at these elevated temperatures, must be a signi®cant consideration in thedesign of these components [56,57].
9. Conclusions
Since the early discoveries of magnetic amorphous metallic glasses, theirpromise for soft magnetic applications has continued to be exploited. Recently,however, a revolution in the understanding of magnetic properties on a nanoscaleand the discovery of exciting new nanocrystalline magnetic materials has led tonew vistas for applications of these soft magnetic materials. It appears that asigni®cant need for state of the art applications of soft magnetic materials willinclude high temperature performance of soft magnetic materials. Promising initialresults on HITPERM alloys suggest that they might also ®nd their way in high
M.E. McHenry et al. / Progress in Materials Science 44 (1999) 291±433 425
temperature soft magnetic applications. The playground of microstructuralengineering of soft magnetic properties will undoubtedly o�er new discoveries forfuture materials scientists and engineers.
Acknowledgements
MEM thanks the National Science Foundation for support through NYI awardDMR-9258450, grant award DMR-95000313 and grant award DMR-9803700.DEL acknowledges support from a NEDO grant. This material reviewed here isalso based in part on work supported by the CMU Data Strorage Systems Centerthrough the National Science Foundation under Grant No. ECD - 8907068.E�orts reviewed here have also been sponsored by the Air Force O�ce ofScienti®c Research, Air Force Material Command, USAF, under grant numberF49620-96-10454. The assistance of the CMU SURG program, and theparticipation of the CMU Buckyball Project members have been invaluable.
The authors acknowledge helpful discussions with Prof. Henry Piehler, Prof. W.Ed Wallace, Prof. Anthony Rollett, Prof. Sara Majetich, Prof. David Lambeth,Dr. R. C. O'Handley, Dr. Sury Sankar, Dr. John Henry Scott, Dr. Vince Harris,Mr. Mark Storch, Mr. Hiro Iwanabe, Dr. Bin Lu, Ms. Katie Gallagher, Mr.Vladimir Zabenkin, Mr. Zafer Turgut, Dr. Shaoyan Chu, Dr. Mei-Qing Huang.
References
[1] Akai H, Akai M, Blugel S, Zeller R, Dederichs PH. J Mag Mag Mat 1984;45:291.
[2] Alben R, Budnick J, Cargill III GS. In: Metallic glasses. Metals Park: OH:ASM, 1978. p. 304.
[3] Alben R, Becker JJ, Chi MC. J Appl Phys 1978;49:1653.
[4] Al-Haj M, Barry J, Olo®njana A. Mat Lett 1997;33:107.
[5] Allia P, Baricco M, Tiberto P, Vinai F. J Appl Phys 1993;74:3137.
[6] Alves F, Houe e P, Le crivain M, Mazaleyrat F. J Appl Phys 1997;81:4322.
[7] Aranda GR, Gonzalez J, Kulakowski K. J Appl Phys 1998;83:6341.
[8] Ayers JD, Konnert JH, Dantonio P, Pattnaik A, Vold CL, Jones HN. J Mat Sci 1995;30:4492.
[9] Ayers JD, Harris VG, Sprague JC, Elam WT. Appl Phys Lett 1994;64:974.
[10] Ayers JD, Harris VG, Sprague JC, Elam WT, Jones HN. Acta Mater 1998;46:1861.
[11] Barranger JP. NASA Technical Note, NASA TND-3693, 1966.
[12] Bean CP, Livingston JD. J Appl Phys 1959;30:120S.
[13] Benjamin JS, Bamford MS. Met Trans 1977;A8:1301.
[14] Bernal JD. Nature (London) 1960;185:68.
[15] Bernal JD. Liquids: structure properties, solid interactions. New York: Elsevier, 1965.
[16] Bertotti G, Ferrara E, Fiorillo F, Tiberto P. Mat Sci Eng 1997;A226±228:603.
[17] Bethune DS, Johnson RD, Salem JR, de Vries MS, Yannoni CS. Nature 1993;366:123.
[18] Bhatnagar AK, Bhanu Prasad B, Jagannathan R. Phys Rev 1984;B 29:4896.
[19] Bigot J, Lecaude N, Perron JC, Milan C, Ramiarinjaona C, Rialland JF. J Mag Mag Mat
1994;133:299.
[20] Birgeneau RJ, Tarvin JA, Shirane, G, Gyorgy EM, Sherwood, RC, Chen HS, et al. Phys Rev
1978;B18:2192.
[21] Bitoh T, Nakazawa M, Makino A, Inoue A, Masumoto T; J Appl Phys 1999;85:5127.
[22] Blatter A, Von Allmen M. Phys Rev Lett 1985;54:2103.
M.E. McHenry et al. / Progress in Materials Science 44 (1999) 291±433426
[23] Boettinger WJ. In: Kear BH, Giessen BC, Cohen M, editors. Rapidly solidi®ed amorphous and
crystalline alloys. New York: Elsevier, 1982.
[24] Boll R, Warlimont H. IEEE Trans Mag 1981;17:3053.
[25] Boll R. Soft magnetic metals and alloys. In: Buschow KHJ, editor. Materials science and technol-
ogy, a comprehensive treatment, vol. 3B, 1994, p. 399 [chapter 14].
[26] Boulos MI. Pure Appl Chem 1985;57:1321.
[27] Boulos MI. J High Temp Mat Process 1997;1:17.
[28] Bozorth RM. Ferromagnetism. New York: van Nostrand, 1951.
[29] Brown GW, Hawley ME, Markiewitz DJ, Spaepen F, Barth EP. J Appl Phys 1999;85:4415.
[30] Brzozka K, Slawska-Waniewska A, Jezuita K. J Mag Mag Mat 1996;160:255.
[31] Buttino G, Poppi M. J Mag Mag Mat 1997;170:211.
[32] Chen CW. Magnetism and metallurgy of soft magnetic Materials. New York: Dover
Publications, 1986.
[33] Chen HS. Rep Prog Phys 1980;43:353.
[34] Chien CL. Phys Rev 1978;B 18:1003.
[35] Chikazumi S. Physics of magnetism. Malabar, FL: Kreiger, 1978.
[36] Chu S-Y, Huang M-Q, Kline C, McHenry ME, Cross JO, Harris VG. J Appl Phys 1999;85:6031.
[37] Coey JMD. Rare-earth iron permanent magnets. Oxford: Oxford Science Publications,
Clarendon Press, 1996.
[38] Colegrove PG. AIAA paper No. 93-1188, 1993, p. 5.
[39] Conde CF, Conde A. Mat Lett 1994;21:409.
[40] Corb BW, Grant NJ, O'Handley RC. J Appl Phys 1982;53:7728.
[41] Corb BW. Phys Rev B 1985;31:2521.
[42] Cserei A, Jiang J, Aubertin F, Gonser U. J Mat Sci 1994;29:1213.
[43] Cullity BD. Introduction to magnetic materials. Reading, MA: Addison-Wesley, 1972.
[44] Cullity BD. Elements of X-ray di�raction. Reading, MA: Addison-Wesley, 1978.
[45] Dahlgren M, Grossinger R, Hernando A, Holzer D, Knobel M, Tiberto P. J Mag Mag Mat
1996;160:247.
[46] Davies HA. In: Steed S, Warlimont H, editors. Rapidly quenched metals, vol. 1. Amsterdam:
North Holland, 1985.
[47] Deriu A, Malizia F, Ronconi F, Vittori-Antisari M, King SM. J Appl Phys 1996;79:2296.
[48] Dravid VP, Teng MH, Host JJ, Elliot BR, Johnson DL, Mason TO, et al. US Patent No. 5472
749, 1995.
[49] Dravid VP, Host JJ, Teng MH, Elliot BR, Hwang J-H, Johnson DL, et al. Nature (London)
1995;374:602.
[50] Duhaj P, Svec P, Janickovic D, Matko I. Mat Sci Eng 1991;A133:398.
[51] Duwez P. J Am Inst Metall Eng 1951;191:765.
[52] Duwez P, Willens RH, Klement W. J Appl Phys 1960;31:1136.
[53] Duwez P. Trans Am Soc Met 1967;60:607.
[54] Duwez P. Ann Rev Mat Sci 1976;6:83.
[55] Efthimiadis KG, Achilleos CA, Chadjivasiliou SC, Tsoukalas IA. J Mag Mag Mat 1997;171:141.
[56] Fingers RT, Kozlowski G. J Appl Phys 1997;81:4110.
[57] Fingers RT, Coate JE, Dowling NE. J Appl Phys 1999;85:6037.
[58] Fujii Y, Fujita H, Seki A, Tomida T. J Appl Phys 1991;70:6241.
[59] Fujimori H, Morita H, Obi Y, Ohta S. In: Levy RA, Hasegawa R, editors. Amorphous magnet-
ism II. New York: Plenum Press, 1977. p. 393.
[60] Gallagher K, Johnson F, Kirkpatrick E, Scott JH, Majetich S, McHenry ME. IEEE Trans Mag
1996;32:4842.
[61] Gallagher KA, Willard MA, Zabenkin VN, Laughlin DE, McHenry ME. J Appl Phys
1999;85:5130.
[62] Gao YQ, Wang W, Zheng FQ, Liu X. J Non-Cryst Solids 1986;81:135.
[63] Gao YQ, Wang W. J Non-Cryst Solids 1986;81:129.
[64] Garcia-Tello P, Blanco JM, Zuberek R, Murillo N, Gonzalez J, Slawska-Waniewska A, et al.
IEEE Trans Mag 1997;33:3919.
M.E. McHenry et al. / Progress in Materials Science 44 (1999) 291±433 427
[65] Garcia Tello P, Blanco JM, Murillo N, Gonzalez J, Zuberek R, Slawska-Waniewska A, et al. J
Appl Phys 1998;83:6338.
[66] Gilman JJ. Phys Today 1975;28:46.
[67] Gleiter H. Prog Mat Sci 1989;33:223.
[68] Gomez-Polo C, Holzer D, Multigner M, Navarro E, Agudo P, Hernando A, Vazguez M. Phys
Rev B 1996;53:3392.
[69] Gonzalez J, Murillo N, Blanco JM, Gonzalez JM, Kulik T. J Appl Phys 1994;76:1131.
[70] Gonzalez JM, Murillo N, Gonzalez J, Blanco JM, Echeberria J. J Mat Res 1996;11:512.
[71] Gorria P, Orue I, Plazaola F, Fernandez-Gubieda ML, Barandiaran J. IEEE Trans Mag
1993;29:2682.
[72] Gorria P, Garitaonandia JS, Barandiaran JM. J Phys Condens Mat 1996;8:5925.
[73] Grabias A, Kopcewicz M. Mat Sci Forum 1998;269±272:725.
[74] Graf T, Kopcewicz M, Hesse J. J Mag Mag Mat 1995;140±144:423.
[75] Graf T, Kopcewicz M, Hesse J. Nanostructured Mat 1995;6:937.
[76] Gubanov VA, Liechtenstein AI, Postnikov AV. Magnetism and the electronic structure of crys-
tals. Berlin: Springer±Verlag, 1992.
[77] Guinier A, Dexter DL. X-ray studies of materials. New York: Interscience Publishers, 1963.
[78] Hajko V, Csach K, Pan S, Danilenko N. Nanostructured Mat 1997;8:961.
[79] Hampel G, Pundt A, Hesse J. J Phys Condens Matter 1992;4:3195.
[80] Handrich K. Phys Stat Solidi 1969;32:K55.
[81] Haruyama O, Asahi N. Mat Sci Forum 1992;88-90:333.
[82] Harris R, Plischke M, Zuckermann MJ. Phys Rev Lett 1973;31:160.
[83] Harris R, Zobin D. J Phys F: Metal Phys 1977;7:337.
[84] Hasegawa R. J Appl Phys 1970;41:4096.
[85] Bertotti G. J Non-cryst Solids 1984;61/62:725.
[86] Hasegawa R. J Appl Phys 1985;57:2110.
[87] Hasegawa N, Saito M. IEICE Technical Report, MR89-12, 1989.
[88] Hasegawa N, Kataoka N, Fujimori H, Saito M. J Appl Phys 1991;70:6253.
[89] Hasegawa N, Saito M, Kataoka N, Fujimori H. J Mat Eng Perf 1993;2:181.
[90] Bertolli G, Makino A, Inoue A, Masumoto T. J Mag Mag Mat 1996;160:249.
[91] Herber RH. Mossbauer e�ect. In: McGraw-Hill encyclopedia of physics. New York: McGraw-
Hill, 1982.
[92] Hernando A, et al. Symposium on Magnetic Properties of Amorphous Metals. Amsterdam:
North-Holland, 1987.
[93] Hernando A, et al. Rapidly solidi®ed alloys. Libermann, 1988.
[94] Hernando A, Kulik T. Phys Rev B 1994;49:7064.
[95] Hernando A, Navarro I. In: Hadjipanyis GC, Siegel RW, editors. Nanophase materials. The
Netherlands: Kluwer, 1994. p. 703.
[96] Hernando A, et al. Phys Rev B 1995;51:3281.
[97] Hernando A, Vazquez M, Kulik T, Prados C. Phys Rev B 1995;51:3581.
[98] Hernando A, Marin P, Vazquez M, Herzer G. J Mag Mag Mat 1998;177±181:959.
[99] Herzer G, Hilzinger HR. J Mag Mag Mat 1986;62:143.
[100] Herzer G, Hilzinger HR. Physica Scripta 1989;39:639.
[101] Herzer G. IEEE Trans Mag 1989;25:3327.
[102] Herzer G. IEEE Trans Mag 1990;26:1397.
[103] Herzer G. Mat Sci Eng A 1991;133:1.
[104] Herzer G. J Mag Mag Mat 1992;112:258.
[105] Herzer G, Warlimont H. Nanostructured Mat 1992;1:263.
[106] Herzer G. IEEE Trans Mag 1995;26:1397.
[107] Herzer G. Scripta Metall Mater 1995;33:1741.
[108] Herzer G. In: Buschow KHJ, editor. Handbook of magnetic materials, vol. 10. Amsterdam:
Elsevier Science, 1997. p. 415 [chapter 3].
[109] Hihara T, Onodera H, Sumiyama K, Suzuki K, Kasuta A, Nishina Y, et al. Jpn J Appl Phys
1994;33:L24.
M.E. McHenry et al. / Progress in Materials Science 44 (1999) 291±433428
[110] Hilzinger HR, Hillmann H, Mager A. Phys Stat Sol 1979;A55:763.
[111] Ho�mann H. IEEE Trans Mag 1968;4:32.
[112] Ho�mann H. IEEE Trans Mag 1973;9:17.
[113] Ho�mann H. IEEE Trans Mag 1979;15:1215.
[114] Ho�mann H, Fujii T. J Mag Mag Mat 1993;128:395.
[115] Ho�mann B, Kronmuller H. Nanostructured Mat 1995;6:961.
[116] Hono K, Inoue A, Sakurai T. Appl Phys Lett 1991;58(19):2180.
[117] Hono K, Hiraga K, Wang Q, Inoue A, Sakurai T. Acta Metall Mater 1992;40:2137.
[118] Hono K, Zhang Y, Tsai AP, Inoue A, Sakurai T. Scripta Metall Mater 1995;32:131.
[119] Host JJ, Teng MH, Elliot BR, Hwang J-H, Mason TO, Johnson DL, et al. J Mat Res
1997;12(5):1268.
[120] Host JJ, Block JA, Parvin K, Dravid VP, Alpers JL, Sezen T, et al. J Appl Phys 1998;83:793.
[121] Inoue A, Zhang T, Masumoto T. Mat Trans JIM 1989;30:965.
[122] Inoue A, Yamanoto H, Masumoto T. Mat Trans JIM 1990;31:1021.
[123] Inoue A, Gook JS. Mat Trans JIM 1995;36:1180.
[124] Inoue A, Gook JS. Mat Trans JIM 1995;36:1282.
[125] Inoue A, Shinohara Y, Gook JS. Mat Trans JIM 1995;36:1427.
[126] Inoue A, Miyauchi Y, Makino A, Masumoto T. Mat Trans JIM 1996;37:78.
[127] Inoue A, Gook JS. Mat Trans JIM 1996;37:32.
[128] Inoue A, Park RE. Mat Trans JIM 1996;37:1715.
[129] Inoue A, Miyauchi Y, Makino A, Masumoto T. Mat Trans JIM 1996;37:78.
[130] Inoue A, Takeuchi A, Zhang T, Murakami A, Makino A. IEEE Trans Mag 1996;32:4866.
[131] Inoue A, Nishiyama N, Matsuda T. Mat Trans JIM 1996;37.
[132] Inoue A, Zhang T, Itoi T, Takeuchi A. Mat Trans JIM 1997;38:359.
[133] Inoue A, Zhang T, Koshiba H, Makino A. J Appl Phys 1998;83:6326.
[134] Iwanabe H, Lu B, McHenry ME, Laughlin DE. J Appl Phys 1999;85B:4424.
[135] Johnson WL. Prog Mat Sci 1986;30:81.
[136] Kaneyoshi T. Amorphous magnetism. Boca Raton, FL: CRC Press, 1984.
[137] Kane SN, Bhagat N, Gupta A, Varga LK. J Mag Mag Mat 1997;167:241.
[138] Kataoka N, Inoue A, Masumoto T, Yoshizawa Y, Yamauchi K. Jpn J Appl Phys
1989;28:L1820.
[139] Kemeny T, Balogh J, Farkas I, Kaptas D, Kiss LF, Pusztai T, et al. J Phys Condens Matter
1998;10:L221.
[140] Kempter K, Ho�mann H. Phys Stat Sol 1969;34:237.
[141] Keuser PE, Pavlovic DM, Laue DH, Clark JJ, Spewock M. NASA Special Publication, NASA
SP-3043, 1967.
[142] Kim CS, Kim SB, Lee HM, Uhm YR, Kim KY, Noh TH, Ok HN. IEEE Trans Mag
1997;33:3790.
[143] Kim KS, Yu SC, Rao KV. J Appl Phys 1997;81:4649.
[144] Kim KS, Yu S-C, Kim K-Y, Noh T-H, Kang I-K. IEEE Trans Mag 1993;29:2679.
[145] Kim KY, Noh TH, Lee YH, Kang IK, Kang T. J Appl Phys 1993;73:6594.
[146] Kim KY, Noh TH, Kang IK, Kang T. Mat Sci Eng 1994;A179/A180:552.
[147] Kim SH, Matsuura M, Sakurai M, Suzuki K. Jpn J Appl Phys 1993;32:676.
[148] Kim SH, Pi WK, Noh TH, Kim HJ, Kang IK. J Appl Phys 1993;73:6591.
[149] Kissinger HE. J Res NBS 1956;57:217.
[150] Kneller EF, Hawig R. IEEE Trans Mag 1991;27:3588.
[151] Knoble M, Sinnecker JP, Sato Turtelli R, Rechenberg HR, Grossinger R. J Appl Phys
1993;73:6603.
[152] Kobe S. Phys Stat Solidi 1970;41:K13.
[153] Kobe S, Handrich K, Fiz. Tverd Tela (Leningard) 1971;13:887 [Sov Phys-Solid State
1971;13:734].
[154] Koch CC. Ann Rev Mat Sci 1986;30:81.
[155] Koch CC. Mat Sci Forum 1992;88±90:243.
[156] Kohlbrecher J, Wiedenmann A, Wollenberger H. Physica B 1995;213/214:579.
M.E. McHenry et al. / Progress in Materials Science 44 (1999) 291±433 429
[157] Kojima A, Horikiri H, Kamamura Y, Makino A, Inoue A, Matsumoto T. Mat Sci Eng
1994;A179/A180:511.
[158] Kojima A, Horikiri H, Makino A, Kawamura Y, Inoue A, Matsumoto T. Mat Trans JIM
1995;36:945.
[159] Kopcewicz M. Struct Chem 1991;2:313.
[160] Kopcewicz M, Grabias A, Nowicki P, Mat Sci Eng A 1997;A226±228:515.
[161] Kopcewicz M, Grabias A. J Appl Phys 1996;80:3422.
[162] Kopcewicz M, Grabias A, Nowicki P, Williamson DL. J Appl Phys 1996;79:993.
[163] Kopcewicz M, Grabias A, Nowicki P. Mat Sci Eng 1997;A226±228:515.
[164] Kopcewicz M, Grabias A, Williamson DL. J Appl Phys 1997;82:1747.
[165] Kopcewicz M, Grabias A, Idzikowski B. J Mag Mag Mat 1998;177±181:1434.
[166] Kopcewicz M, Grabias A, Skorvanek I. J Appl Phys 1998;83:935.
[167] Koshiba H, Inoue A, Makino A. Nanostructured Mat 1997;8:997.
[168] Koster U, Schunemann U, Blank-Bewersdor� M, Brauer S, Sutton M, Stephenson GB. Mat Sci
Eng 1991;A133:611.
[169] Koster U, Meinhardt J. Mat Sci Eng 1994;A178:271.
[170] Kouvel JS. In: Berkowitz E, Kneller E, editors. Magnetism and metallurgy, vol. 2A. New York:
Academic Press, 1969. p. 523.
[171] Kratschmer W, Lamb LD, Fostiropoulos K, Hu�man DR. Nature 1990;347:354.
[172] Kraus L, Haslar V, Duhaj P, Svec P, Studnicka V. Mat Sci Eng 1997;A226±228:626.
[173] Kuhrt C, Schultz L. J Appl Phys 1993;73:6588.
[174] Kulik T. Mat Sci Eng 1992;A159:95.
[175] Kulik T, Hernando A, Vazquez M. J Mag Mag Mat 1994;133:310.
[176] Lanotte L, Iannotti V. J Appl Phys 1995;78:3531.
[177] Lee SE, Ra HY, Yim TH, Kim WT. Mat Sci Forum 1995;179±181:121.
[178] Lim SH, Pi WK, Noh TH, Kim HJ, Kang IK. J Appl Phys 1993;73:865.
[179] Lim SH, Pi WK, Noh TH, Kim HJ, Kang IK. J Appl Phys 1993;73:6591.
[180] Liu T, Gao YF, Xu ZX, Zhao ZT, Ma RZ. J Appl Phys 1996;80:3972.
[181] Luborsky FE. In: Levy RA, Hasegawa R, editors. Amorphous magnetism II. New York: Plenum
Press, 1997.
[182] Luborsky FE. IEEE Trans Mag 1978;14:1008.
[183] Luborsky FE. Amorphous metallic alloys. London: Butterworths, 1983.
[184] MacLaren JM, Crampin S, Vvedensky DD, Eberhart ME. Phys Rev Lett 1989;63:2586.
[185] MacLaren, JM, Schulthess TC, Butler WH, Sutton RA, McHenry ME. J Appl Phys
1999;85:4833.
[186] Mader S, Nowick AS. Appl Phys Lett 1965;7:57.
[187] Majetich SA, Artman JO, McHenry ME, Nuhfer NT, Staley SW. Phys Rev B 1993;48:16845.
[188] Majetich SA, Scott JH, Brunsman EM, McHenry ME, Nuhfer NT. In: Ruo� RS, Kadish KM,
editors. Fullerenes: physics, chemistry, and new directions VI. Pennington, NJ: The
Electrochemical Society, 1994. p. 1448.
[189] Makino A, Suzuki K, Inoue A, Masumoto T. Mat Trans JIM 1991;32:551.
[190] Makino A, Yamamoto Y, Hirotsu Y, Inoue A, Masumoto T. Mat Sci Eng 1994;A179/A180:495.
[191] Makino A, Suzuki K, Inoue A, Masumoto T. Mat Sci Eng 1994;A179/A180:127.
[192] Makino A, Suzuki K, Inoue A, Hirotsu Y, Masumoto T. J Mag Mag Mat 1994;133:329.
[193] Makino A, Inoue A, Masumoto T. Mat Trans JIM 1995;36:924.
[194] Makino A, Hatanai T, Naitoh Y, Bitoh T, Inoue A, Masumoto T. IEEE Trans Mag
1997;33:3793.
[195] Makino A, Hatanai T, Inoue A, Masumoto T. Mat Sci Eng 1997;A226±228:594.
[196] Malkinski L, Slawska-Waniewska A. J Mag Mag Mat 1996;160:273.
[197] Massalski T. Binary alloy phase diagrams, Materials Park, OH ASM International 1990.
[198] Malozemo� AP, Williams AR, Moruzzi VL. Phys Rev B 1984;29:1620.
[199] Matsuura M, Sakurai M, Kim SH, Suzuki K, Tomida T. J Phys Condens Matter 1995;7:7087.
[200] Mazaleyrat F, Faugieres JC, Rialland JF. J Mag Mag Mat 1996;159:L33.
[201] McHenry ME, Majetich SA, De Graef M, Artman JO, Staley SW. Phys Rev B 1994;49:11358.
M.E. McHenry et al. / Progress in Materials Science 44 (1999) 291±433430
[202] McHenry ME, Gallagher K, Johnson F, Scott JH, Majetich SA. Recent advances in the chem-
istry and physics of fullernes and related materials. In: Kadish KM, Ruo� RS, editors. PV 96-10,
ECS Symposium Proceedings, Pennington, NJ, 1996. p. 703.
[203] McHenry ME, Subramoney S. New York: Wiley 1999 [in press].
[204] McHenry ME, Willard MA, Iwanabe H, Sutton RA, Turgut Z, Hsiao A, Laughlin DE. IUMRS
1998. Bull Mat Sci 1999 [in press].
[205] Mizushima T, Makino A, Inoue A. J Appl Phys 1998;83:6329.
[206] Moorjani K, D Coey JM. Magnetic glasses. Amsterdam: Elsevier, 1984.
[207] Moya J, Vazquez M, Cremaschi V, Arcondo B, Sirkin H. Nanostructure Mat 1997;8:611.
[208] MuÈ ller M, Mattern N, Illgen L. Z Metallkd 1991;82:895.
[209] MuÈ ller M, Mattern N, Illgen L. J Mag Mag Mat 1992;112:263.
[210] Murillo N, Gonzalez J, Blanco JM, Gonzalez JM. J Appl Phys 1996;79:5465.
[211] Naohara T. Acta Metall 1998;46:397.
[212] Naitoh Y, Bitoh T, Hatanai T, Makino A, Inoue A. J Appl Phys 1998;83:6332.
[213] Navarro I, Hernando A. J Mag Mag Mat 1994;133:306.
[214] Neel L. J Phys Radium 1954;15:225.
[215] Noh TH, Lee MB, Kim HJ, Kang IK. J Appl Phys 1990;67:5568.
[216] Noh TH, Pi WK, Kim HJ, Kang IK. J Appl Phys 1991;69:5921.
[217] O'Handley RC. IEEE Trans Mag MAG 1976;12:942.
[218] O'Handley RC, Megusar J, Sun S-W, Hara Y, Grant NJ. J Appl Phys 1985;57:3563.
[219] O'Handley RC. J Appl Phys 1987;62:R15.
[220] O'Handley RC. In: Levy RA, Hasegawa R, editors. Amorphous magnetism II. New York:
Plenum Press, 1977. p. 379.
[221] Ohnuma M, Suzuki J, Funahashi S, Ishigaki T, Kuwano H, Hamaguchi Y. Physica B 1995;213/
214:582.
[222] Pandey K, Weichold MH, Palmer DW. IEEE Trans Magn MAG 1980;16:749.
[223] Park JR, Suh SJ, Kim KY, Noh TH. IEEE Trans Mag 1997;33:3799.
[224] Perepesko JH, Paik JS. In: Kear BH, Giessen BC, Cohen M, editors. Rapidly solidi®ed amor-
phous and crystalline alloys. New York: Elsevier, 1982.
[225] Pfeifer F, Radelo� C. J Mag Mag Mat 1980;19:190.
[226] Polk DE, Giessen BC, Gardner FS. Mat Sci Eng 1976;23:309.
[227] Pradell T, Clavaguera N, Zhu J, Clavaguera-Mora MT. J Phys Condens 1995;7:4129.
[228] Pundt A, Hampel G, Hesse J. J Phys Condens Matter 1992;87:65.
[229] Quigley RE. WPAFB, 1993.
[230] Rajkovic M, Buckley RA. Metal Sci 1981;15:21.
[231] Rixecker G, Schaaf P, Gonser U. J Phys Condens Matter 1992;4:10295.
[232] Rixecker G, Schaaf P, Gonser U. Phys Stat Solidi nA 1993;139:309.
[233] Russell KC, Aaronson HI. J Mat Sci 1991;10:1975.
[234] Saito Y, Okuda M, Yoshikawa T, Kasuya A, Nishina Y. J Phys Chem 1994;98:6696.
[235] Schafer M, Dietzmann G. J Mag Mag Mat 1994;133:303.
[236] Schaefer R, Hubert A, Herzer G. J Appl Phys 1991;69:5325.
[237] Schwarz RB, Johnson WL. Phys Rev Lett 1983;51:415.
[238] Schwarz RB, Koch CC. Appl Phys Lett 1986;49:146.
[239] Schwarz RB. Mat Sci Forum 1998;269-272:665.
[240] Scott JH, Majetich SA, Turgut Z, McHenry ME, Boulos M. In: Parker JC, editor.
Nanostructured materials. MRS Symposium Proceedings. Pittsburgh, PA: Materials Research
Society 1997;219:567.
[241] Scott JH, Turgut Z, Chowdary McHenry ME, Majetich SA. MRS Symposium Proceedings
1999;121:412.
[242] Scott JH, Chowdary K, Turgut Z, Majetch SA, McHenry ME. J Appl Phys 1999;85(8):4409.
[243] Shiga N, Kogiku F, Yukumoto M. Mat Trans JIM 1995;36:939.
[244] Skomski R, Coey JMD. Phys Rev B 1993;48:15812.
[245] Skorvanek I, O'Handley RC. J Mag Mag Mat 1995;140±144:467.
M.E. McHenry et al. / Progress in Materials Science 44 (1999) 291±433 431
[246] Slawska-Waniewska A, Gutowski M, Lachowicz HK, Kulik T, Matyja H. Phys Rev B
1992;46:14594.
[247] Slawska-Waniewska A, Munoz JS, Nowicki P. J Mag Mag Mat 1996;160:251.
[248] Slawska-Waniewska A, Zuberek R. J Mag Mag Mat 1996;160:253.
[249] Slawska-Waniewska A, Greneche JM. Phys Rev B 1997;56:R8491.
[250] Smith CH. IEEE Trans Mag 1982;18:1376.
[251] Stollo� NS. Mat Res Soc Proc 1985;39:3.
[252] Suzuki K, Kataoka N, Inoue A, Makino A, Masumoto T. Mat Trans JIM 1990;31:743.
[253] Suzuki K, Makino A, Kataoka N, Inoue A, Masumoto T. Mat Trans JIM 1991;32:93.
[254] Suzuki K, Makino A, Inoue A, Masumoto T. J Appl Phys 1991;70:6232.
[255] Suzuki K, Kikuchi M, Makino A, Inoue A, Masumoto T. Mat Trans JIM 1991;32:961.
[256] Suzuki K, Makino A, Tsai AP, Inoue A, Masumoto T. Mat Sci Eng 1994;A179/A180:501.
[257] Suzuki K, Cadogan JM, Sahajwalla V, Inoue A, Masumoto T. J Appl Phys 1996;79:5149.
[258] Suzuki K, Cadogan JM. Phil Mag Lett 1998;77:371.
[259] Suzuki K, Cadogan JM. Phys Rev B 1998;58:2730.
[260] Suzuki K, Herzer G, Cadogan JM. J Mag Mag Mat 1998;177±181:949.
[261] Suzuki K, Cadogan JM. J Appl Phys 1999;85:4400.
[262] Tate BJ, Parmar BS, Todd I, Davies HA, Gibbs MRJ, Major RV. J Appl Phys 1998;83:6335.
[263] Tsuei CC, Duwez P. J Appl Phys 1960;37:435.
[264] Turgut Z, Huang M-Q, Gallagher K, Majetich SA, McHenry ME. J Appl Phys 1997;81:4039.
[265] Turgut Z, Scott JH, Huang MQ, Majetich SA, McHenry ME, J Appl Phys 1998;83:6468.
[266] Turgut Z, Nuhfer NT, Piehler HR, McHenry ME. J Appl Phys 1999;85(8)4406.
[267] Varga LK, Bakos E, Kiss LF, Bakonyi I. Mat Sci Eng 1994;A179/A180:567.
[268] Varga LK, Lovas A, Pogany L, Kiss LF, Balogh J, Kemeny T. Mat Sci Eng 1997;A226±228:740.
[269] Velisek J. Czech J Phys B 1970;20:250.
[270] Vojtanik P, Komova E, Petrovic P, Varga R, Sassik H, Grossinger R. Acta Phys Slovaca
1998;48:1.
[271] Vojtanik P, Matejko R, Varga R, Sassik H, Grossinger R. EMMA 1998.
[272] Warlimont H. Phys Technol 1980;11:28.
[273] Wang Z, He KY, He SL, Zhang YM, Fu YJ, Zhang L. J Mag Mag Mat 1997;171:300.
[274] Weichold MH, Pandey K, Palmer D. IEEE Trans Mag 1980.
[275] Williams A, Moruzzi VL, Malozemo� AP, Tekuta K. IEEE Trans Mag 1983;19:1983.
[276] Willard MA, Laughlin DE, McHenry ME, Thoma D, Sickafus K, Cross JO, et al. J Appl Phys
1998;84:6773.
[277] Willard MA, Huang M-Q, Laughlin, DE, McHenry, ME, Cross JO, Harris, VG, Frascetti, C, J
Appl Phys 1999;85(8):4421.
[278] Xiong X-Y, Ho K-Y. J Appl Phys 1995;77:2094.
[279] Yavari AR, Desre PJ. Mat Sci Forum 1992;88-90:43.
[280] Yavari AR, Drbohlan O. Mat Trans JIM 1995;36:896.
[281] Yavari AR, Negri D. Nanostructured Mat 1997;8:969.
[282] Yoshizawa Y, Oguma S, Yamauchi K. J Appl Phys 1988;64:6044.
[283] Yoshizawa Y, Yamauchi K, Yamane T, Sugihara H. J Appl Phys 1988;64:6047.
[284] Yoshizawa Y, Yamauchi K. J Jpn Inst Met 1989;53:241.
[285] Yoshizawa Y, Yamauchi K. Mat Trans JIM 1990;31:307.
[286] Yoshizawa Y, Yamauchi K. Mat Sci Eng 1991;A133:176.
[287] Zbroszcyk J, Fukanaga H, Olszewski J, Ciurzynska WH, Hasiak A. J Mag Mag Mat
1996;160:277.
[288] Zbroszcyk J, Narita K, Olszewski J, Ciurzynska W, Lijun W, Wyslocki B, et al. J Mag Mag Mat
1996;160:281.
[289] Zbroszcyk J, Varga LK, Olszewski J, Ciurzynska W, Wyslocki B, Szymura S, et al. J Mag Mag
Mat 1996;160:279.
[290] Zhang Y, Hono K, Inoue A, Sakurai T. Appl Phys Lett 1996;69:2128.
[291] Zhang Y, Hono K, Inoue A, Makino A, Sakurai T. Acta Mater 1996;44:1497.
[292] Zhang J, Wu B, Wu X, Wang G, Zhao J. J Appl Phys 1996;79:5473.
M.E. McHenry et al. / Progress in Materials Science 44 (1999) 291±433432
[293] Zhang XY, Zhang JW, Xiao FR, Liu JH, Liu RP, Zhao JH, Zheng YZ. Mat Lett 1998;34:85.
[294] Zhou XZ, Morrish AH, Naugle DG, Pan R. J Appl Phys 1993;73:6597.
[295] Zhou F, He KY. J Appl Phys 1996;79:8851.
[296] Zhu J, Clavaguera N, Clavaguera-Mora MT, Howells WS. J Appl Phys 1998;84:6565.
[297] Zuberek R, Murillo N, Gonzalez J, Blanco JM, Garcia-Tello P. Nanostructured Mat 1997;8:711.
[298] McHenry ME, Brunsman EM, Majetich SA. IEEE Trans Mag 1995;31:3787.
[299] Suzuki K, 1998 Private Communication.
[300] Willard MA, Gingras M, Lee M, Harris VG, Laughlin DE, McHenry ME. MRS Symposium I.
Spring 1999 [in press].
[301] Hawley ME, Brown GW, Thoma DJ, Willard MA, McHenry ME. MRS Symposium I. Spring
1999 [in press].
[302] Makino A, Suzuki K, Inoue A, Masumoto T. Mat Trans 1992;JIM-33:80.
M.E. McHenry et al. / Progress in Materials Science 44 (1999) 291±433 433